thin film libraries of functional polymers and materials...
TRANSCRIPT
Thin Film Libraries of Functional Polymers
and Materials Prepared by Inkjet Printing
PROEFSCHRIFT ter verkrijging van de graad van doctor aan de Technische Universiteit Eindhoven, op gezag van de Rector Magnificus, prof.dr.ir. C.J. van Duijn, voor een commissie aangewezen door het College voor Promoties in het openbaar te verdedigen op maandag 12 november 2007 om 16.00 uur door Emine Tekin geboren te Kilis, Turkije

Dit proefschrift is goedgekeurd door de promotor: prof.dr. U.S. Schubert Copromotor: dr. P.J. Smith
This research was financially supported by the Dutch Polymer Institute (DPI, project #448) Omslagontwerp: Emine Tekin, Paul Verspaget, Eindhoven Druk: Universiteitsdrukkerij, Technische Universiteit Eindhoven Thin Film Libraries of Functional Polymers and Materials Prepared by Inkjet Printing by Emine Tekin Eindhoven, Technische Universiteit Eindhoven, 2007 A catalogue record is available from the Eindhoven University of Technology Library ISBN: 978-90-386-1140-2
Thin Film Libraries of Functional Polymers
and Materials Prepared by Inkjet Printing Kerncommisie: prof.dr. U.S. Schubert (Technische Universiteit Eindhoven) dr. P.J. Smith (University of Freiburg)
prof.dr. M. Rehahn (Technische Universität Darmstadt) prof.dr. D.J. Broer (Technische Universiteit Eindhoven) prof.dr. J.C. Meredith (Georgia Institute of Technology)
Overige commisieleden: prof.dr. R.A.J. Janssen (Technische Universiteit Eindhoven)
Aileme


Table of contents
Table of contents Chapter I: An overview on instrumentation and applications of inkjet printing
1
1.1 Introduction 21.2 Instrumentation 3 1.2.1 Working principle of piezo-based printheads 51.3 Applications 6 1.3.1 Organic (polymer) electronics 6 1.3.2 Conductive tracks from nanoparticles 10 1.3.3 Applications in biotechnology 14 1.3.4 Reactive printing 15 1.3.5 Combinatorial research 171.4 Aim and outline of the thesis 171.5 References 20 Chapter II: Physical aspects of inkjet printing polymers 252.1 Introduction 262.2 Influences on droplet formation: surface tension, viscosity and printing parameters
27
2.3 Limitations for printing polymer solutions 32 2.3.1 Printability of solvents 32 2.3.2 Polymer molecular weight and concentration 342.4 Pattern formation of the printed polymer films 36 2.4.1 Patterns printed from a single solvent 37 2.4.2 Patterns printed from solvent mixtures 382.5 Conclusions 432.6 Experimental section 452.7 References 47 Chapter III: Inkjet printing of luminescent ruthenium- and iridium-containing polymers
49
3.1 Introduction 503.2 Printing thin film libraries using photoresist patterned substrates 52 3.2.1 Controlling thicknesses of printed films 543.3 Libraries of electron donor/acceptor blends 57 3.3.1 Quenching experiments and morphologies of the blends 583.5 Conclusions 633.6 Experimental section 633.7 References 66 Chapter IV: Inkjet printing of luminescent CdTe nanocrystal (NC)–polymer composites
69
4.1 Introduction 704.2 Printing well-defined dots of CdTe NC–polymer composites 71 4.2.1 Ink formulation 71 4.2.2 Morphology of the printed films 764.3 Optical investigations on the printed CdTe nanocrystal–polymer composites 77 4.3.1 Influence of the polymer content on both morphology and
photoluminescence behaviour of the CdTe particles
77

Table of contents
4.3.2 Large particle-small particle interactions 804.4 Conclusions 814.5 Experimental section 824.6 References 83 Chapter V: Inkjet printing of a conjugated polymer (poly[2-methoxy-5-(2′-ethylhexyloxyl)–1,4-phenylenevinylene] (MEH–PPV)) 855.1 Introduction 865.2 Printability of MEH-PPV dissolved in various organic solvents 875.3 Parameters influencing the surface quality and morphology of printed MEH-PPV lines
92
5.4 Investigation of the micro-morphology and conductivity using AFM 975.5 Printing larger areas and controlling the thickness 1005.6 Fabrication and characterization of light emitting diodes with printed MEH-PPV as the active layer
103
5.7 Conclusions 1075.8 Experimental section 1085.9 References 110 Chapter VI: Film thickness and side chain effects on the optical properties of poly(p-phenylene-ethynylene)-alt-poly(p-phenylenevinylene)s (PPE-PPV) derivatives
1136.1 Introduction 1146.2 Film thickness dependency of the emission colors of PPE–PPVs in inkjet printed libraries
115
6.3 Synthesis and characterisation of PPE-PPVs having alkoxy side chains in varied length
120
6.3.1 Synthesis of polymers Pn/8 121 6.3.2 Thermal behaviour 122 6.3.3 Photophysical investigations 124 6.3.4 Electroluminescence investigations 1266.4 Conclusions 1296.5 Experimental section 1296.6 References 133 Summary 135 Samenvatting 137 Curriculum vitae 139 Acknowledgements 143

Chapter I
An overview on instrumentation and applications of inkjet printing
Abstract Inkjet printing is an attractive technology that has become increasingly accepted for a variety
of industrial and scientific applications for patterning functional materials. It can also be
used to prepare thin film libraries for combinatorial materials research. This chapter
presents an overview of the instrumentation and applications of inkjet technology. The use of
inkjet printing for deposition of semiconductor materials for organic electronics and the
printing of metal nanoparticle dispersions is reviewed. The printing of inks for use in
combinatorial research, in biological applications and reactive printing is also presented.
Parts of this chapter have been published: E. Tekin, P.J. Smith, U.S. Schubert, submitted; B.-J. de Gans, E. Kazancioglu, W. Meyer, U. S. Schubert, Macromol. Rapid Commun. 2004, 25, 292.

Chapter I
2
1.1 Introduction
Inkjet printing has become an important technology for many applications, such as organic
electronics, nanotechnology, cell patterning and tissue engineering, on account of its ability to
precisely deposit picolitre volumes of solutions or suspensions in well-defined patterns. This
ability, sometimes termed ‘direct-write,’ is achieved by using computer-controlled translation
stages and ink-dispensers, which readily facilitates the production of complex patterns. The
direct-write ability removes the need for masks, which leads to cost-savings, efficient use of
materials and waste elimination. Furthermore, as inkjet printing is a non-contact deposition
method, contamination is minimised.
Inkjet printing also offers possibilities for combinatorial polymer materials research.
With state-of the-art combinatorial equipment, large numbers of chemically different
polymers can be synthesised in parallel. However, the preparation of polymer microarrays in
solid state currently represents a bottleneck in combinatorial polymer research. In this respect
inkjet printing is a key technology for producing thin solid film libraries because of its speed,
flexibility and precise dispensing.
The number of functional polymers that have been successfully patterned using inkjet
printing has increased recently; the printing of polythiophenes,1 polyphenylenevinylenes,2
polyfluorene,3,4 polypyrole5 and metal-containing polymers6 have all been reported. Similarly,
metallic nanoparticles,7 carbon nanotubes,8 quantum dots,9 proteins,10 cells,11 and DNA12 have
all been deposited by inkjet printing. Finally, chemical reactions have been performed on
surfaces by means of chemical agents being printed on to them; a process known as reactive
inkjet printing.13
This chapter aims to provide an overview of inkjet printing equipment for the
dispensing of functional materials. Although ordinary desktop colour inkjet printers have been
used they suffer from a number of serious drawbacks. More promising are specially designed
piezo-technology based dispensers; the working principle of a piezo-based inkjet printhead
and different Drop-on-demand (DoD) printers will be compared later. Then developments in
the fields of organic electronics, metallic electronics and reactive printing which have been
achieved using inkjet printing will be discussed. The applications of inkjet printing in bio-
technology and combinatorial research will be reviewed as well. Finally, the aim and the
outline of the thesis will be presented.

An overview on instrumentation and applications of inkjet printing
3
1.2 Instrumentation There are a variety of ways to generate micro-droplets; most of which are commercially
available. These techniques can be classified as either continuous inkjet or drop-on-demand
inkjet.
Continuous inkjet14-16 involves pressurising a fluid reservoir, which causes ink to be
continually jetted in the form of discrete droplets whose diameters are almost similar to the
ejection aperture. In order to print a feature, ejected droplets are deflected by charged plates
towards a substrate; non-deflected droplets are collected in a gutter and returned to the main
reservoir. Drop-on-demand (DoD) inkjet16 uses a low fluid impedance nozzle and a
controllable actuator to generate microsecond pressure impulses in the fluid, thereby causing
droplets to be ejected. In a piezo-electrically driven DoD device, the voltage applied across
the piezo element can be varied in order to tailor the volume of the ejected ink droplet.17
Furthermore, the rise and fall times of the voltage pulse can be tailored to ensure a satellite-
free production of droplets. Continuous inkjet printing is widely used in the industrial coding,
marking and labelling markets, where speed is essential. However, the majority of activity in
inkjet printing today is devoted to DoD methods, which are superior due to the smaller drop
size, higher accuracy and fewer restrictions on ink properties.18
Thermal inkjet (TIJ), is also a drop on demand technology. In its case, pressure
impulses are caused by the formation and collapse of vapour bubbles, which are generated by
varying the current across a heating element that is situated near the ejection orifice. The rapid
increase in temperature causes a small amount of liquid to vaporise. There are two types of
TIJ in use; face shooter TIJ and side shooter TIJ. In the face shooter system, the nozzle plate
is placed over the top of a wafer on to which the fluid flow and heating elements are
fabricated. In the side shooter system, their ejection apertures are formed from channels that
have been etched longitudinally into the wafer. Further comparisons of ejection technologies
and a more detailed overview has been provided by Le19 and by Kang.20
Many researchers have simply used readily available and more affordable desktop inkjet
printers to deposit functional materials.21-24 The adaptation required is that the cartridges
should be filled with the appropriate fluid and sometimes substrate handling also has to be
modified. Desktop colour inkjet printers have the advantage of availability and low cost, but
suffer from a number of disadvantages when used for printing materials. First of all,
cartridges and printheads are usually made from plastic, imposing restrictions on organic
solvents. Cameras to detect droplet generation are not available and the drop placement

Chapter I
4
accuracy is poor. Finally desktop inkjet printers have been optimised for only a few types of
substrates, which are not necessarily the most suitable substrates for polymer microarrays.18
Commercially available inkjet dispensers that are some of the most promising for
functional micro-array preparation are shown in Table 1.1 Positioning accuracy of the
printhead, frequency (denoting the number of droplets that can be ejected per nozzle per
second), number of available nozzles in parallel and typical droplet volume of each device are
compared.
Table 1.1 Overview of selected commercially available printers suitable to print functional materials.
Apparatus
Workspace (mm × mm ×
mm)
Drop placement accuracy
(µm)
Drop volume
(pL)
Number of parallel
nozzles
Frequency (kHz)
Heating(˚C)
MicroDrop Autodrop 200 × 200 × 80 10 ± 2 30 – 500 1-8 2 160
Microfab Jetlab-II 150 × 150 × 25 10 ± 5 20 – 1000 1-16 20 220
Litrex 70 200 × 200 × 1.2 ± 20 30 128 40 70
Litrex 142 370 × 470 × 1.2 <15 10 128 10 70
GeSiM Nanoplotter 260 × 270 × 43 25 ± 5 100 – 2000 1-8 1 -
Perkin-Elmer BioChip 1450 × 980 × 890 20 ± 2 325 4 0.5 -
Dimatix DMP-2800 200 × 300 × 50 ± 25 10 16 20 60
The Autodrop platform (Figure 1.1) from Microdrop Technologies, which was
originally developed for the general micro-dispension of fluids, was the main printer used to
prepare thin films for the research presented in this thesis. It has a holder for 8 dispenser
heads or micropipettes running in parallel. This holder is mounted on an XYZ stage (MD-P-
705), which has a resolution of 10 ± 3 µm and an available workspace of 200 × 200 × 80 mm.
It has a CCD camera to monitor formation of the droplets. The wavelength and amplitude of
the piezo-element driving signal can be varied, but not the waveform.25 A number of different
dispenser heads for dispense mode and micropipettes for pipette mode operation is available,
all based on glass capillaries. The MD-K-130 dispenser head is connected to a 4 mL reservoir.
The nozzle diameter ranges from 30 to 100 µm, corresponding to a drop volume varying
between 30 and 500 pL, with a relative error of less than 1%. Drops can be deposited with
frequencies up to 2 kHz per dispenser head. Maximum throughput rate is therefore 60 µL

An overview on instrumentation and applications of inkjet printing
5
min_1. This upper limit is set by the resonance frequency of the piezo element. Ink viscosity
should be between 0.5 to 20 mPa s. The micropipette AD-K-501 has a storage volume of 25
µL and was specially designed for applications where the fluid has to be changed often.18
Therefore, this system can easily aspirate a variety of solutions from a microtitre plate and
dispense them onto a substrate for subsequent parallel investigations.
Figure 1.1 An image of the Autodrop platform (Microdrop Technologies).25
1.2.1 Working principle of piezo-based printheads A cross-section of a typical pizeo-based printhead from Microdrop Technologies is shown in
Figure 1.2. The core of the micropipette is the ‘‘drop generator’’– a glass capillary surrounded
by a tubular piezo actuator in a protective housing. The lower end of the glass capillary has
been shaped to form the nozzle. The upper end is connected to a pressure line for fluid
aspiration and flushing. Fluids are aspirated by applying a negative pressure and are flushed
by applying a positive air pressure. To prevent fluid dripping from the nozzle during
operation, a slightly negative pressure is applied; usually 10 or 12 mbar depending on the
fluid type. The magnitude of the negative pressure does not have an effect on the printing
performance. The pipette may be cleaned by repeated aspiration and flushing with solvent.
The piezo actuator serves as a built-in ultrasonic cleaning device when operating at its Eigen
frequency, which is 12 kHz, and is used to remove persistent contamination. The upper part of
the capillary serves as a reservoir for aspirated fluid. Therefore no interconnection or sealing
between a separate droplet generator and fluid reservoir was needed, allowing easy cleaning.

Chapter I
6
As the fluid only comes into contact with glass, the handling of fluids with extreme pH values
or aggressive solvents is possible.
Figure 1.2 Left: Cross-section of a pizeo-based printhead. Right: Working principle of the printhead a) voltage is applied to the piezo actuator; contraction of the actuator induces a pressure wave; b) voltage is switched off and the piezo actuator relaxes to normal state, the pressure wave propagates through the capillary to the nozzle; c) the accelerated fluid jet at the nozzle outlet forms a drop which freely flies away from the nozzle.
The working principle of the drop generator is also shown in Figure 1.2. Applying a
rectangular voltage pulse forces the piezo-actuator to contract; pulse amplitude and width can
be set using software. The contraction creates a pressure wave that propagates through the
fluid. At the nozzle the pressure wave is converted into fluid motion at accelerations up to 105
g. A small fluid column leaves the nozzle, breaks off through the action of surface tension and
forms a free-flying droplet. Ejection frequency can be varied between 0 and 2 kHz. A
stroboscopic video camera is available to monitor the process of droplet formation. Varying
the time delay between the signals to the piezo actuator and the strobe allows the operator to
monitor the entire process of droplet formation. Droplet size is mainly determined by the
nozzle diameter, applied voltage and fluid properties, for details see Chapter 2.
1.3 Applications 1.3.1 Organic (polymer) electronics
Patterning is a crucial part of the fabrication of organic electronic devices, in particular for
organic thin film transistors (OTFTs). Polymer semiconductors must be confined to the
channel region of the circuit pattern to eliminate parasitic leakage and to reduce cross-talk in

An overview on instrumentation and applications of inkjet printing
7
order to attain improved device performance. The drain, source and gate electrodes need to be
patterned with the required application-dependent feature size. Usually, the smaller the
distance between the drain and source electrode, the higher the current output and the faster
the transistor switching speed. The switching speed is proportional to µ / L, where µ is the
field effect mobility and L the channel length. The most desirable patterning method for
manufacturing TFT’s should involve the direct printing of active materials, in which the
patterning and deposition are carried out in a single step, and should afford the ability to
process large surface areas. Therefore, inkjet printing is one of the most promising methods
among others such as optical lithography or soft lithography.26 As such, inkjet has often been
used in combination with lithographic methods to decrease the feature size and to improve the
accuracy and resolution.
For TFT circuit applications, inkjet printing technology needs to meet challenging
spatial resolution/feature size acceptance criteria, but also have good droplet placement
accuracy. For instance, in an active matrix display application consisting of one million or
more TFTs, a single printing error may cause an electrical-short that could disable the whole
display. Sirringhaus et al. have overcome these challenges using predefined surface energy
patterns consisting of a hydrophobic polymer layer patterned on top of a hydrophilic substrate
surface.27 The surface energy pattern controls the flow and spreading of the ink droplets on
the substrate and defines the TFT channel length, as well as the line width of source and drain
electrodes deposited from a water based ink of PEDOT:PSS. Very well defined channels with
standard lengths of 5 µm or less could be obtained with the help of surface energy patterns,
which were prepared by photolithographic patterning or laser patterning. Alternatively, using
electron beam lithography to define the hydrophobic barriers, channel lengths as narrow as
250 nm could be achieved.
A similar approach was shown by Wang et al. combining nanoimprint lithography and
inkjet printing. First, nanoimprint lithography was carried out on the insulating polymer
polymethylmethacrylate (PMMA) on quartz substrates with a silicon stamp which was
co-fabricated by photolithography and electron beam lithography. It was followed by
controlled oxygen plasma treatment on the whole surface to remove PMMA in the embossed
area.28 Then, the trenches with hydrophilic bottoms and surrounded by hydrophobic walls
with certain height were obtained by a subsequent heating process (100 ˚C for 10 minutes) to
convert the hydrophilic PMMA surface into hydrophobic. PEDOT:PSS water solution was
then dispensed into these trenches by inkjet printing, forming source drain electrodes.
Although 250-300 nm channel lengths were obtained, there are two main disadvantages of

Chapter I
8
this method compared to the surface energy method: the first one is the heating process which
is not favourable for flexible substrates. The second disadvantage is that the PEDOT:PSS
solution tends to be repelled by the hydrophobic walls. To overcome the issue of repelling,
additional PEDOT:PSS solution had to be dispensed near the edges. This resulted in excessive
thickness and inhomogeneous lines of PEDOT:PSS due to a liquid overflow outside the
boundaries of the trench.
Although production costs are reduced in the methods mentioned above, even lower-
cost fabrication may be attained using only inkjet printing as a patterning tool. For this
purpose, Sirringhaus et al. developed a bottom-up, lithography-free self-aligned inkjet
printing technique, which is capable of defining sub-100 nm channel lengths.29 The method is
comprised of three steps: first, a conductive pattern is printed onto the substrate; second, the
surface of the first pattern is selectively modified; finally, a second conductive material is
inkjet printed which partially overlaps the first conductive pattern. Due to the low surface
energy of the first pattern, as can be seen in Figure 1.3, the deposited droplets from the second
printing step are repelled and dry with their contact line in close proximity to the edge of the
first pattern, forming a self-aligned gap. Lowering the surface energy of the first printed
pattern was carried out by either post-deposition plasma treatment using carbon tetra fluoride
(CF4) or adding a surfactant to the ink prior to printing. Polymer transistor circuits fabricated
using this method yielded significant improvements of “ON” currents and circuit-switching
speeds by more than two orders of magnitude due to the reduction of the channel length.29
Figure 1.3 Schematic representation of the self-aligned printing process developed by Sirringhaus et al. Second printed droplet of PEDOT:PSS dewets from the hydrophobic surface of the first printed droplet (reprinted from ref. 29).
Most of the time, only the gate, source and drain electrodes of polymer field effect
transistors (FET’s) are fabricated employing inkjet printing,28,30,31 other components, such as
the dielectrics and active layers, are deposited by other conventional techniques such as spin-
coating. Recently, Liu and Cui fabricated an all-inkjet printed, all-polymer FET using PEDOT

An overview on instrumentation and applications of inkjet printing
9
to form the source, drain and gate electrodes, polypyrrole as the semi-conducting layer, and
the poly(vinyl pyrrolidone) K60 as the gate dielectric.32 All of these selected polymers were
soluble in water and therefore clogging of the inkjet nozzle was prevented. Due to the use of a
dielectric polymer with a high electric constant (60), the polymer FET operated at a low
voltage. However, the channel length was not optimised (100 µm), and as a consequence
neither was the field effect mobility.
So far, it has been shown that conducting electrodes can be printed from conducting
polymers, such as PEDOT:PSS. They provide efficient electron ejection into semiconducting
polymers with a resistance smaller than that of many inorganic metals. However, the
conductivity of most conducting polymers is not found to be sufficient for all applications.
Therefore, many of the polymer-based electronic devices contain metals as the electrodes,
while semi-conducting active layers are made of polymers. Inkjet printing could be applied as
a patterning tool for the metal electrodes33,34 to reduce the costs and to improve layer
registration in polymer devices. It was exemplified by Arias et al. combining additive and
subtractive printing (named “digital lithography”) to fabricate TFT backplanes. The process
involves the thermal evaporation or chemical vapour deposition of conductive metal layers
and then, patterning by inkjet printing of a wax mask and chemical etching. Afterwards, an
additive printing process was used to deposit a solution-based semiconductor, completing the
bottom gate TFT device fabrication. The metal line width of about 50 µm was determined by
the size of the wax droplet.34 Here, the metal parts can also be directly deposited and
patterned by printing nano-particles which is discussed in detail in the next section.
Ink formulations, such as solvent composition and polymer concentration, influence
both droplet formation and the resulting morphologies on the solid surface, and are critical to
optimal device performance.35,36 The resistivity of PEDOT:PSS layers deposited from
different solvent formulations onto plastic substrates (i.e. polyethylene terephthalate and
polyester) was investigated. The most significant decrease in resistivity was induced by the
addition of a small amount of glycerol in the PEDOT:PSS solution, and was achieved on a
polyester substrate, due to the decrease in roughness.36 Presumably, glycerol acts as a
surfactant and reduces the surface tension of the solution. This reduction permits a more
effective spreading of the conducting ink through the substrate promoting smoother and more
continuous films.
For printing a semiconducting active layer of poly-3-octylthiophene (P3OT), the
organic solvents trichloroethylene, chlorobenzene and xylene were tested for oFET
application. Chloroform, which previously had been found to be yielding high carrier

Chapter I
10
mobility, could not be used for printing because it vaporises too fast and clogs the pipette’s
nozzle. Trichloroethylene yielded non-regular single dots as well as a flake-like overlap of the
dots within a line due to the fast evaporation after deposition; as a result the transistor
behaved poorly. Using chlorobenzene or xylene (high boiling solvents) with relatively low
concentration (1 mg/mL) led to films with higher carrier mobility because of improved film
morphology. In these experiments, the problem caused by the coffee drop effect was
overcome with the following approach: the edges (of the printed line) were located outside the
transistor’s channel which is inherently given by smaller electrode spacing compared to the
dot size.35
Morphology plays an essential role particularly in bulk heterojunction solar cells which
consist of an electron donor (n-type)–electron acceptor (p-type) composite material
(photoactive layer), which displays phase separation on a nanometer scale. Photovoltaic
devices comprising a blend of poly(9,9’-dioctylfluorene-co-bis-N,N’-(4-butylphenyl)-bis-
N,N’-phenyl-1,4-phenylenediamine) (PFB) with poly(9,9’dioctylfuorene-co-benzothiadiazole)
(F8BT) and light-emitting diodes (LEDs) that were prepared from a blend of F8BT with PFB
(poly(9,9-dioctylfluorene-co-N-(4-butylphenyl)diphenylamine) were fabricated using inkjet
printing and spin-coating. It was reported that the rapid drying of the small-volume droplets
produced by inkjet printing leads to finer phase separation for LED and photovoltaic devices,
with good performances and higher efficiency seen than for devices prepared by spin-coating.
Whereas the size of the TFB domains is typically a few microns when spin-coating is used,
inkjet printing combined with an elevated substrate temperature gave features of ~300 nm.
Here the disadvantage of inkjet printing was the non-uniform film thickness. Thickness
distribution of a semiconductor film can dramatically influence the operation of the
electroluminescent devices since the edges are too thick. Therefore 70-80% of the total
printed film which was flat was effectively functional excluding the edges occupying 20-30%
of the total area.3
1.3.2 Conductive tracks from nanoparticles In recent years, several research groups have investigated the inkjet printing of suspensions of
metallic nanoparticles. Wagner et al. used a commercial ink jet printer to jet a solution of
copper hexanoate in either isopropanol or chloroform which they then annealed to form pure
copper lines with a resistivity of 10 µΩcm.37 They subsequently investigated ways of forming
narrower lines by exploiting the deposition behaviour of the precipitated material.38

An overview on instrumentation and applications of inkjet printing
11
Subramanian et al. jetted a solution of α-terpineol and 2 nm diameter gold nanocrystals
encapsulated with hexane thiol using a customised drop-on-demand printer and a 60 µm
nozzle.39 A single layered line printed onto a polyester substrate, which was heated to 190 °C,
had a conductivity that was over 35% that of bulk gold. They further subsequently measured
conductivities as high as 70% of bulk gold when toluene was used as the solvent.
Most research into jetting metallic nanoparticles has focussed on silver,7,40-46 using
either silver-containing solutions,40,41,46 or suspensions of silver nanoparticles7,42-44 as the ink.
Typically, most features printed with silver inks are thermally treated to obtain silver.
However, Schubert et al. developed a new method of sintering. After jetting a nanoparticle
ink onto a polyimide substrate they used microwave radiation to sinter the silver
nanoparticles. A negligible amount of energy was absorbed by the polymer substrate since it
is mostly transparent to microwave radiation, whereas the conducting silver nanoparticles,
with a high dielectric loss factor, absorb the microwaves strongly. The resistivity of the silver
tracks was found to be 3.0 × 10⁻⁷ Ωm, which corresponds to a conductivity that is 5% of bulk
silver. Although, other researchers have achieved higher values of conductivity the main
success of this method was that the sintering time was shortened to just three minutes.7 The
time dependency of the conductivity of a printed silver track upon sintering in a microwave is
demonstrated in Figure 1.4.
a) b)
Figure 1.4 a) Photograph of a printed antenna structure, b) conductance as a function of time for the microwave sintering of silver tracks printed onto a PI substrate (reprinted from ref. 7).

Chapter I
12
Other research based on silver nanoparticle inks has been performed by Magdassi et al.
who prepared an aqueous dispersion of silver nanoparticles. Features printed from this ink,
using commercially available printers, were sintered at 320 °C for ten minutes and gave
conductivity values of 9 × 10⁵ Ω-1m-1; about 1.5% of bulk silver.47 Huang et al. inkjet printed
an ink composed of 50 nm diameter silver nanoparticles dispersed in a water and diethylene
glycol co-solvent system, using a commercially available printer. Smooth and continuous
lines of 130 µm width were obtained on glass using an Epson R210 printer. These were
converted to silver by being placed into an oven, which was set to 260 °C, for 3 min. The
lines exhibited a resistivity of 1.6 × 10⁻⁵ Ωcm.48 Similarly, Joung et al. synthesised silver
nanoparticles with 7 nm diameters from silver nitrate, using toluene as the solvent. The silver
ink was inkjet printed onto polyimide and other substrates, then thermally converted to silver
at 250 °C to give a resistivity of 6 µΩcm.45
Silver source/drain electrodes were prepared by Varahramyan et al. on a heavily n-
doped silicon wafer with thermally grown silicon dioxide which had been coated with a poly-
4-vinylphenol (PVPh) film; poly(3-hexylthiophene) (P3HT) was used as the channel material.
They reported that the PVPh film helped to lower the curing temperature of the silver from
300 °C to 210 °C, and that the resistivity of a single-layer silver track was 5 × 10⁻⁴ Ωcm. The
fabricated P3HT thin film transistor had a channel length of 20 µm and exhibited a saturation
mobility of 3.5 × 10⁻² cm2/V/s, which was three times higher than for a similar device which
used gold source/drain electrodes.49
A solution-based silver ink was prepared by Dearden et al. who used a drop-on-demand
inkjet printer to print a silver-organic solution onto glass. Single layer conductive silver tracks
were obtained after heating for five minutes at temperatures ranging from 125 °C to 200 °C.
Conductivity values that were 33% to 53% those of bulk silver were obtained when
temperatures of 150 °C and above were used.46 Similarly, Kaydanova et al. printed silver
trifluoroacetate in ethylene glycol to create solar cell contacts. Near bulk resistivity of 2.2
µΩ.cm was achieved for a multi-layered silver grid that had been printed at 180 °C.[40] Both
groups used the work of Vest and Teng as a basis.50
Varahramyan et al. jetted silver nitrate that had been dissolved in a mixture of water and
dimethyl sulfoxide onto polyimide at 120 °C. They reported that the inkjet printed tracks had
well-defined shapes (as shown in Figure 1.5) and were thermally treated at 300 °C for 20
minutes to obtain silver. The resistivity was reported as 1.5 × 10⁻⁵ Ωcm, which corresponds to
a conductivity value that is 11% of bulk silver. Two conducting polymers, sulfonated

An overview on instrumentation and applications of inkjet printing
13
polyaniline and poly(ethylene dioxythiophene)/poly(styrene sulfonic acid), were inkjet-
printed onto the silver tracks and found to exhibit ‘ohmic’ behaviour.51
Figure 1.5 Optical images of the printed silver patterns on a flexible polyimide substrate. a) A matrix of silver dots (spacing is 400 µm). The dot diameter is ~280 µm. b) A silver pad formed by 10 lines of printed dots with a dot spacing of 80 µm. c) Three printed silver lines with a horizontal dot spacing of 80 µm and vertical dot spacing of 1000 µm (reprinted from ref. 51).
Metallic nanoparticles are not the only conductive materials that have been printed.
Electrically conductive carbon nanotube patterns on paper and plastic surfaces have been
prepared using an aqueous ink composed of multi-walled carbon nanotubes that had been
grown by chemical vapour deposition. A sheet resistivity of 40 kΩ/ was obtained by
applying multiple prints, which did not need curing in order to be conductive.8 Field-emission
scanning electron microscopy images of the multiple prints on different substrates are shown
in Figure 1.6.
Figure 1.6 Images of corboxylated MWCNTs printed on a, b) Canon BT-400 plastic and c, d) 80 gm-2 paper surfaces. e) Scanned image of a photograph (105 mm × 110 mm) printed (× 5) on Xerox colour copier paper (100 gm-2) using the water-based CNT ink (reprinted from ref. 8).

Chapter I
14
1.3.3 Applications in biotechnology The use of inkjet printing for bioengineering applications, such as generating living cell
structures,11 protein biochips,10 and DNA monolayers,12 is a wide area and this section intends
only to present a few highlights. The main issues to consider in bio-printing are possible
damage to the material due to the heat,11 or shear stress.52 Conditions need to be carefully
optimised for each system.
A wide range of biomaterials can be readily utilised in three dimensional printing (3DP)
on account of the ease of making them into solutions that can be jetted. As well as reducing
the number of post-processing steps, 3DP can control the spatial distribution of composition
and microstructure by printing various materials and using different printing parameters.53
Tissue engineered scaffolds can be produced by direct 3DP, in which the scaffolds are directly
fabricated. However, scaffolds produced by this route have some restrictions such as the range
of pore size and shape complexity.54,55 Wu et al. described an indirect 3DP technique, which
overcomes the limitations of direct 3DP by printing moulds into which the materials are cast
to form the final scaffold. To demonstrate the resolution of indirect 3DP they produced
scaffolds with villi features each having a diameter of 500 µm and a height of 1 mm.53
Boland and Mironov have made significant steps in viably printing cells and are
developing a technique called organ printing,56 which aims to make three-dimensional living
tissue.57-59 Commercially available inkjet printers have also been used to fabricate bacterial
colony arrays and complex patterns.57 In addition, they have used a modified TIJ printer
(Hewlett Packard) to deposit Chinese Hamster Ovary and embryonic motor-neuron cells into
predefined patterns; results showed that less than 8% of the cells were lysed during printing.58
Finally, they have developed a method of creating 3D cellular structures by layering alternate
sheets of NT2 cells and fibrin gels. Their results and findings demonstrate that inkjet printing
is rapidly evolving into a versatile fabrication method for handling biomaterials.
In addition to tissue engineering and cell printing, inkjet printing has been used to
produce biosensors that can be used to measure a range of biologically important
parameters.60-64 Setti et al. used TIJ, an aqueous glucose oxidase (GO) ink and an aqueous ink
containing the conductive polymer PEDOT/PSS to produce an amperometric glucose
biosensor by sequentially depositing PEDOT/PSS and GO on ITO-coated glass. By the means
of a swift and straightforward assay, they demonstrated that no loss in activity occurred after
printing GO, despite using a thermal printhead. The preliminary response of the electrode was
measured in an aqueous glucose solution using ferrocene methanol as a mediator, and gave a
linear result up to 60 mM in glucose. The best sensitivity value achieved was 6.43 µA M-1

An overview on instrumentation and applications of inkjet printing
15
cm-2, these findings indicate that inkjet printing could be a viable fabrication route for the
construction of biosensors.61
1.3.4 Reactive printing Although inkjet printing is often used to form coatings or features composed of a single
material it can also be used to sequentially deposit reactants13 or etching agents.65 For
instance, Kilbey and co-workers used inkjet printing and atom-transfer radical polymerisation
(ATRP)13 to produce patterned polymer surfaces that can serve as platforms for a variety of
applications. First, they anchored the polymerisation initiator onto a gold-plated substrate
using inkjet printing and then performed the ATRP to grow polymer brushes on the surface.
Jabbour et al. recently altered the area conductivity of the PEDOT:PSS anode by the
controlled dispensing of a hydrogen peroxide based ink, which varied the oxidation state of
PEDOT:PSS. This approach also reduced the number of processing steps compared to a more
conventional technique, which used sodium hypochlorite, and minimised damage to the metal
interconnects inside printer’s cartridge.23 This work indeed was the first time demonstration of
the use of inkjet printing to develop electrical greyscale imaging capability that allows the
conversion of digital photographs into electroluminescent images exemplified in Figure 1.7.
Similarly, inkjet printing can be used to print a solution that can change the sheet resistivity of
nanometre-thick conducting polymer films.23,66
Figure 1.7 a) Architecture of an OLED where the PEDOT:PSS is patterned by inkjet printing. b) Cactus logo designed using the software package and c) corresponding OLED image. Device dimensions: 1.3 in. (length) × 1.5 in. (width). TPD: N′,N′-bis(3-methylphenyl)-N′,N′-diphenyl benzidine; PC: polycarbonate; Alq3: tris(8-hydroxyquinoline)aluminium (reprinted from ref. 23).
Inkjet printing has also been used as an etching tool by Schubert et al. to create polymer
microstructures. An inkjet printer dispensed a solvent onto a coated substrate, which had been
prepared by spin-coating. Each droplet of solvent that is deposited on the surface dissolves the

Chapter I
16
underlying polymer, causing a hole to gradually form as the solvent evaporates, resulting in
the formation of high walls from polymer. As can be seen in Figure 1.8, the structures can be
changed from an array of simple holes to honeycomb-like and grid-like structures by varying
the solvent, the polymer coating and the droplet deposition pattern.65
Inkjet printing has also been used to prepare and load small unilamellar vesicles in one
step using a modified desktop printer, whose cartridge had been filled with a solution of a
vesicle-forming amphiphile in ethanol, and was positioned over a small water-filled container.
Several different commercial printers were tested and in all cases 50 to 200 nm sized lipids
and block copolymers were obtained. Furthermore, if a drug is co-dissolved with the
amphiphile, encapsulation can be achieved.24
Figure 1.8 a) Rectangular holes etched in polystyrene by printing a rectangular array of 70 µm acetophenone droplets (shown to scale as the white circle in the upper right). From top to bottom: height map and profile. b) Hexagonal holes etched by a printing hexagonal array of 30 µm isopropyl acetate droplets (reprinted from ref. 65).
One of the advantages of inkjet printing is that it produces uniformly sized droplets.
This particular advantage has been exploited by Stapert et al. in the production of micron-
sized particles with a narrow size distribution by jetting a polymer solution into an aqueous
phase. The particles are formed upon the removal of the solvent from the polymer. Similarly,
hollow capsules can be prepared by removal of the non-solvent from the core of the capsules
An overview on instrumentation and applications of inkjet printing
17
by freeze-drying. This leads to gas-filled capsules with a well-defined polymeric shell and a
diameter in the range of 5 µm depending on the initial drop size and the polymer
concentration.67
1.3.5 Combinatorial research Combinatorial research techniques, which were originally developed for pharmaceutical
research, have attracted growing attention in the field of polymer science since they have the
ability to speed up the discovery of new polymeric materials and the optimisation of
formulations.68 However, one of the major requirements related to combinatorial material
research is the reliable preparation of thin films and dots from solution, and the parallel
investigation of the physical properties of these films to develop more detailed understandings
and new structure/property relationships. Here, inkjet printing opens the way to the automatic
preparation of libraries of polymers, polymer blends and composites, with a systematic
variation of parameters such as chemical composition or thickness. Therefore, the
incorporation of inkjet printing into the combinatorial workflow is seen as a very significant
step towards the fast screening of technologically important materials for applications such as
light emitting diodes, solar cells and smart coatings.69 In Chapters 3 to 6, it will be shown that
inkjet printing can successfully produce thin film libraries of polymers and polymer
composites for parallel investigations of solid state properties.
Jabbour et al. have used combinatorial inkjet techniques to control the deposition and
sheet resistivity of conducting polymers which are currently used in organic light-emitting
devices and solar cells; libraries of electrodes with various sheet resistivities can be prepared
in less than a minute and can be subsequently tested in parallel.70 As well as for polymers,
combinatorial inkjet printing has been used to prepare libraries in nanoscience,71 ceramics72
and biotechnology;73 where it has been shown that commercial inkjet printing technology can
be used to create viable cellular patterns through the deposition of biologically active proteins.
1.4 Aim and outline of the thesis Inkjet printing is an emerging technology for many applications; in particular plastic
electronics. In addition, inkjet printing can appropriately be used in polymer research for the
preparation of libraries of polymers, polymer blends and composites, with a systematic
variation of parameters such as chemical composition or thickness. However, the application
of inkjet printing to polymer deposition from solution results in several new challenges in

Chapter I
18
terms of ink formulation, substrate choice and preparation, and control of solvent evaporation.
The aim of the thesis is to understand the parameters influencing the printability of the
materials and their pattern formation on the substrates. The thesis subsequently intends to
demonstrate the applicability of inkjet printing in the preparation of polymer libraries and
parallel investigations into their solid state properties.
Thus, the dissertation thesis focuses on two different and important subjects: the
improvement of inkjet printed film quality for selected functional materials (mainly
semiconducting-fluorescent polymers and quantum dots) and the investigations of their thin
film libraries to elucidate structure-property relationships. Different functional materials were
investigated in the project; metal containing polymers, nano-composites and conjugative
polymers, which can be used especially in organic electronics applications. The dissertation
thesis consists of six chapters which are defined below.
Chapter 1 is an introductory section that presents an overview of the instrumentation
and applications of inkjet printing technology. The use of inkjet printing in organic
electronics, printing of metal nanoparticle dispersions, printing of inks for use in biological
applications and in reactive printing, and in combinatorial research are reviewed.
The second part will address inherent possibilities and limitations of inkjet printing
polymers regarding solvents, molecular weight and concentration. The influences on droplet
formation of voltage, surface tension and viscosity will be presented as well. Moreover,
various strategies that can be employed to ensure uniform morphology of printed features will
be shown.
The focus of the third part of the thesis is directed to the development of a method for
the high-throughput preparation of thin films of luminescent metal containing polymers using
inkjet printing, as well as the subsequent rapid screening of their optical properties. Photo-
resist patterns on glass substrates were employed to confine the printed liquid and thus to
produce well-defined films. Using this method, thin film libraries with various thicknesses
could be obtained in a controlled way. The same method was used to prepare and screen,
according to electron transfer performance, a thin-film library of donor/acceptor systems,
which have potential application in bulk hetero-junction solar cells.
In the fourth part, inkjet printing of well-defined dots of water-soluble luminescent
CdTe nanocrystals (NCs) embedded in a PVA matrix, and subsequent studies of their
morphology and photoluminescence spectra are reported. The homogeneity of dot thickness
was sufficiently improved by the addition of ethylene glycol, which prevented the “coffee
stain” effect. Libraries of CdTe NC–PVA films, in which the concentration of PVA in
An overview on instrumentation and applications of inkjet printing
19
solution and the size of CdTe NCs was varied, were characterised. The results revealed that
the emission intensity of the CdTe NCs in composite films with polymers can be improved by
optimising the NCs/polymer ratio.
The fifth part will deal with the printing of the conjugated polymer, poly[2-methoxy-5-
(2′-ethylhexyloxyl)–1,4-phenylenevinylene] (MEH–PPV). The printability of MEH–PPV
dissolved in different solvents is studied. The pattern formation of the resulting lines is
explained in relation to the contact angle formed by the MEH–PPV solution on the substrate
and inter-chain interactions. A uniform thickness distribution of MEH–PPV films is obtained
when toluene is used as the solvent. Further improvement on the surface quality of the lines is
achieved by optimising the printing parameters. Moreover, optimisation of the conditions to
print larger films (6 mm × 6 mm) from MEH-PPV solutions is demonstrated, as well as
performance testing for light emitting diodes (LEDs). For this purpose, the influences of
thermal treatment and layer thickness on the device performance were investigated and
compared with spin-coated devices.
The last part will show parallel investigations into the influences on the emission colour
of π-conjugated polymers by varying side chains, film thicknesses and thermal treatment. The
respective thickness libraries of six alkoxy-substituted poly(p-phenyleneethynylene) alt-
poly(p-phenylenevinylene)s (PPE–PPVs) were prepared by inkjet printing. It was found that
the emission colours of the investigated polymers strongly depend on the inter-chain
interactions which increase with increasing film thickness and are influenced by the side
chains. To elucidate the side chain effect, new PPE-PPV derivatives having alkoxy side
chains that are systematically varied in length were synthesised and their optical properties
were screened. Subsequently, LEDs were fabricated using spin-coating and inkjet printing and
their performances were compared.

Chapter I
20
1.5 References
1 M.F. Mabrook, C. Pearson, M.C. Petty, Appl. Phys. Lett. 2005, 86, 013507.
2 Y. Liu, T. Cui, Macromol. Rapid Commun. 2005, 26, 289.
3 Y. Xia, R.H. Friend, Macromolecules 2005, 38, 6466.
4 Y. Xia , R.H. Friend, Appl. Phys. Lett. 2006, 88, 163508.
5 M.F. Mabrook, C. Pearson, M.C. Petty, Sensors and Actuators B 2006, 115, 547.
6 V. Marin, E. Holder, R. Hoogenboom, E. Tekin, U.S. Schubert, Dalton Trans. 2006,
13, 1636.
7 J. Perelaer, B.-J. de Gans, U.S. Schubert, Adv. Mater. 2006, 18, 2101.
8 K. Kordas, T. Mustonen, G. Toth, H. Jantunen, M. Lajunen, C. Soldano, S. Talapatra,
S. Kar, R.Vajtai, P.M. Ajayan, Small 2006, 2, 1021.
9 E. Tekin, P.J. Smith, S. Hoeppener, A.M.J. van den Berg, A.S. Susha, A.L. Rogach, J.
Feldmann, U.S. Schubert, Adv. Funct. Mater. 2007, 17, 23.
10 F.G. Zaug, P. Wagner, MRS Bulletin 2003, 28, 837.
11 M. Nakamura, A. Kobayashi, F. Takagi, A. Watanabe, Y. Hiruma, K. Ohuchi, Y.
Iwasaki, M. Horie, I. Morita, S. Takatani, Tissue Engineering 2005, 11, 1658.
12 A. Bietsch, M. Hegner, H.P. Lang, C. Gerber, Langmuir 2004, 20, 5119.
13 A.Y. Sankhe, B.D. Booth, N.J. Wiker, S.M. Kilbey, Langmuir 2005, 21, 5332.
14 K.C. Chaudhary, I.G. Redekopp, T. Maxworthy, J. Fluid. Mech. 1979, 96, 257.
15 W.T. Pimbley, IBM J. Res. Dev. 1984, 29, 148.
16 E.R. Lee, Microdrop Generation, CRC Press LLC, ISBN 0-8493-1559-X, 2003.
17 N. Reis, C. Ainsley, B. Derby, J. Appl. Phys. 2005, 97, 094903.
18 B.-J. de Gans, U.S. Schubert, Macromol. Rapid Commun. 2003, 24, 659.
19 H.P. Le, J. Imaging Sci. Technol. 1998, 42, 49.
20 H.R. Kang, J. Imaging Sci. 1991, 35, 179.
21 L. Pardo, W.C. Wilson, T. Boland, Langmuir 2003, 19, 1462.
22 Y. Yoshioka, G.E. Jabbour, Synthetic Met. 2006, 156, 779.
23 Y. Yoshioka, G.E. Jabbour, Adv. Mater. 2006, 18, 1307.
24 S. Hauschild, U. Lipprandt, A. Rumplecker, U. Borchert, A. Rank, R. Schubert, S.
Förster, Small 2005, 1, 1177.
25 http://www.microdrop.de
26 C. Reese, M.Roberts, M.-M. Ling, Z. Bao, Materials Today 2004, 7, 20.

An overview on instrumentation and applications of inkjet printing
21
27 S.E. Burns, P. Cain, J. Mills, J. Wang, H. Sirringhaus, MRS Bulletin 2003, 28, 829.
28 J.Z. Wang, J. Gu, F. Zenhausern, H. Sirringhaus, Appl. Phys. Lett. 2006, 88, 133502.
29 C. W. Sele, T. von Werne, R.H. Friend, H. Sirringhaus, Adv. Mater. 2005, 17, 997.
30 H. Sirringhaus, T. Kawase, R.H. Friend, T. Shimoda, M. Inbasekaran, W. Wu, E.P.
Woo, Science 2000, 290, 2123.
31 H. Sirringhaus, T. Kawase, R.H. Friend, Mater. Res. Bull. 2001, 26, 539.
32 Y. Liu, K. Varahramyan, T. Cui, Macromol. Rapid Commun. 2005, 26, 1955.
33 M.L. Chabinyc, W.S. Wong, A.C. Arias, S. Ready, R.A. Lujan, J.H. Daniel, B. Krusor,
R.B. Apte, A. Salleo, R.A. Street, Proceedings of the IEEE 2005, 93, 1491.
34 A.C. Arias, S.E. Ready, R. Lujan, W.S. Wong, K.E. Paul, A. Salleo, M.L. Chabinyc, R.
Apte, R. A. Street, Appl. Phys. Lett. 2004, 85, 3304.
35 M. Plötner, T. Wegener, S. Richter, S. Howitz, W.-J. Fischer, Synthetic. Met. 2004, 147,
299.
36 A.Y. Natori, C.D. Canestraro, L.S. Roman, A.M. Ceschin, Mater. Sci. Eng. B 2005,
122, 231.
37 C.M. Hong, H. Gleskova, S. Wagner, Mater. Res. Soc. Symp. Proc. 1997, 471, 35.
38 T. Cuk, S.M. Troian, C.M. Hong, S. Wagner, Appl. Phys. Lett. 2000, 77, 2063.
39 D.R. Redinger, S. Molesa, S. Yin, R. Farschi, V. Subramanian, IEEE Trans. Elec.Dev.
2004, 51, 1978.
40 T. Kaydanova, A. Miedaner, C. Curtis, J. Perkins, J. Alleman, D. Ginley, in
Proceedings of the National Centre for Photovoltaics and Solar Program Review
Meeting (Denver, Colorado, March 2003).
41 P.J. Smith, D.-Y. Shin, J.E. Stringer, N. Reis, B. Derby, J. Mater. Sci. 2006, 41, 4153.
42 S.B. Fuller, E.J. Wilhelm, J.M. Jacobson, J. Microelectromech. S. 2002, 11, 54.
43 J.B. Szczech, C.M. Megaridis, D.R. Gamota, J. Zhang, IEEE T. Electron. Pack. 2002,
25, 26.
44 D. Kim and J. Moon, Electrochem. Solid State Lett. 2005, 8, J30.
45 K.J. Lee, B.H. Jun, T.H. Kim, J. Joung, Nanotechnology 2006, 17, 2424.
46 A.L. Dearden, P.J. Smith, D.-Y. Shin, N. Reis, B. Derby, P. O’Brien, Macromol. Rapid
Commun. 2005, 26, 315.

Chapter I
22
47 A. Kamyshny, M. Ben-Moshe, S. Aviezer, S. Magdassi, Macromol. Rapid Commun.
2005, 26, 281.
48 H.-H. Lee, K.-S. Chou, K.-C. Huang, Nanotechnology 2005 ,16, 2436.
49 F. Xue, Z. Liu, Y. Su, K. Varahramyan, Microelectron. Eng. 2006, 83, 298.
50 K.F. Teng, R.W. Vest, IEEE Trans. Comp. Hybrids Manu. Tech. 1988, 11, 291.
51 Z. Liu, Y. Su, K. Varahramyan, Thin Solid Films 2005, 478, 275.
52 G.M. Nishioka, A.A. Markey, C.K. Holloway, J. Am. Chem. Soc. 2004, 126, 16320.
53 M. Lee, J.C.Y. Dunn, B.M. Wu, Biomaterials 2005, 26, 4281.
54 B.M. Wu, M.J. Cima. Polym Eng. Sci. 1999, 39, 249.
55 S.S. Kim, H. Utsunomiya, J.A. Koski, B.M. Wu, M.J. Cima, J. Sohn, K. Mukai, L.G.
Griffith, J.P. Vacanti, Ann Surg 1998, 228, 8.
56 V. Mironov, T. Boland, T. Trusk, G. Forgacs, R.R. Markwald, Trends Biotechnol.
2003, 21, 157.
57 T. Xu, S. Petridou, E.H. Lee, E.A. Roth, N.R. Vyavahare, J.J. Hickman, T. Boland,
Biotechnol. Bioeng. 2004, 85, 29.
58 T. Xu, J. Jin, C. Gregory, J.J. Hickman, T. Boland, Biomaterials, 2005, 26, 93.
59 T. Xu, C.A. Gregory, P. Molnar, X. Cui, S. Jalota, S.B. Bhaduri, T. Boland,
Biomaterials 2006, 27, 3580.
60 J.C. Carter, R.M. Alvis, S.B. Brown, K.C. Langry, T.S. Wilson, M.T. McBride, M.L.
Myrick, W.R. Cox, M.E. Grove, B.W. Colston, Biosens. Bioelectron. 2006, 21, 1359.
61 L. Setti, A. Fraleoni-Morgera, B. Ballarin, A. Filippini, D. Frascaro, C. Piana, Biosens.
Bioelectron. 2005, 20, 2019.
62 R. Mukhopadhyay, M. Lorentzen, J. Kjems, F. Besenbacher, Langmuir 2005, 21, 8400
63 F. Turcu, G. Hartwich, D. Schäfer, W. Schuhmann, Macromol. Rapid Commun. 2005,
26, 325.
64 A. Bietsch, J. Zhang, M. Hegner, H.P. Lang, C. Gerber, Nanotechnology 2004, 15, 873.
65 B.-J. de Gans, S. Höppener, U.S. Schubert, Adv. Mater. 2006, 18, 910.
66 Y. Yoshioka, P.D. Calvert, G.E. Jabbour, Macromol. Rapid Commun. 2005, 26, 238.
67 M.R. Böhmer, R. Schroeders, J.A.M. Steenbakkers, S.H.P.M. de Winter, P.A.
Duineveld, J. Lub, W.P.M. Nijssen, J.A. Pikkemaat, H.R. Stapert, Colloid. Surface. A:
Physicochem. Eng. Aspects 2006, 289, 96.

An overview on instrumentation and applications of inkjet printing
23
68 S. Schmatloch, M. A. R. Meier and U. S. Schubert, Macromol. Rapid Commun. 2003,
24, 33.
69 B. Halford, Chem. Eng. News 2004, 82, 41.
70 Y. Yoshioka, G.E. Jabbour, Abstracts of Papers, 227th ACS National Meeting,
Anaheim, CA, United States, March 28-April 1, 2004.
71 L. Chen, J. Bao, C. Gao, J. Comb. Chem. 2004, 6, 699.
72 J. Wang, M.M. Mohebi, J.R.G. Evans, Macromol. Rapid Commun. 2005, 26, 304.
73 E.A. Roth, T. Xu, M. Das, C. Gregory, J.J. Hickman, T. Boland, Biomaterials 2004, 25,
3707.


Chapter II
Physical aspects of inkjet printing polymers
Abstract Studies on the parameters influencing droplet and film formation produced by inkjet are
presented and considered in relation to their effect on the preparation of libraries for
combinatorial materials science. Varying surface tension, viscosity or the piezo voltage is
shown to influence the droplet volume. The printability of polymer solutions decreases
strongly with Mw and polymer concentration, due to elastic stresses originating from
elongational flow in the nozzle of the print head. Films that are printed using only a single
solvent always suffer from ring formation (or the so-called coffee-drop effect). This drawback
can be overcome by the use of solvent mixtures. The effects of solvent mass ratio, print head
velocity, dot spacing and printing method were investigated and optimised to reproducibly
obtain homogeneous polymer films. The results obtained represent an important step towards
the application of inkjet printing for the controlled deposition of polymer dots and libraries.
Parts of this chapter have been published: B.-J. de Gans, E. Kazancioglu (Tekin), W. Meyer, U.S. Schubert, Macromol. Rapid Commun. 2004, 25, 292; E. Tekin, B.-J. de Gans, U.S. Schubert, J. Mater. Chem. 2004, 14, 2627.

Chapter II
26
2.1 Introduction
The previous chapter reviewed the use of inkjet printing in different fields of applications,
such as organic electronics and biotechnology owing to its ability to precisely dispense
functional materials from solutions or suspensions in well-defined patterns.1-5 For all of these
applications it is essential to understand how the fluid properties and printing parameters
affect the deposition quality.6-8 Therefore, the focus of the second chapter is the physical
concerns and current challenges that are associated with droplet formation and inkjet printed
features in particular for polymers. Chief amongst these concerns is the propensity of
suspended material in a deposited, drying droplet to move towards the boundary (in other
words “the coffee-drop effect9,10 ”). Although, explanations for the cause of this phenomena
continue to be offered,11,12 effective strategies are available which prevent it happening.
After evaporation of a printed solution droplet, most of the solute is deposited as a ring
that marks the original contact line. Deegan et al.9,10explained this effect by the pinning of the
contact line of the droplet in combination with increased evaporation at the edges. However,
to maintain the pinned contact line, liquid evaporated at the edges must be replenished by
liquid from the interior. The resulting outward flow can carry virtually all the dispersed
material to the edge.9,10 Similar studies on the lateral dye distribution in inkjet printed organic
polymer light-emitting diodes suggested that a lower rate of evaporation at the edge
eliminates the deposition of dye into distinct outer rings.13,14 In this chapter, using a mixture
of two good solvents for the selected polymer (polystyrene) - one high boiling and one low
boiling- to avoid ring formation will be introduced.
First, general parameters such as surface tension, viscosity, pulse amplitude which
affect droplet generation and dimension will be discussed. Then the possibilities and
limitations of inkjet printing polymers regarding solvents, printability as a function of
polymer molecular weight and concentration will be addressed. Furthermore, optimisation of
the quality of inkjet printed films will be shown in terms of prevention of the coffee drop
effect. Finally, a detailed study into homogeneous polymer film formation as a consequence
of varying solvent ratio, print head velocity, dot spacing and printing methods is also
presented. In order to allow an effective survey utilising automated contact angle
measurements and the application of optical readers, a 6 × 6 mm2 film size in a microtitre
plate format (96 spots) was chosen.

Physical aspects of inkjet printing polymers
27
2.2 Influences on droplet formation: surface tension, viscosity and printing parameters The principle of a piezoelectric droplet-on-demand (DoD) inkjet print head can basically be
explained as follows. Because of a sudden volume change caused by a voltage applied to the
piezo, pressure waves are built up, which start propagating through the glass tube. When a
positive pressure wave approaches the nozzle, the fluid will be pushed outwards. When the
amount of kinetic energy transferred outwards is larger than the surface energy needed to
form a droplet, a droplet can in principle be ejected. The droplet velocity depends on the
amount of kinetic energy transferred outwards in excess of the surface energy needed to form
a droplet. An initial velocity of the droplet must be several metres per second in order to
overcome the decelerating action of the ambient air.15
Figure 2.1 Schematic representations of wave propagation and reflection in a piezoelectric tubular actuator.
Theoretical investigations involving numerical calculations and simulations on drop
speed and size produces methods based on the acoustic wave theory.15,16 According to the
acoustic wave theory, the nozzle end can be considered to be closed since the nozzle opening
is too small compared to the tube cross-section area. The supply end can be considered to be
open since the inside diameter of the supply tube is considerably larger than the inside
diameter of the capillary. Therefore, the pressure wave keeps its sign (phase) when it is
reflected from the closed end and it shifts sign when it is reflected from the open end. The
polarisation resulting from the increase in voltage causes the piezo element to move radially
L
a)
b)
d)
c)
f)
e)
Closed endOpen end
L
a)
b)
d)
c)
f)
e)
Closed endOpen end

Chapter II
28
outward, producing a negative pressure in the liquid (Figure 2.1-a). The pressure wave splits
in two and the split waves move in opposite directions (toward the open end and closed end)
with half amplitude (Figure 2.1-b). The pressure waves are reflected from the two ends as
shown in Figure 2.1-c. Then depolarisation caused by the voltage drop moves the piezo
radially inward, producing a positive pressure in the liquid. The generation of this positive
pressure wave overlaps with the return of the two reflected initial waves (Figure 2.1-d). At
this moment, the positive pressure wave is also split in two. Consequently, the left
propagating negative pressure wave is annihilated and the right one is doubled (Figure 2.1-e).
Figure 2.1-f shows the double-amplitude pressure wave approaching at the nozzle end. If the
pressure is high enough, the liquid is ejected.15, 17-20
Fluid properties are the key parameter affecting on the droplet formation. Fromm used
the Z number grouping of fluid properties to provide a dimensionless analysis of the
mechanics of drop formation in DoD print heads:16
Z = (dργ)1/2/η =Oh-1 (1)
This equation is equivalent to the inverse of the Ohnesorge number (Oh), where η, ρ, and γ
are the viscosity, density, and surface tension of the liquid, respectively, and d is the diameter
of the nozzle aperture. Fromm predicted that drop formation in DoD systems was only
possible for Z > 2 and that for a given pressure pulse the droplet volume will increase with
increasing value of Z.16
In the studies presented here the viscosity and surface tension of an aqueous
PEDOT:PSS were systematically varied and the consequent changes in droplet volume were
recorded. A single pulse voltage pattern of the piezo-based inkjet printer (Microdrop
Technologies, Norderstedt, Germany) is shown in Figure 2.2. The viscosity of a commercial
PEDOT:PSS solution (Baytron P) was varied by simple dilution with distilled water. The
droplet diameters were measured for the prepared solutions using the printing settings of 100
Volts for the pulse height, 30 µs for the pulse width and a frequency of 200 Hz. The diameter
of the nozzle used was 70 µm.
Figure 2.2 Voltage pattern of a single pulse for piezo element.
pulse width
voltage (or pulse height)

Physical aspects of inkjet printing polymers
29
The viscosity values, measured droplet diameters, calculated volumes and calculated Z
values are shown in Table 2.1. As can be seen, the volume of the ejected droplet increases
with decreasing viscosity, and with increasing Z number. In Figure 2.3, the volume of the
droplet is plotted versus the viscosity and Z number. It should be noted that the volume of the
droplets involves the volume of satellite droplets which appear occasionally during ejection.
Table 2.1 Measured viscosities of the PEDOT:PSS solutions, measured droplet diameters and volumes and calculated Z values according to equation 1. Density and the surface tensions of the solutions were 0.981-1.001 g/cm3 and 73 mN/m, respectively.
Viscosities of the solutions
mPa.s
Droplet diameter in µm
Droplet volume in pL
The inverse Ohnesorge number (Z)
17.3 59.8 112 2.85 9.7 64.0 137 5.11 6.5 64.8 142 7.66 5.4 65.1 144 15.72 4.8 65.5 147 17.54 3.6 66.4 154 23.45
110 120 130 140 150 160
3
6
9
12
15
18
Vis
cosi
ty, m
Pa
s
Z number
Droplet volume, pL
Viscosity
4
8
12
16
20
24 Z number
Figure 2.3 Measured volumes of the ejected droplets of PEDOT:PSS solutions versus viscosity of the solutions and Z number.
Similar experiments were performed to investigate the effect of the surface tension on
droplet volume. In this case, the surfactant sodium dodecyl sulphate (SDS) was used to vary
the surface tension of the PEDOT:PSS solution (Baytron P-Jet). The concentrations of SDS

Chapter II
30
added to the solution and resulting surface tensions are presented in Table 2.2. Measured
droplet diameters and volumes as well as calculated Z number for each solution can also be
seen in Table 2.2.
Table 2.2 Concentration of SDS added in PEDOT:PSS solutions, measured surface tensions and calculated Z numbers for each solution and measured droplet diameters and volumes of ejected droplets from each solution. Viscosities and densities were ~5.4 mPa s and ~1.001 g/cm3, respectively.
Concentration of SDS in solution
Surface tension mN/m
Droplet diameter in µm
Droplet volume in pL
The inverse Ohnesorge number (Z)
- 72.7 50.0 65.3 15.72 0.0010 M 49.7 47.3 55.3 13.06 0.0020 M 44.4 45.87 49.5 12.29 0.0040 M 39.2 43.6 43.3 11.60 0.0060 M 38.9 40 33.4 11.55 0.0080 M 38.5 38.2 29.1 11.50
Figure 2.4 shows the relationship between droplet volume and surface tension, as well
as the Z number. Considering that other parameters such as viscosity and density are not
changed significantly during surfactant addition, the volume of the ejected droplet tends to
increase with increasing surface tension.
25 30 35 40 45 50 55 60 65 7030
40
50
60
70
Z number
Sur
face
tens
ion,
mN
/m
Droplet volume, pL
Surface tension
11
12
13
14
15
16
17
Z number
Figure 2.4 Measured volumes of the ejected droplets of PEDOT:PSS solutions versus surface tensions of the solutions and Z number.

Physical aspects of inkjet printing polymers
31
As a consequence of these experiments, one can suggest that the dimensions of a droplet
of a PEDOT:PSS solution can be easily manipulated by varying the viscosity or by the
addition of a surfactant. However, droplets produced with decreased surface tension form
lower contact angles on a substrate, which means that the deposited droplet diameter on the
solid surface will be greater. For this reason, increasing viscosity is a more sophisticated
solution to obtain smaller feature sizes.
Another way of controlling the droplet size is to alter the voltage applied across the
piezo element. A second set of studies were undertaken to examine the influence on droplet
volume of varying voltage and pulse width. For this experiments a poly[2-methoxy-5-(2′-
ethylhexyloxyl)–1,4-phenylenevinylene] (MEH–PPV) solution in toluene (4 mg/mL,
viscosity ~ 1 mPa s) was used. The voltage was increased starting from 50 V to 80 V with a
step of 5 V and droplet diameters were measured while the pulse width was kept constant at
60 µs.
45 50 55 60 65 70 75 80 85 9080
100
120
140
160
180
200
Vol
ume
of th
e ej
ecte
d dr
ople
t, pL
R = 0.98313
Voltage, V
Figure 2.5 Measured droplet volumes obtained by altered voltage values keeping the pulse width constant at 60 µs. R is the deviation from the linear regression.
As can be seen in Figure 2.5 the volume of the droplet increased linearly with an
increase of the applied voltage. These findings agree with those of others.15,19,20 It can also be
seen that 50 V was the minimum voltage used, this was the lowest voltage that could be
applied to generate stable droplets. Above 50 V, the droplet volume can be increased from 85
to 190 pL by raising the voltage to 80 V. Voltages above 80 V lead to unstable droplets and
inconsistent satellites. For an input rectangular pulse, the voltage amplitude and its speed of
variation, determine the amount of the volume change induced by the piezo electric element
in the fluid channel. Since the piezoelectric displacement is proportional to the applied

Chapter II
32
electric field, increasing the voltage amplitude leads to larger volume changes in the same
amount of time, and thus larger induced pressure waves and fluid accelerations.
Consequently, there is a minimum voltage required to eject a drop. Above this critical value,
both the volume and velocity of the ejected droplets increase as voltage increase if all other
parameters are kept constant.19
A second series of droplet volume measurements were obtained by increasing the pulse
width, starting from 50 µs to 90 µs, with a step of 5 µs while the voltage was kept constant at
70 V. As can be seen from the Figure 2.6, the droplet volume was fluctuating in a small range
from 135 to 145 pL by increasing pulse width, while Reis et al. found that droplet size
exhibits a maximum as a function of driving pulse19. The influence of the pulse width is
related to the time required for the initial pressure pulse, generated by the leading edge of the
rectangular actuating signal, to travel from the actuated region to the ends of the fluid
chamber and back to the initiation point.19
45 50 55 60 65 70 75 80 85 90 9580
100
120
140
160
180
200
Vol
ume
of th
e ej
ecte
d dr
ople
t, pL
Pulse width, µs
Figure 2.6 Measured droplet volumes obtained by altered voltage values keeping the voltage costant at 70 V.
2.3 Limitations for printing polymer solutions 2.3.1 Printability of solvents A number of common solvents were investigated for printability. It was found that voltages of
70 to 100 V and pulse widths of 25 to 30 µs are sufficient to generate droplets from these
selected solvents. The solvents that were printed successfully using a micropipette with a
nozzle diameter of 70 µm are listed in Table 2.3. The table also presents physical properties of
the solvents and calculated Z numbers.

Physical aspects of inkjet printing polymers
33
As can be seen from the table, solvents having varied viscosities approximately from
0.4 to above 2 mPa s and surface tension between 23 and 73 mN/m could be successfully
printed. Z numbers for these printable solvents are varied from 21 to 91. Since most of the
solvents presented here have relatively low viscosities and surface tensions, printability is
mainly affected by the vapour pressure. Solvents such as chloroform and acetone have vapour
pressures higher than 100 mmHg (at 20 ˚C) and could not give stable droplets due to their
rapid evaporation in the nozzle.
Table 2.3 The physical properties of some solvents commonly used for polymers and their calculated Z values for a 70 µm nozzle diameter.
Viscosity at 25 ˚C,
mPa s
γ at 25 ˚C, mN/m
Density, g/mL
Vapour pressure, mmHg
Z number
Water 0.89 72.80 1.000 17 at 20 ˚C 80 Toluene 0.56 27.73 0.865 22 at 20 ˚C 73 p-Xylene 0.60 28.01 0.861 9 at 20 ˚C 68 Anisole 1.06 35.10 0.995 10 at 42 ˚C 47 Ethylbenzene 0.63 28.75 0.867 10 at 20 ˚C 66 Acetophenone 1.68 39.04 1.030 0.45 at 25 ˚C 32 Methylbenzoate 1.86 37.17 1.088 <1 at 20 ˚C 29 Ethyl acetate 0.42 23.39 0.902 73 at 20 ˚C 91 Butyl acetate 0.68 24.88 0.880 15 at 25 ˚C 57 N,N-Dimethylformamide 0.79 35.74 0.944 2.7 at 20 ˚C 61 N,N-Dimethylacetamide 1.93 34.00 0.937 2 at 25 ˚C 25 N-Methylpyrrolidone 1.60 41.00 1.028 0.29 at 20 ˚C 34 1,4-Dioxane 1.18 32.75 1.034 27 at 20 ˚C 41 Propylene carbonate 2.51 41.93 1.189 0.13 at 20 ˚C 24 N-Dodecane 1.38 25.35 0.750 1 at 48 ˚C 26 Dimethyl sulfoxide 1.99 42.92 1.100 0.42 at 20 ˚C 29 2-Ethoxyethanol 2.03 28.35 0.930 3.8 at 20˚ C 21
Quantitative performance tests were carried out with a standard micropipette (nozzle
diameter of 70 µm). The test fluid was a mixture of glycerol and water. Figure 2.7 shows the
minimum voltage pulse amplitude that was needed to give an ejected droplet a speed of 2 m
s_1, as a function of the viscosity of the glycol/water mixture. Within the range of viscosities
investigated, the data seem to suggest a linear relationship between the necessary voltage and
the viscosity of the mixture. Higher viscosity requires higher energy thus higher voltage to be
applied on the piezo element to create a pressure wave in the liquid. In the literature,
(approximately) linear relations were found between voltage and droplet velocity,21 and
droplet velocity and viscosity.15

Chapter II
34
Figure 2.7 Voltage necessary to give an ejected droplet of a glycol/water mixture as a function of viscosity.
2.3.2 Polymer molecular weight and concentration Initial polymer printing studies were carried out using solutions containing 2% by weight of
polydisperse polystyrene. Given the small size of the inkjet printed droplets and their
correspondingly high surface to volume ratio, it was expected that solvent evaporation would
be a severe problem, leading to formation of polymer crusts and finally clogging of the
nozzle. Therefore, solvents with a low vapour pressure were used, that is, acetophenone and
methylbenzoate. However, it was found that nozzle clogging through solvent evaporation is a
minor problem. Solvents that were used successfully for the inkjet printing of polystyrene
include toluene, anisole, p-xylene, ethylbenzene, acetophenone, methylbenzoate, and
butylacetate. Even relatively volatile solvents could be used, like ethylacetate and 1,4-
dioxane, though these solvents seem to be the upper limit, as a polymer plug is formed within
half a minute when the nozzle is left undisturbed. This plug can be removed by using
ultrasound.
The behaviour of polymer solutions during inkjet printing differs from the behaviour of
Newtonian fluids. Figure 2.8 shows the behaviour of a 2% by weight polystyrene solution in
acetophenone. The polymer solution droplet remains attached to the nozzle by a fluid
filament, which was sustained for several hundreds of microseconds. Disintegration of the
fluid filament starts with the formation of a pinch point behind the primary droplet, followed
by the formation of secondary, satellite droplets. Laplace pressure driven fluid drainage from
the filament into the droplets finally leads to filament rupture. Meyer et al., who studied inkjet
printing of polyacrylamide in glycerol/water mixtures observed a similar behaviour.22

Physical aspects of inkjet printing polymers
35
However, these authors observed a return to ‘‘Newtonian’’ printing behaviour, that is, a
decrease of filament length and absence of satellite drops at even higher polymer
concentrations and molecular weights, that was not observed in this case. Viscoelastic fluid
jets also show the same breakup mechanism, as was observed by Goldin et al. using sodium
carboxymethylcellulose in water23 and by Christanti and Walker using polyethylene oxide in
glycerol/water mixtures.24
µsµs Figure 2.8 A series of pictures showing droplet ejection as a function of time (µs). Sample: 2% by weight solution of polydisperse polystyrene (Mn 80 kD, Mw 282 kD) in acetophenone. The droplet remains attached to the nozzle through a persistent filament. Detachment occurs by formation of a pinch point after 200 µs and formation of secondary satellite droplets after 240 µs.
Elastic stresses are also responsible for the recoil of a polymer droplet in cases where its
kinetic energy is insufficient to overcome them. The droplet leaves the nozzle, slows and is
then withdrawn. This phenomenon imposes a second barrier that must be overcome, in
addition to the viscous friction in the capillary that is related to the shear viscosity of the
solution.
To gain insight into the relationship between molecular weight, weight fraction of
polymer and printability, the maximum mass fraction Φm,max that could be printed was
determined, as a function of molecular weight, using a pulse width of 15 µs and a voltage of
115 V. Polystyrene standards dissolved in acetophenone were used for these experiments.
Results are shown in Figure 2.9. It can be seen that Φm,max strongly decreases with
molecular weight. In the case of Mw equal to 2.53 × 10⁶, Φm,max is as low as 2.5 × 10⁻⁴. At
high molecular weights, Φm,max seems to scale with Mw according to a power law, that is,
Φm,max α Mw-a, with a = 2.14. At lower molecular weights the maximum weight fractions
are lower than is predicted by this relation.
In addition, the shear viscosity of the solutions was measured at 25 ˚C using an
Ubbelohde viscosimeter. The inset of Figure 2.9 shows the relative viscosities [η]c = (ηsoln-
ηsolv)/ηsolv of the solutions, where [η] denotes the intrinsic viscosity, c the polymer

Chapter II
36
concentration at Φm,max and ηsoln and ηsolv the viscosity of the polymer solution and the
solvent, respectively. It is seen that for the three highest molecular weights, the relative
viscosity of the solutions [η]c < 1, and decreases with increasing molecular weight, rather
than staying constant. This suggests that at least at these high molecular weights, the results
cannot be explained by an increase of the shear viscosity through polymer addition, and
should therefore be due to elasticity effects. Maybe the above power law therefore reflects a
limiting regime where printability is solely determined by elasticity effects.
101
100
10-1
10-2
102 103
[η]c
MW/kD
Figure 2.9 Maximum printable volume fraction Φm,max as a function of molecular weight Mw. The inset shows the reduced viscosities [η]c of solutions containing the maximum
printable mass fraction polystyrene.
At molecular weights below 5 × 10⁵, the viscosity of the polymer solution is a few times
the viscosity of the solvent. It is therefore likely that the combined effect of elasticity and
shear viscosity limits printability. This means that there is a second barrier that must be
overcome which explains the droplet behaviour of a polymer solution i.e. the bouncing back
in case its kinetic energy is insufficient.
2.4 Pattern formation of the printed polymer films Choosing the appropriate combination of solvent and substrate is crucial for successful
printing of polymers and to obtain homogeneous films.25 When printing structures whose
length scale coincides with the droplet diameter, a large contact angle of the solvent on the
substrate is advantageous. Whereas when printing structures, e.g. films, which are much
larger than the droplet diameter, the contact angle should be relatively small. If not, the ink
will dewet on the substrate during drying and the resulting film will not be continuous.

Physical aspects of inkjet printing polymers
37
Moreover, the amount of ink that needs to be deposited to cover a certain area may exceed
what can be deposited by inkjet printing – typically a maximum of few micro litres (for the
micropipette system).
As mentioned in the introduction, a frequently remarked phenomenon, which is often
observed for inkjet printed features, is the so-called “coffee drop” effect, which describes the
propensity for solute to deposit at the boundaries of a printed feature; with a droplet of coffee
being clear examples of such behaviour. Deegan et al.9,10,26 explained the phenomena as being
due to an increased evaporation rate at a feature’s pinned contact line then at its centre.
Material is transported to the boundary by a replenishing flow from the centre. Indeed, the
driving force behind the phenomena is so strong that Magdassi et al.27 found electrical
conductivity up to 15% of bulk silver for rings formed from the room temperature evaporation
of aqueous droplets of silver nanoparticles. The actual cause of coffee staining continues to
generate debate; Sommer et al.11 suggest that ring formation is independent of contact line
pinning whereas Hu and Larson report that the coffee ring effect not only requires a pinned
contact line, but also suppression of the Marangoni flow that results from the latent heat of
evaporation.12
Although the phenomenon’s causes continue to be debated it can be suppressed by the
use of solvent mixtures. In the following section, it will be shown that a small addition of
acetophenone to the more volatile solvent, ethyl acetate prevents material being transported to
the boundary by the possible establishment of a solvent composition gradient.
2.4.1 Patterns printed from a single solvent Initial experiments for pattern formation studies were carried out with solutions of
polydisperse polystyrene (Mw 282 kD) in toluene, ethyl acetate, dioxane, anisole, butyl
acetate, methyl benzoate, acetophenone and p-xylene. The contact angles of all these solvents
on glass surfaces are so small that they cannot be measured using conventional goniometry,
which is limited to contact angles above 20˚. All solutions contained 2% polystyrene by
weight. They could typically be printed at voltages of 95 to 120 V and pulse widths of 45 to
67 µs. To create thin polymer films, an array of droplets was deposited with a dot spacing
value such that the droplets merged on the surface. Well-defined and smooth films were
obtained with toluene, butyl acetate, dioxane, anisole and p-xylene, when varying the dot
spacing between 60 and 140 µm. If too much material was deposited, i.e. when the dot
spacing was smaller than 60 µm, the printed rectangle showed a bleeding effect (e.g. Figure
2.10-b). If the dot spacing was larger than 140 µm, the material deposited on the surface
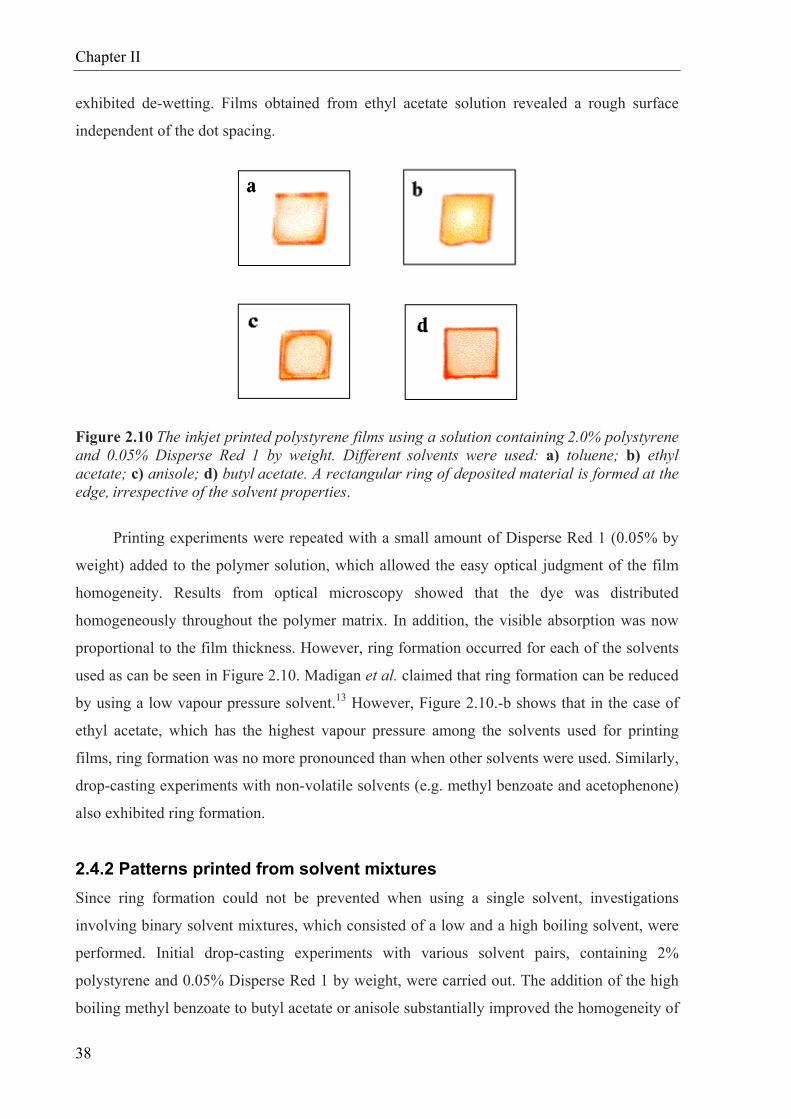
Chapter II
38
exhibited de-wetting. Films obtained from ethyl acetate solution revealed a rough surface
independent of the dot spacing.
Figure 2.10 The inkjet printed polystyrene films using a solution containing 2.0% polystyrene and 0.05% Disperse Red 1 by weight. Different solvents were used: a) toluene; b) ethyl acetate; c) anisole; d) butyl acetate. A rectangular ring of deposited material is formed at the edge, irrespective of the solvent properties.
Printing experiments were repeated with a small amount of Disperse Red 1 (0.05% by
weight) added to the polymer solution, which allowed the easy optical judgment of the film
homogeneity. Results from optical microscopy showed that the dye was distributed
homogeneously throughout the polymer matrix. In addition, the visible absorption was now
proportional to the film thickness. However, ring formation occurred for each of the solvents
used as can be seen in Figure 2.10. Madigan et al. claimed that ring formation can be reduced
by using a low vapour pressure solvent.13 However, Figure 2.10.-b shows that in the case of
ethyl acetate, which has the highest vapour pressure among the solvents used for printing
films, ring formation was no more pronounced than when other solvents were used. Similarly,
drop-casting experiments with non-volatile solvents (e.g. methyl benzoate and acetophenone)
also exhibited ring formation.
2.4.2 Patterns printed from solvent mixtures Since ring formation could not be prevented when using a single solvent, investigations
involving binary solvent mixtures, which consisted of a low and a high boiling solvent, were
performed. Initial drop-casting experiments with various solvent pairs, containing 2%
polystyrene and 0.05% Disperse Red 1 by weight, were carried out. The addition of the high
boiling methyl benzoate to butyl acetate or anisole substantially improved the homogeneity of

Physical aspects of inkjet printing polymers
39
the dye distribution. Mixtures of methyl benzoate and ethyl acetate (with a methyl benzoate
content ranging between 10 and 20% by weight) resulted in particularly uniform
homogeneous films without or minimised ring formation, which suggests that a large
difference in boiling points is advantageous. The effect can be explained as follows: liquid is
transported to the edge from the centre to replenish evaporative losses since the contact line is
fixed. As methyl benzoate evaporates slower than ethyl acetate, the concentration of methyl
benzoate at the edge will gradually increase. This causes a decrease in the local vapour
pressure at the edge, and therefore a decrease in the rate of evaporation, which in turn
decreases the amount of material is transported to the edge.
A solution containing 2.0% polystyrene and 0.05% Disperse Red 1 by weight, dissolved
in a 90:10 w/w mixture of ethyl acetate/methyl benzoate, was printed at a voltage of 112 V
and pulse width of 65 µs, while varying the dot spacing between 70 and 120 µm. Ring
formation was virtually eliminated, independent of the dot spacing. However, since mixtures
containing methyl benzoate and acetophenone spread strongly on the glass surface, the
rectangular shape of the films was often distorted.
Multilevel printing (the procedure is explained in the Experimental part) instead of
monolevel printing can eliminate this problem: when printing a multilevel matrix the
spreading of the solution on the glass surface is avoided and exceptionally homogeneous and
well defined films were obtained. The principle of the multilevel method is that droplets are
printed in such a sequence that they coalesce each other when the initially deposited ones are
partially dry. We performed similar multilevel printing experiments with solvent mixtures of
acetophenone and isopropyl acetate, as well as methyl benzoate and isopropyl acetate. In both
cases, the isopropyl acetate content was 95% by weight. Both mixtures are characterised by a
large difference in boiling point. Again, ring formation was suppressed effectively.
Figure 2.11 shows the topography of the inkjet printed polystyrene films which were
measured with a confocal scanning microscope. The difference between the topographies that
were obtained using a single solvent (butyl acetate) and a mixture of high boiling and low
boiling solvents is obvious. Ring formation is the inevitable result when butyl acetate was
used (see Figure 2.11-a): most of the polymer is deposited at the film edge. The uniformity of
the film strongly improves when using a solvent mixture (see Figure 2.11-b, c, d).
It should be noted that the thicknesses of the films prepared by multilevel printing are
significantly high (e.g. 20 µm) compared to that of monolevel (< 1 µm). Control of film
thickness will be explained in more detail in the following chapters.

Chapter II
40
Figure 2.11 Confocal scanning microscopy images and the corresponding cross sections of the polystyrene films. a) Butyl acetate solution containing 2% by weight polystyrene, monolevel matrix printed. Most of the polymer is deposited at the edges. b) 10:90 w/w Methyl benzoate/ethyl acetate solvent mixture, containing 2% by weight polystyrene, multilevel matrix printed. The uniformity of the film improves strongly when using a solvent mixture. c) 5:95 w/w Acetophenone/isopropyl acetate solvent mixture, containing 2% by weight polystyrene, multilevel matrix printed. d) 5:95 w/w methyl benzoate/ isopropyl acetate solvent mixture, containing 2% by weight polystyrene, multilevel matrix printed.

Physical aspects of inkjet printing polymers
41
Besides the print method, other parameters such as print head velocity, dot spacing,
solvent mass ratio and others may influence the reproducibility, film flatness and film
homogeneity. Therefore, arrays of polymer films were printed using the multilevel approach,
while systematically varying several parameters. The distance of rectangles corresponds to the
distance between the wells of a standard 96-well microtitre plate. Such printed glass plates
can serve perfectly as easily characterisable libraries for combinatorial material research
applications.28,29 In addition, most analytical tools that are available are based on the
microtitre plate format (e.g. UV-Vis/fluorescence, FTIR and RAMAN readers).
Films were printed at different print head velocities, i.e. 6.25, 12.5, 25.0 and 38.0 mm
s-1. The results are shown in Figure 2.12. It can be seen that increasing the velocity decreases
the film quality. Particularly interesting is the film shape when printing at 38 mm s-1, when a
pattern consisting of lines was formed. The line direction coincides with the printing
direction, and the number of lines exactly equals the number of dots of the constituting
matrices but overlapping is incomplete. This can be caused by nozzle clogging at high
velocities due to drying ink in the print head. Therefore subsequent experiments were
performed using 6.25 mm s-1 print head velocity (it takes 6 to 8 minutes to print one 6 × 6
mm2 film, depending on the dot and matrix spaces).
Figure 2.12 Polystyrene films, inkjet printed using a solution containing 2.0% polystyrene and 0.05% Disperse Red 1 by weight. The films were printed at different print head velocities: a) 6.25; b) 12.5; c) 25.0 and d) 38.0 mm s-1. Increasing the velocity decreases the film homogeneity. At 38.0 mm s-1 the film breaks up into lines; the line direction coincides with printing direction, and the number of lines equals the number of dots of the constituting matrix.

Chapter II
42
Figure 2.13 Polystyrene films, inkjet printed using a solution containing 2.0% polystyrene and 0.05% Disperse Red 1 by weight. The films were printed from a methyl benzoate/ethyl acetate solvent mixture. Print parameters and solvent mixture composition vary from row to row. Exact values are given in Table 2.4.
Table 2.4 Dot spacing, matrix spacing and solvent ratios used for optimising reproducibility. The averaged maximum absorbance and standard deviations of the maximum absorbance are shown. The images of the films are shown in Figure 2.13.
Row Dot Spacing, µm
Matrix spacing, µm
Methyl benzoate/
Ethyl acetate % w/w
Amax Standard Deviation
%
A 600 70 10/90 0.727 11.8 B 600 80 10/90 0.531 3.8 C 500 100 10/90 0.585 18.3 D 500 90 10/90 0.688 3.9 E 700 120 15/85 0.443 12.4 F 700 100 15/85 0.555 9.6 G 600 90 15/85 0.673 6.5 H 600 80 15/85 0.606 10.1
Figure 2.13 shows a printed microtitre sized glass plate (here only 56 of the 96 possible
positions were used). The print parameters were identical for each row. Matrix and dot
spacing values, solvent mixture ratios, average maximum absorbance values and standard
deviations of the respective maximum absorbance are given in Table 2.4. The absorption
values indicate that rows B and D gave the most promising results (B: printing conditions: 80
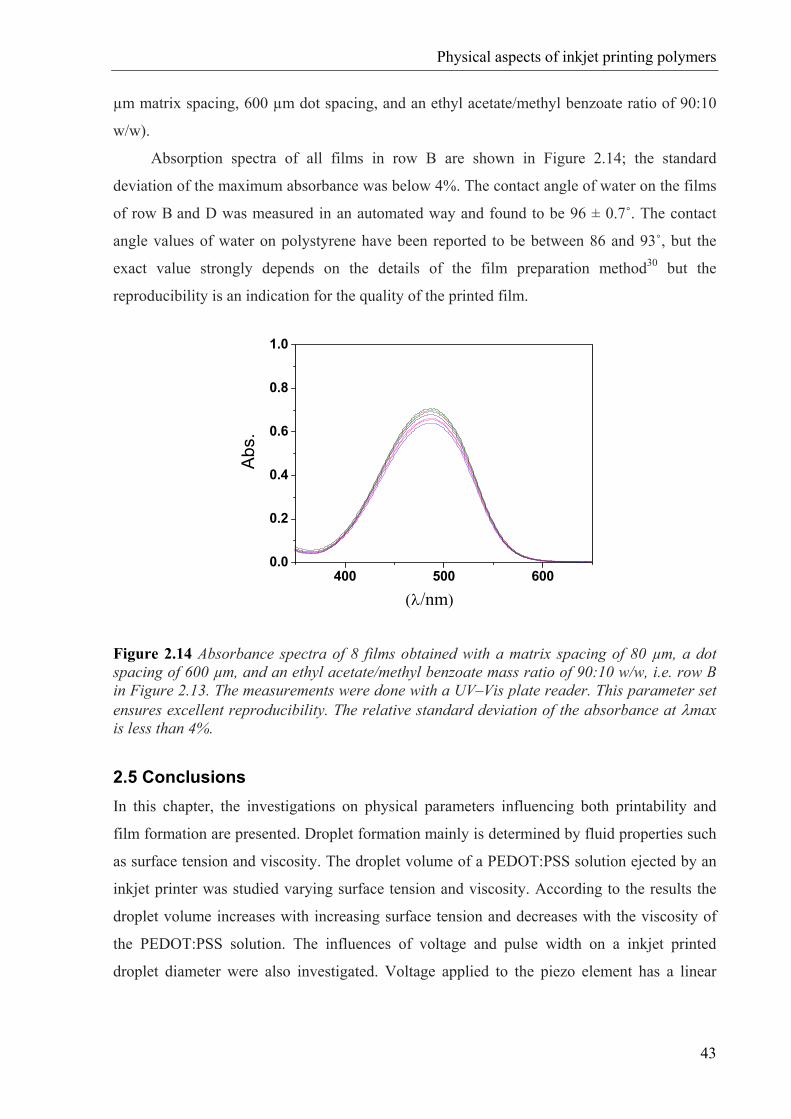
Physical aspects of inkjet printing polymers
43
µm matrix spacing, 600 µm dot spacing, and an ethyl acetate/methyl benzoate ratio of 90:10
w/w).
Absorption spectra of all films in row B are shown in Figure 2.14; the standard
deviation of the maximum absorbance was below 4%. The contact angle of water on the films
of row B and D was measured in an automated way and found to be 96 ± 0.7˚. The contact
angle values of water on polystyrene have been reported to be between 86 and 93˚, but the
exact value strongly depends on the details of the film preparation method30 but the
reproducibility is an indication for the quality of the printed film.
400 500 6000.0
0.2
0.4
0.6
0.8
1.0
(λ/nm)
Abs
.
Figure 2.14 Absorbance spectra of 8 films obtained with a matrix spacing of 80 µm, a dot spacing of 600 µm, and an ethyl acetate/methyl benzoate mass ratio of 90:10 w/w, i.e. row B in Figure 2.13. The measurements were done with a UV–Vis plate reader. This parameter set ensures excellent reproducibility. The relative standard deviation of the absorbance at λmax is less than 4%. 2.5 Conclusions In this chapter, the investigations on physical parameters influencing both printability and
film formation are presented. Droplet formation mainly is determined by fluid properties such
as surface tension and viscosity. The droplet volume of a PEDOT:PSS solution ejected by an
inkjet printer was studied varying surface tension and viscosity. According to the results the
droplet volume increases with increasing surface tension and decreases with the viscosity of
the PEDOT:PSS solution. The influences of voltage and pulse width on a inkjet printed
droplet diameter were also investigated. Voltage applied to the piezo element has a linear

Chapter II
44
relationship with a droplet volume, which confirms the results in literature. However, the
effect of pulse width remains unclear.
Common solvents which can be suitable for polymers are examined for printability.
Water, aromatic solvents, linear alkanes, and esters could be successfully inkjet printed.
Solvents having high vapour pressures (higher than 100 mmHg) did not reveal stable droplets.
The voltage required to give ejected droplets increases linearly with fluid viscosity,
indicating that viscous dissipation is the main factor determining printability of Newtonian
fluids. When printing a polymer solution, the droplet remains attached to the nozzle by a
filament that is sustained over a prolonged period of time. Filament disintegration starts with
the formation of a pinch point above the main droplet and then continues with the formation
of satellite droplets along the filament until rupture. The maximum polymer mass fraction
Φm,max that could be printed was decreasing with increasing Mw. This scaling behaviour
was found to be because of the elastic stress caused by the elongational flow in the nozzle.
Finally a detailed study is presented on how to prepare defined and homogeneous films
by inkjet printing. For this study, polystyrene was selected as the model material. Polystyrene
films could be printed using a range of solvents, i.e. acetophenone, anisole, butyl acetate,
ethyl acetate, methyl benzoate, toluene and p-xylene. However, a ring deposit due to contact
line pinning was always formed. This could be largely suppressed by using a mixture of two
suitable solvents, one high boiling and the other low boiling, i.e. methyl benzoate/ethyl
acetate, acetophenone/isopropyl acetate and methyl benzoate/ isopropyl acetate. Parameters
influencing the quality of the films that were printed from the ethyl acetate/methyl benzoate
solvent mixture were systematically optimised. To this end, a small amount of dye was added.
Multilevel (rather than monolevel) matrix deposition resulted in regular, smooth films, as the
spreading of the solvent mixture on the substrate was strongly reduced. Films printed in this
way had an error of less than 4% in the absorption at λmax. The average contact angle of
water on the film surfaces was in reasonable agreement with literature values. The film
quality was found to be effected by print the head velocity as well as the dot spacing.
The results presented open new avenues for the application of inkjet printing
techniques, e.g. for the preparation of discrete libraries of block copolymers, blends and
coating formulations in combinatorial material research as well as a novel entry to a fast
primary screening of polymeric solar cells or LED materials.

Physical aspects of inkjet printing polymers
45
2.6 Experimental section Materials PEDOT:PSS solutions, Baytron P and Baytron P-jet, were acquired from H.C. Starck. Acetophenone (99%) was purchased from Sigma-Aldrich. Disperse Red 1 was purchased from Fluka Chemika. Six polystyrene standards (Mw 64 kD, 125, 226, 564, 1 070, 2 530; PDI < 1.10) were purchased from PSS (Polymer Standards Service GmbH, Mainz, Germany). Polydisperse general purpose polystyrene (Mn 80 kD, Mw 282 kD, PDI 3.5) was supplied by Shell. Small amounts of different solvents were used, supplied by different manufacturers (purity > 97%).
Microscopic slides (361 inch) from Marienfeld (Lauda-Königshofen, Germany) were used as a substrate. Alternatively, custom-made glass plates with the same dimensions as a microtitre plate, i.e. 5 × 3.33 inch, were used. These plates had a thickness of 1.1 mm and consisted of D263 glass. Before printing, the substrates were ultrasonicated for 5 minutes in acetone. Subsequently they were rubbed and ultrasonicated for 10 minutes with sodium dodecyl solution and washed with demineralised water to remove the soap. Afterwards they were treated with isopropanol vapor in a reflux setup to remove the water and dried under a flow of air. To remove any organic contamination, the substrates were finally treated in a UV-ozone photoreactor (UVP PR-100, Upland, CA) for 20 minutes. For the microtitre sized glass plates, water was removed by ultrasonication in isopropanol, rather than by a reflux setup.
Instrumentation Inkjet printing was carried out using an Autodrop printer (Microdrop Technologies, Norderstedt, Germany). For detailed properties of the printing set up, see Chapter 1.
The Autodrop software provides the user with two different preprogrammed deposition patterns: monolevel matrix and multilevel matrix. A matrix is characterised by the number of droplets in the X- and Y-directions, and the spacing in between. Films can be printed by making the spacing between the droplets sufficiently small, so that they merge on the surface. This printing method will be referred to as the ‘‘monolevel’’ matrix. A second printing method is the ‘‘multilevel’’ matrix, where each of the dots of the original matrix is a matrix by itself. A multilevel matrix is characterised by four additional parameters, i.e. the number of matrices in the X- and Y-directions and the distances in between. A special situation arises when the distance between the matrices is chosen to be (much) smaller than their dot spacing. Figure 2.15 shows a schematic illustration of this print process. Assuming that printing starts at the upper left corner and ends at the lower right, the first matrix, A1, is printed and, after completing A1, deposition continues with A2, A3, B1, B2…etc. The difference between this elaborate printing method, which I will refer to as the ‘‘multilevel’’ matrix in the rest of this contribution, and normal ‘‘monolevel’’ printing is only the sequence of positions in which the droplets are deposited. This method proved useful for the improvement of film homogeneity. Unless stated otherwise, all printed films had a size of 6 x 6 mm2.
Surface tension and contact angle measurements were carried out with a fully automated, video-based OCA30 from Dataphysics (Filderstadt, Germany). The sample holder is mounted on an YZ stage, which enables it to dispense a drop of test-liquid automatically, to measure the contact angle and then remove the droplet at a set of predefined coordinates. The surface tensions of the solutions were measured with the pendant drop method. The shape of a drop of liquid hanging from a syringe tip is determined from the balance of forces which include the surface tension of that liquid. The surface or interfacial tension at the liquid interface can be related to the drop shape through Young-Laplace equation.

Chapter II
46
1 2
3
Figure 2.15 Schematic illustration of the multilevel matrix deposition. First matrix A1 is printed and, after completing A1, deposition continues with A2, A3, B1, B2…etc. Multilevel matrix deposition improves significantly the homogeneity of the printed films.
UV–Vis spectra were measured on a Flashscan S12 spectrophotometer from AnalytikJena (Jena, Germany). Based on the microtitre plate format this device measures up to 8 spectra in parallel within a few seconds. A white light confocal microscope (Nanofocus mSurf, Duisburg, Germany) was used to determine the surface topography. The setup uses an external 100 W xenon cold light.

Physical aspects of inkjet printing polymers
47
2.7 References
1 R.F. Service, Science 2004, 304, 675.
2 B.G. Levi, Phys. Today 2001, 54, 20.
3 E.I. Haskal, M. Büchel, P.C. Duineveld, A. Sempel, P. van de Weijer, MRS Bulletin
2002, 27, 864.
4 R.K. Holman, S.A. Uhland, M.J. Cima, E. Sachs, J. Colloid Interface Sci. 2002, 247,
266.
5 P. Calvert, Chem. Mater. 2001, 13, 3299.
6 M.H. Adao, A.C. Fernandes, B. Saramago, A.M. Cazabat, Colloids Surf. A 1998, 132,
181.
7 B.-J. de Gans, U.S. Schubert, Langmuir 2004, 20, 7789.
8 B.-J. de Gans, P.C. Duineveld, U.S. Schubert, Adv. Mater. 2004, 16, 203.
9 R.D. Deegan, O. Bakajin, T.F. Dupont, G. Huber, S.R. Nagel, T.A. Witten, Nature
1997, 389, 827.
10 R.D. Deegan, O. Bakajin, T.F. Dupont, G. Huber, S.R. Nagel, T.A. Witten, Phys. Rev.
E 2002, 62, 756.
11 A.P. Sommer, N. Rozlosnik, Crystal Growth Des. 2005, 5, 551.
12 H. Hu, R.G. Larson, J. Phys. Chem. B 2006, 110, 7090.
13 C.F. Madigan, T.R. Hebner, J.C. Sturm, Mat. Res. Soc. Symp. Proc. 2000, 625, 123.
14 P.J. Lyon, J.C. Carter, J.C. Bright, M. Cacheiro, WO Patent 02(069119) A1, 2002.
15 J.F. Dijksman, J. Fluid Mech. 1984, 139, 173.
16 J.E. Fromm, IBM J. Res. Develop. 1984, 28, 322.
17 D.B. Bogy, F.E. Talke, IBM J. Res. Dev. 1984, 28, 314.
18 B.V. Antohe, D.B. Wallace, J. Imaging Sci. Technol. 2002, 46, 409.
19 N. Reis, C. Ainsley, B. Derby, J. Appl. Phys. 2005, 97, 094903.
20 H.-C. Wu, T.R. Shan, W.-S. Hwang, H.J. Lin, Mater. Trans. 2004, 45, 1801.
21 W. Meyer, M. Döring, in Microreaction Technology: Industrial Prospects – IMRET3:
Proceedings of the 3rd International Conference on Microreactor Technology, W.
Ehrfeld, Ed., Springer, Berlin 2000, 145.
22 J.D. Meyer, A.A. Bazilevsky, A.N. Rozkhov, IS&T NIP13: 1997 International
Conference on Digital Printing Technologies.
23 M. Goldin, J. Yerushalmi, R. Pfeffer, R. Shinnar, J. Fluid Mech. 1969, 38, 689.

Chapter II
48
24 Y. Christanti, L.M. Walker, J. Non-Newtonian Fluid Mech. 2001, 100, 9.
25 J. Park, J. Moon, Langmuir 2006, 22, 3506.
26 R.D. Deegan, Phys. Rev. E 2000, 61, 475.
27 S. Magdassi, M. Grouchko, D. Toker, A. Kamynshny, I. Balberg, O. Millo, Langmuir
2005, 21, 10264.
28 R. Hoogenboom, M.A.R. Meier, U.S. Schubert, Macromol. Rapid Commun. 2003, 24,
16.
29 S. Schmatloch, M.A.R. Meier, U.S. Schubert, Macromol. Rapid Commun. 2003, 24, 33.
30 M.H. Adao, A.C. Fernandes, B. Saramago, A.M. Cazabat, Colloids Surf. A 1998, 132,
181.

Chapter III
Inkjet printing of luminescent ruthenium- and iridium-containing polymers
Abstract Defined films of luminescent ruthenium(II)polypyridyl-poly(methyl methacrylate) (PMMA)
and iridium(III)polypyridyl-polystyrene (PS) copolymers have been prepared by inkjet
printing. The copolymers were deposited on photoresist patterned glass substrates. Films as
thin as 120 nm could be printed with a roughness of 1 to 2%. Furthermore, the film thickness
could be varied in a controlled way through the number of droplets deposited per unit area.
In addition, the inkjet printing of a thin film library of donor/acceptor systems for bulk
heterojunction solar cells and their characterisation are illustrated. The inkjet printing
technology allowed printing of arrays of different donor/acceptor compositions on a substrate
as well as the subsequent fast optical screening of the electron transfer processes. The
investigated films consist of blends of a poly(methyl methacrylate) polypyridyl ruthenium(II)
copolymer (RuPMMA) as electron donor material (n-type) and C60 fullerene (PC60BM) as
well as heptyl-viologen (C7-V) derivatives as electron acceptor materials (p-type).
Parts of this chapter have been published: E. Tekin, E. Holder, V. Marin, B.-J. de Gans, U.S. Schubert, Macromol. Rapid Commun. 2005, 26, 293; V. Marin, E. Holder, M.M. Wienk, E. Tekin, D. Kozodaev, U.S. Schubert, Macromol. Rapid Commun. 2005, 26, 319

Chapter III
50
3.1 Introduction
Ru- and Ir-complexes are promising materials in device technology because of their special
photophysical and electrochemical properties.1-4 The incorporation to a polymer backbone
through metal ligand interactions of metal complexes represents a possibility to design new
materials with improved properties, mainly for functional thin film applications, e.g., light-
emitting devices or solar cells. The covalent linkage of the complex to a polymer leads to
materials that reveal the advantage of preventing the aggregation of metal complexes as
observed in polymer blends, while still maintaining the processing features of the polymer
backbone. In this way, the manufacturing advantages of polymer-based devices over small
molecule devices become very attractive: straightforward processability by low cost wet-
deposition techniques such as inkjet printing or spin-coating. Furthermore, by making use of
this concept quick degradation on the electrode surface of the light-emitters might be
prevented.1,5
As mentioned in the first chapter, growing efforts have been made in the field of inkjet
printing technology in relation to the fabrication of colour emissive polymer displays.6-10 In
particular, inkjet printing is an essential technique for the integration of different polymers in
a certain pattern on the same substrate (e.g. deposition of red, green and blue emitters for
potential applications in full colour displays).8-11 Furthermore, less material is wasted as
compared to other deposition methods, such as e.g. spin-coating. Moreover, insensitivity to
substrate defects for the fabrication of large area devices is offered.9 The advantages of inkjet
printing versus the spin-coating technique are summarised in Table 3.1. On the other hand,
slow processing, special ink formulation requirements (e.g. low viscosity) and undesired
drying formations (e.g. “coffee drop effect”) can be pointed out as disadvantages of the inkjet
printing process.
Table 3.1 A comparison between the characteristic of film preparation by spin-coating and by inkjet printing methods.9
Characteristics Spin-coating Inkjet printing Patterning capability No patterning capability Capable of patterning
(micrometer resolution) Large device area capability
Sensitive to dust particles and substrate defects
Not sensitive to substrate defects
Efficiency of using material
More than 99% of the solution is wasted
Less than 2% of the solution is wasted
Multi-colour display fabrication capability
No multicolour patterning Ideal for multicolour patterning

Inkjet printing of luminescent Ru- and Ir- containing polymers
51
For device applications, the active layer of semiconducting luminescent materials must
be very thin (in the range of about 100 nm) and very flat (less than 5% roughness) for
efficient charge transport and good surface contact. As discussed in the second chapter,
usually polymer films deposited by inkjet printing suffer from ring formation effect.12,13 This
makes them unsuitable for applications in the production of high quality electronic devices. It
was shown that it is possible to minimise the ring formation effect for macroscopic films13 (or
for small polymer dots14) by a careful selection of solvent and printing methods.
The focus of this chapter is directed to the development of a method for the preparation
of homogenous thin films and thickness libraries of luminescent Ru(II)polypyridyl-PMMA
and Ir(III)polypyridyl-PS copolymers (Figure 3.1) using inkjet printing, as well as the
subsequent screening of their optical properties in parallel. Photoresist patterns on glass
substrates were employed to confine the printed liquid and thus to produce well-defined films.
Using this method, thin film libraries with various thicknesses could be obtained in a
controlled way. The same method was used to prepare a thin-film library of donor/acceptor
systems and to screen according to electron transfer performance for potential application in
bulk heterojunction solar cells. The morphological properties of the blends were investigated
by atomic force microscopy (AFM).
a) b)
O O O
N N
N
NN
N Ru
O
2+ + [SbF6-]2
n m
N
NN
O
NN Ir
+ (PF6-)
20
Figure 3.1 Schematic representation of a) a Ru(II)polypyridyl-PMMA copolymer and b) an Ir(III)polypyridyl-PS copolymer.

Chapter III
52
3.2 Printing thin film libraries using photoresist patterned substrates In the second chapter, it had been shown that the addition of small amounts of high boiling
solvent to a low boiling solvent based ink could prevent ring formation. This finding was used
to print polystyrene films with a thickness between 6 and 20 µm and a roughness smaller than
5%.13
To print thin films (in a range of 100 nm) of luminescent polymers and to subsequently
screen their optical properties in a fast and reliable way, ruthenium(II)polypyridyl-
poly(methyl methacrylate) (PMMA) and iridium(III)polypridyl-polystyrene (PS) copolymers
were selected as suitable candidates. Dilute solutions of these copolymers (1 wt-%) were
prepared using a mixture of isopropyl acetate/acetophenone (85/15, w/w) to minimise the ring
formation effect.13 These solutions could be printed at a voltage of 85 V and a pulse width of
35 µs. However, when printing monolayers (to obtain thin films) onto a glass surface, ring
formation was still taking place due to the low concentration of the polymers, and the films
suffered from a bleeding effect. To confine the deposited material and to obtain well-defined
films, the solutions were printed onto a glass substrate that was patterned with a photoresist,
as shown in Figure 3.2 (see Experimental part for details about the substrate preparation).
This substrate provides wells surrounded by photoresist. It can be suggested that the contact
angle of deposited liquid in such a well goes down to zero. Therefore, the evaporation rate
along the liquid surface interface is homogenous thus eliminating material transport to the
edges.
Glass Photo-resist layer
Micropipette
Glass Photo-resist layer
Micropipette
Figure 3.2 Schematic illustration of the photoresist patterned glass substrate and the corresponding inkjet printing into the wells of this substrate using a micropipette.
The effect of employing barriers was compared to printing onto a normal glass surface
(Figure 3.3). It can be clearly seen from the cross-section that the inkjet printed copolymer

Inkjet printing of luminescent Ru- and Ir- containing polymers
53
films in barriers are much flatter than those printed onto non-patterned glass (Figure 3.3-a and
3.3-b). However, the edges of the cross-sections of the films shown in Figure 3.3-a are
slightly parabolic. This could be due to hydrophobic interactions between photoresist and the
printed material. On the other hand, films printed onto a non-patterned glass surface exhibit
clear ring formation; most of the material was transferred to the edges (Figure 3.3-b). This
effect is mainly eliminated when printing between photoresist barriers. It is obvious that the
topography of the films printed on patterned glass have a more homogeneous thickness
distribution.
0 100 200 300 400 5000.0
0.1
0.2
0.3
0.4
0.5
Distance (µm)
Thic
knes
s (µ
m)
Ru-PMMA (200 nm) Ir-PS (120 nm)
0 100 200 300 400 5000.0
0.2
0.4
0.6
0.8
1.0
Distance (µm)
Ru-PMMA
Thic
knes
s (µ
m)
a)
b)
0 100 200 300 400 5000.0
0.1
0.2
0.3
0.4
0.5
Distance (µm)
Thic
knes
s (µ
m)
Ru-PMMA (200 nm) Ir-PS (120 nm)
0 100 200 300 400 5000.0
0.2
0.4
0.6
0.8
1.0
Distance (µm)
Ru-PMMA
Thic
knes
s (µ
m)
a)
b)
Figure 3.3 a) Lateral cross section of the Ru(II)polypyridiyl-PMMA and iridium(III)polypyridiyl-PS copolymer films printed into the photoresist barriers (x = 0 represents the edge of the photoresist). b) Cross section of the Ru(II)polypyridiyl-PMMA copolymer film directly printed onto a normal glass surface.
The roughness of the films as determined from the profilometer images was
approximately 4 to 6 nm. In addition, the roughness of these films was also examined using
atomic force microscopy (AFM). Typically 10 × 10 µm areas were measured. For instance,

Chapter III
54
the roughness of an Ir(III)polypyridyl-PS copolymer film having a thickness of 120 nm was
1 nm and for a Ru(II)polypyridyl-PMMA film having thickness of 200 nm the roughness was
around 1 to 3 nm. These values correspond to 1-2% of the thickness of the films.
3.2.1 Controlling thicknesses of printed films
When printing onto a glass surface, many organic solvents show strong spreading. As a
consequence of this spreading the obtained films are therefore irregular in shape and the
thickness control after deposition becomes impossible. The material needs to be confined in a
certain area. Therefore, photoresist patterned substrates are also appropriate for this purpose.
To determine the film thicknesses, the printed films were scratched with a scalpel. The
depth of the film was measured by scanning over the scratch using the optical profilometer.
Dot spacing, the corresponding number of deposited droplets per mm2 and the resulting film
thicknesses are summarised in Table 3.2. The thickness versus number of deposited droplets
per area is plotted in Figure 3.4. The observed linear relation confirms that the film thickness
can be precisely controlled by varying the dot spacing.
Table 3.2 Dot spacing (in x and y direction equal) and corresponding number of droplets per area that were used to print luminescent polymers with various thicknesses. The resulting thicknesses were measured by an optical profilometer.
Dot spacing (mm)
Number of droplets per mm2
Thickness (nm)
0.15 45 120 0.14 50 199 0.13 60 282 0.12 70 370 0.11 84 405 0.10 100 500 0.09 122 729 0.08 156 920
To check the dependency of the film thicknes on the number of deposited droplets per
unit area, a library of Ru(II)polypyridyl-PMMA and Ir(III)polypyridyl-PS copolymer films
with variable dot spacings were printed. Each individual film is characterised by the number
of droplets in the X- and Y-directions, and the spacing in between the deposited droplet
centres, a value known as dot spacing; films can be formed by reducing the dot spacing so
that droplets merge on the surface. When the dot spacing (∆x) is decreased, the film thickness

Inkjet printing of luminescent Ru- and Ir- containing polymers
55
(h) should increase according to ( ) 2−∆∝ xh , since the amount of ink that is deposited
increases.
30 60 90 120 150 1800
200
400
600
800
1000
Thic
knes
s (n
m)
Ndrop/mm2
Figure 3.4 Thickness of the films as a function of the number of drops per square millimetre (Ndrop mm-2).
The positions of the luminescent films printed on the patterned substrate correspond to
the positions of the wells of a 96-well microtitre plate (Figure 3.5). This allows the use of a
UV-Vis/fluorescence plate reader to screen the optical properties of the libraries of the
copolymers in parallel.
Inkjet printing
Increasing thickness
Inkjet printing
Increasing thickness Figure 3.5 Photo of the solutions of luminescent ruthenium-(left) and iridium-(right) containing polymers in a glass microtitre plate (top) and the subsequently prepared films using inkjet dispensing techniques (below) are shown.

Chapter III
56
All absorption and emission spectra of the prepared Ru(II)polypyridyl-PMMA and
Ir(III)polypyridyl-PS copolymer libraries with various thicknesses were measured in a short
time. The maximum absorption of the metal-to-ligand charge transfer band of the
ruthenium(II)polypyridyl-PMMA copolymer was observed at 455 nm (Figure 3.6-a). The
respective emission spectra were recorded upon excitation at 455 nm. Emission maxima at
620 nm were exhibited which are characteristic for an electroluminescent trispyridyl
ruthenium (II) complex (Figure 3.6-b). Due to the rigidity of the environment, the emission
band is more pronounced. Ir(III)polypyridyl-PS copolymer films have absorption and
emission bands at 370 and 570 nm, respectively. In both cases, emission and absorption
intensity of the copolymers regularly decreased with a decrease in film thickness.
350 400 450 500 550
-0.02
0.00
0.02
0.04
0.06
0.08
decrease in film thickness
Abs
orpt
ion
(a.u
.)
Wavelength (nm)
500 600 700 8000
300
600
900
1200
1500
decrease in film thickness
Em
issi
on (a
.u.)
Wavelength (nm)
a)
b)
Figure 3.6 a) The absorption and b) emission spectra of inkjet printed Ru(II)polypyridiyl-PMMA copolymer films with variable thickness ranging from 120 nm to 900 nm.
A linear relationship was observed between film thicknesses and the corresponding maximum
absorbance or emission intensities as expected (see Table 3.3). These results also verify the
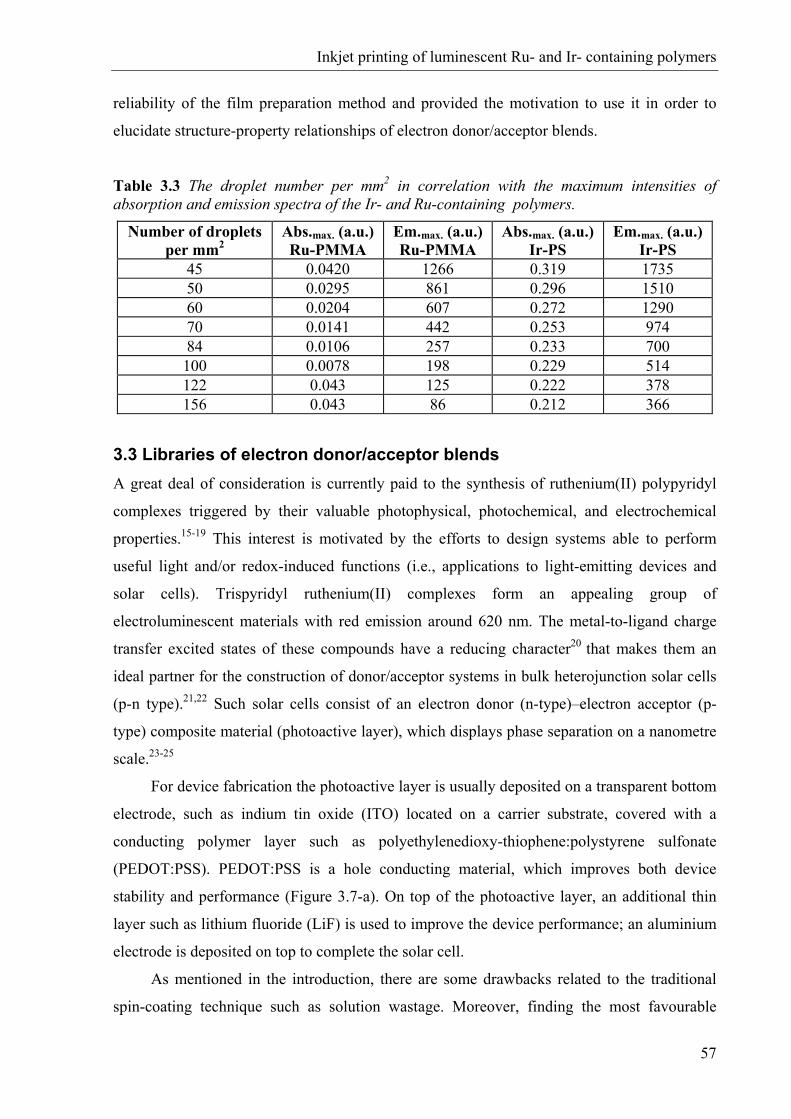
Inkjet printing of luminescent Ru- and Ir- containing polymers
57
reliability of the film preparation method and provided the motivation to use it in order to
elucidate structure-property relationships of electron donor/acceptor blends.
Table 3.3 The droplet number per mm2 in correlation with the maximum intensities of absorption and emission spectra of the Ir- and Ru-containing polymers.
Number of droplets per mm2
Abs.max. (a.u.) Ru-PMMA
Em.max. (a.u.) Ru-PMMA
Abs.max. (a.u.) Ir-PS
Em.max. (a.u.) Ir-PS
45 0.0420 1266 0.319 1735 50 0.0295 861 0.296 1510 60 0.0204 607 0.272 1290 70 0.0141 442 0.253 974 84 0.0106 257 0.233 700 100 0.0078 198 0.229 514 122 0.043 125 0.222 378 156 0.043 86 0.212 366
3.3 Libraries of electron donor/acceptor blends A great deal of consideration is currently paid to the synthesis of ruthenium(II) polypyridyl
complexes triggered by their valuable photophysical, photochemical, and electrochemical
properties.15-19 This interest is motivated by the efforts to design systems able to perform
useful light and/or redox-induced functions (i.e., applications to light-emitting devices and
solar cells). Trispyridyl ruthenium(II) complexes form an appealing group of
electroluminescent materials with red emission around 620 nm. The metal-to-ligand charge
transfer excited states of these compounds have a reducing character20 that makes them an
ideal partner for the construction of donor/acceptor systems in bulk heterojunction solar cells
(p-n type).21,22 Such solar cells consist of an electron donor (n-type)–electron acceptor (p-
type) composite material (photoactive layer), which displays phase separation on a nanometre
scale.23-25
For device fabrication the photoactive layer is usually deposited on a transparent bottom
electrode, such as indium tin oxide (ITO) located on a carrier substrate, covered with a
conducting polymer layer such as polyethylenedioxy-thiophene:polystyrene sulfonate
(PEDOT:PSS). PEDOT:PSS is a hole conducting material, which improves both device
stability and performance (Figure 3.7-a). On top of the photoactive layer, an additional thin
layer such as lithium fluoride (LiF) is used to improve the device performance; an aluminium
electrode is deposited on top to complete the solar cell.
As mentioned in the introduction, there are some drawbacks related to the traditional
spin-coating technique such as solution wastage. Moreover, finding the most favourable

Chapter III
58
donor/acceptor ratios and the determination of their optical properties is highly time
consuming. Consequently, fast screening of electron transfer on inkjet printed donor/acceptor
libraries can be very beneficial for subsequent device testing performance. In addition,
comparison of the layer properties both prepared by spin-coating and inkjet printing is
essential for applications.
In this section, the use of inkjet printing for the deposition of Ru-containing polymer
films with a view to solar cell applications will be presented followed by a discussion of
straightforward screening method that was used to determine the quenching performances of
donor/acceptor systems in films and solutions using high-throughput instrumentation.26-28
e-
e-
e-
e-
++
e-
+
+e- P+
P+
+
e-
+e-
e-
e-
e-
++++
e-
++
++e- P+
P+
++
e-
++
electron
O
O
N N
N
NN
N Ru2 SbF6
-
2 +
n m
O O OO
LIGHT
GLASS
ITO
PEDOT-PSSPHOTOACTIVE LAYER
+
ALUMINIUM
-
LiF
a) b)
c)
e-
e-
e-
e-
++
e-
+
+e- P+
P+
+
e-
+e-
e-
e-
e-
++++
e-
++
++e- P+
P+
++
e-
++
electronelectron
O
O
N N
N
NN
N Ru2 SbF6
-
2 +
n m
O O OO
LIGHT
GLASS
ITO
PEDOT-PSSPHOTOACTIVE LAYER
+
ALUMINIUM
-
LiF
LIGHT
GLASS
ITO
PEDOT-PSSPHOTOACTIVE LAYER
+
ALUMINIUM
--
LiF
a) b)
c)
Figure 3.7 a) General layout of a solar cell device for polymeric materials; b) schematic principle in a bulk heterojunction solar cell; c) Donor/Acceptor pair under investigation (RuPMMA-PC60BM). 3.3.1 Quenching experiments and morphologies of the blends
The bulk heterojunction principle in solar cells is associated with a spontaneous bicontinuous
phase separation process when mixing an electron donor and an electron acceptor. Under

Inkjet printing of luminescent Ru- and Ir- containing polymers
59
absorption of light an electron is transferred from the n-type material (donor) to the p-type
material (acceptor). Photoexcitation does not result in free charges but in a bound hole-
electron pair (exciton). Generally, the dissociation of the exciton takes place at the interface of
the two materials. In solar cells, charge transport occurs through the active layer after the
dissociation event and the charges are collected at the opposite electrodes (Figure 3.7-b).
Photo-induced electron transfer21,29,30 between the electron donor and the electron acceptor in
a photovoltaic is a prerequisite for the conversion of solar energy into electrical energy (Figure
3.7-c). For property pre-screening, fluorescence spectroscopy is an essential method for
investigating this process (the electron transfer leads to emission quenching of the donor).
For a fast screening of p-n type heterojunction systems, a library of blends of p-type
(RuPMMA copolymer) and n-type systems (PC60BM and C7-V) was prepared by ink-jet
printing on a glass (photoresist patterned) substrate. Figure 3.8 shows the library with 20
arrays consisting of various thicknesses and molar ratios. Printing experiments have been
performed using a standard micropipette, which can aspirate solutions of different
concentrations from a microtitre plate and deposit the material on a desired place. For printing
of the 10-6 M RuPMMA copolymer/quencher solutions, a voltage of 90 V and a pulse width
of 35 µs were applied. Thin films of about 120 nm for the RuPMMA/ PC60BM and 170 nm
for the RuPMMA/C7-V were obtained. The topography (Figure 3.9-a) and phase images
(Figure 3.9-b) by AFM of a RuPMMA/PC60BM (1/1) mixture reveal a smooth and uniform
surface with features of about 10 nm diameter. The holes, which can be observed in the spin-
coated films in some cases, were not observed, showing that the polymer film perfectly covers
the substrate surface without any dewetting.
1:0.01:0.5
1:1.01:1.5
1:2
RuPMMA : Quencher
Molar Ratios
T1 T2 T1 T2
PC60BM Viologen Figure 3.8 Schematic representation of a 20 array library of RuPMMA copolymer/quencher blends with different ratios and thicknesses prepared by inkjet printing.

Chapter III
60
a) b)
225 nm 225 nm
Figure 3.9 a) Atomic force microscopy height image of a RuPMMA/PC60BM blend (1/1) inkjet printed from an acetophenone/orthodichlorobenzene solvent mixture onto a photoresist patterned glass substrate and b) corresponding phase image.
The printed array of rectangles allows a fast characterisation of the optical properties in
parallel. Utilising an UV-Vis/fluorescence plate reader, the measurement time was
dramatically reduced: only a few seconds were needed for the acquisition of the spectra. The
quenching tests with PC60BM in films show a clear decrease of the ruthenium(II)-containing
copolymer luminescence at 612 nm (λex = 455 nm) (Figure 3.10). The C7-V proved to be a
relatively poor quencher for the ruthenium(II) complex as compared to the C60 fullerene
derivative (Figure 3.11). Similar results have been observed for the quenching experiments
carried out in solutions. In both cases (for films and solutions) the best quenching
performance was found for a 1/2 molar ratio of RuPMMA/PC60BM.
It should be noted that the quenching in films by PC60BM was not 100% whereas in
solution the emission could be almost totally quenched. This may be due to the phase
separation of donor and acceptor molecules in the films.
After selecting the best quencher, a more detailed investigation into the morphology of
the RuPMMA/PC60BM system was performed by spin-coating on PEDOT-coated glass from
chlorobenzene and o-dichlorobenzene, respectively. Here, spin-coating was used first to
compare the results with literature. It is well-known that the performance of the bulk-
heterojunction solar cell based on a phase-separated mixture of donor/acceptor materials is
strongly dependent on the morphology of the photoactive layer.23,31-34 The solvent used for
film processing plays an important role in this respect. From the solubility tests,
chlorobenzene and o-dichlorobenzene proved to be suitable for both materials (RuPMMA
copolymer and PC60BM) when operating at higher concentrations of the RuPMMA
copolymer for thin-film preparation (CM~10-6 M).

Inkjet printing of luminescent Ru- and Ir- containing polymers
61
500 600 700 8000
250
500
750
1000
Emis
sion
[a.u
.]Wavelength [nm]
RuPMMA:PCBM (1:0.0) RuPMMA:PCBM (1:0.5) RuPMMA:PCBM (1:1.0) RuPMMA:PCBM (1:1.5) RuPMMA:PCBM (1:2.0)
500 600 700 8000
400
800
1200
RuPMMA:PC60BM (1:0.0) RuPMMA:PC60BM (1:0.5) RuPMMA:PC60BM (1:1.0) RuPMMA:PC60BM (1:1.5) RuPMMA:PC60BM (1:2.0)
Emis
sion
[a.u
.]
Wavelength [nm]
b)
a)
Figure 3.10 Luminescence quenching of the RuPMMA copolymer caused by PC60BM: a) in films printed from acetophenone/o-dichlorobenzene and b) in acetophenone/o-dichlorobenzene solutions
Spin-coating of the PEDOT:PSS layer on a glass substrate resulted in a homogeneous
and smooth film of 80 nm thickness (Figure 3.12-a). The RuPMMA/PC60BM blends were
deposited on top. Formation of holes was observed in the case of blends spin-coated from
chlorobenzene (minimum size: 70 nm diameter and 5 nm depth; maximum size: 120 nm
diameter and 6 nm depth) (Figure 3.12-b), while the blends from o-dichlorobenzene showed
homogeneous structure (Figure 3.12-c). This effect is explained by water condensation during
the spin-coating process (chlorobenzene has a lower boiling point than o-
dichlorobenzene).35,36
Device testing experiments of the RuPMMA/PC60BM system yielded very poor
performances. The reason could be that the phase separated domains of donor and acceptor
molecules were coarse. Therefore, ink-jet deposited p-n junction systems in conjunction with
the PEDOT:PSS layer and device applications has not been further studied.

Chapter III
62
500 600 700 8000
250
500
750
1000
Emis
sion
[a.u
.]
Wavelength [nm]
RuPMMA:Viologen(1:0.0) RuPMMA:Viologen(1:0.5) RuPMMA:Viologen(1:1.0) RuPMMA:Viologen(1:1.5) RuPMMA:Viologen(1:2.0)
500 600 700 800 9000
400
800
1200
Emis
sion
[a.u
.]
Wavelength [nm]
RuPMMA:Viologen (1:0.0) RuPMMA:Viologen (1:0.5) RuPMMA:Viologen (1:1.0) RuPMMA:Viologen (1:1.5) RuPMMA:Viologen (1:2.0)
b)
a)
Figure 3.11 Luminescence quenching of the RuPMMA copolymer caused by: C7-V a) in films printed from iso-propanol/acetophenone/o-dichlorobenzene and b) in iso-propanol/acetophenone/o-dichlorobenzene solutions.
a)
250 nm
b)
250 nm
c)
250 nm
Figure 3.12 Atomic force microscopy height images: a) PEDOT:PSS spin-coated onto a glass substrate; b) RuPMMA/PC60BM blends (1/1) spin-coated from chlorobenzene onto a Glass/PEDOT:PSS substrate and c) RuPMMA/PC60BM blends (1/1) spin-coated from o-dichlorobenzene onto a Glass/PEDOT:PSS substrate.

Inkjet printing of luminescent Ru- and Ir- containing polymers
63
3.5 Conclusions The high-throughput preparation of thin film libraries of Ru(II)polypyridyl-PMMA and
Ir(III)polypyridyl-PS copolymers with various thicknesses onto glass was successfully
performed using inkjet printing. This is not possible with conventional methods such as spin-
coating. Photoresist patterned glass substrates were employed to confine the deposited
material. Using this method, ring formation decreased and uncontrolled spreading of the ink
was prevented. Films as thin as 120 nm with a roughness of 1% were successfully printed. By
changing the number of droplets per unit area, the thickness of the films could be varied in a
controlled way. Furthermore, the optical properties of the luminescent films were rapidly
screened utilising a UV-Vis/fluorescence plate reader. Emission and absorption spectra of the
copolymers were regularly decreasing with film thickness. Emission and absorption were
found to be a linear function of the number of drops per mm2 as expected.
Subsequently, ink-jet printing of different electron donor/acceptor compositions for
potential applications in bulk heterojunction solar cells has been described. The electron
transfer from RuPMMA copolymer to PC60BM and C7-V derivatives was screened in a fast
manner utilising a UV-Vis/fluorescence plate reader. Best quenching performance has been
observed for the PC60BM case. Preliminary studies by AFM on the RuPMMA/ PC60BM
blends spin-coated from o-dichlorobenzene on PEDOT:PSS covered glass revealed formation
of homogeneous structures.
In conclusion, it was proven that homogenous and controlled thin film libraries could be
obtained by inkjet printing for combinatorial polymer research. This opens the way to parallel
investigations of the photo-physical properties of different dyes for device applications.
Therefore, the focus of the following chapters will be on optimising printing parameters for
quantum dot-polymer composites and conjugated polymers, and the subsequent
characterisation of their thin films.
3.6 Experimental section
Materials The synthetic procedures to obtain Ru(II)polypyridyl-poly(methyl methacrylate) (PMMA) (Mn = 15,000 g/mol) and Ir(III)polypridyl-polystyrene (PS) (Mn = 3,000 g/mol) are described elsewhere19,37-39 and their structures are shown in Figure 3.1. Methano[60]fullerene [6,6]-phenyl C61 butyric acid methyl ester was prepared as previously described.40 1,1’-Diheptyl-4,4’-bipyridinium dibromide (heptyl-viologen, C7-V) was received from Aldrich (Zwijndrecht, the Netherlands). The PEDOT:PSS (dispersion in water) was purchased from H.C. Stark GmbH. All solvents (chloroform, acetonitrile, acetophenone, iso-propanol, chlorobenzene and o-dichlorobenzene) were commercial products (Biosolve, Aldrich and

Chapter III
64
Fluka) and used as received. The negative tone photoresist SU-8 2005 and SU-8 developer were purchased from Micro Chem. This epoxy based photoresist is resulting in a highly crosslinked layer that is insoluble in organic solvents. Microscopic slides (3 × 1 inch) from Marienfeld (Lauda-Königshofen, Germany) were used as glass substrates.
Preparation of photoresist patterns on glass Because most organic solvents are spreading on glass, printing of polymer solutions sometimes results in irregular films. To obtain well defined arrays of films, glass substrates were patterned using a photoresist to confine the deposited solution. Before patterning, the glass substrates were ultrasonicated for 5 minutes in acetone. Subsequently, they were rubbed and ultrasonicated for 10 minutes with sodium dodecyl sulfate solution and washed with demineralised water to remove the soap. Afterwards, they were ultrasonicated in isopropanol to remove the water and then dried under airflow. To remove any organic contamination, the substrates were finally treated in a UV-ozone photo reactor (UVP PR-100, Upland, CA) for 20 minutes. Photoresist SU-8 2005 was spin-coated onto the glass substrate at 1000 rpm for 2 minutes to obtain a layer of about 8 µm thickness. The substrate was then baked on a heating plate at 90 °C for 7 minutes. A transparent plastic mask containing rectangular dark areas (5 × 5 mm) was placed on top of the substrate, which was then exposed to UV light (300-400 nm) for 1-2 minutes. Afterwards, the sample was post baked at 95 °C for 5 minutes and subsequently immersed in the developer. After rinsing with isopropanol and drying under airflow, the substrate was hard-baked at 150-200 °C for 10 minutes to maximise the cross-link density.41 The structure of this photoresist pattern and the printing onto this substrate are shown in Figure 3.2. The films were printed onto the 96-well microtitre plate positions (each 5 × 5 mm size.). The procedure is shown in Figure 3.13.
Figure 3.13 The schematic illustration of producing the photoresist frame: a) spin-coating photoresist, b) UV light exposing, c) baking and d) developing.
Instrumentation Inkjet printing was carried out using an Autodrop printer (Microdrop, Norderstedt, Germany). The diameter of the nozzle is 70 µm. It was already shown that the device is capable to print dilute solutions (1-2% by weight) of high molecular weight polymers (Mw ~100 kD).42 The micropipette can aspirate small quantities of fluid from a 96-well microtitre plate, and can dispense them at any desired place (e.g. on glass plates, silicon wafers, poly-carbonate, a second microtitre plate). For detailed information please see Chapter 1.
UV-Vis and fluorescence spectra of the inkjet printed films were measured on a Flashscan 530 spectrophotometer from AnalytikJena (Jena, Germany). All spectra were referenced to an empty plate and measurements were performed with four flashes. The actual

Inkjet printing of luminescent Ru- and Ir- containing polymers
65
time for the measurement of one microtitre plate with 96 full UV/vis spectra was approximately 40 seconds.
An optical-profilometer, the Fogale Zoomsurf, was used to determine the surface topography and to measure the thickness of the polymer films. Its vertical resolution is 1 nm when the red light source is employed and 7 nm for white light; the horizontal resolution is 150 nm. However, to scan large areas a low resolution magnifying objective (5 times) was used.
AFM imaging was performed on a Solver P47-H scanning probe microscope (NT-MDT, Moscow, Russia). The measurement was obtained in semi-contact mode with silicon tips (NSG11, NT-MDT).
The spin-coating was carried out using a spin-coater from Headway Research Inc. The PEDOT:PSS films were prepared by spin-coating onto glass substrates at 1500 rpm (2 × 90 seconds).
Chapter III
66
3.7 References
1 H. Rudmann, S. Shimada, M.F. Rubner, J. Am. Chem. Soc. 2002, 124, 4918.
2 J. Slinker, D. Bernards, P.L. Houston, H.D. Abruna, S. Bernhard, G.G. Malliaras,
Chem. Commun. 2003, 2392.
3 K.W. Lee, J.D. Slinker, A.A. Gorodetsky, S. Flores-Torres, H.D. Abruna, P.L. Houston,
G.G. Malliaras, Phys. Chem. Chem. Phys. 2003, 5, 2706.
4 Y.-Y. Noh, C.-L. Lee, J.-J. Kim, J. Chem. Phys. 2003, 118, 2853.
5 J.K. Lee, D. Yoo, M.F. Rubner, Chem. Mater. 1997, 9, 1710.
6 E.I. Haskal, M. Büchel, P.C. Duineveld, A. Sempel, P. van de Weijer, MRS Bulletin
2002, 27, 864.
7 C.F. Madigan, T.R. Hebner, J.C. Sturm, Mat. Res. Soc. Symp. Proc. 2000, 625, 123.
8 T.R. Hebner, C.C. Wu, D. Marcy, M. H. Lu, J.C. Sturm, Appl. Phys. Lett. 1998, 72,
519.
9 J. Bharathan, Y. Yang, Appl. Phys. Lett. 1998, 72, 2660.
10 B.S-C. Chang, J. Liu, J. Bharathan, Y. Yang, J Onohara, J. Kido, Adv. Mater. 1999, 11,
734.
11 T. Shimoda, K. Morii, S. Seki, H. Kiguchi, MRS Bulletin 2003, 28, 821.
12 R.D. Deegan, O. Bakajin, T.F. Dupont, G. Huber, S.R. Nagel, T.A. Witten, Nature
1997, 389, 827.
13 E. Tekin, B.-J. de Gans, U.S. Schubert, J. Mater. Chem. 2004, 14, 2627.
14 B.-J. de Gans, U.S. Schubert, Langmuir 2004, 20, 7789.
15 O. Mamula, A. von Zelewsky, Coord. Chem. Rev. 2003, 242, 87.
16 C. Kaes, A. Katz, M.W. Hosseini, Chem. Rev. 2000, 100, 3553.
17 A.P. Smith, C.L. Fraser, Comprehens. Coord. Chem. II 2004, 1, 1-23.
18 U.S. Schubert, C. Eschbaumer, Angew. Chem. Int. Ed. 2002, 41, 2892.
19 G.R. Newkome, A.K. Patri, E. Holder, U.S. Schubert, Eur. J. Org. Chem. 2004, 235.
20 N. Armaroli, G. Accorsi, D. Felder, J.-F. Nierengarten, Chem. Eur. J. 2002, 8, 2314.
21 D.M. Guldi, M. Maggini, N. Martin, M. Prato, Carbon 2000, 38, 1615.
22 N.S. Sariciftci, F. Wudl, A.J. Heeger, M. Maggini, G. Scorrano, M. Prato, J. Bourassa,
P.C. Ford, Chem. Phys. Lett. 1995, 247, 510.
23 J.K.J. van Duren, X. Yang, J. Loos, C.W.T. Bulle-Lieuwma, A.B. Sieval, J.C.
Hummelen, R.A.J. Janssen, Adv. Funct. Mater. 2004, 14, 425.
Inkjet printing of luminescent Ru- and Ir- containing polymers
67
24 M.M. Wienk, J.M. Kroon, W.J.H. Verhees, Joop, J.C. Hummelen, P.A. van Haal, R.A.
J. Janssen, Angew. Chem. Int. Ed. 2003, 42, 3371.
25 S.C. Veenstra, W.J.H. Verhees, J.M. Kroon, M.M. Koetse, J. Sweelssen, J.J.A.M.
Bastiaansen, H.F.M. Schoo, X. Yang, A. Alexeev, J. Loos, U.S. Schubert, M.M. Wienk,
Chem. Mater. 2004, 16, 2503.
26 S. Schmatloch, H. Bach, R.A.T.M. van Benthem, U.S. Schubert, Macromol. Rapid
Commun. 2004, 25, 95.
27 R. Hoogenboom, M.A.R. Meier, U.S. Schubert, Macromol. Rapid Commun. 2003, 24,
15.
28 S. Schmatloch, M.A.R. Meier, U.S. Schubert, Macromol. Rapid Commun. 2003, 24, 33.
29 D.M. Guldi, M. Maggini, E. Menna, G. Scorrano, P. Ceroni, M. Marcaccio, F. Paolucci,
S. Roffia, Chem. Eur. J. 2001, 7, 1597.
30 E.H. Yanemoto, G.B. Saupe, R.H. Schmehl, S.M. Hubig, R.L. Riley, B.L. Iverson, T.E.
Mallouk, J. Am. Chem. Soc. 1994, 116, 4786.
31 X.Yang, J.K.J. van Duren, J. Loos, M.A.J. Michels, R.A.J. Janssen, Macromolecules
2004, 37, 2151.
32 C.J. Brabec, T. Nann, S. E. Shaheen, MRS Bulletin 2004, 29, 43.
33 U. Stalmach, B. De Boer, C. Videlot, P.F. van Hutten, G. Hadziioannou, J. Am. Chem.
Soc. 2000, 122, 5464.
34 M.H. van der Veen, B. De Boer, U. Stalmach, K. I. van de Wetering, G.Hadziioannou,
Macromolecules 2004, 37, 3673.
35 M. Srinivasarao, D. Collings, A. Philips, S. Patel, Science 2001, 292, 79.
36 C. Barner-Kowollik, H. Dalton, T.P. Davis, M.H. Stenzel, Angew. Chem. Int. Ed. 2003,
42, 3664.
37 E. Holder, M.A.R. Meier, V. Marin, U.S. Schubert, J. Polym. Sci. Part A: Polym. Chem.
2003, 41, 3954.
38 E. Holder, V. Marin, M.A.R. Meier, U.S. Schubert, Macromol. Rapid Commun. 2004,
25, 1491.
39 B.G.G. Lohmeijer, U.S. Schubert, Angew. Chem. Int. Ed. 2002, 41, 3825.
40 J.C. Hummelen, B.W. Knight, F. Le Peq, F. Wudl, J. Yao, C.L. Wilkins, J. Org. Chem.
1995, 60, 532.
41 http://www.microchem.com.

Chapter III
68
42 B.-J. de Gans, E. Kazancioglu, W. Meyer, U.S. Schubert, Macromol. Rapid Commun.
2004, 25, 292.

Chapter IV
Inkjet printing of luminescent CdTe nanocrystal (NC)-polymer composites
Abstract Inkjet printing has been used to produce well-defined patterns of dots (with diameters of ~120
µm), which are composed of luminescent CdTe nanocrystals (NCs) embedded within a
poly(vinyl alcohol) (PVA) matrix. Addition of ethylene glycol (1-2% v/v) to the aqueous
solution of CdTe NCs suppressed the well-known ring formation effect leading to
exceptionally uniform dots. AFM characterisation revealed that in the CdTe NCs films, the
particle-particle interaction could be prevented using inert PVA as a matrix. Combinatorial
libraries of CdTe NC/PVA composites with variable NC sizes and polymer/NC ratios were
prepared by inkjet printing. These libraries were subsequently characterised using a
UV-Vis/fluorescence plate reader to determine their luminescent properties. Energy transfer
from green-emitting to red-emitting CdTe NCs in the composite containing green (2.6 nm
diameter) and red emitting (3.5 nm diameter) NCs was also demonstrated.
E. Tekin, P.J. Smith, S. Hoeppener, A.M.J. van den Berg, A.S. Susha, A.L. Rogach, J. Feldmann, U.S. Schubert, Adv. Funct. Mater. 2007, 17, 23 (front cover).

Chapter IV
70
4.1 Introduction
Some of the most promising features of nanocrystals (NCs) are their high photochemical
stability and their size-dependent optical properties, which are due to the quantum
confinement effect. This means that the colour of the photoluminescence (PL) of NCs can be
tuned by varying their mean size.1-3 The versatility of physical and chemical properties
afforded by NCs makes them promising as the ultimate miniature devices, with potential
applications in fields of optoelectronics, 4-7 and sensors8 and medicine.9
In many instances, the ability to exploit nanoparticle properties for device fabrication
requires the formation of morphologically controlled arrays of nanoparticles.10-14 In other
words, the preservation of the relatively high PL efficiency in NC-containing films, a uniform
distribution of NCs within the films, which together with their uniform optical quality are
very important. Blending NCs with polymers can be solutions to satisfy these requirements.
A suitable polymer that does not quench the luminescence intensity of NCs must be chosen as
a matrix material, which also has to provide a homogeneous NC distribution.
This chapter focuses on obtaining well defined structures of NC-polymer composites
using inkjet printing. One of the problems that needs to be addressed for inkjet printing of
functional materials, as introduced in previous chapters, is that the as-printed patterns often
display a morphological phenomenon commonly called ‘coffee staining’.15-18 Obviously, if the
features obtained for a printed solution containing NCs are not uniform, then the resultant
performance will be unsatisfactory with respect to potential applications. Suppressing this
natural propensity of inkjet printed material to form annular structures is a significant
challenge. In addition, optimisation of the interparticle distance or the sizes of aggregates in
the NCs-polymer composite, which can be determined by the concentration of the polymer,
are essential issues.
In this chapter, the inkjet printing of well defined dots (with diameters of about 100 µm)
of water-soluble luminescent CdTe NCs (stabilised with thioglycolic acid (TGA) or 3-
mercaptopropionic acid (MPA) as shown in Figure 4.1) embedded in a PVA matrix and
subsequent studies of their morphology and PL are described. The homogeneity of the
thickness distribution along a dot was sufficiently improved by the addition of 2% v/v of
ethylene glycol. After optimising the morphology of the printed nanocomposites,
combinatorial libraries of CdTe NC/PVA films were prepared in which the concentration of
PVA and the size of CdTe NCs were varied. The emission properties of these libraries were
characterised in a parallel fashion using a UV-Vis/fluorescence plate reader. The results

Inkjet printing of CdTe NC-polymer composites
71
showed that the emission intensity of CdTe NCs in the composite films with polymers can be
improved by optimising the NP/polymer ratio. Finally, the energy transfer from small CdTe
NCs to larger CdTe NCs within the PVA matrix has been demonstrated.
-S-
-(CH2)n-n = 1-3
-COOH
Figure 4.1 The chemical structure of the CdTe stabilised with thiol stabiliser. n = 1 for TGA, n = 2 for MPA. 4.2 Printing well-defined dots of CdTe NC–polymer composites 4.2.1 Ink formulation Uniform, stable droplets of aqueous CdTe NCs solution were formed at 60-65 V and pulse
widths of 30-35 µs. Upon addition of polymers, the solutions became more viscous, and the
values of voltage need to be increased because the sound waves which propagate throughout
the print head are dampened in more viscous solutions. This required further optimisation of
the printing conditions for each NCs/polymer solution. Thus, solutions containing 1% wt
(with a viscosity of 1.7 m Pa.s) PVA were optimally ejected applying 85-90 V and 40 µs.
After the optimal voltages and pulse widths were determined, CdTe NCs solutions containing
1% wt PVA were printed both onto ITO-coated glass slides (ITO) and ozone-treated glass
slides. These printed dots were analysed using an optical profilometer in order to obtain
information on their topographies. The dots of CdTe NCs/PVA composites exhibited ‘ring
formation’,16 that is they had non-uniform structures whose edges were much higher than
their centre (Figure 4.2-a). As discussed in previous chapters, this ring structure results as a
consequence of a higher evaporation rate at the droplet’s edge and a pinned contact line.19 As
demonstrated previously, the addition of a higher-boiling point solvent to the ink improves the
deposit’s homogeneity since evaporation at the contact line is reduced.17,18 With this in mind,

Chapter IV
72
ethylene glycol (boiling point 196-198 ˚C, water miscible) was tested as an additive to the
aqueous CdTe NCs/polymer solutions and investigated regarding its influence on the patterns
of the nanocomposites after drying was complete.
Figure 4.2 Optical profilometer images and cross-sections of the composite films printed from CdTe NC solutions containing 1% wt PVA in a) water, b) water-ethylene glycol mixture (98/2 v/v), c) water-ethylene glycol mixture (95/5 v/v) and d) water-ethylene glycol mixture (90/10 v/v).
It can be suggested that as the increase in mass at the edge of a printed feature is time-
dependent,16 printing onto a heated substrate can reduce the severity of ‘coffee staining’ since

Inkjet printing of CdTe NC-polymer composites
73
the evaporation rate at all points on the deposited feature is increased. It was also confirmed
that printing metal nanoparticles could prevent the ring formation effect just by heating the
substrate.20
Solutions of CdTe NCs containing 1% wt PVA, in which the amount of ethylene glycol
varied from 0 to 20% v/v, were printed both onto ITO and glass. These substrates were placed
onto a heated platform that was kept at 70 ˚C. The dried patterns of the printed dots were
characterised by an optical profilometer and found to be similar for both glass and ITO.
Figure 4.2 shows the height profiles of the printed composites from different solvent
compositions on glass.
It is interesting that the dot printed using 100% water exhibited a high side wall and a
diameter of approximately 200 µm which is shown in Figure 4.2-a. Printing at room
temperature reveals ring formation as well. The ring formation can be also seen from the 3D
images of the printed dots and lines using water in Figure 4.3. It indicates that drying
formation of polymer solutions behaves differently from metal particle solutions on a heated
substrate. The reason might be the increase of the mobility of the polymer chains by heating
thus the material transfer to the edges increases. Therefore the rise in evaporation rate does
not influence the resulting structure. It should be noted that the effect of the temperature for a
different polymer was also investigated and that all experiments gave the same result: heating
the substrate does not minimise ring formation (see Chapter 5).
An addition of 2% v/v of ethylene glycol (Figure 4.2-b) resulted in a uniform and
homogeneous dot with a diameter reduced to 130 µm. However, further additions of ethylene
glycol, 5% v/v (Figure 4.2-c) and 10% v/v (Figure 4.2-d), caused the dot diameter to increase
and had a detrimental influence on uniformity. Table 4.1 summarises the contact angles
formed by the solutions with varying ethylene glycol contents and the diameters of the dots
printed from these solutions. The increase in diameter corresponded to a decrease in the
contact angle, which was measured for these solutions at room temperature.21,22 As can be
seen from the Table, with an increase of the ethylene glycol concentration the contact angle
decreased and the diameter increased. The reason why the contact angle decreases with a
small addition of ethylene glycol and rises with further addition is not clear. To elucidate this
behaviour, dynamic contact angle measurements on the inkjet printed droplets would be
beneficial. However, the available equipment could only measure static contact angle
measurements using macroscopic droplets since measuring inkjet printed droplets is tricky
due to their fast evaporation. Furthermore, it should be noted that the contact angle of
macroscopic droplets can differ from the microscopic ones as the surface/volume ratios are

Chapter IV
74
different. Consequently 98/2 ratio solution has the highest contact angle therefore its droplet
will have the smallest diameter.
The diameter of the ring formed dots is larger than that of the homogenous dots and it
is known that for the ring formation effect a pining of the contact line is a basic condition.
Nevertheless, it is obvious that the addition of ethylene glycol has a significant influence on
the pattern formations of drying dots.
2.52 mm
0.10 0.15 0.20 0.25 0.30 0.35 0.400.0
0.5
1.0
1.5
2.0
2.5
3.0
(mm)
heig
ht (µ
m)
2.39 µm
1.89 mm
1.89 mm2.52 mm
6 µm
2.52 mm2.52 mm
0.10 0.15 0.20 0.25 0.30 0.35 0.400.0
0.5
1.0
1.5
2.0
2.5
3.0
(mm)
heig
ht (µ
m)
2.39 µm
1.89 mm
1.89 mm2.52 mm
6 µm
2.52 mm
Figure 4.3 The three dimensional pictures of printed dots and lines which exhibits ring formation effect printed from CdTe NC solutions containing 1% wt PVA in water solution and their cross-section.
The actual deposited droplet took longer to dry at all points by increasing amounts of
ethylene glycol. Therefore, ring formation also occurred at higher glycol concentrations. As a
consequence of these optimisation studies, 2% v/v ethylene glycol in a solution of NCs and
PVA was selected as the most suitable for inkjet printing of well defined composite dots.
Table 4.1 Measured contact angles at room temperature and the diameters of the dots of CdTe NCs/PVA composites printed from solutions with varied ratio of water and ethylene glycol ratio on glass and ITO.
Ratio of water/ethylene
glycol (v/v)
Measured contact angle on glass (˚)
Dot diameter (on glass, µm)
Dot diameter (on ITO, µm)
100/0 22.2 200 190 98/2 44.5 130 120 95/5 30.3 140 130 90/10 24.6 160 150 85/15 20.8 180 170 80/20 19.7 200 190
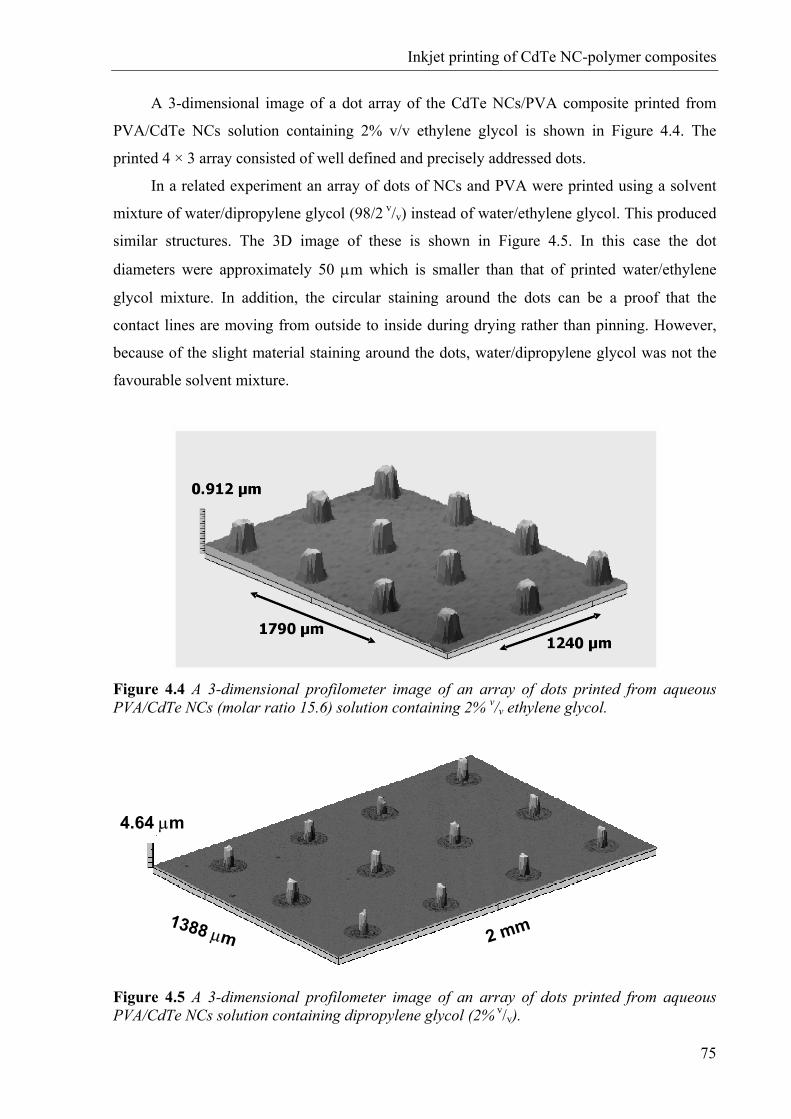
Inkjet printing of CdTe NC-polymer composites
75
A 3-dimensional image of a dot array of the CdTe NCs/PVA composite printed from
PVA/CdTe NCs solution containing 2% v/v ethylene glycol is shown in Figure 4.4. The
printed 4 × 3 array consisted of well defined and precisely addressed dots.
In a related experiment an array of dots of NCs and PVA were printed using a solvent
mixture of water/dipropylene glycol (98/2 v/v) instead of water/ethylene glycol. This produced
similar structures. The 3D image of these is shown in Figure 4.5. In this case the dot
diameters were approximately 50 µm which is smaller than that of printed water/ethylene
glycol mixture. In addition, the circular staining around the dots can be a proof that the
contact lines are moving from outside to inside during drying rather than pinning. However,
because of the slight material staining around the dots, water/dipropylene glycol was not the
favourable solvent mixture.
Figure 4.4 A 3-dimensional profilometer image of an array of dots printed from aqueous PVA/CdTe NCs (molar ratio 15.6) solution containing 2% v/v ethylene glycol.
4.64 µm
1388 µm 2 mm
4.64 µm
1388 µm 2 mm
Figure 4.5 A 3-dimensional profilometer image of an array of dots printed from aqueous PVA/CdTe NCs solution containing dipropylene glycol (2% v/v).

Chapter IV
76
4.2.2 Morphology of the printed films The micro-morphology of the films of the NC’s was investigated to observe the effect of PVA
on the aggregation of particles. For this purpose, an AFM was used, which required that the
surface topography of films printed on glass were prepared both from pure aqueous solution
of CdTe NCs and from aqueous solutions of a PVA/CdTe NCs (molar ratio is 15.63) blend. In
the absence of polymer (Figure 4.6-a) the surface of the film was inhomogeneous revealing
the presence of large aggregates (up to 100 nm in size). For the PVA-containing sample
(Figure 4.6-b), the surface appeared to be much smoother, with some needle-like aggregates
homogenously distributed over the surface, alongside with very tiny features which are
attributed to the single polymer-embedded NCs. It suggests that the morphology of the
particles can be better controlled upon the addition of PVA. Consequently, the PVA matrix
provides encouraging conditions for the inkjet printing of homogeneous NC-containing
layers. The optimum polymer/particle ratio could be determined by performing
photoluminescence measurements.
Figure 4.6 AFM height (top) and phase images (bottom) of the inkjet printed films of a) CdTe NPCs and b) PVA/CdTe NCs (molar ratio 15.6) composites.

Inkjet printing of CdTe NC-polymer composites
77
4.3 Optical investigations on the printed CdTe nanocrystal–polymer composites 4.3.1 Influence of polymer content on both morphology and photoluminescence behaviour of CdTe particles To investigate the effect of the polymer matrix on the luminescence properties of the
embedded CdTe NCs, libraries of composite films containing PVA, or
poly(diallyldimethylamoinonium chloride) (PDDA), in different weight concentrations and
CdTe NCs of different sizes and with different thiol stabiliser (TGA or MPA), were printed
and characterised by fluorescence spectroscopy. The libraries were made up of 5 × 5 mm
squares printed on to heated glass substrates (70 °C). Ethylene glycol was not added because
it increases the contact angle. The printed pixels had to fully wet the substrate in order to
obtain large areas suitable for use within the UV-Vis/fluorescence plate reader. The dot
spacing was 70 µm for these experiments. The resulting films were optically homogenous and
fluorescence spectra were obtained with a standard deviation of about 5%.
When PDDA was used as a matrix, significant quenching of emission of the CdTe NCs
was observed, which is attributed to the influence of the charges of this positively-charged
polyelectrolyte. In the case of the inert polymer (PVA), the emission of the embedded CdTe
NCs remained strong in printed films, independently on the NC stabiliser. The effects of the
polymers on the PL intensity can be clearly seen from Figure 4.7.
The library, which is shown in Figure 4.8, was created to study the influence of the
polymer-to NC ratio and NC size on photoluminescence. The rows of this library varied in
terms of NC size and are described in Table 4.2. In each column, the weight percentage of
PVA in solution used for printing varied in increments of 0.2% wt, going from zero up to
1.4% wt (corresponding molar ratios of PVA/CdTe NCs in the films in each row are from 0 to
21.9 with an increment step of 3.12).
The emission spectra of each pixel, excited at the same wavelength of 400 nm, are
shown in Figure 4.9. As expected size-dependent variation of the emission of the CdTe NCs
was observed; the spectra shift to the red region with increasing particle size. Table 4.2 shows
the emission wavelengths (maximum) of the printed pixels versus particle size. The emission
intensity of each row systematically increased with increasing polymer amount until a
maximum was reached. Maximum increase in emission intensities caused by addition of
polymer in comparison to the films of NCs without polymer, and the corresponding molar

Chapter IV
78
ratio of PVA/CdTe NCs responsible for the maximum achieved emission intensity are
summarised in Table 4.2.
Polymer amount:(%) 0 0.2 0.4 0.6 0.8
500 550 600 650 700 750 8000
100
200
300
400
500
PL
Inte
ncity
λ, nm
0.8% PVA 0.6% PVA 0.4% PVA 0.2% PVA 0.0% PVA
0 0.2 0.4 0.6 0.8
a) b)
500 550 600 650 700 750 8000
500
1000
1500
2000
2500
λ, nm
0.0% PDDA 0.2% PDDA 0.4% PDDA 0.6% PDDA 0.8% PDDA
PL
inte
ncity
Figure 4.7 Photos of the inkjet-printed arrays of CdTe NCs including systematic variation of a) PDDA and b) PVA content in the solution used for printing: from 0 to 1.4% wt with an increment step of 0.2% wt.
Figure 4.8 Photograph of an inkjet-printed combinatorial library of differently sized CdTe NCs emitting at different wavelengths (Table 4.2), including a systematic variation of the PVA content in the solution used for printing: from 0 to 1.4% wt with an increment step of 0.2% wt. Corresponding molar ratios of PVA /CdTe NCs in the films in each row are from 0 to 21.9 with an increment step of 3.12.
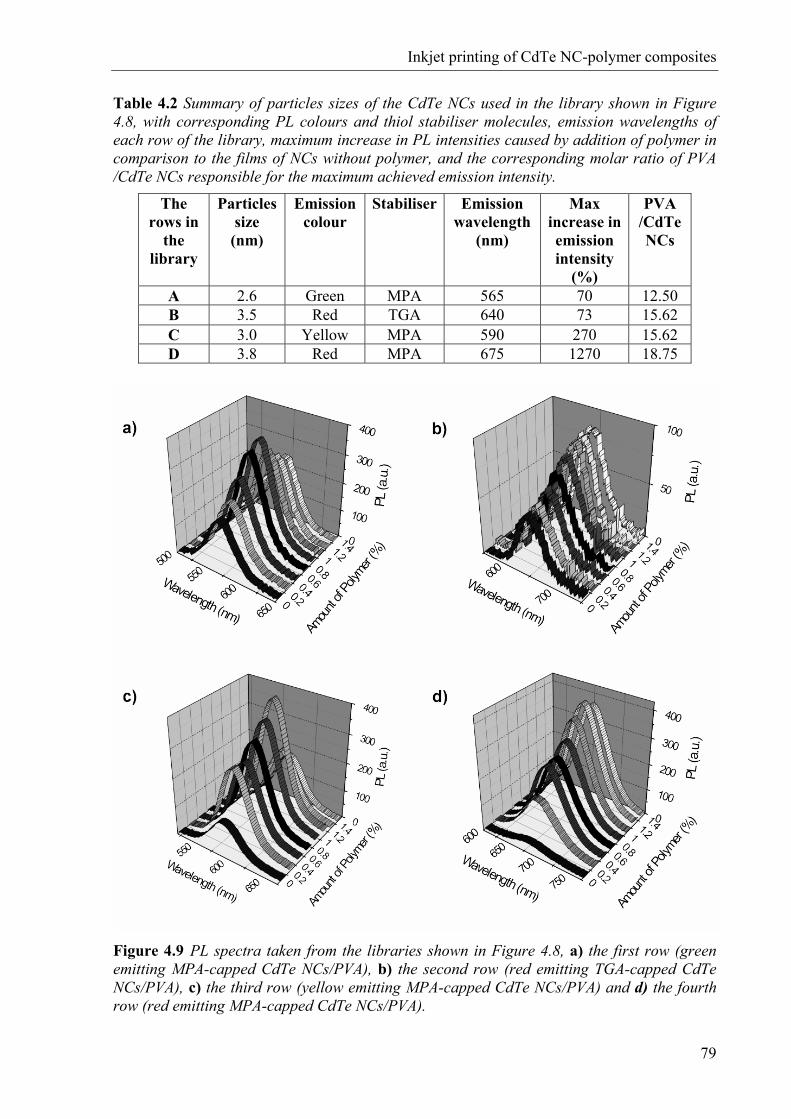
Inkjet printing of CdTe NC-polymer composites
79
Table 4.2 Summary of particles sizes of the CdTe NCs used in the library shown in Figure 4.8, with corresponding PL colours and thiol stabiliser molecules, emission wavelengths of each row of the library, maximum increase in PL intensities caused by addition of polymer in comparison to the films of NCs without polymer, and the corresponding molar ratio of PVA /CdTe NCs responsible for the maximum achieved emission intensity.
The rows in
the library
Particles size
(nm)
Emission colour
Stabiliser Emission wavelength
(nm)
Max increase in emission intensity
(%)
PVA /CdTe NCs
A 2.6 Green MPA 565 70 12.50 B 3.5 Red TGA 640 73 15.62 C 3.0 Yellow MPA 590 270 15.62 D 3.8 Red MPA 675 1270 18.75
Figure 4.9 PL spectra taken from the libraries shown in Figure 4.8, a) the first row (green emitting MPA-capped CdTe NCs/PVA), b) the second row (red emitting TGA-capped CdTe NCs/PVA), c) the third row (yellow emitting MPA-capped CdTe NCs/PVA) and d) the fourth row (red emitting MPA-capped CdTe NCs/PVA).

Chapter IV
80
According to Table 4.2, the emission of 3.8 nm sized CdTe NCs stabilised by MPA has
been improved by 1270% by the addition of PVA (molar ratio of PVA/CdTe NCs: 18.75).
Emissions of green emitting CdTe NCs stabilised by MPA and red emitting CdTe NCs
stabilised by TGA have enlarged approximately by 70%. These results may suggest that there
is no clear effect of stabiliser on emission intensities.
The increase in the PL intensity in the films where the NCs are surrounded by PVA can
be explained as a consequence of an increase of the interparticle distance, which prevents the
particle-particle interaction that causes self-quenching of the PL. This favourable effect
saturates at a certain polymer concentration. At increasing polymer-to-NC ratios the absolute
number of NCs in a film of given thickness drops, leading to a decrease of the overall PL
intensity. For all the rows in the library PL versus polymer-amount passes through a
maximum, which shows that an optimum value was determined for each size except Figure
4.9-b.
Finally a logo printed from CdTe NC-PVA composites of different sizes of NCs with
optimal molar ratios were printed on a ITO substrate which can be seen in Figure 4.10.
Figure 4.10 Logo of CeNS obtained printing well defined dots composed of brightly emitting CdTe nanocrystals in polyvinyl alcohol (PVA) matrix. 4.3.2 Large particle-small particle interactions To further study the effects of particle-particle interactions in composite films, another
library which contained variable amounts of the small (2.6 nm), green-emitting CdTe NCs
together with the large (3.5 nm), red-emitting CdTe NCs were printed. The films were
deposited from water solutions of the mixtures of NCs containing 0.5% wt PVA. Figure 4.11
shows a photograph of this library, together with the emission spectra obtained from the
samples with different small-to-large NC ratios. The reduction of the PL intensity of the small

Inkjet printing of CdTe NC-polymer composites
81
(green emitting) particles gradually took place, while emission of the larger particles (red
emitting) increased, demonstrating Förster resonant energy transfer (FRET) from the smaller
donor NCs to the larger acceptor particles.23 When the ratio of green emitters to red emitters
was 85:15, the green emission peak disappeared completely, while the intensity of the red
emission fed by the smaller particles continued to rise. Thus, efficient energy transfer between
differently sized NCs in the printed composites results in more red emission from the films
with a lower amount of red-emitting NCs, if they are fed by green-emitting counterparts.
Figure 4.11 (top) Photograph of an inkjet printed library of the mixture of green and red emitting CdTe NCs. (bottom) The PL spectra of this library. 4.4 Conclusions High-quality homogeneous dots and arrays of dots composed of luminescent water-soluble
CdTe NCs embedded in a PVA matrix can be fabricated by inkjet printing. The addition of
ethylene glycol to the aqueous solution of CdTe NCs/PVA had a significant influence on the
topography of the printed features; with 2% v/v being the most effective in suppressing the ring
formation effect. AFM characterisation revealed that smoother films were formed when using
PVA as a matrix compared to the NC-only layers. The emission of CdTe NCs remained

Chapter IV
82
strong enough when they were embedded in PVA, while it was quenched by PDDA due to the
influence of positive charges. The optimal PVA/CdTe NCs ratios in terms of the maximum
available PL intensity was determined for different sizes of CdTe NCs by creation of
combinatorial libraries measured in parallel by a UV-Vis/fluorescence plate reader. FRET
was demonstrated in blends of the green and red emitting CdTe NCs within the same
composite.
4.5 Experimental section Instrumentation For the inkjet printing experiments an Autodrop system (Microdrop Technology, Norderstedt, Germany) was used. The diameter of the micropipette nozzle used was 70 µm. For details see Chapter 1.
The topographies of the printed patterns were measured using an optical profilometer, (Fogale Zoomsurf, France), which allows a vertical resolution of 7 nm and a horizontal resolution of 150 nm. A UV-Vis/fluorescence plate reader (Flashscan 530, AnalytikJena, Jena, Germany) was utilised to measure the respective fluorescence spectra of the NCs and their blends with the polymers. All of the films that were prepared for the combinatorial libraries could be conveniently excited at the same wavelength, namely 400 nm, regardless of the size of NCs that they contained. Atomic force microscopy (Solver LS, NT-MDT, Russia) was used to investigate film morphologies utilising Si cantilevers (NSG 11, NT-MDT, Russia). Materials The CdTe NCs used in this study were synthesised in water employing either thioglycolic acid (TGA) or 3-mercaptopropionic acid (MPA) as a stabiliser.24 NCs of four different particle sizes (2.6, 3.5, 3.0 and 3.8) were used. The particle sizes were estimated from their extinction spectra following the procedure from ref.25. The concentration of CdTe NCs was ~1019 particles per litre in water. Poly(vinyl alcohol) (PVA, Mw: 31,000-50,000 g/mol, 99% hydrolysed), poly(diallyldimethylamoinonium chloride) (PDDA, Mw: 100,000-200,000 g/mol) and ethylene glycol were purchased from Aldrich. Microscope slides (3 × 1 inch) from Marienfeld (Lauda-Königshofen, Germany) and ITO coated glass slides from Präzisions Glass & Optik GmbH (Iserlohn, Germany) were used as substrates.
The substrates were ultrasonicated for 5 minutes in acetone. They were then cleaned with sodium dodecyl solution and washed with de-mineralised water to remove the soap. After ultrasonication in iso-propanol for 5 minutes and drying with N2 flow, the slides were treated in a UV-ozone photo-reactor (UVP PR-100, Upland, CA) for 20 minutes

Inkjet printing of CdTe NC-polymer composites
83
4.6 References
1 L. Brus, J. Phys. Chem. 1986, 90, 2555.
2 A.P. Alivisatos, Science 1996, 271, 933.
3 A.L. Rogach, D.V. Talapin, H. Weller, in Colloids and Colloids Asemblies (Ed.: F.
Caruso), Wiley-VCH, Weinheim, 2004, 52.
4 V.L. Colvin, M.C. Schlamp, A.P. Alivisatos, Nature 1994, 370, 354.
5 S.V. Kershaw, M.T. Harrison, A.L. Rogach, A. Kornowski, IEEE J. Sel. Top. Quantum
Elect. 2000, 6, 534.
6 M. Gao, J. Sun, E. Dulkeith, N. Gaponenko, U. Lemmer, J. Feldmann, Langmuir 2002,
18, 4098.
7 S. Coe, W. K. Woo, M. Bawendi, V. Bulovic, Nature 2002, 420, 800.
8 A.N. Shipway, E. Katz, I. Willner, ChemPhysChem 2000, 1,18. 9 M.-C. Daniel, D. Astruc, Chem. Rev. 2004, 104, 293.
10 C.P. Collier, T. Vossmeyer, J.R. Heath, Annu. Rev. Phys. Chem. 1998, 49, 371.
11 C.B. Murray, C.R. Kagan, M.G. Bawendi, Annu. Rev. Mater. Sci. 2000, 1, 18.
12 M.R. Bockstaller, E.L. Thomas, J. Phys. Chem. B 2003, 107, 10017.
13 M.R. Bockstaller, R. Kolb, E.L. Thomas, Adv. Mater. 2001, 13, 1783.
14 Y. Fink, A.M. Urbas, M.G. Bawendi, J.D. Joannopoulos, E.L. Thomas, J. Lightwave
Technol. 1999, 17, 1963.
15 R.D. Deegan, O. Bakajin, T.F. Dupont, G. Huber, S.R. Nagel, T.A. Witten, Nature
1997, 389, 827.
16 R.D. Deegan, O. Bakajin, T.F. Dupont, G. Huber, S.R. Nagel, T.A. Witten, Phys. Rev. E
2002, 62, 756.
17 B.-J. de Gans, U.S. Schubert, Langmuir 2004, 20, 7789.
18 E. Tekin, B.-J. de Gans, U.S. Schubert, J. Mater. Chem. 2004, 14, 2627.
19 R.D. Deegan, Phys, Rev. E 2000, 61, 475.
20 J. Perelaer, B.-J de Gans, U.S. Schubert, Adv. Mater. 2006, 18, 2101.
21 P.J. Smith, D.-Y. Shin, J.E. Stringer, B. Derby, N. Reis, J. Mater. Sci. 2006, 41, 4153.
22 P.C. Duineveld, J. Fluid. Mech. 2003, 477, 175.
23 T. Franzl, D.S. Koktysh, T.A. Klar, A.L. Rogach, J. Feldmann, Appl. Phys. Lett. 2004,
84, 2904.

Chapter IV
84
24 N. Gaponik, D.V. Talapin, A.L. Rogach, K. Hoppe, E.V. Shevchenko, A. Kornowski,
A. Eychmüller, H. Weller, J. Phys. Chem. B 2002, 106, 7177.
25 W.W. Yu, L. Qu, W. Guo, X. Peng, Chem. Mater. 2003, 15, 2854.

Chapter V
Inkjet printing of a conjugated polymer (poly[2-methoxy-5-(2′-ethylhexyloxyl)–1,4-phenylenevinylene] (MEH–PPV))
Abstract The printability of the conjugated polymer, poly[2-methoxy-5-(2′-ethylhexyloxyl)–1,4-
phenylenevinylene] (MEH–PPV), dissolved in different solvents, is studied. The pattern
formation of the resulting lines is explained in relation to the contact angle formed by the
MEH–PPV solution on the substrate and interchain interactions, which occur in the ink. A
uniform thickness distribution of MEH–PPV films is obtained when toluene is used as the
solvent. Further improvement on the surface quality of the lines is achieved by optimising the
printing parameters. Moreover, optimisation of the conditions to print larger films (6 × 6
mm) from MEH-PPV solutions is demonstrated, as well as performance testing for light
emitting diodes (LEDs). For this purpose, the influence of thermal treatment and layer
thickness on the device performance were investigated and compared with spin-coated
devices.
Part of this chapter has been published: E. Tekin, E. Holder, D. Kozodaev, U.S. Schubert, Adv. Funct. Mater. 2007, 17, 277; E. Tekin, N. Rehmann, D.A.M. Egbe, K. Meerholz, U.S. Schubert (in preparation).

Chapter V
86
5.1 Introduction
Poly-phenylenevinylene (PPV) derivatives are very attractive materials for optoelectronic
devices such as polymer light emitting diodes (PLEDs), photovoltaics and polymer field
effect transistors (PFETs) because of their unique charge transport and luminescence
properties.1,2 Poly[2-methoxy-5-(2’-ethylhexyloxyl)-1,4-phenylene-vinylene] (MEH-PPV)
(Figure 5.1) is one of its derivatives that serves as a model compound, representing an
important family of π-conjugated materials used for device production. The alkoxy side
chains provide solubility in common organic solvents3,4 and processibilty for use in different
techniques such as dip-coating, spin and drop casting.5,6 MEH-PPV is also a suitable material
that can be processed by inkjet printing7,8 since dilute solutions of MEH-PPV reveal
Newtonian rheological properties.9
For device optimisation, an important aspect is the interchain interaction of MEH-PPV
because it crucially affects film morphology, luminescence and charge carrier transport
properties. The degree of interchain interactions can be influenced and controlled by varying
the organic solvents and the polymer concentration.10-13 The deposition technique used also
influences the molecular conformations, mainly due to changes in the solvent evaporation
rate.5,7 Aggregation (formation of interchain species) of MEH-PPV is generally promoted in
aromatic solvents which solvates the polymer backbone, resulting in a rigid-rod conformation
of the polymer backbone. Conversely, in solvents such as tetrahydrofuran (THF), it results in
tight coils.10,13
The unique property of inkjet printing is that small amounts of functional materials can
be deposited on defined surface areas, from solutions or suspensions, in a desired shape.
Therefore inkjet printing represents an important technique for the controlled fabrication of
organic transistors, polymer displays, solar cells and biomolecular arrays.14-20 Another major
advantage is the ability of multiple deposition on one substrate, which is desired for printing
multicolour PLEDs, and in combinatorial materials research.21,22
Control of the drying process is crucial in the production of uniform films via inkjet
printing,23,24 if the well known “coffee stain” effect is to be avoided.25 So far, the
investigations concerned with minimising and eliminating this problem for different kinds of
polymers have mainly focused on optimisation of evaporation rate and solvent system.23,24,26-
28 However, the interaction between solvent and polymer has received less attention although
it contributes to the resulting thin film topography especially for conjugated polymers. Device
characterisation and improvement of device performance of MEH-PPV has generally focused

Inkjet printing of a conjugated polymer
87
on spin-coated active layers.29-34 However, no detailed research into the optimisation and
understanding of the conditions for device fabrication using inkjet printing has taken place
until now. Moreover, the coating of large surface areas is another important issue for device
fabrication which has to be investigated.
O
MeO n
Figure 5.1 Schematic representation of the chemical structure of MEH-PPV (poly[2-methoxy-5-(2’-ethylhexyloxyl)-1,4-phenylenevinylene]).
In this chapter, inkjet printing of MEH-PPV thin films, which are important for
potential applications like PLEDs, polymer solar cells and PFETs, is reported. It has been
found that solvent-polymer interactions affect both the printability of MEH-PPV and the
resulting thin film topography. The droplet formation of MEH-PPV solutions was examined
via a stroboscopic camera and the solutions were ultrasonicated prior to printing, to decrease
the degree of aggregation. Viscosities and emission spectra of the solutions were measured to
confirm the existence of interchain interactions. In addition, the height profiles of the films
were analysed utilising an optical profilometer. AFM characterisations were performed to
study the morphology of the surfaces and the I-V characteristics of the printed films.
Subsequently, inkjet printing of MEH-PPV as an active layer of an OLED has been
successfully achieved using toluene/o-dichlorobenzene solution. The possibility of printing
films with various thicknesses and investigation of the printed layers is presented. Single layer
devices were fabricated and the influence of thermal treatment and the thickness of the active
layer on the onset voltage and efficiencies were investigated. Moreover, device performances
of both spin-coated and inkjet printed devices are compared.
5.2 Printability of MEH-PPV dissolved in various organic solvents The printability of MEH-PPV which was dissolved in either chlorobenzene, o-xylene, toluene
or THF, was investigated. When the concentration of MEH-PPV was low (2.5 mg/mL), stable

Chapter V
88
and uniform droplet formation was observed. However, the fast evaporation of THF at the
nozzle of the micropipette did not result in stable droplet formation (Figure 5.2). All droplets
of MEH-PPV solutions ejected from a micropipette nozzle revealed relatively long tails,
which is a common behaviour for linear polymers.35
Chlorobenzene o-XyleneTHFChlorobenzene o-XyleneTHF
Figure 5.2 Images of ejected droplets obtained from MEH-PPV solution in different organic solvents.
When the concentration of MEH-PPV was increased to 5 mg/mL, stable droplet
formation was much more difficult to obtain, even from solvents with a low vapour pressure.
Nozzle clogging occurred because the number of aggregates increased at higher
concentration. To minimise this problem, the solutions were ultrasonicated prior to inkjet
printing. GPC measurements were carried out to monitor the molecular weight distributions in
correlation to the ultrasonication time (Figure 5.3). The GPC curves shift slightly to higher
retention times and the small shoulder at lower retention times is seen to decrease. The results
indicate that even after four hours of ultrasonication no significant change of the average
molecular weight of the polymer is detectable (Mn = 44,330 g/mol (t = 0), Mn = 41,580 g/mol
(t = 4 h)). The reason is that mainly aggregates or only few longer chains are fragmented
during the ultrasonication process. It was decided that, only two hours of ultrasonication were
needed for the following experiments to minimise any eventual effects on the physical
properties of the final MEH-PPV deposit, such as luminescence and/or conductivity.
Aggregate species have been recently defined as an interpenetration of polymer coils36
or as nanocrystalline clusters that serve as physical cross-links among MEH-PPV chains.37
Chen et al. have proved that these physical cross-links undergo gel formation with time.37 Our
observations showed that even after filtration, the solutions can undergo gel like behaviour
upon time. Additionally, the effect of interchain species on the emission spectra has been
detected after filtration (which will be demonstrated in this section).

Inkjet printing of a conjugated polymer
89
3 4 5 6 7 8
0
3000
6000
9000
12000
RI S
igna
l (a.
u.)
Time (minute)
before ultrasonication 1 hour ultrasonication 2 hours ultrasonication 3 hours ultrasonication 4 hours ultrasonication
Figure 5.3 GPC curves measured every 60 minutes during ultrasonication of the MEH-PPV solution. A chloroform/triethylamine/isopropanol (93/5/2) mixture was used as eluent.
In conclusion, these interchain species can not be explained just by undissolved solute.
It is suggested that they are physically interacting coils; and during ultrasonication these
physical cross-links are broken.
Concentrations as high as 5-7 mg/mL could be ejected from the nozzle when an
ultrasonication treatment was applied prior to the inkjet printing event. However, solutions of
much higher concentrations lead to serious clogging problems due to the strong aggregation
effects in the nozzle cavity and the increased solution viscosity. The solution viscosities of
polymer solutions in toluene with concentrations of 5, 7 and 10 mg/mL are 1.13, 1.81 and
2.95 mPa s, respectively.
The printing conditions should be optimised for each polymer solution individually
because of the fact that viscosity variations of the polymer solutions require adjusted pulse
widths and voltages used to fire droplets from the nozzle. Table 5.1 summarises the minimum
voltages to obtain uniform droplets for each polymer solution with 5 mg/mL concentration in
different solvents (applied pulse width: 35 to 40 µs), the viscosities of the solutions after
subtracting the solvent viscosities ( sηη − ), the vapour pressures of the solvents and the
results of the printability. The viscosities of the MEH-PPV solutions prepared from toluene
and o-xylene are significantly higher compared to the viscosities of the chlorobenzene and
THF solutions. Consequently, the required voltages to eject droplets for the more viscous
solutions are high as well.
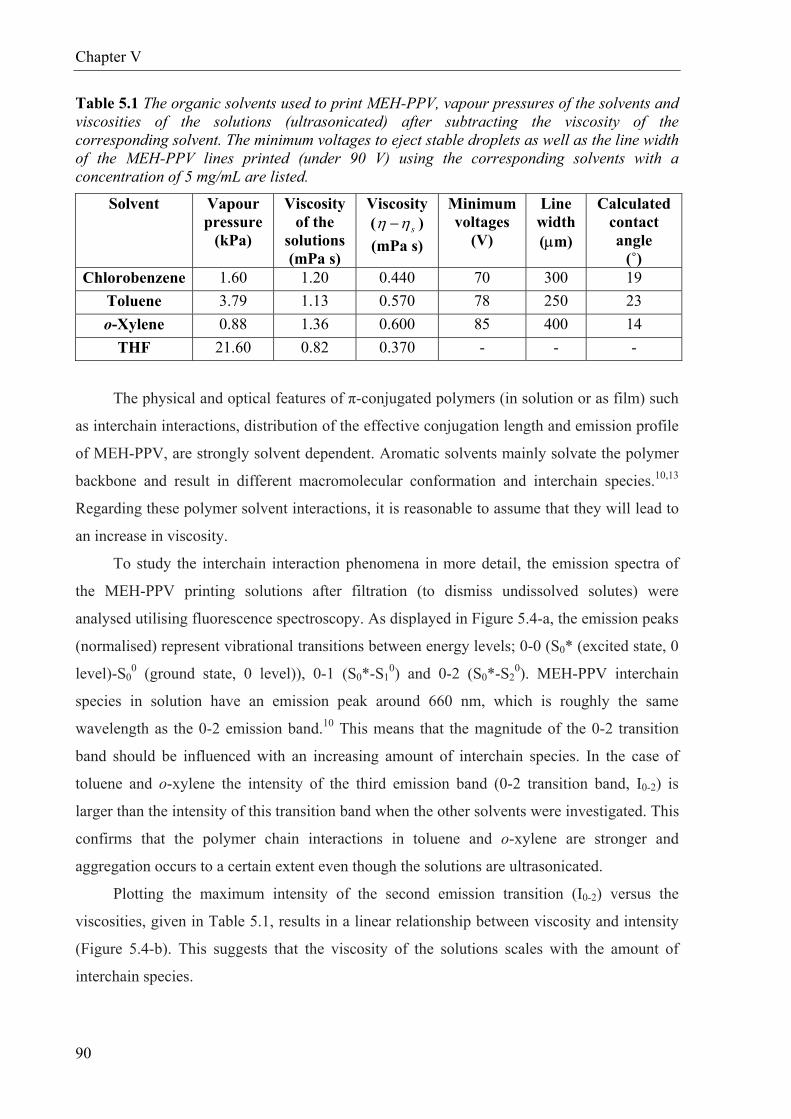
Chapter V
90
Table 5.1 The organic solvents used to print MEH-PPV, vapour pressures of the solvents and viscosities of the solutions (ultrasonicated) after subtracting the viscosity of the corresponding solvent. The minimum voltages to eject stable droplets as well as the line width of the MEH-PPV lines printed (under 90 V) using the corresponding solvents with a concentration of 5 mg/mL are listed.
Solvent Vapour pressure
(kPa)
Viscosity of the
solutions (mPa s)
Viscosity ( sηη − ) (mPa s)
Minimum voltages
(V)
Line width (µm)
Calculated contact angle
(˚) Chlorobenzene 1.60 1.20 0.440 70 300 19
Toluene 3.79 1.13 0.570 78 250 23 o-Xylene 0.88 1.36 0.600 85 400 14
THF 21.60 0.82 0.370 - - -
The physical and optical features of π-conjugated polymers (in solution or as film) such
as interchain interactions, distribution of the effective conjugation length and emission profile
of MEH-PPV, are strongly solvent dependent. Aromatic solvents mainly solvate the polymer
backbone and result in different macromolecular conformation and interchain species.10,13
Regarding these polymer solvent interactions, it is reasonable to assume that they will lead to
an increase in viscosity.
To study the interchain interaction phenomena in more detail, the emission spectra of
the MEH-PPV printing solutions after filtration (to dismiss undissolved solutes) were
analysed utilising fluorescence spectroscopy. As displayed in Figure 5.4-a, the emission peaks
(normalised) represent vibrational transitions between energy levels; 0-0 (S0* (excited state, 0
level)-S00 (ground state, 0 level)), 0-1 (S0*-S1
0) and 0-2 (S0*-S20). MEH-PPV interchain
species in solution have an emission peak around 660 nm, which is roughly the same
wavelength as the 0-2 emission band.10 This means that the magnitude of the 0-2 transition
band should be influenced with an increasing amount of interchain species. In the case of
toluene and o-xylene the intensity of the third emission band (0-2 transition band, I0-2) is
larger than the intensity of this transition band when the other solvents were investigated. This
confirms that the polymer chain interactions in toluene and o-xylene are stronger and
aggregation occurs to a certain extent even though the solutions are ultrasonicated.
Plotting the maximum intensity of the second emission transition (I0-2) versus the
viscosities, given in Table 5.1, results in a linear relationship between viscosity and intensity
(Figure 5.4-b). This suggests that the viscosity of the solutions scales with the amount of
interchain species.

Inkjet printing of a conjugated polymer
91
a)
b)
0.3 0.4 0.5 0.60.0
0.1
0.2
0.3
0.4
0.5
Linear regression R2= 0.99068
I 0-2
Viscosity (v2-v1, mPa s)
THF Clorobenzene Toluene o-Xylene
500 600 700 8000.0
0.2
0.4
0.6
0.8
1.0
0-2
0-10-0
o-Xylene Chlorobenzene Toluene THF
PL
Inte
nsity
(a.u
.)
Wavelength (nm)
Figure 5.4 a) Normalised emission spectra of the polymer solutions (5 mg/mL), in o-xylene, chlorobenzene, toluene and THF (all solutions were ultrasonicated for 2 hours). The measurements were performed utilising an UV-Vis/fluorescence plate reader (λex = 500 nm). b) Correlation of the viscosities (after subtracting the viscosity of the corresponding solvent) prepared from the different solvents (Table 5.1) versus the corresponding maximum intensities of the third emission band (0-2 transitions, I0-2) of the solutions.
It should be noted that, as mentioned in the introduction, the interchain species
(so-called aggregates) are mainly caused by solvation selectivity. Indeed, the values of the
solubility parameters of solvents38 which are given in Table 5.2 are close to each other. On the
other hand the polarities (which are provided by dielectric constant values) of chlorobenzene
and THF are significantly higher than the polarities of toluene and o-xylene. This can explain
why aggregation is relatively low in chlorobenzene although it is an aromatic solvent.
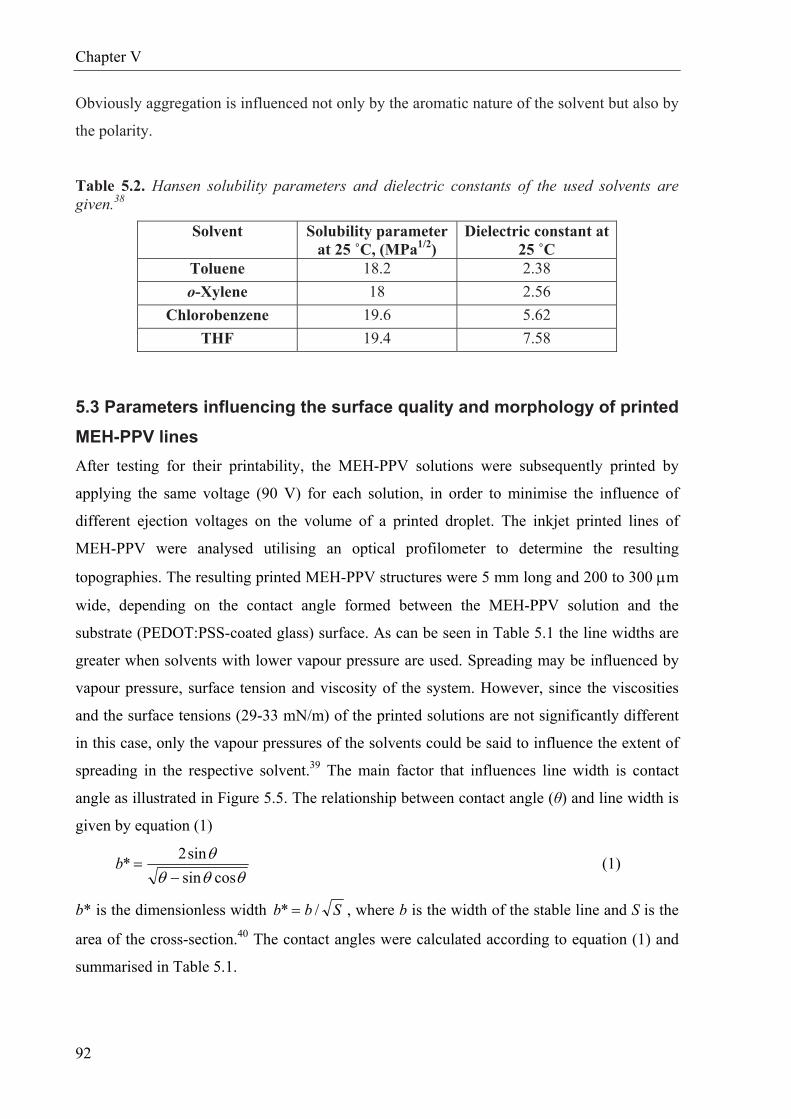
Chapter V
92
Obviously aggregation is influenced not only by the aromatic nature of the solvent but also by
the polarity.
Table 5.2. Hansen solubility parameters and dielectric constants of the used solvents are given.38
Solvent Solubility parameter at 25 ˚C, (MPa1/2)
Dielectric constant at 25 ˚C
Toluene 18.2 2.38 o-Xylene 18 2.56
Chlorobenzene 19.6 5.62 THF 19.4 7.58
5.3 Parameters influencing the surface quality and morphology of printed MEH-PPV lines After testing for their printability, the MEH-PPV solutions were subsequently printed by
applying the same voltage (90 V) for each solution, in order to minimise the influence of
different ejection voltages on the volume of a printed droplet. The inkjet printed lines of
MEH-PPV were analysed utilising an optical profilometer to determine the resulting
topographies. The resulting printed MEH-PPV structures were 5 mm long and 200 to 300 µm
wide, depending on the contact angle formed between the MEH-PPV solution and the
substrate (PEDOT:PSS-coated glass) surface. As can be seen in Table 5.1 the line widths are
greater when solvents with lower vapour pressure are used. Spreading may be influenced by
vapour pressure, surface tension and viscosity of the system. However, since the viscosities
and the surface tensions (29-33 mN/m) of the printed solutions are not significantly different
in this case, only the vapour pressures of the solvents could be said to influence the extent of
spreading in the respective solvent.39 The main factor that influences line width is contact
angle as illustrated in Figure 5.5. The relationship between contact angle (θ) and line width is
given by equation (1)
θθθθcossin
sin2*−
=b (1)
b* is the dimensionless width Sbb /* = , where b is the width of the stable line and S is the
area of the cross-section.40 The contact angles were calculated according to equation (1) and
summarised in Table 5.1.

Inkjet printing of a conjugated polymer
93
θ1
b1
θ2
b2
Small contact angleLarge contact angle
θ1
b1
θ2
b2
Small contact angleLarge contact angle
Figure 5.5 Schematic pictures of a printed liquid droplet on a solid surface revealing large and small contact angles, and resulting in small and large dot diameter, respectively; b2 > b1
because θ2 < θ1.
Due to the increased evaporation rate at the droplet edge and contact line pinning, the
resulting outward flow (capillary driven), to compensate for evaporation losses, can carry
virtually most of the dispersed material to the edge.25 Therefore, the drying pattern of an
inkjet printed droplet mainly depends on the homogeneity of the evaporation rate along the
droplet and mobility of the solutes.
The influence of different solvents on the quality of the obtained topographies is
obvious from the micrographs and the cross-sections of the films shown in Figure 5.6. The
differences in these deposit morphologies can be explained in relation to two main influences:
1-the contact angle formed by the printed drop on the substrate;
2-clustering of MEH-PPV chains due to physical cross-links.
Lines printed from toluene solutions resulted in a flatter surface (Figure 5.6-b) than the lines
from chlorobenzene (Figure 5.6-a) and o-xylene (Figure 5.6-c) solutions. For the toluene
solution, the presence of a thicker liquid layer at the contact line of the droplet permits
uniform slow evaporation throughout the liquid/gas interface41 (see Figure 5.5). In this case
the duration of the pinning of the contact line is receded. It can not be claimed that pinning is
completely prevented, since the contact angle is not that high (23˚). Although, pinning might
still occur, slow diffusion of the swollen polymer aggregates results in minimised material
transfer to the edges via a capillary flow. This aggregation effect becomes more clear from the
pattern shown in Figure 5.6-c (50 nm high side walls). Despite that the contact angle formed
by the chlorobenzene solution is lower than the contact angle formed by o-xylene solution, the
ring formation effect is not as pronounced as in the pattern printed from chlorobenzene (high
side walls, height: 200 to 250 nm) due to the slow diffusion of physically interacted chains.

Chapter V
94
0.0 0.1 0.2 0.3 0.4 0.5 0.60.0
0.1
0.2
0.3
Film width (mm)
Film
hei
ght (
µm)
0.0 0.1 0.2 0.3 0.4 0.5 0.60.0
0.1
0.2
0.3
Film width (mm)
Film
hei
ght (
µm)
0.0 0.1 0.2 0.3 0.4 0.5 0.60.0
0.1
0.2
0.3
Film width (mm)
Film
hei
ght (
µm)
a) b) c)
0.0 0.1 0.2 0.3 0.4 0.5 0.60.0
0.1
0.2
0.3
Film width (mm)
Film
hei
ght (
µm)
0.0 0.1 0.2 0.3 0.4 0.5 0.60.0
0.1
0.2
0.3
Film width (mm)
Film
hei
ght (
µm)
0.0 0.1 0.2 0.3 0.4 0.5 0.60.0
0.1
0.2
0.3
Film width (mm)
Film
hei
ght (
µm)
a) b) c)
Figure 5.6 Micrographs of the inkjet printed lines (prepared from solutions of MEH-PPV, 5 mg/mL) and the corresponding cross-sections measured utilising an optical profilometer. Solvents used were a) chorobenzene, b) toluene and c) o-xylene. Lines were printed under identical conditions such as pulse amplitude, pulse width.
The effect of heating the substrate during printing was also observed. For this
experiment a solution of MEH-PPV (concentration = 2.5 mg/mL) in chlorobenzene was used.
Figure 5.7 shows the influence of different substrate temperatures on the profiles of the
printed lines. It is obvious that as the temperature increases, the ring formation becomes more
pronounced. In addition, the surface of the film printed at high temperature became
significantly rough. As a consequence, since the morphology of the lines printed from
chlorobenzene could not be improved further, toluene and room temperature are selected as
optimal conditions to print controlled patterns.
As well as the evaporation process and interchain interactions, the velocity of the
printhead and the concentration of the polymer solution also play an important role in the film
formation. The lines were printed “on the fly” meaning that the printhead moves continuously
and drops are generated to produce the required spacing. The MEH-PPV lines printed from
toluene solution at 1 mm s-1 velocity reveal a wrinkled surface in the printing direction and
periodic modulations on the sides were observed (Figure 5.8-a). When a dot is dispensed onto
the surface the contact line is pinned and the dot then loses solvent, i.e. dries.39 Due to the
relatively slow printhead velocity, a complete merging between the first and second droplets
does not occur since the first droplet has already dried. As can be seen from Figure 5.8-b,
increasing the printing velocity to 5 mm s-1 resulted in significantly flatter surfaces.

Inkjet printing of a conjugated polymer
95
0.0 0.1 0.2 0.3 0.4 0.5 0.60.0
0.1
0.2
0.3
0.4 80 oC
Film width (mm)
Film
hei
ght (
µm)
0.0 0.1 0.2 0.3 0.4 0.5 0.60.0
0.1
0.2
0.3
0.4
Film width (mm)
Film
hei
ght (
µm) 100 oC
0.0 0.1 0.2 0.3 0.4 0.5 0.60.0
0.1
0.2
0.3
0.4
Film width (mm)
Film
hei
ght (
µm) 60 oC
0.0 0.1 0.2 0.3 0.4 0.5 0.60.0
0.1
0.2
0.3
0.4
80 oC
Film width (mm)
Film
hei
ght (
µm)
0.0 0.1 0.2 0.3 0.4 0.5 0.60.0
0.1
0.2
0.3
0.4
Film width (mm)
Film
hei
ght (
µm) 100 oC
0.0 0.1 0.2 0.3 0.4 0.5 0.60.0
0.1
0.2
0.3
0.4
Film width (mm)
Film
hei
ght (
µm) 60 oC
Figure 5.7 The micrographs and the cross-sections of the MEH-PPV lines printed from chlorobenzene at 60, 80 and 100 ˚C using a heating plate, concentration = 2.5 g/mL.
Keeping the velocity constant at 5 mm s-1 the concentration was increased to 6 mg/mL
in order to study the effects on the resulting film profiles. As a consequence, the thickness
increased from 70 nm to 100 nm as expected. Additionally, the line-width was seen to the
decrease since spreading decreased because of the decrease in the drying time and viscosity of
high concentrated solution. Consequently, narrower lines were obtained, which is more
preferable for potential applications such as in PFETs. On the other hand, given the fact that
the concentrated depositions dry faster, complete merging of the droplets becomes more

Chapter V
96
difficult. For this reason, periodic modulation at the junctions of the droplets are more
pronounced for the MEH-PPV lines printed from high concentrated solutions (Figure 5.8-c).
a)
b)
c)
z = 147nm
y = 109 µmx = 392 µm
z = 135 nm
y = 118 µm x = 314 µm
z=135 nm
y = 83 µm x= 314 µm
Prin
ting
Dire
ctio
n
250 µm
a)
b)
c)
z = 147nm
y = 109 µmx = 392 µm
z = 135 nm
y = 118 µm x = 314 µm
z=135 nm
y = 83 µm x= 314 µm
Prin
ting
Dire
ctio
n
250 µm
Figure 5.8 Micrographs of the MEH-PPV/toluene lines and the corresponding 3D cross-sections. Variation of velocity and concentration were performed as follows: a) solution concentration: 5 mg/mL, velocity of the printhead: 1 mm s-1, b) 5 mg/mL, 5 mm s-1, and c) 6 mg/mL, 5 mm s-1.
When liquid lines are printed with sufficiently small dot spacing (∆x), stable lines are
obtained. However, if ∆x exceeds a critical value for a constant velocity, the lines can become
unstable40 (i.e. the constituent droplets do not merge). If the velocity of the printhead is
increased stable lines can be obtained for a relatively large ∆x. In this case, the time scale for
spreading (allowing droplets to merge into a line) due to capillarity becomes important. To
form stable lines the velocity of the printhead should be higher than the spreading velocity of
the deposited solutions. For this reason, printing at a lower velocity results in unstable lines

Inkjet printing of a conjugated polymer
97
when a large spacing is used, whereas stable lines are obtained at higher velocities for the
same spacing. For instance, printing with a 260 µm dot spacing and at 1 mm s-1 resulted in
separated droplets, a stable line was obtained printing at 4 mm s-1 (Figure 5.9-a). Figure 5.9-b
shows that ∆x required for a stable line increases with increasing velocity up to a critical
value, which corresponds to the maximum wettability of a printed dot.
∆×: 200 220 240 260 280 300 320 340 µm
∆×Velocity:
1 mm/s
2 mm/s
4 mm/s
∆×: 200 220 240 260 280 300 320 340 µm
∆×Velocity:
1 mm/s
2 mm/s
4 mm/s
0 5 10 15 20 25 30200
250
300
350
400
Dot
spa
cing
(µm
)
Velocity of the print head (mm/s)
on Glass on PEDOT:PSS
a)
b)
Figure 5.9 a) Micrographs of stable and unstable lines printed by varying the dot spacings (∆x) and velocities. b) Correlation of ∆x values versus velocities on glass and PEDOT:PSS surfaces. 5.4 Investigation of the micro-morphology and conductivity using AFM Charge transport properties and micro-morphology of the inkjet printed lines of MEH-PPV
are very important for potential device applications. For that reason, both the surfaces and the
electrical properties of the thin films were analysed utilising AFM techniques. For the current-
voltage (I-V) measurements, the device had the following layout: a glass substrate coated with
ITO and PEDOT:PSS as the transparent electrode (anode) and the hole conducting layer
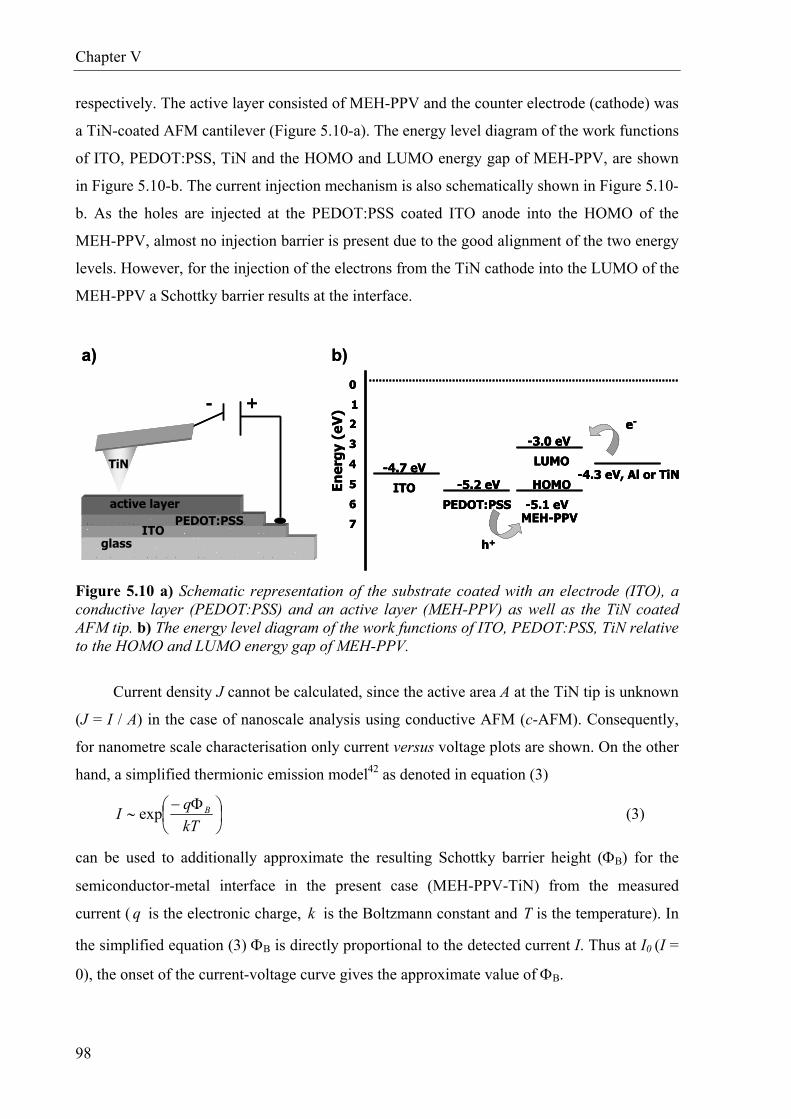
Chapter V
98
respectively. The active layer consisted of MEH-PPV and the counter electrode (cathode) was
a TiN-coated AFM cantilever (Figure 5.10-a). The energy level diagram of the work functions
of ITO, PEDOT:PSS, TiN and the HOMO and LUMO energy gap of MEH-PPV, are shown
in Figure 5.10-b. The current injection mechanism is also schematically shown in Figure 5.10-
b. As the holes are injected at the PEDOT:PSS coated ITO anode into the HOMO of the
MEH-PPV, almost no injection barrier is present due to the good alignment of the two energy
levels. However, for the injection of the electrons from the TiN cathode into the LUMO of the
MEH-PPV a Schottky barrier results at the interface.
+-
TiN
glassITO
PEDOT:PSSactive layer
a)En
ergy
(eV
)
-4.3 eV, Al or TiN
0
1
2
3
4
5
6
7
ITO
-4.7 eV
MEH-PPVPEDOT:PSS
-5.2 eV HOMO
LUMO
-3.0 eV
-5.1 eV
h+
e-
b)
+-
TiN
glassITO
PEDOT:PSSactive layer
a)En
ergy
(eV
)
-4.3 eV, Al or TiN
0
1
2
3
4
5
6
7
ITO
-4.7 eV
MEH-PPVPEDOT:PSS
-5.2 eV HOMO
LUMO
-3.0 eV
-5.1 eV
h+
e-
-4.3 eV, Al or TiN
0
1
2
3
4
5
6
7
ITO
-4.7 eV
MEH-PPVPEDOT:PSS
-5.2 eV HOMO
LUMO
-3.0 eV
-5.1 eV
h+
e-
b)
Figure 5.10 a) Schematic representation of the substrate coated with an electrode (ITO), a conductive layer (PEDOT:PSS) and an active layer (MEH-PPV) as well as the TiN coated AFM tip. b) The energy level diagram of the work functions of ITO, PEDOT:PSS, TiN relative to the HOMO and LUMO energy gap of MEH-PPV.
Current density J cannot be calculated, since the active area A at the TiN tip is unknown
(J = I / A) in the case of nanoscale analysis using conductive AFM (c-AFM). Consequently,
for nanometre scale characterisation only current versus voltage plots are shown. On the other
hand, a simplified thermionic emission model42 as denoted in equation (3)
Φ−
∼kTqI Bexp (3)
can be used to additionally approximate the resulting Schottky barrier height (ΦB) for the
semiconductor-metal interface in the present case (MEH-PPV-TiN) from the measured
current ( q is the electronic charge, k is the Boltzmann constant and T is the temperature). In
the simplified equation (3) ΦB is directly proportional to the detected current I. Thus at I0 (I =
0), the onset of the current-voltage curve gives the approximate value of ΦB.

Inkjet printing of a conjugated polymer
99
-8 -6 -4 -2 0 2 4 6 8-5
0
5
10
15
20
25
30
Cur
rent
(nA
)
Bias Voltage (V)
Averaged I/V curves determined along cross section: PPV film from toluene PPV film from chlorobenzene
0.0 0.5 1.0 1.5 2.0 2.5 3.00123456789
10
Rou
ghne
ss (n
m)
Cross-section (µm)
b)
d)c)
a)
0.0 0.5 1.0 1.5 2.0 2.5 3.00123456789
10
Cross-section (µm)
Rou
ghne
ss (n
m)
Figure 5.11 a) Morphology of the film printed from MEH-PPV/chlorobenzene solution (5 mg/mL) measured by AFM in tapping mode and the roughness of the cross-section of the morphology image. b) AFM height image and the resulting roughness of the film printed from toluene solution. c) 3D distribution of the I-V curves measured along the 3 µm length on the film obtained from toluene solution. d) I-V curves of the films printed both from toluene and chlorobenzene onto PEDOT:PSS coated ITO surfaces measured by AFM using a conducting TiN cantilever.
As can be seen from the images in Figure 5.11, the morphologies of the films resulting
from MEH-PPV/chlorobenzene solution has a smooth surface. Roughness analysis of the

Chapter V
100
surface reveals that the averaged root mean square roughness (Rrms) over 5 × 5 µm is below 2
nm. This value is slightly smaller than the roughness of the film printed from toluene
(roughness is below 3 nm, Figure 5.11-b) since toluene reveals more aggregates. Scanning
along the line (marked on the AFM image, Figure 5.11-b) with a TiN-coated AFM tip allows
electrical characterisation of the printed films. In Figure 5.11-c the 3D distribution of 50 I-V
curves measured along the line of the surface area on the MEH-PPV film printed from toluene
is shown. From Figure 5.11-c, it is obvious that the I-V curves measured on a number of
different positions were remarkably reproducible.
The I-V averaged characteristic of a printed line from toluene was compared to the line
printed from chlorobenzene (Figure 5.11-d). The detected current passed through the film
inkjet printed from chlorobenzene at a certain voltage (5 V) was twice as high as for the film
printed from toluene. However, this difference could be due to the differences in film
thickness; the film printed from chlorobenzene had almost half of the thickness (in the
middle) of the film printed from toluene (see Figures 5.6-a and 5.6-b) due to the coffee stain
effect. It is concluded that MEH-PPV films printed from toluene resulted in a film that had
reasonable conductivity and reproducibility.
5.5 Printing larger areas and controlling the thickness The preceding investigations identified toluene as the optimal solvent (from those tested) for
printing MEH-PPV features. To cover larger areas, multiple lines (line width ~200 µm), can
be printed close enough together to result in one continuous film. Figure 5.12-a shows the
micrograph of the resulting film surface (6 × 6 mm) consisting of the overlapping lines
printed from MEH-PPV solution in toluene on glass.
As can be seen, the merging points of one line to the next line result in fluctuations
since the printed lines start drying before the next lines are deposited. To prevent this effect
and to obtain a continuous smooth surface, the drying kinetic has to be controlled. For this
reason, a small amount (5% v/v) of o-dichlorobenzene (bp: 180 ˚C) was added to the MEH-
PPV / toluene solution as a drying control agent. Figure 5.12-b clearly demonstrates that by
using this solvent combination a smoother surface was obtained. However, increasing the
amount of o-dichlorobenzene leads to a significantly longer drying time and therefore an
increase in the content of o-dichlorobenzene is not desirable. Printing films as large as 25-50
mm2 is feasible using the same formulation but for larger areas the ratio of drying controller

Inkjet printing of a conjugated polymer
101
agent (o-dichlorobenzene) to the solvent (toluene) should be further optimised, since the total
drying time of each line is also related to the dimensions of the lines.
100 µm 100 µm
a) b)
100 µm 100 µm
a) b)
Figure 5.12: Micrographs of the surfaces of the MEH-PPV films inkjet printed from a) toluene and b) a toluene/o-dichlorobenzene mixture (substrate is glass).
As introduced in the previous chapters, the thickness of the deposited layer can be
determined by the density of the printed droplets (number of dots per area)43 as well as the
concentration of the solution. Figure 5.13 demonstrates the increase of the layer thickness
from 276 nm to 615 nm by increasing the solution concentration from 4 mg/mL to 7 mg/mL.
Due to the lower viscosity, the films printed from the low concentrated MEH-PPV solutions
(4 and 5 mg/mL) are more influenced by the ring formation phenomena, i.e. during the
deposition of MEH-PPV most of the solute is transported to the edge of the film.
To prevent any influences caused by the ring formation, the metal cathode was
evaporated onto the middle of the printed MEH-PPV film to ensure that the active area of the
device excludes the edges of the MEH-PPV film. Therefore the printed devices should not be
influenced by ring formation phenomena. Table 5.3 summarises the different thicknesses
obtained from different concentrations and dot spacings. With a concentration of e.g. 5
mg/mL, the thickness of the printed film can be varied in the range of 75 nm to 600 nm by
increasing the number of deposited droplets per area. One can see that the range of accessible
layer thicknesses from a single concentration is much larger than the range accessible by spin-
coating. Using the spin-coating technique, a 5 mg/mL (5% wt) concentrated solution can
reveal thicknesses between 50-150 nm.9 This means that even very low concentrations can
provide sufficient thickness by inkjet printing which is very important when the polymer is
less soluble or aggregates at high concentrations. Another important advantage of inkjet
printing is that one can deposit different compositions or thicknesses onto one substrate.

Chapter V
102
0.825 µm
3.59 mm1186 µm
0.637 µm
1243 µm3.6 mm
0.59 µm
1243 µm 3.6 mm
a)
b)
c)
Thickness = 615 nm
Thickness = 276 nm
Thickness = 450 nm
0.825 µm
3.59 mm1186 µm
0.637 µm
1243 µm3.6 mm
0.59 µm
1243 µm 3.6 mm
a)
b)
c)
Thickness = 615 nm
Thickness = 276 nm
Thickness = 450 nm
Figure 5.13 The profiles of the MEH-PPV films inkjet printed using toluene o-
dichlorobenzene solutions having a) 7 mg/mL, b) 5 mg/mL and c) 4 mg/mL concentrations (obtained by an optical profilometer). Printhead velocity: 15 mm/s, dot spacing: 80 µm.
Table 5.3 Obtainable layer thickness variation by changing the number of deposited droplets per area and/or by changing the concentration of MEH-PPV.
Dot spacing (µm)
Number of deposited droplets
Thickness (nm)
(c = 4 mg/mL)
Thickness (nm)
(c = 5 mg/mL)
Thickness (nm)
(c = 7 mg/mL) 180 1038 50 75 120 160 1444 60 88 136 140 1849 75 100 144 120 2500 95 180 212 100 3600 145 200 270 80 5625 276 450 615 60 10000 410 600 1000
c: concentration of MEH-PPV

Inkjet printing of a conjugated polymer
103
5.6 Fabrication and characterisation of light emitting diodes with printed MEH-PPV as the active layer In order to investigate the device performance, single layer devices with the following
structure were fabricated: ITO//MEH-PPV(60 nm – 95 nm)//Ca (4 nm)//Ag(150 nm) (Figure
5.14). Calcium was chosen for the metal cathode due to its work function of ~2.9 eV which
should allow for an efficient electron injection. The device performances are expected to be
relatively low since a hole injecting PEDOT layer was not added. The devices fabricated by
inkjet printing consist of four different polymer films to ensure a smooth active area and to
allow thickness variations to be performed on one substrate.
CaITO Layer
MEH-PPV
Glass
ITO
MEH-PPV
Ca
Ag
CaITO Layer
MEH-PPVCaITO Layer
MEH-PPV
Glass
ITO
MEH-PPV
Ca
Ag
Glass
ITO
MEH-PPV
Ca
Ag
Figure 5.14 Schematic representation of the device architecture.
Figure 5.15 Efficiency – voltage – curves of two devices with an inkjet printed () and a spin-coated () EML. The layer thickness of both devices is around 90-95 nm. Efficiency is displayed with closed symbols (, ), efficacy is displayed with open symbols (, ).

Chapter V
104
Table 5.4 summarises the device characteristics of all of the investigated devices. Figure
5.15 compares the device performance of two devices with active layers prepared by either
inkjet printing or spin-coating. For a better comparison, printing and spin-coating conditions
were adjusted and optimised so that the active layers had similar thicknesses (approximately
90 to 95 nm). The maximum efficiency of the inkjet printed device was 0.12 Cd/A which is
slightly higher than the efficiency of the spin-coated device with 0.08 Cd/A. Due to similar
layer thicknesses onset voltages of the spin-coated device and the inkjet printed device were
both at around 7 V (see Table 5.4). The difference between the efficiencies can be ascribed to
the film preparation conditions. The slightly lower efficiency of the spin-coated device is
thought to be due to the high polymer concentration of the spin-coated solution where the
aggregation of MEH-PPV is more pronounced.44
To investigate the effect of thermal treatment, an inkjet printed active layer of a MEH-
PPV device (for layer thickness = 75 nm) was annealed for 2 hours at 100 ˚C (Tg of MEH-
PPV: ~75 ˚C). One can easily see in Figure 5.16 that the annealing procedure has a positive
effect on the device performance. The onset voltage is significantly reduced from 7 V for the
non-annealed film to 5 V for the annealed device. One can see that thermal treatment led to an
increased efficiency from 0.2 Cd/A for the non-annealed sample up to 0.38 Cd/A for the
annealed sample. The improvement of the device performance might be attributed to the
elimination of humidity or high-boiling solvent and/or morphology changes upon annealing.
Table 5.4 The device performances of the fabricated devices.
Device Number
Thickness (nm)
Onset voltage
(V)
Max brightness
Cd/m2
Efficiency Cd/A
Efficacy lm/W
SCD 90 7.5 450 0.08 0.03 IPD 1 95 7.5 0,8 0.12 0.05 IPD 2 75 7 75 0.2 0.05 IPD 3 75 (annealed) 5 80 0.38 0.11 IPD 4 60 5.5 3200 0.34 0.075
SCD = spin-coated device IPD = inkjet printed device
In addition to the device characteristics, the photoluminescence and
electroluminescence of the printed MEH-PPV films were recorded (Figure 5.17).
Photoluminescence (PL) spectra of the inkjet printed films with and without the annealing
step were measured (Figure 5.17-a). After annealing it can be seen that the intensities of the
0-1 and 0-2 vibronic transition bands increased. This suggests that annealing enhances the π-π
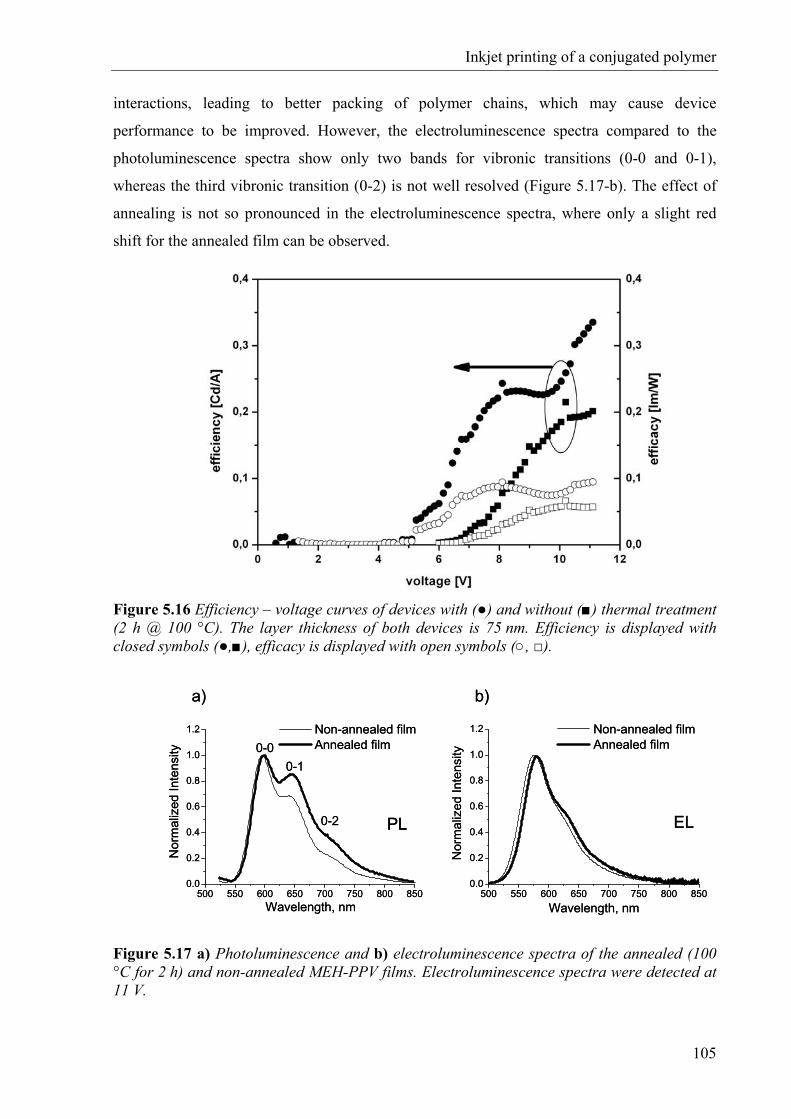
Inkjet printing of a conjugated polymer
105
interactions, leading to better packing of polymer chains, which may cause device
performance to be improved. However, the electroluminescence spectra compared to the
photoluminescence spectra show only two bands for vibronic transitions (0-0 and 0-1),
whereas the third vibronic transition (0-2) is not well resolved (Figure 5.17-b). The effect of
annealing is not so pronounced in the electroluminescence spectra, where only a slight red
shift for the annealed film can be observed.
Figure 5.16 Efficiency – voltage curves of devices with () and without () thermal treatment (2 h @ 100 °C). The layer thickness of both devices is 75 nm. Efficiency is displayed with closed symbols (,), efficacy is displayed with open symbols (, ).
500 550 600 650 700 750 800 8500.0
0.2
0.4
0.6
0.8
1.0
1.2
PL0-2
0-10-0
Wavelength, nm
Nor
mal
ized
Inte
nsity
Non-annealed film Annealed film
a) b)
500 550 600 650 700 750 800 8500.0
0.2
0.4
0.6
0.8
1.0
1.2
EL
Wavelength, nm
Nor
mal
ized
Inte
nsity
Non-annealed film Annealed film
500 550 600 650 700 750 800 8500.0
0.2
0.4
0.6
0.8
1.0
1.2
PL0-2
0-10-0
Wavelength, nm
Nor
mal
ized
Inte
nsity
Non-annealed film Annealed film
a) b)
500 550 600 650 700 750 800 8500.0
0.2
0.4
0.6
0.8
1.0
1.2
EL
Wavelength, nm
Nor
mal
ized
Inte
nsity
Non-annealed film Annealed film
Figure 5.17 a) Photoluminescence and b) electroluminescence spectra of the annealed (100 °C for 2 h) and non-annealed MEH-PPV films. Electroluminescence spectra were detected at 11 V.

Chapter V
106
It was found that the thickness of the active layer is another key parameter and therefore
MEH-PPV solutions with different dot spacings were printed onto ITO coated substrates
(Figure 5.18).
Figure 5.18 Luminance and current density against voltage a) and efficiency – voltage curves b) of devices with various layer thicknesses of the EML. The layer thickness is around 95 nm (), 75 nm () and 60 nm (), respectively. The luminous efficiency is displayed with solid symbols (, , ,) efficacy with open symbols (, , ∆).

Inkjet printing of a conjugated polymer
107
It is clearly seen from Figure 5.18 that thinner devices have a significantly improved
device performance compared to the devices with a thicker active layer. This can be ascribed
to the stronger electric field in the thinner active layer. This increased electric field facilitates
a hole injection and thus increases the current density. However, layer thicknesses below 60
nm resulted in a very poor device performance and are therefore not discussed further.
Figure 5.18-a shows brightness and current density plotted against voltage, and in
Figure 5.18-b the efficiency and power efficiency are displayed as a function of the applied
voltage. The luminous density of the inkjet printed devices increases with decreased layer
thickness and reaches a maximum at 60 nm with a maximum brightness of 3,200 Cd/m² @ 10
V. Furthermore, the onset voltages were noticeably lower and consequently the power
efficiencies are much higher for the thin film devices.
5.7 Conclusions MEH-PPV solutions prepared from solvents with different vapour pressures were processed
by inkjet printing. Obtaining stable droplets from solutions with a low concentration (2.5
mg/mL) was successful, except when extremely low-boiling solvents such as THF were used.
It was found that for higher concentrations (5-7 mg/mL) the undesired influence of
aggregation on the printability can be minimised by utilising an ultrasonication treatment.
However, there were still some physically interacted chains remaining in the solutions,
particularly in toluene and o-xylene, as has been proven by viscosity and emission
measurements. When toluene was used as the solvent, films with a homogenous thickness
distribution were obtained because of the interchain interactions in the solution and toluene’s
higher contact angle. It was also found that an increase in printhead velocity led to further
improvement of the film surface homogeneity. Stable lines can be printed for fairly wide dot
spacings by increasing the velocity of the printhead. Films obtained from toluene and
chlorobenzene revealed a smooth surface as shown by AFM. In addition, the local I-V
characteristics of the film of MEH-PPV printed from toluene solution could be reproducibly
measured. The detected current value at a certain voltage passed through the film printed from
toluene was lower than that of a film printed from chlorobenzene due to differences in the
film thicknesses.
The inkjet printing of large area MEH-PPV films has been successfully performed using
a toluene/o-dichlorobenzene solvent mixture. The thickness of the printed layers was
controlled by either varying the concentration of the MEH-PPV solution or by varying the

Chapter V
108
density of the deposited droplets. The performances of the spin-coated and the inkjet printed
devices were compared and influences of thermal treatment and layer thickness on the inkjet
printed devices were investigated. Although the onset voltages of the inkjet printed device
were comparable to the spin-coated device (in the case of similar thicknesses), the efficiency
of the inkjet printed device was higher. This efficiency could be ascribed to the lower polymer
concentration of the printed solution since in more concentrated solutions aggregation of the
conjugated polymer chains tends to increase, which can lead to poorer device performance.
The performance of the inkjet printed devices was found to strongly depend on layer
thickness and thermal treatment. An improvement of the efficiency for the inkjet printed
device from 0.12 Cd/A up to 0.38 Cd/A and a significantly decreased onset voltage could be
achieved by optimised thickness and annealing.
5.8 Experimental section
Materials MEH-PPV (Mn = 40,000-70,000 g/mol), chlorobenzene (99%) and o-xylene (97%) were purchased from Aldrich (Steinheim, Germany). Toluene and tetrahydrofuran (THF) were obtained from Biosolve (Valkenswaard, The Netherlands). Polyethylenedioxy-thiophene:polystyrene sulfonate (PEDOT:PSS) (dispersion in water) was purchased from H.C. Stark GmbH (Leverkusen, Germany). All chemicals were used without further purification. Microscopic slides (3 × 1 inch) from Marienfeld (Lauda-Königshofen, Germany) were used as substrates. To measure I-V characteristics using AFM, the substrates were prepared on ITO coated glass slides from Präzisions Glass & Optik GmbH (Iserlohn, Germany).
Instrumentation For the printing experiments an Autodrop system (Microdrop Technologies, Norderstedt, Germany) was used. The diameter of the micropipette nozzle is 70 µm. For details see Chapter 1.
Surface analysis was performed using an optical profilometer (Fogale Zoomsurf, France). The setup was used to measure the thicknesses of the printed MEH-PPV patterns. When a red light source is employed, the vertical resolution of the measurements is 1 nm. For the case of white light the vertical resolution is 7 nm with a horizontal resolution of 150 nm. Atomic force microscopy (NTegra, NT-MDT, Russia) was used to investigate film morphologies utilising Si cantilevers (NSG 11,NT-MDT, Russia) and current-voltage characteristics (I/V spectroscopy) using conductive TiN (titanium nitrate) coated tips (NSG01/TiN). The biased sample consisted of indium tinoxide (ITO) coated with polyethylenedioxy-thiophene:polystyrenesulfonate (PEDOT:PSS) followed by MEH-PPV as active layer. The bias was maximal restricted to voltages at -8 V to + 8 V. The conducting TiN cantilever was grounded.
Gel permeation chromatography (GPC) was measured on a Shimadzu system equipped with a SCL-10A system controller, a LC-10AD pump, a RID-10A refractive index detector and a Polymer Laboratories Mixed-D column utilising a chloroform / triethylamine /

Inkjet printing of a conjugated polymer
109
isopropanol (93/5/2) mixture as eluent at a flow rate of 1 mL/min. The calibration was performed utilising linear poly(styrene) standards.
A UV-Vis/fluorescence plate reader (Flashscan 530) from AnalytikJena (Jena, Germany) was utilised to measure the respective fluorescence spectra of the MEH-PPV solutions. All spectra were referenced to an empty sample plate. The measurements were performed in the four point detection mode.
A Branson 2510 ultrasonic bath (Danbury, USA) was used for ultrasonication of the MEH-PPV solutions.
PEDOT:PSS dispersion was spin-coated onto the glass slides at 1500 rpm (for 180 s) using a spin-coater from Headway Research.
Viscosity measurements. Viscosities of MEH-PPV solutions were measured using an Ubbelohde viscometer (Schott, 538/10, Mainz, Germany). Device Fabrication and characterisation MEH-PPV was spin-coated or inkjet printed onto patterned, pre-cleaned indium tin oxide (ITO)-coated glass substrates. The concentrations of the utilised solutions for inkjet printing and spin-coating were 4 mg/mL and 9 mg/mL, respectively. The preparation of the active layers did not take place under inert conditions and therefore water condensation on the film surface cannot be excluded. The cathode, consisting of a 4 nm thin layer of Ca and an Ag layer (150 nm), was deposited by thermal evaporation at a base pressure of 10-6 mbar. The device characterisation was done with a Keithley 2400 source meter, a calibrated photodiode and an Ocean Optics SD2000 CCD spectrometer under argon atmosphere.

Chapter V
110
5.9 References
1 F. Hide, M.A. Dias-Garcia, B.J. Schwartz, A.J. Heeger, Acc. Chem. Rec. 1997, 30, 430.
2 D.D.C Bradley, Adv. Mater. 1992, 4, 756.
3 D. Braun, A.J. Heeger, Appl. Phys. Lett. 1991, 58, 1982.
4 D. Braun, A.J. Heeger, H. Kroemes, J. Electron. Matter. 1991, 20, 945.
5 S.A. Arnautov, E.M. Nechvolodova, A.A. Bakulin, S.G. Elizarov, A.N. Khodarev, D.S.
Martyanov, D.Y. Paraschuk, Synth. Met. 2004, 147, 287.
6 F. Wudl, P.M. Alleman, G. Srdanov, Z. Ni, D. McBranch, ACS Symp. Ser. (Ed. S. R.
Marder, G.D. Stucky, J.E. Sohn), 1991, 455, 683.
7 A. Mehta, P. Kumar, M.D. Dadmun, J. Zheng, R.M. Dickson, T. Thundat, B.G.
Sumpter, M.D. Barnes, Nano Lett. 2003, 3, 603.
8 P. Kumar, A. Mehta, M.D. Dadmun, J. Zheng, L. Peyser, A.P. Bartko, R.M. Dickson, T.
Thundat, B.G. Sumpter, D.W. Noid, M.D. Barnes, J. Phys. Chem. B 2003, 107, 6252.
9 C.-C. Chang, C.-L. Pai, W.-C. Chen, S. A. Jenekhe, Thin Solid Films 2005, 479, 254.
10 T.-Q. Nguyen, I.B. Martini, J. Liu, B.J. Schwartz, J. Phys. Chem. B 2000, 104, 237.
11 T.-Q. Nguyen, R.C. Kwong, M.E. Thompson, B.J. Schwartz, Appl. Phys. Lett. 2000, 76,
2454.
12 C.J. Collison, L.J. Rothberg, V. Treemaneekarn, Y. Li, Macromolecules 2001, 34, 2346.
13 R.F. Cossiello, L. Akcelrud, T.D.Z. Atvars, J. Braz. Chem. Soc. 2005, 16, 74.
14 J. Bharathan, Y. Yang, Appl. Phys. Lett. 1998, 72, 2660.
15 T.R. Hebner, C.C. Wu, D. Marcy, M.H. Lu, J.C. Sturm, Appl. Phys. Lett. 1998, 72, 519.
16 B.S-C. Chang, J. Liu, J. Bharathan, Y. Yang, J. Onohara, J. Kido, Adv. Mater. 1999, 11,
734.
17 K. Cheng, M.-H. Yang, W.W.W. Chiu, C.-Y. Huang, J. Chang, T.-F. Ying, Y. Yang
Macromol. Rapid. Commun. 2005, 26, 247.
18 R.F. Service, Science 2004, 304, 675.
19 B.-J. de Gans, P.C. Duineveld, U.S. Schubert, Adv. Mater. 2004, 16, 204.
20 E. Holder, B.M.W. Langeveld, U.S. Schubert, Adv. Mater. 2005, 17, 1109.
21 Y. Yoshioka, P.D. Calvert, G.E. Jabbour, Macromol. Rapid. Commun. 2005, 26, 238.
22 J. Wang, M. M. Mohebi, J.R.G. Evans, Macromol. Rapid. Commun. 2005, 26, 304.
23 C.F. Madigan, T.R. Hebner, J.C. Sturm, Mat. Res. Soc. Symp. Proc. 2000, 625, 123.
24 T. Shimoda, K. Morii, S. Seki, H. Kiguchi, MRS Bulletin 2003, 28, 821.

Inkjet printing of a conjugated polymer
111
25 R.D. Deegan, O. Bakajin, T.F. Dupont, G. Huber, S.R. Nagel, T.A. Witten, Nature
1997, 389, 827.
26 S. Natarajan, A. Ingle, R. Gupta, US Patent Application, 2005, 67949A1.
27 P.J. Lyon, J.C. Carter, J.C. Bright, M. Cacheiro, WO Patent, 2002, 69119A1.
28 B.-J. de Gans, U.S. Schubert, Langmuir 2004, 20, 7789.
29 T.-F. Guo, F.-S. Yang, Z.-J. Tsai, T.-C. Wen, S.-N. Hsieh, Y.-S. Fu, Appl. Phys. Lett.
2005, 87, 013504.
30 J. Liu, Y. Shi, L. Ma, Y. Yang, J. Appl. Phys. 2000, 88, 15.
31 S.H. Kwon, S.Y. Paik, J.S. Yoo, Synth. Met. 2002, 130, 55.
32 S. Sinha, A.P. Monkman, J. Appl. Phys. 2003, 93, 5691.
33 T.-Q. Nguyen, R.C. Kwong, M.E. Thompson. B.J. Schwartz, Synth. Met. 2002, 119,
523.
34 L.C. Lin, H.F. Meng, J.T. Shy, S.F. Horng, L.S. Yu, C.H. Chen, H.H. Liaw, C.C.
Huang, K.Y. Peng, S.A. Chen, Phys. Rev. Lett. 2003, 90, 036601.
35 B.-J. de Gans, L. Xue, U.S. Agarwal, U. S. Schubert, Macromol. Rapid. Commun. 2005,
26, 659.
36 I.B. Martini, A.D. Smith, B.J. Schwartz, Phys. Rev. B. 2004, 69, 35204.
37 S.H. Chen, A.C. Su, C.S. Chang, H.L. Chen, D.L. Ho, C.S. Tsao, K.Y. Peng, S.A. Chen,
Langmuir 2004, 20, 8909.
38 J. Brandrup, E.H. Immergut, E.A. Grulke, Polymer Handbook, Fourth Edit.1999, John
Wiley & Sons.
39 R.D. Deegan, Phys, Rev. E 2000, 61, 475.
40 P.C. Duineveld, J. Fluid Mech. 2003, 477, 175.
41 H.-Y. Ko, J. Park, H. Shin, J. Moon, Chem. Mater. 2004, 16, 4212.
42 D.B.A. Rep, A.F. Morpurgo, T.M. Klapwijk, Org. Electron. 2003, 4, 201.
43 E. Tekin, E. Holder, V. Marin, B.-J. de Gans, U.S. Schubert, Macromol. Rapid
Commun. 2005, 26, 293.
44 L.G. Yang, Q.H. Zhang, W. Peng, T.C. Huang, L.C. Zeng, P.F. Gu, X. Liu, J. Lumin.
2005, 114, 31.

Chapter VI
Film thickness and side chain effects on the optical properties of poly(p-phenylene-ethynylene)-alt-poly(p-
phenylenevinylene)s (PPE-PPV) derivatives
Abstract Parallel investigations into the influences on the emission colour of π-conjugated polymers by
varying side chains and film thicknesses have been performed. The respective thickness
libraries of six different alkoxy-substituted poly(p-phenylene-ethynylene) -alt-poly(p-
phenylenevinylene)s (PPE–PPVs) were prepared by inkjet printing. It was found that the
emission colours of the investigated polymers strongly depend on the inter-chain interactions
which are increased with increasing film thickness and influenced by the side chains. To
elucidate the side chain effect, new PPE-PPV derivatives, whose alkoxy side chains were
systematically varied in length, were synthesised and their optical properties were screened.
Investigations into the photophysical revealed that longer side chains cause red-shift in the
emission colours of the PPE-PPVs. Furthermore thermal behaviour of the polymers were
studied.
Part of this chapter has been published: E. Tekin, H. Wijlaars, E. Holder, D.A.M. Egbe, U.S. Schubert, J. Mater. Chem. 2006, 16, 4294; E. Tekin, D.A.M. Egbe, C. Ulbricht, S. Rathgeber, E. Birckner, N. Rehmann, K. Meerholz, U.S. Schubert (in preparation).

Chapter VI
114
6.1 Introduction
Tremendous progress has been made in the design, synthesis, and detailed studies of
properties and applications of π-conjugated polymers,1,2 since the initial discovery of
electrical conductivity in doped polyacetylene by Shirakawa et al.3-5 The initial problem of
insolubility of the polymers has been thoroughly addressed by introducing flexible alkyl
and/or alkoxy side groups in poly(p-phenylenevinylene)s,6-8 poly(p-phenylene)s,9-14 poly(p-
phenylene-ethynylene)s15-19 and polythiophenes.20-23 Alkoxy side chains, attached to the
backbone of conjugated polymers, do not only enhance their solubility and subsequently their
processability into thin films for various applications, but can also lead to remarkable changes
in optical, electronic and transport properties of conjugated polymers in the solid state.24-26 For
instance, four-fold alkoxy-substituted poly(p-phenylene-ethynylene)-alt-poly(p-phenylene-
vinylene)s (PPE-PPVs) have tunable optoelectronic properties and thus variable emission
colour (green to red) due to the cooperative effects of grafted alkoxy side chain R1 on the
PPE-segment and R2 on the PPV-segment as depicted in Figure 6.1.27,28
OCnH2n+1
H2n+1CnO
OCn'H2n'+1
H2n'+1Cn'O n
Pn/n'
R1
R2
Figure 6.1 General chemical structure of the PPE-PPVs.
This chapter reports on the effects of side chains and film thickness on the optical
properties of different derivatives of PPE-PPVs. In the first part of the chapter, the effect of
thickness and annealing on the photophysical properties of thin films of the selected PPE-
PPVs, whose chemical structures and molecular-weights are presented in Table 6.1, are
discussed. Inkjet printing was used to prepare thickness libraries of the thin films.
The second part of the chapter presents the synthesis and characterisation of the series
of polymers Pn/n’ with the goal to elucidate the dependency of the photophysical properties
on the length of the side chain attached to the PPE segment. For this reason, R2 = octyloxy (n’
= 8) was kept constant and the length of R1 = OCnH2n+1, was varied with n = 12, 13, 14, 15,
16, 17, 18 and 19. Subsequently, the resulting polymers were successfully processed via inkjet

Thickness and side chain effects on the optical properties of PPE-PPVs
115
printing into thin films. The absorption and photoluminescence spectra and relative as well as
absolute fluorescence quantum yields of the polymers in solutions and in the solid state have
been measured. Furthermore, differential scanning calorimetry (DSC) measurements were
carried out to study the correlation between photophysical and thermal behaviours of the
synthesised polymers. Finally, PLEDs with the following device architecture:
ITO//PEDOT:PSS//PPE-PPV//Ca//Ag have been fabricated using spin-coating or inkjet
printing and the performance of both types were tested.
Table 6.1 Investigated PPE-PPVs and their molecular weights.
Sample Pn/n’ Mn (g/mol) Mw (g/mol) 1 P8/18 50,000 156,900 2 P18/8 38,400 192,700 3 P18/7 41,000 215,000 4 P18/16 43,200 262,800 5 P18/12 10,200 39,400 6 P12/12 25,600 240,000
6.2 Film thickness dependency of the emission colours of PPE–PPVs in inkjet printed libraries To perform optical studies solutions of the polymers shown in Table 6.1 were deposited in
rectangular films (5 × 5 mm) on glass substrates. A toluene/o-dichlorobenzene (90/10 v/v)
mixture was used as the solvent as suggested in the previous chapter. The glass substrates
were treated with chloroform to obtain a slightly hydrophobic surface which assisted in the
confinement of the deposited solution to a certain area and shape. The measured contact angle
of water on this substrate was 34 ± 1o. Consequently, without application of any other
treatment, well-defined thin films were successfully printed on the glass substrate. Thickness
libraries were obtained by printing the six different solutions with varied dot spacing from
180 to 80 µm, which yields to thickness variations from approximately 50 to 150 nm (Figure
6.2).
In Figures 6.3 and 6.4, the absorption and emission spectra of the PPE-PPV thin film
libraries (before annealing) are presented, respectively. Emission spectra of the libraries were
recorded after excitation at the wavelength of the maximum of the main absorption band (450
nm). Data from the absorption and emission spectra are summarised in Table 6.2, namely the
absorption maxima, λmax, abs, the optical band gap energy, Egopt,25 the emission maxima,
λmax,em, and the ratios between the intensities of the 0-1 and 0-0 vibronic transitions, I0-1/I0-0, as
well as between the 0-2 and 0-1 vibronic transitions, I0-2/ I0-1.

Chapter VI
116
Figure 6.2 The optical appearance of the inkjet printed PPE-PPV thin film libraries under UV illumination (wavelength: 390 nm). Each row displays images of a different derivative of PPE-PPVs (as shown in Table 6.1), printed with varying thickness from approximately 50 (column a) to 150 nm (column f, for exact thicknesses see Table 6.2). a) Before annealing, b) after annealing at 70 oC for two hours in air.
The intensities of all the absorption bands increase with increasing thicknesses, as
expected. Well-resolved absorption bands consisting of a maximum peak around 450 nm and
a second peak (or shoulder) of lower intensity around 480 nm were observed when the film
thickness exceeds 65 nm. The observed band splitting can be assigned to various contribution
of H-(450 nm) and J-aggregates (480 nm).29,30 Average band-gap energy of about 2.40 eV
was obtained for all the samples, with the lowest Egopt-values obtained for the polymer 2
(2.37 eV).
In the vertical direction of the library (Figure 6.2-a), the influence of side alkoxy chains
to the emission colours can be seen while in the horizontal direction the effect of thickness is
apparent. Polymers 1 and 2 are decorated with the same side groups but in exchanged
positions. This slight difference results in significant changes in emission colour and spectra.
While the main emission peak of polymer 1 is at 541 nm (0-1 transition band), polymer 2 has
a main band at 607 nm (0-2 transition band). There is a significant correlation between the
red-shift of the photoluminescence (PL) colour and the intensity of the 0-2 vibrational
transition band. The higher the I0-2 /I0-1 ratio the more red-shifted is the emission colour, e.g.
compare samples 1f (I0-2 /I0-1: 0.44), 2f (I0-2 /I0-1: 1.40) and 4f (I0-2 /I0-1: 0.85). This is an
indication of the higher contribution of the excimer or aggregate emission resulting from very
strong π-π intermolecular interactions for polymers 2 and 4.

Thickness and side chain effects on the optical properties of PPE-PPVs
117
Table 6.2 The absorption and emission data are given for the non-annealed films: the absorption maxima, λmax, abs, the optical band gap energy, Eg
opt, the emission maxima, λmax, em, and the ratios between the intensities of the 0-1 and 0-0 vibronic transitions, I0-1 /I0-0, as well as between the 0-2 and 0-1 vibronic transitions, I0-2/ I0-1.
Sample Thickness (nm)
λmax, abs. (nm)
Egopt (eV)
λmax, em. (nm)
I0-1/I0-0 I0-2/I0-1
1a 44 - - 508, 543, sh 590 0.82 0.46 1b 60 452, sh 480 2.40 508, 543, sh 590 0.90 0.49 1c 65 452, sh 480 2.40 510, 543, sh 590 0.94 0.51 1d 90 452, sh 479 2.43 510, 543, sh 590 1.14 0.42 1e 118 452, sh 479 2.43 510, 543, sh 590 1.27 0.43 1f 150 452, sh 479 2.42 510, 543, sh 590 1.27 0.44 2a 50 - - 507, 543, 606 1.15 0.91 2b 63 453 2.37 509, 543, 606 1.40 1.14 2c 70 452 2.37 sh 510, sh 543, 607 1.75 1.40 2d 100 452 2.38 sh 510, sh 546, 607 2.03 1.40 2e 122 452 2.38 sh 510, sh 548, 606 2.50 1.41 2f 145 452 2.36 sh 510, sh 550, 606 2.68 1.40 3a 54 - - 506, 539, sh 587 0.89 0.48 3b 66 395, sh 479 2.43 508, 539, sh 587 0.92 0.50 3c 72 403, sh 479 2.42 509, 541, sh 588 0.95 0.50 3d 85 443, sh 478 2.43 510, 541, sh 588 1.01 0.56 3e 140 445, sh 478 2.43 511, 541, sh 589 1.13 0.56 3f 165 446, sh 478 2.43 511, 541, sh 589 1.14 0.54 4a 50 - - sh 511, 541, sh 576 1.37 0.72 4b 58 431, sh 479 2.40 sh 511, 541, sh 576 1.54 0.78 4c 68 454, sh 479 2.40 sh 511, 541, sh 576 1.80 0.83 4d 93 453, sh 479 2.41 sh 511, 542, sh 576 1.89 0.83 4e 115 453,sh 479 2.41 sh 511, 543, sh 576 2.18 0.87 4f 152 453, sh 479 2.40 sh 511, 543, sh 577 2.30 0.85 5a 52 - - 507, 541, sh 580 0.98 0.51 5b 63 407, sh 480 2.40 509, 541, sh 580 1.09 0.63 5c 69 452, sh 476 2.40 sh 512, 541, sh 580 1.26 0.68 5d 96 451, sh 476 2.41 sh 512, 542, sh 580 1.29 0.66 5e 125 449, sh 475 2.41 sh 512, 542, sh 580 1.42 0.66 5f 155 449, sh 475 2.41 sh 512, 542, sh 580 1.50 0.66 6a 50 - - 508, 540, sh 583 1.09 0.54 6b 60 454, sh 480 2.39 510, 540, sh 583 1.23 0.57 6c 65 455, sh 480 2.38 511, 540, sh 582 1.26 0.62 6d 87 453, sh 476 2.41 sh 511, 540, sh 582 1.52 0.53 6e 100 453, sh 476 2.41 sh 511, 540, sh 582 1.62 0.58 6f 125 451, sh 475 2.41 sh 511, 540, sh 582 1.61 0.60

Chapter VI
118
Figure 6.3 The absortion spectra of the inkjet printed libraries (see Figure 6.2-a) before annealing.
Figure 6.4 The photoluminescence spectra of the inkjet printed libraries (see Figure 6.2-a) before annealing.
In almost all cases for very thin films (with thickness less than and equal to 65 nm,
before annealing), the resolved emission spectra contain three peaks namely 0-0, 0-1 and 0-2
vibrational transition peaks. The ratio of the I0-1 /I0-0 increases with the increasing thickness of

Thickness and side chain effects on the optical properties of PPE-PPVs
119
the films. This is because of the re-absorption effect of the thicker layers. It is particularly
pronounced in the case of polymers 2 and 4, where the ratio increases from 1.15 to 2.68 and
from 1.37 to 2.30, respectively. There is also a clear increase in the I0-2/I0-1 ratio with
increasing thickness. The shifting of the emission colour from blue to orange is very
significant for the thickness library of polymer 2, which is caused by a superposition of the 0-
2 vibrational transition with an excimer emission. This denotes that the greater the thickness
the higher the influence of the inter-chain interactions is since the number of interacting
chains has increased.31 Therefore, the shift in the PL colour and PL spectra can be based on
the different organisations of the polymer chains in different thicknesses.
Figure 6.5 The photoluminescence spectra of the inkjet printed libraries (see Figure 6.2-b) after annealing at 70 ˚C for 2 hours in air.
As can be seen from Figure 6.2-b, after annealing the libraries at 70 ˚C for two hours in
air the emission, especially from the thick films, turns into white. The white emission is a
result of the broader emission spectra; approximately between 400 and 700 nm (Figure 6.5). It
is especially pronounced for the thick film of polymer 2 covering almost the whole visible
region of the light spectrum. This could be due to the reorganisation of the polymer chains
upon heating. It causes a decrease of the fluorescence intensity (as compared to the non-
annealed film). The reason of this behaviour needs more detailed investigations about the
changes in the morphology and the photo-physical properties of the polymers upon annealing.

Chapter VI
120
6.3 Synthesis and characterisation of PPE-PPVs having alkoxy side chains in varied length
In literature, it has been shown that the polymer P18/8 with side chains R1 = octadecyl and
R2 = octyl27,32-35 is very distinct in its solid-state properties (i.e. orange colour and broad
emission).36,37 To check whether similar photophysical behaviour as in P18/8 could be
reproduced if other side chain combinations are used, two series of polymers of type Pn/n′
were synthesised and investigated. In the first series, R1 = OC18H37 whilst R2 = OCn’H2n’+1
was varied with n = 4, 5, 6, 7, 8, 9, 10, 12, 14, 16, 18 (from butyloxy to hexadecyloxy).38 As
can be seen in Figure 6.6, all the polymers P18/n’ except P18/8 exhibit well-structured
intense emission spectra and reveal a yellow colour in the solid state.
400 500 600 700 8000
1000
2000
3000
4000
Inte
nsity
(a. u
.)
n'=18
n'=16
n'=14
n'=12
n'=10
n'=9
n'=8
n'=7
n'=6
n'=5
n'=4
Wavelength, nm
Figure 6.6 The photoluminescence spectra of the polymer films of P18/n’ (n’ = 4-18).
In the second series (from literature), the difference of ten methylene units between R1
and R2 was kept constant and the series of P(n’+10)/n’ (where n’ = 6, 7, 8, 9) was synthesised
and characterised.36 It was found that bulk samples of the polymers bearing even number of
carbon atoms, i.e. P16/6 and P18/8 were orange-red in colour, while their odd-numbered
counterparts P17/7 and P19/9 were yellow. Despite the similarity of bulk colour, P16/6 (λa =
458, 482 nm, λf = 556, Φf = 65%) and P18/8 (λa = 456, 614 nm, λf = 614, Φf = 24%) show
differences in the thin film emissive behaviour.36 This part of the chapter presents the third
series of PPE-PPVs; Pn/8 with n = from 12 to 19.

Thickness and side chain effects on the optical properties of PPE-PPVs
121
6.3.1 Synthesis of polymers Pn/8 The polymers Pn/8, were obtained via the Horner-Wadsworth-Emmons olefination reaction
of 1,4-bis-(4-formylphenylethynyl)-2,5-dialkoxybenzene (1-n) and 2,5-dioctyloxy-p-
xylylene-bis(diethylphosphonate) (2) (as shown in Scheme 1) based on a synthetic protocol
described elsewhere.24-27,36 The reaction time was kept below 30 minutes in order to avoid
insoluble products.36 Data from GPC (polystyrene standard, THF as eluent), yield and colour
of the products are given in Table 6.3.
OCnH2n+1
H2n+1CnO
OC8H17
H17C8O n
n = 12-19
+ (EtO)2OPCH2 CH2PO(OEt)2
OC8H17
H17C8O
t-BuOK
toluene, 15- 30 min, reflux
H2n+1CnO
OHC CHO
1-n 2
Pn / 8
OCnH2n+1
Scheme 1. Schematic representation of the synthesis of PPE-PPVs.
Table 6.3 GPC data, yields and the bulk colour of the polymers.
Polymer Mn PDI DP Yield (%) Bulk colourP12/8 20,500 5.2 20 26 yellow P13/8 19,050 2.9 18 50 yellow P14/8 42,600 6.0 39 50 yellow P15/8 27,100 3.1 24 52 yellow P16/8 21,800 2.4 19 60 orange P17/8 27,700 2.8 24 20 orange P18/8 11,060 3.0 10 60 orange P19/8 31,800 2.9 26 50 orange
The synthesised polymers exhibit number-average molecular weights (Mn) between
11,000 and 43,000 g/mol (degree of polymerisation (DP) ~10-40) and polydispersity indexes
between 2 and 6, as expected from this type of polycondensation reaction.25 The polymers
from P12/8 to P15/8 are yellow in colour while the polymers with longer side chains from
P16/8 to P19/8 are orange as exemplified in Figure 6.7. The polymers Pn/8 where n is greater

Chapter VI
122
than 15 have better solubility compared to the ones with longer side chains. Therefore, this
improved solubility makes them more suitable for use in inkjet printing while the polymers
with short side chains caused nozzle clogging from time to time during printing.
Figure 6.7. Visual colours of the polymeric bulk materials.
6.3.2 Thermal behaviour The DSC thermograms presented in Figure 6.8 show the data obtained during the first cooling
(top) and second heating runs (bottom). The cooling runs reveal that the samples undergo an
exothermic transition in a temperature range between 350 K and 390 K. The transition
temperatures obtained from the peak positions are summarised in Table 6.4. The samples with
n = 12, 13 and 16 to 18 show pronounced peaks at the crystallisation transition. The peaks for
the samples n = 16-18 are rather sharp, but the samples n = 12 and 13 exhibit highly
asymmetric peaks with a rather extended tail on the low temperature side. The disorder-order
transitions in the samples n = 14, 15 and 19 are much less pronounced and in comparison to
the other samples systematically shifted (∆T ≈ 20 K) to lower temperatures.
In agreement to results in the literature obtained for Pn/n’ where n’ was changed but n
was kept fixed to 18,38 it can be concluded that the disorder-order phenomenon is strongly
connected to the alkoxy group length attached to the phenylene rings. However, in contrast to
the previous reports no clear conclusion can be drawn that longer alkoxy groups enhance the
crystallisation ability. In literature, the experiments were performed with rather long alkoxy
units (n = 18) attached to the PPE segment. By increasing n’ from 4 to 16 a more symmetric
architecture is achieved, which also might be advantageous for crystallisation. Here, n’ = 8
(attached to the PPV) is rather low and increasing n (attached to the PPE) from 12 to 19 leads
to even more asymmetric architectures. The cooling and heating runs for samples with n
greater than 15 exhibit an additional crystallisation (exothermic peak) and melting

Thickness and side chain effects on the optical properties of PPE-PPVs
123
(endothermic peak) transition at temperature below 320 K, respectively. In fact, this is more
an indication that longer alkoxy groups are obstructive for reorganisation. In the heating runs
the endothermic peaks of the order-disorder transition are systematically shifted to higher
temperatures (∆T ≈ 35 K) compared to the exothermic peaks observed in the cooling runs.
The heating runs clearly reveal a two-step order-disorder transition separated by about ∆T ≈
30 K for the samples with n = 12, 13, 16-18. Those samples showed a pronounced peak at the
crystallisation transition in the cooling run. The transition temperatures are summarised in
Table 6.4. The Pn/8 polymers where n = 14, 15, 19 with less pronounced peaks in the cooling
run exhibit a single-step order-disorder transition in the heating run. The transition
temperatures of these transitions correspond to the lower temperature transition observed for
the Pn/8 with n = 12, 13, 16-18.
300 320 340 360 380 400 420 440 4600.3
0.4
0.5
0.6
0.7
0.8
0.9
P13/8P12/8
P14/8P15/8P16/8P17/8P18/8
P19/8
dH/d
t [W
/g]
temperature [K]
320 340 360 380 400 420 440 460-0.8
-0.7
-0.6
-0.5
-0.4
-0.3
P13/8
P12/8
P14/8P15/8P16/8P17/8P18/8
P19/8
dH/d
t [W
/g]
temperature [K]
Figure 6.8 DSC thermograms recorded for the samples P12/8 to P19/8 during first cooling (top) and second heating run (bottom) with a rate of 10 K/min. Data are vertically shifted for better visualisation.

Chapter VI
124
In conclusion, the mesophase formation is strongly connected to the alkoxy group
length attached to the phenylene rings. For some of the samples a two-step transition was
observed. There is no clear evidence that longer alkoxy groups are advantageous for
crystallisation but rather there are indications that longer alkoxy groups are obstructive for
reorganisation.
Table 6.4 Summary of the transition temperatures obtained from the peak positions in the first cooling and second heating run for all samples.
sample 1st cooling run 2nd heating run transition temperature (K)
P12/8 380 404 380 P13/8 367 408 378 P14/8 358 - 382 P15/8 360 - 396 P16/8 371 416 387 P17/8 376 420 395 P18/8 376 420 383 P19/8 366 - 396
6.3.3 Photophysical investigations The photophysical data obtained from dilute chloroform solutions of the polymers Pn/8 are
shown in Table 6.5, namely, the absorption maximum λa, the optical band gap energy, Egopt,25
the emission maximum λf, fluorescence quantum yield, Φf . The corresponding absorption and
emission spectra are shown in Figure 6.9. As expected,36 all the polymers show similar
photophysical behaviour in dilute chloroform solution. Their main absorption band is located
around 450 nm and the main emission band at 490 nm. Very high relative and absolute Φf
values (~70%) were obtained. In the PL spectra, a slight increase of the intensity of the
shoulder band at 520 nm is observed with increasing n. This could be due to the inter-chain
interactions which are more pronounced in solid state as explained in the next part.
The influence of the side chain length (n) becomes obvious in the solid state
photophysical behaviour. Figure 6.10 presents the absorption and PL spectra of the thin
polymer films inkjet printed on glass substrates. Due to the enhanced planarisation of the
conjugated backbone, there is a red-shift of both the absorption and PL spectra in thin films
relative to those in solutions. While the main absorption band was around 450 nm for the
polymers Pn/8, n = 16, 17, 18; the absorption band of the polymers where n = 12, 13, 14, 15
and 19 consist of two maxima were around 450 and 480 nm. Optical band gap values
calculated from absorption spectra are approximately 2.40 eV. It is obvious in Figure 6.10 that

Thickness and side chain effects on the optical properties of PPE-PPVs
125
the polymers with short side chains (n = from 12 to 15) exhibit relatively narrow PL spectra,
whereas the polymers with longer side chains have very broad emission spectra and their
maximum emission wavelength are approximately 50 nm red-shifted.
Table 6.5 Absorption and emission data of the polymers in dilute chloroform solutions.
Polymer (in solution) λa Eg
opt λf I0-1/ I0-0 Φf
(relative, %) P12/8 450 2.54 489, 520 0.52 70 P13/8 450 2.54 489, 520 0.52 71 P14/8 450 2.54 489, 520 0.50 74 P15/8 450 2.54 489, 520 0.53 68 P16/8 450 2.53 489, 520 0.52 62 P17/8 450 2.53 489, 520 0.56 70 P18/8 450 2.54 490, 520 0.55 74 (70*) P19/8 450 2.54 490, 520 0.60 70
*Absolute measurement.
As expected, absolute fluorescence quantum yields of the polymers in thin films are
lower than those in solutions due to the enhanced intermolecular interactions. Absolute Φf
measurements using two different experimental set-up exhibited comparable values (Table
6.6). The visual colour of the bulk polymers (Figure 6.7) reflects the differences of the
emission spectra for the polymers with different side chains. It is suggested that longer side
chains allow better packing of the conjugated backbone and therefore enhanced π-π
interaction, which leads to a red-shift of the emission spectra.
Table 6.6 Absorption and emission data of the polymers in thin films.
Polymer (in thin film) λa Eg
opt (eV) λf Φf
a
(absolute, %) Φf
b
(absolute, %)
P12/8 453, 479 2.38 sh510, 540, sh574 18 16
P13/8 455, 482 2.42 sh512, 543, sh580
18 -
P14/8 453, 478 2.42 507, 543 15 10
P15/8 455, 481 2.40 sh512, 540, sh582
17 -
P16/8 451 2.40 507, 550, 595 12 12 P17/8 451 2.37 582 14 12 P18/8 450 2.38 593 17 15
P19/8 454, 478 2.38 sh509, sh536,582 13 17
Quantum yields obtained from a: Hamamatsu system b: Home made set-up.

Chapter VI
126
450 500 550 600 650 7000.0
0.2
0.4
0.6
0.8
1.0 P12/8 P13/8 P14/8 P15/8 P16/8 P17/8 P18/8 P19/8
Wavelength, nm
PL
Inte
nsity
350 400 450 500 5500.00
0.02
0.04
0.06
0.08
P12/8 P13/8 P14/8 P15/8 P16/8 P17/8 P18/8 P19/8
Wavelenth, nm
Abs
.
Figure 6.9 The absorption (right) and the photoluminescence spectra (left) of the polymers Pn/8 (n = from 12 to 19) in dilute chloroform solutions.
500 600 700 8000
2000
4000
6000
8000
10000
Wavelength, nm
PL
Inte
nsity
P12/8 P13/8 P14/8 P15/8 P16/8 P17/8 P18/8 P19/8
400 500 6000.0
0.1
0.2
0.3
0.4
0.5
Wavelenth, nm
Abs
.
P12/8 P13/8 P14/8 P15/8 P16/8 P17/8 P18/8 P19/8
500 600 700 8000
2000
4000
6000
8000
10000
Wavelength, nm
PL
Inte
nsity
P12/8 P13/8 P14/8 P15/8 P16/8 P17/8 P18/8 P19/8
400 500 6000.0
0.1
0.2
0.3
0.4
0.5
Wavelenth, nm
Abs
.
P12/8 P13/8 P14/8 P15/8 P16/8 P17/8 P18/8 P19/8
Figure 6.10 The absorption (right) and the photoluminescence spectra (left) of the polymers Pn/8 (n = from 12 to 19) in films printed from toluene/ o-dichlorobenzene (90/10 v/v).
6.3.4 Electroluminescence investigations Single layer PLEDs with ITO//PEDOT:PSS//Pn/8 (~80 nm)//Ca (4 nm)//Ag (150 nm) were
fabricated and fully characterised. The active layers were prepared using both spin-coating
and inkjet printing from a mixture of toluene/o-dichlorobenzene (90/10v/v). The performances
of the devices are given in Table 6.7. The best device performance was obtained from the spin
coated polymer P12/8 which yielded 0.29 Cd/A efficiency. Besides, the use of P18/8 and
P19/8 as active layer exhibited relatively good performances 0.22 and 0.24 Cd/A,
respectively. No correlation between side chain length and LED efficiencies has been
observed. Overall, the onset voltages were in the range of 2.5-4.6 V which are significantly
lower compared to literature values.28,33 The higher onset voltages found in literature might be
due to an oxidised Ca cathode. The devices whose active layers were prepared by inkjet

Thickness and side chain effects on the optical properties of PPE-PPVs
127
printing resulted in relatively poor performances, lower efficiencies and higher onset voltages.
This might be due to the inhomogeneous thickness distribution of the printed PPE-PPVs on
the PEDOT:PSS layer.
Table 6.7 Electroluminescence data of the spin-coated and inkjet printed thin films (~ 80 nm). Device layout: ITO//PEDOT:PSS//Pn/8//Ca//Ag
Polymer (in thin film)
LED efficiency (Cd/A)
(spin-coated)
Onset voltages (V)
(spin-coated)
LED efficiency (Cd/A)
(inkjet printed)
Onset voltages (V)
(inkjet printed)P12/8 0.29 2.5 0.08 6.6 P14/8 0.12 3.3 0.06 2.8 P16/8 0.03 3.5 - - P17/8 0.12 4.6 0.07 8.0 P18/8 0.22 3.5 - - P19/8 0.24 2.7 - -
Electroluminescence (EL) spectra of the devices of Pn/8 are shown in Figure 6.11. Both
the shape of the spectra and the wavelength of the EL maximum depend on the alkoxy side
chain length. The polymers P12/8 and P14/8 exhibited two well resolved peaks around 500
and 550 nm, whereas polymers with longer side chains have broader EL spectra shifted to the
red region (max intensities around 560-600 nm). On the other hand it was found that with
increasing applied bias voltage, the EL of the polymers Pn/8 (n = 16, 17, 18, 19) were blue-
shifted, while the EL of P12/8 and P14/8 were stable.
500 600 700 8000.0
0.2
0.4
0.6
0.8
1.0
EL
Inte
nsity
Wavelength, nm
P12/8 4V P14/8 10V P16/8 5V P17/8 8V P18/8 6V P19/8 7V
Figure 6.11 Electroluminescence spectra of the devices ITO//PEDOT:PSS//Pn/8//Ca//Ag.
As can be seen from Figure 6.12, at low voltage (5 V) P16/8 emits orange at around 600
nm, increasing the bias voltage to 6 and 7 V led to a blue-shift of the emission by 50 and 100

Chapter VI
128
nm, respectively. Consequently, the shape of the EL spectra of P16/8 became similar to that
of 14/8. Since the process is irreversible, it is suggested that the application of higher electric
fields and, consequently local heating in the polymer film leads to changes in the
conformation of the polymer backbone by uplifting the strong π-π interactions. Therefore the
EL spectrum of P16/8 becomes similar to the EL spectrum of the polymers with shorter side
chains; confirming the literature result that was found for P18/8.36
400 500 600 700 8000.0
0.2
0.4
0.6
0.8
1.0
EL
inte
nsity
λ [nm]
P16/8 5V P16/8 6V P16/8 7V
Figure 6.12 Electroluminescence spectra of the P16/8 measured at varied voltages.
Figure 6.13 Commission internationale de léclairage (CIE)-coordinates of all PLEDs measured at different bias voltages. Increasing voltage led to blue shift for the polymers Pn/8 (n = 16, 17, 18, 19).

Thickness and side chain effects on the optical properties of PPE-PPVs
129
As a result, the EL colours of the polymers Pn/8 varied from orange to green depending
on the side chain as shown in Figure 6.13. EL colours of the polymers Pn/8 (n = 16, 17, 18,
19) are not stable and tend to shift from orange or yellow to green with increasing voltages.
6.4 Conclusions In the first part of this chapter, the influence of film thickness and alkoxy side chains were
systematically investigated in libraries. The preparation of these thin film libraries was
performed by inkjet printing of the corresponding polymer solutions. The PL colours of
polymers 2 and 4 shifted to red and the intensities of the 0-2 transitions are higher than those
of the other polymers. This is caused by the stronger aggregations of the chains. It was also
found that an increase in thickness scales with the I0-2, since the inter-chain interactions
become more emphasised in the thicker films. Furthermore, annealing changed the emission
colours significantly so that white emission from the films became observable. Consequently,
it would appear that the organisation of the polymer chains plays an important role on the
respective emission colours in thin films.
In the second part of the chapter, the effect of the alkoxy side chain attached to the PPE
segment on the photophysical properties of the PPE-PPVs was investigated. Bulk samples of
Pn/8 with n less than 16 are yellow in colour while Pn/8 with n greater than and equal to 16
were orange. Although all synthesised polymers show almost similar absorption spectra in
solution and in films and only slightly different emission spectra in solution, distinct
differences were observed in thin film emission spectra. The thin film emission maxima of the
polymers Pn/8 with n greater than and equal to 16 are red-shifted relative to the polymers
Pn/8 with n less than 16. Moreover, the EL spectra of the polymers show a similar influence
of the side chain to that seen for the PL spectra. Besides broader and red-shifted EL spectra,
Pn/8 with longer side chains revealed a blue-shift in EL colour with increasing voltages
which is due to the reorganisation of the chains. It can be concluded that, the reduced ability
of the longer side chains (attached to the PPE segment) to reorganise (i.e. recrystallise) favour
the planarisation of the conjugated backbone which explains the red-shift in the emission; this
is also implied by DCS studies
6.5 Experimental section Instrumentation 1H-NMR and 13C-NMR spectra have been recorded on a Varian Mercury 400 MHz or a Varian Gemini 300 MHz spectrometer at 298 K in deuterated CD2Cl2. Elemental analyses

Chapter VI
130
were carried out on a EuroVector EuroEA3000 elemental analyser for CHNS. Infrared spectra was recorded on the Tensor 37 RT from Bruker with a grazing angle set-up. Gel permeation chromatography (GPC) measurements were performed on a Shimadzu system equipped with a SCL-10AV vp system controller. As eluent THF was used at a flow rate of 1 mL/min. The molecular weights were calculated against polystyrene standards. The absorption spectra were recorded in dilute chloroform solution (10-5 or 10-6 M) on a Perkin Elmer UV-Vis-NIR Spectrometer Lambda 19. Quantum corrected emission spectra were measured in dilute chloroform solution (10-6 M) with a LS 50 luminescence spectrometer (Perkin Elmer). The fluorescence quantum yields were calculated relative to quinine sulphate (Φf = 55%). The absorbance at the excitation wavelength was kept below 0.05 for the samples and the reference. For printing experiments an Autodrop System (Microdrop Technologies, Norderstedt, Germany) was used. Thin films of 50-150 nm thickness were printed from toluene/o-dichlorobenzene (90/10) on glass substrates for quantum yields measurements and on PEDOT:PSS coated (30 nm) ITO glass substrates for devices. 75 V and 45 µs (pulse width) were selected as optimal parameters and kept constant for all printing experiments since they lead to a stable droplet formation. An UV-Vis/fluorescence plate reader (Flashscan 530) from Analytik Jena (Jena, Germany) was utilised to measure the respective fluorescence spectra of the printed PPE-PPV films. The absolute quantum yields of the thin films were measured on a Hamamatsu C9920-02 system and a home made set-up.
Differential scanning calorimetry (DSC) measurements were carried out on a Mettler DSC 30 with a cell purged with nitrogen. Calibration for temperature and enthalpy changes was performed using a Indium standard. The temperature was changed with a rate of 10 K/min covering a temperature range between 293 K and 493 K. Data analysis was performed on the first cooling and second heating ramps which are considered to reflect the properties of the compact bulk material. Transition temperatures were determined from the peak maxima. Device fabrication and characterisation The concentrations of the utilised solutions for inkjet printing and spin-coating were 4 mg/mL and 8.5 mg/mL, respectively. The preparation of the active layers by inkjet printing did not take place under inert conditions and therefore water condensation on the film surface cannot be excluded. The cathode, consisting of a 4 nm thin layer of Ca and an Ag layer (150 nm), was deposited by thermal evaporation at a base pressure of 10-6 mbar. The device characterisation was done with a Keithley 2400 source meter, a calibrated photodiode and an Ocean Optics SD2000 CCD spectrometer under argon atmosphere. Synthesis of the polymers(Pn/8) Poly[1,4-phenylenethynylene-1,4-(2,5-dihexadecyloxyphenylene)-1,4-phenylenethene-1,2-diyl-1,4-(2,5-dioctyloxyphenylene)ethene-1,2-diyl] (P16/8) 1,4-Bis(4-formylphenylethynyl)-2,5-dihexadecyloxybenzene (1-16, 813 mg, 0.62 mmol) and 2,5-dioctyloxy-p-xylylene-bis(diethylphosphonate) (2, 635 mg, 0.62 mmol) were dissolved in dried toluene (50 mL) while stirring vigorously under argon and heating under reflux. The polycondensations was started by adding potassium-tert-butoxide (415 mg, 3.7 mmol). In spite of the rapidly increasing viscosity, the reaction solution was held mixable by adding further dried toluene in small portion (Σ ~3 mL) over the time of reaction. After 15 min benzaldehyde (0.4 mL, 0.42 g, 4 mmol) was added. Toluene (40 mL) and an excess of dilute HCl were mixed in 2 minutes later. The organic layer was separated and extracted several times with distilled water until the water phase became neutral (pH = 6 to 7). A Dean-Stark apparatus was used to dry the organic layer. The hot (50-60 °C) toluene solution was filtered; the filtrate was concentrated to the minimum by using a rotary evaporator and then
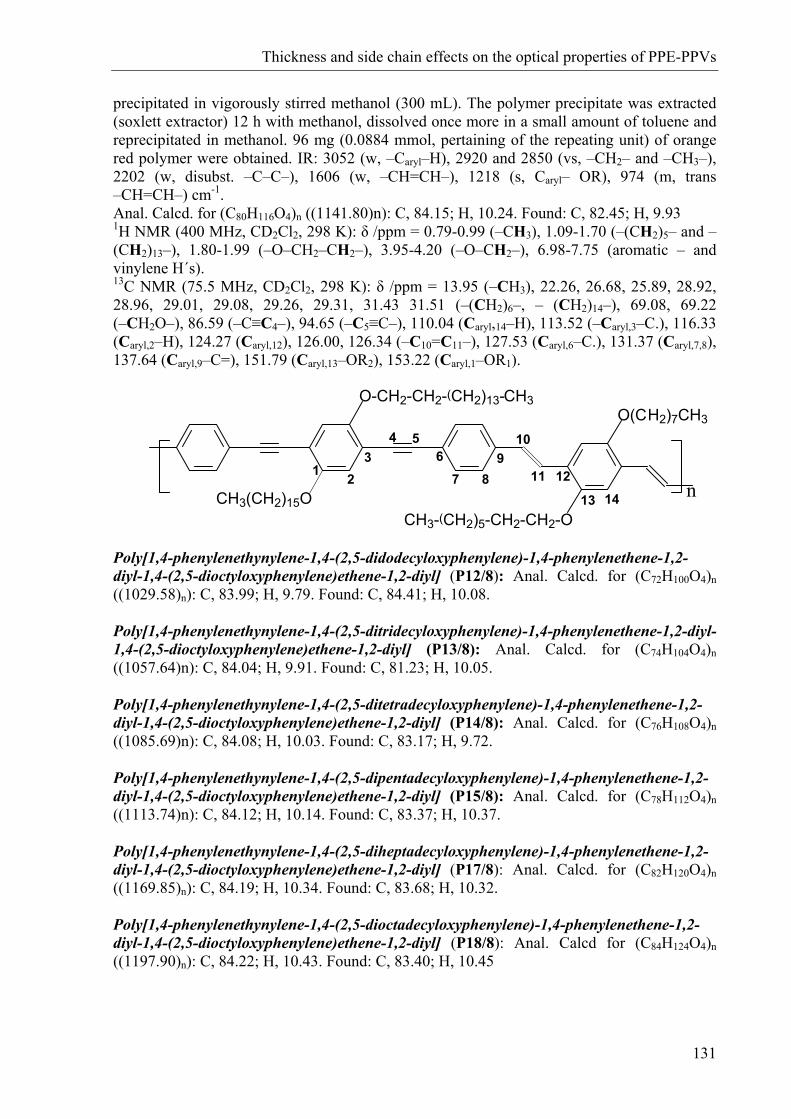
Thickness and side chain effects on the optical properties of PPE-PPVs
131
precipitated in vigorously stirred methanol (300 mL). The polymer precipitate was extracted (soxlett extractor) 12 h with methanol, dissolved once more in a small amount of toluene and reprecipitated in methanol. 96 mg (0.0884 mmol, pertaining of the repeating unit) of orange red polymer were obtained. IR: 3052 (w, –Caryl–H), 2920 and 2850 (vs, –CH2– and –CH3–), 2202 (w, disubst. –C–C–), 1606 (w, –CH=CH–), 1218 (s, Caryl– OR), 974 (m, trans –CH=CH–) cm-1. Anal. Calcd. for (C80H116O4)n ((1141.80)n): C, 84.15; H, 10.24. Found: C, 82.45; H, 9.93 1H NMR (400 MHz, CD2Cl2, 298 K): δ /ppm = 0.79-0.99 (–CH3), 1.09-1.70 (–(CH2)5– and –(CH2)13–), 1.80-1.99 (–O–CH2–CH2–), 3.95-4.20 (–O–CH2–), 6.98-7.75 (aromatic – and vinylene H´s). 13C NMR (75.5 MHz, CD2Cl2, 298 K): δ /ppm = 13.95 (–CH3), 22.26, 26.68, 25.89, 28.92, 28.96, 29.01, 29.08, 29.26, 29.31, 31.43 31.51 (–(CH2)6–, – (CH2)14–), 69.08, 69.22 (–CH2O–), 86.59 (–C≡C4–), 94.65 (–C5≡C–), 110.04 (Caryl,14–H), 113.52 (–Caryl,3–C.), 116.33 (Caryl,2–H), 124.27 (Caryl,12), 126.00, 126.34 (–C10=C11–), 127.53 (Caryl,6–C.), 131.37 (Caryl,7,8), 137.64 (Caryl,9–C=), 151.79 (Caryl,13–OR2), 153.22 (Caryl,1–OR1).
n
O-CH2-CH2-(CH2)13-CH3O(CH2)7CH3
CH3-(CH2)5-CH2-CH2-OCH3(CH2)15O
1 23
4 56
7 89
10
11 12
13 14
Poly[1,4-phenylenethynylene-1,4-(2,5-didodecyloxyphenylene)-1,4-phenylenethene-1,2-diyl-1,4-(2,5-dioctyloxyphenylene)ethene-1,2-diyl] (P12/8): Anal. Calcd. for (C72H100O4)n ((1029.58)n): C, 83.99; H, 9.79. Found: C, 84.41; H, 10.08. Poly[1,4-phenylenethynylene-1,4-(2,5-ditridecyloxyphenylene)-1,4-phenylenethene-1,2-diyl-1,4-(2,5-dioctyloxyphenylene)ethene-1,2-diyl] (P13/8): Anal. Calcd. for (C74H104O4)n ((1057.64)n): C, 84.04; H, 9.91. Found: C, 81.23; H, 10.05. Poly[1,4-phenylenethynylene-1,4-(2,5-ditetradecyloxyphenylene)-1,4-phenylenethene-1,2-diyl-1,4-(2,5-dioctyloxyphenylene)ethene-1,2-diyl] (P14/8): Anal. Calcd. for (C76H108O4)n ((1085.69)n): C, 84.08; H, 10.03. Found: C, 83.17; H, 9.72. Poly[1,4-phenylenethynylene-1,4-(2,5-dipentadecyloxyphenylene)-1,4-phenylenethene-1,2-diyl-1,4-(2,5-dioctyloxyphenylene)ethene-1,2-diyl] (P15/8): Anal. Calcd. for (C78H112O4)n ((1113.74)n): C, 84.12; H, 10.14. Found: C, 83.37; H, 10.37. Poly[1,4-phenylenethynylene-1,4-(2,5-diheptadecyloxyphenylene)-1,4-phenylenethene-1,2-diyl-1,4-(2,5-dioctyloxyphenylene)ethene-1,2-diyl] (P17/8): Anal. Calcd. for (C82H120O4)n ((1169.85)n): C, 84.19; H, 10.34. Found: C, 83.68; H, 10.32. Poly[1,4-phenylenethynylene-1,4-(2,5-dioctadecyloxyphenylene)-1,4-phenylenethene-1,2-diyl-1,4-(2,5-dioctyloxyphenylene)ethene-1,2-diyl] (P18/8): Anal. Calcd for (C84H124O4)n ((1197.90)n): C, 84.22; H, 10.43. Found: C, 83.40; H, 10.45

Chapter VI
132
Poly[1,4-phenylenethynylene-1,4-(2,5-dinonadecyloxyphenylene)-1,4-phenylenethene-1,2-diyl-1,4-(2,5-dioctyloxyphenylene)ethene-1,2-diyl] (P19/8): Anal. Calcd for (C86H128O4)n ((1225.95)n): C, 84.26; H, 10.52. Found: C, 84.07; H, 10.67

Thickness and side chain effects on the optical properties of PPE-PPVs
133
6.6 References
1 T.J. Skotheim, R.L. Elsenbaumer, J.R. Reynolds, Eds. Handbook of Conducting
Polymers, 2nd ed. Marcel Dekker: New York, 1998.
2 G. Hadziioannou, G.G. Malliaras, Eds. Semiconducting Polymers: Chemistry, Physics
and Engineering, 2nd ed. Wiley- VCH: Weinheim, Germany, 2007.
3 H . Shirakawa, E.J. Louis, A.G. MacDiarmid, C.K. Chiang, A.J. Heeger, J. Chem. Soc.,
Chem. Commun. 1977, 578.
4 C.K. Chiang, C.R. Fischer, Y.W. Park, A.J. Heeger, H. Shirakawa, E.J. Louis, S.C. Gau,
A.G. MacDiarmid, Phys. Rev. Lett. 1977, 39, 1098.
5 C.K. Chiang, M.A. Druy, S.C. Gau, A.J. Heeger, E.J. Louis, A.G. MacDiarmid, Y.W.
Park, H. Shirakawa, J. Am. Chem. Soc. 1978, 100, 1013.
6 D. Braun, A.J. Heeger, Appl. Phys. Lett. 1991, 58, 1982.
7 S. Doi, M. Kuwabara, T. Noguchi, T. Ohnishi, Synth. Met. 1993, 57, 4174.
8 S. Pfeiffer, H.H. Hörhold, Macromol. Chem. Phys. 1999, 200, 1870.
9 M. Rehahn, A.D. Schlüter, G. Wegner, W.J. Feast, Polymer 1989, 30, 1054.
10 M. Rehahn, A.D. Schlüter, G. Wegner, W.J. Feast, Polymer 1989, 30, 1060.
11 T. Vahlenkamp, G. Wegner, Macromol. Chem. Phys. 1994, 195, 8350.
12 B. Karakaya, W. Claussen, K. Gessler, W. Saenger, A.D. Schlüter, J. Am. Chem. Soc.
1997, 119, 3296.
13 M. Kreyenschmidt, F. Uckert, K. Müllen, Macromolecules 1995, 28, 4577.
14 U. Scherf, K. Müllen, Makromol. Chem., Rapid Commun. 1991, 12, 489.
15 R. Giesa, R.C. Schulz, Makromol. Chem. 1991, 191, 857.
16 C.E. Halkyard, M.E. Rampey, L. Kloppenburg, S.L. Studer-Martinez, U.H.F. Bunz,
Macromolecules 1998, 31, 8655.
17 U.H.F. Bunz, Chem. Rev. 2000, 100, 1605.
18 C. Weder, M.S. Wrighton, Macromolecules 1996, 29, 5157.
19 M. Moroni, M. Le Moigne, T.A. Pham, J.Y. Bigot, Macromolecules 1997, 30, 1964.
20 M. Sato, H. Morii, Polym. Commun. 1991, 32, 42.
21 M. Sato, H. Morii, Macromolecules 1991, 24, 1196.
22 R.D. McCullough, R.D. Lowe, M. Jayaraman, D.L. Anderson, J. Org. Chem. 1993, 58,
904.
23 T.A. Chen, X. Wu, R.D. Rieke, J. Am. Chem. Soc. 1995, 117, 233.

Chapter VI
134
24 D.A.M. Egbe, C.P. Roll, E. Birckner, U.W. Grummt, R. Stockmann, E. Klemm,
Macromolecules 2002, 35, 3825.
25 D.A.M. Egbe, C. Bader, J. Nowotny, W. Gunther, E. Klemm, Macromolecules 2003,
36, 5459.
26 D.A.M. Egbe, C. Bader, E. Klemm, L. Ding, F.E. Karasz, U.W. Grummt, E. Birckner,
Macromolecules 2003, 36, 9303.
27 D.A.M. Egbe, H. Tillmann, E. Birckner, E. Klemm, Macromol. Chem. Phys. 2001, 202,
2712.
28 L. Ding, Z. Lu, D.A.M. Egbe, F.E. Karasz, Macromolecules 2004, 37, 10031.
29 M. Pope, C.E. Swenberg, Electronic Processes in Organic Crystals and Polymers,
Oxford University Press, New York, 2nd ed. 1999.
30 A. Moliton, R.C. Hiorns, Polym Int. 2004, 53, 1397.
31 Y. Kim, J. Bouffard, S.E. Kooi, T.M. Swager, J. Am. Chem. Soc. 2005, 127, 13726.
32 D.A.M. Egbe, R. Stockmann, M. Hotzel, J. Opt. A: Pure Appl. Opt. 2004, 6, 791.
33 L. Ding, D.A.M. Egbe, F.E. Karasz, Macromolecules 2004, 37, 6124.
34 D.A.M. Egbe, T. Kietzke, B. Carbonnier, D. Mühlbacher, H.H. Hörhold, D. Neher, T.
Pakula, Macromolecules 2004, 37, 8863.
35 A.L. Konkina, S. Sensfussa, H.K. Rotha, G. Nazmutdinovaa, M. Schroednera, M. Al-
Ibrahima, D.A.M. Egbe, Synth. Met. 2005, 148, 199.
36 D.A.M. Egbe, C. Ulbricht, T. Orgis, B. Carbonnier, T. Kietzke, M. Peip, M. Metzner,
M. Gericke, E. Birckner, T. Pakula, D. Neher, U.W. Grummt, Chem. Mater. 2005, 17,
6022.
37 B. Carbonnier, D.A.M. Egbe, E. Birckner, U.W. Grummt, T. Pakula, Macromolecules
2005, 38, 7546.
38 B. Carbonnier, T. Pakula, D.A.M. Egbe, J. Mater. Chem. 2005, 15, 880.

Summary
135
Thin Film Libraries of Functional Polymers and Materials Prepared by Inkjet Printing
Inkjet printing is a key technology for many applications, such as organic electronics and biotechnology on account of its ability to precisely deposit picolitre volumes of solutions or suspensions in well-defined patterns. The printing of polymers is particularly attractive due to their potential applications in flexible electronics. Inkjet printing also lends itself well to the preparation of thin film libraries of polymers, polymer blends or composites for use in combinatorial materials research where parameters such as chemical composition or film thickness can be systematically varied. The physical properties of these libraries can then be investigated in parallel, which leads to a more detailed understanding of materials and the identification of quantitative structure-property relationships. However, for all of these applications it is essential to understand how fluid properties and printing parameters affect the deposition quality.
In the introduction of the thesis, a literature survey provides an overview of inkjet printing equipment for the dispensing of functional materials and applications in the fields of organic electronics, biotechnology and reactive printing. The current status of applications derived from the printing of polymers is described with an emphasis placed on polymer transistors and combinatorial research. The literature overview revealed that there are still several questions to be answered about droplet formation, (with droplet generation being well-understood) and the optimisation of the macro- and micro-morphologies of the structures that result from different ink formulations, which contain functional materials. The goal of the research described in the thesis is to understand the parameters influencing the printability of polymers and polymer composites, and their pattern formation on the substrate. The thesis subsequently demonstrates the applicability of inkjet printing in the preparation of polymer libraries, and then discusses the parallel investigations into the solid-state properties of the polymers. Therefore, the first part of the thesis focuses on the physical properties and current challenges that are associated with droplet formation and the formation of inkjet printed features on the substrate. The changes in droplet volume of a polymer solution were studied by varying surface tension, viscosity and operation parameters (e.g. voltage). The results showed that droplet volume increases with increasing Z number, which is the Reynolds number divided by the Weber number, and with an increase in the voltage applied to the piezo element. Common solvents with Z numbers varying from 20 to 90 were found to be printable unless the solvents had high vapour pressures (~higher than 100 mmHg). The maximum polymer mass fraction that could be printed decreased with increasing molecular weight. This behaviour was found to be due to the elastic stress caused by the elongational flow in the nozzle. The final part of the first section showed that ring formation for polystyrene could be largely suppressed by using a mixture of two suitable solvents, where one had a high boiling point and the other a low boiling point, i.e. methyl benzoate/ethyl acetate, acetophenone/isopropyl acetate and methyl benzoate/ isopropyl acetate.
The third chapter of the thesis describes the succesful preparation of thin film libraries, for combinatorial approaches, of Ru(II)polypyridyl-PMMA and Ir(III)polypyridyl-PS copolymers with various thicknesses onto glass using inkjet printing. In this case, photoresist patterned glass substrates were employed to confine the deposited material, which reduced ring formation. The thickness of the films could be varied in a controlled way. Subsequently, the libraries of the different electron donor/acceptor compositions were prepared and the electron transfer from RuPMMA copolymer to PC60BM and C7-V derivatives was screened in a fast manner. The best quenching performance was observed for the PC60BM case.
In the fourth chapter, high quality, homogeneous dots composed of luminescent water-soluble CdTe nanocrystals (NCs) embedded in a polyvinylalcohol (PVA) matrix were fabricated by inkjet printing. The addition of ethylene glycol to the aqueous solution of CdTe

Summary
136
NCs/PVA suppressed the ring formation effect. AFM characterisation revealed that smoother films were formed when they were embedded in PVA and the emission of the CdTe NCs remained strong enough due to the increased inter-particle distance. The optimal PVA/CdTe NCs ratios in terms of the maximum available photoluminescence intensity were determined for different sizes of CdTe NCs by the creation of combinatorial libraries. Förster resonance energy transfer was demonstrated in blends of the green and red emitting CdTe NCs within the same composite.
The final part of the thesis focused on two types of conjugated polymers. In Chapter Five, the printing of poly[2-methoxy-5-(2′-ethylhexyloxyl)–1,4-phenylenevinylene] (MEH-PPV) solutions, which were prepared from solvents with different polarity and aromaticity, was performed. The interchain interactions of MEH-PPV in toluene and o-xylene were found to be more pronounced in comparison to more polar solvents by measuring viscosity and emission. When toluene was used as the solvent, lines with a homogenous thickness distribution were obtained due to the interchain interactions in the solution and toluene’s higher contact angle. The inkjet printing of large area MEH-PPV films has been successfully performed using a toluene/o-dichlorobenzene solvent mixture. The light emitting diode performance of the inkjet printed devices was found to strongly depend on layer thickness and thermal treatment. An improvement in the efficiency for the inkjet printed device from 0.12 Cd/A up to 0.38 Cd/A and a significantly decreased onset voltage could be achieved by optimised thickness and annealing.
In the last chapter, the effects of side chains and film thickness on the optical properties of different derivatives of poly(p-phenylene-ethynylene)-alt-poly(p-phenylenevinylene)s (PPE-PPVs) were investigated. Parallel characterisation of the thickness libraries revealed that with increasing thickness a red shift of the emission colour and increase in the I0-2 /I0-1 ratio of the emission spectra occurs. This denotes that the higher the thickness, the higher the influence of the inter-chain interactions since the number of interacting chains has increased. The effect of the alkoxy side chain length attached to the PPE segment (n) on the photophysical properties of the PPE-PPVs was also investigated. Bulk samples of PPE-PPVs with n less than 16 are yellow in colour while the PPE-PPVs with n greater than and equal to 16 were orange. The thin film emission maxima of the polymers with longer side chains were found to be red-shifted. Moreover, electroluminescence spectra of the polymers reflect the influences of the side chain similarly to the emission spectra. Consequently, the reduced ability of the longer side chains (attached to the PPE segment) to reorganise favour the planarisation of the conjugated backbone which explains the red shift in the emission; this was also implied by DCS studies.
In conclusion, successful strategies on how to improve the quality of inkjet printed films of different functional polymers and polymer composites in either organic or aqueous solutions were demonstrated. The use of inkjet printing allowed the investigations on the thin film libraries to elucidate structure-property relationship to be successfully realised.

Samenvatting
137
Inkjet printen is een sleuteltechnologie voor vele applicaties, zoals organische elektronica en biotechnologie, omdat het in staat is volumes van enkele picoliters van een oplossing of suspensie zeer precies en nauwkeurig te plaatsen in van te voren bepaalde patronen. Voornamelijk het printen van polymeren is aantrekkelijk omdat dit een potentiële applicatie kan hebben in de flexibele elektronica. Tevens is inkjet printen zeer geschikt voor het creëren van dunne film bibliotheken van polymeren, polymeer mengsels of composities voor het gebruik in combinatorisch materiaal onderzoek waar parameters, zoals de chemische compositie of dikte van de film, systematisch gevarieerd kunnen worden. De fysische eigenschappen van deze bibliotheken kunnen parallel onderzocht worden, wat vervolgens resulteert in een meer gedetailleerd begrip van materialen en de identificatie van kwantitatieve structuur-eigenschap relaties. Echter, voor al deze applicaties is het essentieel te begrijpen in hoeverre de vloei-eigenschappen en print parameters de depositie kwaliteit beïnvloeden. De introductie van deze thesis behelst een literatuur studie met een overzicht van de inkjet printer apparatuur waarmee functionele materialen geprint kunnen worden, alsmede de toepassingen in het bereik van organische elektronica, biotechnologie en reactief printen. De huidige status van toepassingen afgeleid van het printen van polymeren wordt beschreven met de nadruk op polymere transistoren en combinatorisch onderzoek. Het literatuuroverzicht laat zien dat er nog steeds een aantal vragen onbeantwoord zijn over de druppel vorming (terwijl het opwekken van de druppel goed begrepen wordt) en de optimalisatie van de macro- en micro-morfologie van de structuren, ontstaan door verschillende inkt formuleringen die functionele materialen bevatten. Het doel van het onderzoek dat beschreven wordt in de thesis is om inzicht te krijgen in de parameters die de printbaarheid van polymeren en polymeer mengsels beïnvloeden en de patroonvorming op het substraat. In de thesis wordt beschreven wat de toepasbaarheid van inkjet printen is in de preparatie van polymeer bibliotheken, gevolgd door een discussie over het in parallel onderzoeken van de vaste toestand eigenschappen van de polymeren. Hiertoe focusseert het eerste deel van de thesis zich op de fysische eigenschappen en huidige uitdagingen die verbonden zijn met druppel vorming en de vorming van geïnkjet-printe structuren op het substraat. De veranderingen in druppel volume van een polymeer oplossing werden bestudeerd door de oppervlakte spanning, viscositeit en print parameter (o.a. de spanning) te variëren. Het resultaat liet zien dat druppel volume toeneemt met een toenemend Z-getal, wat gedefinieerd is als de ratio van het Reynolds- en Weber-getal, en met een grotere spanning over het piezo element. Gebruikelijke oplosmiddelen met een Z-getal tussen 20 en 90 bleken goed printbaar te zijn, tenzij de oplosmiddelen een hoge dampdruk hebben (hoger dan 100 mmHg). De maximale polymeer massa fractie die geprint kan worden, nam af met toenemend molekuulgewicht. Dit gedrag kon verklaard worden door de elastische stress die veroorzaakt wordt door stroming in de nozzle. Het laatste gedeelte van het eerste deel laat zien dat ring vorming van polystyreen grotendeels voorkomen kan worden door een mengsel van twee geschikte oplosmiddelen te gebruiken die een groot onderling verschil in kookpunt hebben, bijvoorbeeld methyl benzoaat/ethyl acetaat, acetofenon/isopropyl acetaat en methyl benzoaat/isopropyl acetaat. Het derde hoofdstuk van de thesis beschrijft de succesvolle preparatie van dunne film bibliotheken, bedoeld voor combinatorische doeleinden, van Ru(II)polypyridyl-PMMA en Ir(III)polypyridyl-PS co-polymeren op glas met variërende dikte middels inkjet printen. In dit geval werd ring-vorming tegengegaan door glas substraten te gebruiken die voorzien waren van een patroon van fotoresist om spreiding van het gepositioneerde materiaal tegen te gaan. De dikte van de film kon op een gecontroleerde manier gevarieerd worden. Achtereenvervolgens werden de bibliotheken van verschillende elektron donor/acceptor composities geprepareerd en op een snelle manier de elektronen transfer van RuPMMA co-polymer naar PC60BM en C7-V afgeleiden gescreend. De beste quenching prestatie werd gevonden voor PC60BM.

Samenvatting
138
In het vierde hoofdstuk, werden homogene druppels, bestaande uit luminescente en wateroplosbare CdTe nanokristallen (NK’s) die zich in een polyvinylalcohol (PVA) matrix bevinden, in hoge kwaliteit gemaakt door middel van inkjet printen. De toevoeging van ethyleen glycol aan het waterige mengsel van CdTe NK’s/PVA onderdrukte het effect van ring-vorming. AFM karakterisatie bracht aan het licht dat gladdere film gevormd werden als de nanonkristallen zich in een PVA matrix bevinden en de emissie van de CdTe NK’s bleef sterk genoeg door de toegenomen onderlinge afstand van de deeltjes. De optimale PVA/CdTe NK’s verhouding in relatie tot de maximaal aanwezige fotoluminescentie intensiteit warden bepaald voor verschillende CdTe NK’s grootten door middel van het creëren van combinatorische bibliotheken. De Förster resonantie energie overdracht werd gedemonstreerd in mengsels van de groene en rode licht emitterende CdTe NK’s binnen dezelfde compositie. Het laatste deel van de thesis focusseert zich op twee typen geconjugeerde polymeren. In hoofdstuk vijf verteld over het printen van poly[2-methoxy-5-(2′-ethylhexyloxyl)–1,4-fenyleenvinyleen] (MEH–PPV) oplossingen, welke gemaakt werden vanuit oplossingen met verschillende polariteit en aromaticiteit. De interactie tussen onderlinge ketens van MEH-PPV in tolueen en o-xyleen bleken sterker te zijn in vergelijking tot meer polaire oplossingen, en is bepaald door het meten van de viscositeit en de emissie. Als tolueen gebruikt werd als oplosmiddel, werden lijnen met een homogenere dikte verkregen door de onderlinge keten interactie in de oplossing en door de hogere contact hoek van tolueen. Grote oppervlakten van films van MEH-PPV kon succesvol geprint worden door gebruik te maken van een mengsel van de oplosmiddelen tolueen en o-dichlorobenzeen. De prestaties van een licht emitterende diode gemaakt door middel van inkjet printen hangen sterk af van de laagdikte en de thermische behandeling. Hiervoor kan een verbetering in de efficiëntie gehaald worden van 0.12 Cd/A tot 0.38 Cd/A en een significant gedaalde aan-uit spanning door de dikte te optimaliseren en door middel van verweken. In het laatste hoofdstuk werden de effecten van zijketens en film dikte op de optische eigenschappen van verschillende afgeleiden van poly(p-fenyleen-ethynyleen)-alt-poly(p-fenyleenvinyleen)s (PPE-PPVs) bestudeerd. Parallelle karakterisering van de dikte bibliotheken gaf te weten dat met toenemende dikte een rood verschuiving van de emissie kleur plaats vond en tevens een toename in de I0-2 /I0-1 ratio van de emissie spectra. Dit laat zien dat hoe groter de dikte, hoe meer invloed van de onderlinge keten interactie, omdat het aantal interacties toegenomen is. Het effect van de lengte van de alkoxy zijketen lengte aan het PPE gedeelte (n) op de fotofysische eigenschappen van de PPE-PPV’s is ook onderzocht. Bulk monsters van PPE-PPV’s met n kleiner dan 16 hebben een gele kleur, terwijl PPE-PPV’s met n groter dan of gelijk aan 16 oranje van kleur warden. De maxima van de dunne film emissie van de polymeren met een langere zijketen bleken een rood verschuiving te hebben. Tevens laten de elektroluminescentie spectra van de polymeren de invloed van de zijketen zien die gelijk is aan de emissie spectra. Als gevolg hiervan heeft de gereduceerde mogelijkheid van de langere zijketens (gekoppeld aan het PPE gedeelte) om te reorganiseren een voorkeur om het conjugeerde skelet in één vlak te leggen, wat ook de rood verschuiving in de emissie verklaart; dit bleek ook uit DCS studies. Concluderend kan gezegd worden, dat succesvolle strategieën beschreven zijn hoe de kwaliteit van geïnkjet-printe films op verschillende functionele polymeren en polymeer samenstellingen in ofwel organische dan wel waterige oplossingen verbeterd kan worden. Door gebruik te maken van inkjet printen konden succesvolle onderzoeken naar de dunne film bibliotheken gerealiseerd worden om structuur-eigenschap relaties te kunnen leggen.

139
Curriculum Vitae
Emine Tekin (former surname Kazancıoğlu) was born on 14 April 1977 in Kilis (Turkey). She graduated in 1998 from the Istanbul Technical University, Chemistry Department. The diploma thesis, “Reactions of β-Ionon with Diazonium Compounds”, was supervised by Prof. Dr. Olcay Anaç (Organic Chemistry Division). She obtained a master degree from Prof. Dr. Candan Erbil at the same university, Physical Chemistry Division in 2001. The master thesis was “NIPAAm Gels Initiated by Ce(IV)-Tegomer H-Si2111 (polydimethyl siloxane) and PNIPAAm / PV-Si 2250 (polydimethyl siloxane) Semi Interpenetrating Networks”. She was employed as a research assistant at the Physical Chemistry Department from 2001 to 2003. In July 2003 she started her Ph.D. work under supervision of Prof. Dr. Ulrich S. Schubert at the Eindhoven University of Technology (TU/e) in the field of inkjet printing of thin films of functional materials for combinatorial approaches and applications in organic electronics. The results of her research are presented in this thesis.

List of publications
140
Refereed publications:
• D. A. M. Egbe, E. Tekin, E. Birckner, A. Pivrikas, N. S. Sariciftci, U. S. Schubert Effect of styryl side groups on the photophysical properties and hole mobility of PPE-PPV systems Macromolecules 2007, in press.
• E. Tekin, P. J. Smith, S. Hoeppener, A. M. J. van den Berg, A. S. Susha, A. L.
Rogach, J. Feldmann, U. S. Schubert Inkjet printing of luminescent CdTe nanocrystal/polymer composites Adv. Funct. Mater. 2007, 17, 23
• E. Tekin, E. Holder, D. Kozodaev, U. S. Schubert
Controlled pattern formation of poly[2-methoxy-5-(2’-ethylhexyloxyl)–1,4-phenylenevinylene] (MEH–PPV) by inkjet printing Adv. Funct. Mater. 2007, 17, 277
• E. Tekin, H. Wijlaars, E. Holder, D. A. M. Egbe, U. S. Schubert
Film thickness dependency of the emission colours of novel PPE-PPVs in the inkjet printed libraries J. Mater. Chem. 2006, 16, 4294
• V. Marin, E. Holder, R. Hoogenboom, E. Tekin, U. S. Schubert
Light-emitting iridium(III) and ruthenium(II) polypyridyl complexes containing quadruple hydrogen-bonding moieties Dalton Trans. 2006, 13, 1636
• E. Holder, V. Marin, E. Tekin, D. Kozodaev, M. A. R. Meier, B. G. G. Lohmeijer, U.
S. Schubert, Novel iridium complexes with polymeric side-chains Mater. Soc. Symp. Proc. 2005, 846, 67
• V. Marin, E. Holder, M. M. Wienk, E. Tekin, D. Kozodaev, U. S. Schubert
Inkjet printing of electron donor/acceptor blends: towards bulk heterojunction solar cells Macromol. Rapid Commun. 2005, 26, 319
• E. Tekin, E. Holder, V. Marin, B.-J. de Gans, U. S. Schubert
Ink-Jet printing of luminescent Ruthenium- and Iridium-containing polymers for applications in light-emitting devices Macromol. Rapid Commun. 2005, 26, 293
• E. Tekin, B.-J. de Gans, U. S. Schubert
Ink-jet printing of polymers - from single dots to thin film libraries J. Mater. Chem. 2004, 14, 2627
• B.-J. de Gans, E. Kazancioglu, W. Meyer, U. S. Schubert
Inkjet printing polymers and polymer libraries using micropipettes Macromol. Rapid Commun. 2004, 25, 292

List of publications
141
Non-refereed publications:
• U. S. Schubert, B.-J. de Gans, E. Kazancioglu Combinatorial and high-throughput polymer research: composition of complete workflows. PMSE Preprints 2004, 90, 643.
Refereed publications prior to the PhD thesis:
• C. Erbil, E. Kazancioglu, N. Uyanik Synthesis, characterization and thermoreversible behaviours of poly(dimethyl siloxane)/poly(N-isopropyl acrylamide) semi-interpenetrating networks Eur. Polym. J. 2004, 40, 1145.
• E. Kazancioglu, C. Erbil
Synthesis and characterization of poly(N-isopropyl acrylamide) gels prepared by using (NH4)2Ce(NO3)6 Tegomer H-Si 2111 redox pair Polym. Bull. 2003, 50, 175.


143
Acknowledgements: I would like to express my gratitude to all those who have contributed to the work
described in this thesis. First of all, I would like to thank my promoter, Prof. U. S. Schubert for giving me the
opportunity to work in his group and for his guidance and support. Dear Uli, it was a very beneficial experience to work with you: not only for technical learning but also for personal development. I admire your energy and ambition, which you exude all the time.
Secondly, I gratefully acknowledge the effort and time of the members of the core-committee: Prof. U. S. Schubert, Dr. P. J. Smith, Prof. M. Rehahn, Prof. J. C. Meredith and Prof. D. J. Broer who have read and made comments on this thesis. Prof. R. A. J. Janssen is also sincerely thanked for taking part in my PhD defence committee. A word of gratitude goes to the DPI for their financial support to my PhD research.
I want to thank Dr. B.-J. de Gans for his supervision during the first year of my PhD. I also appreciate the help given by Prof. E. Holder in support of my work, which took the form of her work with light-emitting materials and our many fruitful discussions.
The great contribution to this thesis of Dr. Daniel A.M. Egbe is greatly valued. Dear Daniel, without you my work would not be so colourful. I also thank you for your sincere friendship and the hospitality in Jena.
Dear Patrick, once again I would like to thank you for your enormous help to improve my thesis. I also appreciate all the work that you contributed and for our useful discussions. Special thanks are given to little Miss Gwendolyn Smith who was born just after I had finished my thesis and thereby allowing her Father the time to work on my thesis.
Sincere acknowledgement is made of the efforts of Nina Rehmann and Prof. Klaus Meerholz for the PLED measurements, Dr. Eckhard Birckner for quantum yield measurements and Dr. Silke Rathgeber for DSC measurements. Similarly, Dr. Andrei S. Susha and Dr. Andrey L. Rogach are thanked for the collaboration on the printing of CdTe nanocrystals.
All the members of the Laboratory of Macromolecular Chemistry and Nanoscience (SMN), including the students from Jena, are gratefully acknowledged for their friendship and the nice environment (the group trips, barbecues; especially the one in the rain, ice creams (Sabine and Stefani)) that I experienced during my four years.
I especially thank the inkjet team (the best subgroup of SMN!); Patrick, Jolke, Joe, Antje, Chris, Rebecca, Hans, Christoph, Ton de Laat and the ex-members Elisabeth, Berend-Jan and Stefan. I really enjoyed working with you, especially during inkjet meetings.
Dear Jolke, thank you very much for providing the Dutch translation of the summary of my thesis. Additionally, thanks for driving a lot (to Frankfurt, Hamburg, Darmstadt, etc). You are a good “chauffeur.”
Dear Thijs and Harald, thanks for your work, you really gave your best with your graduation projects. I wish you both a lot of success for your futures.

144
Dear Emma, a lot of thanks for your great help with everything. As well as helping with all the official stuff, you were also a great friend by motivating and encouraging me when I had need. I will remember you whenever I dress in pink. Ciao bella!
Dear Veronica and Manuela, there are things that will not end with my PhD; one is certainly our friendship. Fara voi as fi suferit mult! Veronica, iti multumesc deasemenea pentru colaborarea noastra fructuoasa; am invatat mult de la tine! Iti doresc tie si lui Dragos fericire si mult succes. Manuela, nu o sa uit niciodata frumoasa noastra prietenie! Mult noroc cu doctoratul tau; iti doresc tot ce este mai bun pentru viata ta. Au revoir!
Dear Christoph (Candyman), thanks for your sincere friendship. Whenever I needed to open a bottle or the channel door of the glove box and to carry heavy staff you were there:) Of course, NMR measurements and elemental analysis are not minor things either and I thank you for your help here as well.
Antje, Martin, Caroline, Hanneke and Renzo, I think everybody knows that life in SMN would be very difficult without you. Thank you! Dear Stephanie, Dmitry and Daan thanks a lot for the AFM measurements. And Hans thank you for the Nano-indentation measurements and for the hair-dresser.
My office mates: Daan, Harald, Veronica, Remzi, Hector, Daniel and Andy; thank you very much for the friendly environment and fun.
Sevgili Türk arkadaşlarım; Seda, Ece, Remzi, Ayşe, Barış, sizleri tanıdığıma çok memnunum. Bir çoğunuzla tanışmam doktoramın son zamanlarına rastlasa da, Türkiye’ye olan özlemimi gidermemde etkili oldu. Umarım önümüzdeki yıllarda başarı haberlerinizi sıkça alırım. Sevgili Remzi ve Ayşe size Jena’da mutluluklar dilerim. Hoşçakalın.
Lunch mates: Tamara, Andreas, Mathias, Joe, Daan, Stephanie, Christoph, Claudia, Nicole, and Manuela; thanks for your company during lunch and discussions (mainly about food) in the Kennisport (Dear Nicole and Claudia, I am sure you will organize the best group trip for this year). RPK friends, Richard, Mike, Veronica, Carlos, Hans, Christoph, Manuela, Christina thanks for your company on the journeys to Utrecht and the nice combination of food every Friday (döner and Australian ice-cream).
Sevgili eşim Adem, beni doktoramın her aşamasında maddi ve mânevi olarak her zaman destekledin, bunun icin sana ne kadar teşekkür etsem azdır. Sevgili anneciğim (Aysel) ve kardeşlerim (Rıza ve Nuray), beni eğitim hayatım boyunca desteklediğiniz için teşekkürler. Sevgili annemiz (Rahmiye) ve babamiz (Yusuf), beni ve Adem’i akademik alanda kariyer yapmamız için herzaman desteklediğiniz ve yanımızda olduğunuz için size çok teşekkür ederim. Tezimi tüm aileme ve rahmetli babamın anısına takdim ediyorum.
HOUDOEEEEE!
Emine