thesis final draft - worcester polytechnic institute this thesis, performance of a self-designed and...
TRANSCRIPT


i
Abstract
While Direct Methanol Fuel Cells (DMFC) have a promising future as a long-lasting and
environmentally friendly energy source, the use of balance of plant (BOP) equipment, such as
pumps, fans, and compressors, create a complex system that can significantly reduce plant
efficiency and increase cost. As an alternative, passive DMFCs have been designed and studied
due to their ability to run under ambient conditions without any BOP equipment. However,
before they become a feasible energy source, more must be understood about their promise and
limitations. In this thesis, performance of a self-designed and constructed passive DMFC was
investigated. In addition, an analytical mathematical model was developed in order to gain a
better understanding of the limitations of the passive DMFC. The model was compared with
literature's data to ensure reliability.
Passive DMFCs, consisting of one to twelve Membrane Electrode Assemblies (MEAs)
were designed, constructed and tested. The smaller scale fuel cell was optimized using different
setups and elaborately tested using a variety of fuels, most notably methanol chafing gel, to
determine an optimal performance curve. The larger fuel cells were further used to test for long-
term performance and practical feasibility. The compact four-cell units could run for at least 24
hours and can provide performance akin to an AA battery. A larger 12-cell fuel cell was also
designed and built to test feasibility as a convenient power supply for camping equipment and
other portable electronics, and was tested with neat methanol and methanol gel. In all fuel cell
prototypes, polarization plots were obtained, along with open circuit voltage (OCV) plots and
long-term performance plots. While it is currently not possible to differentiate which methanol
fuel source is the best option without a more thorough investigation, methanol gel has shown
great potential as a readily available commercial fuel.

ii
The three largest restrictions in passive DMFC performance are 1) slow mass transfer of
fuel to the anode, 2) slow kinetics of methanol and oxygen electrodes, and 3) methanol
crossover. The developed model correctly predicts the effect of methanol crossover and the
resulting crossover current on OCV as well as on performance of the fuel cell over the entire
voltage-current range. Further, the model correctly predicts the effect of increasing methanol
feed concentration on reduced OCV but increased limiting current density. The effect of the
proton exchange membrane thickness is also well explained. Finally, the model describes the
significant power losses from larger overpotentials, as well as crossover current, and the
resulting significant heat generated and low efficiency.
Overall, PDMFCs show great promise for potential application provided the cost can be
reduced significantly.

iii
Acknowledgements
I would like to express my gratitude to Professor Ravi Datta for giving me the
opportunity to work with him for my graduate research. It has been such a pleasure and I have
learned so much from this experience. His valuable guidance, advice, knowledge, and
innovations have helped tremendously in advancing my research. Outside of academics, he has
also been a great person and friend to talk to. I truly appreciate this experience you have given
me and will cherish it for a long time.
I would like to thank Saurabh Vilekar for his early guidance and introduction to the lab
and equipment. His input and suggestions, as well as his assistance with the fuel cell equipment,
helped greatly in further refining my work. He has also been a great friend to socialize with, even
if he is always busy!
I would like to thank Jack Ferraro, Doug White with their assistance in planning, building,
and troubleshooting my fuel cell as well as use of their tools and equipment. I would also like to
thank Neil Whitehouse with his help in fabricating the current collectors with the CNC.
There are a number of people I have met at WPI who I would also like to acknowledge.
First off, thank you to Annemarie Field, Rebecca Yu, Dan Knox, Nick Deveau, Susan Yen,
Drew Martino, and Matt Perrone, not only for quick help, but making the lab more entertaining.
And second, thank you to Natalie, Mike, Reyyan, Jean Francois, Florent, Tom, Elli, Yuxian and
anyone else I may have left out. All of you have been amazing friends and we have created some
great memories together. Good luck to all of you for the future.
Finally, I want to thank my beloved parents, my sister Heather, and my brother Adam.
I’ve had so much pleasure talking to all of you about my research, even if it was hard to
understand at times! Thank you so much for supporting me and always being there for me.

iv
Table of Contents
Chapter 1: Background of Fuel Cell Technology ........................................................................... 1!
Direct Methanol Fuel Cells ......................................................................................................... 2!
Conventional Direct Methanol Fuel Cell .................................................................................... 3!
Direct Methanol Fuel Cell Issues ................................................................................................ 5!
Passive Direct Methanol Fuel Cells ............................................................................................ 8!
Phase of Methanol Feed ............................................................................................................ 11!
Objectives ................................................................................................................................. 12!
Chapter 2: Experimental Research on Passive Direct Methanol Fuel Cells ................................. 21!
Experimental Setup ................................................................................................................... 21!
Results and Discussion ............................................................................................................. 23!
Single Cell Performance ....................................................................................................... 23!
Prototype 1 and 2 Performance ............................................................................................. 25!
Prototype 3 Performance ....................................................................................................... 27!
Comments on Design, Construction, and Troubleshooting of Prototype 3 .............................. 34!
Conclusion ................................................................................................................................ 36!
Chapter 3: Theoretical Modeling of Passive Direct Methanol Fuel Cells .................................... 52!
Modeling Background .............................................................................................................. 52!
Mathematical Model ................................................................................................................. 54!
Results & Discussion ................................................................................................................ 64!
Conclusion ................................................................................................................................ 67!
Chapter 4: Final Remarks ............................................................................................................. 79!
Self-Fabricated Passive Direct Methanol Fuel Cell .................................................................. 79!
Passive Direct Methanol Fuel Cell Model ................................................................................ 80!
Appendix A: Methanol Gel MSDS ............................................................................................... 85!
Appendix B: Long-term Performance Plots of Prototypes 1 and 2 .............................................. 89!
Appendix C: MEA Preparation ..................................................................................................... 93!
References ..................................................................................................................................... 98!

v
List of Figures
Figure 1: PEMFC Schematic 14
Figure 2: Revised schematic of a DMFC 15
Figure 3: In-Depth Polarization Plot of a PEMFC or DMFC [38] 16
Figure 4: Comparison of Performance Between an "Active" and Passive DMFC. Exp. 09: no
passive qualities, Exp. 10: passive cathode, Exp. 11: passive anode, Exp. 12: passive anode and
cathode [21] 17
Figure 5: Orientation-Independent Vapor PDMFC 18
Figure 6: Comparison of Phase of Methanol Feed (Liquid and Vapor) and Their Effects on
Performance; Top - OCV over time, Bottom - Polarization Plots with Neat Methanol and Liquid
3M Methanol [32] 19
Figure 7: Prototype 1 PDMFC 38
Figure 8: Prototype 2 PDMFC 39
Figure 9: Prototype 3 PDMFC 40
Figure 10: Candle Lamp®
Power Heat gel canister, 75% methanol 41
Figure 11: Polarization Plots of a Single Cell (Clean Fuel Cell Energy Commercial MEA)
PDMFC Using Liquid Methanol 42
Figure 12: Polarization Plot of a Single Cell PDMFC (Clean Fuel Cell Energy Commercial
MEA) Using Methanol Vapor Solutions 43
Figure 13: Prototype 1 and 2 Polarization Curve 44
Figure 14: Prototype 3 OCV Plots Using Various Fuels 45
Figure 15: Polarization Plots of Prototype 3 Using Various Fuels 46
Figure 16: Performance of Vapor Fuels with a 3V Charge 47

vi
Figure 17: Change in Voltage from 1V charge to OCV 48
Figure 18: Effects of Forced Oxygen Leak and Purge on OCV 49
Figure 19: Individual Cell Polarization Plots Using Methanol Gel; T - top, B – bottom 50
Figure 20: Schematic representation of a PDMFC, including concentration profiles, external and
internal crossover currents, and short-circuit currents 71
Figure 21: Open Circuit Voltage versus Methanol Concentration; LC = 200µm, T = 353K, PO2
=
0.21 atm, mMA = 4 mg/cm2, mMC = 4 mg/cm2. (!): Schultz et al. model data, (!): This work
72
Figure 22: Polarization Plot with Varying Nafion Thickness; cMe = 4M, T = 298K, mMA = 4
mg/cm2, mMC = 2 mg/cm2. ("): Nafion 112, Liu et al. experimental data; (!): Nafion 112,
this work; (!): Nafion 115, Liu experimental data; (!): Nafion 115, this work; (!): Nafion 117,
Liu et al. experimental data; (!): Nafion 117, this work 73
Figure 23: Polarization Plot with Varying Methanol Concentration. LC = 127"m, T = 298K,
mMA = 4 mg/cm2, mMC = 2 mg/cm2. (!): 2M; (!): 3M; (!): 4M; (!): 5M; (!): 6M; (!):
7M 74
Figure 24: Polarization Plot with Varying Methanol Concentration; LC = 127"m, T = 298K,
mMA = 4 mg/cm2, mMC = 2 mg/cm2. (!): 2M; (!): 3M; (!): 4M; (!): 5M 75
Figure 25: Anode (bottom) and Cathode (top) Overpotentials with Varying Methanol
Concentration; LC = 127"m, T = 298K, mMA = 4 mg/cm2, mMC = 2 mg/cm2. (!): 3M; (!):
5M; (!): 7M 76
Figure 26: Heat and Power Produced Comparison; cMe = 4M, LC = "m, T = 298K, mMA = 4
mg/cm2, mMC = 2 mg/cm2. (!): heat; (!): power 77
Figure 27: Polarization Plot with Varying Temperature; cMe = 3M, LC = 127"m, mMA = 4

vii
mg/cm2, mMC = 2 mg/cm2. (!): 25ºC; (!): 40ºC 78
Figure 28: Future Concept Design for a 16-cell Passive Direct Methanol Fuel Cell. Left - Side
View, Right - Top View. 82
Figure 29: 16-cell PDMFC as constructed by Rapid Prototyping 83
Figure 30: Glass Lantern with Wick, or a Potential Idea for a Fuel Cartridge 84
Figure 31: Prototype 1 Long-term Performance Using Methanol Gel 89
Figure 32: Prototype 2 Long-term Performance Using Methanol Gel 90
Figure 33: Prototype 1 Long-term Performance Using Neat Methanol 91
Figure 34: Prototype 2 Long-term Performance Using Neat Methanol 92
Figure 35: Bipolar Bolt Sequence 97

viii
List of Tables
Table 1: Differences Between "Active" and Passive DMFCs 20
Table 2: Prototype 1 and 2 Performance Statistics 51
Table 3: Parameters of DMFC Model 69

ix
Nomenclature (Theoretical Model)
,0Hc + concentration of acid
cMe,0 initial concentration of methanol
cMe,ref concentration of methanol, reference
,0O2c concentration of oxygen
cW concentration of water
dM catalyst metal crystalline diameter
e
iD effective diffusion
DMe,A diffusion of methanol in the anode gas diffusion layer
DMe,W diffusion of methanol in water
DO,E diffusion of oxygen in the cathode gas diffusion layer
DO,W diffusion of oxygen in water
0MOR,E !
effective activation energy for methanol oxidation reaction
0ORR,E !
effective activation energy for oxygen reduction reaction
Eµ activation energy for viscosity
F faraday’s constant
A,0i exchange current density, anode
refA,0,i exchange current density, anode, reference
LA,i limiting exchange current density, anode
C,0i exchange current density, cathode
refC,0,i exchange current density, cathode, reference

x
LC,i limiting exchange current density, cathode
2OX,i crossover current density, oxygen
iX,Me crossover current density, methanol
iX,Me,L limiting crossover current density
!i current density, A cm
-2 geometric electrode area
*
!i current density, A cm
-2 metal catalyst surface
!,0i exchange current density, A cm
-2 geometric electrode area
*
!,0i exchange current density, A cm
-2 metal catalyst surface
KMe equilibrium constant
Ka equilibrium constant for proton salvation
e
Ak mass transfer coefficient, anode
e
Fk mass transfer coefficient, cathode
*
!k rate constant corresponding to potential dependence
*
!,0
k ! rate constant corresponding to equilibrium electrode potential
LA anode gas diffusion layer thickness
LB membrane thickness
LE cathode gas diffusion layer thickness
mMA active surface area for a given amount of catalyst, anode
mMC active surface area for a given amount of catalyst, cathode
,0O2p partial pressure of oxygen
ref,O2p partial pressure of oxygen, reference

xi
2COq volume fraction of CO2 bubbles at anode
qW volume fraction of water formation at cathode
R gas constant
Re Reynolds Number
RI interfacial resistance
r" reaction rate, A cm-2
geometric electrode area
*
!r reaction rate, A cm
-2 metal catalyst surface
!,0r exchange reaction rate, A cm
-2 geometric electrode area
*
!,0r exchange reaction rate, A cm
-2 metal catalyst surface
Sc Schmidt Number
Sh Sherwood Number
T temperature
Tref temperature, reference
V total voltage
V0 thermodynamic voltage
xMe,0 mole fraction of methanol
#A transfer coefficient, anode
#C transfer coefficient, cathode
$ degree of dissociation
%MA ratio of active catalytic surface area to MEA area, anode
%MC ratio of active catalytic surface area to MEA area, cathode
& ratio of mutual to matrix effective diffusion coefficients
'G Gibbs free energy

xii
'H enthalpy
(A void fraction of gas diffusion layer, anode
(C volume fraction of water in membrane
(E void fraction of gas diffusion layer, cathode
)A overpotential, anode
)PEM Ohmic overpotential
)C overpotential, cathode
*CO adsorbed carbon monoxide sites
*CO,ref adsorbed carbon monoxide sites, reference
2O! partition coefficient for oxygen
+ water molecules per sulfonic group in Nafion
-Ae! electron stoichiometric number, anode
-Ce! electron stoichiometric number, cathode
-e!!
electron stoichiometric number
!i" proton stoichiometric number
, electro-osmotic drag coefficient of water
"M metallic density of catalyst
-C effective PEM conductivity
.I available metal surface involved in electrocatalysis in contact with ionomer
/ volume fraction of water in membrane at OCV conditions

1
Chapter 1: Background of Fuel Cell Technology
A wide range of rapidly developing fuel cells has shown promise as an alternative energy
source since the discovery of their concept by William Grove in 1839. While they show great
potential as an efficient energy producer, further development and significant cost reduction are
necessary in order for fuel cells to be commercially viable. Currently, the most popular low
temperature fuel cell (<100ºC) that is widely used is the Polymer Electrolyte Membrane Fuel
Cells (PEMFC), which is able to compete effectively with the ever-improving battery technology,
although cost remains a barrier. A PEMFC, as shown in Figure 1, is composed of an anode and
cathode electrode where hydrogen and oxygen fuels are fed to and react, both composed of a gas
diffusion layer and catalyst, as well as an electrolyte to allow protons formed at the anode to pass
through to the cathode, usually a Nafion membrane. Also included is an external load to allow
electrons to travel to the cathode and power an electronic device, such as a light bulb or radio.
Although batteries have proven to be indispensable, their biggest fault is the hazardous
products contained within the cells (e.g., cadmium, lead, or mercury). As a result, they must be
disposed of properly; else they become a risk to the environment. On the other hand, PEMFCs
generate no greenhouse gases directly, and only produce a small amount of water. Another
advantage of PEMFC over batteries is its duration of performance. Batteries have a short shelf
life and must be disposed of when depleted, which reinforces the concern of hazardous waste.
Although rechargeable batteries are common, their capacity and duration decreases with each
recharge. Further, excess recharging can potentially damage the battery. Meanwhile, a PEMFC
can perform up to several thousands of hours, provided a continuous supply of fuel is available.
Despite these advantages, the most significant reason they have not become commercialized is
due to their high cost. The use of expensive catalyst (usually platinum), paired with the

2
expensive membrane (usually Nafion) results in a large cost, a major turnoff compared to the low
price of batteries. Another issue is the use of hydrogen as fuel. Since hydrogen is extremely hard
to store and is dangerous, the concept of PEMFCs as a battery replacement faces an uphill battle.
Direct Methanol Fuel Cells
Currently, the only other competitor in the low temperature fuel cell market is the Direct
Methanol Fuel Cell (DMFC). As the name implies, the fuel source for the DMFC anode is
methanol, rather than hydrogen. The use of methanol brings several advantages; for example,
methanol has a much higher energy density compared to hydrogen. Additionally, its energy
density is also notably larger than other batteries [1]. Another advantage of using methanol is its
storage and distribution capabilities. There are great concerns regarding transporting hydrogen
due to its high volatility and hazardous properties. Further, storing hydrogen is also a
cumbersome process, as it must be compressed using high pressures. Although liquefaction of
hydrogen is an option, it significantly lowers the energy density due to the significant investment
in the liquefaction process. Concerning cathode fuel, while the PEMFC and DMFC cathode
perform best with pure oxygen, they can alternatively run on ambient air. Further, the DMFC can
take advantage of these convenient fuels and perform in a completely passive setting; in other
words, a fuel cell with no external equipment and the ability to perform in a compact setting
much like a battery, provided a supply of methanol fuel is available. This convenient fuel cell,
known as a Passive Direct Methanol Fuel Cell, or PDMFC, provides great promise as a portable
energy source, as discussed in more detail later.

3
Conventional Direct Methanol Fuel Cell
A DMFC (as well as a PEMFC) is a multi-layered system comprised of several
components, as shown in Figure 2, including an anode and cathode bipolar plates, and a
Membrane Electrode Assembly (MEA) comprising of an anode and cathode gas diffusion layer
(GDL), an anode and cathode catalyst layer, and a Proton Exchange Membrane (PEM). The
bipolar plates, usually constructed from a conductive material like graphite, encase the MEA and
feed methanol at the anode and oxygen (or air) at the cathode while removing any products, such
as carbon dioxide bubbles. The bipolar plates are also fabricated with a unique flow pattern,
which gives the methanol and oxygen fuels uniform coverage across their respective electrodes.
The geometries of the flow channels are important, as optimal design can reduce mass transfer
limitations as well as kinetic and ohmic limitations. The most common flow field used is a
serpentine channel, although there have been many other variations used with varying success
[2]. In a passive system, since there are no pumps to promote fuel flow, these are usually omitted.
The GDL, typically composed of carbon paper or carbon cloth, is a porous and
conductive material that both distributes the anode and cathode fuels to their respective catalysts
and transports the generated gaseous and liquid products as well as electrons to the bipolar plate.
Further, it assists in the removal of heat generated by the fuel cell. The GDL can also be treated a
number of ways to improve performance, such as wet-proofing with polytetraflouroethylene
(PTFE) or using a hydrophilic anode backing layer. The GDL can also have a micro porous layer
(MPL).
The catalyst, used to promote both half-cell reactions, is comprised primarily of a
platinum and ruthenium alloy at the anode and platinum at the cathode. Generally, increasing the
catalyst loading directly improves DMFC performance to a certain degree [3], but doing so

4
increases the already high cost of the MEA. At the anode, no pure metal catalyst is able to
sufficiently activate methanol because of binding to strongly bounded CO, activate water via
bonding to weakly bounded OH, or remove strongly bounded CO or OH poisoning [4]. Instead,
platinum and ruthenium in a bi-functional catalyst each perform a different function. While there
are many suggested mechanisms for the decomposition of methanol [4], a simple mechanism is
described. When methanol comes into contact with platinum, it reduces to carbon monoxide,
protons, and electrons.
CH3OH
Pt! "# COads+4H
++4e
- (1)
Unfortunately, carbon monoxide, by strongly binding to catalyst, has a detrimental effect on the
performance of a DMFC [5]. To mitigate this issue, ruthenium acts to decompose water at a
relatively low overpotential to produce hydroxide, another proton, and another electron.
H2O
Ru! "# OHads+H
++e
- (2)
The adsorbed hydroxide can then react with the adsorbed carbon monoxide, producing
carbon dioxide, along with another proton and electron.
COads+OH
ads
Pt/Ru! "## CO2+H
++e
- (3)
Thus, the anode half-cell reaction, or methanol oxidation reaction (MOR), can generate a total of
six protons and six electrons per molecule of methanol, compared to 2 of each for a molecule of
hydrogen in a PEMFC.
CH3OH+H
2O
Pt/Ru! "## CO2+6H
++6e
-
(4)
While the electrons created from the anode travel through an external circuit, thus providing
power, the protons travel through a Nafion membrane via diffusion or electro-osmotic drag
depending on the applied load (elaborated more in Chapter 4). At the cathode, the oxygen

5
reduction reaction (ORR) occurs, reacting with the permeated protons and circumvented
electrons.
O2+4H
++4e
- Pt! "# H2O
(5)
Combining both half-cell reactions (Equations 4 and 5) provides the overall reaction in a DMFC.
CH3OH+ 3
2O2! "# CO
2+2H
2O
(6)
A typical polarization plot showing PEMFC or DMFC performance is depicted in Figure
3. Theoretically, the PEMFC and DMFC should provide the thermodynamic voltage of 1.2 V.
However, the open circuit voltage (OCV), or the voltage at which no load is being applied, for a
PEMFC is about 1.0 V [6] while a DMFC’s OCV is about 0.6 V, but is dependent on many other
parameters such as temperature [7] , Nafion thickness [8], and methanol concentration [9]. The
specifics to the losses in performance are elaborated further in Chapter 3.
Direct Methanol Fuel Cell Issues
Despite the advantages of DMFCs over PEMFCs as a low temperature fuel cell
competitor of batteries, it brings numerous disadvantages. The most problematic issue in DMFC
technology is methanol crossover. Since methanol is easily dissolved in water and Nafion easily
absorbs methanol and water, methanol can easily permeate from the anode to the cathode,
reducing cathode performance. This phenomenon creates a number of issues, including poor fuel
utilization and reduction of both voltage and current density, and thus performance [10]. To
reduce methanol crossover, methanol must be diluted to a very low concentration, about 1M-2M
[11]. Lower concentrations suffer from mass transfer limitations and will not perform beyond a
current density, while higher concentrations are plagued by excessive methanol crossover,
reducing overall performance. Because the methanol must, hence, be diluted, the DMFC is not

6
able to properly utilize methanol’s high energy density, significantly inhibiting its potential. The
effects of methanol crossover are discussed in more detail later on.
A way to reducing methanol crossover is to change the properties of the Nafion
membrane. The simplest method is to increase the membrane thickness (Lc). With an increase of
thickness, methanol is less able to permeate through to the cathode and as a result will improve
performance at lower current densities. However, thicker membranes also reduce proton
transport. This causes a reduction in performance at higher current density conditions, which also
translates to a lower power density [12].
Other options include changing the properties of the Nafion membrane. For example, Lin
et al. [13] have fabricated Nafion/poly(vinyl alcohol)-fiber composite membrane, prepared via
electro-spinning. Poly(vinyl alcohol) (PVA) has a higher affinity for water than Nafion and a
lower affinity for methanol. Although the Nafion/PVA membrane exhibited a lower OCV (due to
a thinner membrane than the Nafion 117), its performance was improved overall due to a lower
normalized membrane proton resistance (LC/#) [13]. Another idea is using a Nafion-
polybenzimidazole blend, which reduces the membrane swelling and methanol permeability.
Wycisk et al. [14] showed an improvement in performance using a low (3 wt%) blend of PBI
impregnated into the Nafion membrane, especially at higher methanol concentrations.
Unfortunately, higher PBI-blend content reduced performance due to an increase in ohmic
resistance [14]. Various other membrane hybridizations have been experimentally tested, such as
poly(tetrafluoroethylene) (PTFE) [15], sulfonated poly(ether ether ketone) (s-PEEK) [16], and
silicone oxide [17], all with a variable amount of success.
Another issue in DMFC is the large overpotentials produced by the methanol oxidation
reaction (MOR) and oxygen reduction reaction (ORR) at the anode and cathode, respectively,

7
significantly reducing overall performance. While methanol and oxygen crossover is one reason
for the generated overpotentials, they are also caused by adverse adsorption. As discussed above,
at the anode, the MOR can produce CO, a stable intermediate product. Unfortunately, adsorbed
CO results from adsorption of methanol, thus poisoning the anode catalyst, usually a platinum
alloy, and increasing overpotential, and severely reduceing performance. This issue can be
somewhat remediated with the use of ruthenium as the alloying metal with platinum, however
the effect of carbon monoxide is still dominant. Further, the cathode can also generate some
carbon monoxide and carbon dioxide due to crossed-over methanol reacting at the cathode. The
MOR and ORR also suffer from sluggish kinetics; while the ORR has a known exchange current
density of 10-10
mA/cm2 (compared to hydrogen’s exchange current density of 10
-3 mA/cm
2 or
higher), the exchange current density of the MOR is not well known, but it is quite low.
Regardless, due to the poor performance of the DMFC anode and cathode, a notably higher
catalyst loading must be used (usually around 4 mg/cm2, compared to less than 0.2 mg/cm
2 for a
PEMFC) to provide a mediocre power density.
A third issue is carbon dioxide and water management. In the anode and cathode half-cell
reactions, respectively, carbon dioxide is formed at the anode and water is formed at the cathode.
The carbon dioxide bubbles generated at the anode can block reaction sites and flow channels,
limiting the transfer of methanol and water to the anode and, therefore, reduces performance.
Further, carbon dioxide also has an effect on the limiting current density at higher current
densities, which further reduces its overall performance. Currently, the best ways to address the
carbon dioxide production is operating with a high methanol feed flow rate, creating a vacuum at
the anode, or pressurizing the cathode [18]. While water is consumed at the anode, it is also
generated at the cathode, which also reduces performance in a similar fashion to carbon dioxide

8
at the anode by limiting oxygen access to the cathode catalyst. In addition, water can also
crossover to the cathode. To minimize water crossover and remove water generated at the
cathode, a high oxygen flow rate and high membrane thickness can be used along with a
hydrophobic cathode gas diffusion layer to avoid filling up with water [19].
Passive Direct Methanol Fuel Cells
Conventional DMFCs focus on the optimization of performance with the assistance of
ancillary equipment, for example: pumps, fans, and heat exchangers. However, the ancillary
equipment is parasitic to DMFC performance due to its power consumption and, thus, saps the
maximum achievable power density, in addition to increasing the cost of operation. Passive
DMFCs (PDMFC), on the other hand, have little to no ancillary equipment and instead rely on
their ambient nature to perform; they are simple and compact. Methanol, typically around 4 or
5M [9], is stored in a reservoir and diffuses into the anode, driven by the concentration gradient
between the reservoir and the anode. Likewise, oxygen diffuses into the cathode from ambient
air. These diffusion limitations can, however, limit PDMFC performance. Because PDMFCs can
run more efficiently because of the lack of parasitic equipment and power, as a result, they can
produce a higher energy density [20]. This compact setup is ideal for a number of applications as
a battery replacement, like portable electronics (PDAs, cell phones, etc.) or camping equipment.
The differences between a conventional, or “active”, DMFC and passive DMFC are further
shown in Figure 4 [21], as well as the difference in performance in Figure 4. While a PDMFC
has added convenience of being portable, the drop in performance becomes very significant,
dropping from about 45 mW/cm2 in a conventional setup to 13 mW/cm
2, almost a 70% drop. The
differences in performance parameters between a conventional DMFC and a PDMFC are defined
simply in Table 1.

9
Because of their compactness and potential, many industries have shown interest in
PDMFC technology, such as Toshiba, Motorola, Samsung, and Hitachi. In addition, work on
multi-cell PDMFCs have also been significantly researched and documented. Thus, Guo and
Faghri [22] have developed an orientation-independent one watt PDMFC using four cells, using
a total active area of 36 cm2, as shown in Figure 5 [23]. Neat methanol from a separate
compartment flows (via pinch valve to vary molarity) while being actively diluted in situ with
water produced at the cathode. Because the water is supplied within the membrane, pumps and
other water collection equipment are not necessary. The PDMFC also has several functionality
features, such as a micro methanol flow controller to shut off methanol supply, a stable vapor
fuel supply via heating, water management and air filtering via additional GDLs and a layer of
SPCTM
Oil Sorbents, and a check valve that releases excess carbon dioxide upon reaching an
interior threshold pressure. While an impressive unit, Guo and Faghri have mentioned that
optimal designs are needed to further improve the PDMFC [23]. Kim et al. developed a one watt,
six-cell monopolar stack, passive micro-DMFC with a total active area of 27 cm2. Using 5M
methanol, their PDMFC was able to perform at one watt. Although their PDMFC still suffers
from many common DMFC issues, such as carbon dioxide buildup and methanol crossover, Kim
et al. has shown significant progress in improving PDMFC performance over the course of
several years, increasing the maximum power obtained from less than 5 mW/cm2 to 37 mW/cm
2
through optimization of composition and structure of the MEA, through minimizing mass
transport resistance and charge transfer resistance, and current collectors, by maximizing access
of methanol and oxygen fuels while inhibiting development of carbon dioxide and water
blocking [24]. Chan et al. also constructed a six-cell monopolar stack PDMFC with a total active
area of 37.5 cm2, able to generate 350 mW. This power was obtained using 6M methanol, which

10
increased the cell temperature to over 70ºC and further increased kinetics. The higher
temperature also helps in water management; Chan et al. showed that while a single cell PDMFC
had accumulated a large amount of water at the cathode, virtually no water was formed on the
individual cells in the PDMFC. However, because one of the cells in the stack had a higher
internal resistance compared to the other cells, overall performance was slightly reduced [25].
Tsujiguchi et al. fabricated an 8-cell PDMFC stack with a total active area of 66 cm2. Using near
pure methanol vapor with the assistance of a porous carbon plate, they achieved a power density
of 1.8 W. Running at a constant 0.25 V load, the PDMFC was able to sustain a power density of
around 27 mW/cm2 for about 25 hours, afterwards dropping at a constant rate for another 55
hours [26].
However, PDMFCs suffer from a unique set of issues not prevalent in conventional
setups. For example, Eccarius et al. have experimentally shown that passive fuel “flow” notably
impacts performance. Because of the higher methanol concentration requirement, methanol
permeation rate increases, which directly results in a drop in performance [21]. Although
increased methanol crossover increases the operating temperature (and thus, electrokinetics), the
actual impact of this heating is not well known [9]. Usually, a constant flow of water-rich liquid
methanol helps keep the anode well humidified and would not be exhausted in the methanol
oxidation reaction (MOR). Further, oxygen flow helps remove water formed on the cathode
GDL, freeing electrode reaction sites [27].
Another rather unique problem is orientation dependency on performance; a vertical
orientation behaves and performs differently compared to a horizontal setup. OCV is uniformly
lower in the vertical position with increasing methanol concentration due to increased methanol
crossover. Despite the reduced OCV, the vertical orientation also generates a greater amount of

11
heat, which improves performance at high current densities and provided a larger power density
output compared to its horizontal counterpart [28].
Because of the removal of a heat source and the generation of heat with increasing fuel
concentrations, heat management becomes another issue [29]. In fact, Broussely and Archdale
estimate that at most, 30% of the energy produced is expected to be electricity whereas the rest is
converted to heat and lost [30]. Although heat management has not been thoroughly discussed in
the most recent publications, Faghri and Guo have applied the use of a heat transfer system in
their fuel cell. The heat transfer system is directly coupled with an evaporation pad at the anode
and raises its temperature, vaporizing the methanol fuel while avoiding water condensation [23].
While this apparatus has potential, it removes the convenience of a completely passive system.
Phase of Methanol Feed
When liquid methanol fuel is used in PDMFCs, carbon dioxide is produced and builds up
over time. Eventually, excess carbon dioxide bubbles prevent the fuel from reacting at the anode
electrode. Normally, a continuous flow of methanol resolves this issue by “cleaning” the anode
surface, but passive fuel cells do not have this luxury. As an alternative, neat methanol vapor can
be used as fuel due to its high volatility, so long as the methanol is not exposed to the Membrane
Electrode Assembly (MEA) directly. Any water required for the anode half-cell reaction is
instead supplied by the cathode via back diffusion [23]. Interestingly, the activity at the anode
using highly concentrated (or pure) methanol vapor is akin to the use of liquid methanol feed, if
an appropriate concentration is used [31]. Despite this, the different methanol feeds behave
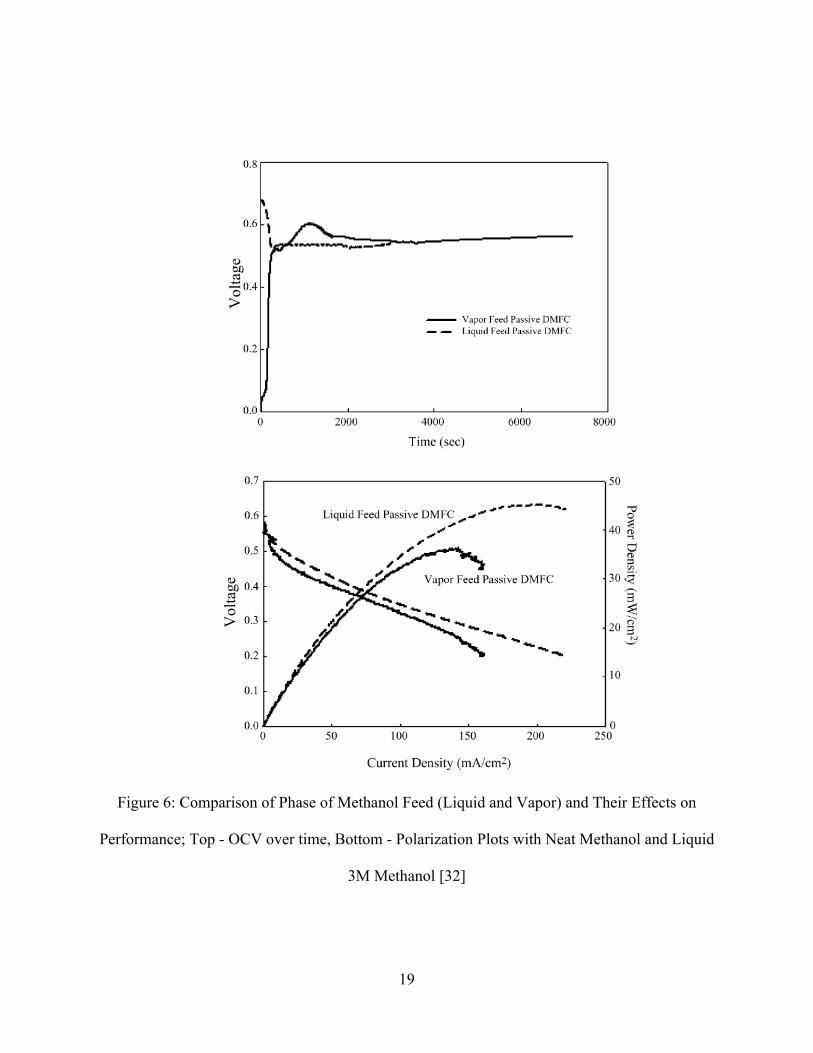
differently. According to the OCV plots versus time in Figure 6, the temporal OCV of liquid
methanol quickly spiked above the stable OCV while the OCV using neat methanol jumped
above the stable OCV about half an hour later. These sudden jumps in OCV demonstrate the

12
effects of methanol crossover on performance. Also, the neat methanol feed OCV was greater
than the liquid methanol feed OCV, indicating that methanol crossover is more of an issue with
liquid methanol feed. Vapor fuel still performs slightly worse than liquid fuel at lower current
density conditions and also alludes to a lower limiting current density, as shown in Figure 6. In
addition, vapor fuel cannot properly hydrate the MEA membrane, which increases internal
resistance. Despite these issues, vapor-fed PDMFCs are slightly more fuel efficient and can
provide a higher energy density [32]. Vapor-fed PDMFC performance could also be further
improved with a more efficient form of water management; condensed water on the anode
surface us unable to diffuse quickly through methanol fast enough due to a small binary
coefficient and reduces the driving force of vapor methanol, which hinders performance [33].
While not often discussed, another variant of fuel for PDMFCs is methanol gel. The
concept of using methanol gel is still a relatively fresh idea and has not been discussed in any
recent publications. For example, methanol can be converted into a gelatinous material with the
use of a gelling agent, such as nitrocellulose, Carbopol 934, prepared carboxyl vinyl polymers.
Since a gelled organic liquid has a slower rate of evaporation, its effectiveness as a fuel is
increased. However, the gelling agent can separate from the methanol, creating an undesirable
product [34]. Since the gel cannot be fed to the cells directly, a proposed method is the use of a
fuel cartridge to hold either gelled methanol or a viscous solution of methanol and implementing
an external fuel delivery system [35].
Objectives
The concept of using PDMFCs with handheld electronics or camping equipment has
great potential. In addition, the convenience of using a non-prepared fuel, such as neat methanol
or methanol gel, over a diluted liquid feed is also a consideration in the development of a

13
convenient energy source, despite its possible performance shortcomings. Therefore, the primary
objective of this work was to construct a functional multi-cell PDMFC and to investigate its
performance, promise, and limitations. Secondary objectives included obtaining performance
curves using a variety of fuels, including liquid methanol, neat methanol vapor, and methanol gel,
stable OCV plots versus time, and long-term voltage and power performance tests.

14
Figure 1: PEMFC Schematic [36]

15
Figure 2: Revised schematic of a DMFC [37]

16
Figure 3: In-Depth Polarization Plot of a PEMFC or DMFC [38]

17
Figure 4: Comparison of Performance Between an "Active" and Passive DMFC. Exp. 09: no
passive qualities, Exp. 10: passive cathode, Exp. 11: passive anode, Exp. 12: passive anode and
cathode [21]

18
Figure 5: Orientation-Independent Vapor PDMFC [23]
19
Figure 6: Comparison of Phase of Methanol Feed (Liquid and Vapor) and Their Effects on
Performance; Top - OCV over time, Bottom - Polarization Plots with Neat Methanol and Liquid
3M Methanol [32]
Volt
age
Volt
age

20
Table 1: Differences Between "Active" and Passive DMFCs
Parameters “Active” Passive
Feed Supply (Anode) Continuous flow of ~1M methanol Reservoir of ~4M methanol or
neat methanol vapor
Feed Supply (Cathode) Continuous flow of oxygen or air Reliant on ambient air
Operating Temperature Can be set, between 70ºC-100ºC Dependent on reaction, cathode
Equipment Pumps, fans, compressors, heat
exchangers None
Parasitic Power Significant None
Transport Limitations Small Large

21
Chapter 2: Experimental Research on Passive Direct
Methanol Fuel Cells
Experimental Setup
The performance and feasibility of a multi-cell PDMFC were tested using several
prototypes of different proportions. Prototype 1 (Figure 7) was machined from a block of acrylic
into a small cube with a hollow interior for methanol storage. A transparent screw-in cover with
nylon screws prevented methanol vapor from escaping as well as air from entering. Further,
screw-in sides with nylon screws were used to firmly seal the OnlineMetals®
current collectors
(0.018” 316SS with 16 holes, about 26% coverage), a commercial Clean Fuel Cell Energy
(CFCE) MEA using Nafion 117 with an anode catalyst loading of 4 mg/cm2 Pt/Ru and cathode
catalyst of 4 mg/cm2 Pt, and silicon gaskets (supplier unknown). Four MEAs were installed, one
MEA per side, connected in series, and run with 75% methanol gel, neat methanol, and various
liquid methanol feeds. Prototype 2 (Figure 8) was constructed from polycarbonate with a
polycarbonate removable top (sealed with an O-ring) and was downsized to reduce volume and
weight. Screw-in sides were secured by nylon screws with a unique Mottcorp®
cathode current
collector (0.095” porous stainless steel, unknown grade), also encasing silicon gaskets (supplier
unknown) and a anode current collector from OnlineMetals®
(0.018” 304SS with 16 holes,
about 26% coverage). Again, one MEA was used per side and four cells were connected in series
tested with neat methanol and methanol gel feeds. All tests were run in ambient air conditions
and ambient temperature conditions, about 25ºC.
Initial testing of the PDMFC only consisted of one MEA with the remaining three sides
blocked with a layer of silicon. Polarization plots were obtained using a variety of fuel sources,
including liquid methanol solutions of various concentrations, methanol vapor of various
"8
1
"8
1

22
concentrations, and methanol gel, similar to the commercially available Sterno. Methanol gel can
provide several advantages over liquid and vapor methanol fuels. For one, because Sterno®
contains methanol and is already mass-produced, it is a very easy to obtain fuel source. Second,
the gel is already prepared with methanol and is easy to handle. And third, the remaining
contents of the gel can be hydrated with methanol, allowing for easy refueling. Polarization plots
were also obtained for a fully assembled PDMFC. All polarization plots were obtained with a
Hewlett Packard 6060B Electronic Load Box.
The four MEAs were connected through a series connection. In theory, if each of the four
MEAs can supply about 0.4 V, the PDMFC should have similar voltage output to a AA battery,
which typically supplies 1.5 V. At stable voltage, both PDMFC prototypes were also tested for
sustainability and long-term performance. In prototype 1, 7 grams of neat methanol/10 grams of
methanol gel was used while 4 grams of neat methanol/5 grams of methanol gel was used in
prototype 2. Both prototypes were run until their performance diminished to a voltage of 0.1 V.
Further testing was done on a larger third prototype (Figure 9); a 12-cell fuel cell unit was
machined from a block of polycarbonate for larger voltage and power output, suitable for smaller
electronic consumer products operating within 3-6 V. Each cell was constructed with the
following specs: OnlineMetals®
0.048” thick stainless steel drilled with 25 1/8” diameter holes
(about 40% coverage) using a Computer Numerical Control (CNC), PORON®
Urethane foam
gaskets from Rogers Corporation, a commercial Nafion 117 membrane from IRD with a catalyst
loading of 4 mg/cm2 Pt/Ru at the anode and 4 mg/cm
2 Pt at the cathode with ETEK carbon cloth
GDLs, and sealed by four #8-32 $” pan head stainless steel screws (supplied by WPI) insulated
with a silicone (supplier unknown) cover and screwed onto a nylon washer (also supplied by
WPI) to avoid short circuiting. Rather than using metallic tabs to establish connections between

23
the units, Allied Electronics®
silver epoxy was embedded with a multi-threaded wire into a
manually cut slit in the stainless steel plate. The interior of the fuel cell was machined into a 3.5”
diameter circle, large enough to fit a Candle Lamp®
Power Heat gel canister (75% methanol), as
shown in Figure 10. Two tabs each were provided in the current collectors to act as the anode
and cathode and used to connect to either a load box for testing purposes or other devices.
Polarization plots and OCV plots (versus time) were collected using neat methanol vapor,
methanol gel, and liquid methanol solutions. In addition, the vapor fuels were further tested for
long-term performance by running at a constant 3V and monitoring their power and output with
time until depletion of the fuel.
Results and Discussion
Single Cell Performance
Prior to testing the performance of the fully assembled prototypes, one MEA was
thoroughly tested in a PDMFC with various fuels. Figure 11 shows the polarization curve of a
PDMFC using increasing liquid methanol concentrations. Immediately noticeable is its overall
poor performance compared to suggested literature performance (e.g. see Figure 4). According to
literature, OCV of a PDMFC usually lies between 0.50V and 0.60V [39, 40]. Further, the power
density output in Figure 11 is relatively small. This may be in part due to poor sealing of the
MEA from using nylon screws. Although there was no obvious leaking of methanol, oxygen or
air leaking into the methanol reservoir is a possibility and can affect performance. Another
possibility for poor performance is a partially damaged MEA caused from fuel starvation, which
is elaborated later.
At OCV conditions and low current density conditions (i<3 mA cm-2
), lower methanol
concentrations perform better than higher methanol concentrations (Figure 11). This decrease in

24
performance with higher methanol concentration is largely due to an increase in methanol
crossover from the anode to the cathode. At higher current densities, the PDMFC is able to
utilize higher concentration fuel more efficiently, however, increasing mass transfer, and thus
performance. The fuels of lower concentrations are mass transfer limited and are unable to
sustain high current densities. These directly translate into an increase in performance in the
more concentrated fuels (5M and 7M) over the lower concentrated fuels (1M and 3M) at higher
current densities. However, the 5M methanol fuel still uniformly outperformed the 7M methanol
fuel and provided the highest power density (4 mW cm-2
).
In addition to liquid methanol, vapor fuels were also tested in the single cell PDMFC, as
shown in Figure 12. As before, OCV is notably lower than it should be, as well as compared to
Figure 11. The additional drop was most likely caused due to increased mass transfer limitations
of vapor fuel as compared with liquid. In particular, the 1:1 methanol vapor solution performed
very poorly compared to the other runs so far. This may have been due to an exceedingly low
concentration of methanol, causing a substantially mass transfer limited performance.
However, the neat methanol vapor and methanol gel (75% methanol) vapor provided
very similar results. The methanol gel performed slightly better at low current density conditions
and under OCV conditions. This is a direct result of a lesser degree of methanol crossover.
However, neat methanol outperforms the methanol gel at higher circuit conditions, which
suggests that the methanol gel’s performance may be restricted by a mass transfer limitation.
Further, this slight increase in voltage at higher current density conditions also slightly increased
the neat methanol maximum power density. These results show a highly promising potential for
methanol gel as a unique and convenient fuel source, particularly for camping applications, when

25
the gel can provide both a heat source for cooking as well as for powering a radio, camp light,
etc. In fact, Prototype 3 performs this function very well, as discussed later on.
Prototype 1 and 2 Performance
Figure 13 represents the polarization curve of the fully assembled Prototype 1 PDMFC
with four CFCE MEAs electrically connected in series and fueled by methanol gel. While the
polarization plot for Prototype 2 is not provided here, its performance was quite similar. It may
be noted with the Prototype 1 polarization plot in Figure 13 that the stack voltage due to the cells
being connected in series is simply additive as expected, while the current density was
unaffected. Interestingly, the observed OCV was even higher than indicated by the OCV in
Figure 12 using methanol gel; about 0.35 V in the single cell PDMFC (with the estimated OCV
being ~1.4 V) while the new OCV reached just over 1.6 V. This overall increase in the voltage in
Prototype 1 had a direct effect on the power density, increasing four times from 3.3 mW/cm2 for
a single cell to 13 mW/cm2. Taking into account all four MEAs with an active area of 5 cm
2 each,
i.e., a total of 20 cm2, Prototypes 1 and 2 are expected to provide a power output of about 260
mW.
Table 2 shows a performance comparison of prototype 1 and prototype 2 using neat
methanol vapor and methanol gel, including capacity, power, heat generated, and overall
efficiency. From the current/power-time plot in Figure 31-Figure 34, the capacity, power, heat,
and efficiency were calculated; the capacity, or the total electric charge produced by the fuel cell,
is
q = I dtt=0
t
! (7)
where I is the current, the total electric work is

26
W = - (VI )dtt=0
t
! (8)
and the maximum electric work generated by the fuel cell is
Wmax
= nfuel (-!H fuel ) (9)
where nfuel is the total number of moles consumed within the PDMFC and -!Hfuel
is the enthalpy
combustion of methanol, and the efficiency is
! =W
Wmax
(10)
Because the methanol gel is only 75% methanol, an equivalent amount of methanol gel is
used to comparatively judge the PDMFC’s performances. Using methanol gel as fuel, Prototype
1 performed for about 40 hours and provided 3050 mAh and 333 Wh/kg. These numbers are
superior to a AA Ni-MH battery cell, which, as of 2009, exhibits a capacity of about 2700 mAh
and a specific energy of 110 Wh/kg [41]. This clearly shows the potential of both PDMFCs as an
energy source and methanol gel as a fuel source. Because Prototype 2 has a smaller interior
volume, it could only hold half as much fuel; as a result, its capacity is slightly less than half than
Prototype 1, only running for about 20 hours.
When compared to neat methanol vapor fuel, their performance is very comparable.
Prototype 1 ran for about 32 hours and provided slightly less capacity (2450 mAh) and power
(1.0 Wh) than methanol gel, an all-around drop in performance. Meanwhile, Prototype 2 ran for
about 18 hours with a total capacity of 1800 mAh and 1.4 Wh, a slight improvement compared to
the methanol gel. Although the performance of neat methanol and gel is comparable, methanol
gel shows great potential as a fuel replacement for PDMFCs because of its ease of availability
and usage/handling.

27
Unfortunately, both prototypes suffer low efficiency and a substantial amount of heat loss.
Thus, the efficiency of the PDMFCs is only 3-5%. With better design and some form of heat
retention to increase their temperature, the performance of the prototypes can be improved.
Although these early PDMFC prototypes show good potential as a portable energy source,
clearly significant improvement is possible. That being said, the PDMFCs developed still
provide a more advantageous energy density as compared with batteries [42].
Prototype 3 Performance
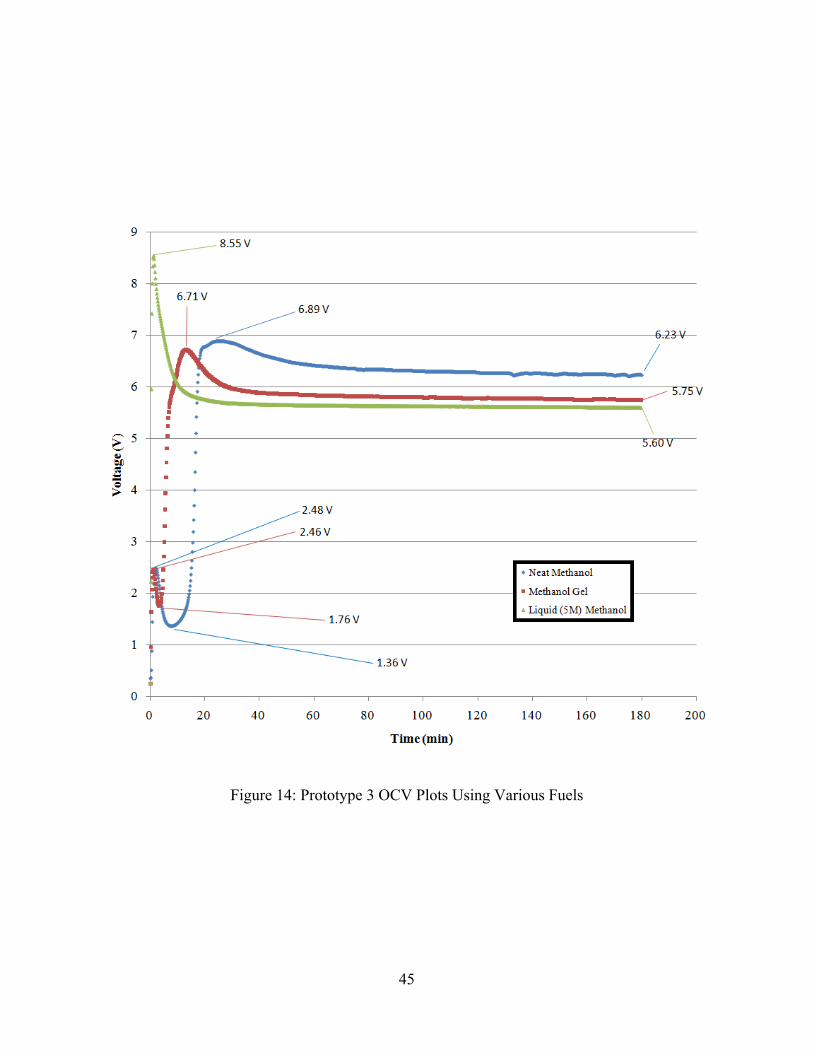
The OCV of Prototype 3 was first tested using liquid (5M) methanol, neat methanol
vapor, and methanol gel vapor, as shown in Figure 14. In the process of reaching steady state, the
liquid methanol quickly rose well above its stable OCV within the first few minutes. The voltage
then quickly dropped off to its stable value after about 10 minutes and sustained a constant OCV
at about 5.60V. The methanol gel and neat methanol vapors performed similarly in achieving
stable OCV, but in an awkward fashion. The methanol gel first quickly peaked within the first
few minutes, and then just as quickly dropped close to one volt. The neat methanol vapor
performed similarly, however its drop in voltage was more significant and maintained that drop
for a notably longer period of time. After reaching some local voltage minima, the OCV of both
vapor fuels then peaked higher than its stable OCV in a similar fashion to the liquid methanol.
The stable OCV of the neat methanol finally reached after about 30 minutes, with a slow
continuous drop over time to 5.75V. The neat methanol took slightly longer to reach a stable
OCV (about an hour) and still continued to drop over time to 6.23V.
The curious behavior of liquid methanol OCV is because of interplay of various transport
processes. For the case of liquid methanol solution, the methanol has not yet permeated to the
cathode within the first few minutes of operation, resulting in a lower mixed potential and,

28
therefore, higher performance [40]. Further, while the voltage does slowly drop as the methanol
slowly crosses over to the cathode, it does not drop below its stable OCV due to the lower
diffusion rate of methanol-water compared to methanol vapor-air [43]. Afterwards, it is evident
that the significant drop from a quick high of 8.5 V to 5.6 V is because of methanol crossover
across PEM to the cathode, increasing its overpotential, although it is possible that some of it is
also due to the anode poisoning as carbon monoxide accumulates on the anode surface in the first
few minutes.
The behavior of neat methanol vapor and methanol gel vapor is rendered more complex,
likely because of the presence of air (and oxygen) present in the anode chamber when it is fueled
and the lid is closed, which is not the case for liquid methanol. For the case of neat methanol
vapor, thus, the first drop in voltage could be a result of a combination of carbon monoxide
accumulation on the surface and the presence of oxygen, which can cause a significant parasitic
current at the anode. Once it is depleted however, the voltage rises rapidly to a peak and then
declines again to a steady-state OCV because of methanol crossover. The behavior of methanol
gel may be similarly explained. The difference in the time scale is probably due to the slower
release of methanol vapor from the gel than from neat methanol liquid, both due to a lower vapor
pressure and because of greater transport limitations in evaporation.
The final OCV of the methanol vapor fuels were more unpredictable compared to the
liquid fuel. Although there was a slight decrease in the liquid methanol fuel’s stable OCV, the
drop was only a fraction of a voltage. Meanwhile, the voltage of the vapor fuels was both
unsteady and slowly dropped over the span of two hours. The unsteady voltage was likely due to
an uneven distribution of fuel within the methanol reservoir, compared to liquid methanol’s
uniform and constant distribution of fuel to each MEA. The slow drop in voltage over time was

29
from an increase in the methanol crossover gradient. Because of this, it is likely that the OCV
may have continued to drop if the voltage was further recorded over a longer period of time.
Also, stable OCV of the neat methanol vapor was notably higher than both the methanol
gel vapor and liquid methanol, despite its higher methanol concentration. Normally, a higher
methanol concentration directly translates to lower OCV due to a larger crossover. While it
might be possible that the neat methanol fuel OCV to continue dropping, a drop of ~0.5V seems
unlikely. A possible explanation for this improvement in performance is a small increase in
temperature operation caused by using a higher methanol concentration [39], thereby improving
the kinetics and, in turn, OCV and performance. However, further investigation is needed to
check this hypothesis.
Figure 15 describes the performance of all three fuels tested in Prototype 3. Not only is it
uniformly outperformed by the liquid methanol, the methanol gel fuel performance is also
inferior to the neat methanol vapor as well, probably because of greater mass transfer limitations.
While superceded by neat methanol in performance at low current density and OCV conditions,
the 5M methanol solution outperformed both vapor fuels at higher current densities and gave the
highest power density output at 42.6 mW/cm2. Given the total number of cells (12) and the active
area of each cell (5 cm2), Prototype 3 can provide a maximum power of about 2.5W! On the
other hand, the maximum power output of the neat methanol fuel is about 2.2 W and that of
methanol gel fuel is about 1.6W.
It is interesting to note the similar performance trends of neat methanol and liquid
methanol, despite their vastly different methanol concentrations. This can once again be related
to the diffusional limitations of methanol in water and air, as mentioned earlier. However, the
performance of the methanol gel might have been expected to perform better than neat methanol

30
at least at lower current density conditions, as described earlier in Figure 12, since the methanol
gel has a lower methanol content (~75%), and thus, Prototype 3 should have experienced less
crossover, providing better performance at lower current density conditions. However, there is
one reasonable explanation for this contradictory performance. As mentioned before, the rate of
vaporization on the methanol gel is slower than neat methanol fuel. As a result, less fuel may
have been reaching the reaction sites, promoting less reaction and thus reducing performance. In
other words, the methanol gel may not have been able to keep an adequate feed rate because of
higher mass transfer resistance, reducing performance. Another reason may have been possible
leaking from the earlier prototypes. Individual cells on Prototype 3 at OCV ranged anywhere
from 0.5-0.6V while the OCV, according to Figure 12, was less than 0.4V. This drop in voltage
not only indicates crossover, but also leakage of either methanol vapor exiting the reservoir or air
entering. If methanol vapor is allowed to reach the cathode, it will react with the ambient air and
create a mixed potential, reducing performance.
Finally, the long-term performance of Prototype 3 was tested using an equivalent weight
of neat methanol (75g) and methanol gel (100g) by applying a constant 3V charge, as shown in
Figure 16. In addition to its power, the voltage was also monitored to ensure stable performance.
As displayed earlier in the polarization plots, the power of the methanol gel pales in comparison,,
performing at a power of around 1.0-1.5W, compared to the neat methanol, which provides an
output in the range of 1.5-2W. In addition, their temporal performances were relatively
comparable, operating stably for around 80 hours. Although the methanol gel continued to
perform upwards of 140 hours, the last 60 hours were well under 1W and under an extremely
unstable voltage. During this time, it may be possible to refuel the gel with neat methanol to

31
rejuvenate its performance. The daily cycling in power is likely due to temperature variation in
the lab
However, both fuels showed relatively unstable performances. However, with methanol
gel; the voltage became unstable after 80 hours, dropping periodically well below its sustained
3V, its power also dropping slightly. This instability may be due to increased mass transfer
limitations as methanol depletes within the methanol compartment. Although there is no easy
way to observe what is occurring in the methanol compartment, a number of hypotheses can be
made. For one, the generated water is likely absorbed back into the gel increasing the internal
humidity and reducing methanol vapor concentration. As a result, the fuel supply is unable to
sustain the 3V set point. Such oscillation, however, should not occur when it is being used as a
power source, e.g., for a camp light, when resistance is rather constant.
Voltage of the fuel cell was monitored when the voltage was changed suddenly from a
loaded setting of a constant 1 V to no load (OCV) using both vapor fuels, as shown in Figure 17.
Similar to the OCV plots in Figure 14, the voltages shoot well above their stable value, about 7.5
V for methanol gel and about 8 using neat methanol vapor. After about 7 minutes, the OCV
using neat methanol vapor reached steady state while the voltage using methanol gel continued
to gradually decline after 15 minutes. This implies that the methanol gel has a slower evaporation
rate compared to neat methanol vapor, i.e., it is more transport limited, requiring a longer time to
reach steady state.
However, the peaks obtained after one minute are notably larger than the voltage peaks
in Figure 14. In addition, the sudden drop in voltage in Figure 17 did not occur during these tests.
A likely reason for this is the absence of oxygen within the methanol reservoir. The temporary
drop in voltage from initial conditions in Figure 17 can be attributed to the consumption of

32
oxygen at the anode. In the present case however, the interior was already saturated with
methanol with an absence of oxygen, so that there was no sudden drop in performance. Also, the
overshoot in voltage indicates a lesser rate of methanol crossover initially. This change in
applied load may be temporarily utilizing the fuel more efficiently. This is because at the higher
load initially, much of the methanol reaching the anode was utilized there, resulting in low
crossover and hence lower cathode overpotential; when the load is suddenly removed, the
cathode is still operating efficiently at the initial condition, until the methanol not now utilized at
the anode crosses over to the cathode. The response for neat methanol vapor is faster because of
greater evaporation rates and lower mass transfer resistance. On the other hand, there is a greater
transport resistance for the methanol gel. In short, the response is determined by both mass
transfer rate in vapor feed and in the membrane. Further, it directly provides the difference in
overpotential at the cathode between the initial load and no load conditions, about 2 V.
To analyze the first drop in OCV in Figure 14, Prototype 3 was also tested for effects of a
forced oxygen leak into the anode chamber on OCV over time, as well as recovery via
removable top on top of the anode chamber after about one hour, as shown in Figure 18. While
neat methanol vapor provides a higher voltage compared to methanol gel fuel, their overall
responses are near identical. Immediately upon opening the cap cover, the voltage sharply
decreases by about 1.2 V for the case of both fuels. After the quick downward pulse, the OCV
using methanol gel notably increased by about 0.3V and then stabilized after about 10 minutes
while the OCV using neat methanol vapor only rose slightly (about 0.1V) and then gradually
decreased over time. This may indicate that methanol gel is much more tolerable in the presence
of oxygen compared to neat methanol vapor, which may further explain why the drop in OCV in
Figure 14 was so much more prominent with neat methanol vapor. The drop in OCV is

33
indicative of overpotential at the anode because of oxygen either from a purge hole as in many
PDMFCs or transferring over from cathode across the PEM.
After about an hour, the removable top was covered to simulate the process of oxygen
being consumed within the methanol reservoir. Almost instantly with both fuels, the voltage
increased to well above their stable OCV, indicating that oxygen is quickly burned off,
consuming methanol, and methanol crossover rate decreases. The overshoot may be due to the
cleansing effect of oxygen on adsorbed carbon monoxide on the anode. Soon after reaching a
maximum voltage, the OCV for both fuels slowly decreased to a new, lower stable OCV. This
shift to new OCV suggests that the effects of a significant inclusion of oxygen within the
methanol chamber may have permanently reduced the overall performance slightly. In addition,
the temporal voltage using methanol gel was much less stable compared to the voltage change
using neat methanol vapor, indicating that methanol gel has a much more unsteady flow rate to
the cells.
While the stacked OCV for methanol gel comes to about 5.7 V, the individual cell
performances tell a different story. Ideally, each cell in Prototype 3 should provide about 0.6V
while instead, the average cell voltage comes out to 0.475 V. This already indicates that the
PDMFC is not performing as well as it potentially could. Even further, according to Figure 19,
some cells output an OCV of larger than 0.5 V while others perform less than 0.45 V and even
go as low as 0.38 V. Because of Prototype 3’s geometrical symmetry, there is no reason that all
of the cells should perform differently, which suggests that some cells either were damaged in
some fashion, most likely due to fuel starvation, or that their quality is variable. In addition to
OCV, Figure 19 also shows the performance of each cell. Although each cell should be
performing about the same, some cells clearly outperform other cells; for example, 3T and 3B

34
perform notably better than 1B and 2B, most likely due to cell damage from fuel starvation. This
causes a major issue in overall performance, as Prototype 3 can only perform as strong as its
weakest cell. In other words, the maximum power output, while decent, can be significantly
improved with better MEAs. Another interesting correlation between the performances of the
individual cells is that almost all of the top cells of Prototype 3 performed slightly better than the
bottom cells. This may indicate that the internal volume has an impact on individual cell
performance. Although the exact “flow” of the methanol gel vapor is unknown, due to its slower
vapor rate and lighter-than-air density, the lower cells may not be receiving as much fuel,
therefore, reducing their overall performance.
Comments on Design, Construction, and Troubleshooting of
Prototype 3
Due to its large number of cells and complex structure, construction and troubleshooting
of prototype 3 took significantly longer than expected. Because of this, an explanation of the
faults encountered would help future PDMFC projects from suffering these same issues,
reducing lost time.
One issue was the high amount of visible (liquid) leaking when leak testing. While
orientation of the MEA and gaskets is important, the torque of the screws on the MEA is critical
not only to performance, but also to the prevention of leaks. A low bolt torque compromises
electrical contact, which reduces the overall performance. Further, ELAT®
GDLs are a porous
and compressive material; with an increase in bolt torque, porosity decreases and electrical
conductivity increases [44]. Earlier models used nylon screws, which have a low tensile strength
and are deformed easily with high torque. These issues caused a poor seal around the MEA,
allowing methanol to leak out of the fuel cell and air to leak in. This issue was amended with the

35
use of metal screws. However, due to the conductivity of metallic screws, a silicone “wrapping”
and nylon washer were used to prevent short-circuiting of the MEA. Further, the current method
of screw tightening is imprecise and may cause a high torque, which can create additional mass
transfer resistance.
Another issue was the current collector fabrication. The earlier prototypes used stainless
steel with a small thickness, which was easily susceptible to deformation. Further, they were also
constructed with tabs to allow for easy connections. Since the third prototype was aimed for a
more appealing ergonomics, this approach was avoided. Thicker stainless steel current collectors
were picked primarily to avoid deformation, which causes leaks, and to fit wires within the
current collector. The connections were also “glued” to the current collector using Applied
Electronics®
silver epoxy. The epoxy and wire was pasted into a slit of the current collector to
ensure a flat surface. Even with a clean connection, there were signs of voltage drops across the
wiring. These voltage drops may be signs of damaged wiring, which inhibits connections
between the current collectors and hinders performance. In addition, while the multi-threaded
stainless steel wires showed no signs of resistivity, the wire’s material of construction should
also be taken into consideration.
While soldering is possible, a silver solder material must be used, as other solder
materials are incompatible with stainless steel. However, silver solder is primarily used for
higher temperature operations. Not only does this make bonding the wire to the current collector
difficult, the intense heat can also damage the current collector. It is also important to note
stainless steel’s low conductivity compared to other alloys and metals, such as nickel and gold.
Using a different material for current collectors could improve performance further, but may
suffer from an increase in corrosion rate due to the use of methanol.

36
A third issue is mass transfer limitation of fuel, which is caused from directly inserting
the Sterno® canister into the fuel cell. In the design process, the third prototype interior was
made just large enough to fit the Sterno® canister with a little extra space. Upon further testing,
the bottom MEAs continuously performed poorly, often giving negative voltage readings with an
applied resistance. Because of the limited space available to the lower MEAs, they were starved
of fuel and caused cell reversal. Cell reversal can also occur when excessive current is drawn
from the multi-cell PDMFC, generating a negative current in some cells. This process damages
the MEA in a number of ways; for example, ruthenium dissolution from the anode, carbon
support oxidation reduced carbon monoxide tolerance, and surface area reduction of platinum on
the cathode [45]. Further, fuel starvation can also reduce the anode electrolyte thickness and
produce delamination, which can create additional electronic or ionic resistances within the
MEA [46]. Because of these issues, results obtained in this current work can likely be improved
significantly with new MEAs.
Conclusion
To test the feasibility of small-scale fuel cell technology, several multi-cell PDMFCs
were designed, built, and tested with several varieties of fuels. Currently, the best choice of fuel
as far as performance optimization seems to be the liquid methanol fuel. In a comparison
between neat methanol vapor and methanol gel, the results seem to be mixed. Using Prototype 1,
methanol gel seems to be the better contender, with a remarkably similar polarization curve and
better long-term performance compared to neat methanol vapor. Prototype 2, despite its same
basic 4-cell geometry, seems to perform slightly better using neat methanol vapor, although the
performance is still very comparable. Surprisingly, Prototype 3 showed a significant difference
in performance where neat methanol vapor clearly outperformed methanol gel, both on a

37
polarization curve and long-term performance. Despite these shortcomings, methanol gel still has
great potential as a fuel source. Not only does it gain the convenience of easy storage and
refueling (similar to neat methanol), zero prep work is required to use as a fuel (a la liquid
methanol). Currently, more investigation is required, not only to improve overall performance of
PDMFCs with its several shortcomings (e.g.: methanol crossover), but also to increase the
performance in the presence of methanol gel as a primary fuel.

38
Figure 7: Prototype 1 PDMFC

39
Figure 8: Prototype 2 PDMFC

40
Figure 9: Prototype 3 PDMFC

41
Figure 10: Candle Lamp®
Power Heat gel canister, 75% methanol

42
Figure 11: Polarization Plots of a Single Cell (Clean Fuel Cell Energy Commercial MEA)
PDMFC Using Liquid Methanol Solution of Various Concentrations

43
Figure 12: Polarization Plot of a Single Cell PDMFC (Clean Fuel Cell Energy Commercial
MEA) Using Methanol Vapor Solutions

44
Figure 13: Prototype 1 and 2 Polarization Curve Using Methanol Gel
"!
#!
$!
%!
&!
'"!
'#!
'$!
"!
"()!
"(%!
"(*!
'(#!
'(+!
'(&!
"! '"! #"! )"! $"!
!"#$%&'$()*+,&-./01.
23&
4"5+67$&-43&
89%%$(+&'$()*+,&-.:01.23&
45
Figure 14: Prototype 3 OCV Plots Using Various Fuels

46
Figure 15: Polarization Plots of Prototype 3 Using Various Fuels
0.00
5.00
10.00
15.00
20.00
25.00
30.00
35.00
40.00
45.00
0.00
1.00
2.00
3.00
4.00
5.00
6.00
7.00
8.00
0.00 5.00 10.00 15.00 20.00 25.00 30.00 35.00
Pow
er D
ensi
ty (
mW
/cm
2)
Volt
age
(V)
Current Density (mA/cm2)
Methanol Gel
Neat Methanol
Liquid (5M)
Methanol

47
Figure 16: Performance of Vapor Fuels with a 3V Charge
2.96
2.965
2.97
2.975
2.98
2.985
2.99
2.995
3
3.005
3.01
0.0
0.5
1.0
1.5
2.0
2.5
0.0 20.0 40.0 60.0 80.0 100.0 120.0 140.0 160.0 V
olt
age
(V)
Pow
er (
W)
Time (Hr)
Neat Methanol
Methanol gel

48
Figure 17: Change in Voltage from 1V charge to OCV
0
1
2
3
4
5
6
7
8
9
0 2 4 6 8 10 12 14
Volt
age
(V)
Time (min)
Neat Methanol
Methanol Gel

49
Figure 18: Effects of Forced Oxygen Leak and Purge on OCV
4.00
4.50
5.00
5.50
6.00
6.50
7.00
0 20 40 60 80 100 120 140 160 180 200
Volt
age
(V)
Time (min)
Neat Methanol
Methanol Gel

50
Figure 19: Individual Cell Polarization Plots Using Methanol Gel; T - top, B – bottom
0
0.1
0.2
0.3
0.4
0.5
0.6
0 5 10 15 20
Cel
l V
olt
age
(V)
Current Density (mA/cm!)
1T
1B
2T
2B
3T
3B
4T
4B
5T
5B
6T
6B

51
Table 2: Prototype 1 and 2 Performance Statistics, discharge plots in Appendix B
Capacity (mAh) Power (Wh) Specific Energy
(Wh/kg)
Heat (Wh) Efficiency (%)
Prototype 1
(10 g gel) 3050 2.5 333.33 66.29 3.77%
Prototype 2
(5 g gel) 1350 1.0 266.67 33.15 3.02%
Prototype 1
(7 g neat
methanol)
2450 1.8 257.14 46.40 3.88%
Prototype 2
(4 g neat
methanol)
1800 1.4 350.00 26.52 5.28%

52
Chapter 3: Theoretical Modeling of Passive Direct Methanol
Fuel Cells
Modeling Background
Passive Direct Methanol Fuel Cells (PDMFC), i.e., those without an active supply of
methanol and air, are of increasing interest due to methanol’s high energy density and ease of
storage, low temperature operation, and absence of ancillary equipment, making it potentially
attractive in portable electronics, such as cell phones and laptops. However, design and
development of a truly passive, air-breathing, orientation-independent, compact PDMFC fueled
by neat methanol that can compete effectively with ever-improving batteries for low wattage
portable power for consumer or military applications has proved to be challenging. Currently,
there are several inherent barriers in PDMFCs preventing commercialization. For one, methanol
oxidation suffers from sluggish kinetics because of carbon monoxide blocking catalyst sites [5].
Another issue is the facile methanol diffusion across the polymer electrolyte membrane (PEM);
the membrane does not effectively perform its essential function of keeping the methanol and
oxygen fuels separate. This creates a mixed potential at the cathode and a significant reduction in
fuel efficiency [47].
These limitations have been well researched experimentally in order to optimize DMFC
performance. Methanol concentration has a profound effect on the performance and efficiency of
a DMFC; higher molarities promote CO poisoning and crossover, while lower molarities
generate lower power densities [3, 48, 49]. Temperature can significantly influence electrode
activation and Ohmic resistance [49] as well as methanol crossover [50]. Membrane thickness
increases Ohmic resistance but concomitantly reduces methanol crossover [12].

53
There has been a significant advancement in the theoretical understanding of these issues
as well. Only a limited number of studies are cited here. Meyers and Newman [51] were the first
to develop a rigorous theoretical and numerical framework for describing multicomponent
transport and reaction phenomena in the various DMFC MEA layers. Wang and Wang [52]
devised a two-phase multi-component model capable of numerically predicting the mixed
potential effects at the cathode from methanol crossover. Chen and Zhao [29] developed a model
for a PDMFC to investigate the effects of heat and mass transport and electrochemical kinetics
on overall performance. Their model showed that thermal management of heat produced could
improve performance. Rice and Faghri [33] investigated the one-dimensional mass transport of
methanol vapor, water vapor, and carbon dioxide in a vapor-fed PDMFC in order to numerically
describe its temporal performance. They found that water management is crucial, as more water
is produced in the fuel cell than what is evaporated, which can reduce performance due to back-
diffusion of water to the anode.
On the other hand, there are simpler, semi-empirical, models available in literature. Thus,
Chiu [53] developed an algebraic semi-empirical model with an emphasis on a quantitative
prediction of fuel crossover. Eight unknown diffusion coefficients were fitted using the
Levenberg-Marquardt algorithm to 28 sets of experimental results. Based on 112 additional sets
of data for model verification, his proposed model was able to accurately predict methanol
crossover flow for a wide range of parameters. Dohle and Wippermann [54] developed a semi-
empirical model describing the relationship between current and anode overpotential, cell
potential versus current, and methanol permeation. The model was able to further predict the
impact of a cathode overpotential caused by methanol permeation.

54
This paper focuses on the development of an analytical mathematical model of a PDMFC
based on a careful and detailed consideration of the key transport and reaction processes and
without fitting, i.e., with a priori parameters. Arriving at the analytical solution based on a
comprehensive theoretical framework involves a number of assumptions that are quite defensible.
Thus, explicit analytical equations have been derived for the anode and cathode overpotentials
involving not only the current density, but also include the exchange current density, the limiting
current density, and the crossover current density, in turn defined from mass transfer and kinetic
consideration. The effect of the experimental parameters, specifically membrane thickness and
the feed concentration, are accurately described by the model. Since oxygen diffuses to the anode
in a DMFC [6], and is sometimes present because of the carbon dioxide vent in the anode
chamber, oxygen crossover is also considered, in addition to the usual methanol crossover.
Additionally, heat generated in a PDMFC is determined, as is its efficiency. Better retention of
this heat can improve PDMFC performance.
Mathematical Model
Figure 20 schematically shows the concentration profiles of methanol, oxygen, carbon
dioxide, and water, as well as the anode and cathode potentials, A
! and C! , across the various
parts of the membrane electrode assembly (MEA). In the bulk phase, as well as in the anode
diffusion layer (ADL), thus the concentration profile of methanol decreases due to its
consumption in the methanol oxidation reaction (MOR) in the anode catalyst layer (ACL).
Further, it drops across the PEM to arrive at the cathode, where it also undergoes electrochemical
MOR.
Similarly, oxygen from air in the bulk diffuses across the cathode diffusion layer (CDL)
to arrive at the cathode catalyst layer (CCL) where it undergoes the oxygen reduction reaction

55
(ORR). The ORR involves protons and electrons produced at the ACL and arriving via PEM and
the external circuit, respectively. In addition, however, protons and electrons produced via MOR
at the CCL by the methanol crossing over are also utilized in the ORR. Both the MOR and ORR
are sluggish reactions, promoted by significant electrode overpotentials, 0A,AA
!!" != at the
anode, and 0C,CC
!!" != at the cathode. These overpotentials, thus, account for not only the
useful current i but also the crossover current iX
. To obtain an analytical solution, we treat the
ACL and CCL as thin, i.e., without diffusion limitations, so that the concentrations within them
are assumed to be uniform.
As indicated above, unreacted methanol is transported across the membrane via diffusion
or electro-osmotic drag and arrives at the cathode, even under open circuit voltage (OCV)
conditions, where it undergoes MOR readily due to the large overpotential, 0A,CA,X
!!" != . It is
noteworthy that this reaction is electrochemical because of the large !A,X
value (Figure 20)
rather than chemical. The protons and electrons thus produced are utilized by the ORR even
through external current 0=i under OCV conditions, effectively creating an internal short
circuit, or a crossover current (iC,X). Likewise, oxygen permeating from the cathode can also
readily undergo ORR due to large overpotential0C,AC,X
!!" != , thus creating an internal
crossover current (iA,X).
The electrode kinetics are approximated by the Butler-Volmer equation
i!
i! ,0
= exp
!!"
#e!•F$#
RT
"
#$$
%
&''! exp !
!!"
#e!•F$#
RT
"
#$$
%
&''
(
)
**
+
,
--
(11)
where •!
!e" is the stoichiometric coefficient in the rate-determining step (RDS) in the sequence of
mechanistic steps, and it is assumed that the transfer coefficients of forward and reverse

56
reactions are equal ( !!! ==!"
). Further, the current density and kinetics of the electrode
reaction are interrelated [36]
*
!!eM
*
!M!rF"#i#i !== (12)
as are the exchange current density
*
!,!eM
*
!,M!,rF"#i#i000 !== (13)
where !"e!
is the stoichiometric coefficient of electrons in electrode reaction ! and the
roughness factor (M! ) is the ratio between the active catalyst area
MM
M!IM
d!m"
6!= (14)
and the geometric area of the electrode and the superscript asterisk refers to the actual
electrochemical surface area of the electrocatalyst. The reaction rate, r!* , is based on unit electro-
catalyst surface area (), is assumed to be pseudo first order [36].
( )ackri
*
!
*
!= ; ( )ackr
i
*
!,"
*
!,0
0= (15)
while the rate, r! , is based on the geometric MEA area r! = "Mr!*( ) .
The Nernst-Planck equation is used to represent the one-dimensional (z-direction) flux of
each species i
Nxdz
d!
RT
Fcz
dz
dcDN
iii
ie
ii,z+!"
#$%
&'(
)*+
,+-= (16)
where the terms in the square brackets represent diffusion and migration, respectively, and the
last term represents convection. The migration term is, of course, zero for uncharged species (zi =
0).

57
In the anode chamber and anode diffusion layer (ADL), fluxes are constant at steady state,
i.e.,
Ni,A= k
aci,bulk
! ci0( ){ }=
Di,A
e
LA
ci0( )! ci a( ){ }
(17)
where the first equation represents the flux from the bulk phase to the ADL in the anode chamber,
and the second equation is the flux through the ADL. These can be combined into the following:
Ni,A= k
A
eci,bulk
! cia( ){ }= Pi,A c
i,bulk!cia( )!
"#$
%&'
(18)
Where e
ak is 1 k
a+ L
aDi,a
e( )!1
, i.e., the effective mass transfer coefficient of the anode, including
resistance to mass transfer in the bulk and in the ADL, and the corresponding permeance is
defined as A
e
i,Ai,AL!DP = and the partition coefficient is ( ) G
iicac! = . The mass transfer
coefficient can be further established from
Sh =kaL0
Di,0
= 2.976 1+CReScd
L
!
"#
$
%&
0.45
(19)
where C is a constant ranging from 0.078-0.095 [55]. In a PDMFC, the velocity of the fuel past
the ADL can be assumed as zero, resulting in the Sherwood number Sh ~ 3 . Thus, the main
difference between active and passive DMFCs is the higher mass transfer coefficient for
methanol as well as for oxygen in active DMFCs.
Methanol can permeate through the PEM via diffusion and electro-osmotic drag, which is
represented by the right and left terms, respectively, in the following
( ) ( ){ } ( )!"#
$%&
+'=F
i!
c
bcccbc
L
DN
w
i
ii
C
e
i,C
i,c (20)

58
As mentioned earlier, the concentration in the ACL is assumed to be uniform and equal to inlet
concentration, i.e., ci(a) = c
i(b) . Further, it is assumed that any methanol crossing over is
consumed entirely within the CCL, i.e., ci(c) = 0 . These assumptions simplify the membrane flux
equation to
( )a cF
i
c
!
L
DN
i
wc
e
i,c
i,c !!"
#$$%
&+=
(21)
Since the relationship between diffusive flux and current density are
!!
"
#
$$
%
&
'=
'
F!
!Ni
"i
"e
i,z" (22)
where !"i is the stoichiometric coefficient of species i in electrode reaction ! , the crossover
current can then be written as
(a) cic
!F
L
D
"
"i i
wc
e
i,c
#i
#e
X
!"#
$%&
+''
(
)
**
+
,
-=
-
(23)
We now define a limiting crossover current density, or the largest possible diffusive flux
at open circuit voltage conditions, i.e., when 0=i . Further assuming that under this condition,
there is no mass transfer limitation across the ADL, ( ) ( )( )0iicac = , and further, ( )( )G
ii!cc =0 , so
that the limiting crossover current density is
G
i
c
e
i,c
!i
!e
X,L"cF
L
D
#
#i
!"#
$%&
''
(
)
**
+
,
-=
-
(24)
Using this, Equation 23 may be written in the form
(a) cic
!
"
"
#c
ii i
w$i
$e
G
i
X,L
X
!"
!#$
!%
!&'
((
)
*
++
,
-
.+=
.
(25)

59
To evaluate this crossover current, thus, we need to determine the concentration ( )aci
.
A mass balance can be written around the ACL assumed to be lumped
( ) ( ) ( )!!,ii,ci,a
r"bNaN !=! (26)
This equation can be used to determine ( )aci
by combining it with Equations 15, 18, and 21.
( )( )
e
A
*
!M!i
e
AWc
e
i,c
G
i
i
k
k"#
kc
$
F
i
L
D
%cac
!+""#
$%%&
'
()*
+,-
++
=1
1
(27)
The last term in the denominator represents the ratio of the maximum rate of reaction in the ACL
to the maximum rate of diffusion in the ADL. The second term represents crossover; if the fuel
solubility is low (like hydrogen, for example), then it can be neglected. Of course, methanol is
highly soluble in water. This expression can be used in Equation 12 to provide the current
density
( )
e
A
*
!M!i
e
AWc
e
i,c
G
i
*
!!eM
!
k
k"#
kc
$
F
i
L
D
%ckF#"i
-
!+""#
$%%&
'
()*
+,-
++
=1
1
(28)
When the rate of diffusion in the ADL is significantly less than the rate of the overall
reaction, the “1” in the denominator may be neglected compared to the other terms. Of course
then the crossover term is also negligible. This then provides the diffusion-limited limiting
current density
G
i
e
A
!i
!e
!,L"cFk
#
#i
!!
"
#
$$
%
&
'=
'
(29)
The previous two equations can be combined and rewritten as a ratio between the current density
of an electrode and its limiting current density.

60
( )
( )e
A
*
!M!i
e
AWc
e
i,c
e
A
*
!M!i
!,L
!
k
k"#
kc
$
F
i
L
D
k
k"-#
i
i
!+""#
$%%&
'
()*
+,-
++
=1
1
(30)
which can be rearranged into the following form
( )
!!"
#
$$%
&''(
)**+
,
-./
012
++''
(
)
**
+
,
3=
3e
AWc
e
i,c
!,L!
!,L!
e
A
*
!M!i
kc
"
F
i
L
D
ii
ii
k
k#$ 11
1 (31)
The term within the square brackets on the right can be rearranged in terms previously defined
terms
!!"
#
$$%
&
''
(
)
**
+
,
-+=''
(
)**+
,
./0
123
+-
!ix"
"i
ikc
!
F
i
L
DMe,
#i
#e
X,L
#,L
e
AWc
e
i,c
0
11 (32)
Finally, Equation 31 is multiplied by 0!,!,Lii to write
!!
"
#
$$
%
&
!!"
#
$$%
&
''
(
)
**
+
,
-++
''
(
)
**
+
,
-===
-
!ix"
"i
iii
ii
i
i
r
r
k
kMe,
#i
#e
X,L
#,L#,L#
#,#
#,
#
*
#,
*
#
*
#,$
*
#
0
0
00
11
10
(33)
and when combined with Equation 11, along with !=!=!!"
, results in
!!
"
#
$$
%
&
!!"
#
$$%
&
''
(
)
**
+
,
-++
''
(
)
**
+
,
-='
'
(
)
**
+
, -•
-!ix
"
"i
iii
ii
RT
F#$"Me,
%i
%e
X,L
%,L%,L%
%,%%%e
0
0 11
1sinh2 (34)
This can be further inverted to provide an explicit equation for the overpotential
!"
!#$
!%
!&'
((
)
*
++
,
-
.
.
/
0
11
2
3
.
.
/
0
11
2
3
4++
.
.
/
0
11
2
3
4=
4
4
4 !ix"
"i
iii
ii
F#"
RT$
Me,
%i
%e
X,L
%,L%,L%
%,%
%e
% 0
01 11
12
1sinh (35)
The observed voltage in a DMFC is determined by the difference between the
thermodynamic voltage and the anodic overpotential, the cathodic overpotential, the Ohmic
losses in the PEM, as well as any internal resistance exhibited by the PEM [36].

61
IPEMCA!!!!VV !!+!=
0 (36)
The thermodynamic voltage is given by the stoichiometry of the overall cell reaction and the
number of electrons produced per mole of reactant (!"e!
!!"i ), i.e., 6
!"
!#$
!%
!&'
((
)
*
++
,
-+..=
.
2
2
23
0
4
0
629810412141
CO
/
O
Me,p
px
F
RT)(T*..V
(37)
Equation 35 is the overpotential of an electrode reaction caused by both diffusional and electro-
osmotic crossover, as indicated by the terms in the brackets, respectively. For the anode
overpotential in particular, we may write with the number of electrons produced in the MOR
( )6=!! !i!e"" and i
A= i+ i
X,O2, where i is the external current
!A=
RT
!A!Ae
!Fsinh
-1 1
2
i+ iX,O2( ) iA,0
1! i+ iX,O2( ) iA,L
"
#$$
%
&'' 1+
1
iA,L
iX,Me,L
+ 6xMe,0!i( )
(
)*
+
,-
./0
10
230
40
(38)
Similarly, since oxygen crossing over term across the PEM to the anode via electro-osmotic
crossover may be neglected
!C=
RT
!C!Ce
!Fsinh
-1 1
2
i+ iX,Me( ) iC,0
1! i+ iX,Me( ) iC,L
"
#$$
%
&''
()*
+*
,-*
.*
(39)
The exchange current densities iA,0,iC,0( ) in the above expressions for overpotentials are
proportional to the roughness factor and reference exchange current densities (Equation 13), and
may be written as
iA,0 = !M,AcMe,0
cMe,ref
1!"CO•S1!"CO•S,ref
exp !EMOR,"0
R
1
T!1
Tref
#
$%%
&
'((
)
*++
,
-..iA,0,ref*
(40)

62
iC,0 = !M,CcO2 ,0
cO2 ,refexp !
EORR,"0
R
1
T!1
Tref
#
$%%
&
'((
)
*++
,
-..iC,0,ref*
(41)
where !CO•S
represents the catalyst site fraction occupied by carbon monoxide resulting as an
intermediate in the MOR, which may be assumed as the Langmuir Isotherm.
!CO•S
=KMecMe,0
1+KMecMe,0
(42)
where the adsorption equilibrium constant is
KMe =1.5*10!8 exp
65,000
RT
"
#$
%
&' (43)
The diffusion-limited limiting current densities, as expressed by Equation 29, are also functions
of effective void fractions in the diffusion layers [56]. To simulate the effect of carbon dioxide
and water buildup within the ADL and CDL, respectively, on limiting current densities,
corresponding volume fraction terms are thus included in Equation 29 for anode and cathode,
respectively
iA,L = 6FcMe,01
ka+
LA
1! qCO2
( )1.5
DMe,A!A
1.5
"
#
$$
%
&
''
!1
(44)
iC,L = 4FcO2 ,01
ka+
LE
1! qW( )1.5DO2 ,D
!C1.5
"
#$$
%
&''
!1
(45)
The methanol crossover current iX,Me( ) is derived from Equations 24, 25, 27, and 31,
expressed in terms of its limiting crossover current density.

63
iX,Me
=
iX,Me,L
+!"e!
!!"i
"
#$$
%
&''xMe,0#i
()*
+*
,-*
.*
1+1
iA,L
iX,Me,L
+!"e!
!!"i
"
#$$
%
&''xMe,0#i
()*
+*
,-*
.*
/
0
11
2
3
44
1
1! i iA,L
"
#$
%
&'
(46)
where
iX,Me,L
=6F
LC
DMe,W
!PEM
1.5!
"#
$
%&cMe,0 (47)
Further, the oxygen crossover current ( iX,O2
) is given by Saurabh et al. [6].
iX,O2
=4F
LC
DO2 ,W
!C
1.5"O2
!
"#
$
%&cO2
G (48)
The Ohmic losses through the PEM are, of course, proportional to its thickness and
membrane conductivity
C
C
PEM
!
iL" = (49)
Where C! is the proton conductivity of the membrane. Although more complex terms are
available in literature [57], we assume the simpler expression of Thampan et al.
!C= (!
PEM! ! )1.5
349.8
1+!K
acH+,0!( ) (50)
where & is 0.6 and 5.5 for liquid phase and vapor phase, respectively [36, 58] and the degree of
dissociation of acid sites, or ß, is
( ) ( ) ( )
( )a
a
K
K!!!"
112
114112
!
!!+!!= (51)
and the dissociation equilibrium constant for acid sites is
!"
#$%
&'(
)*+
,-
-=
298
1152300exp
TRKa
(52)

64
The combination of Equation 36 with Equations 38, and 39 provides the final V-i expression
V =V0!
RT
!A"Ae
!Fsinh
1
2
i+ iX,O2( ) iA,0
1! i+ iX,O2( ) iA,L
"
#$$
%
&'' 1+
1
iA,L
iX,Me,L
+ 6xMe,0
!i( )(
)*
+
,-
./0
10
230
40
+RT
!C"Ce
!Fsinh
1
2
i+ iX,Me( ) iC,0
1! i+ iX,Me( ) iC,L
"
#$$
%
&''
./0
10
230
40!iL
C
!C
! i(RI)
(53)
where RI is interfacial MEA resistance due to imperfect bonding of different layers. Likewise,
the power density can be obtained from iVP = , i.e,
P = iV0!
iRT
!A"Ae
!Fsinh
1
2
i+ iX,O2( ) iA,0
1! i+ iX,O2( ) iA,L
"
#$$
%
&'' 1+
1
iA,L
iX,Me,L
+ 6xMe,0
!i( )(
)*
+
,-
./0
10
230
40
+iRT
!C"Ce
!Fsinh
1
2
i+ iX,Me( ) iC,0
1! i+ iX,Me( ) iC,L
"
#$$
%
&''
./0
10
230
40!i2LC
!C
! i2 (RI)
(54)
The model parameters are summarized in Table 3.
Results & Discussion
Obviously, the most significant part of any model is its accuracy. To show that our model
is a good representation of the PDMFC performance, the model is compared below with
literature data.
According to thermodynamics (Equation 37), the maximum voltage obtainable in a
DMFC is about 1.2 V. However, Figure 21 shows that the actual OCV is only about half of that
[59], and further depends upon methanol concentration. This is due to the combined effect of
sluggish kinetics of the MOR, crossover of methanol, and the sluggish ORR in oxidizing the
methanol on the cathode. As the methanol concentration increases, methanol crossover becomes
a significant issue, reducing the OCV even further.
To further provide OCV from Equation 53 by setting 0=i , i.e.,

65
OCV =V0!
RT
!A"Ae
!Fsinh
1
2
iX,O2
iA,0
1! iX,O2
iA,L
"
#$$
%
&'' 1+
iX,Me,L
iA,L
(
)*
+
,-
./0
10
230
40+
RT
!C"Ce
!Fsinh
1
2
iX,Me
iC,0
1! iX,Me
iC,L
"
#$
%
&'
./0
10
230
40
(55)
and then discuss its validity over the entire range of voltage and current density, its results were
compared to the experimental results of Liu et al. [8], as shown in Figure 22. In addition, the
model was fitted with a small interfacial resistance (RI= 0.5!cm
-2). While this term is usually
neglected assuming an ideal MEA, a small internal resistance may exist due to poor fabrication
techniques or if the MEA becomes less cohesive with continued use. Gasteiger et al. also
discusses the existence of an electronic resistance as part of Ohmic losses in an MEA as a result
of the cell’s compressive forces [60]. For example, a graphite-based flow field compressed to
250 psig will experience an electronic resistance of 0.025!cm-2
. However, this value is notably
smaller in comparison to our interpolated value. To show the effects of this interfacial resistance,
it will be implemented into all further polarization plots.
Further, Figure 22 also shows PDMFC polarization plots with varying membrane
thickness, for a feed concentration of 4M methanol. Although thicker membranes perform better
at lower current densities and generate higher OCV due to lower crossover, thinner membranes
exhibit better performance at higher current densities, and, therefore, produce a higher maximum
power density (Figure 22). Alternatively, Nafion 115 provides a good compromise in
performance at both low and at high current densities.
The methanol feed concentration, of course, has a dominant effect on the polarization
plot, as depicted in Figure 23. At low current densities, lower methanol concentrations produce a
higher voltage. This is largely due to lower methanol crossover to the cathode at lower methanol
concentrations. However, lower methanol concentrations also exhibit lower limiting current
density (Equation 29). Likewise, an increase in concentration also proportionally increases the

66
limiting current density. This relationship trend is maintained up to a 5M solution, which is
confirmed by Bae et al. as the optimal concentration in a PDMFC [3]. Any feed concentration
exceeding that concentration exhibits a slightly lower voltage at all current densities compared to
the 5M concentration, although their performance is still quite comparable.
The effects of methanol crossover are further described by Figure 24, which shows the
relationship between crossover current density and cell current density. It is noteworthy that
crossover current density is of the same order as fuel cell current density. Methanol crossover is
contributed by both diffusion, dependent on methanol concentration, and electro-osmotic drag,
dependent on current density. As methanol concentration increases, the crossover current density
increases proportionally due to increased methanol diffusion through the PEM as shown by
equation 46. In addition, with an increase in cell current density reduces the crossover current
density at a rather linear rate, which indicates that fuel is being consumed at the anode rather
than at the cathode without producing useful current.
The effects of methanol concentration on the anode and cathode overpotentials are further
observed with respect to cell current density in Figure 25, where the region between the two
overpotential values represents the observed voltage, V, of the fuel cell. An increase in methanol
concentration causes the anode overpotential to increase monotonically, primarily determined by
the anode limiting current density. This increase suggests that at low current densities, the anode
overpotential is not drastically affected by methanol concentration while at higher current
densities, the methanol concentration anode limiting current density are proportionally related
[61]. Also, with an increase in concentration, both the cathode overpotential and cathode limiting
current density decrease monotonically, primarily due to methanol crossover. While an increase

67
in oxygen concentration can improve the cathode limiting current density in a conventional
DMFC, a PDMFC does not have this option.
Due to the high overpotential, the MOR produces a notable amount of heat at the anode.
In addition, since methanol oxidizes at the cathode with oxygen due to methanol crossover, heat
is also generated at the cathode [62]. Thus, it is useful to investigate the heat generation in
comparison to the power density of a given fuel cell, as displayed by Figure 26, from
( )VViqloss !=0
(56)
Immediately, it is obvious that a substantial amount of heat is generated in a PDMFC
while only a small fraction of it is converted into electric power, much as Eccarius et al. have
reported [27]. Thus, the DMFC suffers from a low efficiency. The generated heat can, in fact,
raise the internal temperature of a well-designed PDMFC [63] and thus, improve performance.
To represent the effects of heat retention, Figure 27 shows the effects of temperature on a
PDMFC. The higher temperature helps increase the kinetics, which translates into improved
performance, as shown by Casalegno et al. [64]. However, temperature also has an effect on the
limiting current density, based on the fuel cell’s methanol concentration. The limiting current
density increases for lower methanol concentrations while there is a decrease for higher
molarities. Although a temperature increase improves overall performance, it also contributes to
increased methanol crossover. Although this causes a monotonic decrease in the cathode
overpotential and a decrease in the limiting current density, the overall performance is still
generally improved.
Conclusion
While PDMFCs have a high potential in portable applications, they are not developed
enough to compete against rapidly improving traditional batteries. The two largest impediments

68
to PDMFC performance are slow electrode kinetics and methanol crossover. To gain a better
understanding of the performance, a relatively simple analytical model has been developed and
based on a priori parameters. The model accurately predicts the influence of methanol crossover
on OCV as well as overall performance. Further, the model shows the methanol concentration
effects on OCV and limiting current density. Membrane thickness and temperature also have a
notable effect on performance. Large heat losses indicates that retaining the heat, possibly
through insulation or small surface area to volume design, can increase the temperature and, in
turn, improve the kinetics of the MOR and ORR. While the model involves some simplifying
assumptions, it is clear that it has good predictive abilities.

69
Table 3: Parameters of DMFC Model
Parameter Value Units
Constants
iA,0,ref* 10
102.1!
" A cm-2
iC,0,ref* 10
101!
" A cm-2
cMe,ref 3101
!" mol cm
-3
Tref 298 K
cO2 ,ref 610594.8
!" mol cm
-3
!A
0.5 -
!C
0.5 -
!Ae
! 2 -
!Ce
! 2 K
!G -702.5 kJ K-1
mol-1
RI 5.0 % cm
-2
!M
21.45 mg cm-3
dM
6103
!" cm
!I 1 -
!A
0.3 -
!C
0.3 -
! 2.5 -
EMOR,!0
36 kJ mol-1
EORR,!0
67 kJ mol-1
LA
410260
!" cm
LE
410260
!" cm
Eµ 14 kJ mol
-1
!O2
0.8 -

70
! 22 -
! 9 -
! 0.057 -
Equations
qCO2
i!0 A cm-2
qW
i!5 A cm-2
DMe,W
4
27
4
10
T104979.9
T105986.406954.0 !
!
!
"##
$
%
&&
'
(
"+
"+! cm
2 s
-1
DMe,A
T
778.9994163.1
107.0!!
" cm2 s
-1
DO2,W
)6.25(
)68.40(T86.0
5.0
104.7µ
!" cm
2 s
-1
DO2,C
( ) 823.1
352
T357.0 !
!PEM
!+!18537
-
cH+,0
!181 -

71
Figure 20: Schematic representation of a PDMFC, including concentration profiles, external and internal crossover currents, and short-
circuit currents
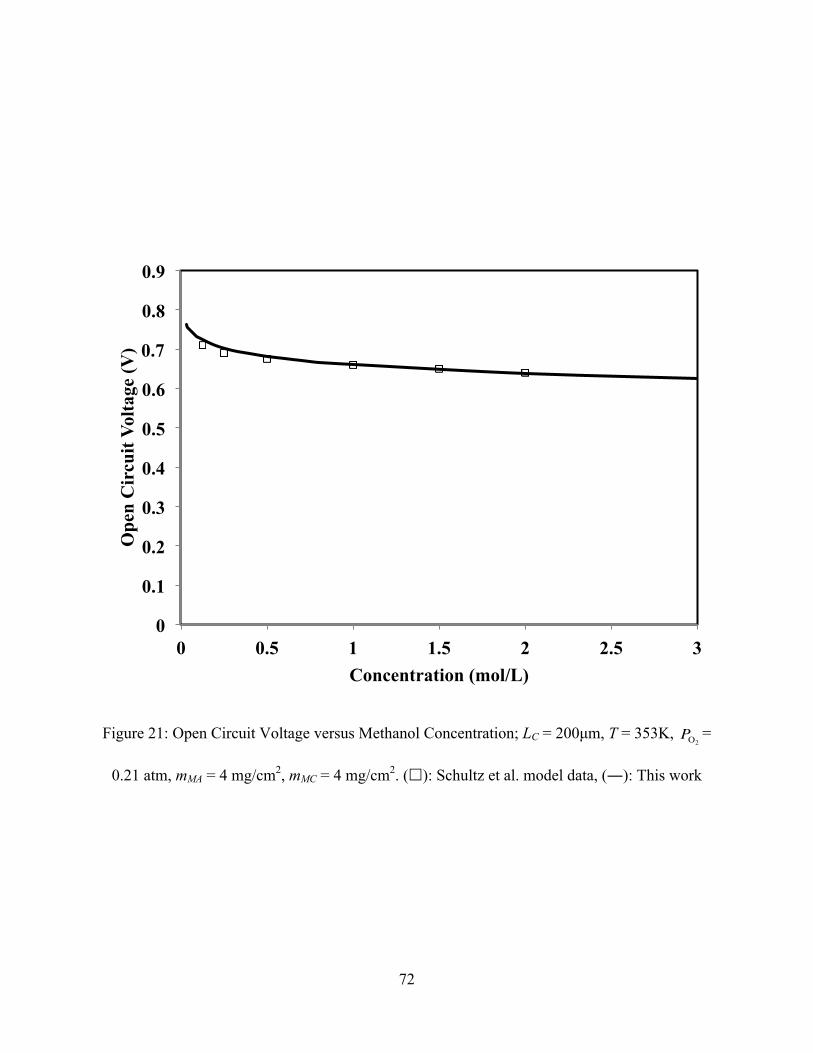
72
Figure 21: Open Circuit Voltage versus Methanol Concentration; LC = 200µm, T = 353K, PO2
=
0.21 atm, mMA = 4 mg/cm2, mMC = 4 mg/cm
2. (!): Schultz et al. model data, (!): This work
0
0.1
0.2
0.3
0.4
0.5
0.6
0.7
0.8
0.9
0 0.5 1 1.5 2 2.5 3
Op
en C
ircu
it V
olt
age
(V)
Concentration (mol/L)

73
Figure 22: Polarization Plot with Varying Nafion Thickness; cMe = 4M, T = 298K, mMA = 4
mg/cm2, mMC = 2 mg/cm
2. (!): Nafion 112, Liu et al. experimental data; (!): Nafion 112, this
work; ("): Nafion 115, Liu experimental data; (!): Nafion 115, this work; (!): Nafion 117,
Liu et al. experimental data; (!): Nafion 117, this work
0
0.005
0.01
0.015
0.02
0.025
0.03
0
0.1
0.2
0.3
0.4
0.5
0.6
0 0.02 0.04 0.06 0.08 0.1 0.12 0.14 0.16 0.18 0.2
Pow
er D
ensi
ty (
mW
/cm
2)
Volt
age
(V)
Current Density (mA/cm2)

74
Figure 23: Polarization Plot with Varying Methanol Concentration. LC = 127!m, T = 298K, mMA
= 4 mg/cm2, mMC = 2 mg/cm
2. ("): 2M; ("): 3M; ("): 4M; ("): 5M; ("): 6M; ("): 7M
0.000
0.005
0.010
0.015
0.020
0.025
0.030
0.035
0
0.1
0.2
0.3
0.4
0.5
0.6
0 0.05 0.1 0.15 0.2
Pow
er D
ensi
ty (
mW
/cm
2)
Volt
age
(V)
Current Density (A/cm2)

75
Figure 24: Polarization Plot with Varying Methanol Concentration; LC = 127!m, T = 298K, mMA
= 4 mg/cm2, mMC = 2 mg/cm
2. ("): 2M; ("): 3M; ("): 4M; ("): 5M
0
0.02
0.04
0.06
0.08
0.1
0.12
0.14
0.16
0.18
0 0.05 0.1 0.15 0.2
Cro
ssover
Cu
rren
t D
ensi
ty
(A/c
m2)
Current Density (A/cm2)

76
Figure 25: Anode (bottom) and Cathode (top) Overpotentials with Varying Methanol
Concentration; LC = 127!m, T = 298K, mMA = 4 mg/cm2, mMC = 2 mg/cm
2. ("): 3M; ("): 5M;
("): 7M
0.2
0.3
0.4
0.5
0.6
0.7
0.8
0.9
0 0.05 0.1 0.15 0.2
An
od
e (b
ott
om
)/C
ath
od
e (
top
)
Over
pote
nti
al
(!a, V
0-!
c)
Current Density (A/cm2)

77
Figure 26: Heat and Power Produced Comparison; cMe = 4M, LC = !m, T = 298K, mMA = 4
mg/cm2, mMC = 2 mg/cm
2. ("): heat; ("): power
0.00
0.04
0.08
0.12
0.16
0.20
0 0.05 0.1 0.15 0.2
Pow
er D
ensi
ty (
W/c
m2)
Current Density (A/cm2)

78
Figure 27: Polarization Plot with Varying Temperature; cMe = 3M, LC = 127!m, mMA = 4
mg/cm2, mMC = 2 mg/cm
2. ("): 25ºC; ("): 40ºC
0
0.005
0.01
0.015
0.02
0.025
0.03
0.035
0
0.1
0.2
0.3
0.4
0.5
0.6
0 0.05 0.1 0.15 0.2
Pow
er D
ensi
ty (
W/c
m2)
Volt
age
(V)
Current Density (A/cm2)

79
Chapter 4: Final Remarks
Although there has been a large amount of progress in the development of PDMFCs,
there is much more potential. A handful of improvements in both the model and Prototype 3
could give more promising results with time. Below are several suggestions that may help
facilitate the direction of the future project.
Self-Fabricated Passive Direct Methanol Fuel Cell
Several ideas can be implemented to improve the performance of the fuel cell. The
easiest way to do so is to extensively test a 1-cell PDMFC. Although a mock-up 1-cell fuel cell
was used during Prototype 1 testing, there are several other parameters that need to be tested for
determining optimal performance, such as Nafion thickness, current collector fabrication
variations, GDL variations, and even removal of the cathode GDL as suggested by Chen and
Zhao [65]. Further, a large amount of generated heat was estimated in Prototypes 1 and 2, and is
speculated to be just as large in Prototype 3. This is especially true with higher concentration
feeds, which produce more heat. If this heat were somehow retained, e.g., by using insulated
cathodes, the PDMFC performance would notably improve.
Upon further testing, the changes with the most notable improvements should be applied
to either the well-developed Prototype 3 or a future, more ergonomically efficient PDMFC
prototype geared towards portable use. For example, the 16-cell PDMFC is shown in Figure 28;
with a wider center, this geometry may also solve the issue of fuel starvation in the bottom cells.
A small-scale 16-cell fuel cell model is also shown in Figure 29, as machined via a Rapid
Prototyping Machine. Although rapid prototyping was not used for Prototype 3, quick tests
showed that the material (acrylonitrile butadiene styrene, or ABS) is at least somewhat
compatible with methanol. In addition, this material is also a lightweight alternative to
80
polycarbonate. However, sealing issues may arise unless the surfaces are machined, as the
machine is unable to incorporate proper screw holes.
Another area of improvement is further analyzing methanol gel as a fuel and improving
its performance. The inconsistency in performance between Prototypes 1 and 2 versus Prototype
3 may indicate that internal volume also has an effect on its performance. The best way to
determine this would be to research how methanol gel dissipates within the methanol reservoir
and its activity at the anode. Else, further investigation to improve performance solely with
methanol gel is needed. In addition, the current method for using the vapor fuels is inconvenient
and requires some form of “fuel cartridge”, or a device that can be filled and fed into the fuel cell
directly. Careful consideration is required to ensure these fuels do not touch the active area and
damage the MEAs. A possible idea would be using an alcohol lamp glass or some form of
container with an external wick (see Figure 30). Not only is the methanol stored within the
reservoir, but also the methanol vapors can easily absorb into the wick and then diffuse to the
anode. While this option may work for methanol vapor, methanol gel may not work with this
method.
Finally, the MEAs used in all prototypes were commercial MEAs. Although these MEAs
provide very good performance, they greatly increase the cost of the fuel cell. Using MEAs
fabricated within the lab could further reduce the cost of the Prototypes., although the
performance may be lower.
Passive Direct Methanol Fuel Cell Model
While the model gives very nice insights into PDMFC performance, there are a number
of improvements that can be considered. Currently, the model developed in this paper is
compared against experimental work of Liu et al. [8]. Ideally, the model should be fitted to the

81
performance of either a conventional DMFC or a 1-cell PDMFC. If the model were instead
adapted to a 1-cell PDMFC, more insight can be provided to the Prototype fuel cell performance.
Unfortunately, the most current 1-cell polarization plots seem to be somewhat poor and requires
further improvement. In addition, the model should also be able to more accurately depict the
performance of both a conventional setup and a passive setup. Although mass transfer limitations
have been incorporated into the model, these terms only influence the limiting current density.
However, there is a clear difference in performance between these two setups, which the model
cannot yet describe well.
Some parameters used in the model also need reconsideration. The model currently
predicts that the limiting current density is independent of Nafion thickness. However,
experiments of Liu et al. show that the limiting current density is, in fact, dependent on Nafion
thickness [8]. Therefore, the model should incorporate either some form of reference thickness
value or should also be a function of Nafion thickness along with GDL thickness. In addition,
although the internal resistance value incorporated into the model is small, it does add
discrepancy when being fitted to other performance curves. Therefore, the model either needs to
be refined to remove this value, or provide some sort of empirical approach to the internal
resistance.

82
Figure 28: Future Concept Design for a 16-cell Passive Direct Methanol Fuel Cell. Left - Side
View, Right - Top View.

83
Figure 29: 16-cell PDMFC as constructed by Rapid Prototyping

84
Figure 30: Glass Lantern with Wick, or a Potential Idea for a Fuel Cartridge

85
Appendix A: Methanol Gel MSDS
This form may be used to comply with OSHA’s Hazard Communication Standard, 29 CFR
1910.1200. To be valid all information required by 1910.1200(g) of the Standard must appear on
this form. Consult the Standard for specific requirements. Note: Blank spaces are not permitted.
If any item is not applicable, or no information is available, the space must be marked to indicate
that.
Quick Name Identifier/Common Name: Gel Chafing Fuel (Contains Methanol)
UPC/SKU: PH0001 Series, PH0007 Series, PH0024, PH0029
SECTION 1 – CHEMICAL PRODUCT AND COMPANY IDENTIFICATION
Manufacturer’s Name:
Candle Lamp Company
1815 Rustin Avenue
Riverside, CA 92507
24 Hour Emergency Telephone Number:
1-800-255-3924 or 1-813-977-3668 (Collect Calls Accepted)
Information Telephone Number: 1-951-682-9600
Date Prepared: 11/12/2010
General or Generic Name: Gel Chafing Fuel (Contains Methanol)
SECTION 2 – COMPOSITION / INFORMATION ON INGREDIENTS
Ingredients
CAS No. % By Weight
Methanol 67-56-1 75.0
Denatonium Benzoate (Bitrex) 3734-33-6 Trace
Mono-Ethylene Glycol 107-21-1 Trace
SECTION 3 – HAZARDS IDENTIFICATION
Potential Health Effects: Methanol (CAS 67-56-1) is the only ingredient expected to have any
potential health effects in this product. Methanol is toxic if ingested.
Eye/Ocular: Exposure may cause eye irritation. Symptoms may include stinging, tearing, and
redness.
Skin/Dermal: Exposure may cause mild skin irritation. Prolonged, repeated exposure may dry the
skin. Symptoms may include redness, burning, drying and cracking, and skin burns. Skin
absorption can occur, symptoms may occur similar to inhalation.

86
Swallowing/Ingestion: Swallowing is toxic. Usual fatal human dose between 3 oz and 4 oz.
Symptoms possible are alcoholic breath, central nervous system depression, convulsions, and
coma.
Inhalation: Exposure to vapor is possible. Short-term inhalation toxicity is low. Breathing small
amounts during normal handling is not likely to cause harmful effects; breathing large amounts
may be harmful. Symptoms are more likely to be observed at concentrations exceeding
recommended exposure limits, and may include headache, drowsiness, nausea, vomiting, blurred
vision, blindness, and coma.
SECTION 4 – FIRST AID MEASURES
Eyes: Move individual away from exposure. Flush eyes with plenty of water for at least 15
minutes while holding eyelids open. Seek medical attention immediately.
Skin: Remove contaminated clothing. Wash exposed area with warm water for at least 15
minutes. Get medical attention. Wash clothing and shoes before reuse.
Swallowing: If swallowed, seek medical attention immediately. If individual is drowsy or
unconscious, do not give anything by mouth. If individual is conscious and alert, INDUCE
VOMITING. If possible, do not leave person unattended.
Inhalation: Move individual away from exposure and into fresh air. If not breathing, give
artificial respiration, If breathing is difficult, administer oxygen. Keep person warm and quiet;
seek medical attention immediately.
SECTION 5 – FIRE FIGHTING MEASURES
Flash Point (Method) 54ºF (12.2ºC) (TAG Closed Cup)
Auto-ignition No data
Explosive Limit Lower Limit: 6.0% Upper Limit 36%
Extinguishing Media CO2, Foam, Dry Chemical (Water may be ineffective)
Fire and Explosion Hazard Vapors form from this product and may travel along the
ground/floor or moved by ventilation. Can be ignited by pilot light,
flames, sparks, heaters, electric motors or other ignition sources.
Do not use heat or flame around closed containers, containers may
explode and scatter burning gel.
Fire Fighting Instructions Water may be ineffective to extinguish flame. Water may be used
to cool fire-exposed containers until fire is extinguished. Wear
self-contained breathing apparatus and full protective clothing.
NFPA Rating: Acute Health – 1; Flammability – 3; Reactivity – 0
0-Least, 1-Slight,
2-Moderate, 3-High,
4-Extreme
SECTION 6 – ACCIDENTAL RELEASE MEASURES
Spill Make sure there is adequate ventilation. Remove all ignition
sources. Absorb spill on vermiculite paper. Clean area with water
until all material is absorbed and removed.

87
Large Spill Immediately eliminate all ignition sources (open flames, smoking
materials, pilot lights, electrical sparks). Remove persons not in
appropriate protective gear from area. Stop spill at source. Prevent
material from entering drains, sewers and waterways. Prevent spill
from spreading. Spread absorbent material on spill. Remove to
containers for disposal per local, state, and federal ordinances.
SECTION 7 – HANDLING AND STORAGE
Handling Keep away from heat, flame, and sparks. Avoid breathing vapors.
Avoid contact with skin, wash thoroughly after handling. Keep
away from children. Place can in chafer before lighting, and keep
away from combustibles (e.g., paper plates, napkins, paper
tablecloths, etc.). Use in a well-ventilated area. DO NOT TAKE
INTERNALLY.
Storage Containers should be stored away from flame, heat or other
ignition sources. Store in a cool dry place (40-120°F,
4-49°C). Provide adequate ventilation. Keep container closed when
not in use.
SECTION 8 – EXPOSURE CONTROLS / PERSONAL PROTECTION
Precautionary Labeling WARNING: Keep away from children. Flammable mixture. Do
not use near fire or heat. Vapor harmful. May be fatal or cause
blindness if swallowed. Cannot be made non-poisonous.
Eye Protection Avoid eye contact with material.
Skin Protection Avoid contact with skin. Do not remove gel from container.
Protective Clothing Recommend the use of rubber or Neoprene gloves and safety
goggles.
Respiratory Protection Not required unless exposed to high concentrations above
approved guidelines
Exposure Guidelines Methanol 75% OSHA PEL =200 ppm (TWA); ACGIH TLV = 200
ppm (TWA)
SECTION 9 – PHYSICAL DATA AND CHEMICAL PROPERTIES
Appearance and Odor Blue thick gel with alcohol odor
pH ~7 (neutral)
Freeze Range -130 F (-90 C)
Boiling Range 170.6-176 F (77-80 C)
Evaporation Rate 3.5 (Butyl Acetate = 1)
Vapor Pressure 97.68 mmHG @ 68 F (20C)
Vapor Density 1.11 (Air = 1)
Solubility in water Miscible
10. STABILITY AND REACTIVITY

88
Hazardous Polymerization Will not occur
Hazardous Decomposition Burning may cause carbon dioxide and/or carbon monoxide if
inadequate oxygen
Chemical Stability Stable
Incompatibility Heat, open flames and strong oxidizers.
11. TOXICOLOGICAL INFORMATION – NA
12. ECOLOGICAL INFORMATION – NA
13. DISPOSAL INFORMATION
Disposal: Dispose of in accordance with all applicable Federal, State, and
local regulations. Purchaser is responsible for proper waste disposal
of any partial to full containers. Do not dump into sewers, any
bodies of water or onto ground.
14. TRANSPORTATION
Domestic: Consumer Commodity ORM-D
International: Flammable Solid, Organic, n.o.s., (contains methanol), 4.1, UN
1325, PGII
15. REGULATORY INFORMATION
OSHA This product hazardous under the OSHA Hazard Communication
Standard (29 CFR 1910.1200)
CERCLA The Reportable Quantity for Methanol is 5000 lbs. Releases equal
to or greater must be reported to the National Response Center
(NRC) at 800-424-8802.
RCRA The hazardous waste number for Methanol is U154.
SARA 302 Components: None
SARA 313 Components: Methanol (CAS # 67-56-1)
International Regulations Canada: DSL. The intentional ingredients of this product are listed.
EEC: EINECS. The intentional ingredients of this product are
listed.
State and Local Regulations
California Proposition 65: None
New Jersey Right To Know Methyl Alcohol (67-56-1)
Pennsylvania Right To Know: Methyl Alcohol (67-56-1)
16. OTHER INFORMATION
The information contained herein is believed to be accurate but is not warranted to be, whether
originating with the company or not. Recipients are advised to confirm in advance that the
information is current, applicable, and suitable to their circumstances and requirements.

89
Appendix B: Long-term Performance Plots of Prototypes 1
and 2
Figure 31: Prototype 1 Long-term Performance Using Methanol Gel
0
10
20
30
40
50
60
70
80
0
0.1
0.2
0.3
0.4
0.5
0.6
0.7
0.8
0.9
1
0 10 20 30 40 50
Volt
age
(V)
Time (Hr)
Voltage
Power
Pow
er (
mW
)

90
Figure 32: Prototype 2 Long-term Performance Using Methanol Gel
0
20
40
60
80
100
120
140
0
0.2
0.4
0.6
0.8
1
1.2
0 5 10 15 20 25
Pow
er (
mW
)
Volt
age
(V)
Time (Hr)
Voltage
Power

91
Figure 33: Prototype 1 Long-term Performance Using Neat Methanol
0
10
20
30
40
50
60
70
80
90
0
0.1
0.2
0.3
0.4
0.5
0.6
0.7
0.8
0.9
1
0 5 10 15 20 25 30 35 40 45
Pow
er (
mW
)
Volt
age
(V)
Time (Hr)
Voltage
Power

92
Figure 34: Prototype 2 Long-term Performance Using Neat Methanol
0
10
20
30
40
50
60
70
80
0
0.1
0.2
0.3
0.4
0.5
0.6
0.7
0.8
0.9
1
0 5 10 15 20 25 30
Pow
er (
mW
)
Volt
age
(V)
Time (Hr)
Voltage
Power

93
Appendix C: MEA Preparation
Electrode Preparation:
DMFC electrodes are prepared by spraying a catalytic ink on a carbon cloth gas diffusion
layer. Always wear safety goggles and gloves when preparing electrodes.
The catalytic ink is a suspension of catalyst particles in a solvent mixture (water +
methanol). The catalyst loading of an electrode depends on the weight of catalyst in the ink. The
loading is the true weight of catalyst (in grams) for 1 cm2 of electrode. Thus the weight of carbon
black is not accounted for in supported catalysts on carbon.
In this lab, electrodes will have a 5 cm2 area. Besides, it is assumed that 20% of the ink is
lost during preparation. Consequently, it is easy to calculate the weight of catalyst needed for the
4 mg/cm2 Pt or Pt/Ru black electrode or for the 1 mg/cm
2 20wt% supported Pt on carbon
electrode.
Nafion (!=2.01 g/cm3) is added before sonication in the ultrasonic bath. The loading is
10% of the total weight of catalyst. It means that in the case of supported catalysts, the weight of
carbon black has to be accounted for.
For one 4 mg/cm2 Pt or Pt/Ru black electrode:
• Weigh 24 mg of metal “black” and put in a beaker
• Add 5 ml of deionized water
• Add 5 ml of ethanol
• Add 2.4 mg of Nafion
• Cover the beaker hermetically with a piece of “parafilm”

94
• Sonicate for 3 hours
WARNING: Ethanol and isopropanol are the most frequent organic solvent used in catalytic ink
preparation for DMFCs. They can react violently with catalysts (especially Pt and Pt/Ru black)
and start a combustion reaction. To prevent any risk, when the ink is prepared, the catalyst
should be first mixed with water and completely soaked before alcohol addition. Besides, the
desired amount of alcohol needs to be poured into a beaker before being added to the ink.
For one 4 mg/cm2 Pt or Pt/Ru black electrode:
• Weigh 120 mg of 20wt% Pt supported on carbon and put in a beaker
• Add 5 ml of deionized water
• Add 5 ml of ethanol
• Add 12 mg of Nafion
• Cover the beaker hermetically with a piece of “parafilm”
• Sonicate for 3 hours
Ink can be prepared for more than one electrode. Quantities have to be multiplied by the
number of electrodes prepared. Besides, each time the amount of catalyst is increased to prepare
one more electrode, the sonication time is increased by ! hour.
After sonication, the catalytic ink is poured in the tank of the sprayer and the beaker is
rinsed with deionized water. The piece of carbon cloth is sprayed as homogeneously as possible
until the surface of the carbon cloth becomes wet. The carbon cloth is dried with a hair dryer

95
and sprayed again until no ink remains. The electrode is then dried in an oven at 80ºC for 1 hour.
Alternatively, the ink can be sprayed onto the membrane either before or after being submerged
in the sulfuric acid solution.
Membrane Treatment:
Membranes are cut into 3” x 3” squares using either Nafion 112, Nafion 1135, Nafion
117, or Nafion 1110.
Membranes are treated in a 1L beaker containing between 200 and 300 ml of deionized
water, H2O2, or H2SO4 solutions. They are boiled in the following order:
• ! hour in deionized water to soak them
• ! hour in 5vol% hydrogen peroxide (commercial solution) to oxidize impurities
• ! hour in deionized water
• 1 hour in 0.5 mol/L sulfuric acid
• ! hour in deionized water (or until ready for further use)
Hot Pressing:
5 cm2 electrodes are placed on either side in the middle of the membrane and the future
MEA is placed in a folded Teflon sheet. The sheet is then sandwiched between two metallic
plates. The top and bottom plates are heated to 275ºF (135ºC). Once that temperature is reached,
the MEA is put in the press at about 2 tons of pressure. Afterwards, the heaters need to be shut
off and the pressure needs to be released. After about 10 minutes, the membrane should be
cooled.

96
WARNING: It is important to always place either the anode or cathode on the top to know
where the anode is. If the membrane is put in the wrong position in the cell, performance is
severely limited. It is easy to figure it out as the OCV will not rise beyond 0.42 V. Also, goggles
and heat resistant gloves should be worn while operating the hot press.
Insertion of the membrane in the fuel cell stack:
The membrane is sandwiched between two gaskets (typically Teflon) and put in the stack
between two bipolar plates. The electrodes must completely cover the feed channels. Besides,
one has to take care that the anode and cathode are on their respective sides. The anode bipolar
plate is labeled, but can be recognized as the feed stream and exit stream are on the same side
and passes through the enclosure to be heated before going in the feed channel.
Once the two sides of the stack are put together, they are bolted together in a particular
sequence to apply a uniform pressure on the membrane (see Figure 35). The pressure on the
membrane should be stacked with a torque of 65 in-lb. This step should be done twice, once at
60 in-lb and again at 65 in-lb, to ensure all the screws are bolted at the same torque. [21]

97
Figure 35: Bipolar Bolt Sequence

98
References
1. Dyer, C.K., Fuel cells for portable applications. Journal of Power Sources, 2002. 106(1-
2): p. 31-34.
2. Oliveira, V.B., C.M. Rangel, and A.M.F.R. Pinto, Effect of anode and cathode flow field
design on the performance of a direct methanol fuel cell. Chemical Engineering Journal,
2010. 157(1): p. 174-180.
3. Bae, B., et al., Performance evaluation of passive DMFC single cells. Journal of Power
Sources, 2006. 158(2): p. 1256-1261.
4. Ferrin, P., et al., Reactivity descriptors for direct methanol fuel cell anode catalysts.
Surface Science, 2008. 602(21): p. 3424-3431.
5. Kauranen, P.S., E. Skou, and J. Munk, Kinetics of methanol oxidation on carbon-
supported Pt and Pt + Ru catalysts. Journal of Electroanalytical Chemistry, 1996. 404(1):
p. 1-13.
6. Vilekar, S.A. and R. Datta, The effect of hydrogen crossover on open-circuit voltage in
polymer electrolyte membrane fuel cells. Journal of Power Sources, 2010. 195(8): p.
2241-2247.
7. Jung, G.-B., et al., Effect of Operating Parameters on the DMFC Performance. Journal of
Fuel Cell Science and Technology, 2005. 2(2): p. 81-85.
8. Liu, J.G., et al., Effect of membrane thickness on the performance and efficiency of
passive direct methanol fuel cells. Journal of Power Sources, 2006. 153(1): p. 61-67.
9. Liu, J., et al., Effect of methanol concentration on passive DMFC performance. Fuel
Cells Bulletin, 2005. 2005(2): p. 12-17.

99
10. Han, J. and H. Liu, Real time measurements of methanol crossover in a DMFC. Journal
of Power Sources, 2007. 164(1): p. 166-173.
11. Arico, A.S., et al., Analysis of the Electrochemical Characteristics of a Direct Methanol
Fuel Cell Based on a Pt-Ru/C Anode Catalyst. Journal of The Electrochemical Society,
1996. 143(12): p. 3950-3959.
12. Jung, G.-B., et al., Supported Nafion Membrane for Direct Methanol Fuel Cell. Journal
of Fuel Cell Science and Technology, 2007. 4(3): p. 248-254.
13. Lin, H.-L., et al., Preparation of Nafion/poly(vinyl alcohol) electro-spun fiber composite
membranes for direct methanol fuel cells. Journal of Membrane Science, 2010. 365(1-2):
p. 114-122.
14. Wycisk, R., et al., Direct methanol fuel cell membranes from Nafion-polybenzimidazole
blends. Journal of Power Sources, 2006. 163(1): p. 9-17.
15. Lin, H.-L., et al., Nafion/PTFE composite membranes for direct methanol fuel cell
applications. Journal of Power Sources, 2005. 150: p. 11-19.
16. Tsai, J.-C., et al., Blended Nafion®/SPEEK direct methanol fuel cell membranes for
reduced methanol permeability. Journal of Power Sources, 2009. 189(2): p. 958-965.
17. Adjemian, K.T., et al., Silicon Oxide Nafion Composite Membranes for Proton-Exchange
Membrane Fuel Cell Operation at 80-140[degree]C. Journal of The Electrochemical
Society, 2002. 149(3): p. A256-A261.
18. Lundin, M.D. and M.J. McCready, High pressure anode operation of direct methanol
fuel cells for carbon dioxide management. Journal of Power Sources, 2011. 196(13): p.
5583-5590.

100
19. Xu, C. and T.S. Zhao, In situ measurements of water crossover through the membrane
for direct methanol fuel cells. Journal of Power Sources, 2007. 168(1): p. 143-153.
20. Baglio, V., et al., Investigation of passive DMFC mini-stacks at ambient temperature.
Electrochimica Acta, 2009. 54(7): p. 2004-2009.
21. Eccarius, S., et al., Completely Passive Operation of Vapor-Fed Direct Methanol Fuel
Cells for Portable Applications. Journal of Micromechanics and Microengineering, 2008.
18(10).
22. Guo, Z. and A. Faghri, Development of a 1 W passive DMFC. International
Communications in Heat and Mass Transfer, 2008. 35(3): p. 225-239.
23. Faghri, A. and Z. Guo, An innovative passive DMFC technology. Applied Thermal
Engineering, 2008. 28(13): p. 1614-1622.
24. Kim, D., et al., Recent progress in passive direct methanol fuel cells at KIST. Journal of
Power Sources, 2004. 130(1-2): p. 172-177.
25. Chan, Y.H., et al., A small mono-polar direct methanol fuel cell stack with passive
operation. Journal of Power Sources, 2008. 178(1): p. 118-124.
26. Tsujiguchi, T., et al., Development of a passive direct methanol fuel cell stack for high
methanol concentration. Journal of Power Sources, 2010. 195(18): p. 5975-5979.
27. Eccarius, S., et al., Passively operated vapor-fed direct methanol fuel cells for portable
applications. Journal of Power Sources, 2008. 182(2): p. 565-579.
28. Chen, R., T.S. Zhao, and J.G. Liu, Effect of cell orientation on the performance of passive
direct methanol fuel cells. Journal of Power Sources, 2006. 157(1): p. 351-357.
29. Chen, R. and T.S. Zhao, Mathematical modeling of a passive-feed DMFC with heat
transfer effect. Journal of Power Sources, 2005. 152: p. 122-130.

101
30. Broussely, M. and G. Archdale, Li-ion batteries and portable power source prospects for
the next 5-10 years. Journal of Power Sources, 2004. 136(2): p. 386-394.
31. Masdar, M.S., T. Tsujiguchi, and N. Nakagawa, Mass spectroscopy for the anode gas
layer in a semi-passive DMFC using porous carbon plate Part I: Relationship between
the gas composition and the current density. Journal of Power Sources, 2009. 194(2): p.
610-617.
32. Kim, H., Passive direct methanol fuel cells fed with methanol vapor. Journal of Power
Sources, 2006. 162(2): p. 1232-1235.
33. Rice, J. and A. Faghri, Analysis of a passive vapor feed direct methanol fuel cell.
International Journal of Heat and Mass Transfer, 2008. 51(3-4): p. 948-959.
34. Wesley, et al., Gelled organic liquids, C.C.o. America, Editor 1998.
35. Ren, X. and L.A. Guleserian, Fuel Formation for Direct Methanol Fuel Cell, 2005.
36. Thampan, T., et al., PEM fuel cell as a membrane reactor. Catalysis Today, 2001. 67(1-
3): p. 15-32.
37. Kandlikar, S.G. and Z. Lu, Thermal management issues in a PEMFC stack - A brief
review of current status. Applied Thermal Engineering, 2009. 29(7): p. 1276-1280.
38. Wu, J., et al., Diagnostic tools in PEM fuel cell research: Part I Electrochemical
techniques. International Journal of Hydrogen Energy, 2008. 33(6): p. 1735-1746.
39. Chen, R. and T.S. Zhao, Performance characterization of passive direct methanol fuel
cells. Journal of Power Sources, 2007. 167(2): p. 455-460.
40. Kho, B.K., et al., On the consequences of methanol crossover in passive air-breathing
direct methanol fuel cells. Journal of Power Sources, 2005. 142(1-2): p. 50-55.

102
41. Fetcenko, M., Ovonic NiMH - Building on Consumer, Vehicle Success to Address
Stationary Applications, T.t.I.S.E.o.P.a.S. Batteries, Editor 2011: ECD Ovonics.
42. Kamarudin, S.K., et al., Overview on the challenges and developments of micro-direct
methanol fuel cells (DMFC). Journal of Power Sources, 2007. 163(2): p. 743-754.
43. Chen, C.-H. and T.-K. Yeh, A mathematical model for simulating methanol permeation
and the mixed potential effect in a direct methanol fuel cell. Journal of Power Sources,
2006. 160(2): p. 1131-1141.
44. Lee, W.-k., et al., The effects of compression and gas diffusion layers on the performance
of a PEM fuel cell. Journal of Power Sources, 1999. 84(1): p. 45-51.
45. Taniguchi, A., et al., Analysis of electrocatalyst degradation in PEMFC caused by cell
reversal during fuel starvation. Journal of Power Sources, 2004. 130(1-2): p. 42-49.
46. Travassos, M.A. and C.M. Rangel, Polarity Reversal in PEM Fuel Cells by Fuel
Starvation, 2010: 3º Seminario Internacional de Torres Verdes, Hydrogen Energy and
Sustainability-Advances in Fuel Cell and Hydrogen Workshop. p. 48-52.
47. Du, C.Y., T.S. Zhao, and W.W. Yang, Effect of methanol crossover on the cathode
behavior of a DMFC: A half-cell investigation. Electrochimica Acta, 2007. 52(16): p.
5266-5271.
48. Liu, J.G., et al., The effect of methanol concentration on the performance of a passive
DMFC. Electrochemistry Communications, 2005. 7(3): p. 288-294.
49. Chu, D. and R. Jiang, Effect of operating conditions on energy efficiency for a small
passive direct methanol fuel cell. Electrochimica Acta, 2006. 51(26): p. 5829-5835.
50. Jiang, R. and D. Chu, Comparative Studies of Methanol Crossover and Cell Performance
for a DMFC. Journal of The Electrochemical Society, 2004. 151(1): p. A69-A76.

103
51. Meyers, J.P. and J. Newman, Simulation of the Direct Methanol Fuel Cell. Journal of The
Electrochemical Society, 2002. 149(6): p. A718-A728.
52. Wang, Z.H. and C.Y. Wang, Mathematical Modeling of Liquid-Feed Direct Methanol
Fuel Cells. Journal of The Electrochemical Society, 2003. 150(4): p. A508-A519.
53. Chiu, Y.-J., An algebraic semi-empirical model for evaluating fuel crossover fluxes of a
DMFC under various operating conditions. International Journal of Hydrogen Energy,
2010. 35(12): p. 6418-6430.
54. Dohle, H. and K. Wippermann, Experimental evaluation and semi-empirical modeling of
U/I characteristics and methanol permeation of a direct methanol fuel cell. Journal of
Power Sources, 2004. 135(1-2): p. 152-164.
55. Uberoi, M. and C.J. Pereira, External Mass Transfer Coefficients for Monolith Catalysts.
Industrial & Engineering Chemistry Research, 1996. 35(1): p. 113-116.
56. Yin, K.-M., An algebraic model on the performance of a direct methanol fuel cell with
consideration of methanol crossover. Journal of Power Sources, 2007. 167(2): p. 420-429.
57. Jalani, N.H., P. Choi, and R. Datta, Phenomenological methanol sorption model for
Nafion® 117. Solid State Ionics, 2004. 175(1-4): p. 815-817.
58. Thampan, T., et al., Modeling of Conductive Transport in Proton-Exchange Membranes
for Fuel Cells. Journal of The Electrochemical Society, 2000. 147(9): p. 3242-3250.
59. Cheng, X., et al., Characterization of catalysts and membrane in DMFC lifetime testing.
Electrochimica Acta, 2006. 51(22): p. 4620-4625.
60. Gasteiger, H.A., et al., Kinetics and Kinetically Limited Performance in PEMFCs and
DMFCs with State-of-the-Art Catalysts, in Mini-Micro Fuel Cells, S. Kakaç, A.
Pramuanjaroenkij, and L. Vasiliev, Editors. 2008, Springer Netherlands. p. 209-224.

104
61. Vidakovic, T., M. Christov, and K. Sundmacher, Rate expression for electrochemical
oxidation of methanol on a direct methanol fuel cell anode. Journal of Electroanalytical
Chemistry, 2005. 580(1): p. 105-121.
62. Kamarudin, S.K., F. Achmad, and W.R.W. Daud, Overview on the application of direct
methanol fuel cell (DMFC) for portable electronic devices. International Journal of
Hydrogen Energy, 2009. 34(16): p. 6902-6916.
63. Xiao, B., H. Bahrami, and A. Faghri, Analysis of heat and mass transport in a miniature
passive and semi passive liquid-feed direct methanol fuel cell. Journal of Power Sources,
2010. 195(8): p. 2248-2259.
64. Casalegno, A., P. Grassini, and R. Marchesi, Experimental analysis of methanol cross-
over in a direct methanol fuel cell. Applied Thermal Engineering, 2007. 27(4): p. 748-
754.
65. Chen, R. and T.S. Zhao, A novel electrode architecture for passive direct methanol fuel
cells. Electrochemistry Communications, 2007. 9(4): p. 718-724.