improving and understanding direct methanol fuel cell ... · improving and understanding direct...
TRANSCRIPT
Improving and Understanding Direct Methanol Fuel Cell (DMFC)
Performance
By
Alexandre Hacquard
A Thesis submitted to the faculty of
WORCESTER POLYTECHNIC INSTITUTE
In partial fulfillment of the requirement for the Degree of Master of Science In
Chemical Engineering
May 2005
APPROVED
Dr. Ravindra Datta, Professor, Major advisor Dr. David Dibiasio, Associate Professor, Department Head

- 2 -
Table of contents
TABLE OF CONTENTS ……………………………………….…………
LIST OF FIGURES ……………………………………………..…………
LIST OF TABLES …………………………………………………….…..
LIST OF SYMBOLS ………………………………………….………….
ACKNOLEDGEMENTS …………………………………….…………..
Abstract ……………………………………..…………………..………..
I. Literature review ………………………………………………………
1. The promise of fuel cells ……………………………………………………………
2. The promise of direct methanol fuel cells ………………………………......……...
a. Advantages ………………………………………………………………………………….
b. Environmental concerns …………………………………………………………………….
c. Potential applications ……………………………………………………………………….
3. Direct Methanol Fuel Cell principle ………………………………...………………
a. Generalities ………………………………….……………………………….…..….………
b. Reactions ……………………………………………..…………………….……...………..
4. Issues in DMFC ……………………………………………………...……………...
a. Slow electro-oxidation kinetics ……………………………….…………………………….
b. Methanol Crossover ………………………………………….……………………………..
c. Gas management on anode side …………………………………………………….………
5. Electrode structure …………………………………………..……………………..
a. Catalysts …………………………………………………………………………….………
b. Catalyst structure ………………………………………………………………….………..
6. Electrodes and MEA preparation ………………………………………..…………
a. Catalytic ink preparation …………………………………………………….……….……..
b. Application to the diffusion backing ………………………………………..……....………
c. MEA preparation ………………………………………………………..………………….
2
5
9
10
11
12
14
14
14
14
14
15
16
16
17
18
18
18
21
22
22
23
23
24
24
24
- 3 -
7. The fuel cell station ………………………….……………………..………………
II. Experimental methods ……………………………….………………..
1. Membrane pretreatment …………………………………………………...……….
2. Membrane Electrode Assembly (MEA) preparation ……………….……..……….
3. Experiments and experimental conditions …………………………………………
III. Experimental results ………………………………….….……………
1. Effect of the catalyst layer ……………………………….……………..…………..
a. Performance of commercial electrodes ……………………………...……………………..
b. Home-made electrodes ……………………………………………………..………………
c. Catalyst supported on carbon ………………………………..……………………………..
d. Effect of Pt black at Cathode (non-supported platinum) ………………..……….…………
e. Pt/Ru catalyst on both sides of the membrane ……………………………..…………........
f. Segregated methanol decomposition and hydrogen oxidation on bilayer
Electrodes ……………………………………………………………..……………………
2. Effects of temperature, humidification and flow rate on Pt/Ru black and Pt/C Membrane Electrode Assembly …………………………...….……
3. Effect of Nafion and PTFE content in the catalytic layer ……..……………..…….
a. Effect of Nafion …………………………………………………...………………….…….
b. Effect of PTFE ……………………………………………………………………….……..
4. Operation at higher methanol concentration with a barrier layer……….………..…
a. Effect of a PTFE solution sprayed on the top of an electrode ………………………….…..
b. Effect of a PTFE solution sprayed between the electrode backing and
the catalytic layer …………………………………………………………………….…….
c. Effect of a supported Pt/Ru resistance layer between the electrode
backing and the catalytic layer …………………………………………….……….……….
d. Effect of the location of the supported catalyst on carbon resistance layer on ……..………
cell performance
5. Nano-composite membranes and methanol crossover ………………………..……
a. 117 membranes …………………………………………………...…………...…....………
b. 112 membranes ……………………………………………………….……………….……
6. Overall conclusions …………………………………………………………….…..
25
27
27
27
28
30
30
30
31
35
37
38
39
41
44
44
44
50
50
50
51
55
57
57
59
62

- 4 -
IV. Dynamic modeling of the DMFC …………………….………………
1. Reaction mechanism for methanol oxidation and oxygen reduction …….……..…
2. Material balance on anode side ……………………….………………..………….
3. Simulation …………………………………………….………………..………….
a. Initial conditions and parameters …………………….………………….…………………
b. Search of fitting parameters …………………………….………….…….………………...
c. Discussion on the dynamic simulation ……………….……………….….………………..
d. Modeling of the polarization curve ………………….…………….…….…………………
4. Overall conclusions on dynamic model …………..…………...…………………..
V. Reaction Network Theory applied to the electro-chemical oxidation of methanol …………………………….……….………….
1. Reaction Network Theory ………………………………………………...……….
2. Methanol oxidation mechanism …………………………………..…………….…
3. Reaction Route graphs for methanol decomposition and WGS Reaction ……...…
4. Overall graph …………………………………………………………....…………
5. Overall conclusions …………………………………………………..…..………..
VI. Conclusions and recommendations for future work …………...……..
REFERENCES ………………………………………………….……….
APPENDIX ………………………………………………………………
65
65
66
68
68
69
72
78
82
84
84
85
88
89
90
91
93
96
- 5 -
List of figures
Figure 1: DMFC principle scheme …………………..…………………………………
Figure 2: Methanol crossover phenomenon ……………………………………………
Figure 3: Internal short circuit created by crossover ………………………….………..
Figure 4: Crossover currant losses compared to total current density ……….…………
Figure 5: CO2 bubbles formation and coalescence in the anode feed channel ………..
Figure 6: Catalyst structure ……………………………………………………………
Figure 7: Flow patterns for bipolar plates ……………………………………………..
Figure 8: Pin Flow pattern ……………………………………………………………..
Figure 9: Fuel Cell Stack ………………………………………………………………
Figure 10: Fuel Cell Stack …………………………………………………………….
Figure 11: Performance of commercial electrodes …………………………………….
Figure 12: Performance of hand-made electrodes ……………………………………
Figure 13: Current oscillations at fixed potential and anode feed flow rate
of 1ccm …………………………………………………………………….
Figure 14: Current oscillations at fixed potential and anode feed flow rate
of 5ccm …………………………………………………………………….
Figure 15: Effect of flow rate on cell performance ……………………………………
Figure 16: Performance of supported catalysts ……………………………………….
Figure 17. a: Current oscillations at fixed potential for an anode flow rate
of 1ccm ……………………………………..…………………………….
Figure 17. b: Current oscillations at fixed potential for an anode flow rate
of 5ccm …………………………………………………………………..
Figure 18: Effect of flow rate on a Pt/Ru black and Pt black MEA …………………..
Figure 19: Effect of temperature on an MEA made with Pt/Ru black
on anode and cathode ………………………………………………………
Figure 20: Bilayer Pt black-Pt/Ru black at anode …………………………………….
Figure 21: Bilayer Pt/Ru black-Pt on C at anode ……………………………………..
Figure 22: Effect of temperature and flow rate ………………………………………..
Figure 23: Effect of cathode humidification …………………………………………..
17
19
19
20
21
23
25
25
26
28
30
32
33
34
34
35
36
37
38
39
40
41
42
43
- 6 -
Figure 24: Polarization curves at 110ºC for anode flow rates of 1ccm
and 5ccm …………………………………………………….………..……
Figure 25: Effect of Nafion content at anode ………………………………...………..
Figure 26: Effect of Nafion content at Cathode ……………………………..………...
Figure 27: Effect of PTFE at the cathode ………………………………..….…………
Figure 28: Effect of 5wt% of PTFE and flow rate at the Anode at T = 60ºC
and T = 80ºC ……………………………………………………………….
Figure 29: Effect of various PTFE content at the Anode (T=80ºC) …………………...
Figure 30: Effect of methanol concentration on a 20wt% PTFE at the
anode (T=80ºC) …………………………………………………………….
Figure 31: 10wt% PTFE resistance barrier at the Anode ………………………………
Figure 32: 10wt% PTFE resistance layer at the Anode ………………………………..
Figure 33: 20wt% PTFE resistance layer at the Anode ……………………………….
Figure 34: 10wt% PTFE / 10wt% NAFION resistance layer at the Anode ……………
Figure 35: Effect of flow rate on the 10wt% PTFE and
the 10wt% PTFE / 10wt% ………………………………………………….
Figure 36: 10wt% PTFE / 10wt% NAFION resistance layer located
between the anode catalytic layer and the membrane ……………………..
Figure 37: 10wt% PTFE / 10wt% NAFION resistance layer located
between the membrane and the anode catalytic layer ……………………..
Figure 38: Effect of 117 a Nano-composite membrane on the cell
performance at 60ºC ……………………………………………………….
Figure 39: Effect of 117 a Nano-composite membrane on the cell
performance at 80ºC ……………………………………………………….
Figure 40: Effect of methanol concentration on a 117 Nano-composite
membrane at 80ºC ………………………………………………………….
Figure 41: Effect of 112 Nano-composite membranes on the cell
performance at 60ºC ………………………………………………………..
Figure 42: Effect of 112 Nano-composite membranes at 80ºC ……………………….
Figure 43: Effect of various 112 Nano-composite membranes at 80ºC ……………….
43
44
45
46
47
48
49
51
52
52
53
54
55
56
58
58
59
60
60
61

- 7 -
Figure 44: Effect of methanol concentration on the Zr/Si2 112
Nano-composite membrane on the cell performance at 80ºC ……………..
Figure 45: Current density as a function of time at U = 0.5V for a 117
Nafion membrane at 80ºC with Fanode = 1ccm, CCH3OH = 1M
and PC = 0atm (rel.) ………………………………………………………..
Figure 46: Current density as a function of time at U = 0.3V for a 117
Nafion membrane at 80ºC with Fanode = 1ccm, CCH3OH = 1M
and PC = 0atm (rel.) ………………………………………………………..
Figure 47: Current density as a function of time at U = 0.1V for a 117
Nafion membrane at 80ºC with Fanode = 1ccm, CCH3OH = 1M
and PC = 0atm (rel.) ………………………………………………………..
Figure 48: Surface coverage as a function of time at U = 0.5V for a 117
Nafion membrane at 80ºC with Fanode = 1ccm, CCH3OH = 1M
and PC = 0atm (rel.) ………………………………………………………..
Figure 49: Anode and cathode over potentials as a function of time at
U = 0.5V for a 117 Nafion membrane at 80ºC with Fanode = 1ccm,
CCH3OH = 1M and PC = 0atm (rel.) …………………………………………
Figure 50: Surface coverage as a function of time at U = 0.3V for a 117
Nafion membrane at 80ºC with Fanode = 1ccm, CCH3OH = 1M
and PC = 0atm (rel.) ………………………………………………………..
Figure 51: Anode and cathode over potentials as a function of time at
U = 0.3V for a 117 Nafion membrane at 80ºC with
Fanode = 1ccm, CCH3OH = 1M and PC = 0atm (rel.) ………………………….
Figure 52: Surface coverage as a function of time at U = 0.1V for a 117
Nafion membrane at 80ºC with Fanode = 1ccm, CCH3OH = 1M
and PC = 0atm (rel.) ………………………………………………………..
Figure 53: Anode and cathode over potentials as a function of time at
U = 0.1V for a 117 Figure 54: Theoretical polarization curve
for a 117 Nafion membrane at 80ºC with Fanode = 1ccm,
CCH3OH = 1M and PC = 0atm (rel.) ………………………………………….
61
70
71
71
72
73
74
75
76
77
- 8 -
Figure 54: Theoretical polarization curve for a 117 Nafion membrane at
80ºC with Fanode = 1ccm, CCH3OH = 1M and PC = 0atm (rel.) …………………
Figure 55: Theoretical polarization curve for a 112 Nafion membrane at
80ºC with Fanode = 5ccm, CCH3OH = 1M and PC = 0atm (rel.) ………………...
Figure 56: Theoretical polarization curve for a 117 Nafion membrane at
80ºC with Fanode = 5ccm, CCH3OH = 1M and PC = 1atm (rel.) …………………
Figure 57: Theoretical polarization curve for a 117 Nafion membrane at
80ºC with Fanode = 5ccm, CCH3OH = 5M and PC = 0atm (rel.) ……………...….
Figure 58: Methanol decomposition Reaction Route Graph …………...……………….
Figure 59: Water-Gas Shift Reaction Reaction Route Graph …………………………...
79
80
81
82
88
89

- 9 -
List of tables
Table 1: Parameter values employed in the model …………………………………….
Table 2: Fitted parameter values ………………………………………………………. 68
69

- 10 -
List of symbols
AS: Electrode surface
Ca: Anode double layer capacitance
Cc: Cathode double layer capacitance
CCH3OH: Methanol concentration in the feed solution
C M H
+: Proton concentration in the membrane
Ct*: Active catalytic sites concentration
DMH
+: Diffusion coefficient of protons in the membrane
F: Faraday’s constant
k: Rate constant
K: Equilibrium
kP: Hydraulic permeability of the membrane
kΦ: electro kinetic permeability of the membrane
NCH3OH: Methanol flux through the membrane
PA: Anode pressure
PC: Cathode pressure
Q: Feed flow rate
R: Perfect gases constant
T: Temperature of the cell
U0: Standard cell voltage
V: Anode compartment volume
Greek letters
α: Charge transfer coefficient
γ: Roughness factor
ηA: Anode overpotential
ηC: Cathode overpotential
κM: Conductivity of the membrane
µ: Pore fluid viscosity in the membrane

- 11 -
Acknowledgments
First, I would like to thank my advisor Ravindra Datta for the opportunity to work in
the Fuel Cell Center, his advice and guidance.
I would also like to acknowledge my lab-mates Nikhil Jalani and Saurabh Vilekar for
their assistance, discussion and for sharing their experience. I also wish them gook luck
for their PhD. Thanks to Ilie Fishtik and Caitlin Callaghan for their help on Reaction
Network Theory.
Next, I thank the Chemical Engineering Department for giving me the opportunity to
do a Master at Worcester Polytechnic Institute. I acknowledge the faculty of the
department, its staff and students for making of my master a good time.
Finally, thanks to Sandy and Jo for their help on administrative problems and to Jack
Ferraro and Douglas C. White for helping me to fix my experimental station.
- 12 -
Abstract
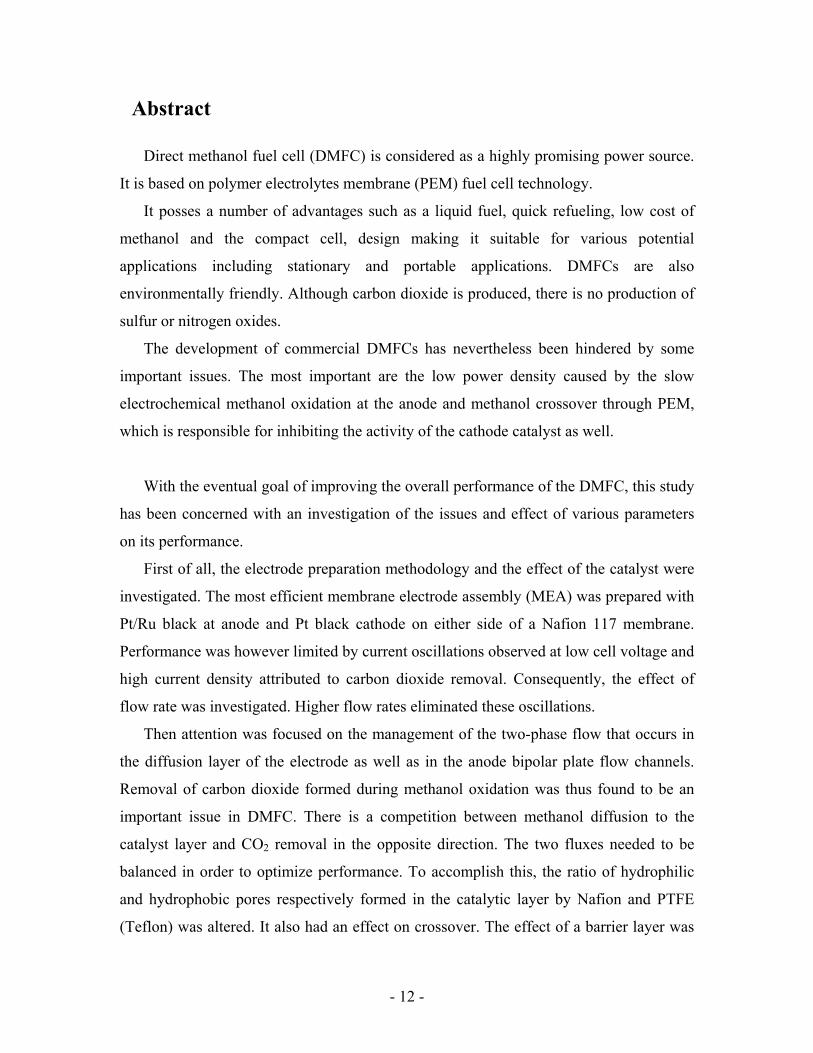
Direct methanol fuel cell (DMFC) is considered as a highly promising power source.
It is based on polymer electrolytes membrane (PEM) fuel cell technology.
It posses a number of advantages such as a liquid fuel, quick refueling, low cost of
methanol and the compact cell, design making it suitable for various potential
applications including stationary and portable applications. DMFCs are also
environmentally friendly. Although carbon dioxide is produced, there is no production of
sulfur or nitrogen oxides.
The development of commercial DMFCs has nevertheless been hindered by some
important issues. The most important are the low power density caused by the slow
electrochemical methanol oxidation at the anode and methanol crossover through PEM,
which is responsible for inhibiting the activity of the cathode catalyst as well.
With the eventual goal of improving the overall performance of the DMFC, this study
has been concerned with an investigation of the issues and effect of various parameters
on its performance.
First of all, the electrode preparation methodology and the effect of the catalyst were
investigated. The most efficient membrane electrode assembly (MEA) was prepared with
Pt/Ru black at anode and Pt black cathode on either side of a Nafion 117 membrane.
Performance was however limited by current oscillations observed at low cell voltage and
high current density attributed to carbon dioxide removal. Consequently, the effect of
flow rate was investigated. Higher flow rates eliminated these oscillations.
Then attention was focused on the management of the two-phase flow that occurs in
the diffusion layer of the electrode as well as in the anode bipolar plate flow channels.
Removal of carbon dioxide formed during methanol oxidation was thus found to be an
important issue in DMFC. There is a competition between methanol diffusion to the
catalyst layer and CO2 removal in the opposite direction. The two fluxes needed to be
balanced in order to optimize performance. To accomplish this, the ratio of hydrophilic
and hydrophobic pores respectively formed in the catalytic layer by Nafion and PTFE
(Teflon) was altered. It also had an effect on crossover. The effect of a barrier layer was

- 13 -
investigated to reduce crossover. Finally, zirconia and silica nano-composite membranes
were tested instead of Nafion and found to reduce crossover.
Developing a good understanding of what happens on the catalyst surface is
important to develop a strategy on how improve DMFC performance. Thus is why a
dynamic model based on a simplified mechanism for methanol electro-oxidation reaction
was developed. It shows, amongst other insights, how the intermediate species coverage
evolves with time. The mechanism was however too simple to provide an idea of which
poisoning species are formed on the catalyst surface. A more exhaustive mechanism is
thus being developed using Reaction Route analysis.
- 14 -
I. Literature review
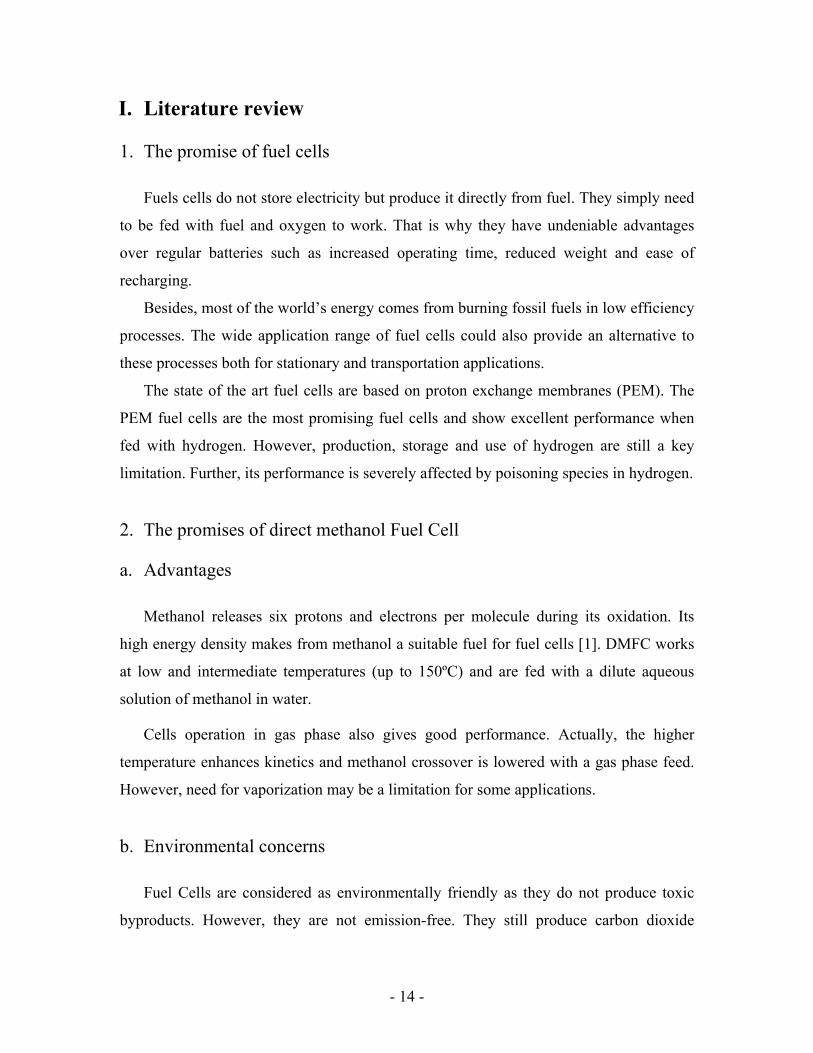
1. The promise of fuel cells
Fuels cells do not store electricity but produce it directly from fuel. They simply need
to be fed with fuel and oxygen to work. That is why they have undeniable advantages
over regular batteries such as increased operating time, reduced weight and ease of
recharging.
Besides, most of the world’s energy comes from burning fossil fuels in low efficiency
processes. The wide application range of fuel cells could also provide an alternative to
these processes both for stationary and transportation applications.
The state of the art fuel cells are based on proton exchange membranes (PEM). The
PEM fuel cells are the most promising fuel cells and show excellent performance when
fed with hydrogen. However, production, storage and use of hydrogen are still a key
limitation. Further, its performance is severely affected by poisoning species in hydrogen.
2. The promises of direct methanol Fuel Cell
a. Advantages
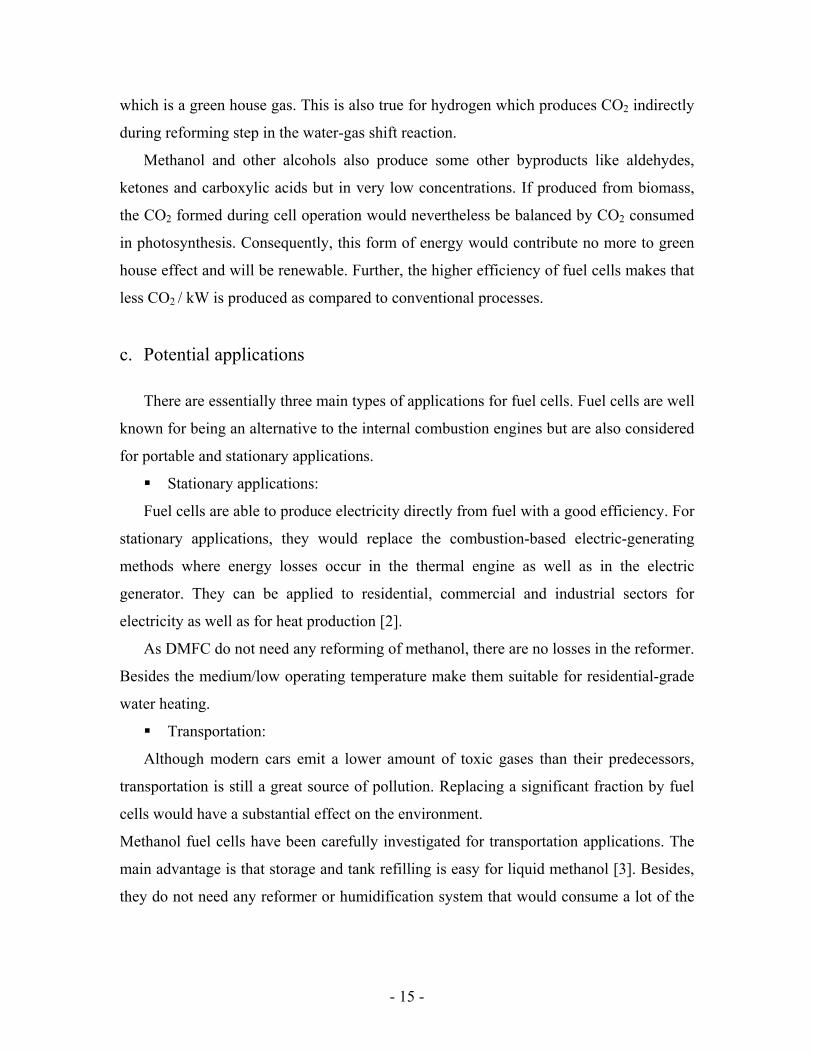
Methanol releases six protons and electrons per molecule during its oxidation. Its
high energy density makes from methanol a suitable fuel for fuel cells [1]. DMFC works
at low and intermediate temperatures (up to 150ºC) and are fed with a dilute aqueous
solution of methanol in water.
Cells operation in gas phase also gives good performance. Actually, the higher
temperature enhances kinetics and methanol crossover is lowered with a gas phase feed.
However, need for vaporization may be a limitation for some applications.
b. Environmental concerns
Fuel Cells are considered as environmentally friendly as they do not produce toxic
byproducts. However, they are not emission-free. They still produce carbon dioxide
- 15 -
which is a green house gas. This is also true for hydrogen which produces CO2 indirectly
during reforming step in the water-gas shift reaction.
Methanol and other alcohols also produce some other byproducts like aldehydes,
ketones and carboxylic acids but in very low concentrations. If produced from biomass,
the CO2 formed during cell operation would nevertheless be balanced by CO2 consumed
in photosynthesis. Consequently, this form of energy would contribute no more to green
house effect and will be renewable. Further, the higher efficiency of fuel cells makes that
less CO2 / kW is produced as compared to conventional processes.
c. Potential applications
There are essentially three main types of applications for fuel cells. Fuel cells are well
known for being an alternative to the internal combustion engines but are also considered
for portable and stationary applications.
Stationary applications:
Fuel cells are able to produce electricity directly from fuel with a good efficiency. For
stationary applications, they would replace the combustion-based electric-generating
methods where energy losses occur in the thermal engine as well as in the electric
generator. They can be applied to residential, commercial and industrial sectors for
electricity as well as for heat production [2].
As DMFC do not need any reforming of methanol, there are no losses in the reformer.
Besides the medium/low operating temperature make them suitable for residential-grade
water heating.
Transportation:
Although modern cars emit a lower amount of toxic gases than their predecessors,
transportation is still a great source of pollution. Replacing a significant fraction by fuel
cells would have a substantial effect on the environment.
Methanol fuel cells have been carefully investigated for transportation applications. The
main advantage is that storage and tank refilling is easy for liquid methanol [3]. Besides,
they do not need any reformer or humidification system that would consume a lot of the
- 16 -
available space in a car. Actually, their design is compact even if some water is needed to
dilute methanol.
Portable applications and micro-fuel cells:
The most important feature for a portable or micro fuel cell is a compact design. For a
minimized size and weight, the cell has to work at ambient temperature. The low
operating temperature of PEM fuel cell is a great advantage for portable applications.
Actually, it is the only fuel cell able to work at ambient temperature [4]. For reasons
similar to transportation application, it appears clearly that DMFC are more suitable than
hydrogen fuel cells.
Fuel cells are still a developing technology and need improvement in both
technological performance and cost.
3. Direct Methanol Fuel Cell principle
a. Generalities
Basically, the direct methanol fuel cell is a proton exchange membrane fuel cell that
is fed with an aqueous solution of methanol.
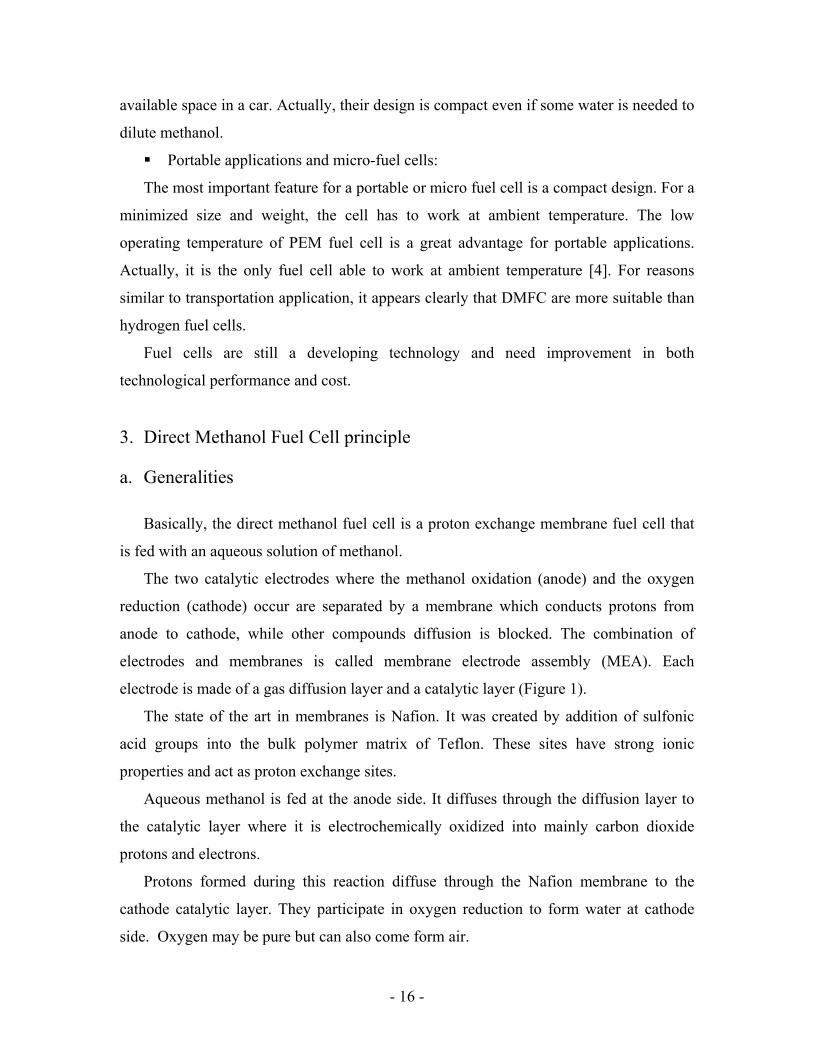
The two catalytic electrodes where the methanol oxidation (anode) and the oxygen
reduction (cathode) occur are separated by a membrane which conducts protons from
anode to cathode, while other compounds diffusion is blocked. The combination of
electrodes and membranes is called membrane electrode assembly (MEA). Each
electrode is made of a gas diffusion layer and a catalytic layer (Figure 1).
The state of the art in membranes is Nafion. It was created by addition of sulfonic
acid groups into the bulk polymer matrix of Teflon. These sites have strong ionic
properties and act as proton exchange sites.
Aqueous methanol is fed at the anode side. It diffuses through the diffusion layer to
the catalytic layer where it is electrochemically oxidized into mainly carbon dioxide
protons and electrons.
Protons formed during this reaction diffuse through the Nafion membrane to the
cathode catalytic layer. They participate in oxygen reduction to form water at cathode
side. Oxygen may be pure but can also come form air.
- 17 -
Electrons are collected by graphite bipolar plates which are the two poles of the cell.
The structure of the cell is described in Figure 1.
Figure 1: DMFC principle scheme
b. Reactions
Anode reaction: CH3OH + 7H2O CO2 + 6H3O+ + 6e- E0=0.02V
Cathode reaction: 3/2O2 + 6H3O+ + 6e- 9H2O E0=1.23V
Overall reaction: CH3OH + 3/2O2 CO2 + 2H2O E0=1.21V
At anode, the methanol is oxidized into carbon dioxide and six protons (as hydronium
ions) plus six electrons. The six protons formed react at the cathode with oxygen to form
water.
The overall reaction looks like a combustion reaction and is thus sometimes referred
to as cold combustion. Actually the cell is a mean to control this reaction and use it to
produce current directly.
ANODE
MeOH + H2O
CO2
CATHODE
H2O
O2
Gas diffusion layer
Membrane(Nafion)
Catalyst
H+
H2O
Loadi
e-
ANODE
MeOH + H2O
CO2
CATHODE
H2O
O2
Gas diffusion layer
Membrane(Nafion)
Catalyst
H+
H2O
Loadi
e-
Bipolar plate
Bipolar plate
- 18 -
The standard cell voltage for a DMFC at 25ºC is 1.21V. However, this potential is
never obtained in reality. The open circuit potential is usually about 0.6 to 0.8V in the
best case.
4. Issues in DMFC
a. Slow electro-oxidation kinetics
Various surface intermediates are formed during methanol electro-oxidation.
Methanol is mainly decomposed to CO which is then further oxidized to CO2. Other CO-
like species are also formed: COHads, HCOads, HCOOads [11]. Principle by-products are
formaldehyde and formic acid. Some of these intermediates are not readily oxidizable
and remain strongly adsorbed to the catalyst surface. Consequently, they prevent fresh
methanol molecules from adsorbing and undergoing further reaction. Thus electro-
oxidation of intermediates is the rate limiting step.
This poisoning of the catalyst surface seriously slows down the oxidation reaction.
Besides, a small percentage of the intermediates desorbs before being oxidized to CO2
and hence reduce fuel efficiency but undergoing in complete oxidation.
Thus, a very important challenge is to develop new electrocatalysts that inhibit the
poisoning and increase the rate of the reaction. At the same time, they should have a
better activity toward carbon dioxide formation.
b. Methanol Crossover
Description:
In PEM fuel cells, one of the objectives of the membrane is to stop fuel and oxygen to
reach the electrode on the other side and undergo non-electrochemical oxidation.
However, in DMFC, the fuel diffuses through Nafion membrane. Due to the hydroxyl
group and its hydrophilic properties, methanol interacts with the ion exchange sites and is
dragged by hydronium ions in addition to diffusion as a result of concentration gradient
between anode and cathode.
- 19 -
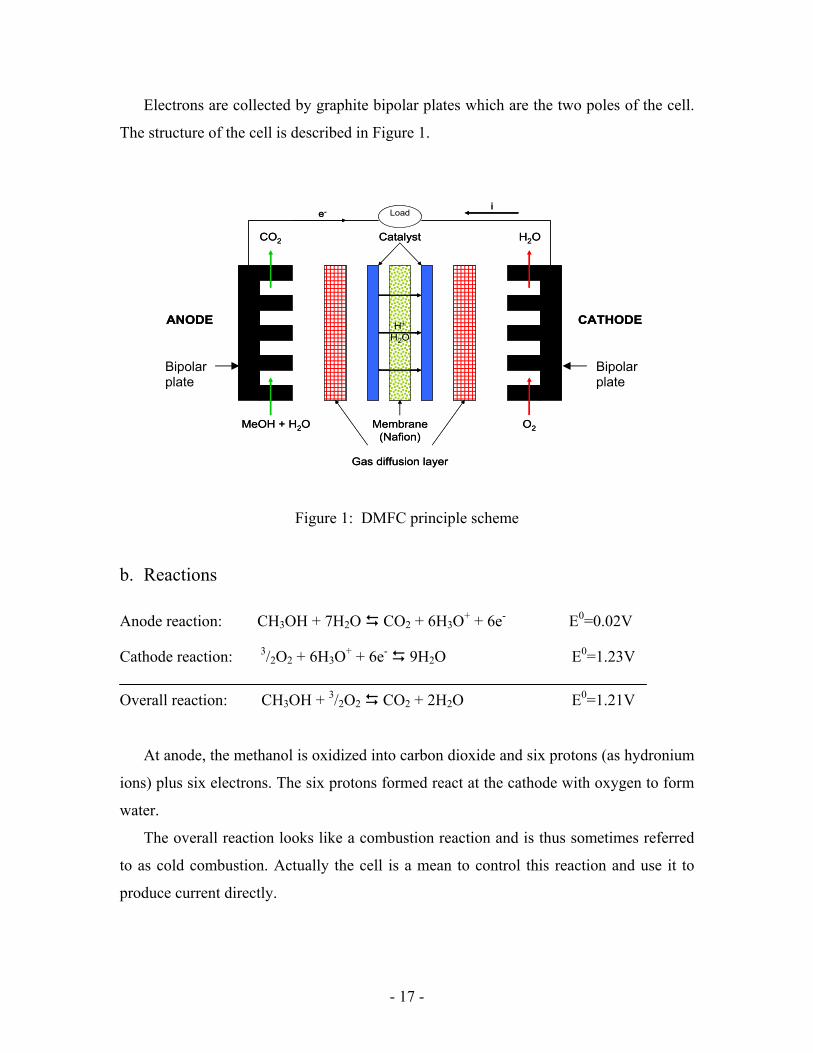
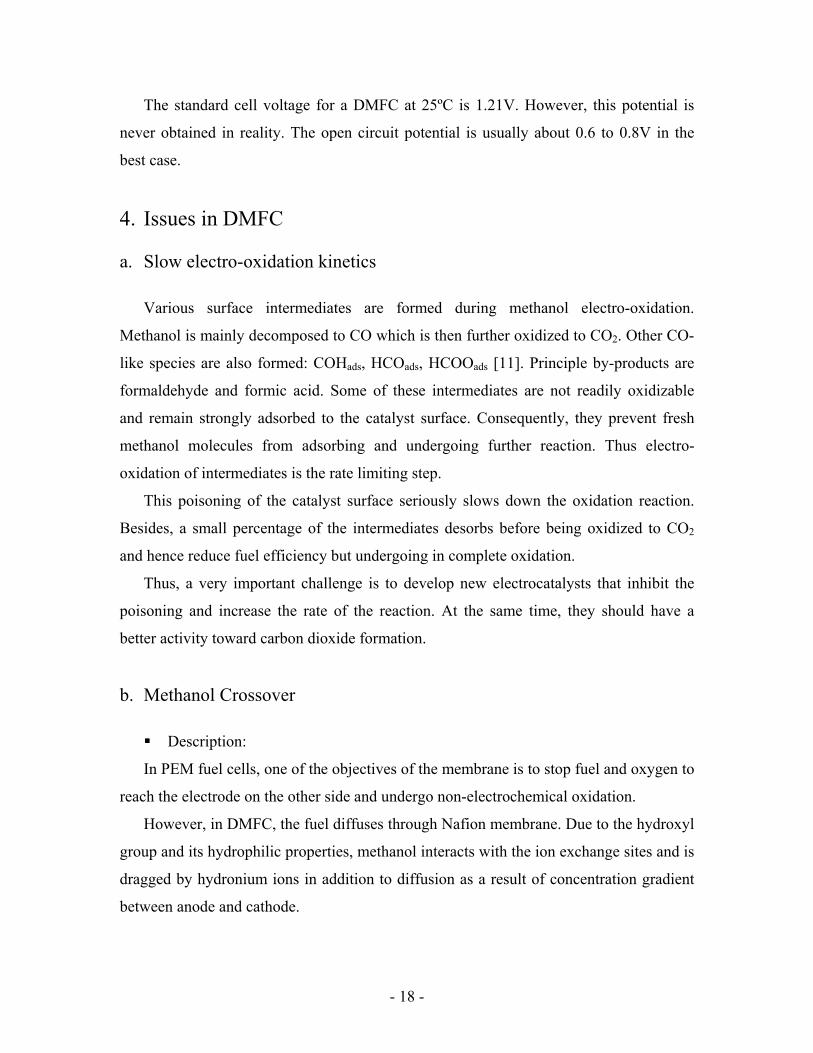
Methanol that crosses over reacts directly with oxygen at the cathode (Figure 2).
Electrons are brought directly from the anode to the cathode along with methanol
resulting in an internal short circuiting and consequently a loss of current (Figure 3).
Besides, the cathode catalyst, which is pure platinum, is fouled by methanol oxidations
intermediates similar to anode.
Figure 2: Methanol crossover phenomenon
Figure 3: Internal short circuit created by crossover
Simple solutions to prevent crossover:
Crossover is enhanced by the concentration and pressure gradient between anode and
cathode. It can be easily limited by using a low methanol concentration in the anode feed
solution and by increasing cathode pressure in a certain measure. A compromise should
be found for the concentration. It should be small enough to reduce crossover as much as
possible but also supply the anode catalytic layer with enough methanol to produce an
acceptable current density.
CH3OHBipolar plate
Anode
Membrane
MeOH solution
MeOH oxidation
Cathode
Phys. Chem. Chem. Phys., 2001, 3, 347-355
- 20 -
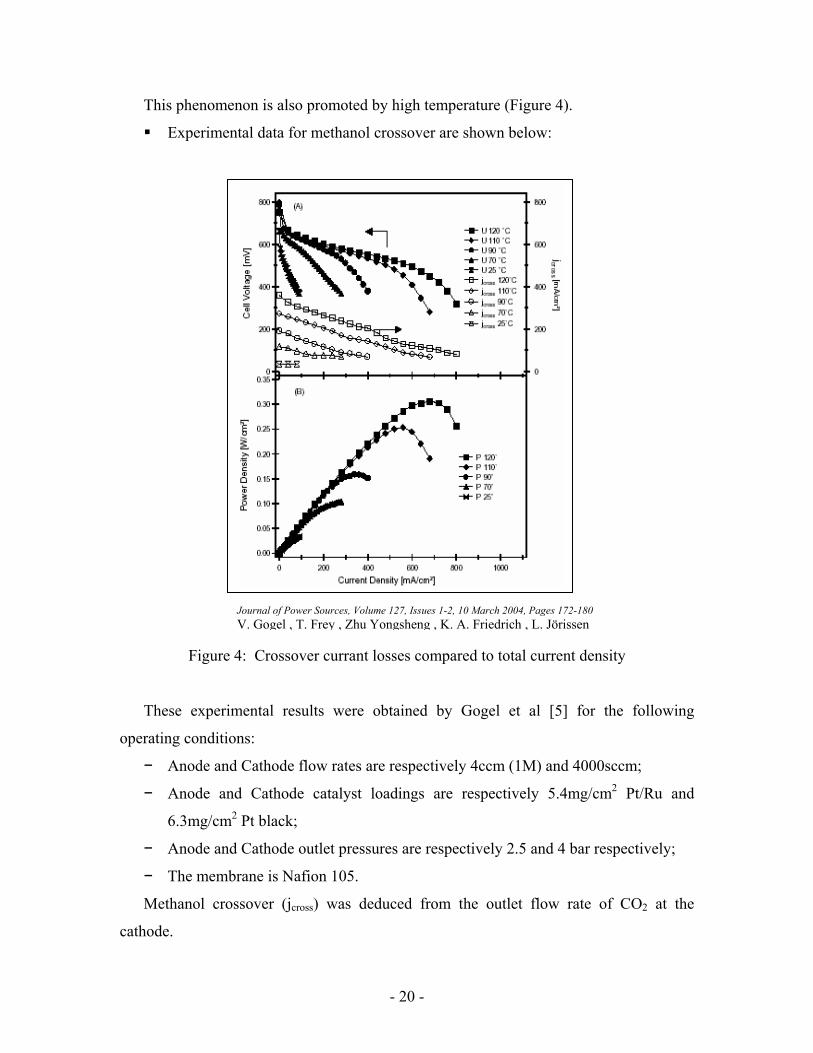
This phenomenon is also promoted by high temperature (Figure 4).
Experimental data for methanol crossover are shown below:
Figure 4: Crossover currant losses compared to total current density
These experimental results were obtained by Gogel et al [5] for the following
operating conditions:
− Anode and Cathode flow rates are respectively 4ccm (1M) and 4000sccm;
− Anode and Cathode catalyst loadings are respectively 5.4mg/cm2 Pt/Ru and
6.3mg/cm2 Pt black;
− Anode and Cathode outlet pressures are respectively 2.5 and 4 bar respectively;
− The membrane is Nafion 105.
Methanol crossover (jcross) was deduced from the outlet flow rate of CO2 at the
cathode.
Journal of Power Sources, Volume 127, Issues 1-2, 10 March 2004, Pages 172-180 V. Gogel , T. Frey , Zhu Yongsheng , K. A. Friedrich , L. Jörissen
- 21 -
The small thickness of the electrode promotes methanol crossover. Besides the cell is
operated under harsh conditions which gives high performance. The data showed here are
not comparable to those which will be presented later on in the experimental part as our
operating conditions are quite different. However, it gives an idea of how crossover
changes with temperature and how an issue it can be.
It can be seen that despite the pressure difference of 1.5 bars between anode and
cathode jcross is substantial. Current losses due to crossover are close to 50% at 120ºC and
close to 10% at ambient temperature.
c. Gas management on anode side
Most of the carbon dioxide formed during methanol oxidation is in the gas phase and
has to be removed via the feed channel.
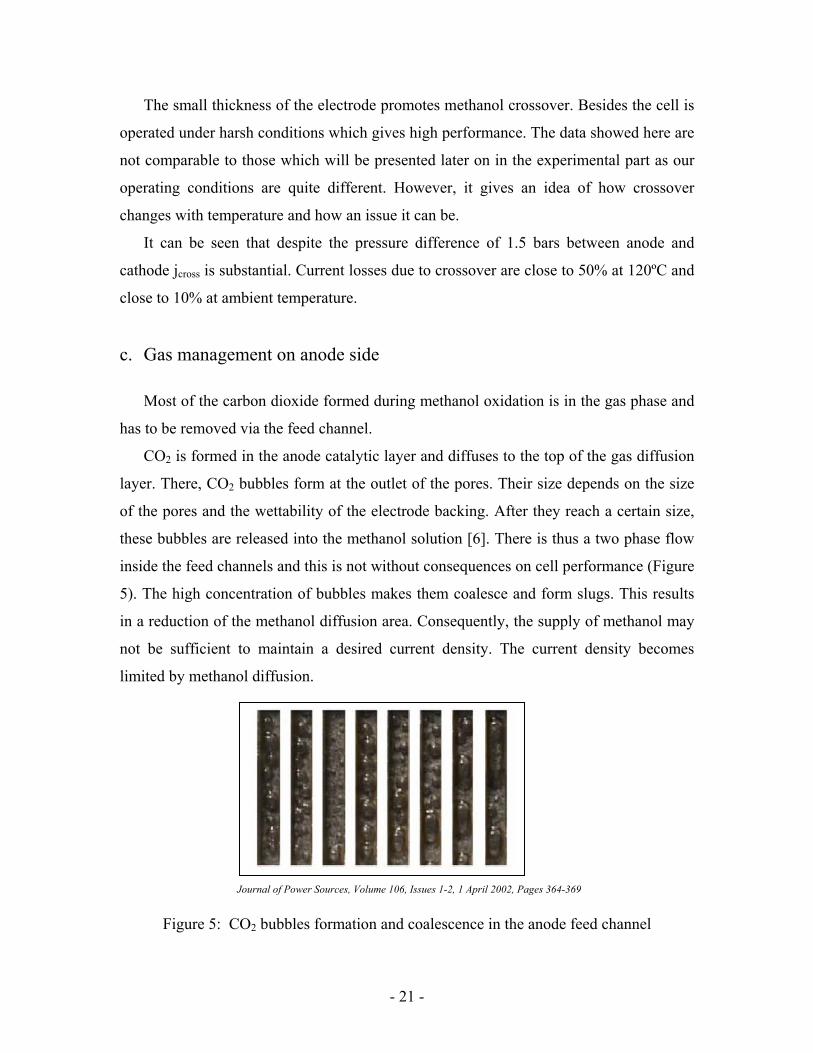
CO2 is formed in the anode catalytic layer and diffuses to the top of the gas diffusion
layer. There, CO2 bubbles form at the outlet of the pores. Their size depends on the size
of the pores and the wettability of the electrode backing. After they reach a certain size,
these bubbles are released into the methanol solution [6]. There is thus a two phase flow
inside the feed channels and this is not without consequences on cell performance (Figure
5). The high concentration of bubbles makes them coalesce and form slugs. This results
in a reduction of the methanol diffusion area. Consequently, the supply of methanol may
not be sufficient to maintain a desired current density. The current density becomes
limited by methanol diffusion.
Figure 5: CO2 bubbles formation and coalescence in the anode feed channel
Journal of Power Sources, Volume 106, Issues 1-2, 1 April 2002, Pages 364-369
- 22 -
This phenomenon is especially an issue at high current densities where a large
amount of carbon dioxide is formed.
Two techniques are considered to take care of this problem. They certainly have to be
developed and used simultaneously. First, the patterns of the feed channels can be
changed to help a quick removal of CO2. Second, Lu and Wang [6] investigated the
structure of the diffusion layer itself and formation of bubbles on the top.
According to them, small and homogeneously spread pores would create small
diameter bubbles rather than slugs. This may generate a bubbly flow rather than a slug
flow.
5. Electrode structure
The gas diffusion layer of an electrode is usually carbon cloth. Carbon paper has also
been used but has shown a higher resistance to methanol diffusion [7]. Besides CO2
bubbles formation management was not as good as with carbon cloth.
a. Catalysts
The catalytic layer is made from a catalytic powder applied to the diffusion layer or
directly on the membrane. Catalyst for anode and cathode are different.
Anode catalyst:
It has been proven that an adsorbed hydroxyl group is needed in rate determining
steps of methanol oxidation [1]. This group comes from water dissociation on the catalyst
surface which occurs only at high electrode potential (0.6V) on Pt. That makes methanol
oxidation difficult on a pure Pt catalyst.
However, water discharging occurs at much lower potential on ruthenium (0.2V).
That is why a bimetallic catalyst containing both platinum and Ruthenium is commonly
used at anode.
The chemisorption process of methanol is significantly favored on Pt sites.
Consequently, the steps concerned by the hydroxyl groups can only occur on adjacent Pt
- 23 -
and Ru sites. This should be taken in count during the catalyst preparation [7]. An
optimized contact area between both catalysts is desired.
Cathode catalyst:
Pure platinum is almost universally used as a cathode catalyst. The catalytic powders
used for DMFC are either metal black or supported catalyst on carbon particles at various
loadings. Both of them are widely used.
b. Catalyst structure
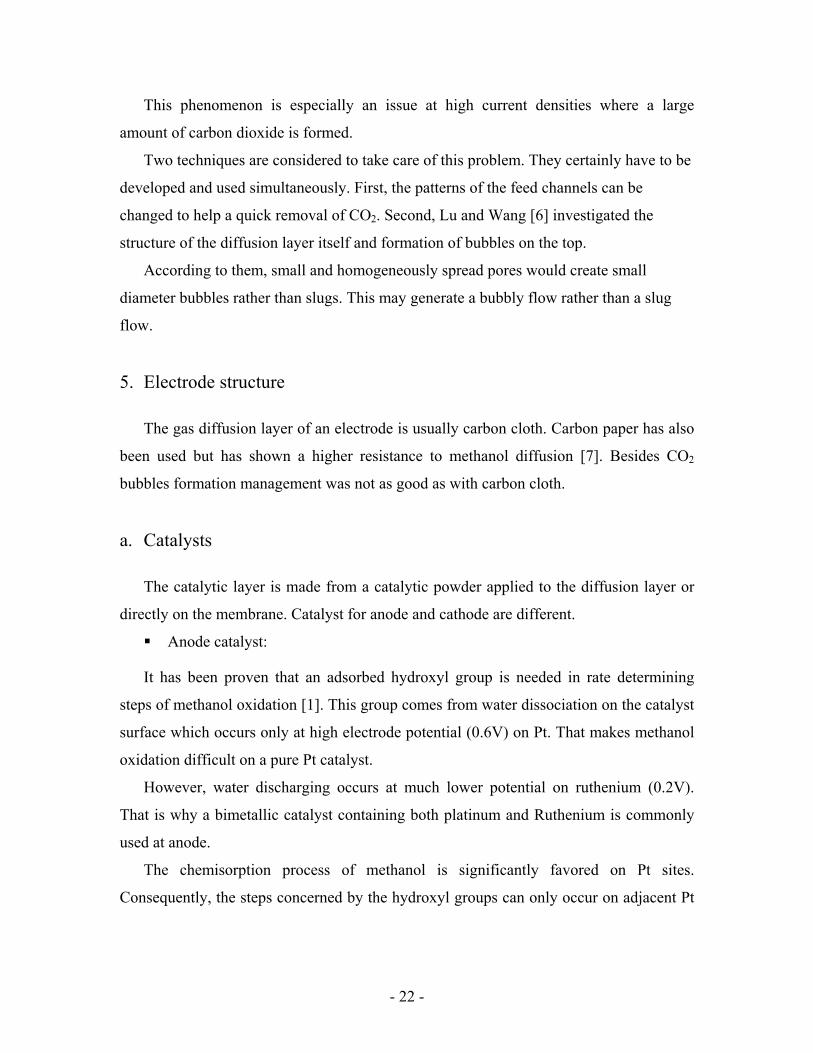
The catalytic layer contains catalyst particles but also Nafion particles [6]. Nafion is
added to the catalyst to help proton removal (Figure 6). A good continuity of the Nafion
network is needed for effective transport of protons to the membrane. This reduces
electric resistance of the catalytic layer. However, a too high Nafion loading would
covers the catalyst particles and reduces the active area.
Figure 6: Catalyst structure
6. Electrodes and MEA preparation
Electrodes are prepared by applying a catalytic ink to an electrode backing used as a
gas diffusion layer.
CH3OH
Carbon particle
H+
e-
Nafion + Water
Pt particle
- 24 -
a. Catalytic ink preparation
There are various techniques for electrodes preparation. However, most of them
involve the use of catalytic ink. This ink contains catalyst particles in suspension in a
mixture of an organic solvent and water.
To increase the catalytic area, a smaller particle size is preferable. That is why
catalyst particles are milled. Three techniques can be utilized [8]:
− Magnetic stirring;
− Mixing in a sonic bath;
− Ball milling.
As discussed previously, the catalytic layer needs to contain a certain amount of
Nafion. Nafion solution is added to reach a desired percentage of the weight of catalyst.
b. Application to the diffusion backing
The most common technique is ink spraying. It can be done directly on the electrode
backing (usually carbon cloth) or on the membrane. A third option consists in applying it
to a Teflon sheet and then transferring it onto the membrane by hot-pressing [9]. In case
of application on the diffusion backing, droplets of ink can also be spread on its surface.
Once electrodes are made, solvent is evaporated in an oven at a temperature between
80 and 120ºC.Other techniques such as dry spraying or screen printing exist. However,
they are still developing techniques.
c. MEA preparation
During cell operation, formed protons need to be transferred as quickly as possible to
the cathode. This implies a good continuity between Nafion contained in the catalytic
layer and the membrane. To achieve that, the electrodes and the membrane are pressed
together high temperature.
The techniques used are either hot-rolling, or more frequently, hot-pressing.
- 25 -
7. The fuel cell station
Bipolar plates:
As discussed above, the Membrane Electrode Assembly is the heart of the fuel cell.
However, it can not be used alone. Bipolar plates are used as current collector as well as a
fuel provider. On their surface a channel network is machined. Methanol is fed to the part
of the electrode in contact with the channel, while electrons are transferred from the
electrode to the bipolar plate where they are in direct contact.
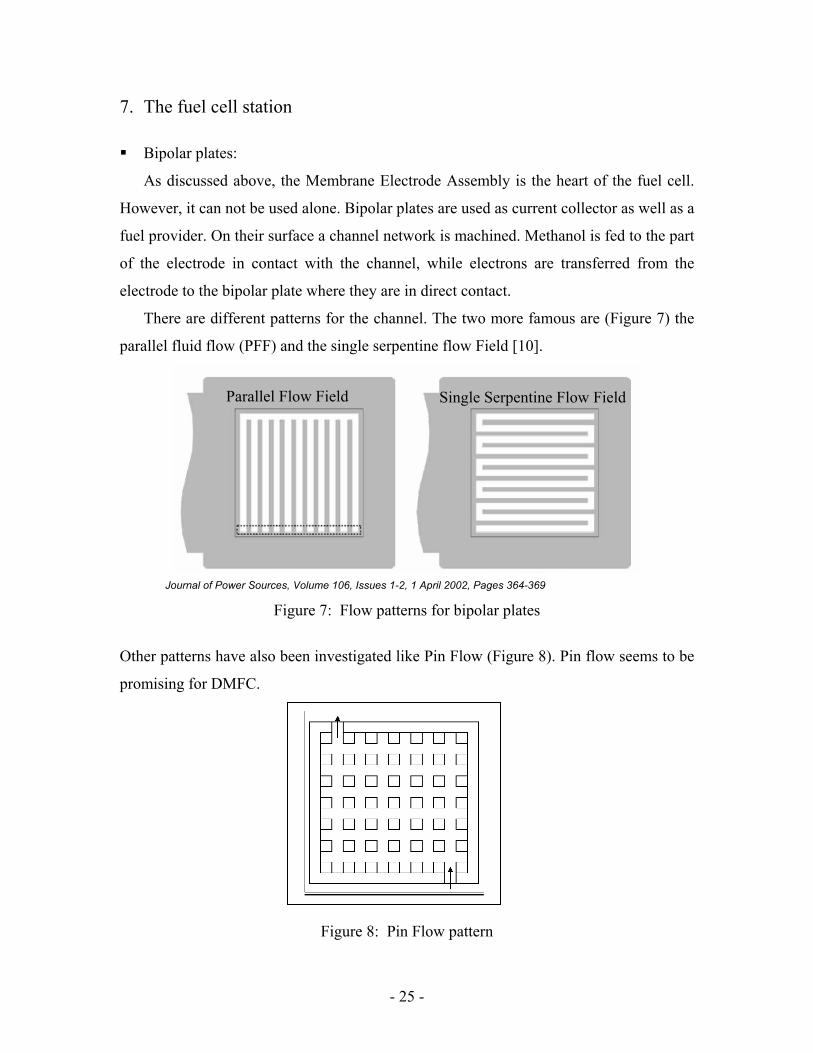
There are different patterns for the channel. The two more famous are (Figure 7) the
parallel fluid flow (PFF) and the single serpentine flow Field [10].
Figure 7: Flow patterns for bipolar plates
Other patterns have also been investigated like Pin Flow (Figure 8). Pin flow seems to be
promising for DMFC.
Figure 8: Pin Flow pattern
Parallel Flow Field Single Serpentine Flow Field
Journal of Power Sources, Volume 106, Issues 1-2, 1 April 2002, Pages 364-369

- 26 -
Complete stack:
Teflon gaskets of appropriate thickness are used on each side of the membrane. They
have to be as thick as the electrodes to prevent leaks but not too thick so as to keep good
electrical contact between the electrodes and the bipolar plates (Figure 9).
Figure 9: Fuel Cell Stack
On the other sides of the bipolar plates rubber gasket are used to insulate them from
enclosures. Those enclosures are bolted to hold everything together.
Journal of Power Sources, Volume 134, Issue 1, 12 July 2004

- 27 -
II. Experimental methods 1. Membrane pretreatment
Nafion membranes 117 from Electrochem were treated by consecutive boiling:
• ½ hour in deionized water to soak them;
• ½ hour in 5 %vol hydrogen peroxide to oxidize impurities;
• ½ hour in deionized water;
• 1 hour in 0.5mol/L sulfuric acid;
• ½ hour in deionized water.
2. Membrane Electrode Assembly (MEA) preparation
The catalytic ink was prepared by mixing the amount of catalyst (from Alfa Aesar)
needed for one electrode with 5mL of deionized water and 5mL of methanol. Then 5%
Nafion solution (1100EW from DUPONT [ρ=2.01g/cm3]) is added. The weight of
Nafion is 10% of the weight of catalyst. The ink was sonicated for 3 hours.
WARNING: Ethanol and isopropanol are the most frequent organic solvent used in
catalytic ink preparation for DMFC. They can react violently with catalysts (especially
Pt and Pt/Ru black) and start a combustion reaction.
To prevent any risk, when the ink is prepared, the catalyst should be first mixed with
water and completely soaked before alcohol addition. Besides the desired amount of
alcohol needs to be poured into a beaker before being added to the ink.
The ink was sprayed on 5cm2 carbon cloth pieces (1.75g/cc, Teflon treated from
Electrochem).
MEAs were prepared by hot-pressing electrodes on each side of the Nafion
membrane for 2 min 30 at 275 F under 2 tons.
This operating mode has initially been developed for hydrogen fuel cells.
- 28 -
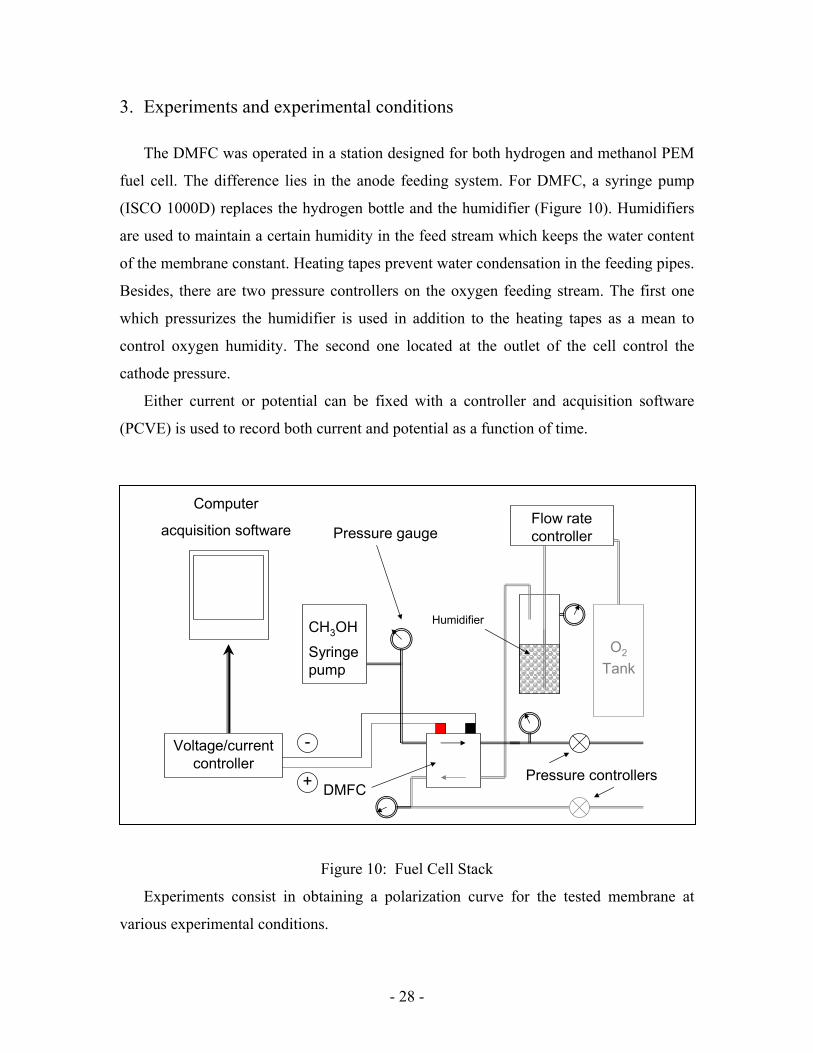
3. Experiments and experimental conditions
The DMFC was operated in a station designed for both hydrogen and methanol PEM
fuel cell. The difference lies in the anode feeding system. For DMFC, a syringe pump
(ISCO 1000D) replaces the hydrogen bottle and the humidifier (Figure 10). Humidifiers
are used to maintain a certain humidity in the feed stream which keeps the water content
of the membrane constant. Heating tapes prevent water condensation in the feeding pipes.
Besides, there are two pressure controllers on the oxygen feeding stream. The first one
which pressurizes the humidifier is used in addition to the heating tapes as a mean to
control oxygen humidity. The second one located at the outlet of the cell control the
cathode pressure.
Either current or potential can be fixed with a controller and acquisition software
(PCVE) is used to record both current and potential as a function of time.
Figure 10: Fuel Cell Stack
Experiments consist in obtaining a polarization curve for the tested membrane at
various experimental conditions.
Humidifier
DMFC
Flow rate controller
O2
Tank
CH3OH
Syringe pump
Pressure controllers
Voltage/current controller
Computer
acquisition software Pressure gauge
+
-

- 29 -
The MEA first needs to be activated. The cell containing the MEA is operated at 80ºC
and under a fixed voltage 0.3V for 6 hours or until the current profile becomes flat.
During experiments, the cell voltage is kept constant while current is measured as a
function of time. Thus the steady state can be visualized for each applied potential. The
cell voltage is switched manually from 0.5V to 0.1V with a step of 0.1V.
Anode and cathode are respectively fed continuously with a solution of methanol in
water via a syringe pump and pure oxygen.
Open circuit potential is also measured by switching from a non-zero current to no
current.
The cell was operated at 60ºC or 80ºC. The anode and cathode flow rate were
respectively 1ccm of 1M methanol solution and 75sccm of pure oxygen. The cathode side
humidifier temperature was kept at ambient temperature.
Anode and cathode were left at atmospheric pressure.
These experimental conditions remained the same in the following experiments
except when specified otherwise.
- 30 -
III. Experimental results
The following experiments were aimed at improving the overall performance of the
DMFC. Various parameters were successively investigated. The three main area of
investigation were: effect of the catalyst, Nafion and Teflon loading in the catalytic layer,
and the effect of nano-composite membranes. Conclusions drawn during the course of
this study were utilized to reorient it, if warranted.
1. Effect of catalyst layer
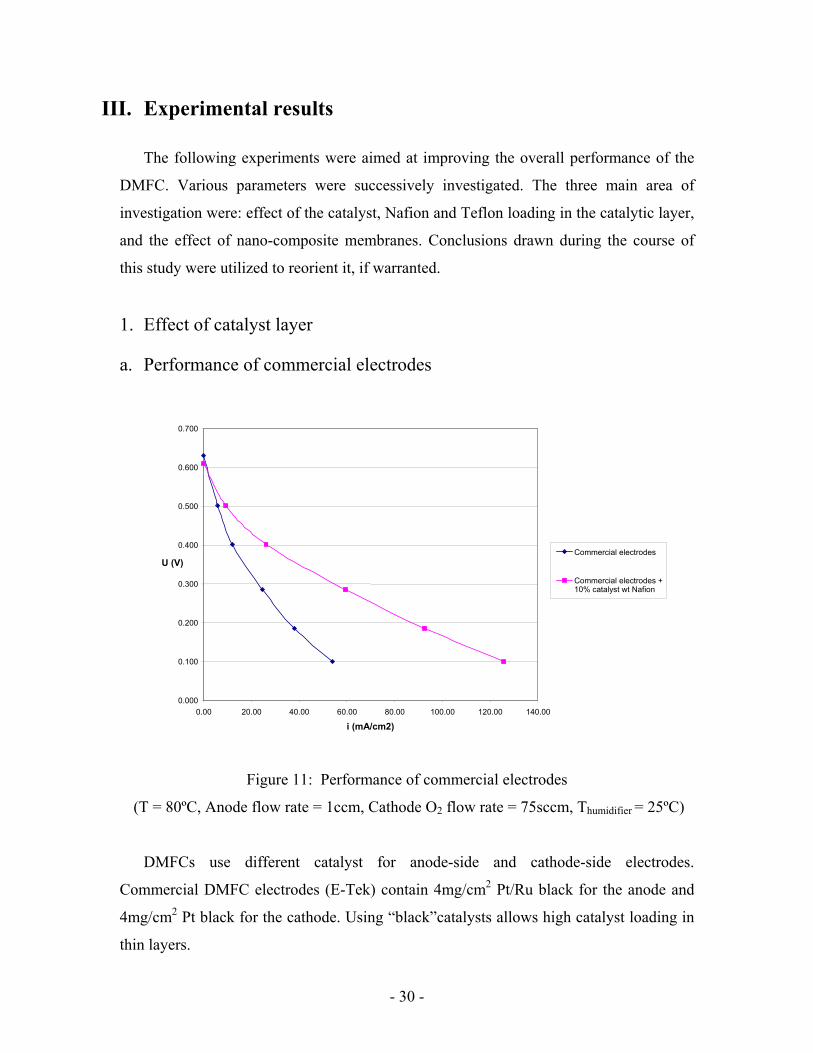
a. Performance of commercial electrodes
Figure 11: Performance of commercial electrodes
(T = 80ºC, Anode flow rate = 1ccm, Cathode O2 flow rate = 75sccm, Thumidifier = 25ºC)
DMFCs use different catalyst for anode-side and cathode-side electrodes.
Commercial DMFC electrodes (E-Tek) contain 4mg/cm2 Pt/Ru black for the anode and
4mg/cm2 Pt black for the cathode. Using “black”catalysts allows high catalyst loading in
thin layers.
0.000
0.100
0.200
0.300
0.400
0.500
0.600
0.700
0.00 20.00 40.00 60.00 80.00 100.00 120.00 140.00
i (mA/cm2)
U (V) Commercial electrodes
Commercial electrodes +10% catalyst wt Nafion
- 31 -
Commercial electrodes performance was quite low (Figure 11) compared to
Sundmacher et al [11] results. They did their experiments at similar conditions and with a
similar MEA. Despite their goal was to compare their model to experiments and not to
get high performance our MEA was far from giving acceptable performance. For
example they obtained current densities of 25 and 110 mA/cm2 at respectively 0.5V and
0.35V whereas we obtained current densities of 10 and 25 mA/cm2 at respectively 0.5V
and 0.35V. Nevertheless, results couldn’t be compared at lower cell voltage because they
used different methanol concentration.
Fuel cell electrodes contain Nafion to help proton conduction. A way to improve their
performance could be to spray a Nafion solution on them. A solution was thus prepared
by mixing 0.25ml of 5% in weight (wt%) Nafion solution with 10ml of ethanol. It
corresponds to 10% of the weight of catalyst considering 20% of losses during spraying.
After treatment with this solution performance increase (Figure 11) but was still half
of what was desired.
b. Home-made electrodes
With the goal of improving DMFC performance we began by trying to optimize the
MEA preparation [12]. Membranes remained the same (commercial Nafion117 from
Electrochem) but electrodes were prepared in the lab using Pt/Ru and Pt black with an
atomic ratio of 1. The Pt/Ru black catalyst will remain the same in this study.
For both electrodes the catalytic ink was prepared by mixing 24mg of catalyst with
20ml of water and 20ml of ethanol and sonicated for 24h in order to ground and disperse
the catalyst particle agglomerates. 0.25ml of 5wt% Nafion solution was added 1h before
utilization. Then this ink was sprayed on a 5cm2 piece of Teflon treated carbon cloth and
the electrode dried for 1h at 80º C.
20% losses were considered during the preparation including spraying. To deposit
roughly of 4mg/cm2 of catalyst, 24mg were used instead of 20mg.
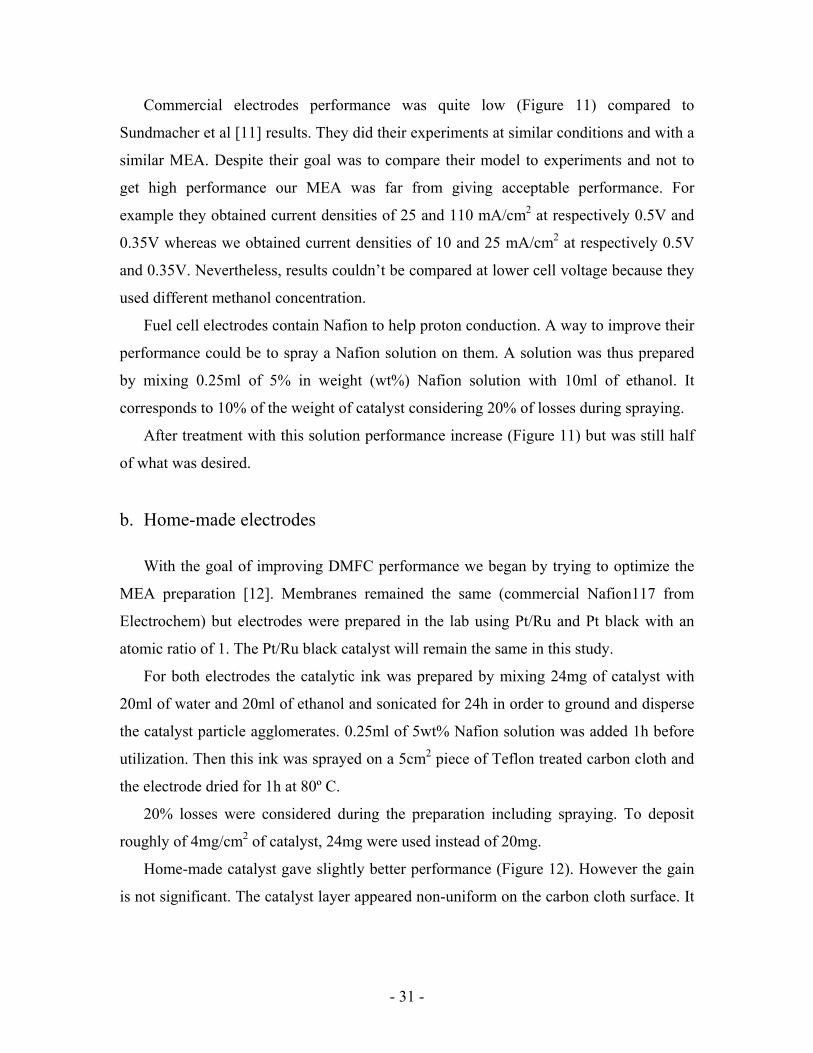
Home-made catalyst gave slightly better performance (Figure 12). However the gain
is not significant. The catalyst layer appeared non-uniform on the carbon cloth surface. It
- 32 -
appeared that the catalytic ink has penetrated too far into the carbon cloth instead of
forming a layer on its surface.
To address this problem, a more concentrated and thus viscous ink was prepared. The
amount of solvent was reduced to 10ml for both water and ethanol. A nice layer was thus
formed on the carbon cloth surface and performance appeared to be better (Figure 12).
0.000
0.100
0.200
0.300
0.400
0.500
0.600
0.700
0.00 50.00 100.00 150.00 200.00 250.00
i (mA/cm2)
U (V
)
ink composition : 20mlwater + 20ml ethanol
ink composition : 10mlwater + 10ml ethanol
Figure 12: Performance of hand-made electrodes
(T = 80ºC, Anode flow rate = 1ccm, Cathode O2 flow rate = 75sccm, Thumidifier = 25ºC)
The new polarization curve shows nonetheless a sharp drop in performance at low
potential. Actually at these cell voltages irregular current oscillations (figure 13) occur
and an average value of current was thus plotted. These oscillations were found to
disappear when the anode feed flow rate was increased to 5ccm (figure 14).
Origin of oscillations:
As oscillations seemed to be linked to the flow rate, it was assumed that mass
transport was involved in this phenomena, rather than being due to surface chemistry.
- 33 -
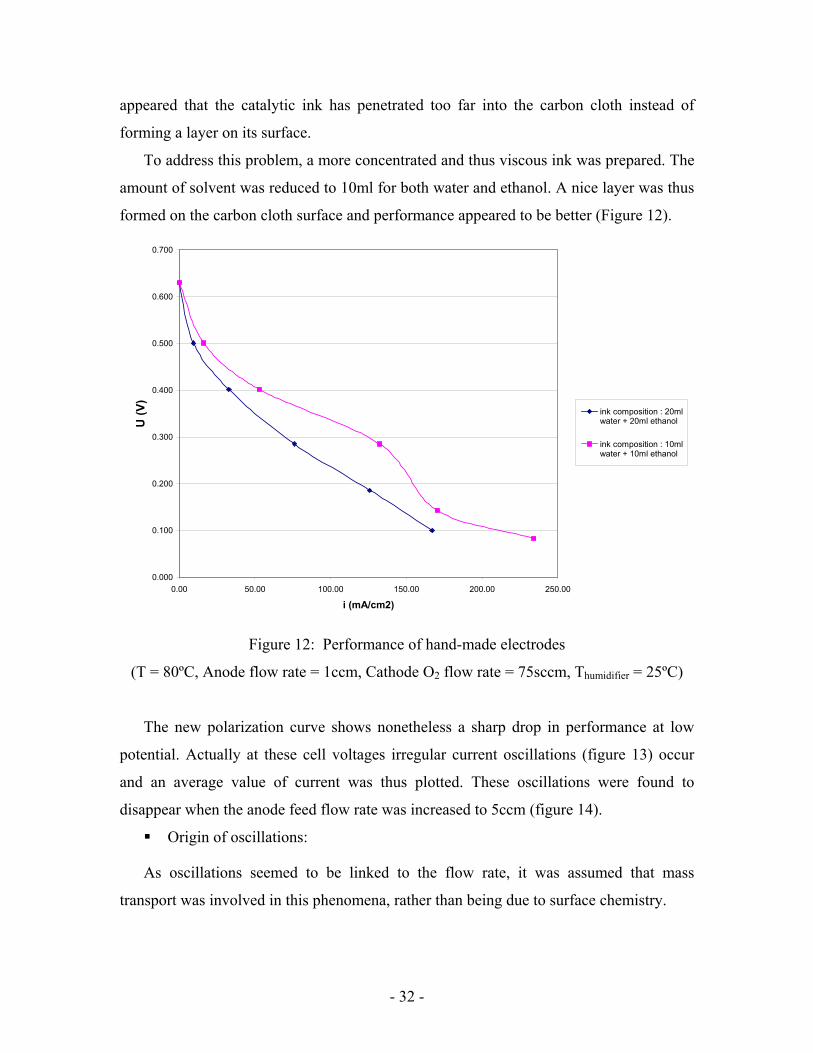
At low cell voltages and high current densities, a lot of gaseous carbon dioxide is
synthesized. It, thus, occupies a much larger volume than the methanol solution in the
feed channel [13]. Consequently, if too much carbon dioxide is produced, the solution is
no longer in contact with the diffusion backing and is not effectively supplied to the
catalytic layer thus resulting in a drop of current. In other words, the current is limited by
mass transport.
Figure 13: Current oscillations at fixed potential and anode feed flow rate of 1ccm
(T = 80ºC, Anode catalyst: 4mg/cm2 Pt/Ru black, Cathode catalyst: 4mg/cm2 black,
Cathode O2 flow rate = 75sccm, Thumidifier = 25ºC)
According to this hypothesis, the erratic oscillations are related to limited anode
catalytic layer methanol concentration. When the cell voltage is switched to a value
around 0.3V or less, methanol supply to catalyst layer becomes limited and its
concentration in the catalytic layer declines. Crossover declines at the same time. Thus,
less CO2 is formed due to low current. Then it is removed from the feed channel and
methanol again reaches the catalytic layer and the cell can again produce a high current.
As the current starts to rise and more CO2 is produced, fresh methanol is again unable to
reach the cathode.
0
0.5
1
1.5
2
2.5
3
0 0.2 0.4 0.6 0.8 1 1.2
Time (h)
Cell voltage (V) Current (A)
- 34 -
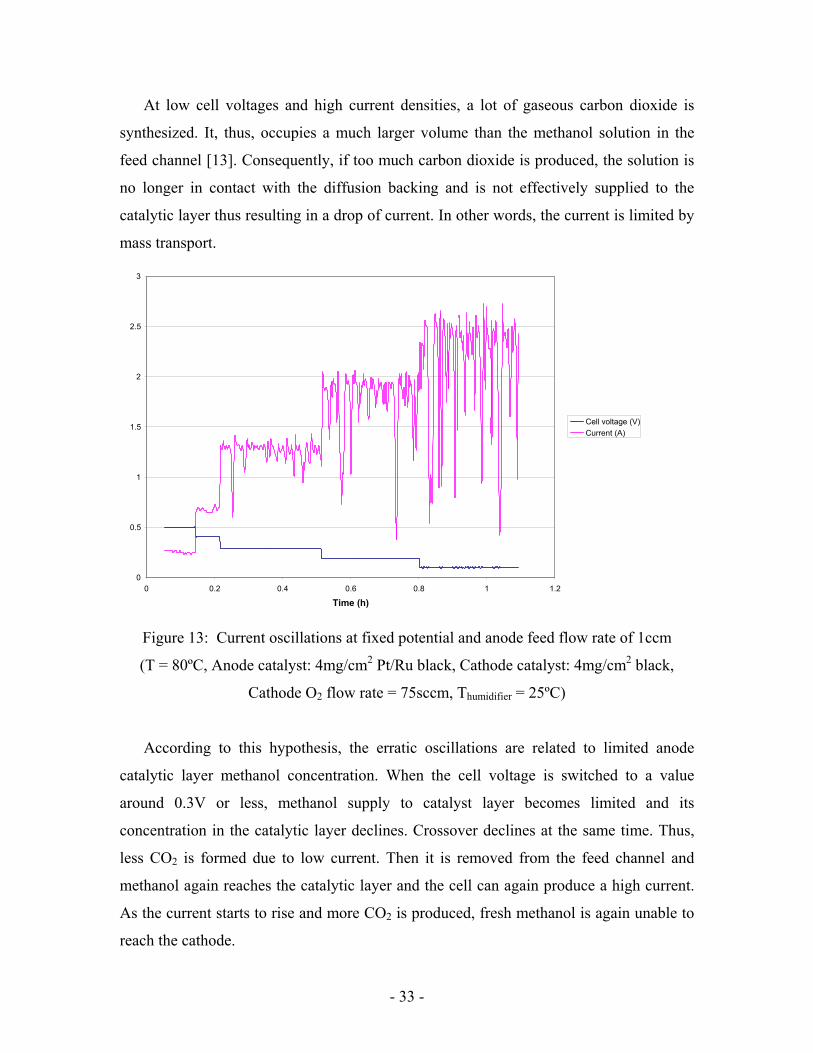
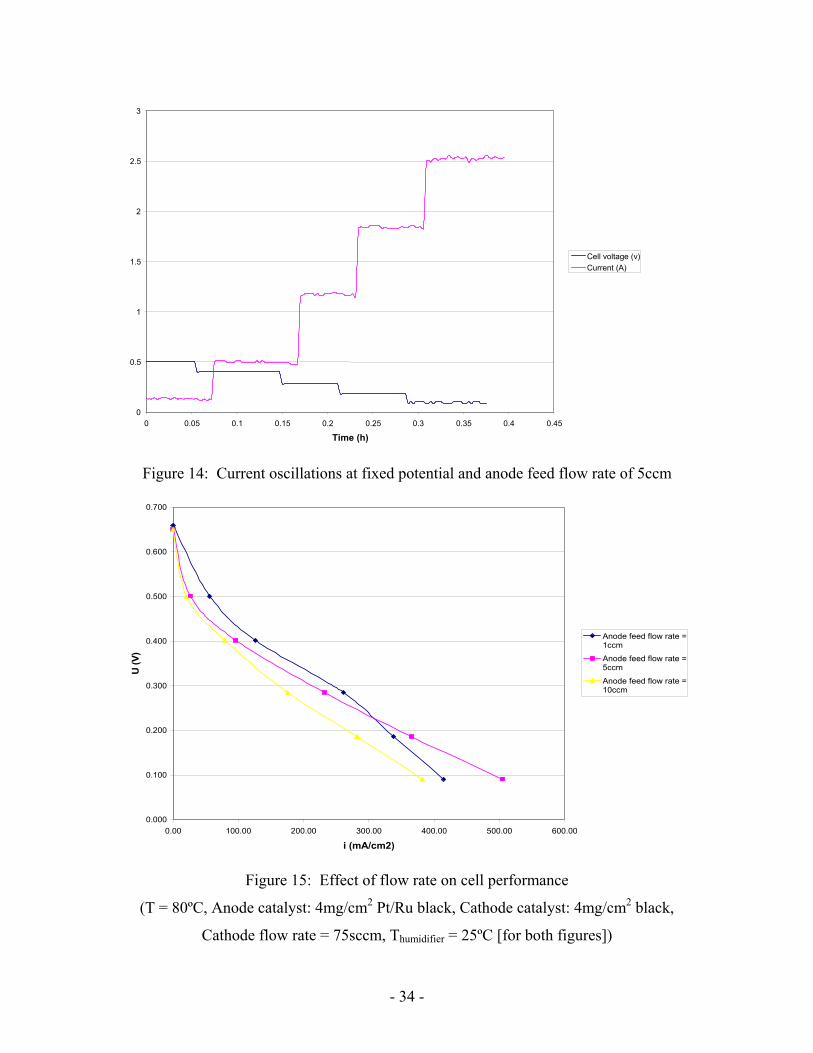
Figure 14: Current oscillations at fixed potential and anode feed flow rate of 5ccm
0.000
0.100
0.200
0.300
0.400
0.500
0.600
0.700
0.00 100.00 200.00 300.00 400.00 500.00 600.00
i (mA/cm2)
U (V
)
Anode feed flow rate =1ccm
Anode feed flow rate =5ccm
Anode feed flow rate =10ccm
Figure 15: Effect of flow rate on cell performance
(T = 80ºC, Anode catalyst: 4mg/cm2 Pt/Ru black, Cathode catalyst: 4mg/cm2 black,
Cathode flow rate = 75sccm, Thumidifier = 25ºC [for both figures])
0
0.5
1
1.5
2
2.5
3
0 0.05 0.1 0.15 0.2 0.25 0.3 0.35 0.4 0.45
Time (h)
Cell voltage (v) Current (A)
- 35 -
If the anode feed flow rate is increased, CO2 is removed more rapidly. There is no
longer competition between carbon dioxide removal and methanol supply. That is why
oscillations disappear at higher flow rates (Figure 14).
However there is a penalty for higher flow rates. It can be seen that at higher cell
voltage that performance is lower for a 5ccm flow rate (Figure 15). Methanol transfer
increases with the flow rate it increases methanol crossover as well. In this range of
potential it increases methanol crossover and decreases slightly performance by inhibiting
the performance of the cathode. It also explains why flow rate can not be increased too
much. As seen in Figure 15, 10ccm flow rate gives even lower performances.
c. Catalyst supported on carbon
0.000
0.100
0.200
0.300
0.400
0.500
0.600
0.700
0.00 50.00 100.00 150.00 200.00 250.00 300.00 350.00
i (mA/cm2)
U (V
)
Anode : Pt/Ru black / Cathode : Ptblack
Anode : Pt/Ru on C (40wt%) /Cathode : Pt black
Anode : Pt/Ru on C (40wt%) /Cathode : Pt on C (20wt%)
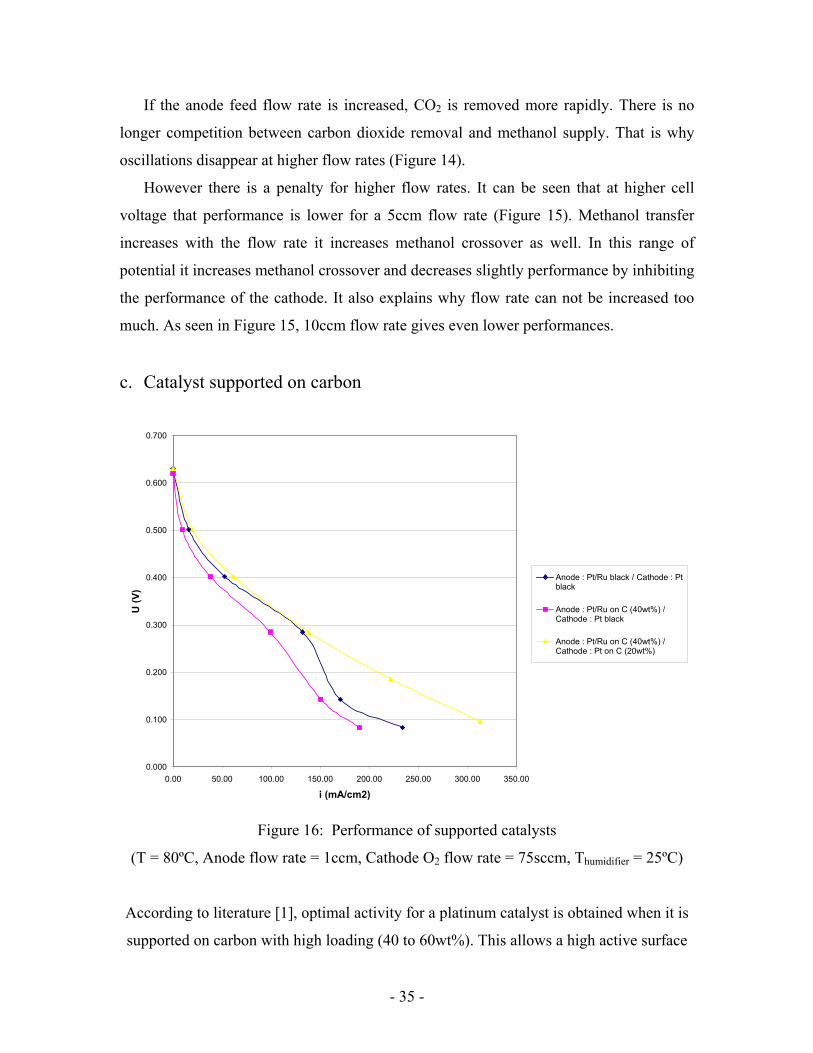
Figure 16: Performance of supported catalysts
(T = 80ºC, Anode flow rate = 1ccm, Cathode O2 flow rate = 75sccm, Thumidifier = 25ºC)
According to literature [1], optimal activity for a platinum catalyst is obtained when it is
supported on carbon with high loading (40 to 60wt%). This allows a high active surface
- 36 -
as well as a high catalyst loading, although the catalyst layer thickness increases.
This idea was applied to both the anode and cathode catalyst layer. Pt/Ru black was
replaced by 60mg of 40wt% Pt/Ru supported on carbon (equivalent to 24mg of Pt/Ru
black [atomic ratio equal to 1]) at the anode and Pt black by 120mg of 20wt% Pt/C
(equivalent to 24mg of Pt/Ru black) at the cathode so that the catalyst loading remained
4mg/cm2. The Nafion loading, in this case, is expressed as a percentage of the overall
weight of carbon powder plus catalyst. It remained 10wt%.
Better performance were obtained with Pt/Ru black than with supported Pt/Ru on
carbon (Figure 16). However interesting changes concerned supported platinum on
carbon at the cathode at low cell voltages.
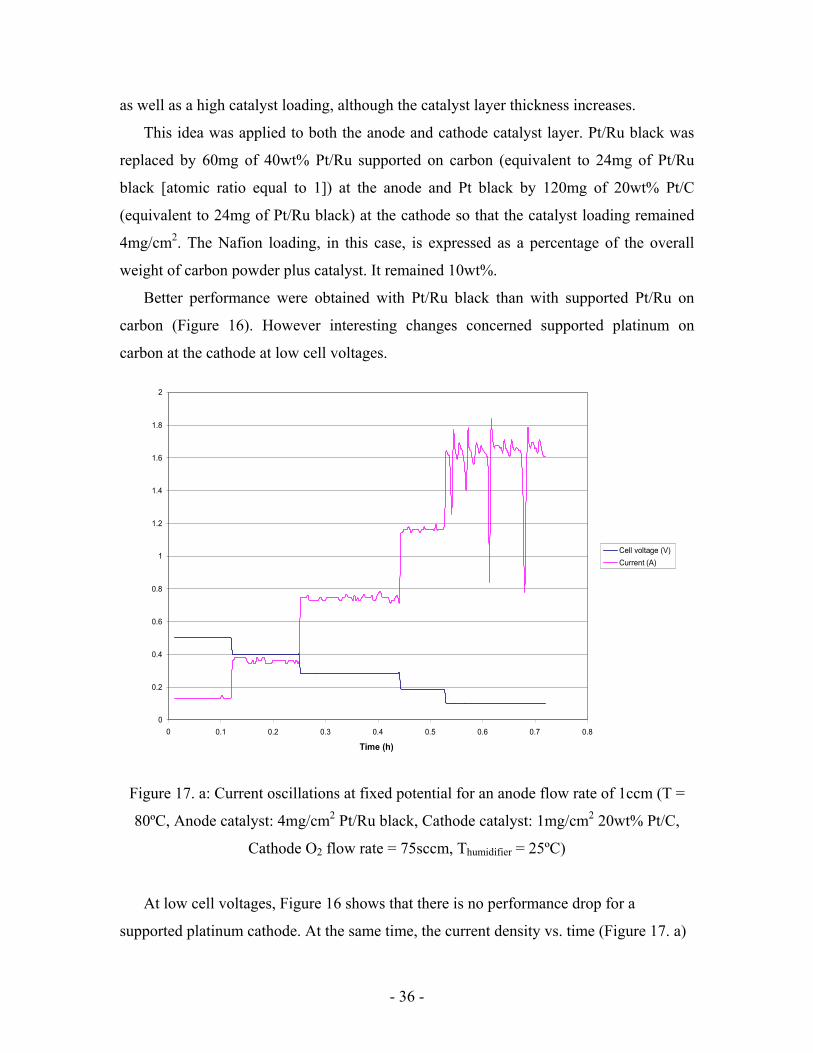
Figure 17. a: Current oscillations at fixed potential for an anode flow rate of 1ccm (T =
80ºC, Anode catalyst: 4mg/cm2 Pt/Ru black, Cathode catalyst: 1mg/cm2 20wt% Pt/C,
Cathode O2 flow rate = 75sccm, Thumidifier = 25ºC)
At low cell voltages, Figure 16 shows that there is no performance drop for a
supported platinum cathode. At the same time, the current density vs. time (Figure 17. a)
0
0.2
0.4
0.6
0.8
1
1.2
1.4
1.6
1.8
2
0 0.1 0.2 0.3 0.4 0.5 0.6 0.7 0.8 Time (h)
Cell voltage (V)Current (A)
- 37 -
plot shows that the amplitude of the erratic oscillations was reduced compared to a
platinum black cathode.
0
0.2
0.4
0.6
0.8
1
1.2
1.4
1.6
1.8
0 0.1 0.2 0.3 0.4 0.5 0.6 0.7
Time (h)
Cell voltage (V)Current (A)
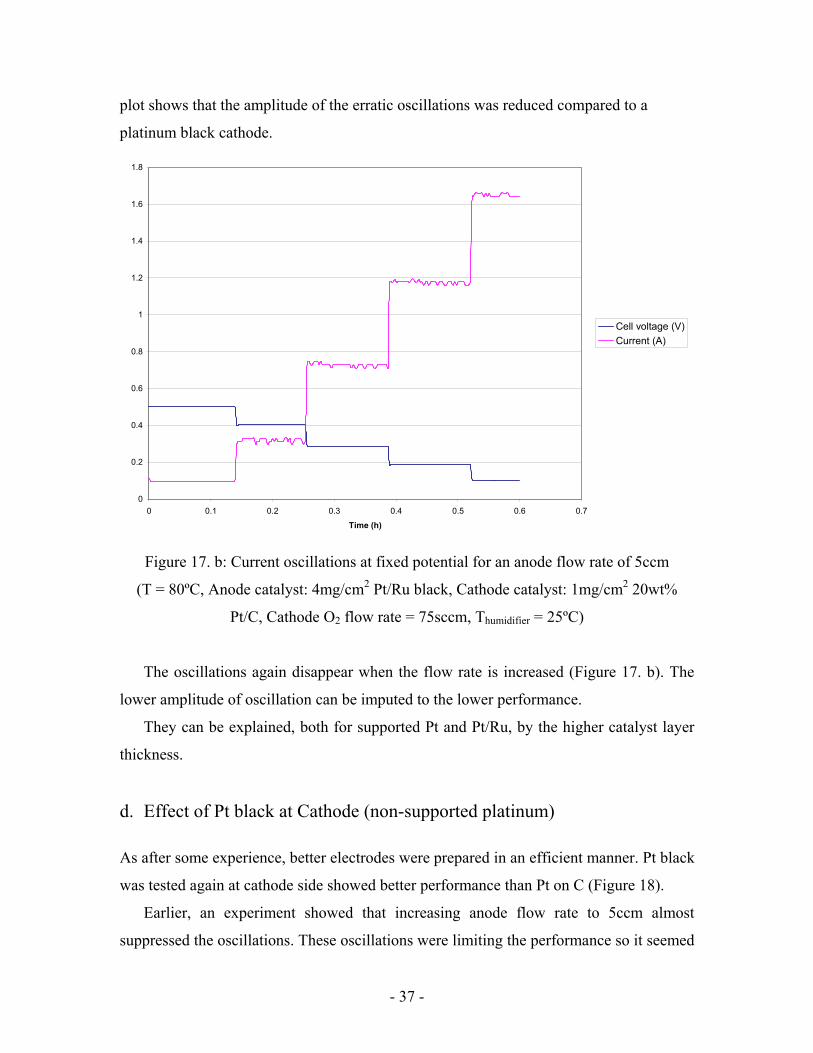
Figure 17. b: Current oscillations at fixed potential for an anode flow rate of 5ccm
(T = 80ºC, Anode catalyst: 4mg/cm2 Pt/Ru black, Cathode catalyst: 1mg/cm2 20wt%
Pt/C, Cathode O2 flow rate = 75sccm, Thumidifier = 25ºC)
The oscillations again disappear when the flow rate is increased (Figure 17. b). The
lower amplitude of oscillation can be imputed to the lower performance.
They can be explained, both for supported Pt and Pt/Ru, by the higher catalyst layer
thickness.
d. Effect of Pt black at Cathode (non-supported platinum)
As after some experience, better electrodes were prepared in an efficient manner. Pt black
was tested again at cathode side showed better performance than Pt on C (Figure 18).
Earlier, an experiment showed that increasing anode flow rate to 5ccm almost
suppressed the oscillations. These oscillations were limiting the performance so it seemed
- 38 -
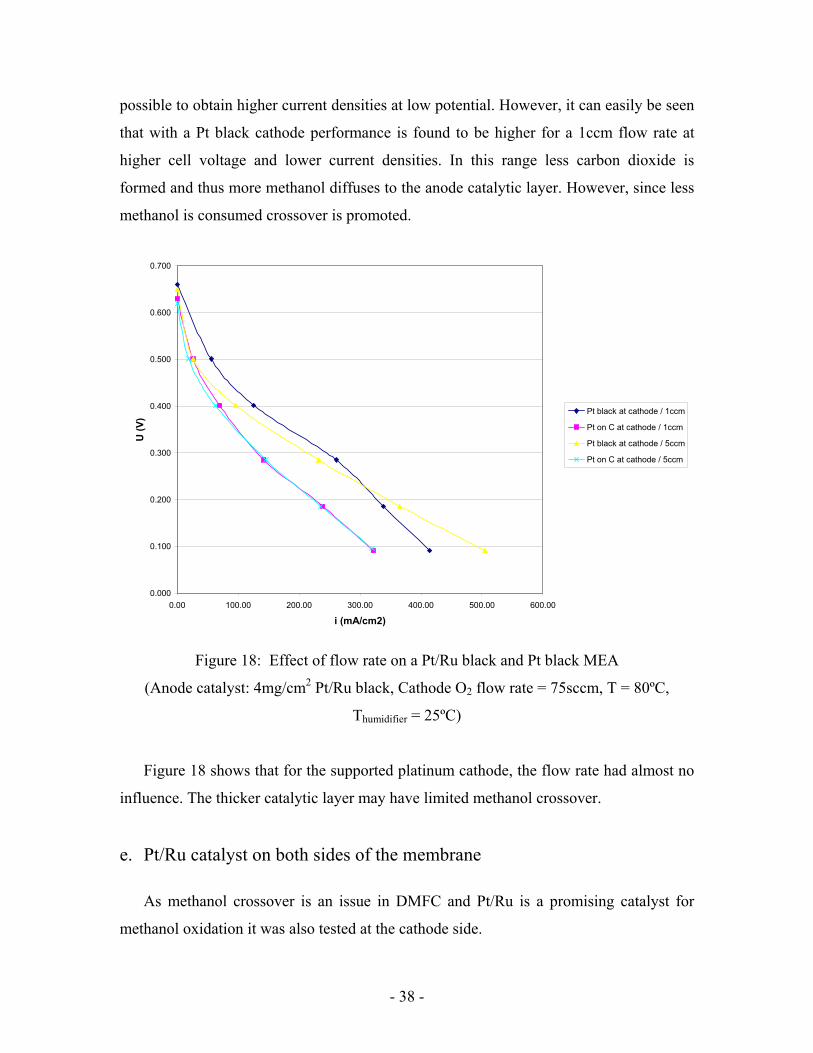
possible to obtain higher current densities at low potential. However, it can easily be seen
that with a Pt black cathode performance is found to be higher for a 1ccm flow rate at
higher cell voltage and lower current densities. In this range less carbon dioxide is
formed and thus more methanol diffuses to the anode catalytic layer. However, since less
methanol is consumed crossover is promoted.
0.000
0.100
0.200
0.300
0.400
0.500
0.600
0.700
0.00 100.00 200.00 300.00 400.00 500.00 600.00
i (mA/cm2)
U (V
)
Pt black at cathode / 1ccm
Pt on C at cathode / 1ccm
Pt black at cathode / 5ccm
Pt on C at cathode / 5ccm
Figure 18: Effect of flow rate on a Pt/Ru black and Pt black MEA
(Anode catalyst: 4mg/cm2 Pt/Ru black, Cathode O2 flow rate = 75sccm, T = 80ºC,
Thumidifier = 25ºC)
Figure 18 shows that for the supported platinum cathode, the flow rate had almost no
influence. The thicker catalytic layer may have limited methanol crossover.
e. Pt/Ru catalyst on both sides of the membrane
As methanol crossover is an issue in DMFC and Pt/Ru is a promising catalyst for
methanol oxidation it was also tested at the cathode side.
- 39 -
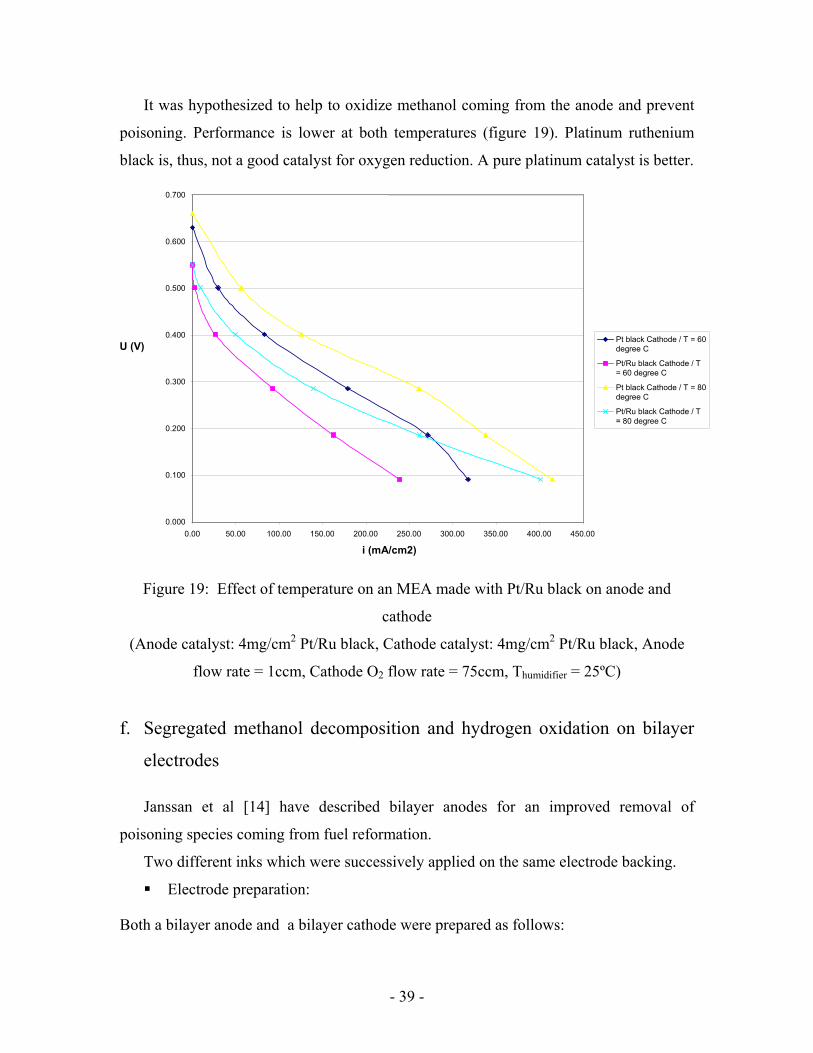
It was hypothesized to help to oxidize methanol coming from the anode and prevent
poisoning. Performance is lower at both temperatures (figure 19). Platinum ruthenium
black is, thus, not a good catalyst for oxygen reduction. A pure platinum catalyst is better.
Figure 19: Effect of temperature on an MEA made with Pt/Ru black on anode and
cathode
(Anode catalyst: 4mg/cm2 Pt/Ru black, Cathode catalyst: 4mg/cm2 Pt/Ru black, Anode
flow rate = 1ccm, Cathode O2 flow rate = 75ccm, Thumidifier = 25ºC)
f. Segregated methanol decomposition and hydrogen oxidation on bilayer
electrodes
Janssan et al [14] have described bilayer anodes for an improved removal of
poisoning species coming from fuel reformation.
Two different inks which were successively applied on the same electrode backing.
Electrode preparation:
Both a bilayer anode and a bilayer cathode were prepared as follows:
0.000
0.100
0.200
0.300
0.400
0.500
0.600
0.700
0.00 50.00 100.00 150.00 200.00 250.00 300.00 350.00 400.00 450.00
i (mA/cm2)
U (V) Pt black Cathode / T = 60degree C
Pt/Ru black Cathode / T= 60 degree C
Pt black Cathode / T = 80degree C
Pt/Ru black Cathode / T= 80 degree C
- 40 -
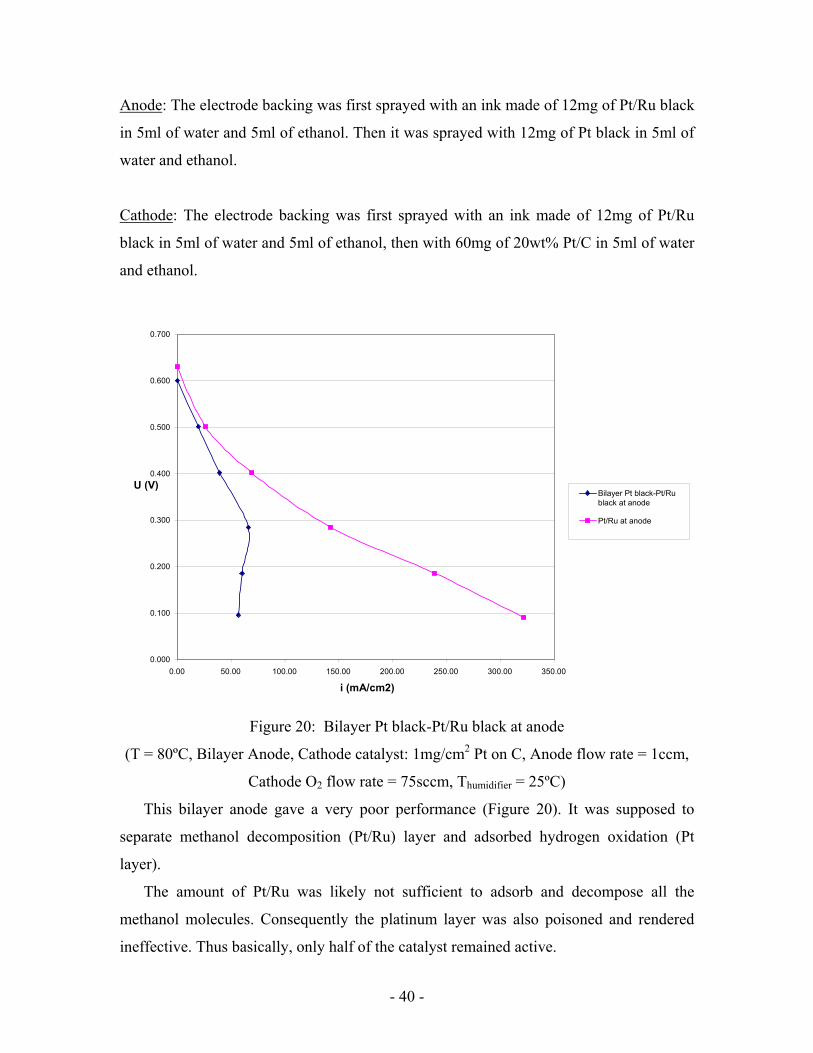
Anode: The electrode backing was first sprayed with an ink made of 12mg of Pt/Ru black
in 5ml of water and 5ml of ethanol. Then it was sprayed with 12mg of Pt black in 5ml of
water and ethanol.
Cathode: The electrode backing was first sprayed with an ink made of 12mg of Pt/Ru
black in 5ml of water and 5ml of ethanol, then with 60mg of 20wt% Pt/C in 5ml of water
and ethanol.
Figure 20: Bilayer Pt black-Pt/Ru black at anode
(T = 80ºC, Bilayer Anode, Cathode catalyst: 1mg/cm2 Pt on C, Anode flow rate = 1ccm,
Cathode O2 flow rate = 75sccm, Thumidifier = 25ºC)
This bilayer anode gave a very poor performance (Figure 20). It was supposed to
separate methanol decomposition (Pt/Ru) layer and adsorbed hydrogen oxidation (Pt
layer).
The amount of Pt/Ru was likely not sufficient to adsorb and decompose all the
methanol molecules. Consequently the platinum layer was also poisoned and rendered
ineffective. Thus basically, only half of the catalyst remained active.
0.000
0.100
0.200
0.300
0.400
0.500
0.600
0.700
0.00 50.00 100.00 150.00 200.00 250.00 300.00 350.00
i (mA/cm2)
U (V) Bilayer Pt black-Pt/Rublack at anode Pt/Ru at anode

- 41 -
0.000
0.100
0.200
0.300
0.400
0.500
0.600
0.700
0.00 50.00 100.00 150.00 200.00 250.00 300.00 350.00
i (mA/cm2)
U (V
)
Bilayer Pt/Ru black-Pt onC at cathode
Pt on C at cathode
Figure 21: Bilayer Pt/Ru black-Pt on C at anode
(T = 80ºC, Anode catalyst: 4mg/cm2 Pt/Ru black, Cathode Bilayer, Anode flow rate =
1ccm, Cathode O2 flow rate = 75sccm, Thumidifier = 25ºC)
Performance was found to be lower for the bilayer cathode (Figure 21). It may be due
to a reduced amount of Pt catalyst. However, one must be careful when adding more
supported platinum. More catalyst results in a thicker catalytic layer and lowers protons
mass transfer.
2. Effects of temperature, humidification and flow rate on Pt/Ru black and
Pt/C Membrane Electrode Assembly
After some experience, good reproducibility was obtained in the preparation of
MEAs. Electrodes using Pt supported on C were used at the cathode as they helped to
prevent oscillations.

- 42 -
Their behavior was investigated while varying such parameters as temperature, anode
feed flow rate (Figure 22) and cathode humidification (Figure 23) were changed.
As expected, temperature increases performance. The increase in flow rate has the
same effect at 60ºC. However when temperature is increased the effect of flow Rate
becomes smaller. Actually at 80ºC there is no effect of flow rate.
0.000
0.100
0.200
0.300
0.400
0.500
0.600
0.700
0.00 50.00 100.00 150.00 200.00 250.00 300.00 350.00
i (mA/cm2)
U (V
)
T=60 degree C F=1ccm
T=60 degree C F=5ccm
T=80 degree C F=1ccm
T=80 degree C F=5ccm
Figure 22: Effect of temperature and flow rate
(Anode catalyst: 4mg/cm2 Pt/Ru black, Cathode catalyst: 1mg/cm2 20wt% Pt/C, Cathode
O2 flow rate = 75ccm, Thumidifier = 25ºC)
At 60ºC, an improvement in methanol transfer due to flow rate shows an
improvement in performance. However, when temperature is increased, methanol
crossover is also increased [15]. At 80ºC, the beneficial effect of a higher flow rate is,
thus, annihilated by a higher crossover, resulting in no overall improvement.
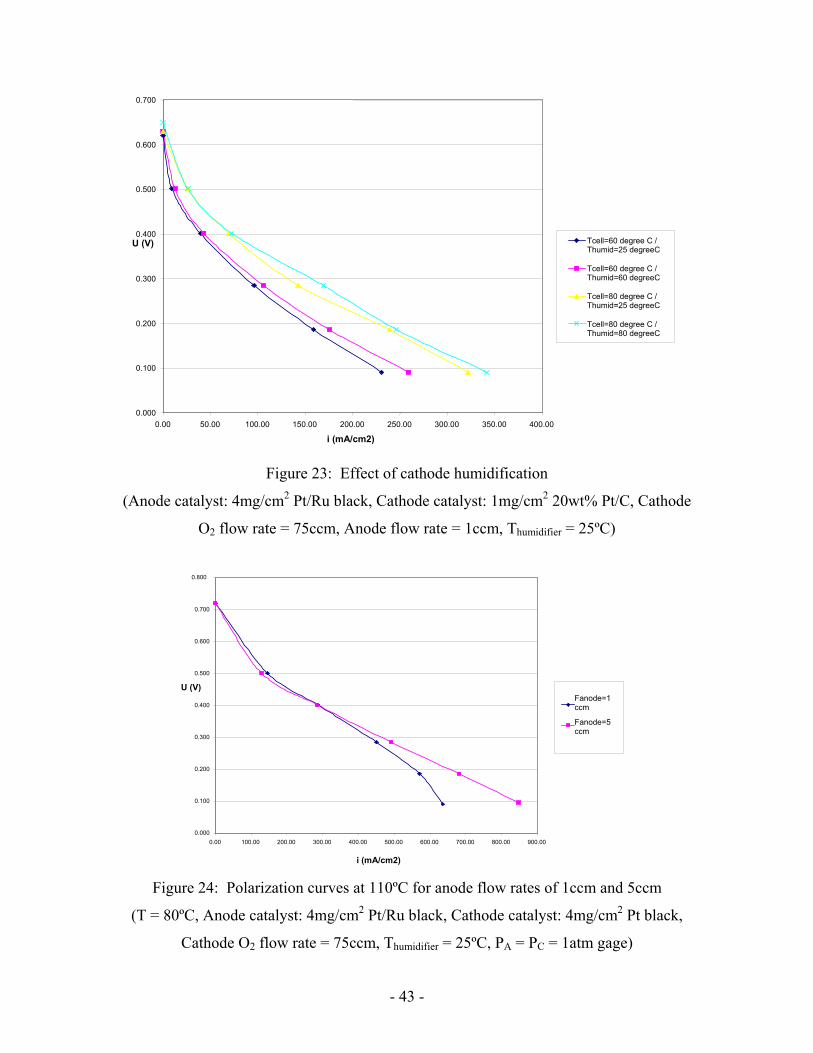
Humidification was found to have little effect (Figure 23). It is due to water flooding
from anode side to cathode side. It seems that humidification is not an issue in DMFC
with a liquid feed.
- 43 -
Figure 23: Effect of cathode humidification
(Anode catalyst: 4mg/cm2 Pt/Ru black, Cathode catalyst: 1mg/cm2 20wt% Pt/C, Cathode
O2 flow rate = 75ccm, Anode flow rate = 1ccm, Thumidifier = 25ºC)
Figure 24: Polarization curves at 110ºC for anode flow rates of 1ccm and 5ccm
(T = 80ºC, Anode catalyst: 4mg/cm2 Pt/Ru black, Cathode catalyst: 4mg/cm2 Pt black,
Cathode O2 flow rate = 75ccm, Thumidifier = 25ºC, PA = PC = 1atm gage)
0.000
0.100
0.200
0.300
0.400
0.500
0.600
0.700
0.800
0.00 100.00 200.00 300.00 400.00 500.00 600.00 700.00 800.00 900.00
i (mA/cm2)
U (V) Fanode=1ccm
Fanode=5ccm
0.000
0.100
0.200
0.300
0.400
0.500
0.600
0.700
0.00 50.00 100.00 150.00 200.00 250.00 300.00 350.00 400.00
i (mA/cm2)
U (V) Tcell=60 degree C /Thumid=25 degreeC
Tcell=60 degree C /Thumid=60 degreeC
Tcell=80 degree C /Thumid=25 degreeC
Tcell=80 degree C /Thumid=80 degreeC
- 44 -
High performance could be obtained at 110ºC (Figure 24). To keep the methanol
solution liquid, however, the anode compartment was pressurized at one atmosphere gage
pressure. Cathode pressure was also kept at 1 the same pressure to keep the zero pressure
difference between each side of the membrane, to reduce methanol crossover due to
pressure difference between anode and cathode. However, pressurized fuel cells will not
likely be suitable for small size portable applications such as laptops and cell-phones.
3. Effect of Nafion and PTFE content in the catalytic layer
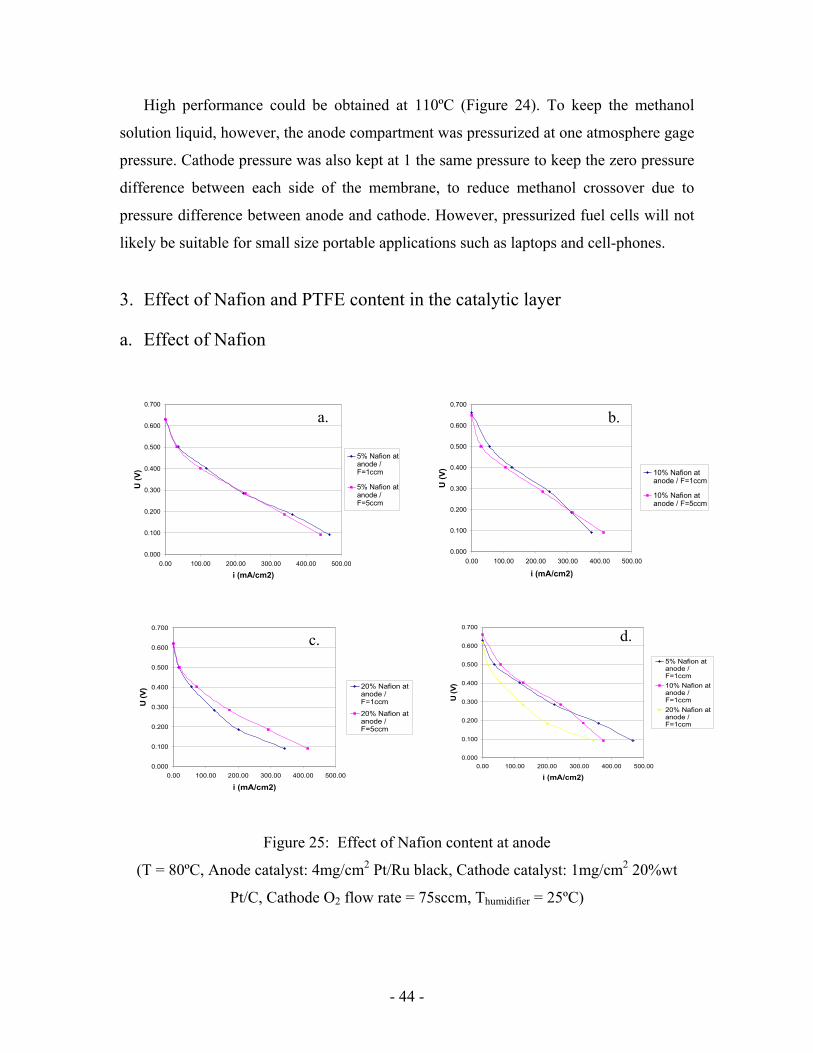
a. Effect of Nafion
Figure 25: Effect of Nafion content at anode
(T = 80ºC, Anode catalyst: 4mg/cm2 Pt/Ru black, Cathode catalyst: 1mg/cm2 20%wt
Pt/C, Cathode O2 flow rate = 75sccm, Thumidifier = 25ºC)
0.000
0.100
0.200
0.300
0.400
0.500
0.600
0.700
0.00 100.00 200.00 300.00 400.00 500.00
i (mA/cm2)
U (V
) 20% Nafion atanode /F=1ccm
20% Nafion atanode /F=5ccm
0.000
0.100
0.200
0.300
0.400
0.500
0.600
0.700
0.00 100.00 200.00 300.00 400.00 500.00
i (mA/cm2)
U (V
)
5% Nafion atanode /F=1ccm
5% Nafion atanode /F=5ccm
0.000
0.100
0.200
0.300
0.400
0.500
0.600
0.700
0.00 100.00 200.00 300.00 400.00 500.00
i (mA/cm2)
U (V
) 10% Nafion atanode / F=1ccm
10% Nafion atanode / F=5ccm
0.000
0.100
0.200
0.300
0.400
0.500
0.600
0.700
0.00 100.00 200.00 300.00 400.00 500.00
i (mA/cm2)
U (V
)
5% Nafion atanode /F=1ccm10% Nafion atanode /F=1ccm20% Nafion atanode /F=1ccm
c. d.
a. b.
- 45 -
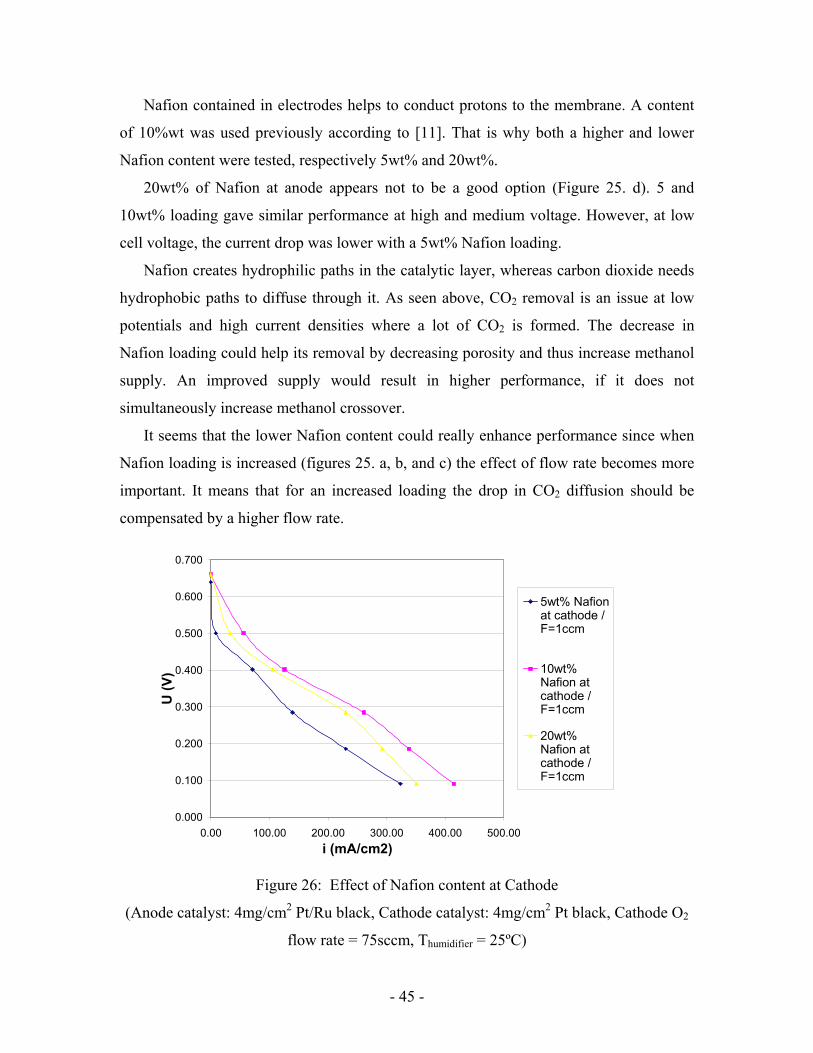
Nafion contained in electrodes helps to conduct protons to the membrane. A content
of 10%wt was used previously according to [11]. That is why both a higher and lower
Nafion content were tested, respectively 5wt% and 20wt%.
20wt% of Nafion at anode appears not to be a good option (Figure 25. d). 5 and
10wt% loading gave similar performance at high and medium voltage. However, at low
cell voltage, the current drop was lower with a 5wt% Nafion loading.
Nafion creates hydrophilic paths in the catalytic layer, whereas carbon dioxide needs
hydrophobic paths to diffuse through it. As seen above, CO2 removal is an issue at low
potentials and high current densities where a lot of CO2 is formed. The decrease in
Nafion loading could help its removal by decreasing porosity and thus increase methanol
supply. An improved supply would result in higher performance, if it does not
simultaneously increase methanol crossover.
It seems that the lower Nafion content could really enhance performance since when
Nafion loading is increased (figures 25. a, b, and c) the effect of flow rate becomes more
important. It means that for an increased loading the drop in CO2 diffusion should be
compensated by a higher flow rate.
Figure 26: Effect of Nafion content at Cathode
(Anode catalyst: 4mg/cm2 Pt/Ru black, Cathode catalyst: 4mg/cm2 Pt black, Cathode O2
flow rate = 75sccm, Thumidifier = 25ºC)
0.000
0.100
0.200
0.300
0.400
0.500
0.600
0.700
0.00 100.00 200.00 300.00 400.00 500.00i (mA/cm2)
U (V
)
5wt% Nafionat cathode /F=1ccm
10wt%Nafion atcathode /F=1ccm
20wt%Nafion atcathode /F=1ccm
- 46 -
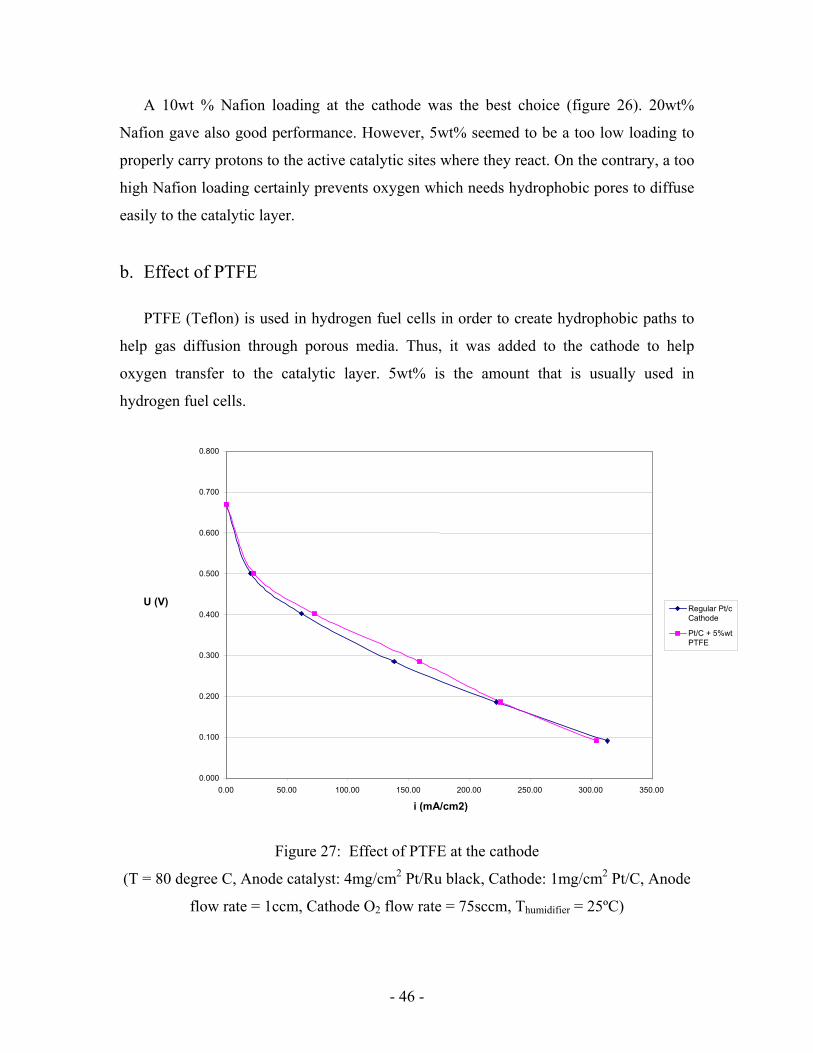
A 10wt % Nafion loading at the cathode was the best choice (figure 26). 20wt%
Nafion gave also good performance. However, 5wt% seemed to be a too low loading to
properly carry protons to the active catalytic sites where they react. On the contrary, a too
high Nafion loading certainly prevents oxygen which needs hydrophobic pores to diffuse
easily to the catalytic layer.
b. Effect of PTFE
PTFE (Teflon) is used in hydrogen fuel cells in order to create hydrophobic paths to
help gas diffusion through porous media. Thus, it was added to the cathode to help
oxygen transfer to the catalytic layer. 5wt% is the amount that is usually used in
hydrogen fuel cells.
Figure 27: Effect of PTFE at the cathode
(T = 80 degree C, Anode catalyst: 4mg/cm2 Pt/Ru black, Cathode: 1mg/cm2 Pt/C, Anode
flow rate = 1ccm, Cathode O2 flow rate = 75sccm, Thumidifier = 25ºC)
0.000
0.100
0.200
0.300
0.400
0.500
0.600
0.700
0.800
0.00 50.00 100.00 150.00 200.00 250.00 300.00 350.00
i (mA/cm2)
U (V) Regular Pt/cCathode
Pt/C + 5%wtPTFE

- 47 -
0.000
0.100
0.200
0.300
0.400
0.500
0.600
0.700
0.00 50.00 100.00 150.00 200.00 250.00 300.00 350.00
i (mA/cm2)
U (V
)
5% PTFE at Anode /Fanode = 1ccm
No PTFE at Anode /Fanode = 1ccm
5% PTFE at Anode /Fanode = 5ccm
No PTFE at Anode /Fanode = 5ccm
0.000
0.100
0.200
0.300
0.400
0.500
0.600
0.700
0.00 50.00 100.00 150.00 200.00 250.00 300.00 350.00 400.00 450.00
i (mA/cm2)
U (V
)
5% PTFE at Anode /Fanode = 1ccm
No PTFE at Anode /Fanode = 1ccm
5% PTFE at Anode /Fanode = 5ccm
No PTFE at Anode /Fanode = 5ccm
Figure 28: Effect of 5wt% of PTFE and flow rate at the Anode at T = 60ºCand T = 80ºC
(Anode catalyst: 4mg/cm2 Pt/Ru black, Cathode: 1mg/cm2 Pt/C, Anode flow rate = 1ccm,
Cathode O2 flow rate = 75sccm, Thumidifier = 25ºC [for both figures])
- 48 -
Thus, 5, 10 and 20wt% PTFE electrodes were tested. For cathode side, only the 5wt%
electrode was investigated. Nafion loading remained 10wt% for each electrode.
Addition of PTFE does not have a great effect on the cell performance (Figure 27).
Oxygen diffusion to the catalytic layer seems not to be a key issue for pure oxygen use on
cathode.
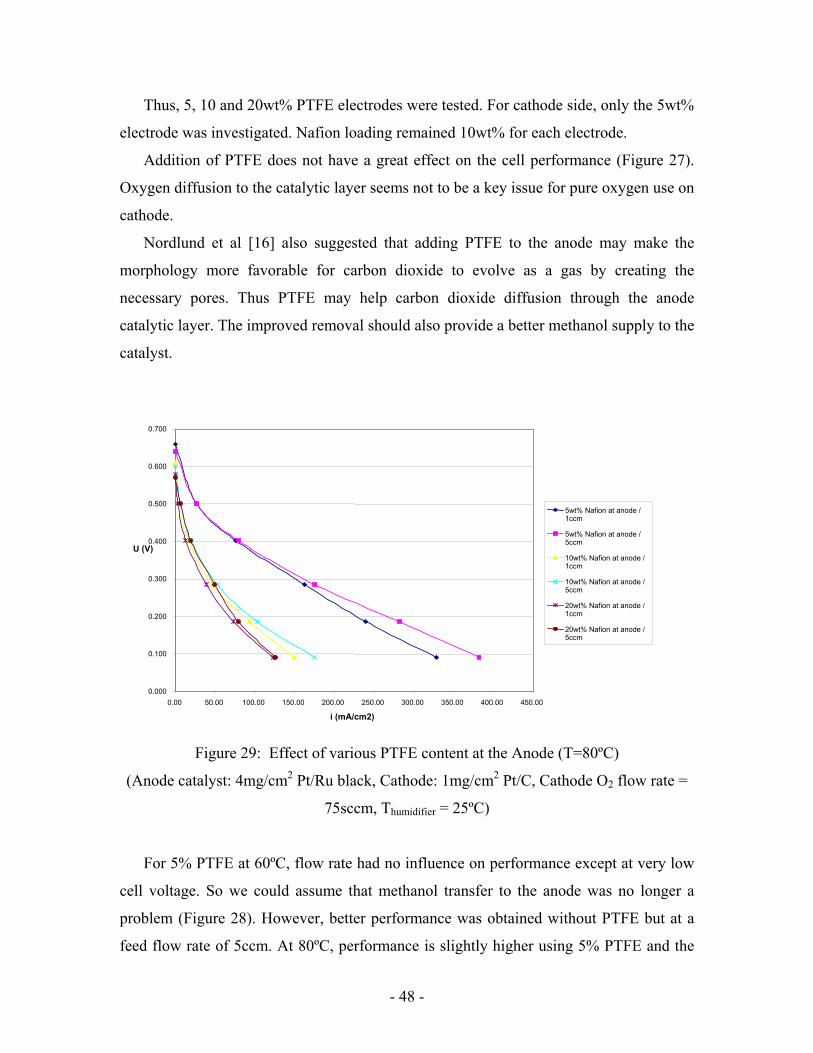
Nordlund et al [16] also suggested that adding PTFE to the anode may make the
morphology more favorable for carbon dioxide to evolve as a gas by creating the
necessary pores. Thus PTFE may help carbon dioxide diffusion through the anode
catalytic layer. The improved removal should also provide a better methanol supply to the
catalyst.
Figure 29: Effect of various PTFE content at the Anode (T=80ºC)
(Anode catalyst: 4mg/cm2 Pt/Ru black, Cathode: 1mg/cm2 Pt/C, Cathode O2 flow rate =
75sccm, Thumidifier = 25ºC)
For 5% PTFE at 60ºC, flow rate had no influence on performance except at very low
cell voltage. So we could assume that methanol transfer to the anode was no longer a
problem (Figure 28). However, better performance was obtained without PTFE but at a
feed flow rate of 5ccm. At 80ºC, performance is slightly higher using 5% PTFE and the
0.000
0.100
0.200
0.300
0.400
0.500
0.600
0.700
0.00 50.00 100.00 150.00 200.00 250.00 300.00 350.00 400.00 450.00
i (mA/cm2)
U (V)
5wt% Nafion at anode / 1ccm 5wt% Nafion at anode / 5ccm 10wt% Nafion at anode / 1ccm 10wt% Nafion at anode / 5ccm 20wt% Nafion at anode / 1ccm 20wt% Nafion at anode / 5ccm
- 49 -
difference becomes significant at low cell voltage for a feed flow rate of 5ccm (Figure
28). Kinetics is improved by temperature. Consequently, at 80ºC, more methanol is
needed at the catalytic layer. PTFE and higher flow rate both have a beneficial effect.
For the anode, performances decreased with the PTFE loading (figure 29). The high
concentration of hydrophobic pores apparently blocked methanol diffusion to the anode
catalytic layer.
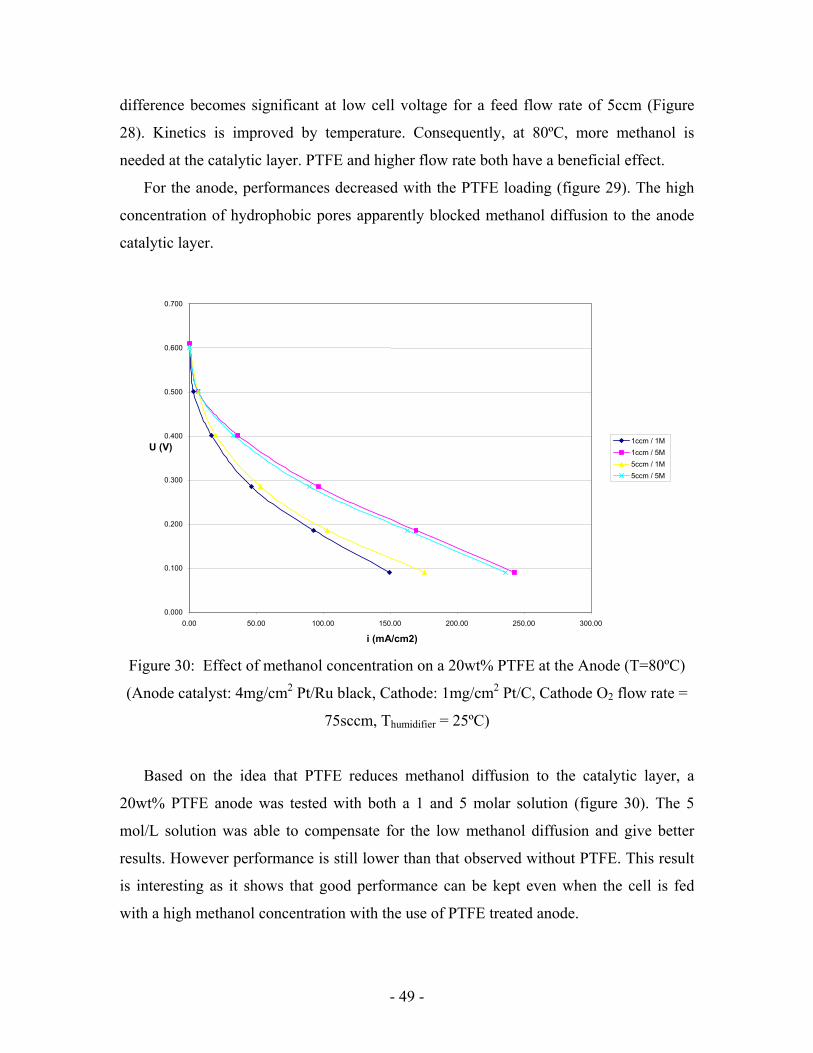
Figure 30: Effect of methanol concentration on a 20wt% PTFE at the Anode (T=80ºC)
(Anode catalyst: 4mg/cm2 Pt/Ru black, Cathode: 1mg/cm2 Pt/C, Cathode O2 flow rate =
75sccm, Thumidifier = 25ºC)
Based on the idea that PTFE reduces methanol diffusion to the catalytic layer, a
20wt% PTFE anode was tested with both a 1 and 5 molar solution (figure 30). The 5
mol/L solution was able to compensate for the low methanol diffusion and give better
results. However performance is still lower than that observed without PTFE. This result
is interesting as it shows that good performance can be kept even when the cell is fed
with a high methanol concentration with the use of PTFE treated anode.
0.000
0.100
0.200
0.300
0.400
0.500
0.600
0.700
0.00 50.00 100.00 150.00 200.00 250.00 300.00 i (mA/cm2)
U (V) 1ccm / 1M1ccm / 5M5ccm / 1M5ccm / 5M
- 50 -
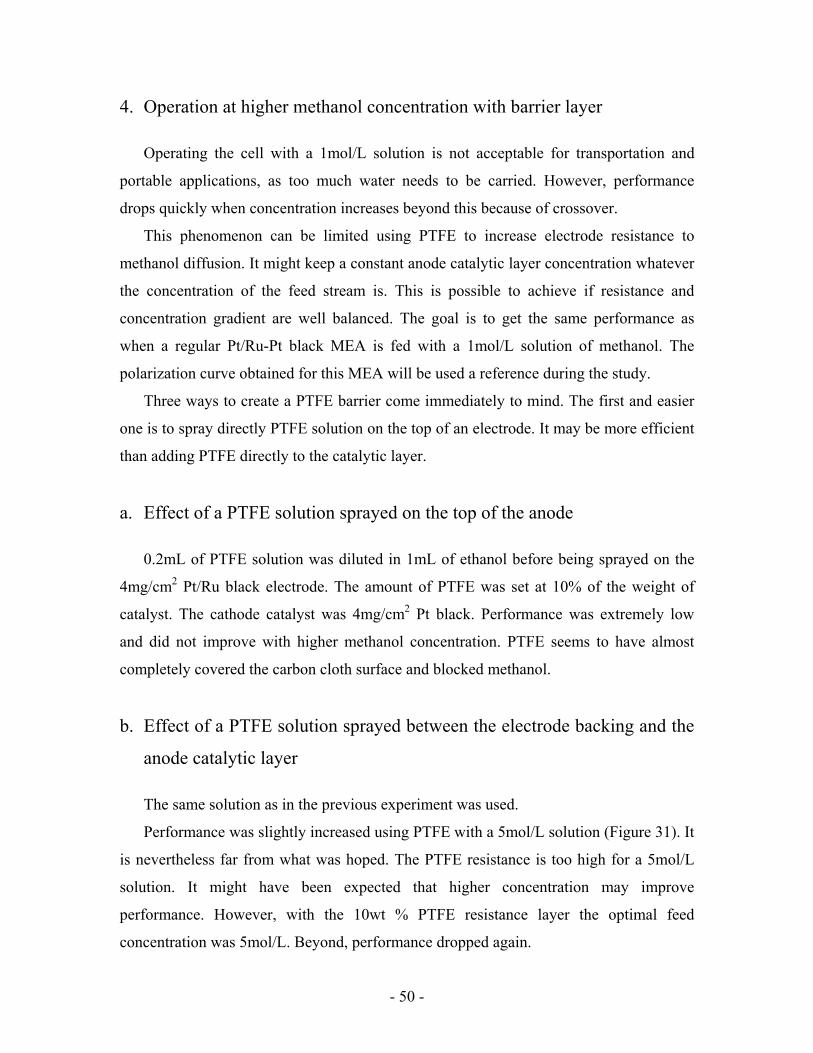
4. Operation at higher methanol concentration with barrier layer
Operating the cell with a 1mol/L solution is not acceptable for transportation and
portable applications, as too much water needs to be carried. However, performance
drops quickly when concentration increases beyond this because of crossover.
This phenomenon can be limited using PTFE to increase electrode resistance to
methanol diffusion. It might keep a constant anode catalytic layer concentration whatever
the concentration of the feed stream is. This is possible to achieve if resistance and
concentration gradient are well balanced. The goal is to get the same performance as
when a regular Pt/Ru-Pt black MEA is fed with a 1mol/L solution of methanol. The
polarization curve obtained for this MEA will be used a reference during the study.
Three ways to create a PTFE barrier come immediately to mind. The first and easier
one is to spray directly PTFE solution on the top of an electrode. It may be more efficient
than adding PTFE directly to the catalytic layer.
a. Effect of a PTFE solution sprayed on the top of the anode
0.2mL of PTFE solution was diluted in 1mL of ethanol before being sprayed on the
4mg/cm2 Pt/Ru black electrode. The amount of PTFE was set at 10% of the weight of
catalyst. The cathode catalyst was 4mg/cm2 Pt black. Performance was extremely low
and did not improve with higher methanol concentration. PTFE seems to have almost
completely covered the carbon cloth surface and blocked methanol.
b. Effect of a PTFE solution sprayed between the electrode backing and the
anode catalytic layer
The same solution as in the previous experiment was used.
Performance was slightly increased using PTFE with a 5mol/L solution (Figure 31). It
is nevertheless far from what was hoped. The PTFE resistance is too high for a 5mol/L
solution. It might have been expected that higher concentration may improve
performance. However, with the 10wt % PTFE resistance layer the optimal feed
concentration was 5mol/L. Beyond, performance dropped again.

- 51 -
Figure 31: 10wt% PTFE resistance barrier at the Anode
(T = 80ºC, Anode catalyst: 4mg/cm2 Pt/Ru black, Cathode: 4mg/cm2 Pt black, Anode
flow rate = 1ccm, Cathode O2 flow rate = 75sccm, Thumidifier = 25ºC)
c. Effect of a supported Pt/Ru resistance layer between the electrode
backing and the catalytic layer
Having a fine control on methanol diffusion seems to be difficult when using a pure
PTFE barrier. An option in creating a resistance layer is spraying a mixture of carbon
powder and PTFE before the catalytic ink to create a resistance barrier. The thickness and
PTFE loading of this layer are easier to control.
However, a 40% supported Pt/Ru on carbon was used instead of carbon powder
because it was already available in the lab. Some methanol will adsorb on its surface and
foul it. However, it should not affect the performance since the catalytic layer is still there
for of the oxidation reaction. This layer has only to act as a barrier.
The resistance layer was designed to have half the thickness of the catalytic layer.
Thus, 12mg of powder were sprayed of the 5cm2 electrode. The PTFE content of the ink
was adjusted at 10% of the weight of the supported Pt/Ru powder.
0.000
0.100
0.200
0.300
0.400
0.500
0.600
0.700
0.00 50.00 100.00 150.00 200.00 250.00 300.00 350.00 400.00 450.00
i (mA/cm2)
U (V)
Nafion 117 (1M)
Nafion 117 (5M)
Nafion117+10wt%PTFE (1M) Nafion117+10wt%PTFE (5M)
- 52 -
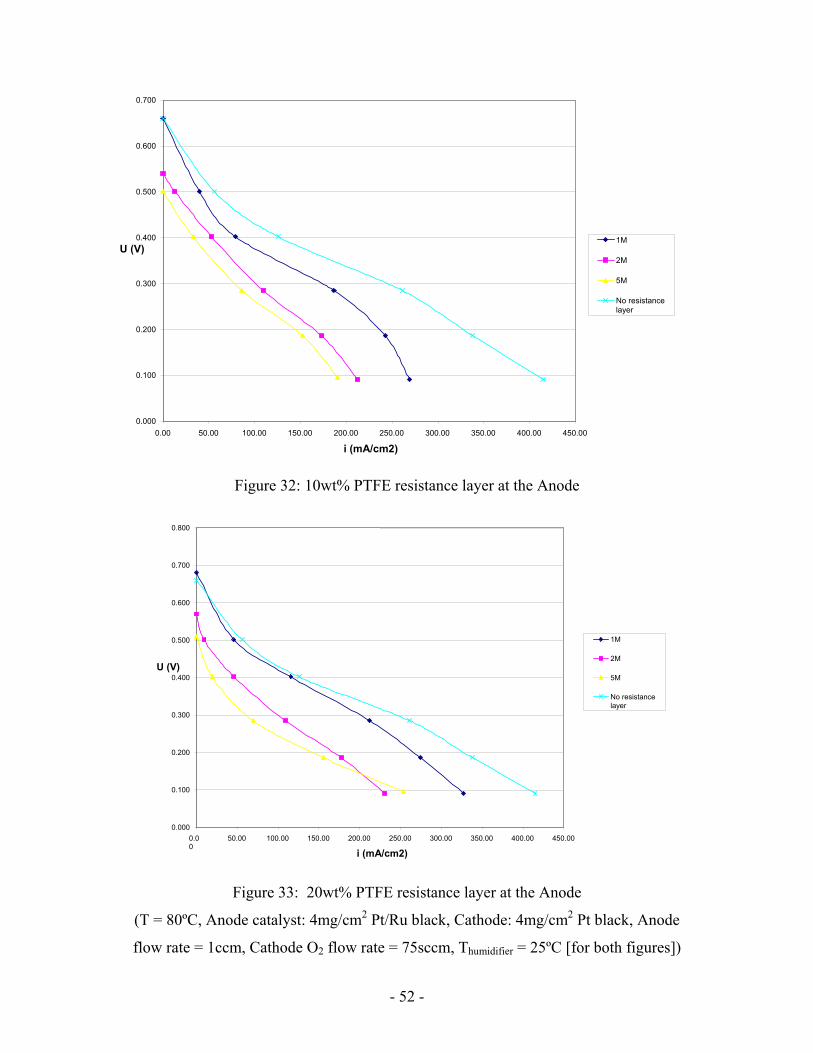
Figure 32: 10wt% PTFE resistance layer at the Anode
Figure 33: 20wt% PTFE resistance layer at the Anode
(T = 80ºC, Anode catalyst: 4mg/cm2 Pt/Ru black, Cathode: 4mg/cm2 Pt black, Anode
flow rate = 1ccm, Cathode O2 flow rate = 75sccm, Thumidifier = 25ºC [for both figures])
0.000
0.100
0.200
0.300
0.400
0.500
0.600
0.700
0.00 50.00 100.00 150.00 200.00 250.00 300.00 350.00 400.00 450.00 i (mA/cm2)
U (V) 1M 2M 5M No resistancelayer
0.000
0.100
0.200
0.300
0.400
0.500
0.600
0.700
0.800
0.00 50.00 100.00 150.00 200.00 250.00 300.00 350.00 400.00 450.00
i (mA/cm2)
U (V)
1M 2M 5M No resistancelayer
- 53 -
Performance decreased with increasing concentration, however (Figure 32). Besides,
it can be seen that the limiting current is decreased. Resistance is too low to operate at
higher methanol concentration. However, it is still too high at 1mol/L to reach expected
performance.
When PTFE loading is increased, performance is still decreased (Figure 33).
However, higher current densities are obtained at low cell voltage for a 5mol/L
concentration than for 2mol/L. It shows that, in this range of cell voltage where more
methanol is consumed, a high concentration is needed to balance diffusion resistance. It
also shows that diffusion does not have the same concentration dependence in all the cell
voltage range.
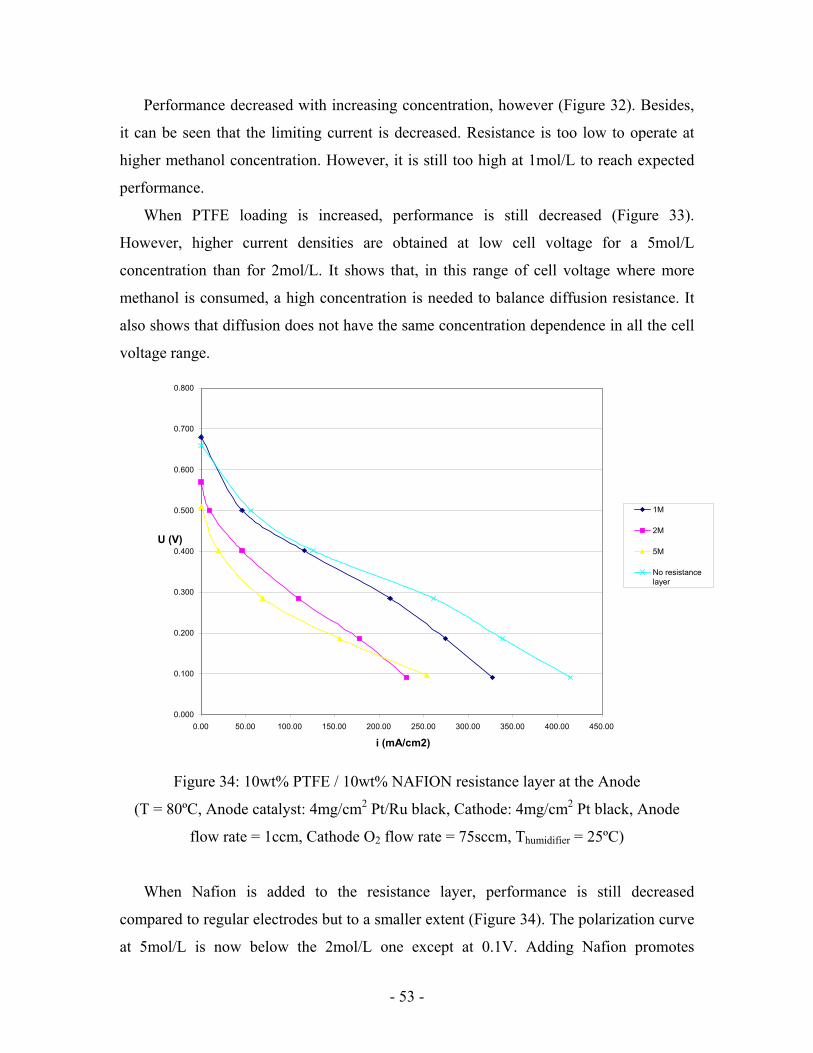
Figure 34: 10wt% PTFE / 10wt% NAFION resistance layer at the Anode
(T = 80ºC, Anode catalyst: 4mg/cm2 Pt/Ru black, Cathode: 4mg/cm2 Pt black, Anode
flow rate = 1ccm, Cathode O2 flow rate = 75sccm, Thumidifier = 25ºC)
When Nafion is added to the resistance layer, performance is still decreased
compared to regular electrodes but to a smaller extent (Figure 34). The polarization curve
at 5mol/L is now below the 2mol/L one except at 0.1V. Adding Nafion promotes
0.000
0.100
0.200
0.300
0.400
0.500
0.600
0.700
0.800
0.00 50.00 100.00 150.00 200.00 250.00 300.00 350.00 400.00 450.00 i (mA/cm2)
U (V)
1M
2M
5M
No resistancelayer
- 54 -
methanol diffusion in the resistance layer and the high concentration has no longer a
beneficial effect.
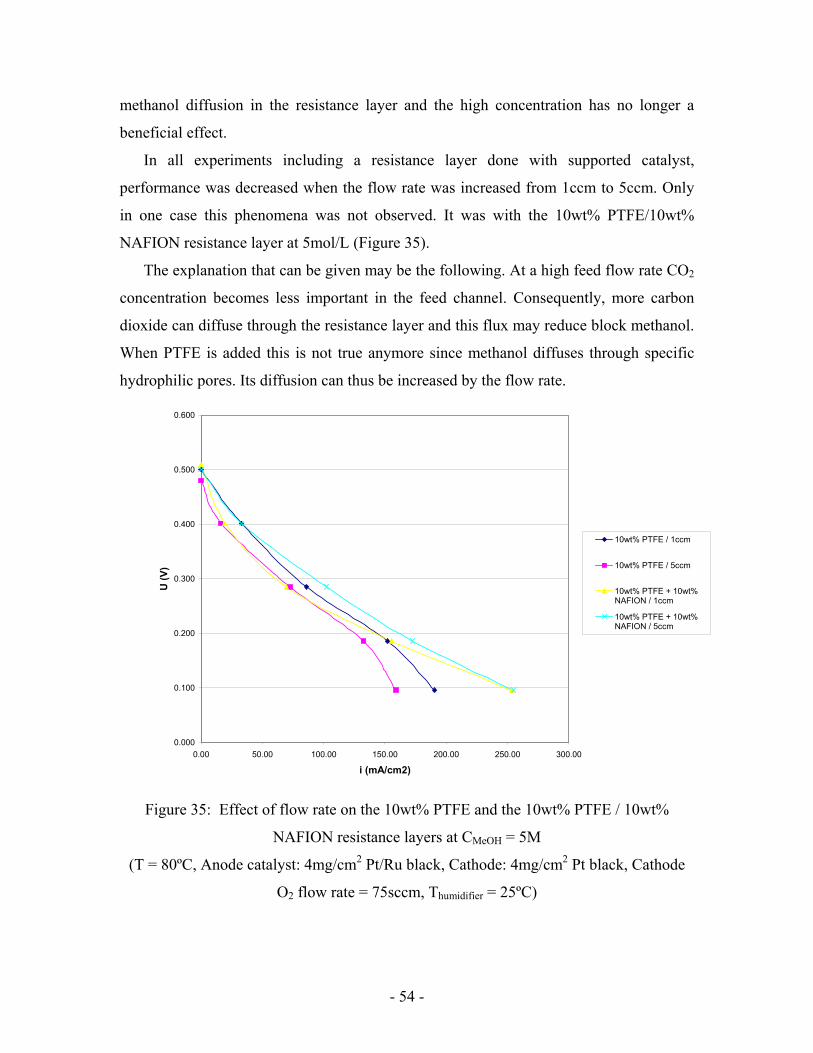
In all experiments including a resistance layer done with supported catalyst,
performance was decreased when the flow rate was increased from 1ccm to 5ccm. Only
in one case this phenomena was not observed. It was with the 10wt% PTFE/10wt%
NAFION resistance layer at 5mol/L (Figure 35).
The explanation that can be given may be the following. At a high feed flow rate CO2
concentration becomes less important in the feed channel. Consequently, more carbon
dioxide can diffuse through the resistance layer and this flux may reduce block methanol.
When PTFE is added this is not true anymore since methanol diffuses through specific
hydrophilic pores. Its diffusion can thus be increased by the flow rate.
0.000
0.100
0.200
0.300
0.400
0.500
0.600
0.00 50.00 100.00 150.00 200.00 250.00 300.00
i (mA/cm2)
U (V
)
10wt% PTFE / 1ccm
10wt% PTFE / 5ccm
10wt% PTFE + 10wt%NAFION / 1ccm
10wt% PTFE + 10wt%NAFION / 5ccm
Figure 35: Effect of flow rate on the 10wt% PTFE and the 10wt% PTFE / 10wt%
NAFION resistance layers at CMeOH = 5M
(T = 80ºC, Anode catalyst: 4mg/cm2 Pt/Ru black, Cathode: 4mg/cm2 Pt black, Cathode
O2 flow rate = 75sccm, Thumidifier = 25ºC)
- 55 -
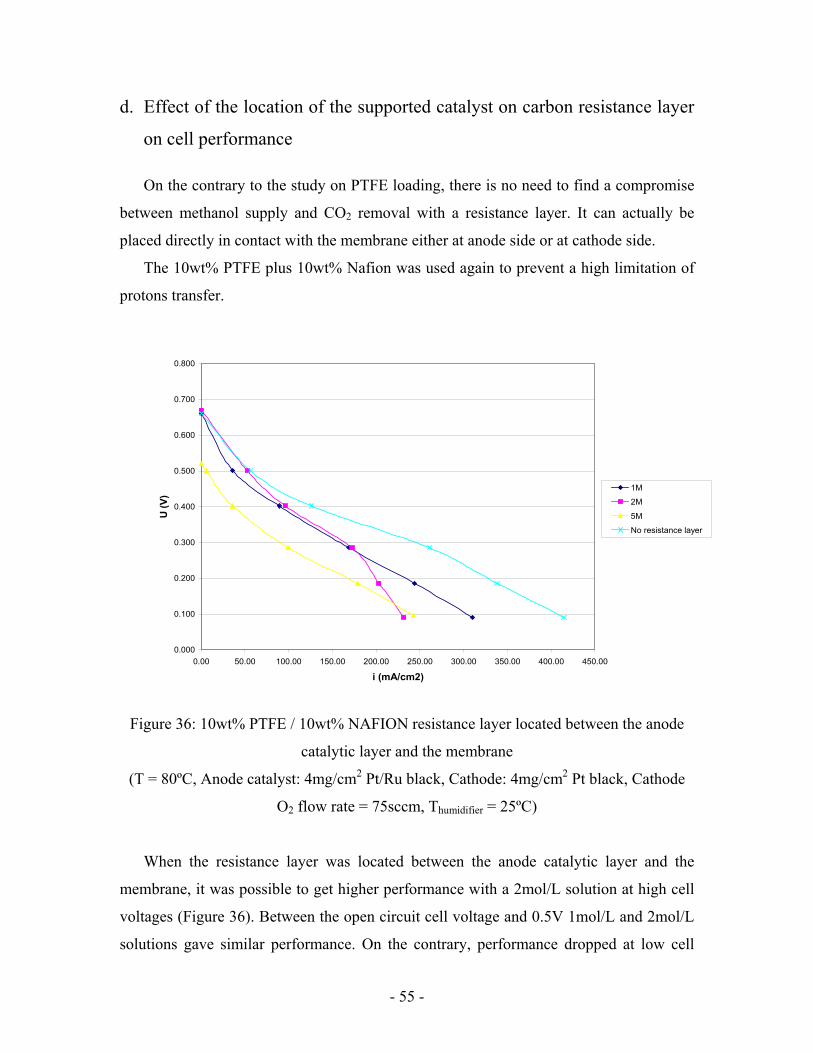
d. Effect of the location of the supported catalyst on carbon resistance layer
on cell performance
On the contrary to the study on PTFE loading, there is no need to find a compromise
between methanol supply and CO2 removal with a resistance layer. It can actually be
placed directly in contact with the membrane either at anode side or at cathode side.
The 10wt% PTFE plus 10wt% Nafion was used again to prevent a high limitation of
protons transfer.
0.000
0.100
0.200
0.300
0.400
0.500
0.600
0.700
0.800
0.00 50.00 100.00 150.00 200.00 250.00 300.00 350.00 400.00 450.00
i (mA/cm2)
U (V
)
1M
2M
5M
No resistance layer
Figure 36: 10wt% PTFE / 10wt% NAFION resistance layer located between the anode
catalytic layer and the membrane
(T = 80ºC, Anode catalyst: 4mg/cm2 Pt/Ru black, Cathode: 4mg/cm2 Pt black, Cathode
O2 flow rate = 75sccm, Thumidifier = 25ºC)
When the resistance layer was located between the anode catalytic layer and the
membrane, it was possible to get higher performance with a 2mol/L solution at high cell
voltages (Figure 36). Between the open circuit cell voltage and 0.5V 1mol/L and 2mol/L
solutions gave similar performance. On the contrary, performance dropped at low cell
- 56 -
voltages. The higher methanol concentration certainly promoted carbon dioxide
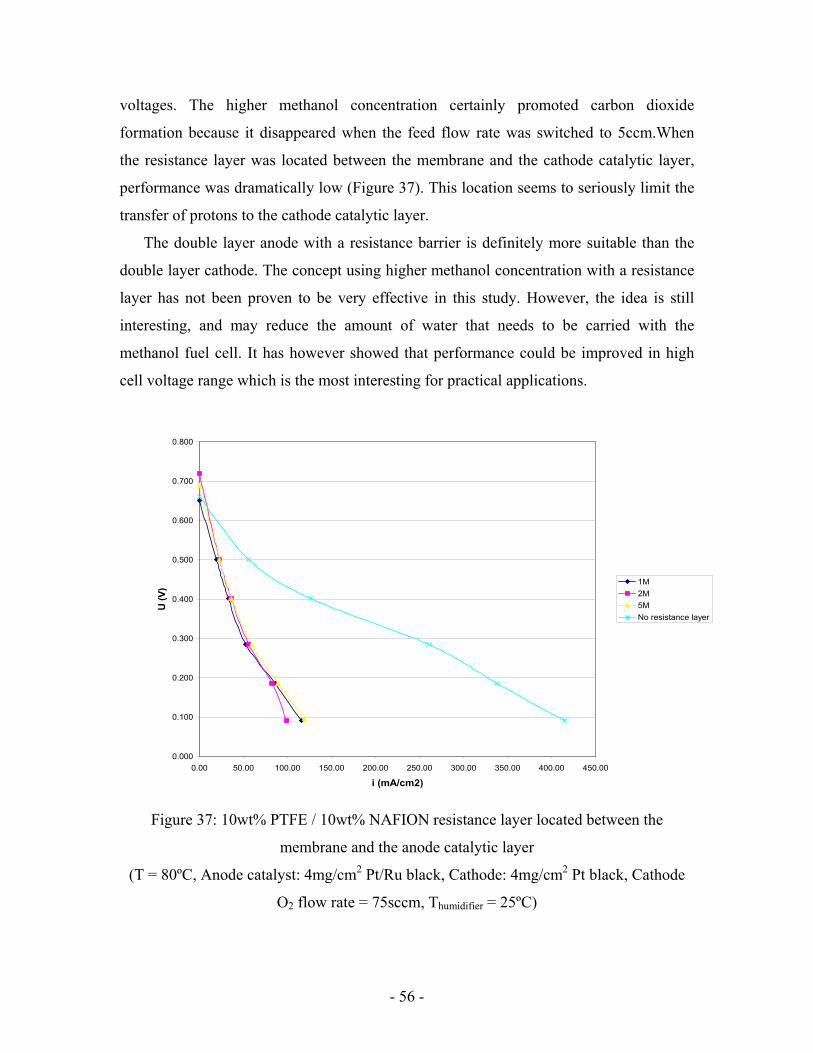
formation because it disappeared when the feed flow rate was switched to 5ccm.When
the resistance layer was located between the membrane and the cathode catalytic layer,
performance was dramatically low (Figure 37). This location seems to seriously limit the
transfer of protons to the cathode catalytic layer.
The double layer anode with a resistance barrier is definitely more suitable than the
double layer cathode. The concept using higher methanol concentration with a resistance
layer has not been proven to be very effective in this study. However, the idea is still
interesting, and may reduce the amount of water that needs to be carried with the
methanol fuel cell. It has however showed that performance could be improved in high
cell voltage range which is the most interesting for practical applications.
0.000
0.100
0.200
0.300
0.400
0.500
0.600
0.700
0.800
0.00 50.00 100.00 150.00 200.00 250.00 300.00 350.00 400.00 450.00
i (mA/cm2)
U (V
)
1M2M5MNo resistance layer
Figure 37: 10wt% PTFE / 10wt% NAFION resistance layer located between the
membrane and the anode catalytic layer
(T = 80ºC, Anode catalyst: 4mg/cm2 Pt/Ru black, Cathode: 4mg/cm2 Pt black, Cathode
O2 flow rate = 75sccm, Thumidifier = 25ºC)
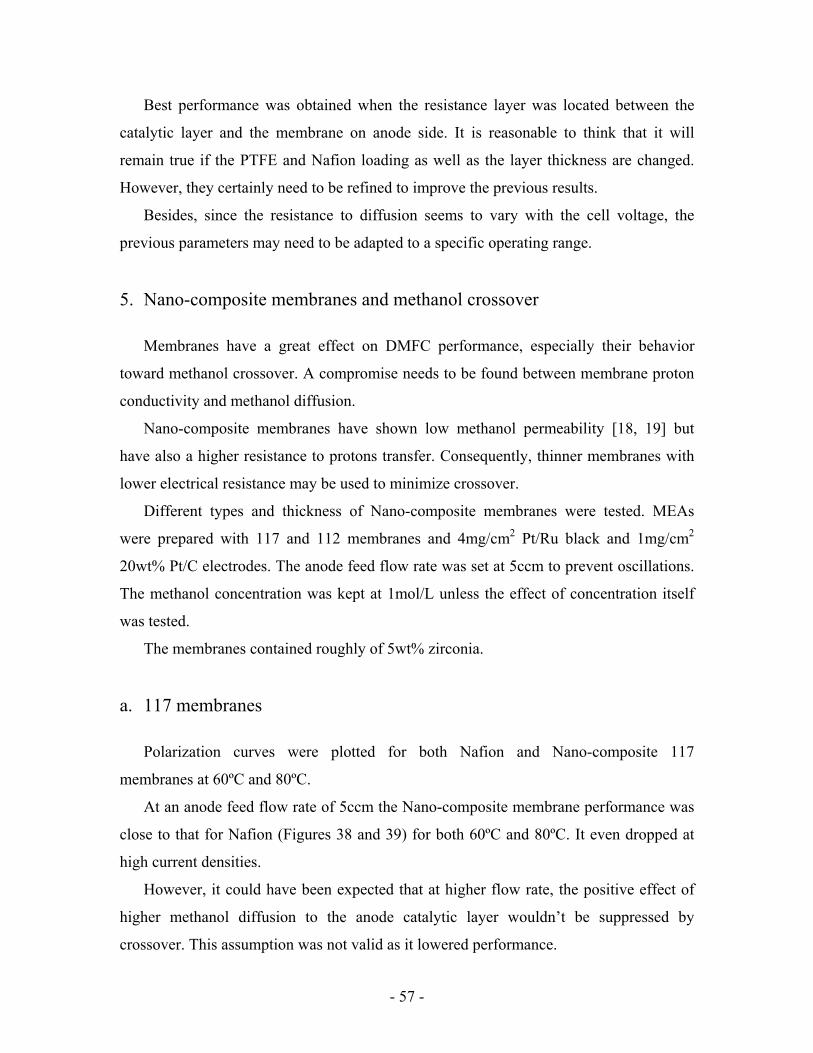
- 57 -
Best performance was obtained when the resistance layer was located between the
catalytic layer and the membrane on anode side. It is reasonable to think that it will
remain true if the PTFE and Nafion loading as well as the layer thickness are changed.
However, they certainly need to be refined to improve the previous results.
Besides, since the resistance to diffusion seems to vary with the cell voltage, the
previous parameters may need to be adapted to a specific operating range.
5. Nano-composite membranes and methanol crossover
Membranes have a great effect on DMFC performance, especially their behavior
toward methanol crossover. A compromise needs to be found between membrane proton
conductivity and methanol diffusion. Nano-composite membranes have shown low methanol permeability [18, 19] but
have also a higher resistance to protons transfer. Consequently, thinner membranes with
lower electrical resistance may be used to minimize crossover.
Different types and thickness of Nano-composite membranes were tested. MEAs
were prepared with 117 and 112 membranes and 4mg/cm2 Pt/Ru black and 1mg/cm2
20wt% Pt/C electrodes. The anode feed flow rate was set at 5ccm to prevent oscillations.
The methanol concentration was kept at 1mol/L unless the effect of concentration itself
was tested.
The membranes contained roughly of 5wt% zirconia.
a. 117 membranes
Polarization curves were plotted for both Nafion and Nano-composite 117
membranes at 60ºC and 80ºC.
At an anode feed flow rate of 5ccm the Nano-composite membrane performance was
close to that for Nafion (Figures 38 and 39) for both 60ºC and 80ºC. It even dropped at
high current densities.
However, it could have been expected that at higher flow rate, the positive effect of
higher methanol diffusion to the anode catalytic layer wouldn’t be suppressed by
crossover. This assumption was not valid as it lowered performance.
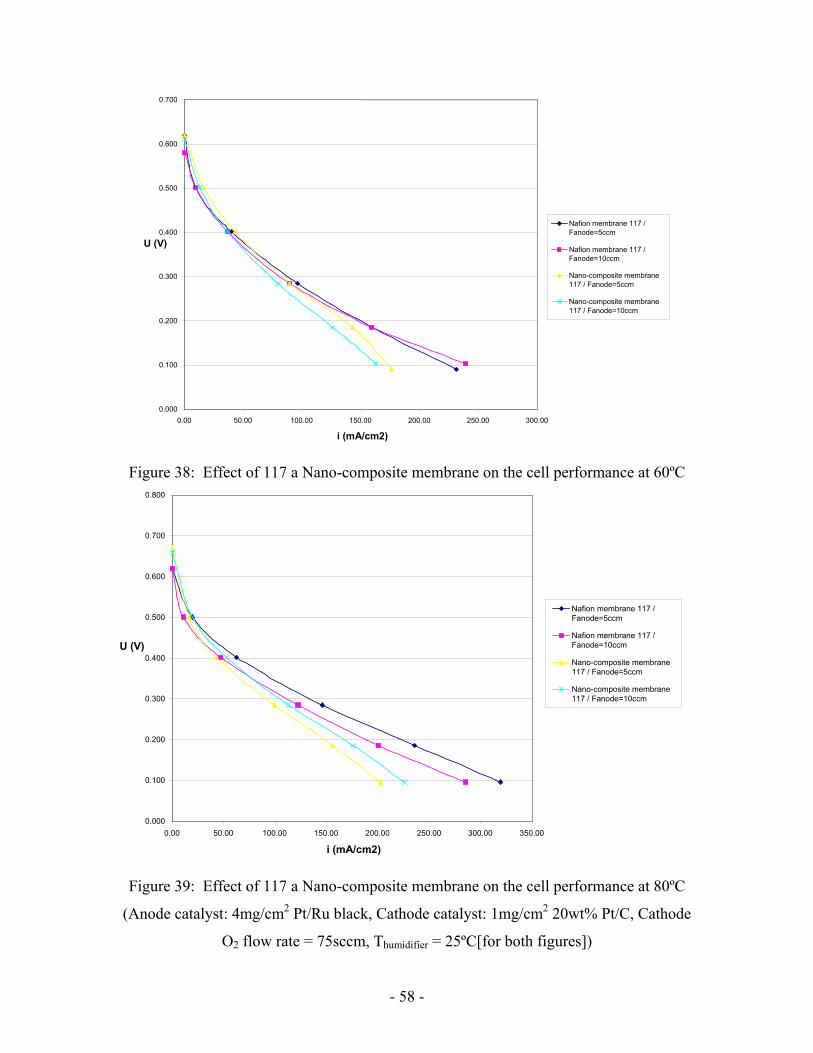
- 58 -
Figure 38: Effect of 117 a Nano-composite membrane on the cell performance at 60ºC
Figure 39: Effect of 117 a Nano-composite membrane on the cell performance at 80ºC
(Anode catalyst: 4mg/cm2 Pt/Ru black, Cathode catalyst: 1mg/cm2 20wt% Pt/C, Cathode
O2 flow rate = 75sccm, Thumidifier = 25ºC[for both figures])
0.000
0.100
0.200
0.300
0.400
0.500
0.600
0.700
0.00 50.00 100.00 150.00 200.00 250.00 300.00
i (mA/cm2)
U (V) Nafion membrane 117 / Fanode=5ccm Nafion membrane 117 / Fanode=10ccm Nano-composite membrane117 / Fanode=5ccm Nano-composite membrane117 / Fanode=10ccm
0.000
0.100
0.200
0.300
0.400
0.500
0.600
0.700
0.800
0.00 50.00 100.00 150.00 200.00 250.00 300.00 350.00
i (mA/cm2)
U (V)
Nafion membrane 117 /Fanode=5ccm Nafion membrane 117 /Fanode=10ccm Nano-composite membrane117 / Fanode=5ccm Nano-composite membrane117 / Fanode=10ccm

- 59 -
The same behavior was observed at higher methanol concentration (5M) (Figure 40).
It seems that even if methanol crossover is reduced with 117 Nano-composite
membranes, proton conductivity becomes too low to increase performance.
0.000
0.100
0.200
0.300
0.400
0.500
0.600
0.700
0.00 50.00 100.00 150.00 200.00 250.00 300.00
i (mA/cm2)
U (V
)
Nafion membrane 117 /Cmethanol=1M
Nano-composite membrane 117 /Cmethanol=1M
Nafion membrane 117 /Cmethanol=5M
Nano-composite membrane 117 /Cmethanol=5M
Figure 40: Effect of methanol concentration on a 117 Nano-composite membrane at
80ºC
(Anode catalyst: 4mg/cm2 Pt/Ru black, Cathode catalyst: 1mg/cm2 20wt% Pt/C, Anode
flow rate 5ccm, Cathode flow rate = 75sccm, Thumidifier = 25ºC)
b. 112 membranes
Different Nano-composite membranes were tested. A zirconia, two mixed zirconia-
silica and a silica membrane. The amount of silica was 2wt% for the first mixed
membrane (Zr/Si1) and for the silica nano-composite membrane. It was slightly increased
for the second mixed membrane (Zr/Si2).
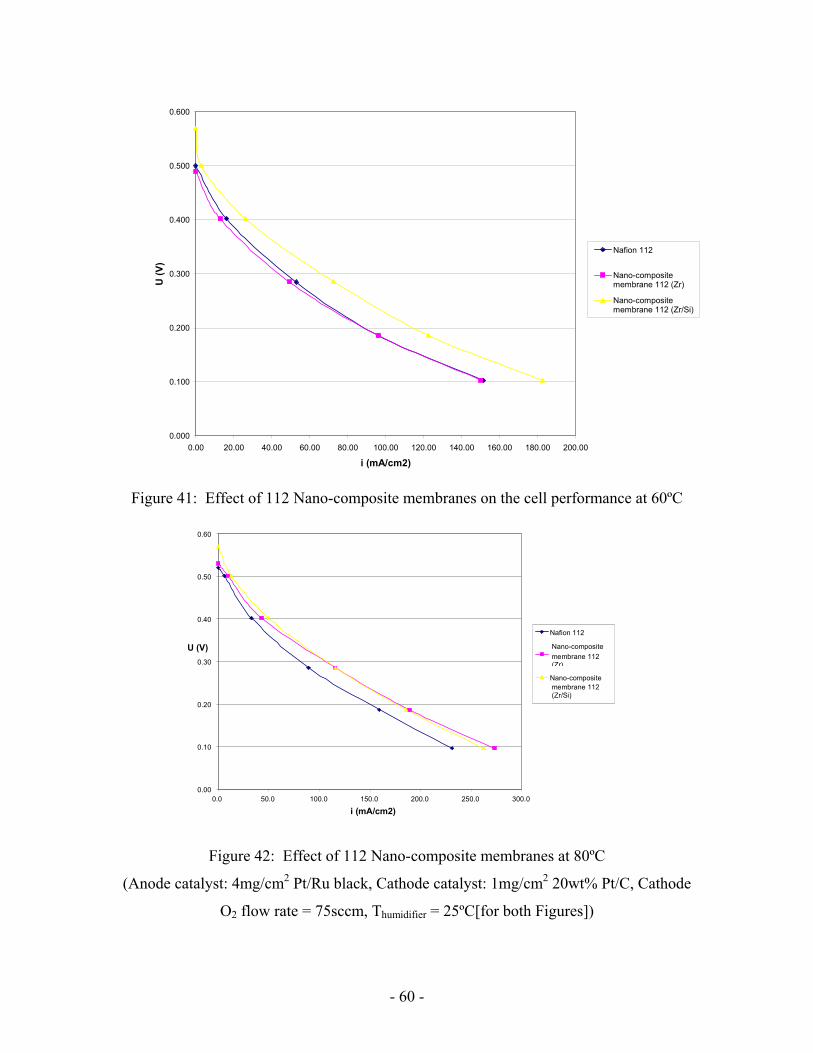
- 60 -
0.000
0.100
0.200
0.300
0.400
0.500
0.600
0.00 20.00 40.00 60.00 80.00 100.00 120.00 140.00 160.00 180.00 200.00
i (mA/cm2)
U (V
)
Nafion 112
Nano-compositemembrane 112 (Zr)
Nano-compositemembrane 112 (Zr/Si)
Figure 41: Effect of 112 Nano-composite membranes on the cell performance at 60ºC
Figure 42: Effect of 112 Nano-composite membranes at 80ºC
(Anode catalyst: 4mg/cm2 Pt/Ru black, Cathode catalyst: 1mg/cm2 20wt% Pt/C, Cathode
O2 flow rate = 75sccm, Thumidifier = 25ºC[for both Figures])
0.00
0.10
0.20
0.30
0.40
0.50
0.60
0.0 50.0 100.0 150.0 200.0 250.0 300.0
i (mA/cm2)
U (V) Nafion 112 Nano-composite membrane 112 (Zr)
Nano-composite membrane 112 (Zr/Si)
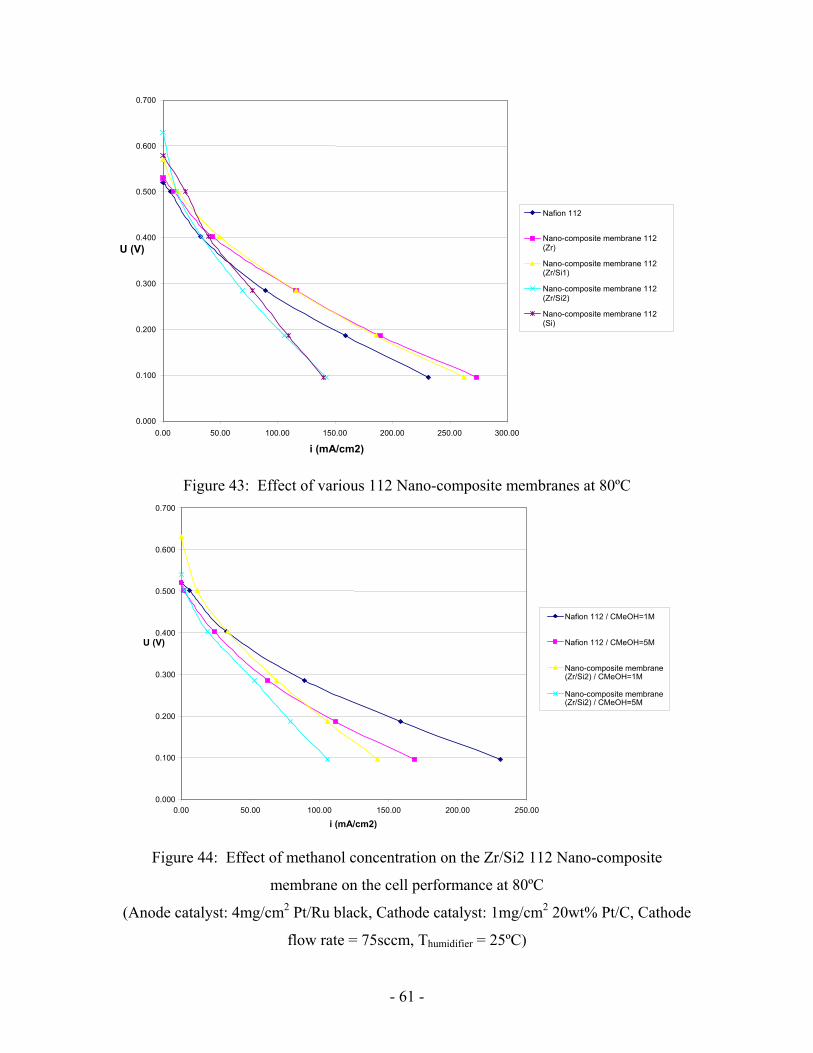
- 61 -
Figure 43: Effect of various 112 Nano-composite membranes at 80ºC
Figure 44: Effect of methanol concentration on the Zr/Si2 112 Nano-composite
membrane on the cell performance at 80ºC
(Anode catalyst: 4mg/cm2 Pt/Ru black, Cathode catalyst: 1mg/cm2 20wt% Pt/C, Cathode
flow rate = 75sccm, Thumidifier = 25ºC)
0.000
0.100
0.200
0.300
0.400
0.500
0.600
0.700
0.00 50.00 100.00 150.00 200.00 250.00 300.00
i (mA/cm2)
U (V)
Nafion 112
Nano-composite membrane 112 (Zr)
Nano-composite membrane 112 (Zr/Si1)
Nano-composite membrane 112 (Zr/Si2)
Nano-composite membrane 112 (Si)
0.000
0.100
0.200
0.300
0.400
0.500
0.600
0.700
0.00 50.00 100.00 150.00 200.00 250.00
i (mA/cm2)
U (V)
Nafion 112 / CMeOH=1M
Nafion 112 / CMeOH=5M
Nano-composite membrane(Zr/Si2) / CMeOH=1M Nano-composite membrane(Zr/Si2) / CMeOH=5M

- 62 -
The mixed Zr/Si membrane showed better performance than Nafion at 60ºC (Figure
41) whereas the pure Zr membranes had similar performance. At 80ºC, things have
changed, however. Both Zr and Zr/Si membranes showed better performance (Figure 42).
Both proton conductivity and crossover becomes higher than in 112 membranes than
in 117 membranes. In this case, proton conductivity becomes sufficient and crossover
reduction becomes significant. That must be the reason for higher performance. Besides,
the loading of inorganics affects the performance.
An increased silica loading has an undesirable effect on performance (Figure 43).
Zirconia seems to be more suitable for low methanol permeation membranes than silica.
A higher methanol concentration had a negative effect on performance (Figure 44).
Even if crossover is reduced at 1mol/L, the resistance to diffusion is not high enough.
6. Overall conclusions
Best performance was obtained for anode and cathode made respectively of 4mg/cm2
Pt/Ru black and 4mg/cm2 Pt black. The improvement due to other parameters depend on
the operating conditions. It has been seen that Nafion and PTFE loading can enhance
performance either at low or high current densities. However, it was not possible to
optimize both at the same time.
The most important conclusion that can be drawn is that carbon dioxide formation is a
great issue in Direct Methanol Fuel Cells. Even though it is possible to get rid of the
oscillations by increasing the flow rate, CO2 still has a dramatic effect on the
performance. That is why both electrode and bipolar plates should be designed for
effective carbon dioxide removal.
Electrode optimization:
According to Lindermeir et al [7], catalyst particle size should be as small as possible
to optimize the active area. Agglomeration was reduced by sonication to keep a small
particle size and a narrow size distribution.
The hardest part is to control Nafion and PTFE structure in the catalytic layer. The
effect of loading was studied but it seems that structure was not optimized. Always,
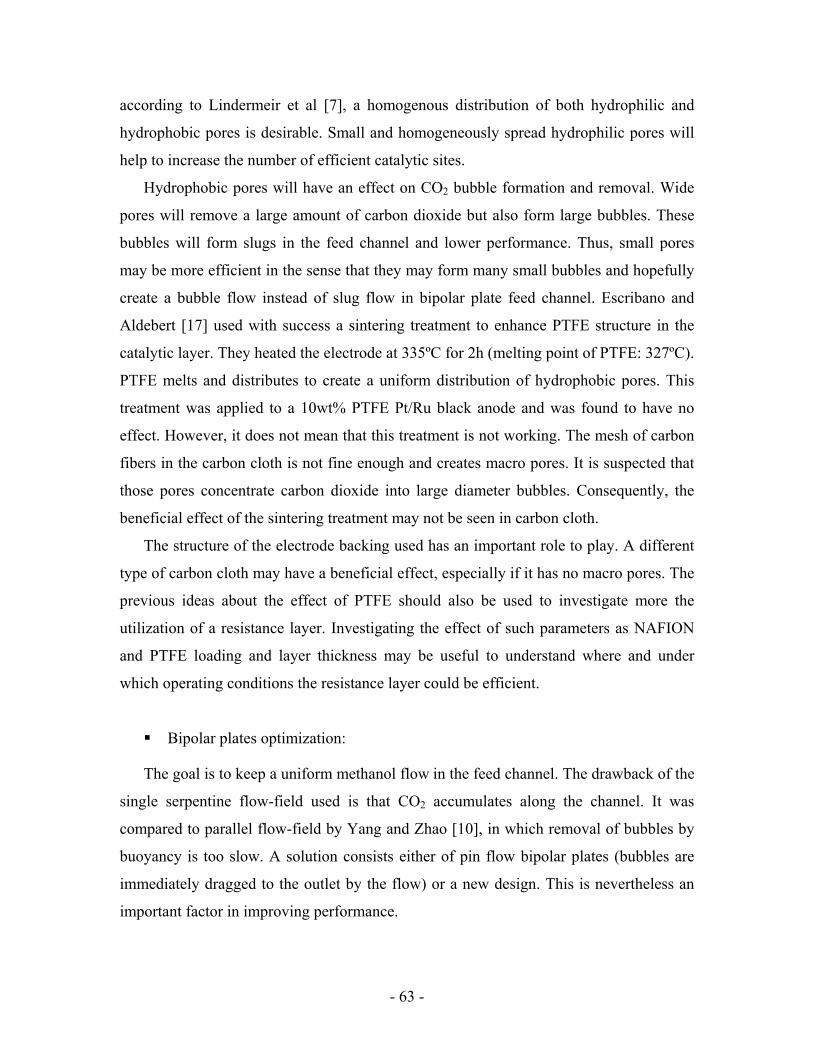
- 63 -
according to Lindermeir et al [7], a homogenous distribution of both hydrophilic and
hydrophobic pores is desirable. Small and homogeneously spread hydrophilic pores will
help to increase the number of efficient catalytic sites.
Hydrophobic pores will have an effect on CO2 bubble formation and removal. Wide
pores will remove a large amount of carbon dioxide but also form large bubbles. These
bubbles will form slugs in the feed channel and lower performance. Thus, small pores
may be more efficient in the sense that they may form many small bubbles and hopefully
create a bubble flow instead of slug flow in bipolar plate feed channel. Escribano and
Aldebert [17] used with success a sintering treatment to enhance PTFE structure in the
catalytic layer. They heated the electrode at 335ºC for 2h (melting point of PTFE: 327ºC).
PTFE melts and distributes to create a uniform distribution of hydrophobic pores. This
treatment was applied to a 10wt% PTFE Pt/Ru black anode and was found to have no
effect. However, it does not mean that this treatment is not working. The mesh of carbon
fibers in the carbon cloth is not fine enough and creates macro pores. It is suspected that
those pores concentrate carbon dioxide into large diameter bubbles. Consequently, the
beneficial effect of the sintering treatment may not be seen in carbon cloth.
The structure of the electrode backing used has an important role to play. A different
type of carbon cloth may have a beneficial effect, especially if it has no macro pores. The
previous ideas about the effect of PTFE should also be used to investigate more the
utilization of a resistance layer. Investigating the effect of such parameters as NAFION
and PTFE loading and layer thickness may be useful to understand where and under
which operating conditions the resistance layer could be efficient.
Bipolar plates optimization:
The goal is to keep a uniform methanol flow in the feed channel. The drawback of the
single serpentine flow-field used is that CO2 accumulates along the channel. It was
compared to parallel flow-field by Yang and Zhao [10], in which removal of bubbles by
buoyancy is too slow. A solution consists either of pin flow bipolar plates (bubbles are
immediately dragged to the outlet by the flow) or a new design. This is nevertheless an
important factor in improving performance.
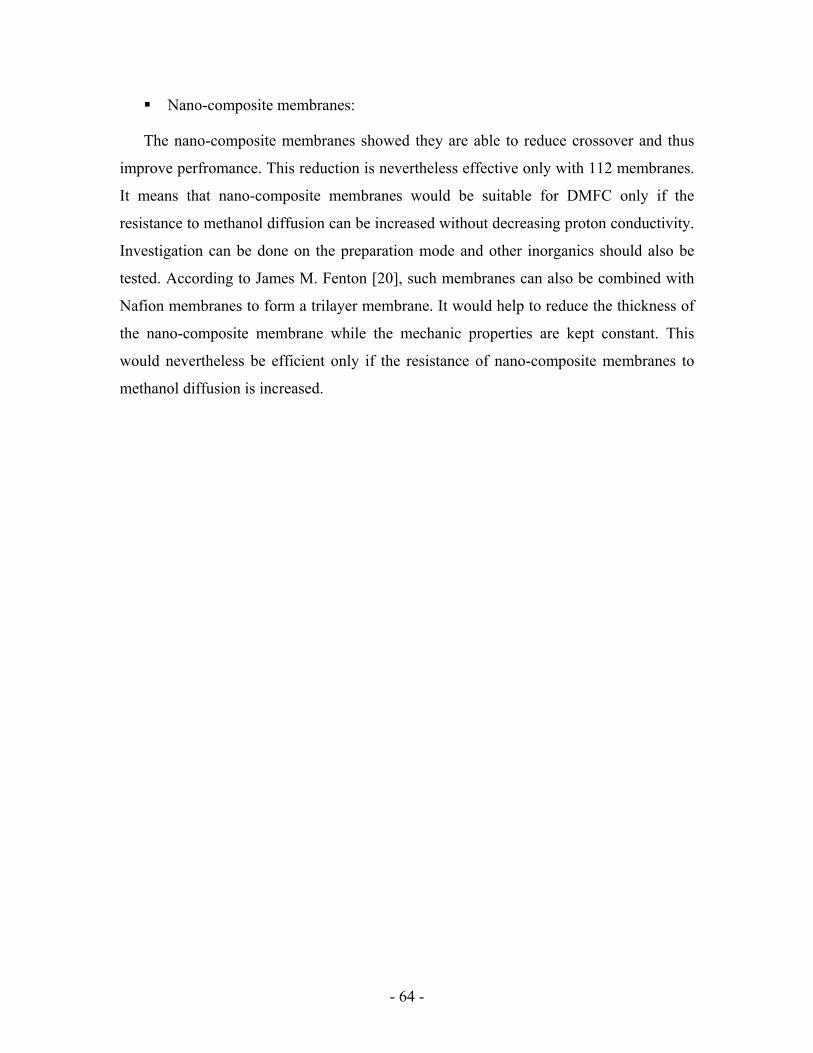
- 64 -
Nano-composite membranes:
The nano-composite membranes showed they are able to reduce crossover and thus
improve perfromance. This reduction is nevertheless effective only with 112 membranes.
It means that nano-composite membranes would be suitable for DMFC only if the
resistance to methanol diffusion can be increased without decreasing proton conductivity.
Investigation can be done on the preparation mode and other inorganics should also be
tested. According to James M. Fenton [20], such membranes can also be combined with
Nafion membranes to form a trilayer membrane. It would help to reduce the thickness of
the nano-composite membrane while the mechanic properties are kept constant. This
would nevertheless be efficient only if the resistance of nano-composite membranes to
methanol diffusion is increased.
- 65 -
IV. Dynamic modeling of the DMFC
A dynamic model was developed to model the evolution of the cell performance with
time (anode and cathode potential, adsorbed species coverage and cell current) for a fixed
cell voltage. This model was subsequently used to calculate the cell current density at
steady state for various cell voltages to obtain the polarization curve.
1. Reaction mechanism for methanol oxidation
This model was mainly based on the one used by Sundmacher et al [11].
The methanol oxidation mechanism used is the following:
(1): CH3OH + 3Pt Pt3-COH + 3H+ + 3e-
(2): H2O + Ru Ru-OH + H+ + e-
(3): Pt3-COH + 2Ru-OH Pt-COOH + H2O + 2Pt + 2Ru
(4): Pt-COOH + Ru-OH CO2 + H2O + Pt + Ru
The overall oxygen reduction reaction used is the following:
The assumption is made that water is only adsorbed on ruthenium sites whereas
methanol and its oxidation products can only be found on platinum sites.
(c): 3/2 O2 + 6H+ + 6e- 3H2O
Reaction rates:
−−
= −COHPtAOHCHPtA TRF
KC
RTF
kr33 .
exp1exp1
3111 θηθη
α
−−
= −OHRuARuA TR
FKRT
Fkr θηθη
α.
exp1exp1
222
- 66 -
−= −−−
22
3
233 .1
3 RuPtCOOHPtOHRuCOHPt Kkr θθθθθ
( )RuOHCOOHPtkr θθ −= 44
Both reaction 4 and the oxygen reduction reaction were considered as irreversible.
−−
=
23
2exp1expθ
ηηα
PP
RTF
RTF
kr OCC
CCC
2. Material balance on anode side
Six differential equations are needed to describe the system. The first one gives the
rate of variation of methanol concentration in the anode compartment assumed to be well
mixed. Three more equations are needed for the coverage of adsorbed species and two for
the anodic and the cathodic over potentials.
The methanol solution in the feed channel was considered to be in direct contact with
the catalytic layer although we know that at high current density this is not so due to back
diffusion of CO2. It is necessary to consider losses of methanol due to crossover. The flux
of methanol through the membrane is written: NCH3OH.
(a) ( ) 13333 1 r
VA
NVA
CCdt
dC SOHCH
SOHCH
FOHCH
OHCH −−−=τ
(b) ( )3113 rrCdt
d
t
COHPt −= ∗
−
γθ
(c) ( )432 231 rrrCdt
d
t
OHRu −−= ∗−
γθ
(d) ( )431 rrCdt
d
t
COOHPt −= ∗−
γθ
(e) ( )( )21 331 rrFiCdt
dCell
a
A +−=η
(f) ( )( )OHCHCellc
c NrFiCdt
d3561
+−−=η

- 67 -
Where: QV
=τ
This system can be solved if we have an expression for the methanol crossover flux.
Methanol is transported through the membrane by convection and diffusion.
vCdz
dCDN M
OHCH
MM
OHCHOHCHOHCH
3333 +−= where v is the convective flow velocity.
Sundmacher et al [1] gives an expression for v. It was deduced from Schlogl’s
expression for v and the Nernst-Plank equation for proton transport through the
membrane:
dzdPk
kC
TRD
dzdPkC
Fi
kv P
MH
MH
PMH
Cell
..
.
...
µµ
µµ φ
φ −
+
+=
+
+
+
where MCA
dPP
dzdP −
=
Knowing an expression for v, the previous equation can be solved analytically.
1)exp()exp(... 3
33 −
=Pe
PePeCd
DN OHCHM
MOHCH
OHCH where MOHCH
M
DdvPe
3
.= is the Peclet number
A code was written on Matlab (See Appendix) to solve these equations in which
operating conditions were given. To be consistent with experimental data, this code
computes the cell current density for a given cell voltage. In order to do this, the current
density should be expressed as a function of the cell voltage and anode and cathode over
potential.
( )CAM
M
Cell UUd
i ηηκ−+−−= 0

- 68 -
3. Simulation
a. Initial conditions and parameters
The code was used the model the cell current density for a cell working under the
following conditions:
T = 353K Q = 1ccm = 1.67.10-8 m3/s
CCH3OH = 1000 mol/m3 PA = 101325 Pa
PC = 101325 Pa
Rate constants are unknown as well as double layer capacitance. They were guessed
by trial and error. First, calculations were done with values provided by Sundmacher et
al. These parameters are valid at 80ºC. Consequently this model can only be used at this
temperature or else new fitted parameters need to be found.
Table 1: Parameter values employed in the model
The following initial conditions have been used:
CCH3OH = 1000 mol/m3 ΘPt3-COH = 0
ΘRu-OH = 0 ΘPt-COOH = 0
ηA = 0 V ηC = 0 V
V = 2.10-7 m3
T = 353K
γ = 100
CA = 4.105 F/ m2
α1 = 0.5
αC = 0.5
R = 8.314 J/mol.K
DMH
+ = 5.4.10-9 m2/s
kΦ = 1.13.10-19 m2
U0 = 1.21V
Q = 1ccm = 1.67.10-8 m3/s
AS = 5.10-4m2
Ct* = 2.2.10-5 mol/m2
CC = 8.105 F/ m2
α2 = 0.5
F = 96485
C M H
+ = 1200 mol/m3
kP = 1.57.10-18 m2
µ = 3.353.10-4 kg/m.s
κM = 17 Ω-1.m-1
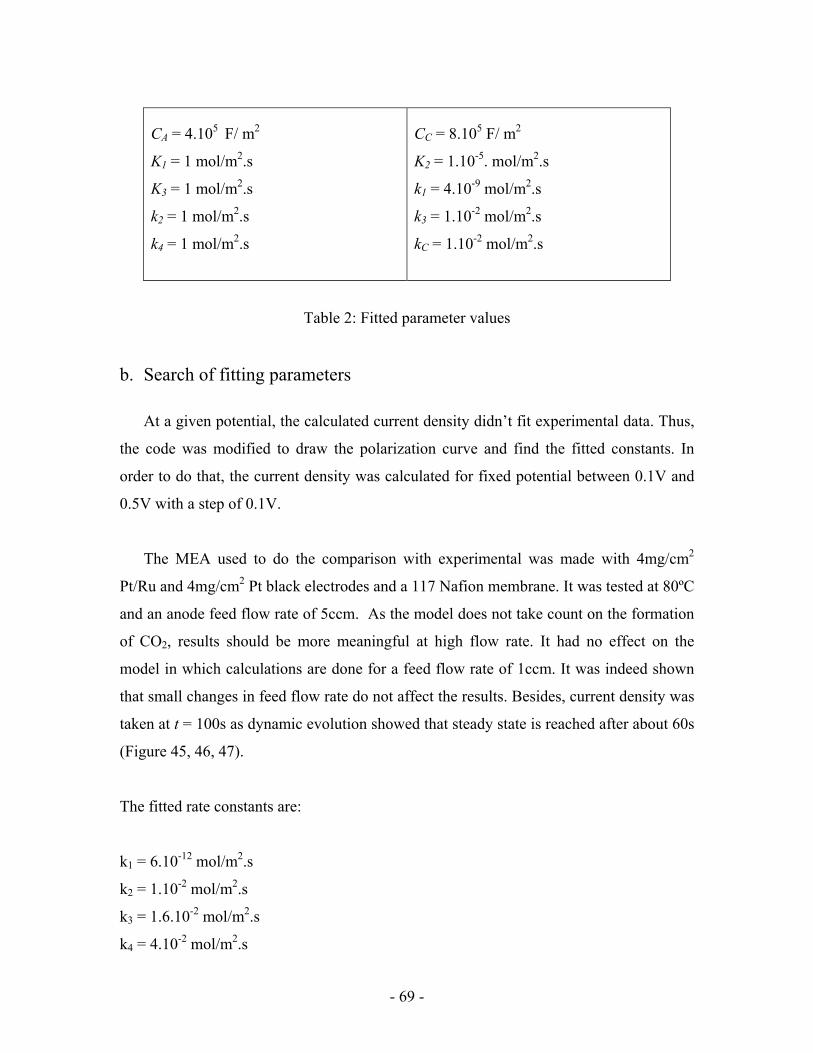
- 69 -
Table 2: Fitted parameter values
b. Search of fitting parameters
At a given potential, the calculated current density didn’t fit experimental data. Thus,
the code was modified to draw the polarization curve and find the fitted constants. In
order to do that, the current density was calculated for fixed potential between 0.1V and
0.5V with a step of 0.1V.
The MEA used to do the comparison with experimental was made with 4mg/cm2
Pt/Ru and 4mg/cm2 Pt black electrodes and a 117 Nafion membrane. It was tested at 80ºC
and an anode feed flow rate of 5ccm. As the model does not take count on the formation
of CO2, results should be more meaningful at high flow rate. It had no effect on the
model in which calculations are done for a feed flow rate of 1ccm. It was indeed shown
that small changes in feed flow rate do not affect the results. Besides, current density was
taken at t = 100s as dynamic evolution showed that steady state is reached after about 60s
(Figure 45, 46, 47).
The fitted rate constants are:
k1 = 6.10-12 mol/m2.s
k2 = 1.10-2 mol/m2.s
k3 = 1.6.10-2 mol/m2.s
k4 = 4.10-2 mol/m2.s
CA = 4.105 F/ m2
K1 = 1 mol/m2.s
K3 = 1 mol/m2.s
k2 = 1 mol/m2.s
k4 = 1 mol/m2.s
CC = 8.105 F/ m2
K2 = 1.10-5. mol/m2.s
k1 = 4.10-9 mol/m2.s
k3 = 1.10-2 mol/m2.s
kC = 1.10-2 mol/m2.s
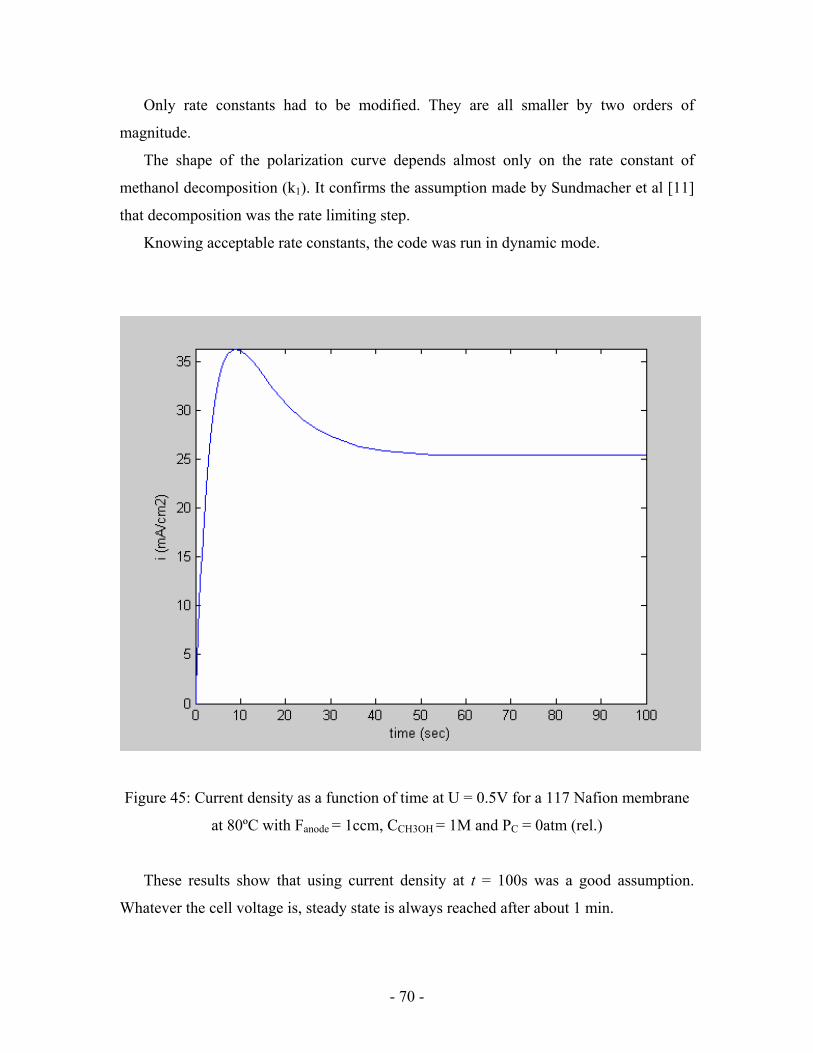
- 70 -
Only rate constants had to be modified. They are all smaller by two orders of
magnitude.
The shape of the polarization curve depends almost only on the rate constant of
methanol decomposition (k1). It confirms the assumption made by Sundmacher et al [11]
that decomposition was the rate limiting step.
Knowing acceptable rate constants, the code was run in dynamic mode.
Figure 45: Current density as a function of time at U = 0.5V for a 117 Nafion membrane
at 80ºC with Fanode = 1ccm, CCH3OH = 1M and PC = 0atm (rel.)
These results show that using current density at t = 100s was a good assumption.
Whatever the cell voltage is, steady state is always reached after about 1 min.
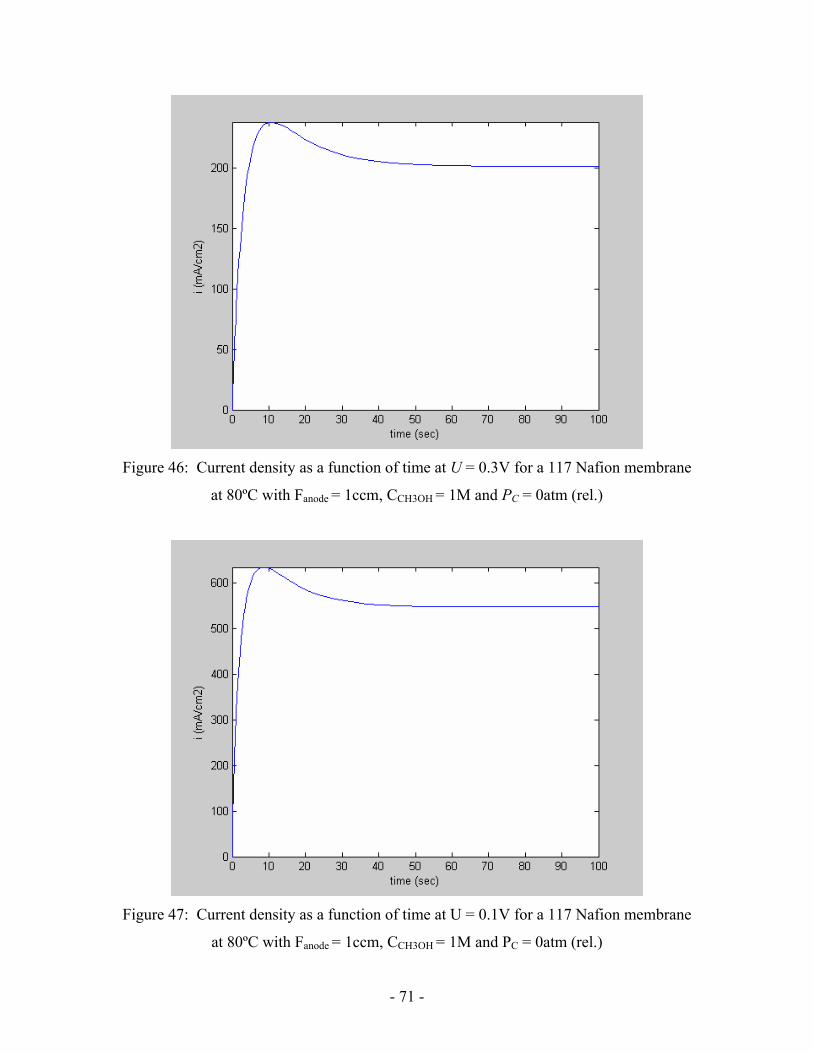
- 71 -
Figure 46: Current density as a function of time at U = 0.3V for a 117 Nafion membrane
at 80ºC with Fanode = 1ccm, CCH3OH = 1M and PC = 0atm (rel.)
Figure 47: Current density as a function of time at U = 0.1V for a 117 Nafion membrane
at 80ºC with Fanode = 1ccm, CCH3OH = 1M and PC = 0atm (rel.)
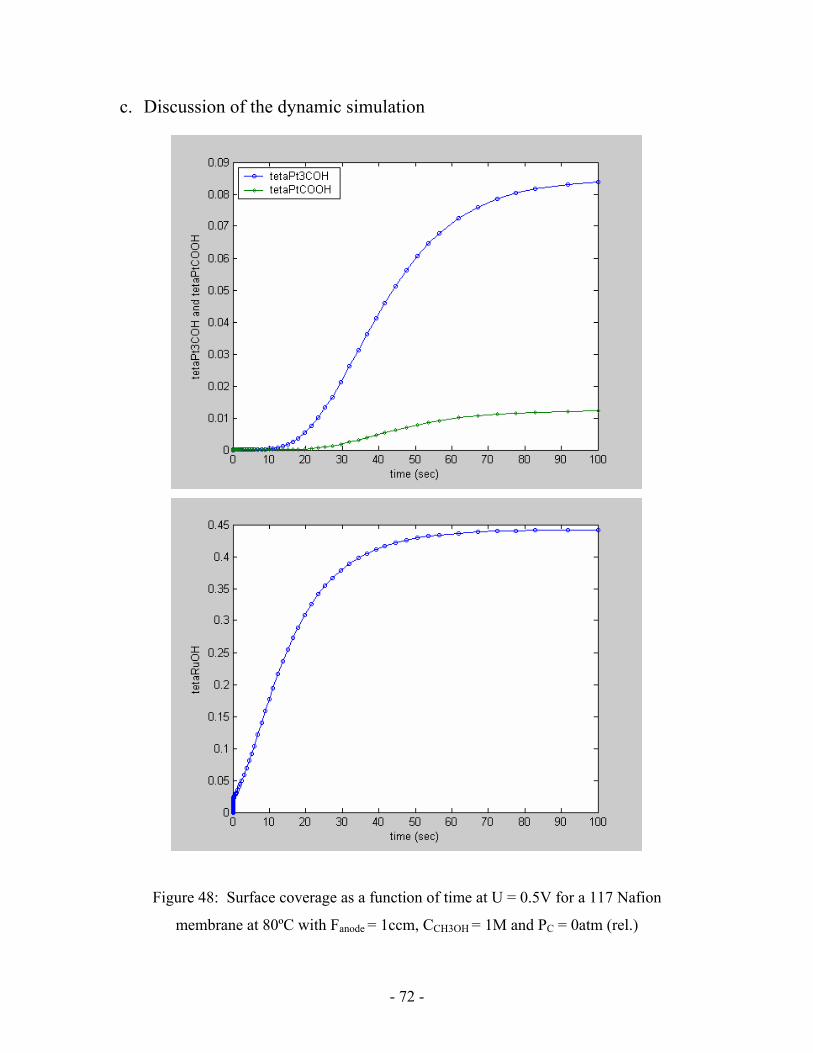
- 72 -
c. Discussion of the dynamic simulation
Figure 48: Surface coverage as a function of time at U = 0.5V for a 117 Nafion
membrane at 80ºC with Fanode = 1ccm, CCH3OH = 1M and PC = 0atm (rel.)
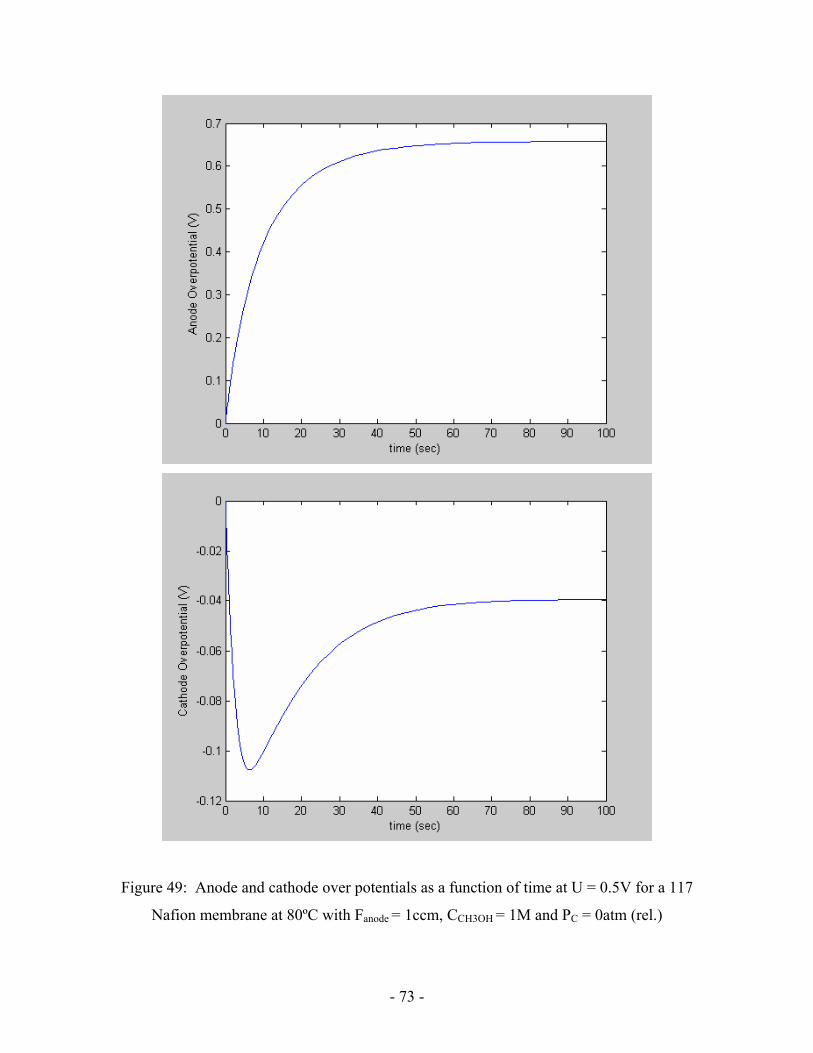
- 73 -
Figure 49: Anode and cathode over potentials as a function of time at U = 0.5V for a 117
Nafion membrane at 80ºC with Fanode = 1ccm, CCH3OH = 1M and PC = 0atm (rel.)
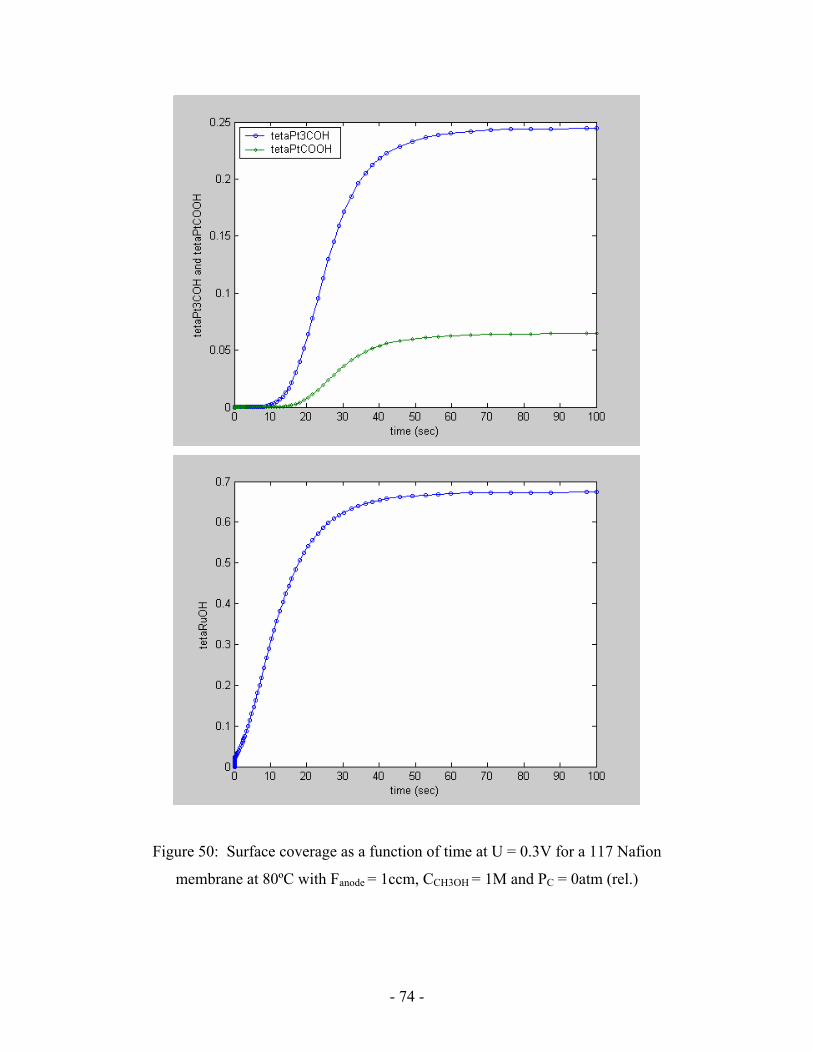
- 74 -
Figure 50: Surface coverage as a function of time at U = 0.3V for a 117 Nafion
membrane at 80ºC with Fanode = 1ccm, CCH3OH = 1M and PC = 0atm (rel.)
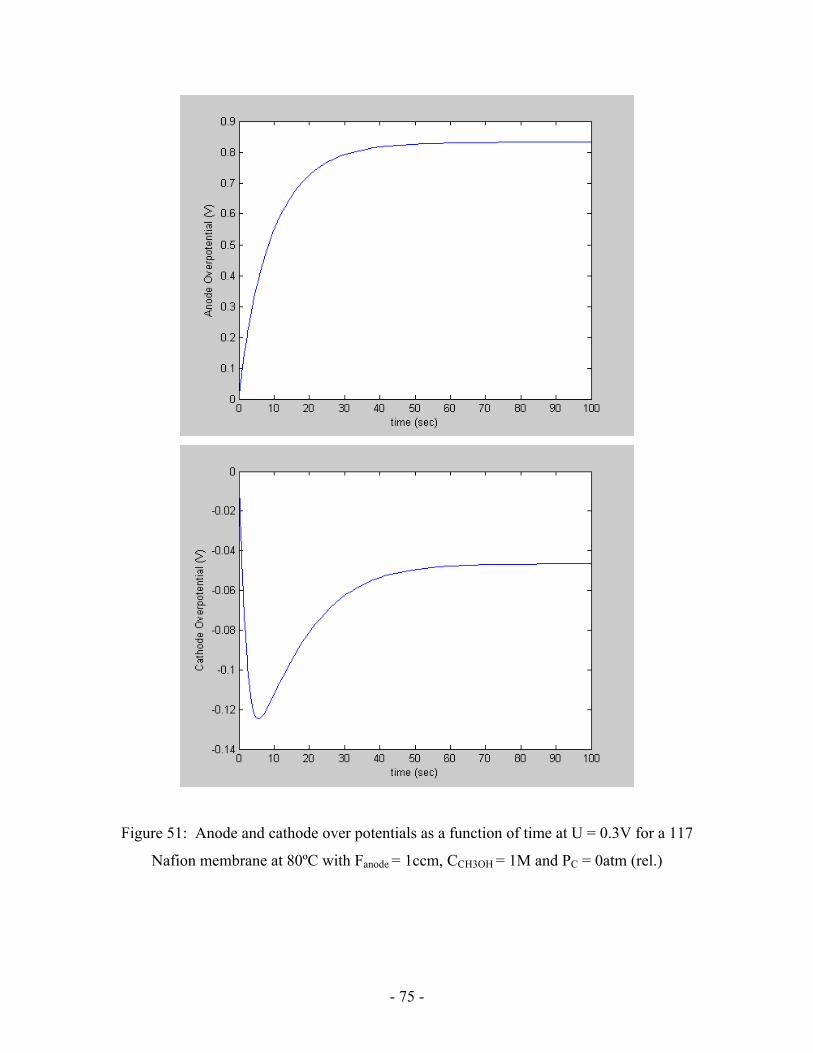
- 75 -
Figure 51: Anode and cathode over potentials as a function of time at U = 0.3V for a 117
Nafion membrane at 80ºC with Fanode = 1ccm, CCH3OH = 1M and PC = 0atm (rel.)

- 76 -
Figure 52: Surface coverage as a function of time at U = 0.1V for a 117 Nafion
membrane at 80ºC with Fanode = 1ccm, CCH3OH = 1M and PC = 0atm (rel.)
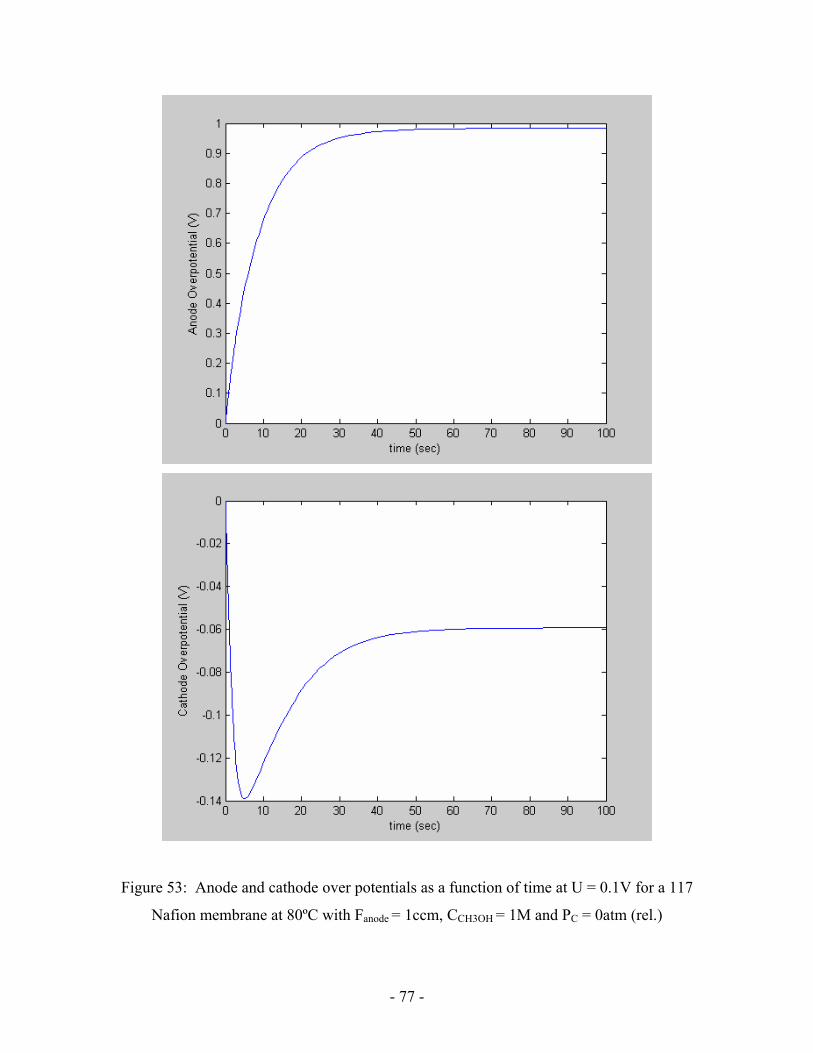
- 77 -
Figure 53: Anode and cathode over potentials as a function of time at U = 0.1V for a 117
Nafion membrane at 80ºC with Fanode = 1ccm, CCH3OH = 1M and PC = 0atm (rel.)
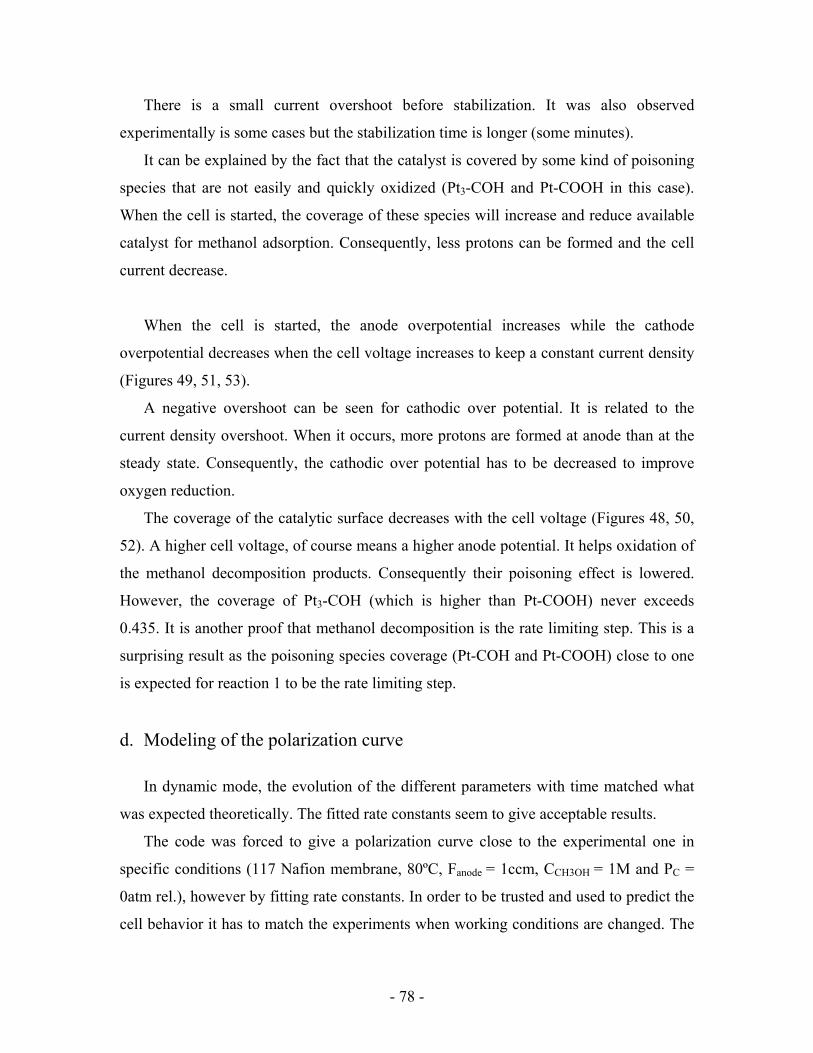
- 78 -
There is a small current overshoot before stabilization. It was also observed
experimentally is some cases but the stabilization time is longer (some minutes).
It can be explained by the fact that the catalyst is covered by some kind of poisoning
species that are not easily and quickly oxidized (Pt3-COH and Pt-COOH in this case).
When the cell is started, the coverage of these species will increase and reduce available
catalyst for methanol adsorption. Consequently, less protons can be formed and the cell
current decrease.
When the cell is started, the anode overpotential increases while the cathode
overpotential decreases when the cell voltage increases to keep a constant current density
(Figures 49, 51, 53).
A negative overshoot can be seen for cathodic over potential. It is related to the
current density overshoot. When it occurs, more protons are formed at anode than at the
steady state. Consequently, the cathodic over potential has to be decreased to improve
oxygen reduction.
The coverage of the catalytic surface decreases with the cell voltage (Figures 48, 50,
52). A higher cell voltage, of course means a higher anode potential. It helps oxidation of
the methanol decomposition products. Consequently their poisoning effect is lowered.
However, the coverage of Pt3-COH (which is higher than Pt-COOH) never exceeds
0.435. It is another proof that methanol decomposition is the rate limiting step. This is a
surprising result as the poisoning species coverage (Pt-COH and Pt-COOH) close to one
is expected for reaction 1 to be the rate limiting step.
d. Modeling of the polarization curve
In dynamic mode, the evolution of the different parameters with time matched what
was expected theoretically. The fitted rate constants seem to give acceptable results.
The code was forced to give a polarization curve close to the experimental one in
specific conditions (117 Nafion membrane, 80ºC, Fanode = 1ccm, CCH3OH = 1M and PC =
0atm rel.), however by fitting rate constants. In order to be trusted and used to predict the
cell behavior it has to match the experiments when working conditions are changed. The
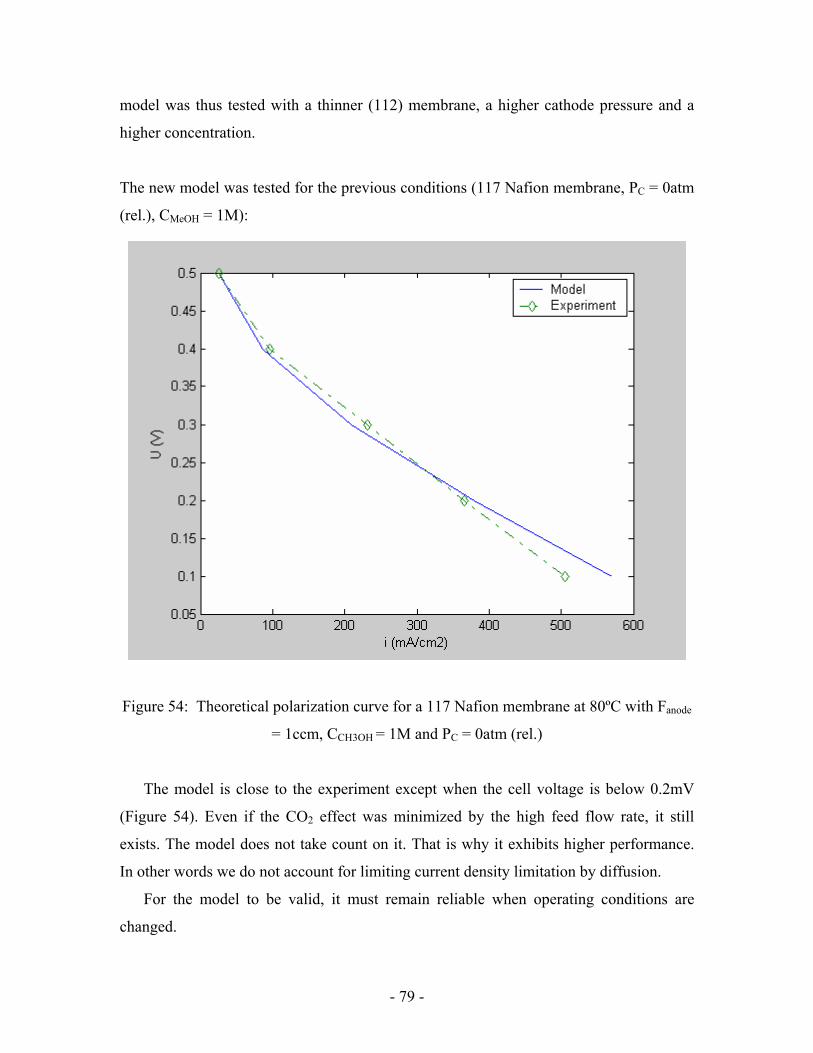
- 79 -
model was thus tested with a thinner (112) membrane, a higher cathode pressure and a
higher concentration.
The new model was tested for the previous conditions (117 Nafion membrane, PC = 0atm
(rel.), CMeOH = 1M):
Figure 54: Theoretical polarization curve for a 117 Nafion membrane at 80ºC with Fanode
= 1ccm, CCH3OH = 1M and PC = 0atm (rel.)
The model is close to the experiment except when the cell voltage is below 0.2mV
(Figure 54). Even if the CO2 effect was minimized by the high feed flow rate, it still
exists. The model does not take count on it. That is why it exhibits higher performance.
In other words we do not account for limiting current density limitation by diffusion.
For the model to be valid, it must remain reliable when operating conditions are
changed.

- 80 -
Thus it was tested for 112 Nafion membrane, PC = 0atm (rel.), CMeOH = 1M:
Figure 55: Theoretical polarization curve for a 112 Nafion membrane at 80ºC with Fanode
= 5ccm, CCH3OH = 1M and PC = 0atm (rel.)
For a 112 Nafion membrane, theory and experiment fit well above 0.3V (Figure 55).
Again this may be due to CO2 formation. Such a difference at low cell voltage can be
completely due to the low methanol diffusion due to CO2 evolution. In addition we were
not accounted for fouling of the cathode by the methanol that is crossing over to the
cathode. The original code was modified to account for fouling of the cathode.
Differential equations (a) to (e) appeared two times in the system, one time to describe
methanol oxidation at the anode and a second time to describe methanol oxidation at the
cathode side. It had nevertheless no effect on the final results. This may be due to an
underestimation of methanol crossover by the model. Another reason may be that
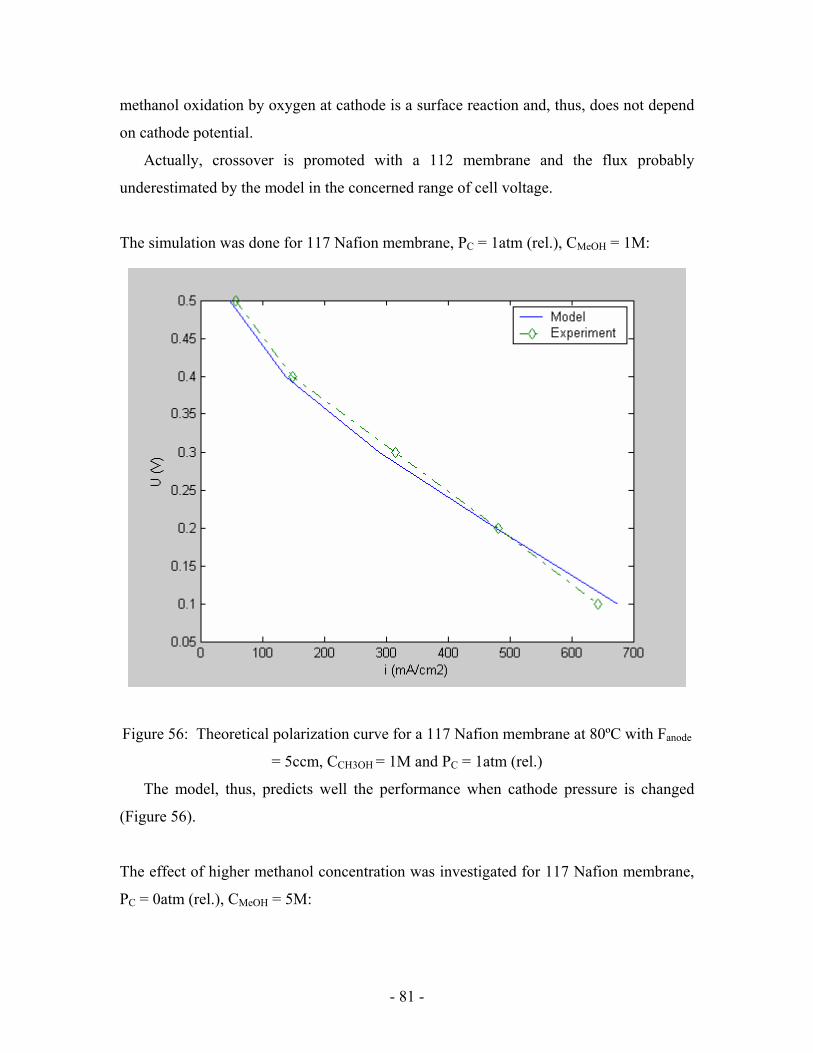
- 81 -
methanol oxidation by oxygen at cathode is a surface reaction and, thus, does not depend
on cathode potential.
Actually, crossover is promoted with a 112 membrane and the flux probably
underestimated by the model in the concerned range of cell voltage.
The simulation was done for 117 Nafion membrane, PC = 1atm (rel.), CMeOH = 1M:
Figure 56: Theoretical polarization curve for a 117 Nafion membrane at 80ºC with Fanode
= 5ccm, CCH3OH = 1M and PC = 1atm (rel.)
The model, thus, predicts well the performance when cathode pressure is changed
(Figure 56).
The effect of higher methanol concentration was investigated for 117 Nafion membrane,
PC = 0atm (rel.), CMeOH = 5M:
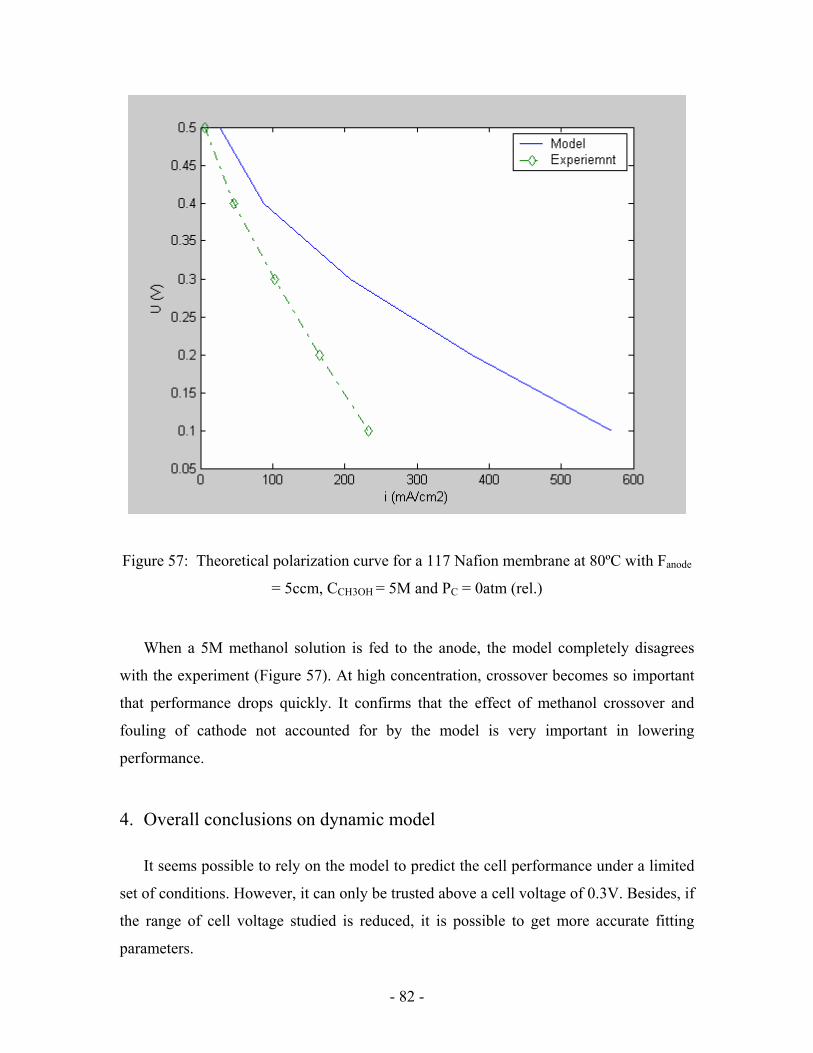
- 82 -
Figure 57: Theoretical polarization curve for a 117 Nafion membrane at 80ºC with Fanode
= 5ccm, CCH3OH = 5M and PC = 0atm (rel.)
When a 5M methanol solution is fed to the anode, the model completely disagrees
with the experiment (Figure 57). At high concentration, crossover becomes so important
that performance drops quickly. It confirms that the effect of methanol crossover and
fouling of cathode not accounted for by the model is very important in lowering
performance.
4. Overall conclusions on dynamic model
It seems possible to rely on the model to predict the cell performance under a limited
set of conditions. However, it can only be trusted above a cell voltage of 0.3V. Besides, if
the range of cell voltage studied is reduced, it is possible to get more accurate fitting
parameters.
- 83 -
The model does not accurately account for the cathode overpotential which it
underestimates substantially. Further, the model does not take into consideration the
inhibition of cathode kinetics as a result of methanol crossover. Finally, the diffusion
limitations of methanol through gas-diffusion layer, especially at higher current densities
and CO2 evolution, are not included in the model and account for variation at low
voltage. Sundmacher et al [11] accounted for the diffusion through the diffusion layer by
considering a mass balance for Methanol and carbon dioxide both for the anode
compartment and the catalytic layer. A code similar to the code studied previously was
written including these two mass balances. It resulted in a modification in the fitted
parameters but the shape of the coverage, potentials, and current evolution with time
remained the same. This code still not account for methanol diffusion limitation due to
carbon dioxide removal.

- 84 -
V. Reaction Network Theory applied to the electro-chemical
oxidation of methanol
Several mathematical models have been developed for methanol electro-oxidation.
They use an oversimplified mechanism for the reaction considering only one or two
intermediate species. However, the real mechanism is much more complicated and most
steps remain unknown.
1. Reaction Network Theory
The new graph-theoretical approach developed by Fishtik et al [21] was used in an
effort to improve our understanding of methanol electro-oxidation reaction and its
mechanism. This approach is based on Reaction Route Graphs which depict all possible
succession of reactions (Reaction Route) that lead to the studied overall reaction. It
should be noted that in this case, the nodes do not represent a particular species. The
drawing of this type of graph implies the knowledge of the complete mechanism or at
least an assumption since every branch corresponds to a step in the mechanism.
An analogy can be made between these graphs and electrical networks. Besides, the
concept of reaction resistance was introduced [22]. This allows the use of both
Kirchhoff’s and Ohm’s law in order to analyze and reduce the network. The reaction
resistance is defined as the mean value of the reciprocal rate (similar to a conductance)
between the reverse and forward rate.
PP
P
P
PP
rr
rrln
r1R ←→
←
→
−
==
To calculate the resistance one needs an expression for the forward and reverse
reaction rate of elementary step. Assuming that rate constants follow Arrhenius law,
activation energies and pre-exponential factors can be calculated from a thermodynamic
transition state model. By evaluating and comparing the resistances along parallel
- 85 -
pathways between two nodes, some of them can be neglected. Consequently, a clearer but
still representative mechanism is obtained.
Besides, the overall reaction rate (rOR) is easy to determine knowing the possible
Reaction Routes. In analogy to Ohm’s law it is a function of the overall reaction
resistance and affinity.
OR
OROR R
Ar =
Such an approach seems to be an efficient one to simplify the complicated methanol
oxidation mechanism and come up with a significant overall rate expression. However,
Reaction Network Theory has been studied for surface reaction in gas phase. There are
two challenges to face to adapt the method to methanol electro-oxidation in fuel cells.
The mechanism contains some electrochemical steps. For these, activation energy is
potential dependant. Consequently, a fundamental model should be found to express
them. Besides, the unity bond index-quadratic exponential potential method (UBI-QEP)
developed by Shustorovitch [23], valid in gas phase needs to be adapted to liquid phase
or be replaced by another ab initio model.
2. Methanol oxidation mechanism
The methanol oxidation overall reaction (OR) can be divided into two consecutive
overall reactions. The first one is methanol decomposition into carbon monoxide. The
second one is the water-gas shift reaction (WGSR).
OR1: CH3OH + 4H2O CO + 4H3O+ + 4e- (MeOH decomposition)
OR2: CO + 3H2O CO2 + 2H3O+ + 2e- (WGSR)
CH3OH + 7H2O CO2 + 6H3O+ + 6e- (MeOH electro-oxidation)
In order to draw an overall of graph for methanol oxidation it seems easier to draw a
graph for each of the consecutive reactions and then try to connect them together.
- 86 -
Even if a bimetallic catalyst is used in electro-oxidation of methanol the assumption
was made that all adsorbates diffuse quickly to the interface between both catalysts. It
can thus be considered that all reactions occur on the site kind of site.
The methanol decomposition was investigated by Gokhale et al [24] who reported a
mechanism for decomposition of methanol on copper.
The mechanism needed to be adapted to the electro-chemical reaction that was
studied. Original steps which form adsorbed hydrogen were considered as
electrochemical. Consequently, they form a hydronium ion and an electron. The
assumption that all these steps become electrochemical is certainly not true. However, it
makes a good starting point.
The mechanism contains twelve steps for OR1:
s1: CH3OH CH3OHS
s2: CH3OHS + H2O CH3OS + H3O+ + e-
s3: CH3OS + H2O CH2OS + H3O+ + e-
s4: CH2O+ H2O HCOS + H3O+ + e-
s5: HCOS + H2O COS + H3O+ + e-
s6: CH3OHS + H2O H2COHS + H3O+ + e-
s7: H2COHS + H2O HCOHS + H3O+ + e-
s8: HCOHS + H2O COHS + H3O+ + e-
s9: COHS + H2O COS + H3O+ + e-
s10: HCOHS + H2O COS + 2H3O+ + e-
s11: H2COHS + H2O CH2OS + H3O+ + e-
s12: COS CO + S
Methanol is dehydrogenated to form different intermediates. For the same chemical
formula, adsorbates can have different structures. All those steps are considered to occur
on platinum.
Fishtik et al [22] reported a mechanism for the Water-Gas Shift Reaction on copper.
It was slightly changed to be adapted to the electro-oxidation that occurs in a methanol
fuel cell. Steps which form adsorbed hydrogen were again considered as electrochemical.

- 87 -
Besides, this assumption prevents dihydrogen formation. Consequently, steps including
this adsorbate were not considered.
Thus, twelve reactions remain:
S12: COS CO + S
s13: H2O + S H2OS
s14: H2OS + OS 2OHS
s15: 2H2O + S OHS + H3O+ + e-
s16: OHS + H2O OS + H3O+ + e-
s17: COS + OS CO2S + S
s18: COS + OHS HCOOS + S
s19: COS + OHS + H2O CO2S + S + H3O+ + e-
s20: HCOOS + OS CO2S + OHS
s21: HCOOS + H2O CO2S + H3O+ + e-
s22: HCOOS + OHS CO2S + H2OS
s23: CO2S CO2 + S
Steps 14 to 17 occur on ruthenium and correspond to water adsorption. This
mechanism show such adsorbates as carbon monoxide and formic acid are intermediates
in methanol electro-oxidation. However, according to Gojković et al [25], formic acid is
formed during methanol electro-oxidation. Other intermediates like HCOHS and COHS
appear in the reaction. COHS can react to form either CO or formaldehyde and formic
acid. This intermediate seems to have an important role in the overall reaction.
Reactions including COHS were taken from the Fuel Cell handbook [26]:
S24: COHS + OS HCOOS + S
S25: COHS + OS COS + OHS
S26: COHS + OHS HCOOS + S + H3O+ + e-
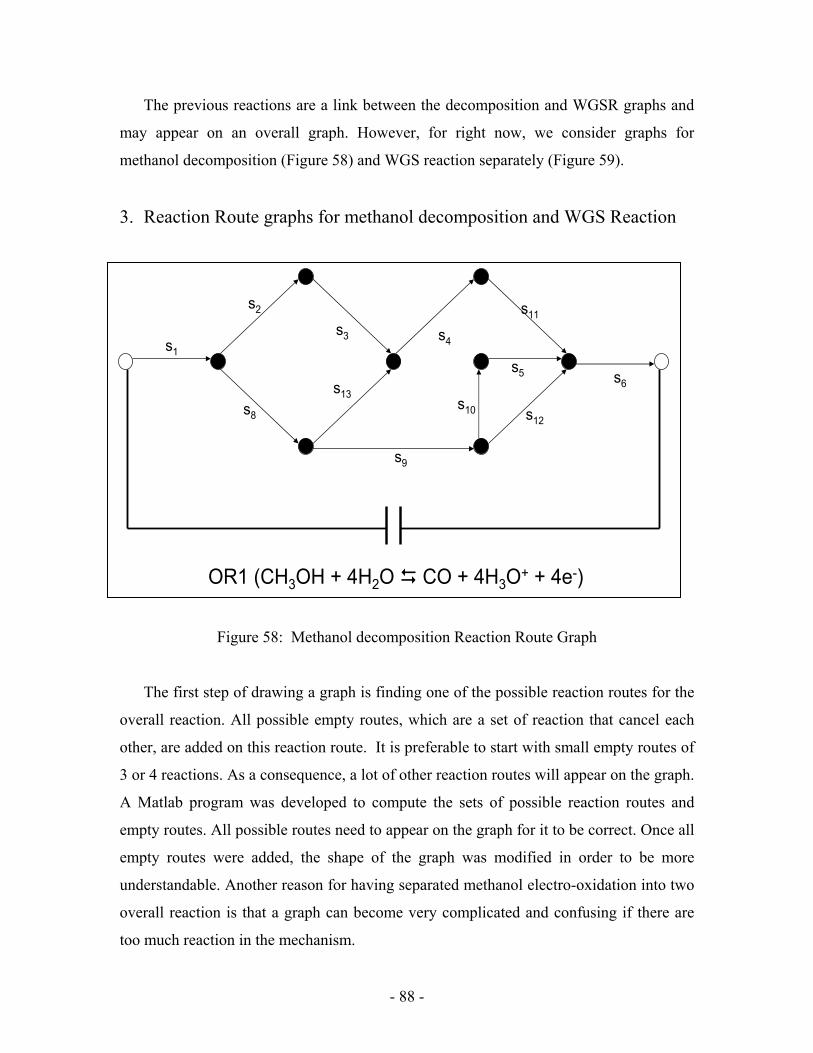
- 88 -
The previous reactions are a link between the decomposition and WGSR graphs and
may appear on an overall graph. However, for right now, we consider graphs for
methanol decomposition (Figure 58) and WGS reaction separately (Figure 59).
3. Reaction Route graphs for methanol decomposition and WGS Reaction
Figure 58: Methanol decomposition Reaction Route Graph
The first step of drawing a graph is finding one of the possible reaction routes for the
overall reaction. All possible empty routes, which are a set of reaction that cancel each
other, are added on this reaction route. It is preferable to start with small empty routes of
3 or 4 reactions. As a consequence, a lot of other reaction routes will appear on the graph.
A Matlab program was developed to compute the sets of possible reaction routes and
empty routes. All possible routes need to appear on the graph for it to be correct. Once all
empty routes were added, the shape of the graph was modified in order to be more
understandable. Another reason for having separated methanol electro-oxidation into two
overall reaction is that a graph can become very complicated and confusing if there are
too much reaction in the mechanism.
OR1 (CH3OH + 4H2O CO + 4H3O+ + 4e-)
s1s4
s8
s2
s3
s13
s5 s6
s9
s12
s11
s10
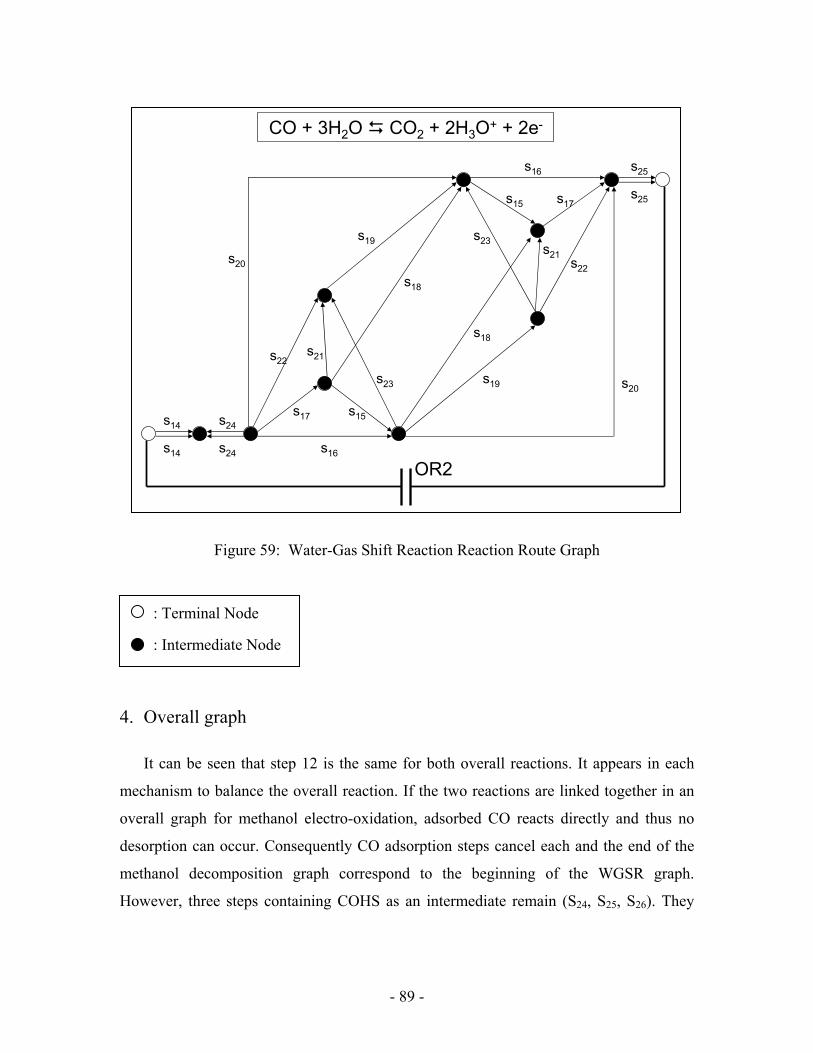
- 89 -
Figure 59: Water-Gas Shift Reaction Reaction Route Graph
4. Overall graph
It can be seen that step 12 is the same for both overall reactions. It appears in each
mechanism to balance the overall reaction. If the two reactions are linked together in an
overall graph for methanol electro-oxidation, adsorbed CO reacts directly and thus no
desorption can occur. Consequently CO adsorption steps cancel each and the end of the
methanol decomposition graph correspond to the beginning of the WGSR graph.
However, three steps containing COHS as an intermediate remain (S24, S25, S26). They
: Terminal Node
: Intermediate Node
OR2
CO + 3H2O CO2 + 2H3O+ + 2e-
s15s17
s16
s25
s25
s24
s24
s14
s14
s16
s21
s20
s20
s22
s23
s23s21
s15 s17
s22
s19
s18
s18
s19
- 90 -
belong to the overall graph and need to be added to it. The easiest way to add the three
remaining steps is to find empty routes that include all of them.
The two following empty routes contain all three steps:
• S26 - S27 + S19 = 0
• S26 - S28 + S17 = 0
These empty routes have to be added on the WGSR graph. Both of them contain S26.
Unfortunately, the sequence of the reaction makes those empty routes impossible to fit in
the graph. Thus, either a new graph need to be draw using the overall methanol oxidation
reaction or COHS can be omitted. The latter solution was adopted here. Actually,
according to the state of the art in Reaction Route Graph theory, such a graph would be
too difficult to draw.
5. Overall conclusions
The two graphs that are drawn here are a starting point for a detailed study of the
electro-oxidation of methanol. Even tough, it is not complete it would make possible to
identify the important steps and those which are limiting the reaction provided reaction
kinetics of the steps are available.
Unfortunately, it was not possible to find a way to calculate the activation energy of
electro-chemical steps as a function of the electrode potential. A method based on
calculations of the energy of the complex formed during the reaction has been developed
by Anderson [27]. It needs a program which can calculate this energy right before and
after the reaction. It was not possible to investigate this further in this study because of a
lack of time.
- 91 -
VI. Conclusions and recommendations for future work
According to experimental investigations, home-made electrodes were found to be
much more efficient than commercial electrodes for the Direct Methanol Fuel Cells.
Besides, these investigations permitted us to understand the role played by various MEA
components on the cell performance.
Methanol diffusion through the membrane is of course well known, but its diffusion
through the electrode backing was also revealed to be an important issue limiting
performance. It was found to be difficult to control the balance between the flux of
methanol and the flux of carbon dioxide which escapes the catalytic layer. This balance
depends up on the Nafion and PTFE loading in the anode catalytic layer and the structure
of the hydrophilic and hydrophobic pores created. PTFE loading may also have to be
adjusted in the carbon cloth or in the resistance layer if it is used. The balance depends
however on the operating point. Best performance were obtained with a 4mg/cm2 Pt/Ru
black anode and 4mg/cm2 Pt black cathode on a 117 membrane. No PTFE was used and
the optimum Nafion loading at cathode was 10wt%. However, the optimum Nafion
loading at anode changed with the cell voltage. At high cell voltage and low current
densities it was 10wt%, but below 0.25V, it the optimum Nafion loading became 5wt%.
The two-phase flow was not only posing problems in the diffusion layer but also in
the feed channel. A slug flow reduces liquid phase diffusion area. This kind of flow is a
great limitation to the cell performance and need to be avoided. Both methanol and
carbon dioxide diffusion are strongly dependent on the diffusion layer, which was a piece
of carbon cloth in this study. The carbon cloth remained the same and was already Teflon
treated. It would be interesting to test non-treated carbon cloth. As seen during the study
on PTFE content at anode and the resistance layer, PTFE can have a great effect on both
methanol and CO2 diffusion. The behavior of the diffusion layer toward diffusion may be
drastically different with non-treated carbon cloth. A carbon cloth with another density
may also be tested.
Conclusions were drawn for our cell station and some of them may not be true more
frequently for other equipment. The stack itself might change some of the results that
were obtained. For example, working with new bipolar plates or with 25cm2 electrodes
- 92 -
could change CO2 management and lead to other observations. It could also possibly
promote some solution considered to improve performance.
The dynamic DMFC modeling was focused on the effect of the two-phase flow at the
anode but rather on the reaction mechanism. Even though it is highly simplified, this
mechanism is somewhat consistent with reality as it contains two intermediate poisoning
species. Their rate of reaction represents nevertheless a simplified global rate for a set of
reaction coming from a more complicated mechanism. It was however sufficient to give
reasonable predictions when operating conditions were changed. Rate constant in the
model were fitted. However, better predictions could be made if the model could make a
better estimate of the flux of methanol that diffuses to the cathode. The equation derived
by Sundmacher et al [11] for NCH3OH underestimate the flux. Fitting tests for the diffusion
coefficient of methanol could solve the problem. It needs to be replaced by a more
accurate expression.
Reaction route theory could give us a more precise idea on the importance of
adsorbed CO and COOH based on the two graphs developed in the study. It is a powerful
tool to study the mechanism. Unfortunately, at this point, computation of potential-
dependant activation energies is still an issue.
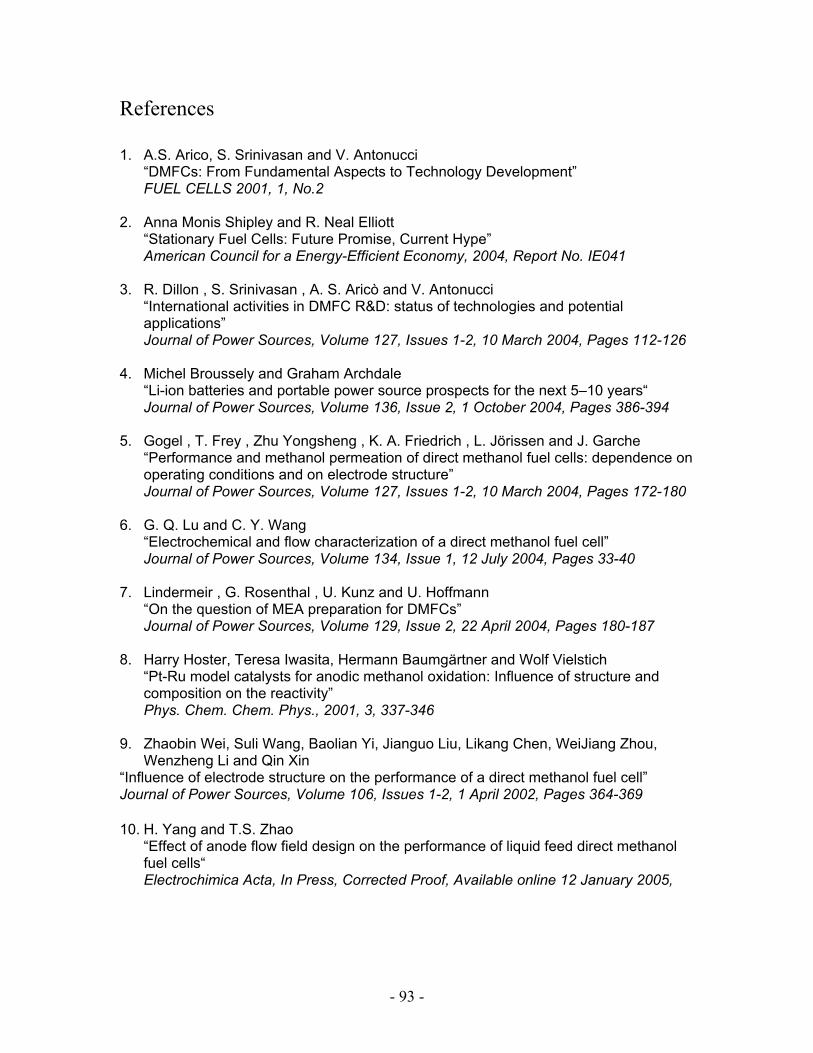
- 93 -
References 1. A.S. Arico, S. Srinivasan and V. Antonucci
“DMFCs: From Fundamental Aspects to Technology Development” FUEL CELLS 2001, 1, No.2
2. Anna Monis Shipley and R. Neal Elliott
“Stationary Fuel Cells: Future Promise, Current Hype” American Council for a Energy-Efficient Economy, 2004, Report No. IE041
3. R. Dillon , S. Srinivasan , A. S. Aricò and V. Antonucci “International activities in DMFC R&D: status of technologies and potential applications” Journal of Power Sources, Volume 127, Issues 1-2, 10 March 2004, Pages 112-126
4. Michel Broussely and Graham Archdale “Li-ion batteries and portable power source prospects for the next 5–10 years“ Journal of Power Sources, Volume 136, Issue 2, 1 October 2004, Pages 386-394
5. Gogel , T. Frey , Zhu Yongsheng , K. A. Friedrich , L. Jörissen and J. Garche “Performance and methanol permeation of direct methanol fuel cells: dependence on operating conditions and on electrode structure” Journal of Power Sources, Volume 127, Issues 1-2, 10 March 2004, Pages 172-180
6. G. Q. Lu and C. Y. Wang “Electrochemical and flow characterization of a direct methanol fuel cell” Journal of Power Sources, Volume 134, Issue 1, 12 July 2004, Pages 33-40
7. Lindermeir , G. Rosenthal , U. Kunz and U. Hoffmann “On the question of MEA preparation for DMFCs” Journal of Power Sources, Volume 129, Issue 2, 22 April 2004, Pages 180-187
8. Harry Hoster, Teresa Iwasita, Hermann Baumgärtner and Wolf Vielstich “Pt-Ru model catalysts for anodic methanol oxidation: Influence of structure and composition on the reactivity” Phys. Chem. Chem. Phys., 2001, 3, 337-346
9. Zhaobin Wei, Suli Wang, Baolian Yi, Jianguo Liu, Likang Chen, WeiJiang Zhou,
Wenzheng Li and Qin Xin “Influence of electrode structure on the performance of a direct methanol fuel cell” Journal of Power Sources, Volume 106, Issues 1-2, 1 April 2002, Pages 364-369 10. H. Yang and T.S. Zhao
“Effect of anode flow field design on the performance of liquid feed direct methanol fuel cells“ Electrochimica Acta, In Press, Corrected Proof, Available online 12 January 2005,
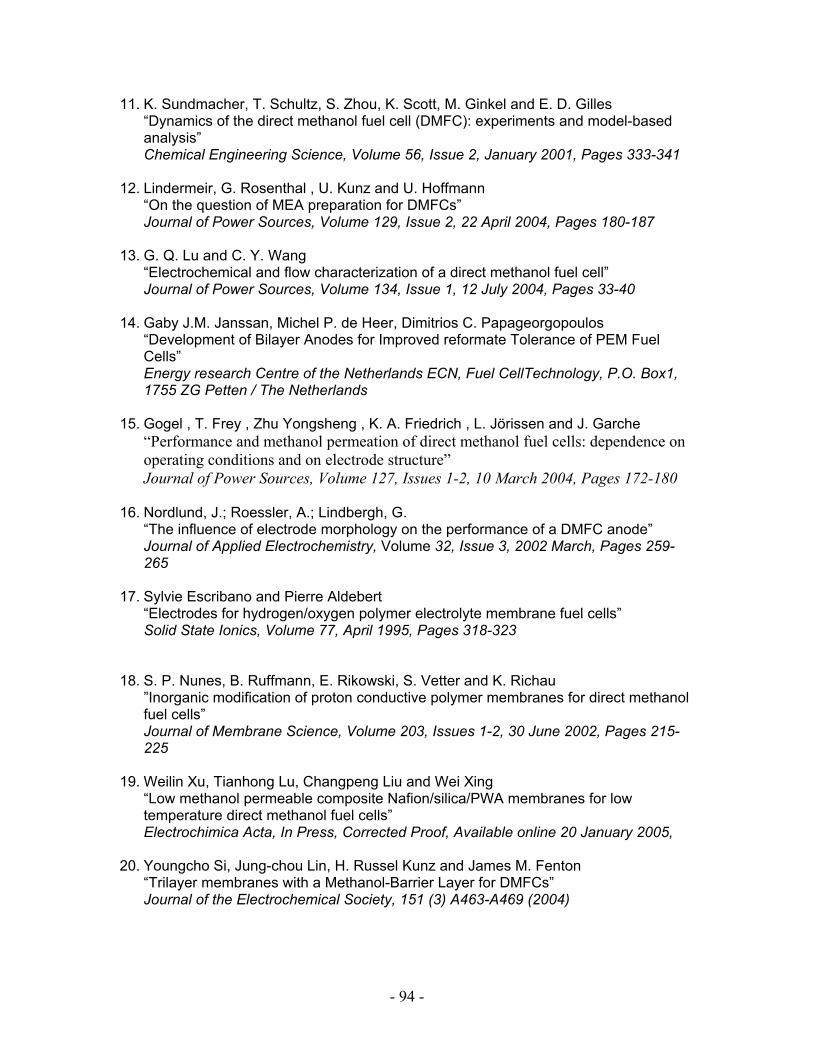
- 94 -
11. K. Sundmacher, T. Schultz, S. Zhou, K. Scott, M. Ginkel and E. D. Gilles “Dynamics of the direct methanol fuel cell (DMFC): experiments and model-based analysis” Chemical Engineering Science, Volume 56, Issue 2, January 2001, Pages 333-341
12. Lindermeir, G. Rosenthal , U. Kunz and U. Hoffmann “On the question of MEA preparation for DMFCs” Journal of Power Sources, Volume 129, Issue 2, 22 April 2004, Pages 180-187
13. G. Q. Lu and C. Y. Wang “Electrochemical and flow characterization of a direct methanol fuel cell” Journal of Power Sources, Volume 134, Issue 1, 12 July 2004, Pages 33-40
14. Gaby J.M. Janssan, Michel P. de Heer, Dimitrios C. Papageorgopoulos “Development of Bilayer Anodes for Improved reformate Tolerance of PEM Fuel Cells” Energy research Centre of the Netherlands ECN, Fuel CellTechnology, P.O. Box1, 1755 ZG Petten / The Netherlands
15. Gogel , T. Frey , Zhu Yongsheng , K. A. Friedrich , L. Jörissen and J. Garche
“Performance and methanol permeation of direct methanol fuel cells: dependence on operating conditions and on electrode structure” Journal of Power Sources, Volume 127, Issues 1-2, 10 March 2004, Pages 172-180
16. Nordlund, J.; Roessler, A.; Lindbergh, G. “The influence of electrode morphology on the performance of a DMFC anode” Journal of Applied Electrochemistry, Volume 32, Issue 3, 2002 March, Pages 259-265
17. Sylvie Escribano and Pierre Aldebert
“Electrodes for hydrogen/oxygen polymer electrolyte membrane fuel cells” Solid State Ionics, Volume 77, April 1995, Pages 318-323
18. S. P. Nunes, B. Ruffmann, E. Rikowski, S. Vetter and K. Richau ”Inorganic modification of proton conductive polymer membranes for direct methanol fuel cells” Journal of Membrane Science, Volume 203, Issues 1-2, 30 June 2002, Pages 215-225
19. Weilin Xu, Tianhong Lu, Changpeng Liu and Wei Xing “Low methanol permeable composite Nafion/silica/PWA membranes for low temperature direct methanol fuel cells” Electrochimica Acta, In Press, Corrected Proof, Available online 20 January 2005,
20. Youngcho Si, Jung-chou Lin, H. Russel Kunz and James M. Fenton “Trilayer membranes with a Methanol-Barrier Layer for DMFCs” Journal of the Electrochemical Society, 151 (3) A463-A469 (2004)
- 95 -
21. Ilie Fishtik, Caitlin A. Callaghan, and Ravindra Datta
“Reaction Route Graphs. I. Theory and Algorithm” J. Phys. Chem. B 2004, 108, 5671-5682
22. Ilie Fishtik, Caitlin A. Callaghan, and Ravindra Datta
“Reaction Route Graphs. II. Examples of Enzyme- and surface-Catalyzed Single Overall Reactions” J. Phys. Chem. B 2004, 108, 5683-5697
23. Harrell Sellers and Evgeny Shustorovich
“Intrinsic activation barriers and coadsorption effects for reactions on metal surfaces: unified formalism within the UBI-QEP approach“ Surface Science, 504, 2002, 167-182
24. Amit A. Gokhale, Shampa Kandoi, Jeffrey P. Greeley, Manos Mavrikakis and James
A. Dumesic “Molecular-level descriptions of surface chemistry in kinetic models using density functional theory” Chemical Engineering Science, Volume 59, Issues 22-23, November-December 2004, Pages 4679-4691
25. Snezana Lj. Gojković “Mass transfer effect in electrochemical oxidation of methanol at platinum electrocatalysts” Journal of Electroanalytical Chemistry, Volume 573, Issue 2, 1 December 2004, Pages 271-276
26. A.J. Appleby, F.R. Foulkes
“Fuel Cell Handbook (Sixth Edition)” CRC Press, ISBN: 0849308771 August, 2002
27. Alfred B. Anderson
“Theory at the electrochemical interface: reversible potentials and potential-dependent activation energies” Electrochimica Acta, Volume 48, Issues 25-26, 15 November 2003, Pages 3743-3749

- 96 -
Appendix
Main program for dynamic calculations at fixed cell voltage clear all; format long; global U global Q global CCH3OHF global Pa global Pc global icell global K1 global K2 global K3 global K4 global R global F global T global k1 global kc global k2 global k3 global k4 global alpha1 global alphaC global alpha2 global Ucell0 global kphi global mu global CprotM global kp global dM global DprotM global DCH3OHM global PO2 global Pteta global VA global kLS global AS global VACL global kappa global CA global CC global gamma global Ctstar
- 97 -
global tau global C0A global C1A global C0C global C1C global sigma global Czeta global Cteta global Const global KC global A global B global C global D global P %Kinetic parameters K1=1*10^-0; K2=1*10^-5; K3=1*10^0; k1=0.6*10^-11; k2=1.0*10^-2; k3=0.16*10^-1; k4=0.4*10^-1; kc=1*10^-2; alpha1=0.5; alphaC=0.5; alpha2=0.5; Ucell0=1.2; R=8.314; F=96500; kphi=1.13*10^-9; mu=3.353*10^-4; CprotM=1200; kp=1.57*10^-18; dM=1.778*10^-4; DprotM=5.359*10^-4; DCH3OHM=4.9*10^-6; PO2=Pc; Pteta=10^5; VA=0.2*10^-6; kLS=8*10^-6; AS=5*10^-4; VACL=9*10^-9; kappa=17*10^-0; CA=4*10^2; CC=8*10^2; gamma=100; Ctstar=20*2.2*10^-5; C0A=CA; C1A=CA/100; C0C=CC; C1C=CA/10; sigma=1; Czeta=55556; Cteta=32.68; %Operating parameters of the cell Q=1.67*10^-8; CCH3OHF=1000; Pa=101325; Pc=101325; tau=VA/Q; T=353; A=kphi/mu; B=CprotM*kp/mu*(Pc-Pa)/dM; C=(DprotM/(R*T)+CprotM*kphi/mu); D=kp/mu*(Pc-Pa)/dM;
- 98 -
%Given value of the cell voltage U=0.1; t=[0 100]; [t,X,s]=ode15s('ODEfixedU',t,[1000;0;0;0;0;0]); for j=1:length(t) icell(j)=kappa/dM*(Ucell0-U-X(j,5)+X(j,6))/10; time(j)=j; end %Plot : figure(1) plot(t,icell(:)) xlabel('time (sec)'); ylabel('i (mA/cm2)'); figure(2); plot(t,X(:,2),t,X(:,4)); xlabel('time (sec)'); ylabel('tetaPt3COH and tetaPtCOOH'); figure(3); plot(t,X(:,3)); xlabel('time (sec)'); ylabel('tetaRuOH'); figure(4); plot(t,X(:,5)); xlabel('time (sec)'); ylabel('Anode Overpotential (V)'); figure(5); plot(t,X(:,6)); xlabel('time (sec)'); ylabel('Cathode Overpotential (V)'); figure(6); plot(t,X(:,1)); xlabel('time (sec)'); ylabel('CCH3OH');

- 99 -
Solving function for dynamic calculations at fixed cell voltage function dXdt=ODEfixedU(t,X) global U global Q global CCH3OHF global Pa global Pc global icell global K1 global K2 global K3 global K4 global R global F global T global k1 global kc global k2 global k3 global k4 global alpha1 global alphaC global alpha2 global Ucell0 global kphi global mu global CprotM global kp global dM global DprotM global DCH3OHM global PO2 global Pteta global VA global kLS global AS global VACL global kappa global CA global CC global gamma global Ctstar global tau global C0A

- 100 -
global C1A global C0C global C1C global sigma global Czeta global Cteta global Const global KC global A global B global C global D global P dXdt=[1/tau*(CCH3OHF-X(1))-AS*X(1)*P*(DCH3OHM/dM*((-kphi/mu*CprotM*F*-((((Ucell0-U-X(5)+X(6))*kappa/dM)/F+CprotM*kp/mu*(Pc-Pa)/dM)... /(CprotM*F*(DprotM/R/T+CprotM*kphi/mu)))-kp/mu*(Pc-Pa)/dM)*dM/DCH3OHM)*exp((-kphi/mu*CprotM*F*-... ((((Ucell0-U-X(5)+X(6))*kappa/dM)/F+CprotM*kp/mu*(Pc-Pa)/dM)/(CprotM*F*(DprotM/R/T+CprotM*kphi/mu)))-kp/mu*(Pc-Pa)/dM)... *dM/DCH3OHM)/(exp((-kphi/mu*CprotM*F*-((((Ucell0-U-X(5)+X(6))*kappa/dM)/F+CprotM*kp/mu*(Pc-Pa)/dM)/(CprotM*F*(DprotM/R/T+CprotM*kphi/mu)))-kp/mu*(Pc-Pa)/dM)*dM/DCH3OHM)-1))-AS*(k1*exp(alpha1*F*X(5)/(R*T))*((1-X(2)-X(4))^3*X(1)-1/K1*exp(-alpha1*F/(R*T)*X(5))*X(2)^3)) 1/(gamma*Ctstar)*((k1*exp(alpha1*F*X(5)/(R*T))*((1-X(2)-X(4))^3*X(1)-1/K1*exp(-alpha1*F/(R*T)*X(5))*X(2)^3))-(... k3*(X(2)*X(3)^2-1/K3*X(4)*(1-X(2)-X(4))^3*(1-X(3))^2))) 1/(gamma*Ctstar)*((k2*exp(alpha2*F*X(5)/(R*T))*((1-X(3))^3-1/K2*exp(-alpha2*F/(R*T)*X(5))*X(3)^3))-2*(k3*(X(2)*X(3)^2-... 1/K3*X(4)*(1-X(2)-X(4))^3*(1-X(3))^2))-(k4*(X(4)*X(3)))) 1/(gamma*Ctstar)*((k3*(X(2)*X(3)^2-1/K3*X(4)*(1-X(2)-X(4))^3*(1-X(3))^2))-(k4*(X(4)*X(3)))) (AS/CA)*(((Ucell0-U-X(5)+X(6))*kappa/dM)-F*(3*(k1*exp(alpha1*F*X(5)/(R*T))*((1-X(2)-X(4))^3*X(1)-1/K1*exp(-alpha1*F/(R*T)*X(5))... *X(2)^3))+3*(k2*exp(alpha2*F*X(5)/(R*T))*((1-X(3))^3-1/K2*exp(-alpha2*F/(R*T)*X(5))*X(3)^3)))) (AS/CC)*(-((Ucell0-U-X(5)+X(6))*kappa/dM)-6*F*(P*X(1)*AS*(DCH3OHM/dM*((-kphi/mu*CprotM*F*-((((Ucell0-U-X(5)+X(6))*kappa/dM)... /F+CprotM*kp/mu*(Pc-Pa)/dM)/(CprotM*F*(DprotM/R/T+CprotM*kphi/mu)))-kp/mu*(Pc-Pa)/dM)*dM/DCH3OHM)*exp((-kphi/mu*CprotM*F*-... ((((Ucell0-U-X(5)+X(6))*kappa/dM)/F+CprotM*kp/mu*(Pc-Pa)/dM)/(CprotM*F*(DprotM/R/T+CprotM*kphi/mu)))-kp/mu*...

- 101 -
(Pc-Pa)/dM)*dM/DCH3OHM)/(exp((-kphi/mu*CprotM*F*-((((Ucell0-U-X(5)+X(6))*kappa/dM)/F+CprotM*kp/mu*(Pc-Pa)/dM)/... (CprotM*F*(DprotM/R/T+CprotM*kphi/mu)))-kp/mu*(Pc-Pa)/dM)*dM/DCH3OHM)-1))+(kc*exp(alphaC*F*X(6)/(R*T))*... (1-exp(-F*X(6)/(R*T))*(PO2/Pteta)^(3/2)))))];

- 102 -
Main program for the polarization curve modeling clear all; format long; global U global Q global CCH3OHF global Pa global Pc global icell global K1 global K2 global K3 global K4 global R global F global T global k1 global kc global k2 global k3 global k4 global alpha1 global alphaC global alpha2 global Ucell0 global kphi global mu global CprotM global kp global dM global DprotM global DCH3OHM global PO2 global Pteta global VA global kLS global AS global VACL global kappa global CA global CC global gamma global Ctstar global tau
- 103 -
global C0A global C1A global C0C global C1C global sigma global Czeta global Cteta global Const global KC global A global B global C global D global P %Operating parameters of the cell Q=1.67*10^-8; CCH3OHF=1000; T=353; Pa=101325; Pc=101325; tau=VA/Q; %Kinetic parameters K1=1*10^-0; K2=1*10^-5; K3=1*10^0; k1=0.80*10^-7; k2=1.0*10^-2; k3=0.3*10^-1; k4=0.15*10^-1; kc=1*10^-2; alpha1=0.5; alphaC=0.5; alpha2=0.5; Ucell0=1.2; R=8.314; F=96500; kphi=1.13*10^-9; mu=3.353*10^-4; CprotM=1200; kp=1.57*10^-18; dM=5.08*10^-5; DprotM=5.359*10^-3; DCH3OHM=5.359*10^-4; PO2=Pc; Pteta=10^5; VA=0.2*10^-6; kLS=8*10^-6; AS=5*10^-4; VACL=9*10^-9; kappa=17*10^-0; CA=4*10^2; CC=8*10^2; gamma=100; Ctstar=20*2.2*10^-5; C0A=CA; C1A=CA/100; C0C=CC; C1C=CA/10; sigma=1; Czeta=55556; Cteta=32.68; A=kphi/mu; B=CprotM*kp/mu*(Pc-Pa)/dM; C=(DprotM/(R*T)+CprotM*kphi/mu); D=kp/mu*(Pc-Pa)/dM; for i=1:5 voltage(i)=0.6-i/10; U=voltage(i); t=[0 600];

- 104 -
[t,X,s]=ode15s('ODEpolarization',t,[1000;0;0;0;0;0]); for j=1:length(t) icell(j)=kappa/dM*(Ucell0-U-X(j,5)+X(j,6)); end currentdensity(i)=icell(length(t))/10; end %Plot : %C=5M exp4(5)=233.6; exp4(4)=165.8; exp4(3)=102.6; exp4(2)=46; exp4(1)=6.2; %Pc=1atm rel exp3(5)=642; exp3(4)=480.9; exp3(3)=315.7; exp3(2)=149; exp3(1)=57.6; %N112 exp2(5)=358.6; exp2(4)=252.2; exp2(3)=149.2; exp2(2)=49.4; exp2(1)=2.8; %normal exp(5)=505; exp(4)=365; exp(3)=232; exp(2)=96; exp(1)=26; figure(1) plot(currentdensity(:),voltage(:),exp2(:),voltage(:));0.1); xlabel('i (mA/cm2)'); ylabel('U (V)');

- 105 -
Solving function for the polarization curve modeling function dXdt=ODEpolarization(t,X) global U global Q global CCH3OHF global Pa global Pc global icell global K1 global K2 global K3 global K4 global R global F global T global k1 global kc global k2 global k3 global k4 global alpha1 global alphaC global alpha2 global Ucell0 global kphi global mu global CprotM global kp global dM global DprotM global DCH3OHM global PO2 global Pteta global VA global kLS global AS global VACL global kappa global CA global CC global gamma global Ctstar global tau global C0A

- 106 -
global C1A global C0C global C1C global sigma global Czeta global Cteta global Const global KC global A global B global C global D global P dXdt=[1/tau*(CCH3OHF-X(1))-AS*X(1)*P*(DCH3OHM/dM*((-kphi/mu*CprotM*F*-((((Ucell0-U-X(5)+X(6))*kappa/dM)/F+CprotM*kp/mu*(Pc-Pa)/dM)... /(CprotM*F*(DprotM/R/T+CprotM*kphi/mu)))-kp/mu*(Pc-Pa)/dM)*dM/DCH3OHM)*exp((-kphi/mu*CprotM*F*-((((Ucell0-U-X(5)+X(6))... *kappa/dM)/F+CprotM*kp/mu*(Pc-Pa)/dM)/(CprotM*F*(DprotM/R/T+CprotM*kphi/mu)))-kp/mu*(Pc-Pa)/dM)*dM/DCH3OHM)/... (exp((-kphi/mu*CprotM*F*-((((Ucell0-U-X(5)+X(6))*kappa/dM)/F+CprotM*kp/mu*(Pc-Pa)/dM)/(CprotM*F*... (DprotM/R/T+CprotM*kphi/mu)))-kp/mu*(Pc-Pa)/dM)*dM/DCH3OHM)-1))-AS*(k1*exp(alpha1*F*X(5)/(R*T))*((1-X(2)-X(4))^3*X(1)... -1/K1*exp(-alpha1*F/(R*T)*X(5))*X(2)^3)) 1/(gamma*Ctstar)*((k1*exp(alpha1*F*X(5)/(R*T))*((1-X(2)-X(4))^3*X(1)-1/K1*exp(-alpha1*F/(R*T)*X(5))*X(2)^3))-(k3*(X(2)*X(3)^2-... 1/K3*X(4)*(1-X(2)-X(4))^3*(1-X(3))^2))) 1/(gamma*Ctstar)*((k2*exp(alpha2*F*X(5)/(R*T))*((1-X(3))^3-1/K2*exp(-alpha2*F/(R*T)*X(5))*X(3)^3))-2*(k3*(X(2)*X(3)^2... -1/K3*X(4)*(1-X(2)-X(4))^3*(1-X(3))^2))-(k4*(X(4)*X(3)))) 1/(gamma*Ctstar)*((k3*(X(2)*X(3)^2-1/K3*X(4)*(1-X(2)-X(4))^3*(1-X(3))^2))-(k4*(X(4)*X(3)))) (AS/CA)*(((Ucell0-U-X(5)+X(6))*kappa/dM)-F*(3*(k1*exp(alpha1*F*X(5)/(R*T))*((1-X(2)-X(4))^3*X(1)-1/K1*exp... (-alpha1*F/(R*T)*X(5))*X(2)^3))+3*(k2*exp(alpha2*F*X(5)/(R*T))*((1-X(3))^3-1/K2*exp(-alpha2*F/(R*T)*X(5))*X(3)^3)))) (AS/CC)*(-((Ucell0-U-X(5)+X(6))*kappa/dM)-6*F*(P*X(1)*AS*(DCH3OHM/dM*((-kphi/mu*CprotM*F*-((((Ucell0-U-X(5)+X(6))... *kappa/dM)/F+CprotM*kp/mu*(Pc-Pa)/dM)/(CprotM*F*(DprotM/R/T+CprotM*kphi/mu)))-kp/mu*(Pc-Pa)/dM)*dM/DCH3OHM)*... exp((-kphi/mu*CprotM*F*-((((Ucell0-U-X(5)+X(6))*kappa/dM)/F+CprotM*kp/mu*(Pc-Pa)/dM)/(CprotM*F*...

- 107 -
(DprotM/R/T+CprotM*kphi/mu)))-kp/mu*(Pc-Pa)/dM)*dM/DCH3OHM)/(exp((-kphi/mu*CprotM*F*-((((Ucell0-U-X(5)+X(6))*kappa/dM)... /F+CprotM*kp/mu*(Pc-Pa)/dM)/(CprotM*F*(DprotM/R/T+CprotM*kphi/mu)))-kp/mu*(Pc-Pa)/dM)*dM/DCH3OHM)-1))+... (kc*exp(alphaC*F*X(6)/(R*T))*(1-exp(-F*X(6)/(R*T))*(PO2/Pteta)^(3/2)))))];