thesis connor murphy
TRANSCRIPT
1
The synthesis of small molecules with the potential as
anti-diabetic agents.
Connor Joseph Murphy
12469222
This thesis is submitted in fulfillment of the Requirements for the B.Sc.
Double Honours Degree in Chemistry
Maynooth University Department of Chemistry
Maynooth University
Date 16/12/2015
Supervisor: Dr John Stephens
2
Table of Contents Page
Abstract 4
Acknowledgements 5
Chapter 1: Introduction and Literature Review
1.1 Diabetes Mellitus 6
1.1.1 What is diabetes mellitus 6
1.1.2 Types of diabetes mellitus 6
1.1.2.1 Type 1 6
1.1.2.2 Type 2 6
1.1.2.3 Gestation diabetes mellitus 7
1.2 Health impact of diabetes 7
1.3 Treatment and prevention 7
1.3.1 Weight management and control 7
1.3.2 Insulin 8
1.3.3 Pancreas transplant 8
1.3.4 Anti-diabetic oral drugs 8
1.3.4.1 Sulfonylureas 8
1.3.4.2 Biguanides 9
1.4 Diabetes mellitus impact on society 9
1.4.1 Prevalence and rise of diabetes 9
1.4.2 Cost to society 10
1.5 Pyrazoles 10
1.6 Pyrimidines 11
1.7 Aims 13
Chapter 2: Results and Discussion
2.1 Results and discussion for the synthesis for amino phenylpyrazole 14
2.1.1 Retrosynthesis of amino phenylpyrazole 14
2.1.2 Synthesis and yields of amino phenylpyrazole experiments 14
2.1.3 Verifying product made by NMR data 15
2.1.4 Reaction time 18
2.1.5 Development of purification method 19
2.1.6 Mechanism for amino phenylpyrazole formation 20
2.2 Results and discussion for the synthesis of bicycle pyrimidine 21
2.2.1 Retrosynthesis of bicycle pyrimidine 21
2.2.2 Synthesis and yields of bicycle pyrimidine experiments 21
2.2.3 Verifying product made by NMR data 22
2.2.4 Mechanism for the formation of bicycle pyrimidine 42
2.2.5 Comparison between the synthesis of 2,5-diphenylpyrazolo[1,5-a] 44
pyrimidine-7(4H) one in 5ml of acetic acid and 2.5ml of acetic acid
2.2.6 Comparison between solvents ethanol and acetic acid 44
3
2.2.7 Comparison with regards the steric effects between the methyl and 44
phenyl R groups
2.2.8 Comparison with regards electronic effects of a para substituent on 45
a phenyl ring using 4-nitrophenyl and 4-methoxyphenyl R groups
Chapter 3: Conclusion
3.1 Future work for the synthesis of the amino phenylpyrazole 47
3.1.1 New purification methods 47
3.1.2 Minimize the reaction time 47
3.1.3 Mechanistic study 47
3.2 Future work for the synthesis of bicycle pyrimidines 47
3.2.1 Minimize reaction time 47
3.2.2 New purification methods 47
3.2.3 Repeat experiment using a wide variety of R groups to full discover 48
the steric and electronic component of the reaction
3.2.4 Will other electron donating groups like the methoxy give similar 48
results in regards impurities and NMR spectra
3.3 Conclusion 48
Chapter 4: Experimental
4.1 General 49
4.2 Synthesis of amino phenylpyrazole 50
4.3 General procedure for the synthesis of bicycle pyrimidines 5a, 5b, 5c and 5d 51
4.3.1 Synthesis of 2,5-diphenylpyrazole[1,5-a] pyrimidin-7(4H) one, 5a1 51
and 5a2
4.3.2 Synthesis of 5-methyl-2-phenylpyrazole[1,5-a] pyrimidin-7(4H) one, 52
5b1 and 5b2
4.3.3 Synthesis of 5-(4-nitrophenyl)-2-phenylpyrazole[1,5-a] 53
pyrimidin-7(4H) one, 5c
4.3.4 Synthesis of 5-(4-methoxyphenyl)-2-phenylpyrazole[1,5-a] 54
pyrimidin-7(4H) one, 5d
References 55
4
Abstract
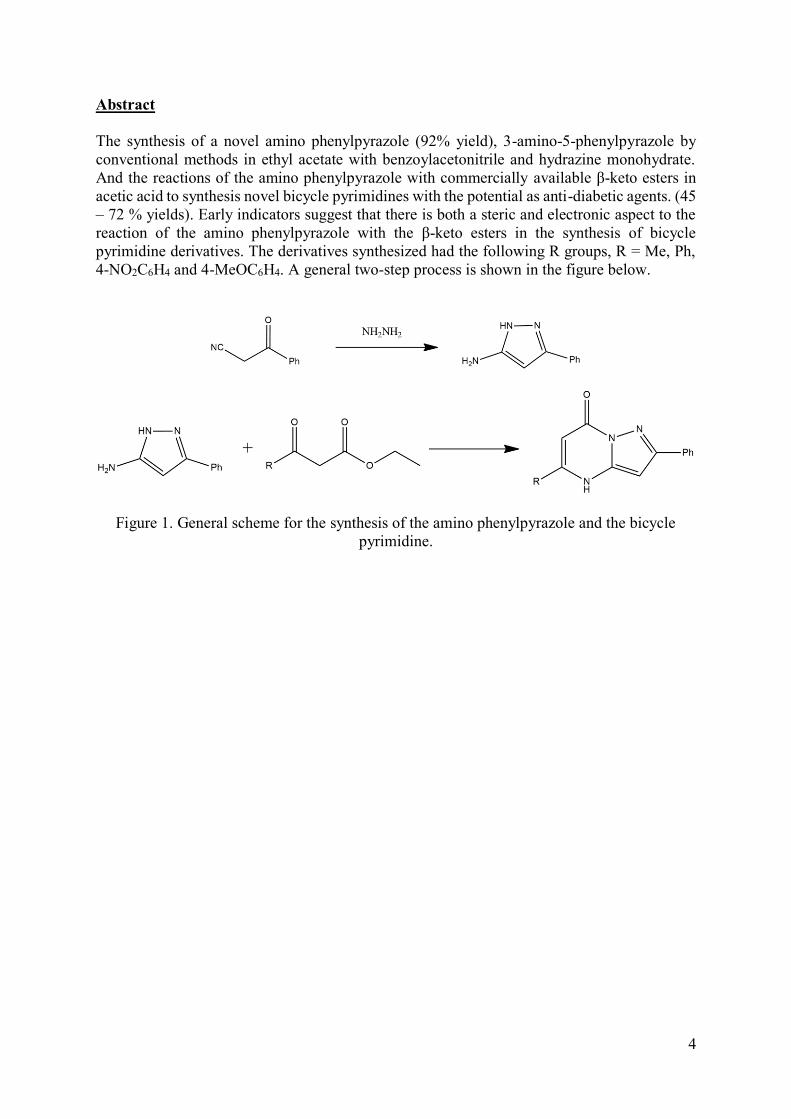
The synthesis of a novel amino phenylpyrazole (92% yield), 3-amino-5-phenylpyrazole by
conventional methods in ethyl acetate with benzoylacetonitrile and hydrazine monohydrate.
And the reactions of the amino phenylpyrazole with commercially available β-keto esters in
acetic acid to synthesis novel bicycle pyrimidines with the potential as anti-diabetic agents. (45
– 72 % yields). Early indicators suggest that there is both a steric and electronic aspect to the
reaction of the amino phenylpyrazole with the β-keto esters in the synthesis of bicycle
pyrimidine derivatives. The derivatives synthesized had the following R groups, R = Me, Ph,
4-NO2C6H4 and 4-MeOC6H4. A general two-step process is shown in the figure below.
Figure 1. General scheme for the synthesis of the amino phenylpyrazole and the bicycle
pyrimidine.

5
Acknowledgements
I would like to thank Dr. John Stephens, my supervisor throughout my thesis for his help and
guidance.
I would like to thank Mr. Mark Kelada for all his assistance, patience and knowledge
throughout my undergraduate thesis.
I would like to thank Ms. Ria Walsh for creating a special carcinogenic waste container for my
experiments.
I would like to thank all the postgraduates in the synthesis lab for their help when I needed it,
and for their warm welcome which made my time in the laboratory both education and fun.
6
Chapter 1: Introduction and literature review
1.1 Diabetes Mellitus
1.1.1 What is diabetes mellitus?
Diabetes Mellitus, derives its name from the Greek words diabainein, meaning to pass through
as in the huge volume of water that passes through the body i.e. the urine. Mellitus from meli
meaning honey and is reference to the presence of sugar in the urine. So diabetes mellitus
effectively means honey urine. 1 It is commonly just referred to as diabetes, as it will be known
in this thesis. It consists of a group of metabolic diseases in which the body is unable to
naturally control its own blood sugar level, where glucose is the sugar in question. It is possible
to be born with diabetes or develop it in later life. Diabetes is not a contagious disease, it is not
possible for diabetes to be passed from one person to another, like it is possible with the
common cold. An individual with diabetes will experience both high (hyperglycemia) and low
(hypoglycemia) levels of glucose in their blood.
1.1.2 Types of diabetes.
There are three types of diabetes, type 1, type 2 and gestation diabetes. Each with their own
causes and treatments.
1.1.2.1 Type 1 diabetes
Type 1 diabetes (T1), also known as insulin-dependent diabetes. It is the absolute deficiency
of insulin secretion. It is cell-mediated autoimmune destruction of the pancreatic β cells, the
location where insulin is secreted. It is characterized by the presence of ICA, anti-GAD, islet
antigen 2 (IA2) or insulin autoantibodies which identify the autoimmune process associated
with β-cell destruction.2 It accounts for ~5-10% of all cases of diabetes. The symptoms for T1
are excessive urination, excessive thirst to replace lost fluids, fatigue, increased appetite,
weight loss, and blurred vision. An individual is capable of developing T1 any stage in their
life. However the vast major of diagnosis are before an individual is 20 years old.3 Men are
statistically more likely to develop T1 then women according to research carried out in Sweden.
Out of the cases of incidence 16.4 out of 100,000 were men. While 8.9 out of 100,000 are
women, this means a man is 84% more likely to develop T1 then a woman. 4
1.1.2.2 Type 2 diabetes
Type 2 diabetes (T2), is also known as non-insulin-dependent diabetes. T2 diabetes is caused
in two ways cells being insulin-resistant or the body being unable to produce enough insulin
for the body. Insulin resistance means that the cells in the body are unable to intake the insulin
that has been produced by the body.1 If an individual is overweight there cells may be perfectly
able to take up the insulin but the pancreas is unable to produce a large enough amount of
insulin for the increased body size. T2 accounts for between 90-95% of all diabetics.5 It often
develops in later life typically around 46 years old. However, this age is decreasing due to more
young people developing the disease.6 The main reason T2 is so prevalent is due to its
connection to obesity and the worldwide trend of increasing obesity especially among young
7
people.7 So much so there are people who want T2 to be redefined as “diabesity”, obesity
dependent diabetes mellitus.8
1.1.2.3 Gestation diabetes mellitus
Gestation diabetes mellitus (GDM) defined as “any degree of glucose intolerance with onset
or first recognition during pregnancy”.9 This is very much under debate as it possible that a
women may have diabetes before pregnancy and that it only detected during pregnancy. A
leading investigator in this area is Pricilla White 5and she is currently caring out research in
that area. I won’t be investigating any further for the propose of this thesis. There is conflicting
data in regards the prevalence of GDM it varies from as little as 1.4% to 50% in a national
diabetes data group study. 10
1.2 Health impact of diabetes
An individual with diabetes will be more prone to a series of health problems. A person with
diabetes will experience both high and low blood sugar levels. high blood sugar levels
(hyperglycemia) are associated with an increased risk of cardiovascular disease and this has
been confirmed by studies, especially in older women. 11 Low blood sugars (hypoglycemia) is
associated with both an increased risk of cardiovascular disease12 and loss of cognitive and
neural function. 13 A diabetic is also twice more likely to experience a stroke then a non-diabetic
this connects back to the increased risk of cardiovascular disease.14 In an Irish study between
2005 to 2009, the rate of amputations was recorded between diabetics and non-diabetics. It
should that in 2005 a diabetic was 22.3% more likely to have an amputation then a non-diabetic,
in the following years up to and including 2009 this likelihood does not change significantly.15
Overall in general the life expectancy for a diabetic is lower, diabetic men and women 50 years
and older live on average 7.5 and 8.2 years less, respectively than non-diabetics. 16
1.3 Treatment and prevention of diabetes
1.3.1 Weight management and control
T2 diabetes is directly connected to obesity as for mentioned.8 Therefore it is logical to assume
that if an individual were to control their weight then they would be able to prevent T2. In a
3.2-year study carried out by the diabetes prevention program in the U.S.A. Where participant
had a change in lifestyle i.e. encouraged to diet and increase exercise to achieve weight loss.
This weight corresponded to a direct reduction in the risk of developing diabetes, “for every
kilogram of weight loss, there was a 16% reduction in risk adjusted for changes in diet and
activity”. 17 Individuals suffering from T2 may “reverse” diabetes by weight loss, this is
according to a study carried out by the University of Newcastle in the UK in 2011. In this study
the participants are put under a strict diet and their β-cell function measured along with their
insulin sensitivity. After 8 weeks these had normalized, T2 had effectively been reversed.18

8
1.3.2 Insulin
Glucose testing/ blood sugar level testing followed up by insulin injections of the appropriate
amount, was the primary way to treat both T1 and T2. This would artificially increase the
amount of insulin in the body. This insulin would then cause cells in the body to absorb glucose,
which in turn would reduce blood sugar levels. Initially cow insulin was used to treat diabetes,
however with advancements this later changed to pig than human insulin. Which eventually
led to the breakthrough by Genentech© in using DNA recombinant technology to get E. coli
to produce human insulin.5 This made insulin cheap and easy to mass produce.
1.3.3 Pancreas transplant
T1 is where the pancreas is unable to produce insulin. So a pancreas transplant is seen as an
alternative to insulin injections for T1 suffers. This may be a full or partial pancreas. This
treatment is not available to all diabetics. Not every person is able to find a suitable donor.
With all transplants there is always a risk of the body rejecting the organ19 and infection after
the operation.
1.3.4 Anti-diabetic oral drugs
1.3.4.1 Sulfonylureas
Sulfonylureas are a type of drug that is used to treat T2, they were discovered in Germany
during the early 1940’s however due to the outbreak of World War II, they weren’t developed
as T2 drugs until the 1960’s.5 The sulfonylureas act on the β-cells in the pancreas, by binding
to KATP channels on the cells plasma membrane. This binding triggers the production and
release of insulin into the blood stream. This insulin then causes glucose absorption therefore
reducing blood sugar levels.20
Figure 2. Generic structure of a sulfonylurea.
The sulfonylureas have very few side effects a common side effect is hypoglycemia, which can
be severe and prolonged. Tolbutamide is a commonly used sulfonylurea used to treat T2.
Figure 3. Structure of Tolbutamide

9
1.3.4.2 Biguanides
Biguanides are derived from a French lilac, galega officinalis. Biguanides derived from galega
officinalis were known to have hypoglycemic properties. There were several drugs available
derived from galega officinalis, however after a period of time issues arose from them and they
were discontinued. An example is butformin, it was used until the frequency of lactic acidosis
prevented further use. 5 Metformin is a biguanide that is used in to treat T2. It does this by
reducing hepatic glucose production by inhibiting gluconeogenesis21 and by increasing glucose
uptake and utilization in skeletal muscle.20
Figure 4. Structure of biguanides
A Dutch study carried out over 4.3 years, showed that long term use of metformin leads to an
increased risk of vitamin B12 deficiency. It recommends that in the future that B12 levels should
be monitored. 22
Figure 5. Structure of metformin
1.4 Diabetes mellitus impact on society
1.4.1 Prevalence and rise of diabetes
A study carried out by the international diabetes federation (IDF), found that in 2013 there were
382 million people with diabetes. They determined this by collecting data from 744 sources
throughout the world. They were also able to make prediction based on current trends which
predict that in 2035, 592 million people will have diabetes.23 Diabetes is rising throughout the
world the main reason is the rise in T2 which is linked to obesity, see section 1.1.2.2 . As
nations develop they tend to adopt western lifestyles such as minimal exercise and increased
consumption of sugary and fatty foods, especially sugar-sweetened beverages which lead to

10
obesity.24 25 An example of a developing nation which experienced an increase in diabetes is
China. In 1980, 1% of Chinese had diabetes this has increased to 10% of Chinese in 2008, this
corresponds to 92 million people, showing the connection between economic development
(westernization) and diabetes. 26
1.4.2 Cost to society
Diabetes is a colossal drain on national health budgets. In 2010 diabetes costed 376 billion
united state dollars (USD) which is equivalent to 354 billion euro. This represented 12% of all
global health spending in 2010. This cost will continue to rise as does the number of diabetics.
It is estimated that in 2030 diabetes will cost 561 billion USD or 528 billion euro.27
1.5 Pyrazoles
A pyrazole is a type of 5 membered aromatic ring with three carbons and two nitrogen atoms
having the formula C3H3N2H. First named in 1883 by Ludwig Knorr.28
Figure 6. Structure of a pyrazole
Pyrazoles have lone pair electrons on the nitrogen atoms. This allows them to act as bases and
undergo nucleophilic attack. This property of pyrazoles will be important in the synthesis of
the pyrimidines. As a pyrazole can act as a base it can under many reactions. A very famous
reaction involves the synthesis of Pfizer’s, Viagra. A pyrazole ring is a key component of the
structure of Viagra.
Figure 7. Structure of Viagra
11
This demonstrates the importance of pyrazoles in the production of molecules with
pharmacological important. It has been synthesized by conventional and non-conventional
means, reflux and microwave give the same yield, 80%.29,30
1.6 Pyrimidines
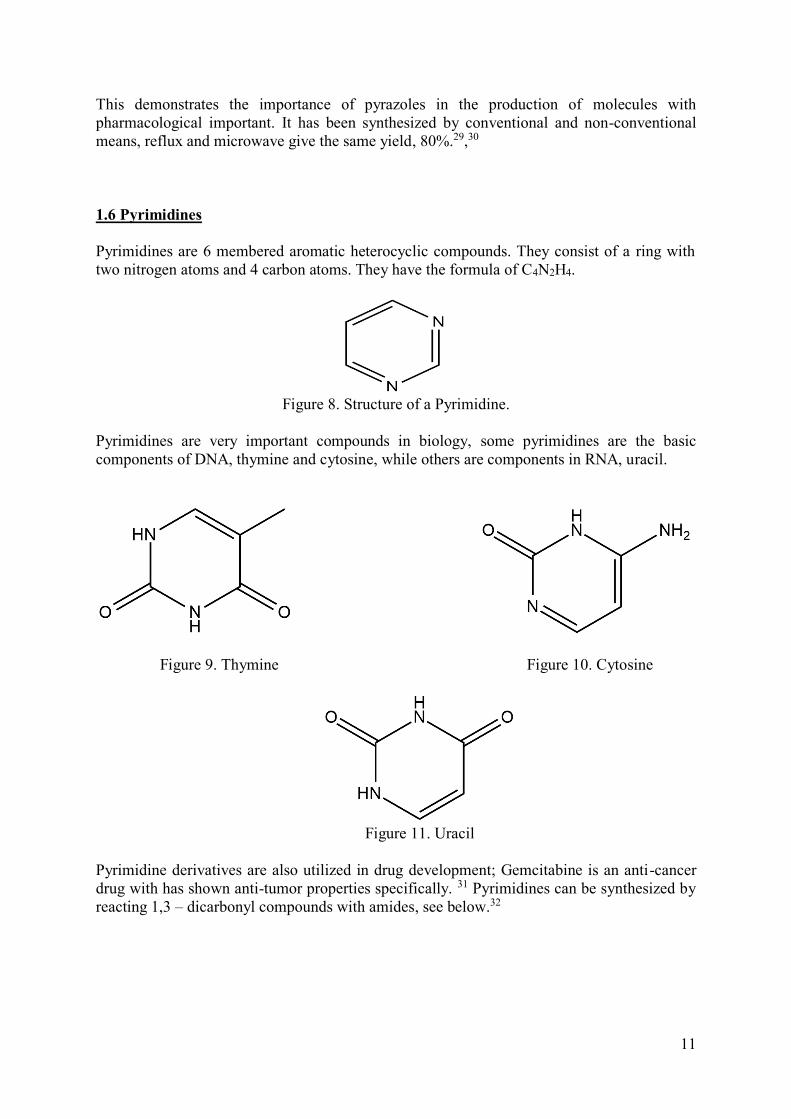
Pyrimidines are 6 membered aromatic heterocyclic compounds. They consist of a ring with
two nitrogen atoms and 4 carbon atoms. They have the formula of C4N2H4.
Figure 8. Structure of a Pyrimidine.
Pyrimidines are very important compounds in biology, some pyrimidines are the basic
components of DNA, thymine and cytosine, while others are components in RNA, uracil.
Figure 9. Thymine Figure 10. Cytosine
Figure 11. Uracil
Pyrimidine derivatives are also utilized in drug development; Gemcitabine is an anti-cancer
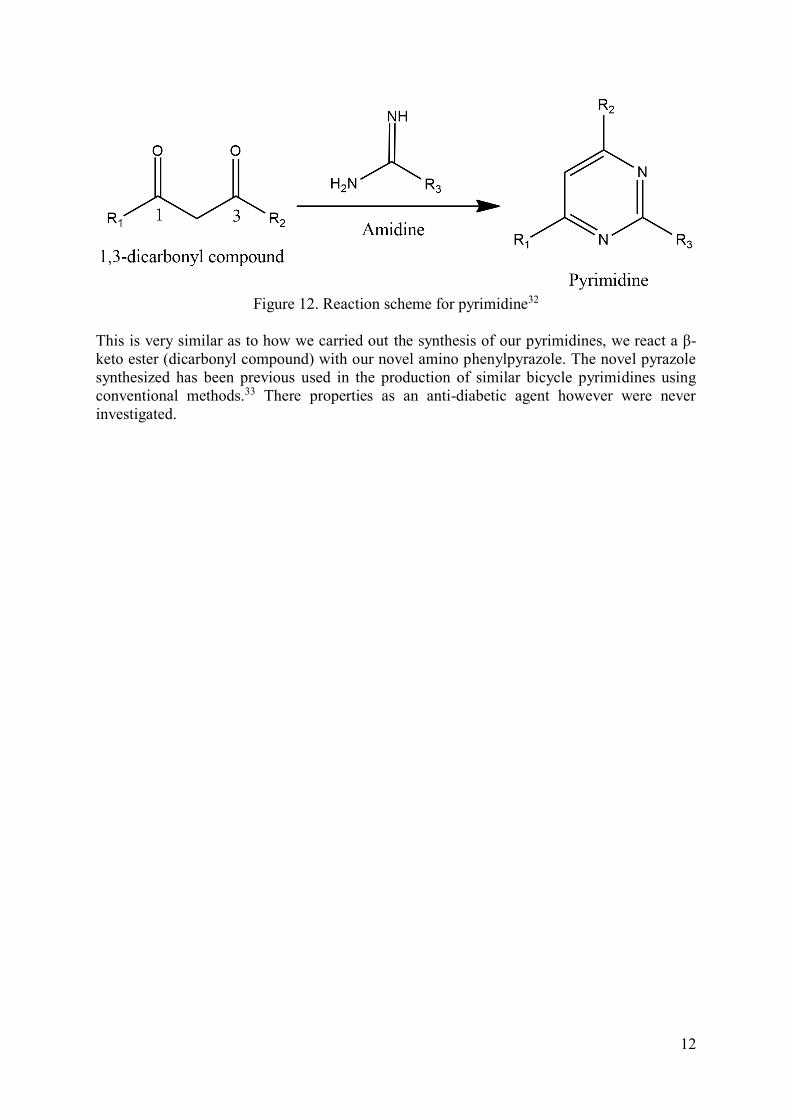
drug with has shown anti-tumor properties specifically. 31 Pyrimidines can be synthesized by
reacting 1,3 – dicarbonyl compounds with amides, see below.32
12
Figure 12. Reaction scheme for pyrimidine32
This is very similar as to how we carried out the synthesis of our pyrimidines, we react a β-
keto ester (dicarbonyl compound) with our novel amino phenylpyrazole. The novel pyrazole
synthesized has been previous used in the production of similar bicycle pyrimidines using
conventional methods.33 There properties as an anti-diabetic agent however were never
investigated.

13
1.7 Aims
The aims of the project are as follows,
The synthesis of several novel compounds with similar structure to a known anti-diabetic agent
RTC53 developed by the Stephens research group in Maynooth University. As an alternative
to metformin.
Figure 13. Structure of RTC53
The synthesis of a novel pyrazole, amino phenylpyrazole (3-amino-5-phenylpyrazole). To
investigate its synthesis using conventional methods i.e. reflux overnight. Determine the
minimum amount of time needed for the reaction to finish and a method to purify amino
phenylpyrazole.
To develop a method to produce and purify several bicycle pyrimidines. And see the effects of
various experimental set ups like solvent, solvent volume, steric effects and electronic effects
on yield.
14
Chapter 2: Results and Discussion
2.1 Results of synthesis for amino phenylpyrazole
2.1.1 Retrosynthesis of amino phenylpyrazole
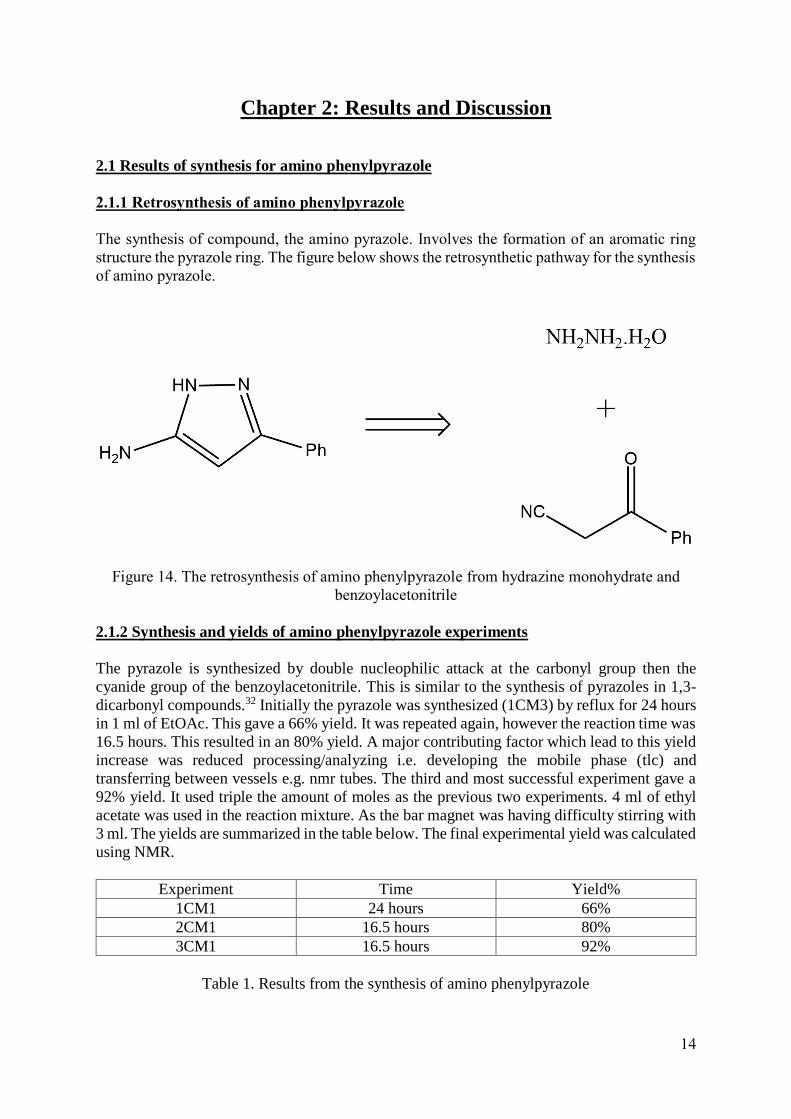
The synthesis of compound, the amino pyrazole. Involves the formation of an aromatic ring
structure the pyrazole ring. The figure below shows the retrosynthetic pathway for the synthesis
of amino pyrazole.
Figure 14. The retrosynthesis of amino phenylpyrazole from hydrazine monohydrate and
benzoylacetonitrile
2.1.2 Synthesis and yields of amino phenylpyrazole experiments
The pyrazole is synthesized by double nucleophilic attack at the carbonyl group then the
cyanide group of the benzoylacetonitrile. This is similar to the synthesis of pyrazoles in 1,3-
dicarbonyl compounds.32 Initially the pyrazole was synthesized (1CM3) by reflux for 24 hours
in 1 ml of EtOAc. This gave a 66% yield. It was repeated again, however the reaction time was
16.5 hours. This resulted in an 80% yield. A major contributing factor which lead to this yield
increase was reduced processing/analyzing i.e. developing the mobile phase (tlc) and
transferring between vessels e.g. nmr tubes. The third and most successful experiment gave a
92% yield. It used triple the amount of moles as the previous two experiments. 4 ml of ethyl
acetate was used in the reaction mixture. As the bar magnet was having difficulty stirring with
3 ml. The yields are summarized in the table below. The final experimental yield was calculated
using NMR.
Experiment Time Yield%
1CM1 24 hours 66%
2CM1 16.5 hours 80%
3CM1 16.5 hours 92%
Table 1. Results from the synthesis of amino phenylpyrazole

15
The reaction conditions for the synthesis of amino phenylpyrazole.
Figure 15. The reaction for the preparation of amino phenylpyrazole
2.1.3 Verifying product made using NMR data
The product is shown with its hydrogens labelled. Equivalent hydrogens are given the same
number.
Figure 16. Amino phenylpyrazole hydrogens shown and labelled
H1, H2 and H3 are aromatic, so they are expected between 7.5 ppm to 8.25 ppm. H4 is attached
to an alkene expect to see a signal between 5ppm to 6.3ppm. H5 and H6 are amines so they
should appear between 0.7ppm to 3.1ppm, however amines don’t appear every time.

16
Figure 17. Full spectrum of 3CM1
Figure 18. Zoom in on aromatic region

17
In the aromatic region there are four peaks. At 7.26 ppm is the known solvent peak for CDCl3,
the other three peaks are a doublet of int 2 (7.53 ppm), a triplet of int 2 (7.39 ppm) and a triplet
of int 1 (7.33 ppm). These peaks correspond to H3, H2 and H1 respectively (the aromatics).
Figure 19. Zoom in from 6.1 – 2.9 ppm
The singlet at 5.92 ppm of int 1 is H4 (alkene) and the broad singlet of int 2 at 3.80 ppm is H5
(amine).

18
Figure 27. Zoom in from 2.5 – 0 ppm
There are small peaks between 2.4 to 0.8 ppm, these are ethyl acetate the solvent used to
transfer the product. At 1.26 ppm there is a peak of int 0.19. This in the position of where a
signal from ethyl acetate would give an int of 3. Scaling this to a peak of int 1 in our product,
would represent a concentration of 6.3% ethyl acetate (0.19/3 * 100 = 6.3%). 6.3% of 98% is
92% yield. No peaks were identified for H6, this is to be expected as N-H signal often don’t
appear on the spectrum. Converting ppm to Hz the coupling constants were got while analyzing
the data with mester nova software.
2.1.4 Reaction time
The first experiment (1CM1) had a reaction time of 23 hours 31 minutes. From tlc plates it
could be seen that the reaction had not finished after 4 hours 24 minutes. The reaction was
repeated (2CM1) but this time it was ran for less time 16 hours 37 minutes. From tlc plates it
was observed that the reaction had gone to completion. Therefore, the minimal reaction time is
between 4.5 hours to 16.5hours.
19
2.1.5 Development of purification method
Trituration as a method of purification was initially investigate. The solvents tested were ethyl
acetate, DCM and petroleum ether. They proved unsuccessful. column chromatography was
then investigated. The stationary phase chosen was silica powder. Using tlc various solvent
systems were tried to identify an appropriate mobile phase, 50:50 ethyl acetate:petroleum ether,
increasing in 10 up to 90:10 ethyl acetate:petroleum ether and 40:60 DCM:petroleum ether,
increasing in 10 up to 90:10 DCM:petroleum ether. The initial mobile phase was a solvent
gradient 60:40 ethyl acetate: petroleum ether and increasing up to 80:20 ethyl
acetate:petroleum ether. This was changed in later purifications to a single solvent, 70:30 ethyl
acetate:petroleum ether. The hydrazine monohydrate attaches itself to the stationary phase and
is unable to move in the column by the mobile phase. It attaches itself as the hydrazine is
slightly basic due to its lone pairs and interacts with the slightly acidic silica. It is slightly acidic
due to the presence of Si-OHs. This in theory means that a very short column could be used to
remove the hydrazine from the product. A short column would in turn mean shorter run time
speeding up purification of the product.
20
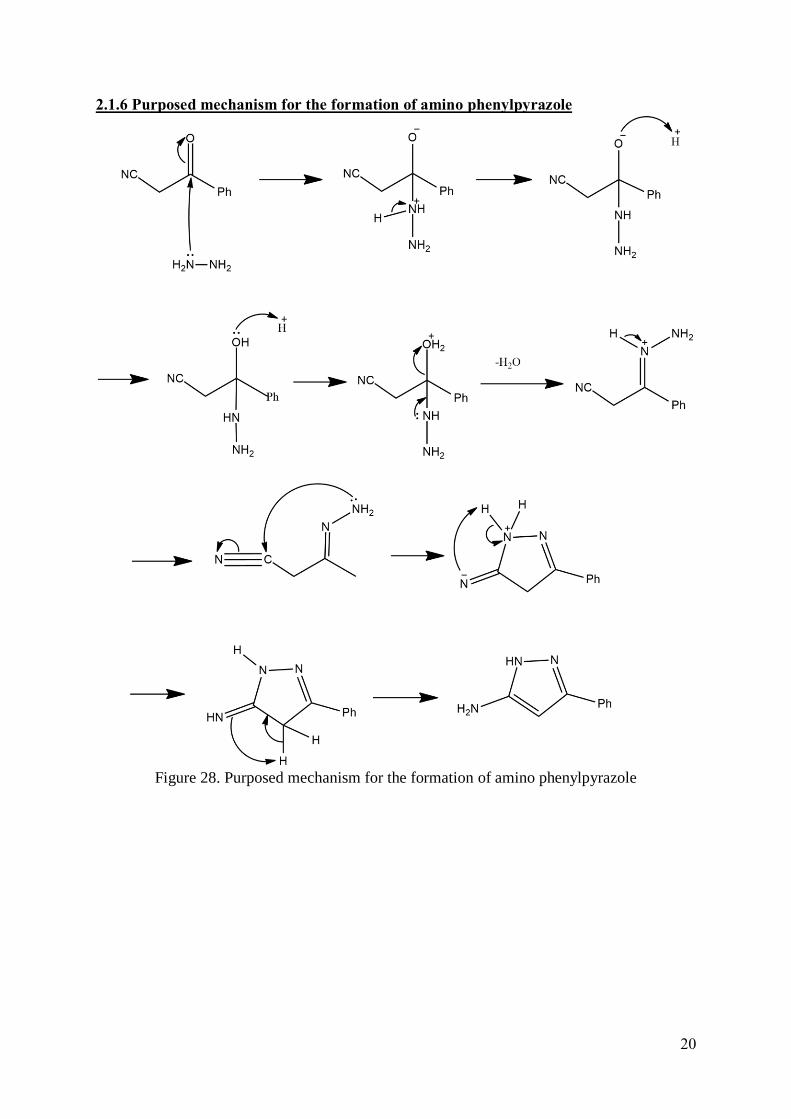
2.1.6 Purposed mechanism for the formation of amino phenylpyrazole
Figure 28. Purposed mechanism for the formation of amino phenylpyrazole

21
2.2 Results for the synthesis of bicycle pyrimidine
2.2.1 Retrosynthesis of bicycle pyrimidine
The synthesis of bicycle pyrimidines and its derivatives involves the formation of a pyrimidine
ring. The figure below shows the retrosynthetic pathway for the synthesis of the bicycle
pyrimidine.
Figure 29. The formation of a generic bicycle pyrimidine from a generic β-keto ester and
amino phenylpyrazole
2.2.2 Synthesis and yields of bicycle pyrimidine experiments
The bicycle pyrimidine is formed by double nucleophilic attack, both carbonyl groups in the
β-keto ester are attacked. The synthesis of the bicycle pyrimidine is a two-step process. First
the amino phenylpyrazole is produced see section 4.2 for synthesis. The amino phenylpyrazole
is then reacted with a β-keto ester. Several bicycle pyrimidines were synthesis, with varying R
group and under different conditions. The yields and solvents are summarized in the table
below.
Experiment Solvent R Yield %
5a1 5 ml AcOH Ph 36%
5a2 2.5 ml AcOH Ph 72%
5b1 5 ml AcOH Me 73%
5b2 5 ml EtOHα Me 14%*
5c 5 ml AcOH 4-NO2C6H4 45%
5d 5 ml AcOH 4-MeOC6H4 77%*
Table 2. Yields of experiments. *crude yield, product present confirmed with NMR. α
Contains a catalytic amount of AcOH see experimental section
Unable to cool acetic acid down to force product to precipitate out, due to its low freezing
point.
22
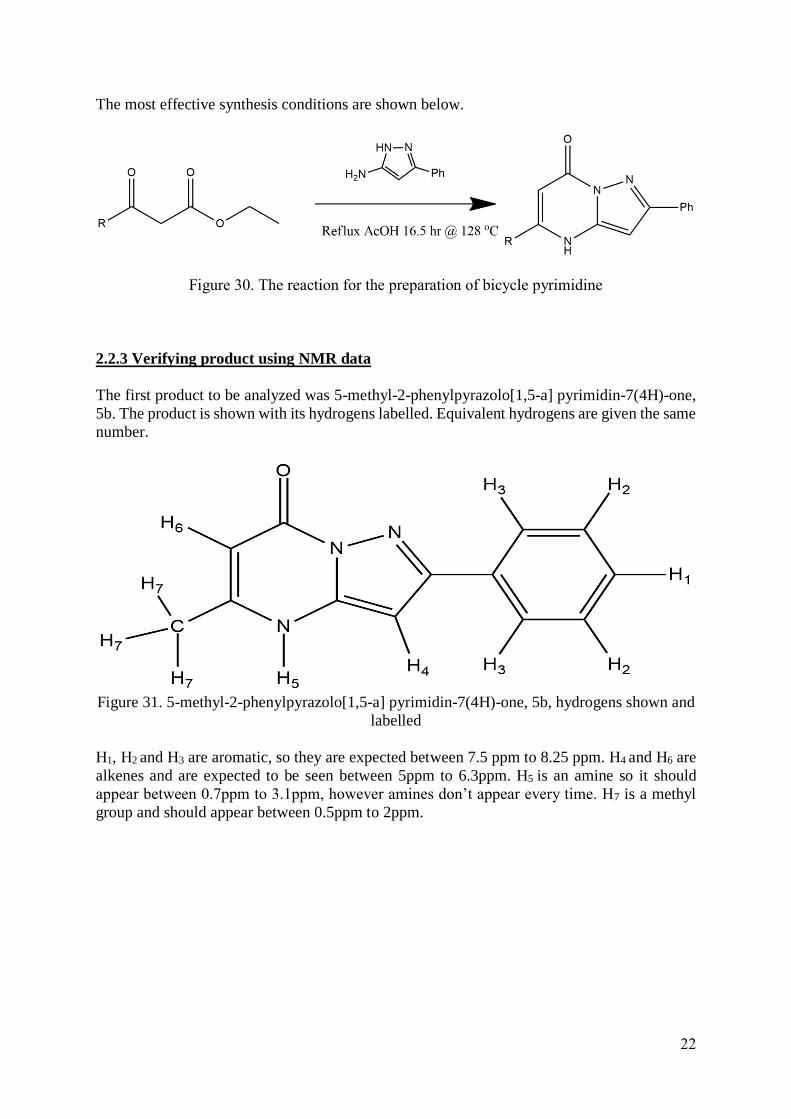
The most effective synthesis conditions are shown below.
Figure 30. The reaction for the preparation of bicycle pyrimidine
2.2.3 Verifying product using NMR data
The first product to be analyzed was 5-methyl-2-phenylpyrazolo[1,5-a] pyrimidin-7(4H)-one,
5b. The product is shown with its hydrogens labelled. Equivalent hydrogens are given the same
number.
Figure 31. 5-methyl-2-phenylpyrazolo[1,5-a] pyrimidin-7(4H)-one, 5b, hydrogens shown and
labelled
H1, H2 and H3 are aromatic, so they are expected between 7.5 ppm to 8.25 ppm. H4 and H6 are
alkenes and are expected to be seen between 5ppm to 6.3ppm. H5 is an amine so it should
appear between 0.7ppm to 3.1ppm, however amines don’t appear every time. H7 is a methyl
group and should appear between 0.5ppm to 2ppm.

23
Figure 32. Full spectrum of 5-methyl-2-phenylpyrazolo[1,5-a] pyrimidin-7(4H)-one, 5b
Figure 33. Zoom in on aromatic region
In the aromatic region there are three peaks. There is a doublet of int 2 (7.97 ppm), a triplet of
int 2 (7.48 ppm) and a triplet of int 1 (7.41 ppm). These peaks correspond to H3, H2 and H1
respectively (aromatics).

24
Figure 34. Mid region of spectra 6.8 – 5.4 ppm region
There is a singlet of int 1 (6.57 ppm) and another singlet of int 1 (5.61 ppm), they correspond
to H6 and H4 respectively (alkenes).

25
Figure 35. 4.0 – 1.6ppm region with integration and peaks assigned
There is a large singlet of int 31 at 3.39 ppm, this is water in the DMSO. The singlet at 2.51
ppm had a int of 6, this is the DMSO solvent peak. The singlet at 2.31ppm of int 3 is H7, the
methyl group. The small singlet at 1.92 ppm is from acetic acid.
26
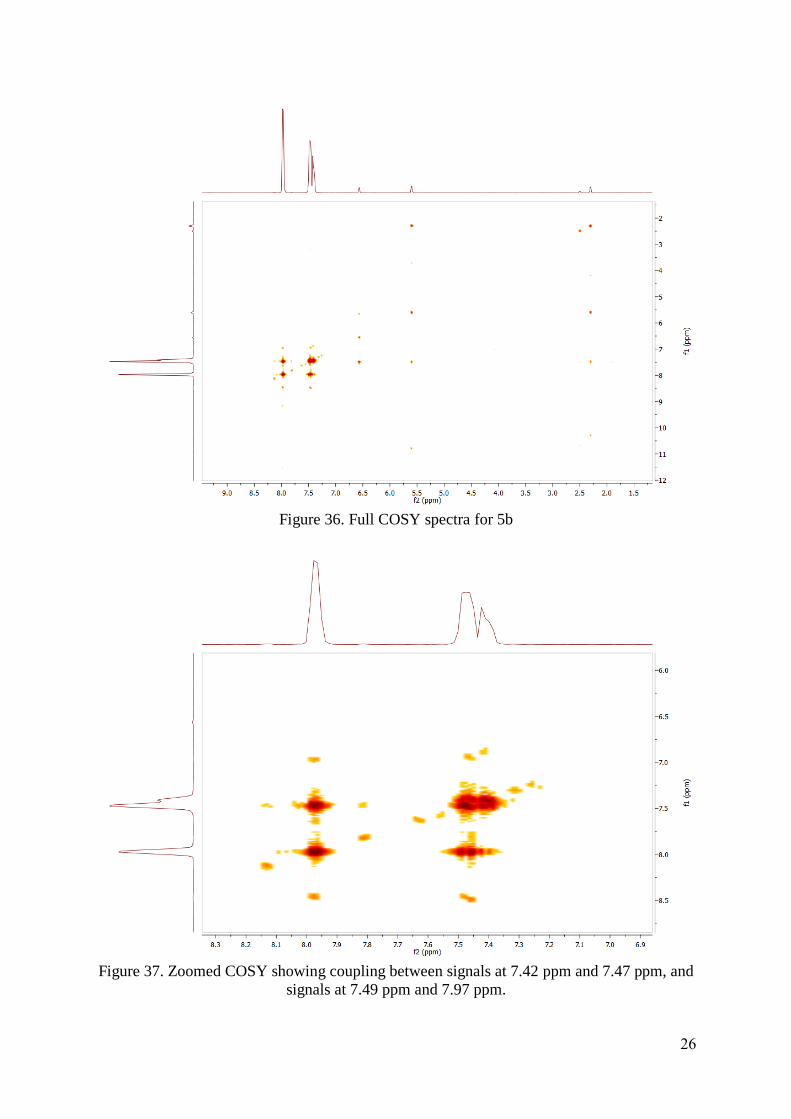
Figure 36. Full COSY spectra for 5b
Figure 37. Zoomed COSY showing coupling between signals at 7.42 ppm and 7.47 ppm, and
signals at 7.49 ppm and 7.97 ppm.
27
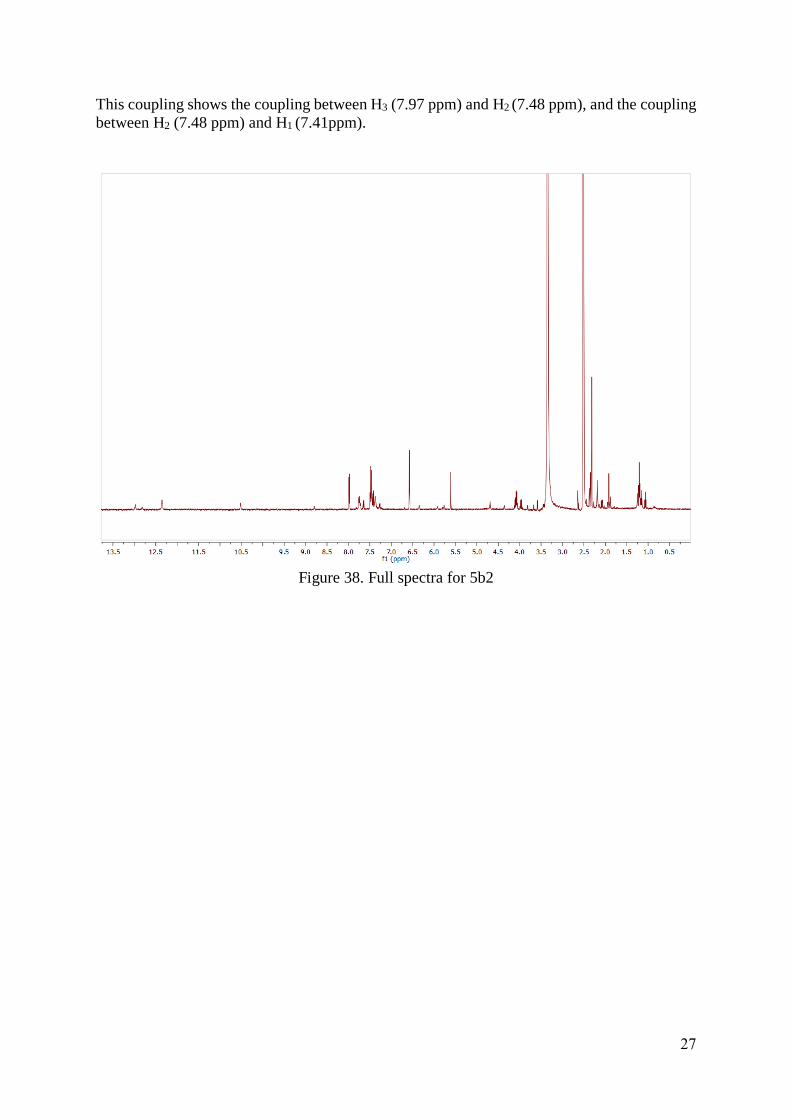
This coupling shows the coupling between H3 (7.97 ppm) and H2 (7.48 ppm), and the coupling
between H2 (7.48 ppm) and H1 (7.41ppm).
Figure 38. Full spectra for 5b2

28
Figure 39. Zoom of spectra for 5b2
It can be seen that there is some product present, however the is a considerable amount of
impurity in this sample. The pecks in the aromatic region show this. There will be no in depth
analyses for this spectra.
29
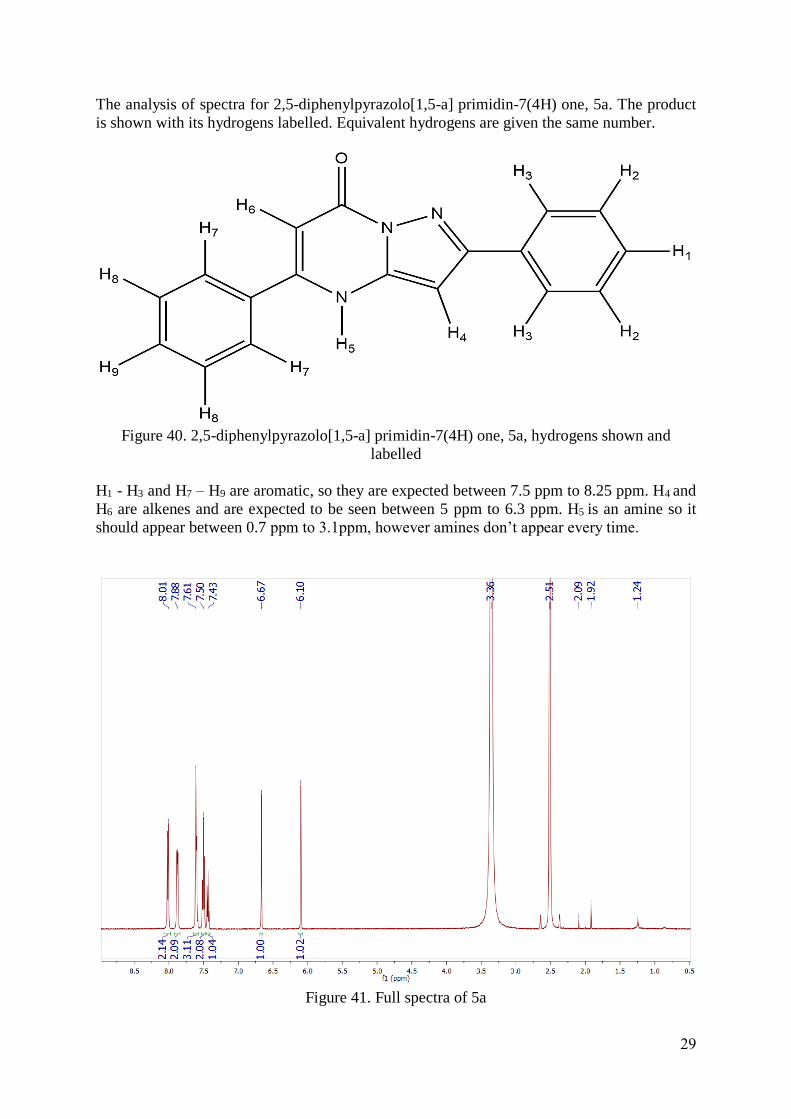
The analysis of spectra for 2,5-diphenylpyrazolo[1,5-a] primidin-7(4H) one, 5a. The product
is shown with its hydrogens labelled. Equivalent hydrogens are given the same number.
Figure 40. 2,5-diphenylpyrazolo[1,5-a] primidin-7(4H) one, 5a, hydrogens shown and
labelled
H1 - H3 and H7 – H9 are aromatic, so they are expected between 7.5 ppm to 8.25 ppm. H4 and
H6 are alkenes and are expected to be seen between 5 ppm to 6.3 ppm. H5 is an amine so it
should appear between 0.7 ppm to 3.1ppm, however amines don’t appear every time.
Figure 41. Full spectra of 5a
30
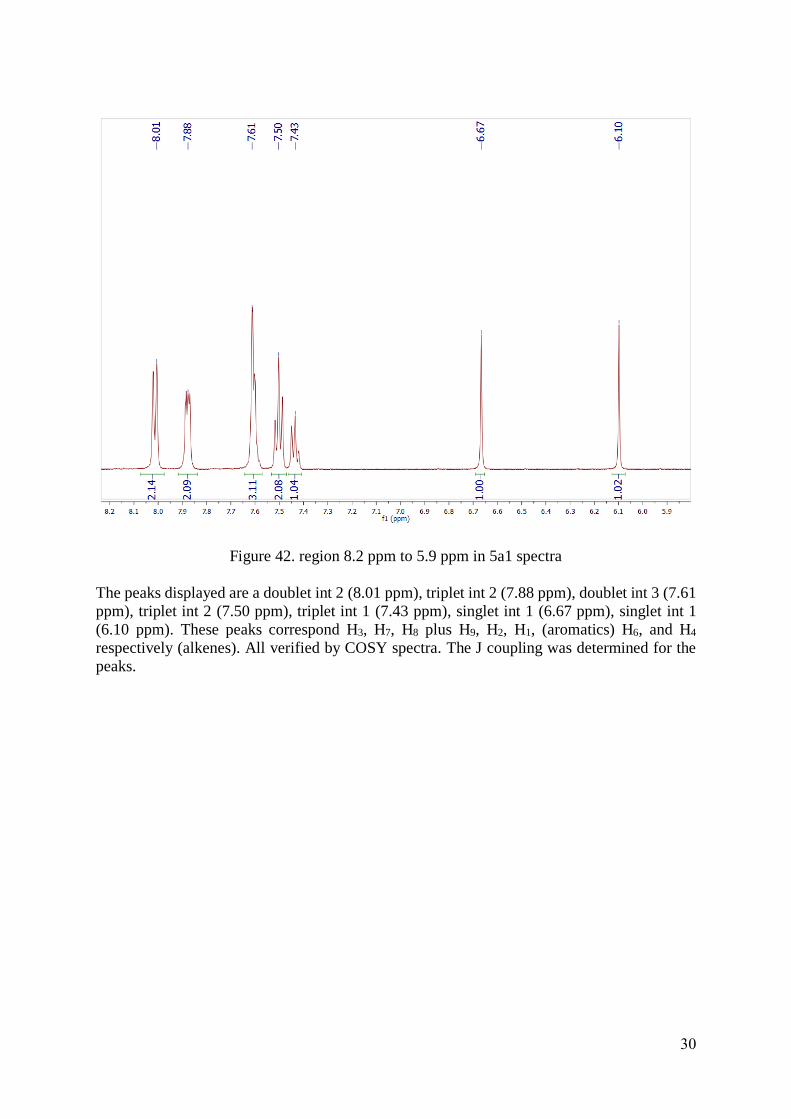
Figure 42. region 8.2 ppm to 5.9 ppm in 5a1 spectra
The peaks displayed are a doublet int 2 (8.01 ppm), triplet int 2 (7.88 ppm), doublet int 3 (7.61
ppm), triplet int 2 (7.50 ppm), triplet int 1 (7.43 ppm), singlet int 1 (6.67 ppm), singlet int 1
(6.10 ppm). These peaks correspond H3, H7, H8 plus H9, H2, H1, (aromatics) H6, and H4
respectively (alkenes). All verified by COSY spectra. The J coupling was determined for the
peaks.

31
Figure 43. Full COSY spectra for 5a1
Figure 44. COSY spectra zoomed in for 5a1

32
From these spectra the coupling between H3, H2 and H1 can be seen also the coupling between
H7 and the singlet created by H8 and H9.
Figure 45. The 3.9 ppm to 0.7 ppm region of the spectra.
There is a large singlet at 3.36 ppm, this is water in the DMSO. The singlet at 2.51 is the
DMSO solvent peak. The small singlet of at 1.92 ppm is from acetic acid. The small singlets
at 2.09 ppm and 1.24 ppm are acetone and ethanol respectively.
33
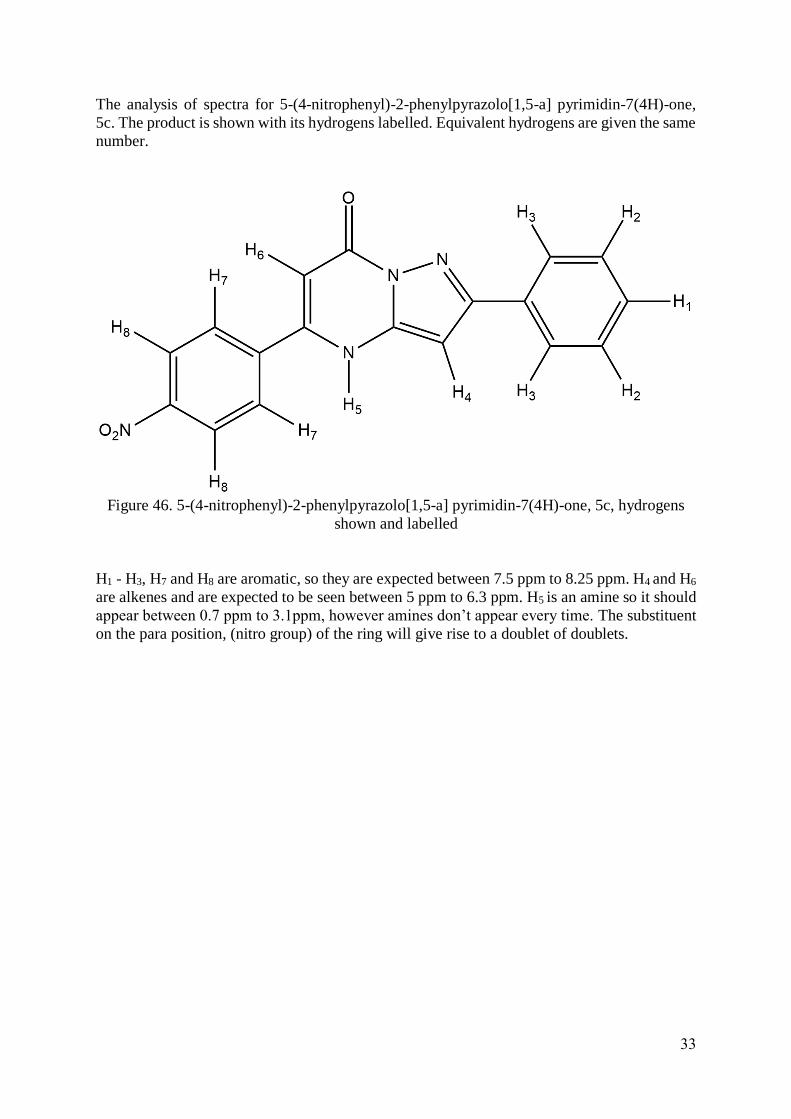
The analysis of spectra for 5-(4-nitrophenyl)-2-phenylpyrazolo[1,5-a] pyrimidin-7(4H)-one,
5c. The product is shown with its hydrogens labelled. Equivalent hydrogens are given the same
number.
Figure 46. 5-(4-nitrophenyl)-2-phenylpyrazolo[1,5-a] pyrimidin-7(4H)-one, 5c, hydrogens
shown and labelled
H1 - H3, H7 and H8 are aromatic, so they are expected between 7.5 ppm to 8.25 ppm. H4 and H6
are alkenes and are expected to be seen between 5 ppm to 6.3 ppm. H5 is an amine so it should
appear between 0.7 ppm to 3.1ppm, however amines don’t appear every time. The substituent
on the para position, (nitro group) of the ring will give rise to a doublet of doublets.
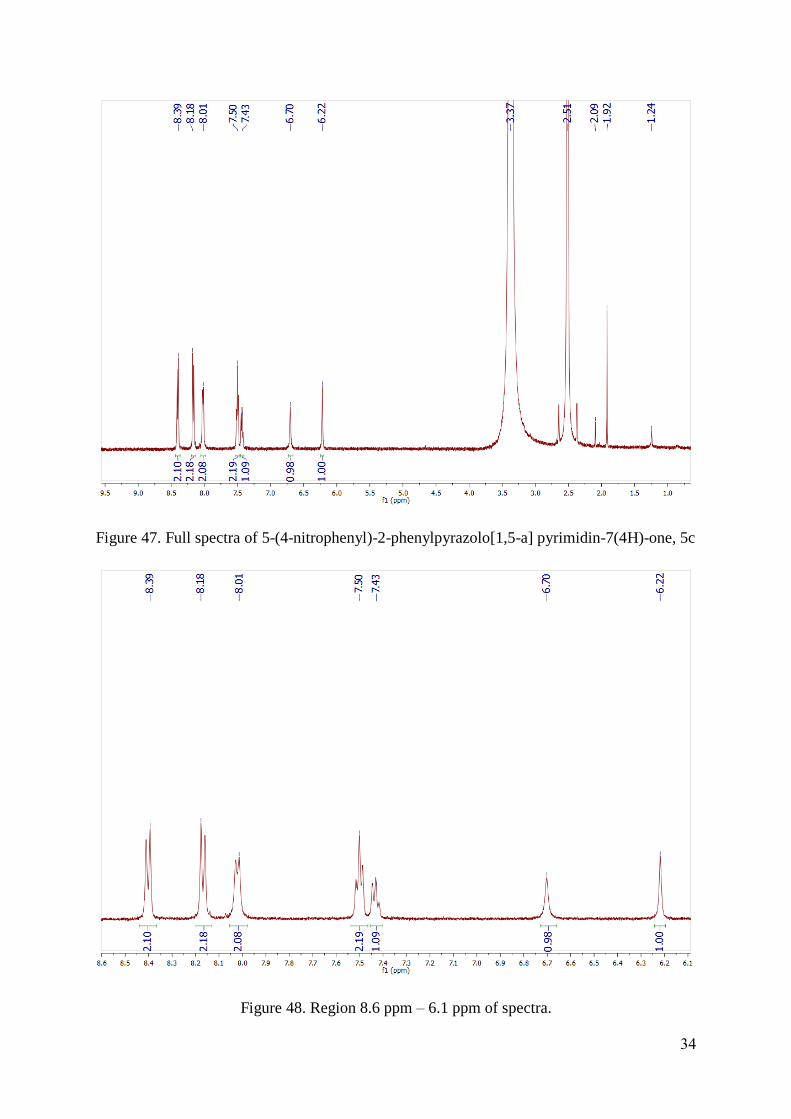
34
Figure 47. Full spectra of 5-(4-nitrophenyl)-2-phenylpyrazolo[1,5-a] pyrimidin-7(4H)-one, 5c
Figure 48. Region 8.6 ppm – 6.1 ppm of spectra.

35
The peaks displayed are a doublet int 2 (8.39 ppm), doublet int 2 (8.18 ppm), doublet int 2
(8.01 ppm), triplet int 2 (7.50 ppm), triplet int 1 (7.43 ppm), singlet int 1 (6.70 ppm), singlet
int 1 (6.22 ppm). These peaks correspond hydrogens H8, H7, H3, H2, H1, (aromatics) H6, and
H4 respectively(alkenes). Where H8 and H7 are the doublet of doublets which is visible to the
uneven peak height and the symmetric nature. All this is verified by COSY spectra. The J
coupling was determined for the peaks. The region near 0.0 ppm is effectively identical to the
previous products spectra. The large singlet at 3.37 ppm, is water in the DMSO. The singlet at
2.51 is the DMSO solvent peak. The small singlet of at 1.92 ppm is from acetic acid. The small
singlets at 2.09 ppm and 1.24 ppm are acetone and ethanol respectively.
Figure 49. COSY for 5c

36
Figure 50. Zoom of COSY for 5c
It shows coupling between peaks at 8.01 ppm and 7.50 ppm. This corresponds to H3 and H2.
There is coupling between peaks at 7.50 ppm and 7.43 ppm. This corresponds to H2 and H1.
37
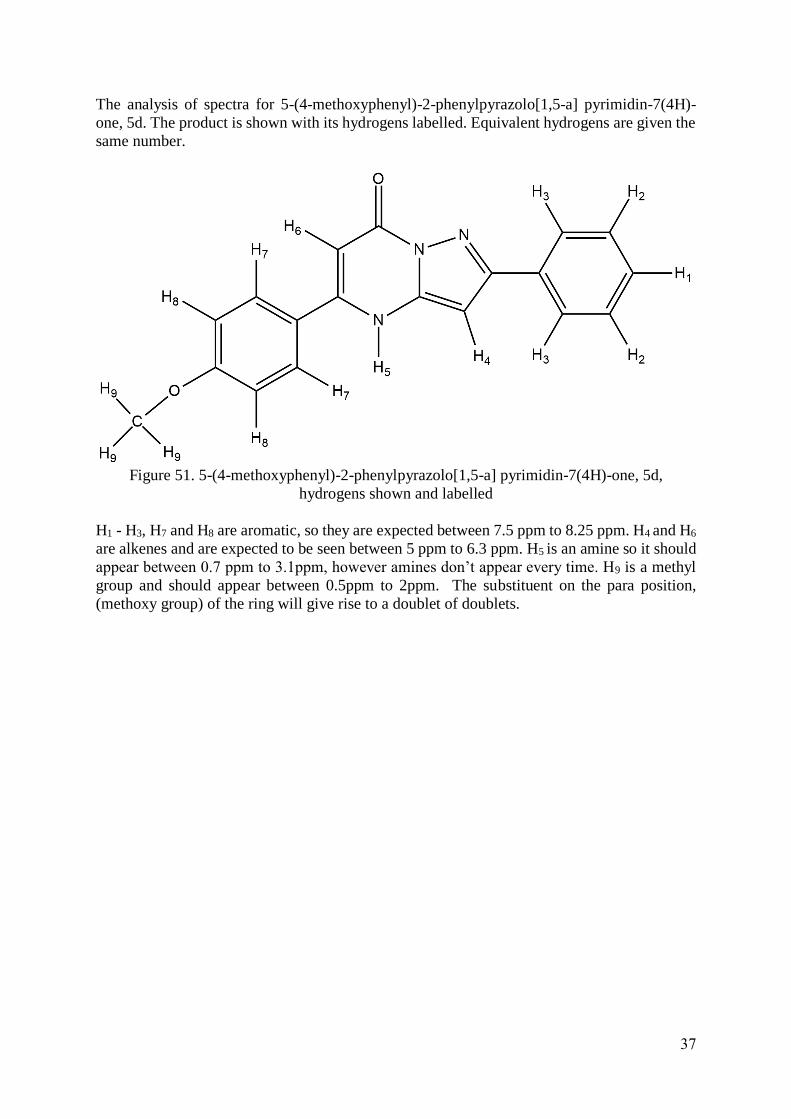
The analysis of spectra for 5-(4-methoxyphenyl)-2-phenylpyrazolo[1,5-a] pyrimidin-7(4H)-
one, 5d. The product is shown with its hydrogens labelled. Equivalent hydrogens are given the
same number.
Figure 51. 5-(4-methoxyphenyl)-2-phenylpyrazolo[1,5-a] pyrimidin-7(4H)-one, 5d,
hydrogens shown and labelled
H1 - H3, H7 and H8 are aromatic, so they are expected between 7.5 ppm to 8.25 ppm. H4 and H6
are alkenes and are expected to be seen between 5 ppm to 6.3 ppm. H5 is an amine so it should
appear between 0.7 ppm to 3.1ppm, however amines don’t appear every time. H9 is a methyl
group and should appear between 0.5ppm to 2ppm. The substituent on the para position,
(methoxy group) of the ring will give rise to a doublet of doublets.

38
Figure 52. Full spectra of for 5-(4-methoxyphenyl)-2-phenylpyrazolo[1,5-a] pyrimidin-
7(4H)-one, 5d
Figure 53. Region 8.1 – 5.9 ppm of spectrum

39
The peaks displayed are a doublet int 2 (7.99 ppm), doublet int 2 (7.84 ppm), triplet int 2 (7.50
ppm), triplet int 1 (7.43 ppm), multiplet int 2 (7.33 ppm), triplet int 2 (7.28 ppm), doublet int 1
(7.23 ppm), doublet int 2 (7.16 ppm), singlet int 1 (6.65 ppm) and singlet int 1 (6.06 ppm). The
peaks of the multiplet int 2 (7.33 ppm), triplet int 2 (7.28 ppm) and doublet int 1 (7.23 ppm)
are from a currently unknown impurity. Due to the comparable size of the integration with the
other peaks in the spectra. This impurity is present in a high percentage. The other peaks
doublet int 2 (7.99 ppm), doublet int 2 (7.84 ppm), triplet int 2 (7.50 ppm), triplet int 1 (7.43
ppm), doublet int 2 (7.16 ppm), singlet int 1 (6.65 ppm) and singlet int 1 (6.06 ppm) represent
H3, H7, H2, H1, H8, (the aromatic hydrogens) and H6, H4 (the alkenes) respectively. The J
coupling was determined for the peaks.
Figure 54. Region 4.5-0.9 ppm of spectrum
From previous spectra some of these peaks are already identified. The large singlet at 3.36
ppm, is water in the DMSO. The singlet at 2.51 is the DMSO solvent peak. The small singlet
at 1.92 ppm is from acetic acid. The small singlets at 2.09 ppm and 1.24 ppm are acetone and
ethanol respectively. The singlet int 3 (3.87 ppm) is the methyl group on the product H9. The
small triplet (4.22 ppm) singlet int 2 (3.68 ppm) and multiplet (3.07 ppm) are unknown and
believed to be from the fore mentioned impurity.

40
Figure 55. Full COSY of 5d
Figure 56. Zoomed COSY for 5d

41
From this COSY diagram the coupling between H7 and H8 can be observed, also the coupling
between H3, H2, and H1 can be observed. It is also able to show coupling between unknown
impurity peaks.
Figure 57. Zoomed COSY for 5d
Again coupling between the unknown impurity peaks can be seen.

42
2.2.4 Purposed mechanism for bicycle pyrimidine formation
Figure 58. Reaction mechanism for the bicycle pyrimidine part 1

43
Figure 59. Reaction mechanism for the bicycle pyrimidine part 2

44
2.2.5 Comparison between the synthesis of 2,5-diphenylpyrazolo[1,5-a] pyrimidin-7(4H)
one in 5 ml of acetic acid and 2.5 ml of acetic acid.
In the synthesis of 2,5-diphenylpyrazolo[1,5-a] pyrimidin-7(4H)-one, 5a, the reaction was
carried out in the same solvent with different volumes, 5 ml and 2.5 ml. Both reactions
produced the desired product. The 5 ml reaction produced a yield of 36%, while the 2.5 ml
produced a yield of 72%. Double the yield produced in half the volume of acetic acid. The
acetic acid is saturated with product, and the remained precipitates out. This also shows that
the product is polar as it dissolves in AcOH a polar acid. A higher yield may have been
produced, however it remained dissolved.
2.2.6 Comparison between solvents ethanol and acetic acid
In the synthesis of 5-methyl-2-phenylpyrazolo[1,5-a] pyrimidin-7(4H)-one, 5b, the reaction
was carried out in two different solvents to try and develop a new way to isolate product. The
reactions were carried out with everything the same apart from solvent, one reaction used 5 ml
of AcOH while the other used 5 ml of EtOH with a catalytic amount of AcOH. The 5 ml AcOH
experiment produced a pure sample of 73% yield. The other with the EtOH produced a 14%
yield of impure product. The produce is more soluble in EtOH than AcOH. The EtOH solution
never became saturated, hence the product didn’t precipitate out. The solution was concentrated
under reduced pressure, in an attempt to force the product to precipitate out. A solid was
produced however under NMR inspection it can be seen that the product is impure. A factor
that may have effected this is the reflux temperature. In the synthesis with AcOH the reaction
refluxes at 128 0C, while in EtOH it only refluxes at 88 0C. Therefore, it could be a possibility
that the reaction is not getting enough energy during the reaction time to overcome the
activation energy barrier to produce product in a large quantity.
2.2.7 Comparison with regards the steric effects between the methyl and phenyl R groups
By comparing these two groups, the steric importance of the R group will be investigated. The
phenyl is much large than the methyl group. The phenyl group produced a yield of 36% while
the methyl group produced a yield of 73%. This initial result indicates that small groups may
be more reactive, than larger R groups under the same reaction conditions i.e. solvent,
temperature, quantity, time and isolation methods. This higher reactivity in turn would produce
further yields produces greater yields. It appears that the smaller the group the easier it is for
the β-keto ester to undergo nucleophilic attack by the lone pair on the amino group of the amino
phenylpyrazole.

45
2.2.8 Comparison with regards electronic effects of a para substituent on a phenyl ring
using 4-nitrophenyl and 4-methoxyphenyl R groups
By comparing these two groups, the electronic importance of the R group will be investigated.
The 4-nitrophenyl is electron withdrawing while the 4-methoxyphenyl is electron donating.
The nitro has a Hammett p value of 0.77 while the methoxy has a value of -0.29. Groups with
a positive p value are electron withdrawing and groups with a negative p value are electron
donating.32
Figure 60. Resonance structures for ethyl 4-nitrophenylbenzoylacetate
46
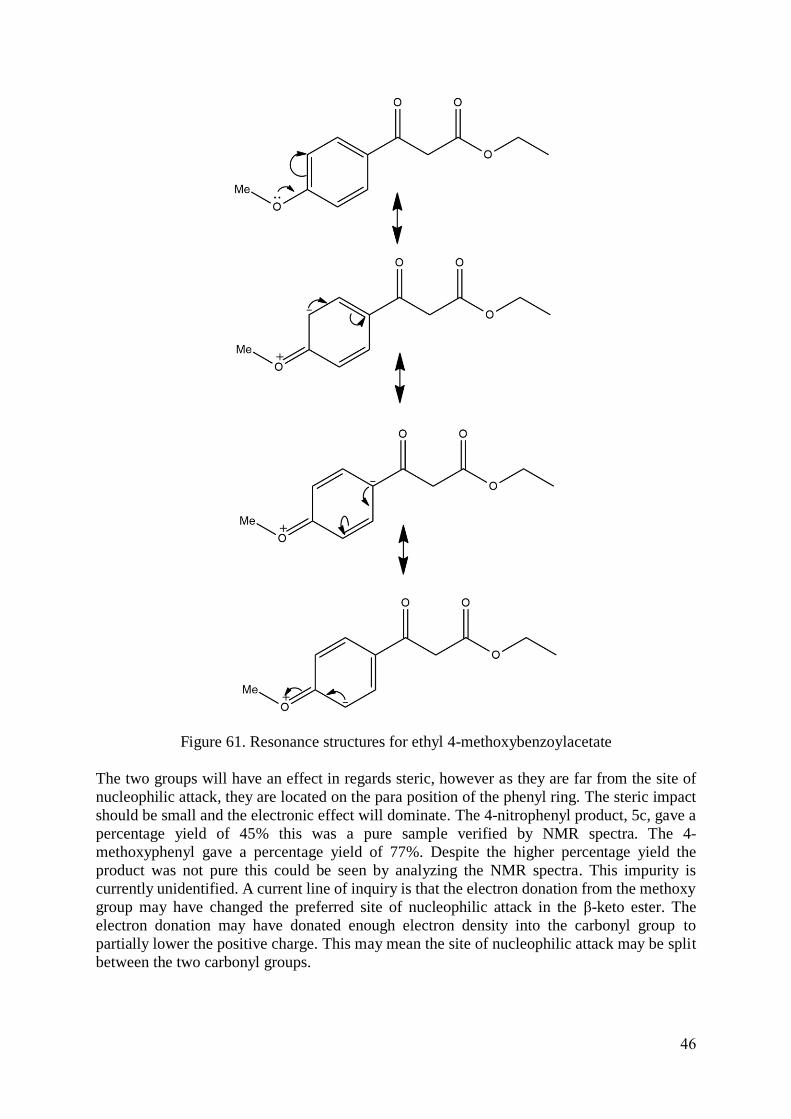
Figure 61. Resonance structures for ethyl 4-methoxybenzoylacetate
The two groups will have an effect in regards steric, however as they are far from the site of
nucleophilic attack, they are located on the para position of the phenyl ring. The steric impact
should be small and the electronic effect will dominate. The 4-nitrophenyl product, 5c, gave a
percentage yield of 45% this was a pure sample verified by NMR spectra. The 4-
methoxyphenyl gave a percentage yield of 77%. Despite the higher percentage yield the
product was not pure this could be seen by analyzing the NMR spectra. This impurity is
currently unidentified. A current line of inquiry is that the electron donation from the methoxy
group may have changed the preferred site of nucleophilic attack in the β-keto ester. The
electron donation may have donated enough electron density into the carbonyl group to
partially lower the positive charge. This may mean the site of nucleophilic attack may be split
between the two carbonyl groups.

47
Chapter 3: Future work and conclusion
3.1 Future work for the synthesis of the amino phenylpyrazole
3.1.1 New purification methods
Attempt to develop faster and better methods to purify amino phenylpyrazole. Convert the
amino phenylpyrazole to a quaternary ammonium salt. This could be done by mixing HCl and
dioxane with the reaction mixture. The quaternary ammonium salt will be insoluble in polar
dioxane. The impurities will be dissolved in the solution.
Figure 62. A chlorine salt of amino phenylpyrazole
3.1.2 Minimize reaction time
The experiment would be repeated however this time it would undergo tlc after 4 hours and 24
minutes. Every 30 minutes until the reaction was complete. This will allow for the minimal
amount of time for the reaction to occur be determined.
3.1.3 Mechanistic study
Carry out a mechanistic study to confirm the purposed mechanism. If any errors in the purposed
mechanism arise modify the mechanism.
3.2 Future work for the synthesis of bicycle pyrimidine
3.2.1 Minimize reaction time
The experiment would be repeated however this time it would undergo tlc every 30 minutes
until the reaction was complete. This will allow for the minimal amount of time for the reaction
to occur be determined.
3.2.2 New purification methods
Carry out a solvent screen of organic acids, to investigate if the product will precipitate out. If
the acid has a suitable freezing point cool the acid to force more product to precipitate out.
Carry out a solvent screen of solvents with a catalytic amount of acid, again if possible cool
the solution to force product to precipitate out. The acetic acid couldn’t be cooled as it freezes
48
at 17 0C. A similar acid is the next acid up in the carboxylic acid family, propanoic acid.
Propanoic acid has a freezing point of -24 0C. It should be possible to cool the acid to get the
produce to precipitate out. It has a boiling point of 141 0C similar to the acetic acids 118 0C.
Therefore, there will be enough energy supplied to overcome the activation energy barrier for
the reaction to progress. However, there are greater safety concerns in using the propanoic acid.
It unlike acetic acid is classed as a specific target organ toxic. It is a single exposure category
3 in regards the respiratory system.
3.2.3 Repeat experiment using a wide variety of R groups to full discover the steric and
electronic component of the reaction
A large variety of both commercially available and novel β-keto esters would be used in the
synthesis of bicycle pyrimidine derivatives. The steric effect on the yield would be recorded.
The conclusion of these experiments would not completely rely on steric effects as some
electron factors would contribute,
3.2.4 Will other electron donating groups like the methoxy give similar results in regards
impurities in the NMR spectra
Repeat the synthesis of bicycle pyrimidine using more electron donating groups on the para
position on the phenyl ring. Compare results with the 4-methoxyphenyl. If then there may be a
connection between electron donating groups and a possible, change in the mechanism.
3.3 Conclusion
The synthesis of amino phenylpyrazole can be carried out by conventional methods, using
reflux at 880C in ethyl acetate over 16.5 hours. It can be purified by column chromatography,
stationary phase silica powder and mobile phase 70:30 ethyl acetate:petroleum ether to give a
yield of 92%. The synthesis of bicycle pyrimidine can be carried out in 2.5 ml AcOH. This
gives a higher yield than if 5 ml AcOH is used. This is due to the inability of the AcOH to
dissolve anymore product, the solution has become saturated. The reaction appears to be
susceptible to steric effects. Based on results of experiments that were carried out, the smaller
the R group the higher yield of product under the same reaction conditions. For example, the
methyl group produced a 73% yield while the phenyl group had a 36%. This possible steric
effect should hold for groups directly connected to the carbon in the carbonyl group. This
implies that para substituents on the phenyl ring wouldn’t have a major impact steric, however
all groups in reality will have both a steric and electronic component. The para substituents
major effect on the reactions outcome should be electronic in nature. An electron withdrawing
group like the nitro group on the ring gave a higher yield than the phenyl ring, 45% opposed to
the 36% from the phenyl, 9% greater. Giving early indications that electron withdraw groups
may increase reaction yield. The effect of electron donating groups like the methoxy substituent
on the ring is currently unknown due to the presence of impurities and is an area of future work.
49
Chapter 4: Experimental
4.1 General
All reactions were carried out in a fume hood. Chemicals only left the fume hood to be analyzed
or processed by a piece of apparatus that was to large, cumbersome or communal to be brought
into the fume hood. The progress of reactions was observed by thin layer chromatography (tlc),
the plates used were silica gel 60 F254, 230-400 mesh ASTM, Merck, the plates were then
viewed under UV light. 1H spectra were recorded using a Bruker Avance 500 MHz
spectrometer the data was both analyzed by the computer programs TopSpin and MestReNova.
In the NMRs was TMS used as a standard, its signal was set to 0.00 ppm. In CDCl3 NMRs the
solvent peak was located at 7.27 ppm for 1H spectra. In DMSO NMRs the solvent peak was
located at 2.51 ppm for 1H spectra. The signal multiplicity is given by s singlet, d doublet, t
triplet, q quartet, dd doublet of doublets and br for broad. Concentration under reduced pressure
was carried out using a Buchi R-210, rotary evaporator. During column chromatography
powdered silica was used as the stationary phase and a Millipore Ireland pump was used to
push solvent through the column. All molar weights calculations and diagrams were done by
using the ChemBioOffice 2010© software.

50
4.2 Synthesis of amino phenylpyrazole
Figure 63. Structure of amino phenylpyrazole
Benzoylacetonitrile (0.870 g, 6.0 mmol) and hydrazine monohydrate (0.390 g, 7.8 mmol) were
dissolved in ethyl acetate (4 ml) and heated at reflux at 870C for 16.5 hours. The ethyl acetate
was removed under reduced pressure. The green residue was dissolved in the minimum amount
of DCM. The residue was purified using flash chromatography, mobile phase 70:30 ethyl
acetate:petroleum ether, to give a red solid, 933 mg (92%).
1H NMR: (500 MHz, CDCl3): δH 3.78 (br s, 2H, H5), 5.92 (s, 1H, H4), 7.33 (t, J = 7.4 Hz, 1H,
H1), 7.39 (t, J = 7.3 Hz, 2H, H2), 7.53 (d, J = 7.4 Hz, 2H, H3). 1H NMR data matches literature
data.30 Rf: 0.32 ( 7:3, EtOAc:PE).

51
4.3 General procedure for the synthesis of bicycle pyrimidines 5a, 5b, 5c, and 5d
4.3.1 Synthesis of 2,5-diphenylpyrazolo[1,5-a] pyrimidin-7(4H) one, 5a1 and 5a2
Figure 17. Structure of product 2,5-diphenylpyrazolo[1,5-a] primidin-7(4H) one, 5a
Ethyl benzoylacetate (115 mg, 0.6 mmol) and amino phenylpyrazole (96 mg, 0.6 mmol) they
were dissolved in acetic acid (5 ml). The reaction mixture was then refluxed for 16.5 hours.
The reaction was allowed to cool down, for 3 hours. The product / precipitate was filtered for.
It was washed with DCM (5 ml). The isolated product was a cream coloured powdered solid,
62 mg (36%), 5a1.
The experiment was repeated again however 2.5 ml of AcOH was used. The isolated product
was a cream coloured powdered solid, 124 mg (72%), 5a2.
1H NMR (500 MHz, DMSO): δH 6.10 (s, 1H, H4), 6.67 (s, 1H, H4), 7.43 (t, J = 7.4 Hz, 1H,
H1), 7.50 (t, J = 7.4 Hz, 2H, H2), 7.61 (d, J = 3.9 Hz, 3H, H8 + H9), 7.88 (t, J = 4.2 Hz, 2H, H7),
8.01 (d, J = 7.5 Hz, 2H, H3).

52
4.3.2 Synthesis of 5-methyl-2-phenylpyrazolo[1,5-a] pyrimidin-7(4H)-one, 5b1
Figure 19. Structure of product, 5-methyl-2-phenylpyrazolo[1,5-a] pyrimidin-7(4H)-one, 5b
Ethyl acetoacetate (78 mg, 0.6 mmol) and amino phenylpyrazole (96 mg, 0.6 mmol) they were
dissolved in acetic acid (5 ml). The reaction mixture was then refluxed for 16.5 hours. The
reaction was allowed to cool down, for 5 hours. The product / precipitate was filtered of. It was
washed with DCM (5 ml). The isolated product were small brown crystals, 99 mg (73%), 5b1.
The experiment was repeated. The solvent used was ethanol (5 ml) and acetic acid (3.4 μl). The
reaction mixture was then refluxed for 16.5 hours at 88⁰C. The reaction was allowed to cool
down, for 3 hours. The reaction mixture was concentrated under pressure. A solid was formed.
The solid was triturated with EtOH. The solid was filtered off and washed with DCM (5 ml).
The isolated product was a green solid, 19 mg (14%)*, 5b2.
1H NMR (500 MHz, DMSO): δH 2.31 (s, 3H, H7), 5.61 (s, 1H, H4), 6.57 (s, 1H, H6), 7.41 (t, J
= 7.2 Hz, 1H, H1), 7.48 (t, J = 7.5 Hz, 2H, H2), 7.97 (d, J = 7.5 Hz, 2H, H3).

53
4.3.3 Synthesis of 5-(4-nitrophenyl)-2-phenylpyrazolo[1,5-a] pyrimidin-7(4H)-one, 5c
Figure 21. Structure of product, 5-(4-nitrophenyl)-2-phenylpyrazolo[1,5-a] pyrimidin-7(4H)-
one, 5c
Ethyl 4-nitrobenzoylacetate (142 mg, 0.6 mmol) and amino phenylpyrazole (96 mg, 0.6 mmol)
they were dissolved in acetic acid (5 ml). The reaction mixture was then refluxed for 16.5
hours. The reaction was allowed to cool down, for 3 hours. The product / precipitate was
filtered of. It was washed with DCM (5 ml). The isolated product was a yellow solid, 90 mg
(45%), 5c.
1H NMR (500 MHz, DMSO): δH 6.22 (s, 1H, H4), 6.70 (s, 1H, H6), 7.43 (t, J = 7.1 Hz, 1H,
H1), 7.50 (t, J = 7.2 Hz, 2H, H2), 8.01 (d, J = 7.5 Hz, 2H, H3), 8.18 (dd, J = 8.4 Hz, 2H, H7),
8.39 (dd, J = 8.8 Hz, 2H, H8),
54
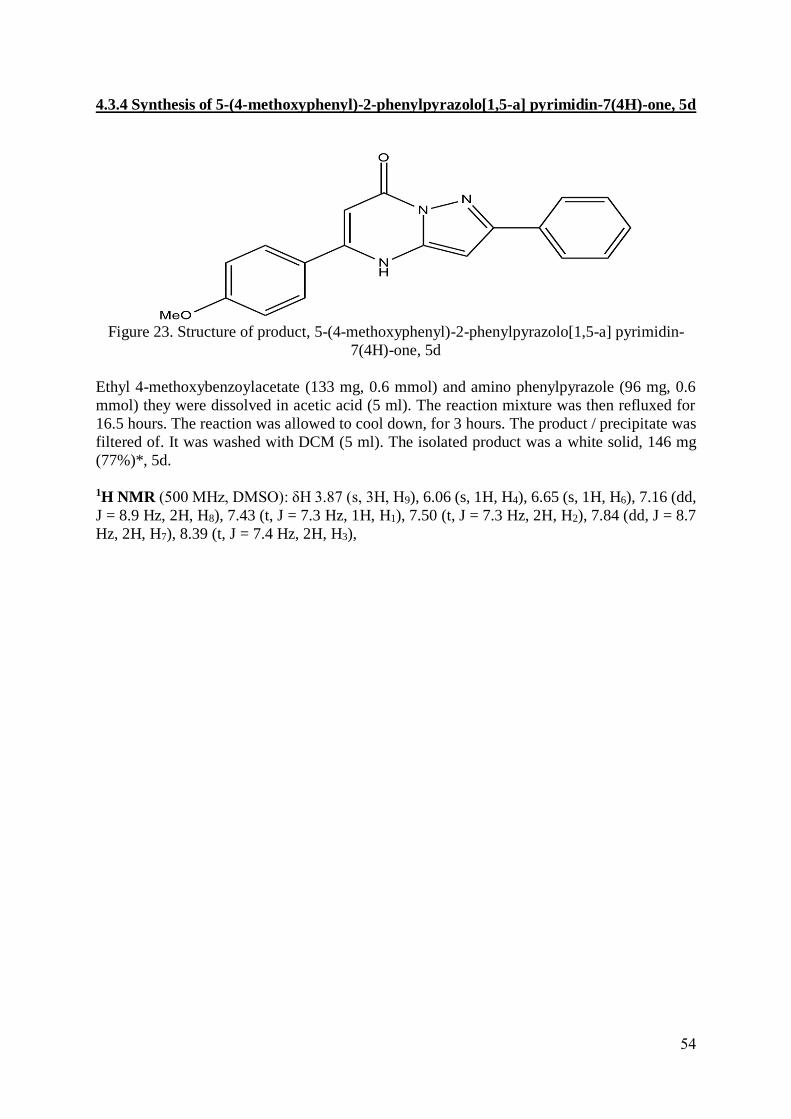
4.3.4 Synthesis of 5-(4-methoxyphenyl)-2-phenylpyrazolo[1,5-a] pyrimidin-7(4H)-one, 5d
Figure 23. Structure of product, 5-(4-methoxyphenyl)-2-phenylpyrazolo[1,5-a] pyrimidin-
7(4H)-one, 5d
Ethyl 4-methoxybenzoylacetate (133 mg, 0.6 mmol) and amino phenylpyrazole (96 mg, 0.6
mmol) they were dissolved in acetic acid (5 ml). The reaction mixture was then refluxed for
16.5 hours. The reaction was allowed to cool down, for 3 hours. The product / precipitate was
filtered of. It was washed with DCM (5 ml). The isolated product was a white solid, 146 mg
(77%)*, 5d.
1H NMR (500 MHz, DMSO): δH 3.87 (s, 3H, H9), 6.06 (s, 1H, H4), 6.65 (s, 1H, H6), 7.16 (dd,
J = 8.9 Hz, 2H, H8), 7.43 (t, J = 7.3 Hz, 1H, H1), 7.50 (t, J = 7.3 Hz, 2H, H2), 7.84 (dd, J = 8.7
Hz, 2H, H7), 8.39 (t, J = 7.4 Hz, 2H, H3),

55
References
(1) Reece, J. B.; Urry, L. A.; Cain, M. L.; Wasserman, S. A.; Minorsky, P. V.; Jackson, R.
B. Campbell Biology; 2010.
(2) Cossio, M. L. T.; Giesen, L. F.; Araya, G.; Pérez-Cotapos, M. L. S.; VERGARA, R.
L.; Manca, M.; Tohme, R. A.; Holmberg, S. D.; Bressmann, T.; Lirio, D. R.; Román, J.
S.; Solís, R. G.; Thakur, S.; Rao, S. N.; Modelado, E. L.; La, A. D. E.; Durante, C.;
Tradición, U. N. A.; En, M.; Espejo, E. L.; Fuentes, D. E. L. A. S.; Yucatán, U. A. De;
Lenin, C. M.; Cian, L. F.; Douglas, M. J.; Plata, L.; Héritier, F. International Textbook
of Diabetes Mellitus - Fourth Edition; 2012; Vol. XXXIII.
(3) Kaufman, F. R. Medical management of type 1 diabetes; 2012.
(4) Ostman, J.; Lönnberg, G.; Arnqvist, H. J.; Blohmé, G.; Bolinder, J.; Ekbom Schnell,
a; Eriksson, J. W.; Gudbjörnsdottir, S.; Sundkvist, G.; Nyström, L. J. Intern. Med.
2008, 263 (4), 386–394.
(5) Dods, R. Understanding Diabetes: A Biochemical Perspective; 2013; Vol. 51.
(6) Koopman, R. J.; Mainous, A. G.; Diaz, V. A.; Geesey, M. E. Ann. Fam. Med. 2005, 3,
60–63.
(7) Lobstein, T.; Baur, L. a; Uauy, R. Obes. Rev. 2004, 5 Suppl 1, 4–104.
(8) Astrup, a; Finer, N. Obes. Rev. 2000, 1 (2), 57–59.
(9) Metzger, B. E.; Gabbe, S. G.; Persson, B.; Buchanan, T. A.; Catalano, P. A.; Damm,
P.; Dyer, A. R.; Leiva, A. de; Hod, M.; Kitzmiler, J. L.; Lowe, L. P.; McIntyre, H. D.;
Oats, J. J. N.; Omori, Y.; Schmidt, M. I. Diabetes Care 2010, 33 (3), 676–682.
(10) Hartling, L.; Dryden, D. M.; Guthrie, A.; Muise, M.; Vandermeer, B.; Aktary, W. M.;
Pasichnyk, D.; Seida, J. C.; Donovan, L. Evid. Rep. Technol. Assess. (Full. Rep). 2012,
No. 210, 1–327.
(11) Barrett-Connor, E.; Ferrara, A. Diabetes Care 1998, 21 (8), 1236–1239.
(12) Lu, Y. L.; Huang, C. N. J. Intern. Med. Taiwan 2011, 22, 115–120.
(13) McNay, E. C.; Williamson, A.; McCrimmon, R. J.; Sherwin, R. S. Diabetes 2006, 55
(4), 1088–1095.
(14) Hill, M. D. Handb. Clin. Neurol. 2014, 126, 167–174.
(15) Buckley, C. M.; O’Farrell, A.; Canavan, R. J.; Lynch, A. D.; De La Harpe, D. V;
Bradley, C. P.; Perry, I. J. PLoS One 2012, 7 (7), e41492.
(16) Franco, O. H.; Steyerberg, E. W.; Hu, F. B.; Mackenbach, J.; Nusselder, W. Arch.
Intern. Med. 2007, 167, 1145–1151.
(17) Hamman, R. F.; Wing, R. R.; Edelstein, S. L.; Lachin, J. M.; Bray, G. A.; Delahanty,
L.; Hoskin, M.; Kriska, A. M.; Mayer-Davis, E. J.; Pi-Sunyer, X.; Regensteiner, J.;
Venditti, B.; Wylie-Rosett, J. Diabetes Care 2006, 29 (9), 2102–2107.
(18) Lim, E. L.; Hollingsworth, K. G.; Aribisala, B. S.; Chen, M. J.; Mathers, J. C.; Taylor,
R. Diabetologia 2011, 54 (10), 2506–2514.
(19) Robertson, R. P.; Davis, C.; Larsen, J.; Stratta, R.; Sutherland, D. E. Diabetes Care
2000, 23 (1), 112–116.
56
(20) (Rang, HP. Dale, MM. Ritter, JM. Flower, R. H. London: Churchill Livingstone
Elsevier 2011, 777.
(21) Cusi, K.; Consoli, A.; DeFronzo, R. A. J Clin Endocrinol Metab 1996, 81 (11), 4059–
4067.
(22) de Jager, J.; Kooy, A.; Lehert, P.; Wulffelé, M. G.; van der Kolk, J.; Bets, D.; Verburg,
J.; Donker, A. J. M.; Stehouwer, C. D. A. BMJ 2010, 340, c2181.
(23) Aguiree, F.; Brown, A.; Cho, N.; Dahlquist, G. Int. Diabetes Fed. 2013, No. 6, pp1–
pp160.
(24) Malik, V. S.; Hu, F. B. Curr. Diab. Rep. 2012, 12, 195–203.
(25) Kanoski, S. E.; Davidson, T. L. Physiol. Behav. 2011, 103 (1), 59–68.
(26) Hu, F. B. Diabetes Care 2011, 34 (6), 1249–1257.
(27) Zhang, P.; Zhang, X.; Brown, J.; Vistisen, D.; Sicree, R.; Shaw, J.; Nichols, G.
Diabetes Res. Clin. Pract. 2010, 87 (3), 293–301.
(28) Chauhan, A.; Sharma, P. K.; Kaushik, N.; A., C.; P.K., S.; N., K. Int. J. ChemTech
Res. 2011, 3 (1), 11–17.
(29) Bagley, M. C.; Davis, T.; Dix, M. C.; Widdowson, C. S.; Kipling, D. Org. Biomol.
Chem. 2006, 4 (22), 4158–4164.
(30) Beinat, C.; Reekie, T.; Banister, S. D.; O’Brien-Brown, J.; Xie, T.; Olson, T. T.; Xiao,
Y.; Harvey, A.; O’Connor, S.; Coles, C.; Grishin, A.; Kolesik, P.; Tsanaktsidis, J.;
Kassiou, M. Eur. J. Med. Chem. 2015, 95, 277–301.
(31) Jain, K. S.; Chitre, T. S.; Miniyar, P. B.; Kathiravan, M. K.; Bendre, V. S.; Veer, V. S.;
Shahane, S. R.; Shishoo, C. J. Curr. Sci. 2006, 90 (6), 793–803.
(32) Clayden, J.; Greeves, N.; Warren, S.; Wothers, P. Organic Chemistry; 2000.
(33) Nam; Grandberg; Sorokin. Chem. Heterocycl. Compd. 2003, 39 (9), 1210–1212.