thesis- computer simulation of rf for dry foods-v2 · 2010-04-19 · iv computer simulation of...
TRANSCRIPT

COMPUTER SIMULATION OF RADIO FREQUENCY (RF) HEATING IN DRY FOOD
MATERIALS AND QUALITY EVALUATION OF
RF TREATED PERSIMMONS
By
GOPAL TIWARI
A dissertation submitted in partial fulfillment of the requirements for the degree of
DOCTOR OF PHILOSOPHY
WASHINGTON STATE UNIVERSITY
Department of Biological Systems Engineering
MAY 2010

ii
To the Faculty of Washington State University:
The members of the Committee appointed to examine the dissertation of GOPAL
TIWARI find it satisfactory and recommend that it be accepted.
______________________________ Dr. Juming Tang, Chair ______________________________ Dr. Barbara Rasco ______________________________ Dr. John K. Fellman _____________________________ Dr. Shyam Sablani ______________________________ Dr. Shaojin Wang

iii
ACKNOWLEDGEMENT
I express my greatest gratitude to my advisor Dr. Juming Tang for his guidance,
support, consistent encouragement, and great patience throughout my studies and research.
Because of his insightful advices, understanding and moral support, I could stay focused on my
PhD research. I also express my sincere thanks to my doctoral committee members: Drs.
Barbara Rasco, John K. Fellman, Shyam Sablani and Shaojin Wang for their valuable time,
suggestions and comments whenever I approached them with problems. Dr. Shaojin Wang also
helped me in designing experiments and developing manuscripts during my research work.
I acknowledge Dr. Sohan Birla with whom I received valuable research inputs from
time to time. I thank to Galina Mikhaylenko, Wayne Dewitt, Frank Younce, and Vince Himsl
for providing technical assistance. I extend my thanks to my friends and fellow students
Balunkeswar Nayak, Kanah Kereilemang Mokwena, Derick Jiwan, Shunshan Jiao, Sumeet
Dhawan, Roopesh Shayamaldevi, Prabhakar Singh and Fermin Resurrection for the support
throughout my research.
Last but not the least, I express my deepest gratitude to my parents, brothers and their
families who have sacrificed a lot towards my education. Without their moral support, it was
not possible to accomplish this research.

iv
COMPUTER SIMULATION OF RADIO FREQUENCY (RF) HEATING IN DRY
FOOD MATERIALS AND QUALITY EVALUATION OF
RF TREATED PERSIMMONS
Abstract
by Gopal Tiwari, Ph.D.
Washington State University
May 2010
Chair: Juming Tang
Radio frequency (RF) heating is a novel heat treatment that has been explored for
control of pests and pathogens in several agricultural commodities such as fresh fruits, dry nuts,
food grains, legumes and flours. A major problem for the technology to be commercially
applicable is its non uniform heating in different food materials. It is important to understand,
investigate and analyze the complex behavior of RF heating. The present research was aimed to
study RF heating uniformity in food materials.
As a preliminary step of the research, RF heating was experimentally evaluated in
‘Fuyu’ persimmon, a selected specialty crop fruit. The objective was to develop a RF based
heat treatment protocol to control Mexican fruit fly in persimmon. Quality parameters,
including weight loss, firmness, soluble solids, titratable acidity, peel and pulp color, and calyx
browning of persimmons were evaluated after 7 days of RF heat treatments. Results showed
that RF heat treatment provided potential for disinfestations of persimmons with acceptable
quality.
As a next step, a computer model was developed to simulate RF heating in dry food
materials using finite element software FEMLAB. The aim of this part of the study was to

v
understand the complex behavior of RF heating in the dry food materials. Whole wheat flour
was selected as a representative material for dry food materials. Simulated and experimental
results showed that temperature values were higher at the corners and lower sections of flour in
a rectangular container after RF heating.
The computer model was further used to investigate the effect of different influencing
parameters on heating uniformity in dry food materials placed between two parallel electrodes.
Results showed that smaller values of dielectric properties resulted in better RF power
uniformities in the samples. RF power uniformity in cuboid shaped samples, placed on the
bottom electrode, first decreased and then increased with the increase in sample size. Reducing
electrode gap improved RF power uniformity. This research is useful to understanding the RF
heating mechanism, to improve heating uniformity in agricultural commodities, and to design
and scale up efficient RF systems.
vi
TABLE OF CONTENTS
ACKNOWLEDGEMENT
ABSTRACT
LIST OF TABLES
LIST OF FIGURES
OUTLINE OF DISSERTATION
CHAPTER 1……………………………………………………………………………………..1
RADIO FREQUENCY (RF) HEATING IN FRESH FRUITS AND DRY
AGRICULTURAL COMMODITIES: A REVIEW
1. Introduction………………………………………………………………………...…………2
2. RF heating mechanism………………………………………..................................................3
3. RF heating applications……………………………………………………….…....................4
3.1. Fresh fruits……………………………………………………………..……………4
3.2. Dry agricultural commodities….................................................................................6
3.2.1. Pest-insects control……………………………………………..…………6
3.2.2. Fungi control…………………………………………….………………..7
3.2.3. Pathogen control………………………………..…………………8
3.2.4. Enzymatic deactivation……………………………….…………..8
4. Mathematical models used for RF heating in dry agricultural commodities………....9
5. Current research directions………………………………………………………......10
References………………………………………………………………………….…..11
CHAPTER 2……………………………………………………………………………….…...18
vii
EFFECT OF WATER ASSISTED RADIO FREQUENCY HEAT TREATMENT ON THE
QUALITY OF ‘FUYU’ PERSIMMONS
1. Introduction……………………………………………………………….…………20
2. Materials and methods……………………………………………………..………...22
2.1. Sample preparations and thermal treatment designs………………….…...22
2.2. Treatment parameter determinations………………………………..……..23
2.3. Treatment procedures…………………………………………..……….…24
2.4. Quality evaluation…………………….…………………………….……..25
3. Results and discussions………………………………..…………………………….26
3.1. Comparison of thermal imaging and thermocouple methods…………..…26
3.2. Preheating time determination……………………………………….……26
3.3. Temperature time profile of persimmon…………………………….…….27
3.4. Quality……………………………………………………………..………27
3.4.1. Weight loss……………………………………………..………..27
3.4.2. Firmness……………………………………………….………...28
3.4.3. Peel and pulp color………………………………………..……..29
3.4.4. Total soluble solids and titratable acidity…………………..……29
3.4.5. Visual observations………………………………………..…….30
4. Conclusions……………………………………………………………………….…30
References……………………………………………………………………………...40
CHAPTER 3………………………………………………………………………………........45
COMPUTER SIMULATION OF RADIO FREQUENCY HEATING OF DRY FOOD
MATERIALS, PART I: MODEL DEVELOPMENT AND VALIDATION…………….……46

viii
1. Introduction………………………………………………………………………….47
2. Materials and methods………………………………………………………..……..49
2.1. Material selection……………………………………………………….…50
2.2. Dielectric and thermal properties measurement…………………….……..50
2.3. Development of computer model……………………………………….…50
2.3.1. Physical model…………………………………………………..50
2.3.2. Governing equations……………………………………….……51
2.3.3. Initial and boundary conditions……………………………….....52
2.3.4. Solution procedure…………………………………………….....53
2.4. Model validation…………………………………………………………...54
2.4.1. Material selection………………………………………………..54
2.4.2. Experimental procedure……………………………………….....55
3. Results and discussions……………………………………………………………...55
3.1. Dielectric and thermal properties of wheat flour………………………….55
3.2. Simulated thermal propertied of wheat flour……………………………...56
3.3. Comparison of simulated and experimental thermal profiles of wheat
flour………………………………………………………………….…….57
3.4. Sensitivity analysis…………………………………………………….…..58
4. Conclusions……………………………………………………………………….…58
References………………………………………………….…………………………..71
CHAPTER 4
COMPUTER SIMULATION OF RADIO FREQUENCY HEATING OF DRY FOOD
MATERIALS, PART II: MODEL PREDICTIONS………………………….………………..75

ix
1. Introduction……………………………………………………………..…………...77
2. Materials and methods………………………………………………..………….......79
2.1. Governing equations…………………………………………..……….......79
2.1.1. RF power density and Laplace equations…………..……………79
2.1.2. Average RF power density and RF power uniformity index
(PUI) of the sample…………………...………………….………80
2.2. Physical and simulation model…………………………………..………...80
2.3. DPs of sample and surrounding medium……………………….……….…81
2.4. Boundary conditions…………………………………………….………....81
2.5. Simulation methodology…………………………………….…………….81
2.6. Simulation sequence………………………………………………….……82
2.6.1. Simulation with varying sample size, position, and shape……....82
2.6.2. Simulation with varying sample DPs of the sample and
surrounding medium……………………………….……..……...83
2.6.3. Simulation with varying electrode gap and top electrode
configuration………………………………………………..........83
3. Results and discussions……………………………………………………….……..84
3.1. Distribution of RF power density in different sample sizes…………….....85
3.2. Distribution of RF power density in different sample shapes at
different positions between the RF electrodes…………………….……..…85
3.3. Effect of sample size on sample PUI…………………………….………...86
3.4. Effect of sample vertical position on sample PUI………………….……...86
3.5. Effect of DPs of sample and surrounding medium on sample PUI….…….88

x
3.6. Effect of electrode gap on PUI………………………………………….…88
3.7. Effect of top electrode bending/configuration………………………….…89
4. Conclusions……………………………………………………………………….....89
References…………………………………………………………………………….105
CONCLUSIONS AND RECOMMENDAIONS………………………………………..……109
xi
LIST OF TABLES
Chapter 2
Table 1. Experimental design of radio frequency heat treatment……………..…………31
Table 2. Comparisons of measured surface and core temperatures of ‘Fuyu’
persimmon between thermal imaging (TI) and thermocouple (TC)
methods during preheating and hydro-cooling…………………………………32
Table 3. Preheating time determinations at 40°C water baths based on heating
uniformity after RF treatment of ‘Fuyu’ persimmon at three different
target temperatures……………………………………………...……………...33
Table 4. Quality parameters of control and RF treated ‘Fuyu’ persimmons
after 7 days storage at room temperature (22°C, 35% RH)…………...………..34
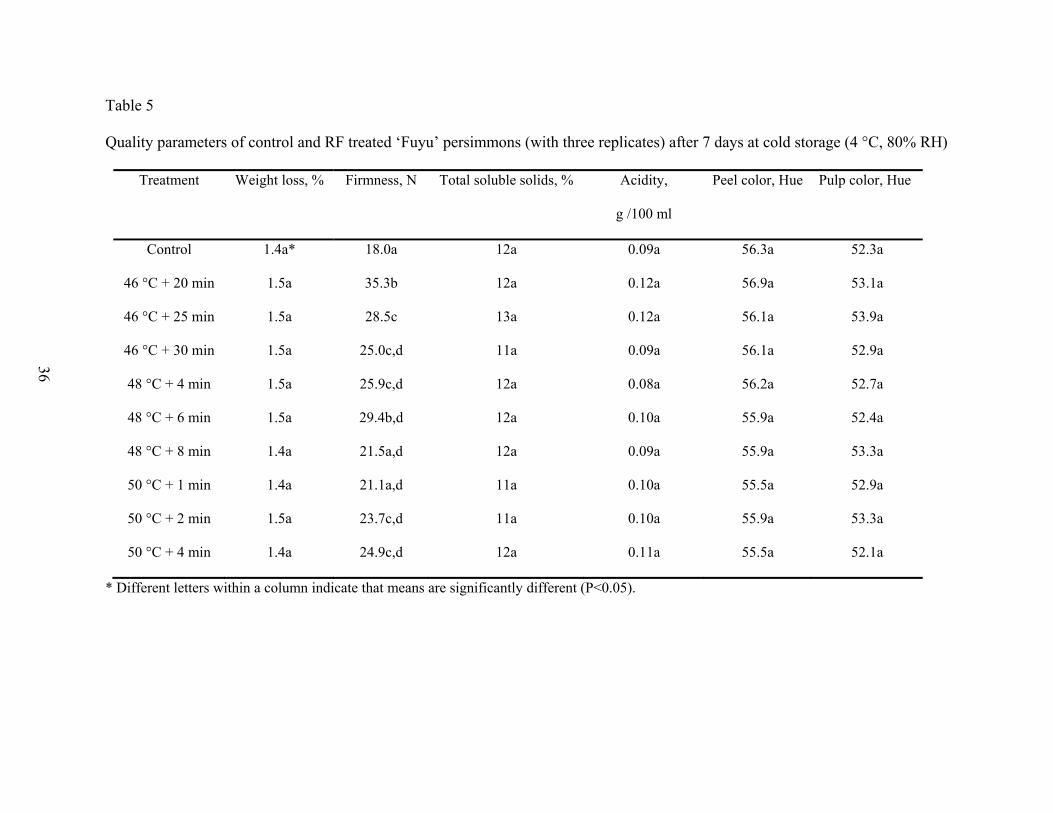
Table 5. Quality parameters of control and RF treated ‘Fuyu’ persimmons
after 7 days at cold storage (4 °C, 80% RH)…………………………………...35
Table 6. ANOVA P values (α = 0.05) for the effect of treatment, storage and
treatment × storage interaction for persimmon quality parameters………...…..36
Chapter 3
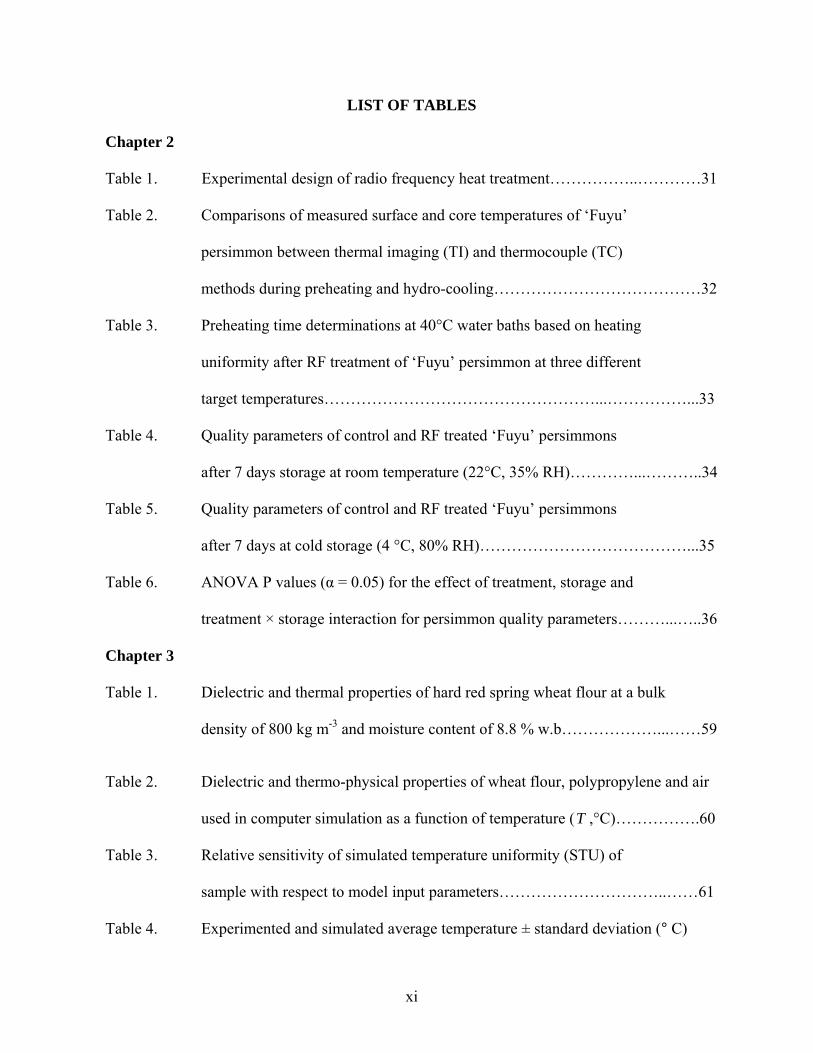
Table 1. Dielectric and thermal properties of hard red spring wheat flour at a bulk
density of 800 kg m-3 and moisture content of 8.8 % w.b………………...……59
Table 2. Dielectric and thermo-physical properties of wheat flour, polypropylene and air
used in computer simulation as a function of temperature (T ,°C)…………….60
Table 3. Relative sensitivity of simulated temperature uniformity (STU) of
sample with respect to model input parameters…………………………..……61
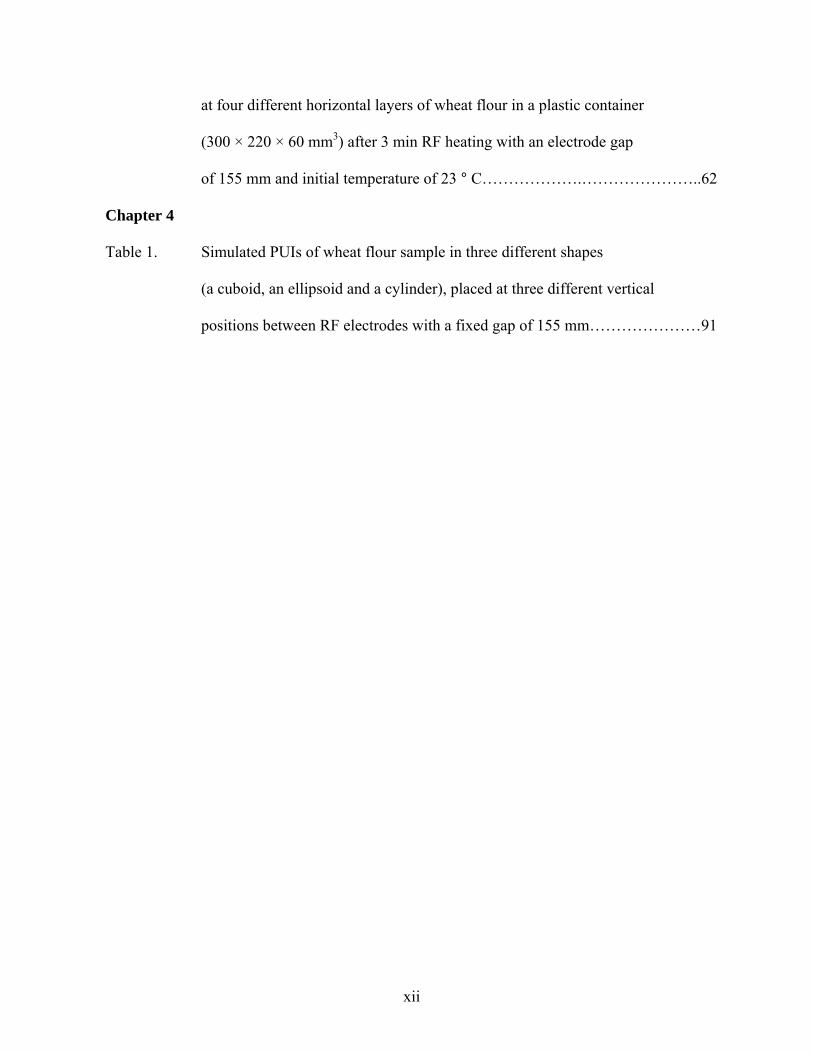
Table 4. Experimented and simulated average temperature ± standard deviation (° C)
xii
at four different horizontal layers of wheat flour in a plastic container
(300 × 220 × 60 mm3) after 3 min RF heating with an electrode gap
of 155 mm and initial temperature of 23 ° C……………….…………………..62
Chapter 4
Table 1. Simulated PUIs of wheat flour sample in three different shapes
(a cuboid, an ellipsoid and a cylinder), placed at three different vertical
positions between RF electrodes with a fixed gap of 155 mm…………………91

xiii
LIST OF FIGURES
Chapter 2
Fig. 1. Experimentally determined preheating and radio frequency (RF) heating times
for the surface and core temperature of ‘Fuyu’ persimmon to each of the three
selected temperatures…………………………………………………………………37
Fig. 2. Heating and cooling profiles for surface and core of ‘Fuyu’ persimmon
(diameter of 7 cm), subjected to preheating in hot water at 40 °C followed by
RF heating to raise temperature up to 48 °C, holding at 48 °C for 6 min and
hydro-cooling for 30 min at 4 °C water………………………………………………38
Fig. 3. Temperature distributions of persimmons obtained by thermal imaging after:
(a) water preheating at 40 °C for 20 min, (b) RF heating from 40°C to 48°C,
(c) holding in hot water at 48 °C for 6 min, and (d) cooling in cold water at
4 °C for 30 min……………………………………………………………………….39
Chapter 3
Fig. 1. Schematic diagram of a 12 kW, 27.12 MHz radio frequency system……………..…63
Fig. 2. Geometrical and boundary conditions of one quadrant of 12 kW, 27.12 MHz
RFsystem (dimensions are in mm)…………………………………………………...64
Fig. 3. Flow chart of modeling using FEMLAB 3.4………………………………………....65
Fig. 4. Simulated temperature (°C) profiles of one quadrant wheat flour sample
(150 × 110 × 60 mm3) at (a) four different horizontal layers (0, 20, 40, and 60 mm)
from the bottom (b) four different vertical layers (0, 36, 72, and 110 mm) from the
vertical center plane of sample after 3 min RF heating with an electrode gap
155 mm and initial temperature 23 °C……………………………………………….66
xiv
Fig. 5. Simulated electric field distribution (a) and RF power density distribution
(W m-3) of one quadrant wheat flour sample (150× 110 × 60 mm3) after 3 min
RF heating with an electrode gap 155 mm…………………………………………..67
Fig. 6. Experimental (a) and simulated (b) temperature distributions (°C) of hard
red spring wheat flour in top and first mid layers (60 and 40 mm from the
bottom of sample) placed in a polypropylene container (300×220×60 mm3)
on the top of the bottom electrode with the comparison of the temperature
profiles (c) along the line LL’, after 3 min RF heating with an initial temperature
of 23 °C and a fixed electrode gap of 155 mm……………………………………….68
Fig. 7. Experimental (a) and simulated (b) temperature distributions (° C) of hard
red spring wheat flour in second mid and bottom layers (20 and 0 mm
from the bottom of sample) placed in a polypropylene container
(300×220×60 mm3) on the bottom electrode with the comparison of the
temperature profiles (c) along the line LL’ after 3 min RF heating with an
initial temperature of 23 °C and a fixed electrode gap of 155 mm………………......69
Fig. 8. Experimental and simulated temperature-time histories of hard red spring
wheat flour at the center of first mid layer (40 mm) from the bottom
of sample (300×220×60 mm3), placed in a polypropylene container on the
top of grounded electrode during 3 min RF heating with an electrode gap
of 155 mm…………………………………………………………………………….70
Chapter 4
Fig. 1. Geometrical and boundary condition of one quadrant of 12 kW, 27.12 MHz RF
system (dimensions are in mm)………………………………………………………92
xv
Fig. 2. Schematic diagram of radio frequency cavity showing change in top electrode
configuration by bending it upward from its both ends at different lengths and
angles…………………………………………………………………………………93
Fig. 3. Simulated RF power density contours (W m-3) of wheat flour sample in three
different sizes, placed on the bottom electrode with a fixed electrode gap of
155 mm. Top electrode size was 525 × 400 mm2……………………………………94
Fig. 4. Simulated RF power density contours (W m-3) of wheat flour sample in three
different shapes (a cuboid, an ellipsoid and a cylinder) placed at three different
vertical positions between the RF electrodes of fixed gap of 155 mm………............95
Fig. 5. Simulated RF power uniformity indexes (PUIs) of cuboid shaped wheat flour
mass with varying sample lengths and widths. Cuboids were placed on the bottom
electrode with top electrode size (525 × 400 mm2) and a fixed electrode gap of
155 mm. Sample heights were set as 60 mm…………………………........................96
Fig. 6. Simulated RF power uniformity indexes (PUIs) of cuboid shaped wheat flour with
varying sample heights. Samples were kept on the bottom electrode with a fixed
electrode gap of 155 mm. Top electrode size was 525 × 400 mm2 and samples
length and width both were set as 150 mm…………………………..........................97
Fig. 7. Simulated power uniformity indexes (PUIs) of cuboid shaped wheat flour in three
different sizes, kept at seven different vertical positions (in mm) under the fixed
electrode gap of 155 mm………………………………………………......................98
Fig. 8. Simulated power uniformity indexes (PUIs) in cuboid shaped sample
(150×150×60 mm3) with varying DPs. Samples were placed on the bottom
electrode with an electrode gap of 155 mm…………………………………………..99

xvi
Fig. 9. Trends of simulated power uniformity indexes (PUIs) of samples with varying
dielectric constants in five different sizes. Loss factor value fixed as 10…………..100
Fig. 10. Simulated power uniformity indexes (PUIs) in sample (150×150×60 mm3) in
different surrounding medium dielectric constant. Sample DPs was fixed as
(8 10 * j− ) and it was kept on the bottom electrode with an electrode gap
of 155 mm…………………………………………………………………………...101
Fig. 11. Simulated power uniformity indexes (PUIs) of cuboid shaped wheat flour
(150×150×60 mm3) with varying electrode gaps. Sample was kept on the
bottom electrode with an electrode gap of 155 mm………………………………...102
Fig. 12. Simulated power uniformity indexes (PUIs) in a cuboid shaped wheat flour
(300 ×210 × 60 mm3) sample, placed on the bottom electrode when top electrode
(525×400 mm2) was bent (A) at six different positions (0, 100, 200, 300, 400 and
500 mm) along the length of electrode, keeping bending angle fixed as 15°.
(B) at different angles (in degrees), keeping bending position fixed as
200 mm……………………………………………………………………………..103
Fig. 13. Simulated power density contours (W m-3) in a cuboid shaped wheat flour
sample (300 ×210 × 60 mm2) placed on the bottom electrode when top
electrode (525×400 mm2) was (A) bent 100 and 300 mm along the length
of electrode, keeping bending angle fixed as 15° (B) bent upwards 5° and 45°,
keeping bending position fixed as 200 mm…………………………………………104
xvii
OUTLINE OF DISSERTATION
The dissertation is organized into four self-contained chapters. The first chapter
provides an overview of radio frequency (RF) heating, its various applications in dry food
materials and fresh fruits, and the motivation for developing a computer model to help
understand RF heating behavior in dry food materials. Chapter 2 evaluates the potential of RF
heating in a selected fresh fruit persimmon (Diospyros kaki) as a quarantine heat treatment to
control Mexican fruit fly (Anastrepha ludens). Chapter 3 describes a mathematical model for
RF heating of dry food products for a parallel plate RF system. Chapter 4 investigates the effect
of different influencing parameters on the RF heating behavior of dry food products.
Since the dissertation is composed of individually published and prepared manuscripts,
the chapter formats vary according to submitted journals. A list of articles published or
manuscripts prepared from this research are shown below:
Tiwari, G., Wang, S., & Tang, J. (2010). Radio frequency (RF) heating in fresh fruits and dry
agricultural commodities: A review. Journal of Food Engineering
(Chapter 1)
Tiwari, G., Wang, S., Birla, S.L., & Tang, J. (2008). Effect of water-assisted radio frequency
heat treatment on the quality of 'Fuyu' persimmons. Biosystems Engineering, 100(2),
227-234. (Chapter 2)
Tiwari, G., Wang, S., Tang, J., & Birla, S.L. (2010). Computer simulation of radio frequency
heating of dry food materials, Part I: model development and validation. Journal of
Food Engineering (Chapter 3)
xviii
Tiwari, G., Wang, S., Tang, J., & Birla, S.L. (2010). Computer simulation of radio frequency
heating of dry food materials, Part II: model predictions. Journal of Food Engineering
(Chapter 4)

1
CHAPTER 1
RADIO FREQUENCY HEATING IN FRESH FRUITS AND DRY AGRICULTURAL
COMMODITIES: A REVIEW
G. Tiwari, S. Wang, J. Tang
Prepared manuscript for the Journal of Food Engineering
Department of Biological Systems Engineering,
Washington State University, Pullman, WA 99164-6120, USA
Corresponding author:
Juming Tang, 213 LJ Smith Hall, Pullman, WA 99164-6120, USA;
Phone: 509-335-2140; fax: 509-335-2722; e-mail: [email protected].

Abstract
The literature review focuses on the radio frequency (RF) heating application on fresh fruits
and dry agricultural commodities. RF heating mechanism and different available mathematical
models for RF heating in dry agricultural commodities are also discussed in detail. It was
identified that complex nature of RF heating needs to be investigated experimentally as well as
mathematically.
1. Introduction
Conventional heating methods use steam or hot water or hot air or a combination of any
of them to heat food materials for food safety against pathogens, insects and pests. These
methods are relatively slow as they rely on slow heat transfer from outer to inner sections of
samples. The larger the sample sizes, the slower the heat transfer (Wang et al., 2001b). Slow
heating in food materials often result in inferior food quality in terms of texture, color, flavor,
and nutritional values. The desire to eliminate these problems and achieve fast and effective
heating for food materials has increased interest in using novel thermal technologies such radio
frequency (RF) and microwave (MW) energy.
RF and MW heating involve interaction of electromagnetic (EM) field with food
materials. When food materials are placed in an alternating EM field, charges (free ions and
electric dipoles) present in foods get displaced and attempt to follow changes in external
alternating EM field. The EM energy absorbed by the material to carry out these displacements
is dissipated as heat. Since nature of heat is volumetric, these methods are rapid compared to
other conventional heating methods. In an EM spectrum, RF (3-300 MHz) and MW (300 MHz-
300 GHz) bands occupy adjacent sections, with RF waves having lower frequencies. The major

3
advantage of RF heating over MW heating is its ability to penetrate deeper in food materials as
RF wave length is much longer (e.g., ~ 11 m at 27.12 MHz) than MW wavelength (e.g., ~ 12
cm at 2450 MHz). The only concern with the RF heating technology is its non uniform heating
(Tang et al., 2000). Different factors such as sample dielectric and thermo-physical properties,
size, shape, its position between the RF electrodes, and electrode configuration may affect
temperature uniformity in a RF treated food product. Therefore, it is essential to understand
complex behavior of RF heating mathematically as well as experimentally.
2. RF heating mechanism
An accurate calculation of RF power density (Q , W m-3) is essential to determining
temperature rise in food materials during RF heating. RF power density in the material is given
by (Rowley, 2001):
2"2 oQ fπ ε ε= E (1)
where f is the frequency (Hz), oε and "ε are the permittivity of the free space (8.86 ×
10-12 F m-1), and the loss factor of the material, respectively. E is the modulus of electric field
(V m-1). Temperature rise in the food materials can be calculated by the unsteady heat transfer
equation given by (Birla et al., 2008):
p
T QTt C
αρ
∂= ∇ ∇ +
∂ (2)
where T is the local temperature (°C) inside the material, t is the time (s) of heating, ρ , α ,
and pC are the density (kg m-3), thermal diffusivity (m s-2) and specific heat (J kg-1 °C-1) of the
food material, respectively.
It is clear from the Eq. (1) that determination of electric field is necessary to calculate
the RF power density inside the dielectric material. Electric field inside the RF applicator can

4
be determined by solving a set of partially differential equations (Eqs. 3-6), known as Maxwell
equations (Balanis, 1989).
t
µ ∂∇× = −
∂HE (3)
0 ( ' ")c jt
σ ε ε ε ∂∇× = + −
∂EH E (4)
vρ∇ ⋅ =D (5)
0∇ ⋅ =H (6)
where E , H and D are electric field (V m-1), magnetic field (A m-2), and electric flux density
(C m-2) of the dielectric material, respectively. 'ε , µ , vρ , cσ are the dielectric constant,
magnetic permeability (H m-1), free volume charge density (C m-3) and electrical conductivity
(S m-1) of the material, respectively. A general solution of Maxwell equations leads to wave
nature of RF electric field. Since, RF wave lengths are substantially longer (e.g., ~ 11 m at
27.12 MHz) compared to practically available RF applicator sizes, Maxwell equations can be
simplified into a single Laplace equation by neglecting the effect of magnetic field. The
assumption results in the static RF electric field approximation inside the RF applicator.
Laplace equation is used by (Birla et al., 2008):
( + 2 ( ' ") ) 0oj f j Vσ π ε ε ε∇ − ∇ = (7)
where j = 1− , V is the voltage between the two electrodes (V) and related to the electric
field ( V= −∇E ).
3. RF heating applications
3.1. Fresh fruits
RF heating has been explored as an potential alternative quarantine treatment to control
insect pests such as codling moth, Mexican fruit fly, and Mediterranean fruit fly in fresh fruits.
5
Quarantine security against insect and pests in fresh fruits is required before exporting them to
countries such as Japan and South Korea. Currently, methyl bromide fumigation is used to
control pests in fresh fruits (Aegerter & Folwell, 2000) but its future use is uncertain as it has
been recognized as an ozone depleting substance under Montreal Protocol (USEPA, 1998).
Increased international pressure to limit the use of methyl bromide due to environmental issues,
continual increase in price and reduced production result in urgent needs for developing non-
chemical alternative quarantine treatments. Ikediala et al. (2002) evaluated the feasibility of RF
heating as a potential postharvest treatment against codling moth in cherries. Cherries
immersed in water were RF heated in a 6 kW RF system. The dielectric and ionic conductivity
properties of the water and that of the fruit were matched by adding salt in the water to improve
temperature uniformity in RF treated cherries. Birla et al. (2004) developed a fruit mover to
improve the RF heating uniformity in large fruits such as apples and oranges. Rotation and
movement to fruits subjected to RF heating improved temperature uniformity in treated fruits.
Birla et al. (2005) applied RF energy on oranges to control Mediterranean fruit fly. Oranges
immersed in saline water were rotated in the fruit mover and their temperatures were raised
from 19 to 48 °C using RF heating. These authors reported temperature non uniformity in
oranges and recommended conventional hot water heating prior to RF heat treatment in fresh
fruits to improve temperature uniformity in fresh fruits. Based on the recommendations, Wang
et al. (2006b) combined hot water surface preheating with RF core heating to develop RF based
heat treatment protocol for apples. Treatment parameters were selected based on the minimum
time-temperature conditions required for 100% mortality of fifth-instar codling moth. Results
showed that hot water assisted RF heating improved temperature uniformity in apples. Monzon
et al. (2007) applied RF heating in persimmon, a specialty fruit crop as a quarantine heat

6
treatment against Mexican fruit fly. In that study, persimmons were immersed in salt water to
reduce non-uniform heating during RF treatments. The dielectric properties of water were
adjusted to match that of persimmon by adding appropriate amount of salt. RF non-uniform
heating was still found in the treated persimmons, resulting in loss of firmness and calyx
browning in some treatments. Recently, the water assisted RF treatments for disinfesting
mangoes were also conducted (Sosa-Morales et al., 2009). Quality parameters such as firmness,
soluble solids and acidity of treated mangoes were measured and compared with controls after
12 days of storage at 21°C. No significant difference in quality parameters between RF treated
and control mangoes were reported in this study.
3.2. Dry agricultural commodities
Advancements of RF heating in dry products started in 1940s, when RF heating was
first used to control molds in breads (Cathcart et al., 1947). RF heating technology in dry
agricultural commodities was mainly used to control pest insects, fungi, pathogens and
enzymatic activity. A brief history of research activities related to RF heating applications in
dry agricultural commodities is provided in subsequent sections
3.2.1. Pest- insects control
Wheat, infested with seven different pests, was heated inside a 39 MHz RF system
(Nelson & Kantack, 1966). It was reported that complete elimination of pests varied with RF
heating intensity, and duration. Nelson (1972, 1973) applied RF energy to control insects in
several stored food grains. RF heat treatment was also used to eradicate pinewood nematode in
loblolly and eastern white pine boards (Dwinell et al., 1994). Results showed that nematode
mortality was a function of RF heating intensity and wood moisture content. Walnuts were
heated in a 27.12 MHz RF system to control codling moth (Cydia pomonella), navel

7
orangeworm (Amyelois transitella), and Indian meal moth (Plodia interpunctella) (Wang et al.,
2001a, 2002, 2003, 2005). It was reported that RF heating eliminated pests without affecting
walnut quality. Langua- Solar et al (2005) used RF heating to control Angoumois grain moths
in dried storage rough rice. It was reported that RF heating between 55 °C to 60 °C for 5 min
resulted in 99% control of all biological stages of Angoumois grain moth. RF heating of
walnuts was again examined to investigate the effect of different influencing factors such as
walnut orientation, walnut type (open and closed shell), and intermittent mixing during RF
heating (Wang et al., 2006a). Results showed that vertically oriented walnuts received higher
temperature values than those of horizontally oriented. Open shell walnuts were heated faster
than closed shell walnuts after washing. Mixing walnuts twice during 3 min RF heating,
improved heating uniformity in walnuts. Temperature uniformities of RF treated walnuts were
assessed and compared under different conditions such as mixing of walnuts and hot air
circulation in a large scale RF experiment using an industrial scale 27.12 MHz, 25 kW RF
system (Wang et al., 2007a, b). These authors reported that single mixing optimized the heating
uniformity of walnuts. Recently, RF heating combined with hot air was used to control cowpea
weevil (Callosbruchus maculatus) and Indian meal moth (Plodia interpunctella) in chickpea,
lentil and green pea (Wang et al., 2010). It was reported that quality parameters including
moisture loss, germination rate and color of treated legumes were the same as controls.
3.2.2. Fungi control
In the past, RF heating was also explored to control fungi in different dry agricultural
products. Two different varieties of wheat were RF heat treated to eradicate Fusarium
graminearum, a harmful fungi accountable for ‘head blight’ disease (Cwiklinski & von
Hoersten, 2001). Germination of wheat seeds after RF heat treatment increased from 40% to
8
88%. Corn (Vassanacharoen et al., 2006) and Barley (Akaranuchat et al., 2007) seeds were RF
heated to control seed-borne fungi such as Aspergillus flavus, Alternaria sp., Penicillium sp.
and Rhizopus sp., and Fusarium semitectum. Three varieties of seasame seeds (white, black and
red), infected with fungi Macrophomina phaseolina, were RF treated using five different
selected temperatures (60, 70, 80, 85, and 90 °C) for 3 min (Vasanachalorn et al., 2004). RF
heating eliminated fungi without affecting the quality of seasame seeds. The efficacy of RF
heat treatment has been evaluated in oak, poplar and southern yellow pine wood to control
wood decay fungi (Gloeophyllum trabeum, Ganoderma lucidum and Irpex lacteus) using an
industrial 40-kW RF oven (Tubajika et al., 2007). Authors reported that RF treatment
successfully eliminated fungi in treated wood samples.
3.2.3. Pathogen control
RF heating was also explored to inactivate pathogenic micro-organisms in dry
agricultural commodities. Alfalfa seeds were RF treated to control pathogenic microorganisms
Solmonella, Escherichia coli O157:H7, and Listeria monocytogenes (Nelson et al., 2002). RF
heat treatment caused significant reduction in all three pathogens without affecting seed
quality. Langua- Solar et al. (2007) used RF heating to inactivate Solomonella spp and
Escherichia coli O157:H7 in fishmeal. It was reported that RF energy caused five log
reductions of these micro-organisms, without affecting fishmeal quality.
3.3.4. Enzyme deactivation
Lyman et al. (1948) studied RF treatment of cottonseeds. They reported that RF heating
reduced the formation of free fatty acids, accountable for bad odor in cottonseeds. Growth
inhibitor enzymes in soybeans were inactivated using RF heating (Borchers & Manage, 1972).
Quality of RF treated soybeans was better than controls. Oberndorfer and Lucke (1999)

9
preheated rapeseeds at different temperatures inside a RF applicator, before pressing them
against a laboratory screw press, in order to evaluate the effect of RF heating on oil yield. It
was reported that RF preheat treatment increased oil yield. Irfan and Pawelzil (1999) evaluated
the quality of RF preheated rapeseed oil and reported that RF preheat treatment did not affect
the oil quality. Pungency of yellow mustard seeds were reduced by RF heating (Cserhalmi et
al., 2001). RF heating inactivated myrosinase enzyme, accountable for seeds pungency.
Schuster-Gajzago et al. (2006) also inactivated myrosianse enzyme in mustard seeds using RF
energy. RF treated mustard seeds had the similar chemical composition and colloid-chemical
properties as controls.
4. Mathematical models used for RF heating of dry agricultural commodities
Ptasznik et al. (1990) developed a semi-empirical mathematical model for RF assisted
convective drying of hygroscopic materials based on the experimental data. The model was
used to simulate RF drying of broad bean. Neophytou and Metaxas (1998) simulated RF
heating of paper block in three different size (0.80×0.35× 0.40 m3, 1.50×0.50×0.80 m3,
2.00×0.60×1.00 m3) applicators, using finite element method. They solved Maxwell and
Laplace equations and compared the solutions to establish the validity of quasi static
assumption of electric field using blocks of paper as a dielectric material. It was reported that
assumption of quasi-static electric field was true only for small size applicator (0.80×0.35×
0.40 m3) with the lowest RF frequency (13.56 MHz). Marshall and Metaxas (1998) simulated
the RF electric field strength developed during the RF assisted heat pump drying of particulate
materials. Experimental results showed that RF heating increased the drying rate as well as the
performance of heat pump.

10
Yang et al. (2003) simulated RF heating of alfalfa and radish seeds packed inside
rectangular polypropylene boxes in a 1 kW RF system. They solved wave equations using a
transmission line method. A commercially available finite difference time domain based
software TLM-FOOD HEATING was used to solve heat transfer in the model. Model was
experimentally validated by comparing the simulated and experimented temperatures profiles
of seeds at four different locations. They reported disagreements in the model. A model on RF
assisted fluidized bed drying was developed for the corn (Jumah, 2005). Effect of electric field
strength, frequency, inlet temperature and intermittency on RF drying was analyzed. Wang et
al. (2005) developed a mathematical model to predict the required temperature time
combination for insect thermal mortality and product quality as a function of number of
intermittent mixing in RF treatment of walnuts. The model was based on the normal
distribution of product final and initial temperatures. It was shown that increased number of
mixing could increase the effective temperature time combinations for effective insect control
without affecting the product quality. The model was also validated using soybean, lentil, and
wheat.
5. Current research direction
It is clear from the literature review that the complex behavior of RF heating requires
further studies for fresh fruits and dry agricultural commodities. In the current research,
persimmon, a fresh fruit and whole wheat flour are selected as representative materials to
investigate the potential of RF heating in fresh fruits and dry agricultural commodities.
Following are the general objectives of this research:
1. Develop a RF based quarantine heat treatment for persimmon
2. Investigate the efficacy of RF heat treatments on the quality of persimmon

11
3. Develop a computer model to simulate RF heating in dry food materials
4. Experimentally validate the developed computer model
5. Analyze the effects of influencing parameters on temperature uniformity of RF treated
dry food materials, using the validated computer model
6. Study options to improve temperature uniformity in the treated dry food materials

References
Aegerter, A.F. & Folwell, R. J. (2000). Economic aspects of alternatives to methyl bromide in
the postharvest and quarantine treatment of selected fresh fruits. Crop protection, 19(3),
161–168.
Akaranuchat, P., Noimanee, P., Krittigamms, N., Von Hoersten, D., & Vearaslip, S. (2007).
Control seed-borne fungi by radio frequency heat treatment as alternative seed
treatment in barley (Hordeum vulgare). Conference on International Agricultural
Research for Development, Witzenhausen, Germany.
Balanis, C.A. (1989). Advanced engineering electromagnetics. John Wiley & Sons, New York
Banerjee, M., & Sarkar, P.K. (2003). Inhibitory effect of garlic on bacterial pathogens from
spices. World Journal of Microbiology and Biotechnology, 19 (6), 565-569.
Birla, S.L., Wang, S., & Tang, J. (2008). Computer simulation of radio frequency heating of
model fruit immersed in water. Journal of Food Engineering, 84(2), 270-280.
Birla, S.L., Wang, S., Tang, J., Fellman, J.K., Mattinson, D.S., & Lurie, S. (2005). Quality of
oranges as influenced by potential radio frequency heat treatments against
Mediterranean fruit flies. Postharvest Biology and Technology, 38(1), 66-79.
Birla, S.L., Wang, S., Tang, J., & Hallman, G. (2004). Improving heating uniformity of fresh
fruit in radio frequency treatments for pest control. Postharvest Biology and
Technology, 33(2), 205-217.
Borchers, R., & Manage, L.A. (1972). Rapid improvement in nutritional quality of soybeans by
dielectric heating. Journal of Food Science, 37, 333-334.

13
Cserhalmi, Zs., Markus, Zs., Czukor, B., Barath, A., & Toth, M. (2001). Physico-chemical
properties and food utilization possibilities of RF-treated mustard seed. Innovative Food
Science and Emerging Technologies, 1, 251-254.
Cwiklinski, M., & von Hoersten, D. (2001). Effect of exposure to radio-frequency electric
fields on fusarium graminearum in wheat seed. Annual International Meeting of the
American Society of Agricultural Engineers, Sacramento, California, USA.
Dwinell, L.D., Avramidis, S., & Clark, J.E. (1994). Evaluation of a radiofrequency vacuum
dryer for eradicating the pinewood nematode in green sawn wood. Forest Products
Journal, 44(4), 19-24.
Ikediala, J.N., Tang, J., Hansen, J., Drake, S.R., & Wang, S. (2002) Quarantine treatment of
fruits using radio frequency energy and an ionic-water-immersion technique.
Postharvest Biology and Technology. 24, 25-37.
Irfan, I., & Pawelzil, E. (1999). The effect of rapeseed treatment by microwave and radio-
frequency application on oil extraction and oil quality. Part II: Influence on oil quality.
Fat Science Technology, 101(5), 168–171.
Jumah, R. (2005). Modelling and simulation of continuous and intermittent radio frequency-
assisted fluidized bed drying of grains. Food and Bioproducts Processing, 83(C3), 203-
210.
Lagunas-Solar, M.C., Pan, Z., Zeng, N.X., Truong, T.D., Khir, R., & Amaratunga, K.S.P.
(2007). Application of radio frequency power for non-chemical disinfestation of rough
rice with full retention of quality attributes. Applied Engineering in Agriculture, 23(5),
647-654.

14
Lagunas-Solar, M. C., Zeng, N. X., Essert, T. K., Truong, T. D., Pina, C., Cullor, J. S., Smith,
W. L., & Larrain, R. (2005). Disinfection of fishmeal with radiofrequency heating for
improved quality and energy efficiency. Journal of the Science of Food and
Agriculture, 85(13), 2273-2280.
Lyman, C.M., Burda, E.J., & Olschner, P.Q. (1948). The effect of dielectric heating on storage
quality of cottonseed. Journal of the American Oil Chemists' Society, 25(7), 246-249.
Marra, F., Lyng, J., Romano, V., & McKenna, B. (2007). Radio-frequency heating of foodstuff:
solution and validation of a mathematical model. Journal of Food Engineering, 79(3),
998-1006.
Marra, F., Zhang, L., & Lying, J. (2009). Radio frequency treatment of foods: Review of recent
advances. Journal of Food Engineering, 91(4), 497-508.
Marshall, M.G. & Metaxas, A.C. (1998). Modeling of the radio frequency electric field strength
developed during the RF assisted heat pump drying of particulates. Journal of
Microwave Power and Electromagnetic Energy, 33(3), 167-177.
Monzon, M.E., Biasi, B., Mitcham, E.J., Wang, S., Tang, J.M., & Hallman, G.J. (2007). Effect
of radiofrequency heating on the quality of 'Fuyu' persimmon fruit as a treatment for
control of the Mexican fruit fly. HortScience, 42(1), 125–129.
Nelson, S.O. (1972). Possibilities for controlling stored grain insects with radio frequency
energy. Journal of Microwave Power and Electromagnetic Energy, 7(3), 231-239.
Nelson, S.O. (1973). Insect-control studies with microwaves and other radio frequency energy.
Bulletin of the Entomological Society of America, 19(3), 157-163.
Nelson, S.O., & Kantack, B.H. (1966). Stored-grain insect control studies with radio-frequency
energy. Journal of Economic Entomology, 59(3), 588-594.

15
Nelson, S.O., Lu, C.Y., Beuchat, L.R., & Harrison, M.A. (2002). Radio-frequency heating of
alfalfa seed for reducing human pathogens. Transactions of the ASAE, 45(6), 1937-
1942.
Neophytou, R.I., & Metaxas, A.C. (1998). Combined 3D FE and circuit modeling of radio
frequency heating systems. Journal of Microwave Power and Electromagnetic Energy,
33(4), 243-262.
Oberndorfer, C., & Lucke, W. (1999). The effect of rapeseed treatment by microwave and
radio-frequency application on oil extraction and oil quality. Part I: Influence on
mechanical oil extraction. Fat Science Technology, 101(5), 164–167.
Ptasznik W, Zygmunt S, & Kudra T. (1990). Simulation of RF-assisted convective drying for
seed quality broad bean. Drying Technology, 8(5), 977-992.
Rowley, A.T. (2001). Radio frequency heating. In P. Richardson (Ed.), Thermal technologies in
food processing (pp 163-177). Woodhead Publishing Limited, Abington
Schuster-Gajzago, I., Kiszter, A.K., Toth-Markus, M., Bardth, A., Markus-Bednarik, A., &
Czukor, B. (2006). The effect of radio frequency heat treatment on nutritional and
colloid-chemical properties of different white mustard (Sinapis alba L.) varieties.
Innovative Food Science & Emerging Technologies, 7(1-2), 74-79.
Sosa-Morales M.E., Tiwari, G., Wang, S., Tang, J., Lopez-Malo A., & Garcia, H.S. (2009).
Dielectric heating as a potential post-harvest treatment of disinfesting mangoes, II:
development of RF based protocols and quality evaluation of treated fruits. Biosystems
Engineering, 103(3), 287-296.
Tang, J., Ikediala, J.N., Wang, S., Hansen, J., & Cavalieri, R. (2000). High temperature short
time thermal quarantine methods. Postharvest Biology and Technology, 21, 129-145.

16
Tubajika, K.M, Jonawiak, J.J., Mack, R., & Hoover, K. (2007). Efficacy of radio frequency
treatment and its potential for control of sapstain and wood decay fungi on red oak,
poplar, and southern yellow pine wood species. Journal of Wood Science, 53(3), 258-
263.
[USEPA] United States Environmental Protection Agency (1998). Reregistration Eligibility
Decision. Aluminum and Magnesium Phosphide. Case s0025 and 0645. Office of
Pesticide Programs, Special Review and Reregistration Division. Agricultural Statistics.
Washington, DC.
Vassanacharoen, P., Janhang, P., Krittigamas, N., von Hörsten, D., & Lücke, W. (2006). Radio
frequency heat treatment to eradicate Fusarium semitectum in corn grain (Zea Mays).
Agricultural Science Journal, 37(5), 180-182.
Vasanachalorn, P., Kritigamas, N., Thanapornpoonpomg. (2004).Radio frequency heat
treatment to control seed-borne Macrophomina phaseolina in sesame seed (Ses amum
indicum L.). Deutcher Tropentag. Berlin, Germany.
Wang, S., Birla, S.L., Tang, J., & Hansen, J.D. (2006a). Postharvest treatment to control
codling moth in fresh apples using water assisted radio frequency heating. Postharvest
Biology and Technology, 40(1), 89-96.
Wang, S., Ikediala, J.N., Tang, J., Hansen, J.D., Mitcham, E., Mao, R., & Swanson, B. (2001a).
Radio frequency treatments to control codling moth in in-shell walnuts. Postharvest
Biology and Technology, 22(1), 29-38.
Wang, S., Monzon, M., Johnson, J.A., Mitcham, E.J., & Tang, J. (2007a). Industrial-scale radio
frequency treatments for insect control in walnuts: I. Heating uniformity and energy
efficiency. Postharvest Biology and Technology, 45(2), 240-246.
17
Wang, S., Monzon, M., Johnson, J.A., Mitcham, E.J., & Tang J. (2007b). Industrial-scale radio
frequency treatments for insect control in walnuts: II. Insect mortality and product
quality. Postharvest Biology and. Technology, 45(2), 247-253.
Wang, S., Tang, J., & Cavalieri, R.P. (2001b). Modeling fruit internal heating rates for hot air
and hot water treatments. Postharvest Biology and Technology, 22, 257-270.
Wang, S., Tang, J., Cavalieri, R.P., & Davies, D.C. (2003). Differential heating of insects in
dried nuts and fruits associated with radio frequency and microwave treatments.
Transactions of the ASAE, 46(4), 1175-1182.
Wang, S., Tang, J., Johnson, J.A., Mitcham, E., Hansen, J.D., Cavalieri, R.P., Bower, J., &
Biasi, B. (2002). Process protocols based on radio frequency energy to control field and
storage pests in in-shell walnuts. Postharvest Biology and Technology, 26(3), 265-273.
Wang, S., Tang, J., Sun, T., Mitcham, E.J., Koral, T., & Birla, S.L. (2006b). Considerations in
design of commercial radio frequency treatments for postharvest pest control in inshell
walnuts. Journal of Food Engineering, 77(2), 525-534.
Wang, S., Tiwari, G., Jiao, S., Johnson J.A., & Tang, J. (2010). Developing postharvest
disinfestation treatments for legumes using radio frequency energy. Biosystems
Engineering, 105(3), 341-349.
Wang, S., Yue, J., Tang, J., & Chen, B. (2005). Mathematical modelling of heating uniformity
for in-shell walnuts subjected to radio frequency treatments with intermittent stirrings.
Postharvest Biology and Technology, 35(1), 97-107.

18
Yang, J., Zhao, Y., & Wells, J.H. (2003). Computer simulation of capacitive radio frequency
(RF) dielectric heating on vegetable sprout seeds. Journal of Food Process
Engineering, 26(3), 239-263.

CHAPTER 2
EFFECT OF WATER ASSISTED RADIO FREQUENCY HEAT TREATMENT ON
THE QUALITY OF ‘FUYU’ PERSIMMONS
G. Tiwari1, S. Wang1, S.L. Birla2, J. Tang1
Published manuscript in Biosystems Engineering
1Department of Biological Systems Engineering,
Washington State University, Pullman, WA 99164-6120, USA
2 Department of Biological Systems Engineering,
University of Nebraska, Lincoln, NE 68583, USA.
Corresponding author: Juming Tang, 213 LJ Smith Hall, Pullman, WA 99164-6120, USA;
Phone: 509-335-2140; fax: 509-335-2722; e-mail: [email protected].

20
Abstract
Water assisted radio frequency (RF) heat treatment was evaluated as a potential alternative to
chemical fumigation for providing quarantine security against Mexican fruit fly (Anastrepha
ludens) in ‘Fuyu’ persimmon. Three holding times were chosen for each of the three treatment
temperatures (46, 48 and 50 °C), one time at, one above and another below 100% mortality.
Heat treatment protocols included preheating the fruit in 40°C water, followed by RF heating in
12 kW, 27.12 MHz RF system, holding at the target temperature for the required time and then
hydro cooling at 4°C for 30 min. The preheating time at 40°C was determined based on the
final RF heating uniformity over the fruit cross-section. Quality parameters, including weight
loss, firmness, soluble solids, titratable acidity, peel and pulp color, and calyx browning of
persimmons, were evaluated after 7 days of room (22°C) and cold storage (4°C). All treatments
except for one condition (48°C + 8 min holding) had no significantly adverse effects on quality
attributes. Slight calyx browning was observed in the treated samples and the degree of
browning increased with treatment time for each treatment temperature. Results suggested that
water assisted RF heat treatments provided potential for disinfestation of persimmons with
acceptable product quality in terms of firmness, soluble solids and peel and pulp color.

21
1. Introduction
China, Japan and Korea are traditionally major producers of persimmon (Diospyros
kaki) fruit, contributing 95 % of world production (Soriano et al., 2006). In the United States,
the Human Nutrition Information Service (HNIS) in the Department of Agriculture has placed
it into the category of specialty fruit of increasing popularity to the US consumers (Homnava et
al., 1991). California is a major producer of ‘Fuyu’ persimmons in the US (Forbus et al., 1991;
Clark & MacFall, 2003). The Mexican fruit fly, Anastrepha ludens (Loew), though originated
in Mexico, is found in tropical fruit such as persimmons in California (Monzon et al., 2007),
posing major threat for international and inter-state persimmon fruit trade, which requires
quarantine security before exporting.
Currently, methyl bromide fumigation is used for pest control in fresh fruits (Aegerter
& Folwell, 2000; Hansen et al., 2000) but its use in future is uncertain as it has been recognized
as ozone depleting substance under Montreal Protocol (USEPA, 1998). Increased international
pressure to limit the methyl bromide use due to environmental issues, continual increase in
price and reduced production result in urgent needs for developing non-chemical alternative
quarantine treatments.
Hot air and hot water treatments have been studied as alternatives to disinfest codling
moth (Cydia pomonella) in cherries (Feng et al., 2004), Caribbean fruit fly (Anastrepha
suspense) in oranges (Sharp & McGuire, 1996), Mexican (Anastrepha ludens) and West Indian
fruit fly (Anastrepha obliqua) in mangoes (Sharp et al., 1989) and other insects in apples
(Smith & Lay-Yee, 2000), and persimmons (Dentener et al., 1996; 1997; LayYee et al., 1997).
These conventional heating methods require lengthy treatment times (in hours) for 100%
disinfestations of fruit flies as heat transfers slowly from surface to core of the fruit. Exposure

22
to heat for prolong time results in adverse effects on overall quality of fruits, such as weight
and firmness loss, skin browning and other quality losses.
Radio frequency (RF) heating has been investigated as a quarantine treatment in dry
products such as walnuts (Wang et al., 2001; 2002) and in fresh fruits such as apples (Wang et
al., 2006), cherries (Monzon et al., 2006), oranges (Birla et al., 2005) and more recently in
persimmons (Monzon et al., 2007). The main advantages of RF heating over other conventional
heating methods are its rapid heating, potential differential heating between pest and
commodity (Wang et al., 2003), and ability to penetrate deep into the target material (Tang et
al., 2000; Hansen & Johnson, 2007).
Monzon et al. (2007) evaluated potential for RF heating as a quarantine heat treatment
in persimmon fruit using saline water immersion technique. In that study, fruit samples were
immersed in salt water to reduce non-uniform heating during RF treatments. The dielectric
properties of water were adjusted to match that of persimmon by adding appropriate amount of
salt. RF non-uniform heating was still found in the treated persimmons, resulting in loss of
firmness and calyx browning in some treatments. Similar studies on RF treatments of apples
and oranges showed that even matching dielectric properties of fruit with surrounding water did
not provide adequate heating uniformity among the fruit (Birla et al., 2004; 2005). By
combining RF core heating with water surface pretreatment, RF treatments have been
successfully explored for disinfesting apples (Wang et al., 2006) with acceptable product
quality. It is desirable to develop the water assisted RF treatments for controlling the insect
pests in persimmons without quality damage.
The objectives of this study were to: (1) determine the preheating times at each target
temperature based on the required RF heating uniformity, (2) develop a treatment protocol of
23
water assisted RF heating for ‘Fuyu’ persimmon control of Mexican fruit fly, and (3) evaluate
product quality of RF treated persimmons under ambient and cold storage conditions.
2. Material and methods
2.1. Sample preparations and thermal treatment designs ‘Fuyu’ persimmons (average weight of 137 ± 9.6 g and diameter of 6.9 ± 0.4 cm) were
purchased from a commercial orchard in Visalia, CA and shipped overnight to Washington
State University, Pullman, WA, USA. Persimmons were kept in cold storage (4 °C) until used
for next day treatments. The samples were left at ambient temperature (~22 °C) for at least 12
hours to achieve uniform fruit temperature before RF treatments and avoid the enhanced
thermal tolerance of insects (Wang et al., 2005). Fruits had initial average firmness 40.3 ± 5.3
N, total soluble solids 11.3 ± 0.5 %, and peel color 60.8 ± 3.0, 31.3 ± 3.8 and 53.9 ± 5.6 in L,
a*, b* scale.
Thermal death kinetic studies of third instars (most heat tolerant stage) of Mexican fruit
fly indicated that 100% mortality can be achieved by exposing to 46 °C for 25 min, or 48 °C
for 6 min, or 50 °C for 2 min (Hallman et al., 2005). In this study, three target temperatures of
46, 48, and 50 °C and three holding times corresponding to a level at, above and below 100%
mortality were selected for RF heat treatment and quality analysis (Table 1).
2.2. Treatment parameter determinations
We selected 40 °C as the preheating temperature for all thermal treatments. Liu (1978)
reported that heat exposure to 40 °C for 4 days had no adverse effects on the quality of ‘Golden
Delicious’ apples in terms of firmness and peel and pulp color. In preliminary tests, we also
observed no quality change in persimmons after treating in 40 °C water for 60 min. Prior to RF
treatments, eight fruits were placed in a circulating water bath (Model ZD, Grant, Cambridge,

24
UK) at 40 °C for 30 min. Two thermocouples (Type-T, THQSS-020U-6, Omega Engineering
Inc., Stamford, CT) were inserted in one fruit to measure the fruit surface and core
temperatures, the data were recorded every 5 s using a data logger (DL2e, Delta-T Devices
Ltd., Cambridge, UK). At the heating times of 5, 10, 15, 20, 25 and 30 min, one randomly
selected fruit was removed from the water bath and cut into halves along the surface
perpendicular to calyx. One half fruit facing upward was immediately placed into a water filled
container with 90 percent fruit volume immersed in water. Water temperature was maintained
equal to fruit surface temperature (40 °C) to reduce heat loss from the exposed fruit surface. A
thermal image of the exposed fruit surface was taken immediately using an infra-red imaging
camera with accuracy ± 2°C (ThermaCAM TM Researcher 2001, FL-IR Systems, Portland,
OR). The subsurface and core temperatures of the preheated fruits were measured at 2 mm
below the peel and the fruit center, respectively, by thermocouple, which were compared with
those measured by thermal imaging methods for the mentioned specific times. The fruit surface
and core temperatures after RF treatments with a target temperature of 48 °C were also
recorded during 30 min of cooling using 4 °C water.
To determine the best preheating time for each target temperature, a preliminary
experiment was conducted to compare the heating uniformity of the fruit samples after RF
treatments for different preheating times at 40°C. After preheating for the given times, eight
fruits as a group were immediately transferred into a fruit mover filled with 40°C water. Water
inside the fruit mover was circulated using a 0.745 kW, single phase centrifugal pump (TEEL
Model # 2PC27, Dayton Electrical Mfg. Co., Niles, IL). The description and operation
procedures of the fruit mover can be found in Birla et al. (2004). The fruit mover was placed
between the two parallel electrodes of a 12 kW, 27 MHz batch type RF heating system (E-200,

25
Strayfield International Limited, Workingham, UK). RF heating was conducted using 8 kW
power with an electrode gap of 210 mm. Circulating water temperature was monitored by
thermocouples, placed in the circulation pipe outside the RF system. RF power was switched
off once the circulating water temperature reached the target temperature (46 or 48 or 50 48
°C). Two fruit samples were immediately taken out from the fruit mover and cut into halves to
map the temperature distribution by the infra-red imaging camera. The mean temperature and
standard deviation of RF treated samples were estimated for each thermal image. The best
heating uniformity around the target temperature was used to determine the preheating time for
final RF treatments.
2.3. Treatment procedures
Based on those preliminary tests, three preheating times of 25, 30 and 35 min, 15, 20
and 25 min, and 5, 10 and 15 min were chosen for the target fruit temperatures of 46, 48 and 50
°C, respectively. Longer preheating times at 40 °C and shorter RF heating were used to achieve
the desired heating uniformity for lower final target temperature.
In experiment for quality studies, eight persimmons were heated in the water bath at
40°C with the optimized preheating time for each final temperature. Preheated fruits were
transferred into the fruit mover filled with 40 °C water inside the RF system. RF power (8 kW)
was applied till the circulating water reached the target temperatures (46 or 48 or 50 °C). Fruits
were immediately removed from the fruit mover and kept in the water bath maintained at the
selected target temperature for different holding times (Table 1). Fruits were then hydro-cooled
in 4 °C water for 30 min and stored in open space at room (22°C and 35% relative humidity)
and cold storage (4°C and 80% relative humidity) for 7 days. Controls were dipped in water at

26
room temperature for 30 min before keeping them with treated fruits in both storage conditions.
Each treatment was replicated three times.
2.4. Quality evaluation
Quality parameters including weight loss, firmness, soluble solids, peel and pulp color,
and titratable acidity were measured after 7 days at room and cold storage. Weight loss was
expressed as percentage of fruit weight reduction from initial weight. Firmness was measured
in Newton (N) by a Texture Analyzer (Model TA-XT2, Stable Micro Systems, YL, UK) using
a cylindrical (7.9 mm diameter) hemispherical tip probe. The speed of the probe was set at 400
mm/min; the measurements were made at three equally spaced positions (120° apart) along the
equatorial fruit surface. Prior to firmness measurement, fruits skins were peeled off at all three
positions. Peel color was measured at three marked spots on each fruit by a tristimulus
colorimeter (Model CM-2002, Minolta Corp., Ramsey, NJ) and expressed in L, a*, and b*
scale. Pulp color was measured at two spots on each exposed fruit surface after cutting it into
two halves. Hand-squeezed juice from six persimmons was used to measure sample titratable
acidity (TA) after each treatment. Five ml juice sample was titrated against 0.1 N NaOH till
final pH reached 8.2. The TA value was expressed in terms of equivalent anhydrous malic acid
in g/100 ml of juice. Total soluble solids (°Brix) were measured using a hand held
refractometer (Model N-1α, ATAGO Co. Ltd., Tokyo, Japan) and expressed as percentage
soluble solids in juice. Visual observations for skin and calyx browning were also made after 7
days of room and cold storages (4 °C).
The measurement of individual quality attribute was subjected to an analysis of variance
(ANOVA) and means were separated using Tukey’s method (SAS Institute, 2002, Cary, NC) at
a significance level of 0.05 (P<0.05).

27
3. Results and discussions
3.1. Comparison of thermal imaging and thermocouple methods
Table 2 shows core and surface temperatures of persimmon fruit measured by thermal
imaging and thermocouple methods. Temperature data were compared after 5, 10, 15, 20, 25,
and 30 min of preheating at 40 °C and hydro-cooling at 4 °C for 30 min. A good agreement
was obtained between these two methods both for surface and core temperatures. The
temperature difference between thermal imaging and thermocouple methods was below 1.4 °C
(Table 2).
3.2. Preheating time determination
Average temperature (mean ± S.D.) of persimmon fruit cut surface measured by thermal
imaging after initial RF treatments with different preheating times are shown in Table 3. In
general, in order to obtain relatively uniform treatments, longer preheating times and shorter
RF heating were needed for lower target temperatures. For example, preheating at 40°C for 20
min provided the average fruit temperature of 47.7±0.6°C, aimed to achieve 48°C, while 15 and
25 min preheating offered the average fruit temperatures of 44.8±0.5 °C and 50.8 ± 0.8 °C,
respectively, after RF heating, which were not suitable for 48 °C treatment (Table 3). Similarly,
preheating times of 30 and 10 min at 40 °C were found appropriate for 46 °C and 50 °C final
treatment temperature, providing the uniform average fruit temperatures of 46.1 ± 0.3 and
49.9±0.4 °C after RF heating. Therefore, based on the achieved target temperature and heating
uniformity, preheating times of 30, 20 and 10 min at 40°C were chosen for final treatment
temperature of 46, 48 and 50°C, respectively. The selected preheating times in 40°C water bath
and subsequent RF heating times required for the fruit to reach three different final
temperatures (namely 46, 48 and 50°C) as measured at the core and subsurface are summarized

28
in Fig. 1. It took about 70, 120, and 140 s of RF heating for fruit core to reach 46, 48, and
50°C, respectively, after preheating described above (Fig. 1).
3.3. Temperature time profile of persimmon
Figure 2 shows the temperature time history of persimmon fruit at different stages -
preheating in 40 °C water for 20 min, RF heating to raise the fruit temperature up to 48 °C,
holding at 48 °C for 6 min, and cooling at 4 °C for 30 min in 48 °C + 6 min heat treatment. The
core and surface temperature of persimmon fruit were 35.4 °C and 40 °C, respectively, after 20
min preheating (Fig. 3a). Slow heat transfer from the surface to the core of fruit resulted
relatively in lower core temperature. Core temperature of fruit during RF heating rose from
35.4 °C to 48.4 °C whereas surface temperature rose from 40 °C to 47.8 °C (Fig. 3b), showing
preferential core heating by RF treatments. It is obvious that pretreatment surface heating prior
to RF treatment compensated core RF heating of fruit and assured uniform fruit temperature
(mean ± S.D., 47.7 ± 0.6 °C). Holding fruit in 48 °C water for 6 min further improved the
heating uniformity. The average temperature (mean ± S.D.) after holding was 47.9±0.2 °C
(Fig. 3c). Cooling for 30 min at 4 °C water reduced fruit surface and core temperatures to 5.4
and 13.4 °C, respectively (Fig. 3d). Cooling time can be further reduced based on the required
fruit core temperature to reduce operational cost in industrial applications of this technology.
3.4. Quality
3.4.1. Weight loss
RF heat treatment itself had no significant effect on weight loss of treated fruits after 7
days at room temperature and in cold storage (4 °C )(P>0.05) (Tables 4 and 5). In another study
also, no significant difference on weight loss was observed between RF treated and control
persimmons after 12 days at 20 °C storage (Monzon et al., 2007). Table 6 shows the results of

29
factorial ANOVA analysis performed on individual quality attributes. Regardless of the RF
treatment, storage conditions significantly affected the weight loss (P<0.05). Fruits stored in
cold storage had lower weight loss (~1.4-1.5%) compared to those stored at room temperature
(6.9-8.4%) (Tables 4 and 5). The sharp reduction in weight loss for samples in cold storage
might be attributed to lower level of dehydration and reduced physiological changes in fruit
such as respiration, transpiration and ripening.
3.4.2. Firmness
No significant difference was detected in firmness between control and the treated
samples after 7 day storage at room temperature , except for fruits that went through the 48 °C
+ 8 min holding treatment (P<0.05) (Table 4). The reduced firmness for this particular
treatment might have been caused by prolonged heating, resulting increased rate of ripening in
the treated fruit. Monzon et al. (2007) also reported a reduction in the firmness of persimmons,
after 48 °C RF treatment with holding times 12 and 18 min. All treated persimmons in cold
storage were significantly firmer than the untreated control (Table 5). The reason for the
increased firmness of persimmons could be the inhibition of ethylene synthesis due to heat
treatment, which subsequently delays the ripening (Lurie & Mitcham, 2007). Such an increase
in the firmness of treated persimmons was not observed in room condition, but it was definitely
evident in cold storage. Studies on apples (Lurie & Klein, 1992a; Lurie & Nussinovitch, 1996)
and tomato (Lurie & Klein, 1992b) showed that heat treatment followed by reduced
temperature storage either significantly increased the firmness or delayed the ripening of
commodity. Kim et al. (1994) reported that heat treatment at 45 °C for 1.75 h followed by 2 °C
storage for a week significantly increased firmness of ‘Golden Delicious’ apples than those

30
stored at 10, 18 and 25 °C. This observation might be helpful in extending storage life of
persimmons.
3.4.3. Peel and pulp color
There was no significant difference in peel color between the control and all treated
fruits after 7 day storage at room temperature, except for the 48 °C + 8 min holding treatment.
Peel color (hue) was significantly lower in the 48 °C + 8 min holding treatment (P<0.05) (Table
4), which was evident by the dark shade on treated fruits surface. Heat exposure for relatively
longer time followed by room storage could have enhanced the rate of ripening, resulting in
dark color for this particular treatment. However, no significant difference was observed in peel
color between treated and control fruits in cold storage (P>0.05) (Table 5).
Treatments at 48 °C for 8 min holding also showed significant effects on pulp color of
RF treated persimmons after storage at room temperature (P<0.05) (Table 4). Decreases in hue
(dark shade) indicated over ripening of fruits. Firmness loss and peel color change supported
the findings for this particular treatment. No significant difference in pulp color was detected
between treated and control fruits after 7 days of cold storage (4 °C )(P>0.05) (Table 5).
3.4.4. Total soluble solids and titratable acidity
RF treatment had no significant effect on soluble solids and titratable acidity of
persimmons (P>0.05). Studies on RF treated apples (Wang et al., 2006) and oranges (Birla et
al., 2005) also showed similar results. Storage conditions significantly affected TA and TSS of
fruits (P<0.05) (Table 6). Slight decrease in TA and TSS was observed in cold stored fruits
compared to those stored at room temperature (Tables 4 and 5). This could be attributed to
lower metabolic activities of fruits in cold storage (Prasana et al., 2000), resulting in slow rate
of maturity. Quantity of malic acid in immature persimmons was found less than in mature

31
ones (Senter et al., 1991). The lower TSS in cold storage could be due to the reduced
conversion rate of starch into sugars.
3.4.5. Visual observations
In all RF treatments, calyx was slightly browner than controls and the browning was
more severe in the longest holding time in each of three target temperatures. No shrivel or skin
browning was observed in treated fruits.
4. Conclusions
Water assisted RF heating was investigated as a quarantine treatment for Mexican fruit
fly in ‘Fuyu’ persimmons at 46, 48 and 50 °C. Quality parameters, including weight loss,
firmness, soluble solids and titratable acidity, peel and pulp color, were evaluated after 7 days
of room and cold storage. All RF treatments except for 48 °C + 8 min holding either
significantly improved or had no effect on the overall quality of persimmons. Increased
firmness in cold stored treated fruits may be useful for extending storage life of persimmons.
Based on results, RF treatments for 46 °C + 25 min holding, or 48 °C + 6 min holding, or 50 °C
+ 2 min holding have potential to provide 100 % mortality of Mexican fruit fly with acceptable
fruit quality. Water assisted RF heating can overcome heating non-uniformity problem
associated with RF treatments in fresh fruits. Large scale tests are needed to establish a
quarantine protocol for persimmons using water assisted RF heating technique.
Acknowledgement
This research was supported by grants from USDA-CSREES (2004-51102-02204) and
USDA-NRI (2005-35503-16223) and partially by Washington State University Agricultural
Research Center.

32
Table 1
Experimental design of radio frequency heat treatment
Treatments Treatment description
46 °C + 20 min Preheating at 40 °C and RF heating to raise temperature
up to 46 °C and holding at 46 °C for 20, 25 and 30 min 46 °C + 25 min
46 °C + 30 min
48 °C + 4 min Preheating at 40 °C and RF heating to raise temperature
up to 48 °C and holding at 48 °C for 4, 6 and 8 min 48 °C + 6 min
48 °C + 8 min
50 °C + 1 min Preheating at 40 °C and RF heating to raise temperature
up to 50 °C and holding at 50 °C for 1, 2 and 4 min 50 °C + 2 min
50 °C + 4 min
Control No heat treatment

33
Table 2
Comparisons of measured surface and core temperatures of ‘Fuyu’ persimmon between thermal
imaging (TI) and thermocouple (TC) methods during preheating and hydro-cooling
Treatments Time, min Surface temperature, °C Core temperature, °C
TI TC TI TC
Preheating in
40 °C water
5 38.5 39.5 25.4 25.9
10 38.5 39.9 28.8 29.8
15 38.6 40.0 32.5 33.1
20 38.8 40.0 34.7 35.4
25 39.2 40.0 36.6 37.0
30 39.6 40.0 37.4 38.0
Hydrocooling
in 4°C water
30 5.6 5.4 12.8 13.4

34
Table 3
Preheating time determinations at 40°C water baths based on heating uniformity after RF
treatment of ‘Fuyu’ persimmons (with three replicates) at three different target temperatures.
Target Temperature
after RF treatment
Preheating time in 40°C
water bath, min
Average and standard deviation
temperatures after RF treatment, °C
46°C
25 43.9±0.3
30 46.1±0.4
35 48.2±0.7
48°C
15 44.8±0.5
20 47.7±0.6
25 50.8±0.8
50°C
5 44.8±0.9
10 49.9±0.4
15 51.0±0.3

35
Table 4
Quality parameters of control and RF treated ‘Fuyu’ persimmons (with three replicates) after 7 days storage at room temperature
(22°C, 35% RH)
Treatment Weight loss, % Firmness, N Total soluble solids, % Acidity, g/100 ml Peel color, Hue Pulp color, Hue
Control 6.9a* 16.75a 14.6a 0.15a 56.4a 53.2a
46 °C + 20 min 6.4a 16.43a 14.0a 0.14a 54.7a,b 52.9a,b
46 °C + 25 min 8.4a 18.61a 13.2a 0.13a 55.6a 54.6a
46 °C + 30 min 6.1a 16.04a 14.1a 0.13a 54.4a,b 52.6a,b
48 °C + 4 min 6.0a 16.59a 14.5a 0.12a 56.1a 54.2a
48 °C + 6 min 8.1a 18.40a 14.0a 0.15a 55.8a 53.8a
48 °C + 8 min 7.6a 11.94b 13.9a 0.14a 53.2b 50.5b
50 °C + 1 min 7.3a 17.14a 14.5a 0.12a 55.3a,b 52,5a,b
50 °C + 2 min 8.3a 19.96a 14.6a 0.14a 56.2a 52.7a,b
50 °C + 4 min 8.1a 16.20a 14.6a 0.12a 54.8a,b 53.7a
* Different letters within a column indicate that means are significantly different (P<0.05)
36
Table 5
Quality parameters of control and RF treated ‘Fuyu’ persimmons (with three replicates) after 7 days at cold storage (4 °C, 80% RH)
Treatment Weight loss, % Firmness, N Total soluble solids, % Acidity,
g /100 ml
Peel color, Hue Pulp color, Hue
Control 1.4a* 18.0a 12a 0.09a 56.3a 52.3a
46 °C + 20 min 1.5a 35.3b 12a 0.12a 56.9a 53.1a
46 °C + 25 min 1.5a 28.5c 13a 0.12a 56.1a 53.9a
46 °C + 30 min 1.5a 25.0c,d 11a 0.09a 56.1a 52.9a
48 °C + 4 min 1.5a 25.9c,d 12a 0.08a 56.2a 52.7a
48 °C + 6 min 1.5a 29.4b,d 12a 0.10a 55.9a 52.4a
48 °C + 8 min 1.4a 21.5a,d 12a 0.09a 55.9a 53.3a
50 °C + 1 min 1.4a 21.1a,d 11a 0.10a 55.5a 52.9a
50 °C + 2 min 1.5a 23.7c,d 11a 0.10a 55.9a 53.3a
50 °C + 4 min 1.4a 24.9c,d 12a 0.11a 55.5a 52.1a
* Different letters within a column indicate that means are significantly different (P<0.05).

37
Table 6
ANOVA P values (α = 0.05) for the effect of treatment, storage and treatment × storage interaction for persimmon quality parameters
Wt loss Firmness Soluble solids Acidity Peel color Pulp color
Treatment (T) 0.0729 <0.0001 0.7965 0.0628 <0.0001 0.0021
Storage (S) <0.0001 <0.0001 <0.0001 <0.0001 <0.0001 0.4480
T × S 0.0263 <0.0001 0.0959 0.0158 <0.0001 0.0002
* P < 0.05 indicate a significant effect at the 5 % level from the of treatment, storage and treatment × storage on quality parameters

38
Fig. 1. Experimentally determined preheating and radio frequency (RF) heating times for the
surface and core temperature of ‘Fuyu’ persimmon to each of the three selected target
temperatures.

39
Fig. 2. Heating and cooling profiles for surface and core of ‘Fuyu’ persimmon (diameter of 7
cm), subjected to preheating in hot water at 40 °C followed by RF heating to raise temperature
up to 48 °C, holding at 48 °C for 6 min and hydro-cooling for 30 min at 4 °C water.

40
Fig. 3. Temperature distributions of persimmons obtained by thermal imaging after: (a) water
preheating at 40 °C for 20 min, (b) RF heating from 40°C to 48°C, (c) holding in hot water at
48 °C for 6 min, and (d) cooling in cold water at 4 °C for 30 min.
(a) (b)
(c) (d)

41
References
Aegerter A F; Folwell R J (2000). Economic aspects of alternatives to methyl bromide in the
postharvest and quarantine treatment of selected fresh fruits. Crop Protection, 19(3),
161–168
Birla S L; Wang S; Tang J; Fellman J K; Mattinson D S; Lurie S (2005). Quality of oranges as
influenced by potential radio frequency heat treatments against Mediterranean fruit
flies. Postharvest Biology and Technology, 38(1), 66–79
Birla S L; Wang S; Tang J; Hallman G (2004). Improving heating uniformity of fresh fruit in
radio frequency treatments for pest control. Postharvest Biology and Technology, 33(2),
205–217
Clark C J; MacFall J S (2003). Quantitative magnetic resonance imaging of ‘Fuyu’ persimmon
fruit during development and ripening. Magnetic Resonance. Imaging, 21(6), 679–685
Dentener P R; Alexander S M; Lester P J; Petry R J; Maindonald J H; McDonald R M (1996).
Hot air treatment for disinfestation of lightbrown apple moth and longtailed mealy bug
on persimmons. Postharvest Biology and Technology, 8(2), 143–152
Dentener P R; Bennett K V; Hoy L E; Lewthwaite S E; Lester P J; Miandonald J H; Connolly P
G (1997). Postharvest disinfestation of lightbrown apple moth and longtailed mealy bug
on persimmons using heat and cold. Postharvest Biology and Technology, 12 (3), 255–
264
Feng X Q; Hansen J D; Biasi B; Tang J M; Mitcham E J (2004). Use of hot water treatment to
control codling moths in harvested California ‘Bing’ sweet cherries. Postharvest
Biology and Technology, 31(1), 41–49

42
Forbus W R; Payne J A; Senter S D (1991). Nondestructive evaluation of Japanese Persimmon
maturity by delayed light-emission. Journal of Food Science, 56(4), 985–988
Hallman G J; Wang S; Tang J M (2005). Reaction orders for thermal mortality of third instar
Mexican fruit fly (Diptera: Tephritidae). Journal of Economic Entomology, 98(6),
1905–1910
Hansen J D; Johnson J A (2007). Introduction. In: Heat Treatments for Postharvest Pest
Control: Theory and Practice (Tang J; Mitcham E; Wang S; Lurie S, eds), pp 1–26.
CABI, Oxon
Hansen J D; Sell C R; Moffit H R; Leesch J G; Hartsell P L (2000). Residues in apples and
sweet cherries after methyl bromide fumigation. Pest Management Science, 56(6),
555–559
Homnava A; Payne J; Koehler P; Eitenmiller R (1991). Characterization of changes during
ripening of oriental persimmon. Journal of Food Quality, 14(5), 425–434
Kim D M; Smith N L; Lee C Y (1994). Effect of heat-treatment on firmness of apples and
apple slices. Journal of Food Processing and Preservation 18(1), 1–8
LayYee M; Ball S; Forbes S K; Woolf A B (1997). Hot-water treatment for insect
disinfestation and reduction of chilling injury of ‘Fuyu’ persimmon. Postharvest
Biology and Technology. 10(1), 81–87
Liu F W (1978). Modification of apple quality by high temperature. Journal of American
Society for Horticultural Science, 103, 730–732
Lurie S; Klein J D (1992a). Calcium and heat-treatments to improve storability of Anna apples.
HortScience, 27, 36–39

43
Lurie S; Klein J D (1992b). Ripening characteristics of tomatoes stored at 12-degrees-C and 2-
degrees-C following a prestorage heat-treatment. Scientia Horticulturae, 51(1-2), 55–64
Lurie S; Mitcham E J (2007). Physiological responses of agricultural commodities to heat
treatments. In: Heat Treatments for Postharvest Pest Control: Theory and Practice
(Tang J; Mitcham E; Wang S; Lurie S, eds), pp 79–104. CABI, Oxon
Lurie S; Nussinovitch A (1996). Compression characteristics, firmness, and texture perception
of heat treated and unheated apples. International Journal of Food Science and
Technology, 31(1), 1–5
Monzon M E; Biasi B; Mitcham E J; Wang S; Tang J M; Hallman G J (2007). Effect of
radiofrequency heating on the quality of 'Fuyu' persimmon fruit as a treatment for
control of the Mexican fruit fly. HortScience, 42(1), 125–129
Monzon M E; Biasi B; Simpson T L; Johnson J; Feng X; Slaughter D C; Mitcham E J (2006).
Effect of radio frequency heating as a potential quarantine treatment on the quality of
'Bing' sweet cherry fruit and mortality of codling moth larvae. Postharvest Biology and
Technology, 40(2), 197–203
Prasanna K N V; Rao D V S; Krishnamurthy S (2000). Effect of storage temperature on
ripening and quality of custard apple (Annona squamosa L.) fruits. The Journal of
Hortcultural Science and Biotechnology, 75(5), 546–550
Senter S D; Chapman G W; Forbus W R; Payne J A (1991). Sugar and nonvolatile acid
composition of persimmons during maturation, Journal of Food Science, 56(4), 989–
991
Sharp J L; McGuire R G (1996). Control of Caribbean fruit fly (Diptera: Tephiritidae) in naval
orange by forced hot air. Journal of Economic Entomology, 89(5), 1181–1185
44
Sharp J L; Ouye M T; Ingle S J; Hart W G (1989). Hot-water quarantine treatment for mangoes
from Mexico infested with the Mexican fruit-fly and West-Indian-fruit-fly (Diptera,
tephritidae). Journal of Economic Entomology, 82(6), 1657–1662
Smith K J; Lay-Yee M (2000). Response of ‘Royal Gala’ apples to hot water treatment for
insect control. Postharvest Biology and Technology, 19(2), 111–122
Soriano J M; Pecchioli S; Romero C; Vilanova S; Llacer G; Giordani E; Badenes M L (2006).
Development of microsatellite markers in polyploidy persimmon (Diospyros kaki Lf)
from an enriched genomic library. Molecular Ecology Notes, 6(2), 368–370
Tang J; Ikediala J N; Wang S; Hansen J D; Cavalieri R P (2000). High-temperature-short-time
thermal quarantine methods. Postharvest Biology and Technology, 21(1), 129–145
[USEPA] United States Environmental Protection Agency (1998). Reregistration Eligibility
Decision. Aluminum and Magnesium Phosphide. Case s0025 and 0645. Office of
Pesticide Programs, Special Review and Reregistration Division. Agricultural Statistics.
Washington, DC
Wang S; Birla S L; Tang J; Hansen J D (2006). Postharvest treatment to control codling moth
in fresh apples using water assisted radio frequency heating. Postharvest Biology and
Technology, 40(1), 89–96
Wang S; Ikediala J N; Tang J; Hansen J D; Mitcham E; Mao R; Swanson B (2001). Radio
frequency treatments to control codling moth in in-shell walnuts. Postharvest Biology
and Technology, 22(1), 29–38
Wang S; Johnson J A; Tang J; Yin X (2005). Heating condition effects on thermal resistance of
fifth-instar navel orangeworm (Lepidoptera: Pyralidae). Journal of Stored Products
Research, 41(4), 469-478.

45
Wang S; Tang J; Cavalieri R P; Davies D C (2003). Differential heating of insects in dried nuts
and fruits associated with radio frequency and microwave treatments. Transactions of
the ASAE, 46(4), 1175–1182.
Wang S; Tang J; Johnson J A; Mitcham E; Hansen J D; Cavalieri R P; Bower J; Biasi B (2002).
Process protocols based on radio frequency energy to control field and storage pests in
in-shell walnuts. Postharvest Biology and Technology, 26(3), 265–273.

46
CHAPTER 3
COMPUTER SIMULATION OF RADIO FREQUENCY HEATING OF DRY FOOD
MATERIALS, PART I: MODEL DEVELOPMENT AND VALIDATION
Manuscript prepared for Journal of Food Engineering
G. Tiwari1, S. Wang1, J. Tang1*, S. L. Birla2
1 Department of Biological Systems Engineering,
Washington State University, Pullman, WA 99164-6120, USA.
Department of Biological Systems Engineering,
University of Nebraska, Lincoln, NE 68583, USA.
Corresponding author:
Juming Tang, 213 LJ Smith Hall, Pullman, WA 99164-6120, USA;
Phone: 509-335-2140; fax: 509-335-2722; e-mail: [email protected].

47
Abstract
Radio frequency (RF) heat treatment has been identified as a novel pasteurization and
non-chemical quarantine method for dry food materials. But the major obstacle of this
treatment is non-uniform heating in these food materials. The objectives of this study were to
develop a computer simulation model for a 12 kW, 27.12 MHz RF system using a finite
element based commercial software, FEMLAB. Hard red spring whole wheat flour as a
uniform and representative material for dry food materials was selected. Dielectric properties of
wheat flour were measured using an open-ended coaxial probe connected with impedance
analyzer, and thermal properties were determined using a duel needle probe method. RF
experiments with the pilot scale unit were conducted for 3 min using a fixed electrode gap of
155 mm. Simulated and experimented temperature profiles (° C) of wheat flour were compared
in four different horizontal layers. Both, simulated and experimental results showed that
temperature values were higher at the mid layers followed by top and bottom layer. Corners
were more heated than centers in each layer. Simulation results showed that RF power density
inside the wheat flour sample was higher at the edges and lower sections of the sample, causing
higher temperature values in these sections. Sensitivity analysis showed that temperature
uniformity in the sample was most affected by top electrode voltage and sample dielectric
properties. The developed model can further be used to study the effect of some important
parameters such as sample size, position, and shape and dielectric properties on RF heating of
dry food materials.
Keywords: RF heat treatment, Computer simulation, Wheat flour, Dielectric properties, Heating
uniformity

48
1. Introduction
Dry products such as grains (cereals, oil seeds and legumes), nuts, herbs, spices, bakery
products and infant formulas are generally regarded as shelf stable foods and can be stored for
long time due to their low moisture contents. Nevertheless, presence of pathogens and insect
pests may cause considerable qualitative and quantitative losses in these products. For example,
in lentils, if not stored properly, losses can be reached as high as 50 % due to insect damages
(Ghosh et al., 2007). Wheat flour infested with R. dominica greatly affectes baking and
rheological properties of bread made by the flour (Sanchez-Marinez et al., 1997). International
trade of dry nuts such as walnuts and almonds may require complete elimination of targeted
insect pests in these commodities in certain countries, such as Japan, South Korea and
European countries (Wang et al., 2007a, b). Contamination of pathogens Chronobacter
sakazakii and Salmonella spp in infant formulas (Breeuwer et al., 2003; Friedemann, 2007),
and Bacillus cereus and Clostridium perfrigens in spices (Banerjee and Sarkar, 2003) may even
pose a serious threat to consumer health.
Radio frequency (RF) heat treatment has been explored to investigate its potential in dry
food products and to control targeted pathogens and insects in several dry products, such as
disinfestations of navel orangeworm (Amyelois transitella), codling moth (Cydia pomonella),
Indian meal moth (Plodia interpunctella) and red flour beetle (Tribolium castaneum) in in-shell
walnuts (Wang et al., 2001a; 2002; 2007a, b), grain borers and Angoumois grain moth in rice
(Lagunas-Solar et al., 2007), and Salmonella spp and E. coli O157: H57 in fishmeal (Lagunas-
Solar et al., 2005). But the major hurdle for RF heating technology to be commercially
applicable is its non uniform heating. Non uniform temperature distribution may cause quality
loss or insect/pathogen survival due to either over or under heating in different parts of a food

49
product. To make this technology commercially feasible, it is essential to understand the
complex mechanism of RF heating.
Computer simulation has been effectively used to help understand the RF heating
process in different food materials. Neophytou and Metaxas (1998, 1999) used finite element
method to simulate electric field inside RF applicators by solving wave and Laplace equations.
Yang et al. (2003) modeled RF heating of alfalfa and radish seeds packed inside rectangular
polypropylene boxes in a 1 kW RF system using a commercial software TLM-FOOD
HEATING based on transmission line and finite different time domain methods. Chan et al.
(2004) solved wave equations to simulate electric field patterns in 1 % carboxymethyl cellulose
(CMC) solution, placed in a 6 kW, 27.12 MHz RF system using finite element method. They
compared simulated electric field patterns with the experimentally determined temperature
patterns in CMC solutions using five load positions and container sizes. Marra et al. (2007)
successfully simulated the temperature distribution and heating uniformity inside a cylindrical
meat roll subjected to a 600 W RF heating using a commercially available finite element based
software (FEMLAB). They reported differences in temperature uniformity inside the meat
sample at different power levels. A computer simulation using FEMLAB was also successfully
performed to study various factors causing heating non uniformity in fresh fruits, when
subjected to RF heating inside a 12 kW, 27.12 MHz RF system (Birla et al., 2008a, b).
Simulation results showed that dielectric properties, shape and position of fruit inside the RF
applicator greatly affected heating uniformity of fresh fruits. Romano and Marra (2008) studied
the effect of regular sample shapes (cube, cylinder and sphere) and their orientation on RF
heating behavior in meat samples using a computer model and predicted that cubes should have
better heating uniformity than cylinders and spheres. Wang et al. (2008) simulated and

50
validated a computer model to study the influence of dielectric properties of mashed potato and
circulating water on the electric field distribution, heating rate and temperature distribution in a
6 kW RF system. Simulation results confirmed that increase in salt content (loss factor) did not
guarantee the increase in RF power density.
Very few studies on the computer simulation of the RF heating of dry food products are
reported in the literature. Yang et al. (2003) simulated the RF heating of alfalfa and radish
seeds. This study was based on a small RF cavity and they reported discrepancies in
temperature distributions between simulation and experimental results. Therefore, it is
necessary to systematically study the RF heating characteristics in dry food materials and
design parameters to improve the RF heating uniformity based on the validated computer
simulation model.
The overall objective of this study was to investigate the behavior of RF heating in dry
food materials with the use of a computer simulation model. Specific objectives were to (1)
determine the dielectric and thermal properties of the wheat flour as a representative material of
dry food products, (2) develop a computer simulation model for a 12 kW, 27.12 MHz RF
system using commercial finite element software FEMLAB, and (3) validate the computer
model by comparing with the transient experimental temperature profiles of wheat flour at four
different layers after 3 min RF heating.
2. Materials and Methods
2.1. Material selection
Hard red spring whole wheat flour, bronze chief, was selected as a representative food
material of the dry food products. The selection of wheat flour was based on compositional
uniformity and particle size as compared to other dry food materials, such as food grains and

51
bakery products. The flour was procured from Wheat Montana farms, Three Forks, Montana,
USA and stored at room temperature prior to RF experiments. The initial moisture content of
wheat flour was 8.8% on wet basis.
2.2. Dielectric and thermal properties measurement
Dielectric properties (DPs) of wheat flour samples at a normal bulk density (without
further compression) of 800 kg m-3 were measured with an open-ended coaxial-line probe (HP
85070B) connected to an impedance analyzer (HP 4291B, Hewlett Packard Corp., Santa Clara,
CA, USA). This normal bulk density of wheat flour was similar to that (785 kg m-3) reported by
Rahman (1995). Sample temperatures were raised from 20 to 70 °C in every 10 °C interval in
an oil bath by circulating 10% water and 90% ethylene glycol solution through the jacket of the
test cell. The details of the measurement system and procedure can be found elsewhere (Wang
et al., 2003; Guo et al., 2008). The selected temperature range should be practically applicable
for the heat disinfestations of dry food materials without affecting their quality.
Thermal properties (thermal conductivity and specific heat) at a bulk density of 800 kg
m-3 were measured by a dual needle probe method (KD2 Pro, Decagon Devices, Pullman, WA,
USA) within the temperature range from 20 to 70 °C.
2.3. Development of computer model
2.3.1. Physical model
A 12 kW, 27.12 MHz parallel plate RF heating system (Strayfield Fastran with E-200,
Strayfield International Limited, Wokingham, UK) was used for the study. The RF system
included metallic enclosure, generator, and RF applicator with a pair of RF electrodes. A
schematic diagram of the RF applicator was shown in Fig. 1. The bottom electrode was the
integral part of metallic enclosure. Top electrode position could be changed with the help of

52
adjustable screw bars. RF power from the generator was fed in the middle of top electrode. A
dielectric material (wheat flour) in a container was placed on the ground electrode.
2.3.2. Governing equations
Quasi static approximation for the RF electric field is a valid assumption inside the RF
cavity due to its long wavelength (~ 11 m) compared to cavity size (1.8 × 1.4 × 1.0 m3). Wave
length of a wave in a non-magnetic homogeneous dielectric material ( mλ ) can be expressed as:
'm
m
λλε
= (1)
where 'mε is the material dielectric constant and λ is the wavelength in air (Besser and
Gilmore, 2003). Since, dry food materials have low dielectric constant values, assumption of
quasi-static RF electric field inside dry food materials should also be valid.
Quasi-static electric field inside the RF cavity can be obtained by solving Laplace
equation:
( + 2 ) 0o mj f Vσ π ε ε∇ ∇ = (2)
where j = 1− , V is the voltage between the two electrodes (V) and related to the electric
field ( V= −∇E ), f is the frequency (Hz), oε is the permittivity of free space (8.86 × 10⁻¹² F
m-1), σ and εm are the electrical conductivity (S m-1) and the complex relative permittivity of
the material, respectively. The complex relative permittivity mε can be expressed in terms of
dielectric constant 'mε and loss factor "mε of the material ( ' * "m m mjε ε ε= − ). When a dielectric
material is placed inside the RF applicator, RF power density (Q , W m-3) in the material is
given by:
2"2 o mQ fπ ε ε= E (3)

53
The RF power density acts as a heat source and results in unsteady conductive heat transfer
inside the material. The unsteady conductive heat transfer equation is given by:
p
T QTt C
αρ
∂= ∇ ∇ +
∂ (4)
where T is the local temperature (°C) inside the material, t is the time (s) of heating, ρ , α ,
and pC are the density (kg m-3), thermal diffusivity (m s-2) and specific heat (J kg-1 °C-1) of the
food material, respectively.
2.3.3. Initial and boundary conditions
It was difficult to consider each and every details of RF systems in simulation as it
required excessive computer resources. Only a quarter part of the RF machine, sample and
container was modeled to avail advantages of system symmetry. Dimensions of the sample,
container and RF system along with electrical and thermal boundary conditions are shown in
Fig. 2. Electrical insulation ( 0E∇ = ) was assigned to symmetrical planes of the RF applicator,
coincided with the symmetrical planes of sample and container. In reality, voltage on top
electrode varies all over the surface of top electrode. Voltage has its minimum value at the feed
point and goes on increasing as we move away from the feed point. Barber (1983) reported if
top electrode dimensions were less than 30% of the RF wave length, voltage can be assumed
uniform in all parts of the top electrode. In the present RF system, top electrode dimensions
(1.05 × 0.8 m2) with feed point at its center (Fig. 1) were sufficiently small compared to 30% of
RF wave length (~3.3 m), therefore, electric voltage on the top electrode was considered
uniform in the simulation. Top electrode voltage was also assumed constant during the RF heat
treatment, as voltage in typical industrial-scale RF systems varies only 7 % between standby to
full load position (Metaxas, 1996). It was difficult to measure top electrode voltage in an

54
operating RF system, therefore, preliminary simulations were run by considering different
values of top electrode voltage. Based on the comparison between preliminary simulation
results and experimental results, value of top electrode voltage was considered as 13000 V for
the final simulation. The similar approach for the evaluation of top electrode voltage has been
reported (Marshall and Metaxas, 1998; Birla et al., 2008a). RF cavity walls along with bottom
electrode were grounded, therefore voltage (V = 0 V) was set for these boundaries. Convective
heat transfer ( h = 20 W m-2 °C-1) was assumed on the top exposed surface of the sample (Wang
et al., 2001b). Other outer surfaces of the plastic container were considered as thermally
insulated ( T∇ =0). Initial temperature was set at 23 °C based on the experimental room
conditions.
2.3.4. Solution procedure
Commercially available software based on finite element method, FEMLAB (V3.4,
COMSOL Multiphysics, Burlington, MA, USA) was used to solve coupled electromagnetic
and heat transfer equations. Inbuilt FEMLAB modules (AC/DC quasi-static) and heat transfer
by conduction with transient analysis were selected to solve partial differential equations.
Modeling steps involved in simulation were shown in Fig. 3. The unstructured mesh consisting
Lagrange- Quadratic element was generated in the entire domain of RF cavity. Relatively fine
meshes were created near the sharp edges and corners of the sample and the container to
increase the accuracy of solution. The final mesh consisted of 145781 domain elements
(tetrahedral), 11192 boundary elements (triangular), 633 edge elements (linear) and 26 vertex
elements. The direct linear system solver UMFPACK was used with a relative tolerance and an
absolute tolerance of 0.01 and 0.001, respectively. Initial and maximum time steps were set as
0.001 and 1 s. Solution was considered convergent and grid independent when difference in

55
temperature values of sample in successive refining of grids was less than 0.1%. All computer
simulations were performed for 24 hours in a Dell 670 workstation with two Dual Core, 2.80
GHz XEON processors and 12 GB RAM running on a Windows XP 64 bit operating system.
Another set of simulations was run to analyze the sensitivity of influencing input parameters on
the simulated temperature uniformity ( STU , °C) by varying the model input parameters within
their allowable limits. Selected input parameters were top electrode voltage, sample DPs and
thermal conductivity and heat transfer coefficient of air. Top electrode voltage was varied
between ± 5 percent from its nominal value of 13000 V. DPs of wheat flour (3.27- j 0.23) at 20
°C were varied ± 20 percent. Thermal conductivity of wheat flour was changed between 0.1 to
0.3 W m-1 °C-1 with its nominal value of 0.2. Heat transfer coefficient under still air condition
was varied between 0-20 W m-2 °C-1. STU was defined as:
21 (( ) )vol
av volvol V
STU sqrt T T dVV
= −∫ (5)
where T and avT are local and average temperatures (°C) inside the dielectric material
over the volume ( volV , m-3), respectively. The subdomain integration scheme of FEMLAB was
used to integrate Eq. (5). Results were expressed by ratio of percentage change in STU to the
corresponding percent change in input parameters.
2.4. Model validation
2.4.1. Container material selection
Three trays of polypropylene (each having inner dimension 300 × 220 × 20 mm3)
stacked one above another were used as the container. This was designed to facilitate
temperature mapping at multiple layers. The bottoms of the top two trays were made of
polypropylene mesh (thickness 2 mm with mesh opening of 6 mm). The purpose of using mesh

56
as a bottom was to minimize the air gap between two adjacent trays when staked one above
another. The lower tray bottom and sides of the container were made of 7 mm thin
polypropylene sheet.
2.4.2. Experimental procedure
About one kg wheat flour was filled in each tray to maintain bulk density of 800 kg m-3
in experiments, as used in simulation. A very thin polypropylene film was placed on the
perforated bottom of each tray prior to loading flour into trays. This was done to stop flour flow
from one tray to another tray. The container (stacked trays) was put at the center of the bottom
electrode. The wheat sample was subjected to 3 min RF heating with an electrode gap of 155
mm. The container was immediately removed from the RF system after treatments. The surface
temperatures of all three trays were recorded using an infra-red image camera (ThermaCAMTM
Researcher 2001, FL-IR Systems, Portland, OR, USA) with an accuracy ± 2 ° C, starting from
the top to the bottom tray. Finally, wheat flour of the third (bottom) tray was carefully
overturned on another polypropylene sheet to record the bottom surface temperature of the
sample. All the four thermal imaging measurements were completed within 30 s. A fiber-optic
sensor (UMI, FISO Technologies Inc., Quebec, Canada) was also inserted 40 mm from the
bottom of the container to measure the temperature profile at the center of the second tray
during 3-min RF heating. Experimental and simulated surface temperature distributions were
compared at four different heights (0, 20, 40, and 60 mm) from the bottom of the container.
3. Results and discussion
3.1. Dielectric and thermal properties of wheat flour
Table 1 shows the temperature dependent dielectric and thermal properties of wheat
flour at 27.12 MHz. Both, dielectric constant and loss factor increased slightly with an increase

57
in temperature. Nelson and Trabelsi (2006) also reported slight increase in dielectric properties
of hard red winter flour at moisture content of 11 % d.b. within the temperature range from 5 to
55 °C. Thermal conductivity and specific heat of wheat flour also increased with increasing
temperature. Increase in thermal conductivity and specific heat with temperature were reported
in literature for many other dry products, such as rice flour and milk powder (Muramatsu et al.,
2006), wheat flour (Rahman, 1995), lentils (Tang et al., 1991), and gram (Dutta et al., 1998).
For use of these properties in simulation model, data were subjected to linear regression
analysis. The regression equations are listed in Table 2. Since the increase in loss factor of
wheat flour with temperature was trivial; therefore, an average loss factor value of 0.33 was
used in the simulation. Dielectric and thermal properties of polypropylene container and air
were adapted from Birla et al. (2008a).
3.2. Simulated temperature profiles of wheat flour
Fig. 4 shows simulated temperature profiles of one quadrant of a wheat flour sample in
four different horizontal and vertical layers. Horizontally, temperature values were highest at
the lower sections of the wheat flour except at the bottom layer, which was in contact with the
bottom electrode. Vertically, temperature increased from the symmetrical (central) layer to
outer layers of the wheat sample, except at the outer most layer, which was in contact with the
container side walls. The temperature non uniformity in the sample could be attributed to
electric field behavior. Though, the electric field was normal to the central parts of top sample,
but it was deflected by the sample corners and edges (Fig. 5a). As a result, net electric field
increased at the corners, edges and lower sections of the sample. Since RF power density at any
location is proportional to the square of electric field, it also increased, (Fig 5b), resulting in
higher temperature values at these parts. These findings were supported by the simulation of

58
cylindrical meat batters where higher temperatures at the edges and lower sections of the meat
were observed after RF heating (Marra et al., 2007). Computer simulation of RF heating of
model fruit, placed on the bottom electrode also showed higher heating at the lower part of the
fruit (Birla et al., 2008a). Similar heating patterns were observed in seven polyurethane foam
sheets, subjected to an industrial-scale RF heating (Wang et al., 2007a, b).
3.3. Comparison of simulated and experimental thermal profiles of wheat flour
Figs. 6 and 7 show a comparison between experimental and simulated surface
temperature distribution of wheat flour in all four layers. Temperature profiles along the center
line LL’ (Figs. 6c and 7c) of each layer were also compared. The results demonstrate that
simulated and experimental temperature distribution patterns for all layers are in good
agreement. The values of experimentally determined temperature and the simulated
temperature were matched well except for the corners of the sample where the simulated
temperatures values were found higher than the experimental values. Along the line LL’,
simulated and experimented values were also in good agreement. The difference in simulated
and experimentally determined temperature values, large at the corners and edges, could be due
to either simplification of RF system or ignored moisture migration form outer hot sections to
inners cold sections of the wheat flour during 3 min RF heating in simulation. Simulated and
experimental temperature profiles measured at the center of first mid layer (40 mm form the
container bottom) were also in good agreement (Fig. 8). Table 4 compared simulated and
experimented average temperature values of all four layers after 3 min RF heating. It is clear
that experimented average temperatures matched well with the simulated ones. But the values
of simulated standard deviation were comparatively higher than those determined by

59
experiments. As corners and edges were more heated in simulation shown in Figs. 6 and 7, this
increased the simulated standard deviation in each layer.
3.4. Sensitivity analysis
Results showed that STU was most sensitive to the top electrode voltage as change in
STU value to the corresponding change in electrode voltage was highest (Table 3). Sample
DPs and thermal conductivity of wheat flour also affected STU . Simulation results showed
that heat transfer coefficient of air within the range of 0-20 W m-2 C-1 had negligible effect on
simulated temperature uniformity.
4. Conclusions
A computer model for the RF heating of the dry products was developed for a 27.12
MHz RF system using a finite element based commercial software, FEMLAB using whole
wheat flour as a model food. Dielectric and thermal properties of wheat flour were measured
and used in the simulation model. Simulated results showed that temperature values at the mid
layers were highest, followed by those of top and bottom layers. Corners were heated more
than centers at each layer. Simulation results confirmed that non uniform distribution of RF
power density resulted in temperature non uniformity in the sample. Therefore, analysis of RF
power distribution inside food materials can be a starting step to understand the complex RF
heating process and to predict the temperature distribution in dry food materials.

60
Table 1
Dielectric and thermal properties of hard red spring wheat flour at a bulk density of 800 kg m-3
and moisture content of 8.8 % w.b. The data represent the mean of two replicates.
Temperature
(T, °C)
Dielectric constant
( 'mε )
Loss factor
( "mε )
Thermal
conductivity
( k , W m-1 °C-1)
Specific heat
( pC , J kg-1 °C-1)
20 3.27 ± 0.03 0.29 ± 0.01 0.12 ± 0.003 1229.37 ± 36.23
30 3.34 ± 0.03 0.31 ± 0.00 0.14 ± 0.005 1644.38 ± 38.00
40 3.49 ± 0.02 0.31 ± 0.02 0.15 ± 0.003 1661.25 ± 35.23
50 3.73 ± 0.06 0.31 ± 0.01 0.17 ± 0.006 1823.75 ± 60.10
60 4.09 ± 0.01 0.34 ± 0.01 0.20 ± 0.007 1950.64 ± 13.25
70 4.77 ± 0.10 0.42 ± 0.01 0.27 ± 0.004 2188.75 ± 21.21

61
Table 2
Dielectric and thermo-physical properties of wheat flour, polypropylene and air used in
computer simulation as a function of temperature (T, °C)
Wheat flour Polypropylene Air
Dielectric constant ( 'mε ) 3.72-0.0345T
+0.0007T2 2 1
Loss factor ( "mε ) 0.33 0.0023 0
Specific heat, ( pC , J kg-1 °C-1) 23T + 757 1800 _
Thermal conductivity
( k , W m-1 °C-1)
1.36×10⁻⁴T2
0.0094T+0.2819 0.2 _
Density ( ρ , kg m-3) 800 900 _

62
Table 3
Relative sensitivity of simulated temperature uniformity ( STU ) of wheat sample with respect
to model input parameters
Input parameters
Nominal value Percentage
change in input
Change in STU /
Corresponding change
in input parameters
Electrical voltage (V)
13000 ±4 1.34
DPs
3.27- j 0.23 ±20 0.49
Thermal conductivity (W m-1 °C-1)
0.2 ±50 0.12
Heat transfer coefficient of air (W m-2 °C-1)
10 ±100 0.03

63
Table 4 Experimental and simulated average temperature ± standard deviation (° C) at four different
horizontal layers of wheat flour in a plastic container (300 × 220 × 60 mm3) after 3 min RF
heating with an electrode gap of 155 mm and initial temperature of 23 ° C
Position of layer (thickness from
the bottom of container)
Experiment (° C) Simulation (° C)
Top layer (60 mm) 55.8 ± 2.3 54.5 ± 4.3
First mid layer (40 mm) 67.9 ± 3.0 68.2 ± 5.7
Second mid layer (20 mm) 70.9 ± 2.9 70.9 ± 5.5
Bottom layer (0 mm) 48.4 ± 1.6 49.7 ± 3.6

64
Fig.1. Schematic diagram of a 12 kW, 27.12 MHz radio frequency system

65
Fig. 2. Geometry and boundary conditions of one quadrant of 12 kW, 27.12 MHz radio
frequency systems used in simulation (dimensions are in mm).

66
Fig. 3. Flow chart of modeling using FEMLAB 3.4

67
(a) Four horizontal layers, from bottom plane (b) Four vertical layers, from central line plane
Fig. 4. Simulated temperature (°C) profiles of one quadrant wheat flour sample (150 × 110 × 60 mm3) at (a) four different horizontal
layers (0, 20, 40, and 60 mm) from the bottom (b) four different vertical layers (0, 36, 72, and 110 mm) from the vertical center plane
of sample after 3 min RF heating with an electrode gap 155 mm and initial temperature of 23 °C.

68 (a) Electric field distribution (b) RF power density Fig. 5. Simulated electric field distribution (a) and RF power density distribution (W m-3) of one quadrant wheat flour sample (150×
110 × 60 mm3) after 3 min RF heating with an electrode gap of 155 mm.

69
Experimented top layer (60 mm) Experimented first mid layer (40 mm)
85
8585
8080
80 80
75 75
70
65
85
8585
8080
80 80
75 75
70
65
Simulated top layer (60 mm) Simulated first mid layer (40 mm)
50
55
60
65
70
75
80
0 100 200 300
Tem
pera
ture
(C)
Length of sample (mm)
Exp
Sim
Fig. 6. Experimental (a) and simulated (b) temperature distributions (°C) of hard red spring
wheat flour in top and first mid layers (60 and 40 mm from the bottom of sample) placed in a
polypropylene container (300×220×60 mm3) on the top of the bottom electrode with the
comparison of the temperature profiles (c) along the line LL’, after 3 min RF heating with an
initial temperature of 23 °C and a fixed electrode gap of 155 mm.

70
Experimented second mid layer (20 mm) Experimented bottom layer (0 mm)
55 55
55 55
50
50
45
45
Simulated second mid layer (0 mm) Simulated bottom layer (0 mm)
35
40
45
50
55
0 100 200 300
Tem
pera
ture
(C)
Length of sample (mm)
Exp
Sim
Fig. 7. Experimental (a) and simulated (b) temperature distributions (° C) of hard red spring
wheat flour in second mid and bottom layers (20 and 0 mm from the bottom of sample) placed
in a polypropylene container (300×220×60 mm3) on the bottom electrode with the comparison
of the temperature profiles (c) along the line LL’ after 3 min RF heating with an initial
temperature of 23 °C and a fixed electrode gap of 155 mm.
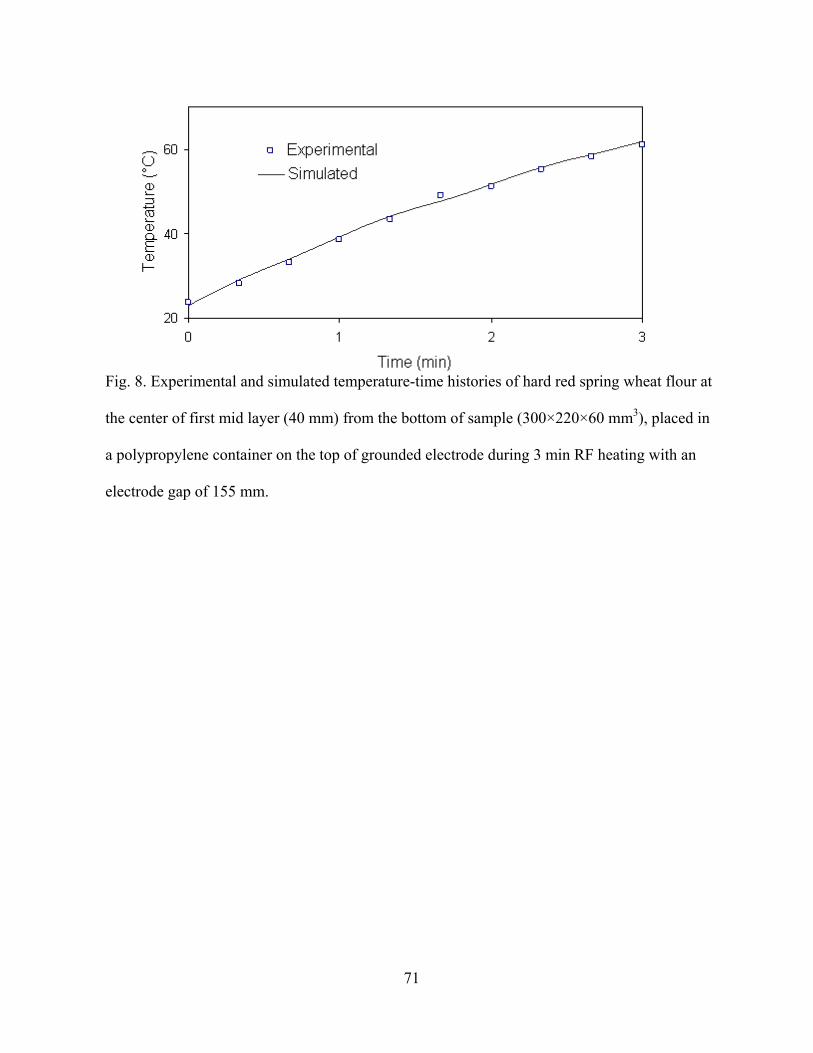
71
Fig. 8. Experimental and simulated temperature-time histories of hard red spring wheat flour at
the center of first mid layer (40 mm) from the bottom of sample (300×220×60 mm3), placed in
a polypropylene container on the top of grounded electrode during 3 min RF heating with an
electrode gap of 155 mm.

72
References
Banerjee, M., & Sarkar, P.K. (2003). Inhibitory effect of garlic on bacterial pathogens from
spices. World Journal of Microbiology and Biotechnology, 19 (6), 565-569.
Barber, H. (1983). Electroheat. 1st ed. Granada Publishing Limited, London
Birla, S.L., Wang. S., & Tang, J. (2008a). Computer simulation of radio frequency heating of
model fruit immersed in water. Journal of Food Engineering, 84(2), 270–280.
Birla S.L., Wang, S., Tang, J., & Tiwari, G. (2008b). Characterization of radio frequency
heating of fresh fruits influenced by dielectric properties. Journal of Food Engineering,
89(4), 390–398.
Besser, L., & Gilmore, R. (2003). Practical RF circuit design for modern wireless systems:
Passive circuits and systems, Norwood: Artech House Publishers.
Breeuwer, P., Lardeau, A., Peterz, M., & Joosten, H.M. (2003). Desiccation and heat tolerance
of Enterobacter sakazakii. Journal of Applied Microbiology, 95(5), 967–973.
Chan, T.V.C.T., Tang, J., & Younce, F. (2004). 3 Dimensional numerical modeling of an
industrial radio frequency heating systems using finite elements. Journal of Microwave
Power and Electromagnetic Energy, 39(2), 87–105.
Dutta, S.K., Nema,V.K., & Bhardwaj, R.K. (1998). Thermal properties of gram. Journal of
Agricultural Engineering Research, 39 (4), 269–275.
Friedemann, M. (2007). Enterobacter sakazakii in food and beverages (other than infant
formula and milk powder). International Journal of Food Microbiology, 116(1), 1–10.
Ghosh, P.K., Jayas, D.S., Srivastava, C., & Jha, A.N. (2007). Drying and storing lentils:
engineering and entomological aspects In Lentil: an ancient crop for modern times (pp
385-414). Netherlands: Springer.

73
Guo, W., Tiwari, G., Tang, J., & Wang, S. (2008). Frequency, moisture and temperature-
dependent dielectric properties of chickpea flour. Biosystems Engineering, 101(2), 217-
224.
Lagunas-Solar, M.C., Pan, Z., Zeng, N.X., Truong, T.D., Khir, R., & Amaratunga, K.S.P.
(2007). Application of radiofrequency power for non-chemical disinfestation of rough
rice with full retention of quality attributes. Applied Engineering in Agriculture, 23(5),
647–654.
Lagunas-Solar, M.C., Zeng, N.X., Essert, T.X., Truong, T.D., Pina, C., Cullor, J.S., Smith,
W.L., & Larrain, R. (2005) Disinfection of fishmeal with radiofrequency heating for
improved quality and energy efficiency. Journal of the Science of Food and
Agriculture, 85, 2273–2280.
Marra, F., Lyng, J., Romano, V., & McKenna, B. (2007). Radiofrequency heating of foodstuff:
Solution and validation of a mathematical model. Journal of Food Engineering, 79(3),
998–1006.
Marshall, M.G., & Metaxas, A.C. (1998). Modeling of the radio frequency electric field
strength developed during the RF assisted heat pump drying of particulates. Journal of
Microwave Power and Electromagnetic Energy, 33(3), 167-177.
Metaxas, A. C. (1996). Foundations of electroheat – A unified approach. Ist ed. John Wiley &
Sons. New York:
Muramatsu, Y., Tagawa, A., & Kasai, T. (2006). Effective thermal conductivity of rice flour
and whole and skim milk powder. Journal of Food Science 70(4), 279–287.
Nelson, S.O., Trabelsi, S. (2006). Dielectric spectroscopy of wheat from 10 MHz to 1.8 GHz.
Measurement Science and Technology 17(8), 2294–2298.

74
Neophytu, R. I., & Metaxas, A.C. (1998). Combined 3D FE and circuit modeling of radio
frequency heating systems. Journal of Microwave Power and Electromagnetic Energy,
33 (4), 243–262.
Neophytu, R.I., & Metaxas, A.C. (1999). Combined tank and applicator design of radio
frequency heating systems. IEE Proceedings-Microwaves Antennas and Propagation
146(5), 311–318.
Rahman, S. (1995). Food properties handbook. CRC Press. Florida:
Romano, V., & Marra, F. (2008). A numerical analysis of radio frequency heating of regular
shaped foodstuff. Journal of Food Engineering, 84(3), 449–457.
Sánchez-Mariñez, R.I., Cortez-Rocha, M.O., Ortega-Dorame, F., Morales-Valdes, M., &
Silveira, M.I. (1997). End-use quality of flour from Rhyzopertha Dominica infested
wheat. Cereal Chemistry, 74(4), 481–483.
Tang, J., Sokhansanj, S., Yannacopoulos, S., & Kasap, S.O. (1991). Specific heat capacity of
lentil seeds by differential scanning calorimetry. Transactions of the ASAE, 34(2), 517–
522.
Wang, J., Olsen, R. G., Tang, J., & Tang, Z. (2008). Influence of mashed potato dielectric
properties and circulating water electric conductivity on radio frequency at 27 MHz.
Journal of Microwave Power and Electromagnetic Energy, 42(2), 31–46.
Wang, S., Ikediala, J.N., Tang, J., Hansen, J.D., Mitcham, E., Mao, R., & Swanson, B. (2001a).
Radio frequency treatments to control codling moth in in-shell walnuts. Postharvest
Biology and Technology, 22(1), 29–38.
75
Wang, S., Monzon, M., Johnson, J.A., Mitcham, E. J., & Tang, J. (2007a). Industrial-scale
radio frequency treatments for insect control in walnuts: I. Heating uniformity and
energy efficiency. Postharvest Biology and Technology, 45(2), 240–246.
Wang, S., Monzon, M., Johnson, J.A., Mitcham, E.J.,& Tang, J. (2007b). Industrial-scale radio
frequency treatments for insect control in walnuts: II: Insect mortality and product
quality. Postharvest Biology and Technology, 45(2), 247–253.
Wang, S., Tang, J., & Cavalieri, R.P. (2001b). Modeling fruit internal heating rates for hot air
and hot water treatments. Postharvest Biology and Technology, 22(3), 257–270.
Wang, S., Tang, J., Cavalieri, R.P., & Davies, D.C. (2003). Differential heating of insects in
dried nuts and fruits associated with radio frequency and microwave treatments.
Transactions of the ASAE, 46(4), 1175-1182.
Wang, S., Tang, J., Johnson, J.A., Mitcham, E., Hansen, J.D., Cavalieri, R., Bower, J., & Biasi,
B. (2002). Process protocols based on radio frequency energy to control field and
storage pests in in-shell walnuts. Postharvest Biology and Technology, 26(3), 265-273.
Yang, J., Zhao, Y., & Wells, J.H. (2003). Computer simulation of capacitive radio frequency
(RF) dielectric heating on vegetable sprout seeds. Journal of Food Process
Engineering, 26(3), 239–263.

76
CHAPTER 4
COMPUTER SIMULATION OF RADIO FREQUENCY HEATING OF DRY FOOD
MATERIALS, PART II: MODEL PREDICTIONS
G. Tiwari1, S. Wang1, J. Tang1*, S. L. Birla2
Prepared manuscript for Journal of Food Engineering
1 Department of Biological Systems Engineering,
Washington State University, Pullman, WA 99164-6120, USA.
2 Department of Biological Systems Engineering,
University of Nebraska, Lincoln, NE 68583, USA.
Corresponding author:
Juming Tang, 213 LJ Smith Hall, Pullman, WA 99164-6120, USA;
Phone: 509-335-2140; fax: 509-335-2722; e-mail: [email protected].

77
Abstract
The objectives of this research were to investigate the influence of various factors on
radio frequency (RF) power distribution in dry food materials, placed in a 12 kW, 27.12 MHz
parallel plate RF system, using a finite element computer model after validation with wheat
flour. The factors investigated were sample size, shape, relative position between RF
electrodes, and dielectric properties (DPs) of the sample and the surrounding medium. Effects
of electrode gap and top electrode configuration on RF power distribution behavior of the
sample were also studied. RF power uniformity of the samples was compared using power
uniformity index (PUI). Simulated results showed that RF power uniformity in cuboid shaped
samples, placed on the bottom electrode, first decreased and then increased with the increase in
sample size. Sample shape and its vertical position between the fixed gap parallel plate
electrodes also affected RF power distribution and uniformity. A cuboid sample had higher RF
power densities at the edges while an ellipsoid had higher power densities in the center parts.
Simulated results showed that smaller values of DPs resulted in better RF power uniformities in
the samples. Reducing the electrode gap improved RF power uniformity of the sample. While
studying the influence of top electrode configuration on the RF power distribution and
uniformity, the results showed that optimum RF power uniformity in a particular sample size
could be achieved with a particular top electrode bending position and angle. The results are
useful in understanding complex RF heating, designing and scaling up efficient RF systems.
Keywords: Radio frequency, Computer simulation, Dielectric properties, Power uniformity
index

78
1. Introduction
Radio frequency (RF) technology has been explored in various food processing
operations such as pasteurization and sterilization (Bengtsson et al., 1970; Houben et al., 1991;
Brunkhorst et al. 2000; Luechapattanaporn et al., 2005; Lagunas-Solar et al. 2005, 2007; Byrne
et al. 2010) and insect disinfestations in various agricultural commodities such as fresh fruits
(Birla et al., 2004, 2005; Wang et al 2006, ; Tiwari et al., 2008) and dry nuts (Wang et al.,
2001, 2002, 2003, 2005, 2008b). A major obstacle of RF technology to be commercially
applicable is its potential non uniform heating. Different factors such as sample dielectric
properties (DPs), size, shape, its position between the RF electrodes, and electrode
configuration may affect temperature uniformity in a RF treated food product. Barber (1983)
reported that temperature uniformity could be improved if electrodes are shaped to fit the
surface of the material. Wang et al. (2005) observed temperature non uniformity in in-shell
walnuts, placed at different locations inside a 12 kW, 27.12 MHz RF system after 3 min
heating. Effect of three sample shapes (cube, cylinder and sphere) on temperature uniformity of
meat has been simulated by Romano and Marra (2008). They reported that cubes should have
better temperature uniformity compared to cylinders and spheres. Birla et al. (2008a) reported
difference in temperature profiles of a model fruit when it was placed at different vertical and
horizontal positions between the fixed gap RF electrodes. Simulation on RF heating of mashed
potato, conducted by Wang et al. (2008a) showed that DPs of meshed potato and surrounding
water affected heating rate and temperature distribution. Birla et al. (2008b) showed that DPs of
different constitutional parts (peel and pulp) of a fruit influenced its final temperature
distribution after RF heating. Petrescu and Ferariu (2008) reported the effect of vertical gap
between RF electrodes, and the horizontal distance between the successive pair of electrodes on
79
the heating uniformity of a dielectric material kept inside a staggered RF applicator. Wang et
al. (2010) used three different electrode gaps to select the most suitable heating time for the RF
heat treatment of lentils. Keeping the complexity of RF heating behavior in mind, a complete
investigation on RF heating behavior is essential to optimize temperature distributions in
treated food products.
Experimental methods are time consuming, costly, and often provide limited variability.
Computer simulation can be used as a fast, cheap, flexible and effective tool to virtually
analyze and provide an insight of RF heating mechanism in food materials. Computer
simulation has previously been used to study RF heating uniformity in various food materials
such as fresh fruits (Birla et al., 2008a, b), meat (Marra et al., 2007; Rayner, 2007; Romano and
Marra, 2008), grain seeds (Yang et al., 2003), mashed potato (Wang et al., 2008a), and carboxy
methyl cellulose solution (Chan et al., 2004). Recently, Tiwari et al. (2010) developed and
validated a finite element based computer model for RF heating of dry food products using
wheat flour as a representative material. Simulation results in that study demonstrated that non
uniform distribution of RF power density (which acted as a heat source) was responsible for
temperature non uniformity in wheat flour. Therefore, as a starting step, it was important to
access and study the behavior of RF power density inside a dry product, influenced by
important factors such as sample size, shape, position, DPs, electrode gap and top electrode
configuration.
In the past, different criteria and index have been used to study, evaluate and compare
RF power and temperature uniformity in food samples. Neophytou and Metaxas (1998) used
normalized RF power density to compare RF power uniformities in rapeseeds and raw potatoes.
Temperature uniformity of walnuts, soybeans, wheat and lentils has been experimentally
80
assessed and compared by using a heating uniformity index, defined as the ratio of difference in
standard deviation rises to average sample temperature rises during RF treatments (Wang et al.,
2005). Romano and Marra (2008) compared the simulated average, maximum and minimum
temperatures of meat samples in three different shapes (cube, cylinder and sphere). In the
present work, RF power densities in dry food samples are assessed and compared under
different conditions, using a simulated power uniformity index (PUI). The overall objective of
the study was to help design and scale up efficient RF systems for industrial applications.
Specific objectives of this study were to investigate the effect of (1) sample size, shape and its
relative vertical position between the electrodes, (2) sample and surrounding material, and (3)
electrode gap and top electrode configuration on sample RF power density distribution.
2. Material and methods
2.1. Governing equations
2.1.1. RF power density and Laplace equations
When a dielectric material is placed between two plate RF electrodes, the local RF
power density (Q , W m-3) in the material is defined as:
2"2 o mQ fπ ε ε= E (1)
where f is the frequency (Hz), oε and "mε are the permittivity of the free space (8.86 × 10⁻¹² F
m-1), and the loss factor of the material, respectively. E is the modulus of electric field (V).
Electric field ( E ) inside the RF applicator is defined as the negative gradient of the electric
voltage ( V= −∇E ).
Quasi-static electric field approximation of Maxwell equation is used in the modeling of RF
heating of dry food materials (Tiwari et al., 2010). Maxwell equation with quasi static electric
field approximation is given by:
81
( + *2 ) 0o mj f Vσ π ε ε∇ ∇ = (2)
where 1j = − , σ and εm are electrical conductivity (S m-1) and complex relative
permittivity of the material, respectively. The complex relative permittivity mε of the material
is related to dielectric constant 'mε and loss factor "mε ( ' * "m m mjε ε ε= − ).
2.1.2. Average RF power density and RF power uniformity index (PUI) of the sample
Average RF power density ( avQ , W m-3) in a dielectric material is defined as volume
integral of RF power density (Q , W m-3) divided by material volume ( volV , m3):
1
vol
av volvol V
Q QdVV
= ∫ (3)
RF power uniformity index (PUI) in a dielectric material is defined as:
21 (( ) )−
=∫vol
av volvol V
av
sqrt Q Q dVV
PUIQ
(4)
It is clear from Eq. (4) that PUI should be smaller for better RF power uniformity in the
dielectric material. The minimum possible value of PUI is zero, which indicates uniform RF
power in dielectric material. A well designed RF system should have low PUI.
2.2. Physical and simulation model
A 12 kW, 27.12 MHz RF system (Strayfield Fastran with E-200, Strayfield
International Limited, Wokingham, UK) was used as a physical model. The description of the
RF system can be found elsewhere (Birla et al., 2008; Tiwari et al., 2010). It was not feasible to
include each and every single detail of the RF system in simulations due to excessive time and
computer resource requirements. Therefore, only a quarter part of the symmetric RF system
82
was simulated. Fig. 1 showed the RF cavity geometry, boundary conditions and coordinate
system used in simulation.
2.3. DPs of sample and surrounding medium
Tiwari et al. (2010) measured the DPs of wheat flour within the temperature range of 20
to 70 °C. Average DPs (3.78- j *0.33) of wheat flour were used in all simulations, except for
the cases in which effect of sample DPs on RF power uniformity were investigated. Similarly,
air (1- j *0) was used as surrounding material in all simulations, except for the cases in which
effect of surrounding material dielectric constants on RF power uniformity were investigated.
2.4. Boundary conditions
Constant electrical voltage (13000 V) was applied on top electrode (Tiwari et al., 2010).
Since, bottom electrode was grounded and attached to the metallic casings of the RF cavity,
voltage (0 V) was assigned to all metallic casings and bottom electrode. Electrical insulation
( 0E∇ = ) was considered to the symmetrical faces of RF applicator and sample.
2.5. Simulation methodology
Commercially available finite element based software FEMLAB (V3.4, COMSOL
Multiphysics, Burlington, MA, USA) was used for simulations. An Inbuilt AC/DC module with
quasi-static analysis was selected to solve Maxwell equation. In each simulation, model
geometry was first constructed and meshed. A relatively fine mesh was generated at the
interface of sample and the surrounding medium. Linear system solver (UMFPACK) was used
to solve the partial differential equation. For each case, simulation was repeated by refining the
mesh size. Average RF power density ( avQ ) and PUI of the sample were calculated in each
repetition using FEMLAB inbuilt integration scheme. Solution was considered mesh
independent when sample PUI in successive repetitions did not change till three decimal points.

83
Solution time for each simulation varied between 20-60 min, depending on sample and mesh
size. All simulations were performed on a Dell 670 workstation with two Dual-Core, 2.80 GHz
XEON processors and 12 GB RAM running a Windows XP 64-bit operating system.
2.6. Simulation sequence
2.6.1. Simulation with varying sample size, position and shape
Wheat flour samples shaped in cuboids, were placed on the ground electrode. A series
of simulations were run by changing lengths and widths of samples progressively at regular
intervals between 50-600 mm, while the height was fixed as 60 mm. Another set of simulations
were performed by varying sample heights ranging between 10 and 100 mm with lengths and
widths fixed as 150 mm. The electrode gap in each simulation was set at 155 mm. Trends of RF
power density distribution and PUIs of flour in each simulation were determined.
Based on previous simulation results, three cuboids (50×50×60 mm3, 150×150×60
mm3, 300×300×60 mm3) were selected to study the effect of sample vertical position between
the fixed gap RF electrodes. Dimensions represented lengths, widths and heights of cuboids
along x, y and z axis. Coordinate system is shown in Fig. 1. Cuboids were placed at seven
vertical positions (z = 0, 17.5, 37.5, 47.5, 57.5, 77.5 and 95 mm) from the bottom electrode.
Positions (z = 0, 47.5 and 95 mm) are the vertical elevations when samples were placed on the
bottom electrode, exactly in the middle of RF electrodes and in touch with the top electrode.
Positions (z = 17.5, 37.5, 57.5 and 77.5) are the vertical elevations in which samples were
placed at equal distances (-30, -10, +10 and +30 mm) from the central position. Trends of RF
power density distribution with PUIs were determined in each simulation.
A cuboid, an ellipsoid and a cylinder were chosen to study the effect of container shape.
Dimensions of shapes were considered as 150×150×60 mm3, which represented length, width

84
and height in the cuboid, equatorial radiuses and height in the ellipsoid and two mutually
perpendicular radiuses and height in the cylinder along x, y and z directions, respectively.
Samples were placed at three different vertical positions: on the ground electrode, in the middle
of electrodes and in contact with the top electrode. RF power density contours and PUIs of
samples were determined in each simulation.
2.6.2. Simulation with varying DPs of the sample and surrounding medium
To study the effect of DPs on sample PUI, simulations were run by changing the
dielectric constant of the sample from 1 to 100, for various loss factors ranging between 0.5 and
100. A cuboid sample (150×150×60 mm3) was placed on the ground electrode with an
electrode gap of 155 mm. Another set of simulations was performed in five different size
cuboids with narrowed range of dielectric constant (6 – 14) for a set loss factor of 10.
Surrounding material dielectric constant was also varied between 1 and 30 with a set sample
DPs (8- j *10) to study the effect of surrounding material dielectric constant on PUI. Sample
DPs were selected, based on previous simulation results.
2.6.3 Simulation with varying electrode gap and top electrode configuration
Simulations were run by changing top electrode position between 65 mm and 155 mm,
while a cuboid sample (150×150×60 mm3) was kept on the ground electrode. Electrode gap
was changed by varying the position of top electrode. Tiwari et al. (2010) accounted that edge
heating in wheat flour sample placed inside a rectangular container was mainly due to increased
electric field concentration at the corners and edges. Therefore, it was hypothesized that
bending the top electrode upward should reduce the electric field strength in these parts and
improve the heating uniformity of the sample. A schematic diagram of RF cavity with top
electrode bending at different positions and angles was shown in Fig. 2. Top electrode was bent

85
upwards from it both ends at different lengths and angles. Firstly, simulations were run for
different bending positions (0, 100, 200, 300, 400, 500 mm) measured from the center of the
electrode. Bending angles in all these simulations were set as 15°. Secondly, angles were varied
between 0-90°, with the bending position fixed as 200 mm. In all simulations, a cuboid sample
(300×210×60 mm3) was placed on the ground electrode.
3. Results and discussions
3.1. Distribution of RF power density in different sample sizes
Fig. 3 shows the general trends of RF power density distribution of wheat flour in three
different cuboids, placed on the ground electrode. The cuboids were selected in such a way that
two cuboids (150×300×60 mm3, 300×300×60 mm3) were completely and the other cuboid
(600×300×60 mm3) was partially between the RF electrodes, as the top electrode size was
525×400 mm2. It was clear from the Fig. 3 that RF power densities increased from inner to
outer sections of first two cuboids. Higher RF power densities occurred at the edges compared
to other parts, indicated edge heating in these samples. It was also noticeable that relative
sample volumes containing same RF power density contours were more in 300×300×60 mm3
than 150×300×60 mm3, which indicated that sample size affected RF power uniformity, which
will be explained in detail in section 3.3. RF power density distribution was different for the
third sample where density contours first increased and then decreased from inner to outer
sections of the sample. Lowest RF power densities of this sample were at the outer most
section.
Difference in RF power density patterns in the different sample sizes can be explained
by electric field behavior. When samples were put completely between the RF electrodes,
electric field, deflected by the edges and corners increased the net electric field at the outer

86
sections compared to inner sections of the samples (Marra et al., 2007; Birla et al., 2008a;
Tiwari et al., 2010). Since RF power density is proportional to the square of electric field, it
also increased from inner to outer sections of the samples. In case of third sample, net electric
field was comparatively smaller at the outer-most sections of the sample as sample was larger
than the electrode size. That is why, RF power density increased and then decreased from inner
to outer sections of third sample.
3.2. Distribution of RF power density in different sample shapes, placed in different positions
between the RF electrodes
It was also desirable to investigate the effect of sample shapes (a cuboid, a cylinder and
an ellipsoid) on the RF power density distribution as most of the agricultural materials are kept
either in boxes, cans or in pouches. Fig. 4 showed the general trends of RF power density
distribution in the cuboid, ellipsoid, and cylinder, kept at three different positions. It was clear
that cuboid and cylinder had higher RF power densities at the outer sections, while ellipsoid
had higher densities at its inner sections. In cuboid and cylinder, electric field is deflected by
the sample edges, resulted in increase of net electric field concentration at the outer sections of
the samples; while in ellipsoid, the electric field was deflected by every point located on its
curved surface. As a result, net electric field concentration at the inner sections was higher
compared to outer sections of the sample.
RF power density patterns in samples also changed with their placement positions.
Sample in contact with either of the electrodes had higher RF power densities near the contact
surfaces due to increased electric field concentration at the contact surfaces. Samples placed in
the middle of RF electrodes showed higher RF power densities at their central sections as

87
electric field deflected by both (top and bottom) edges, increased net electric field
concentration at the central parts of the sample.
3.3. Effect of sample size on PUI
Figs. 5 and 6 summarized the effect of sample size on PUI of wheat flour. Simulated
results demonstrated (Fig. 5) that increase in sample length and width caused an initial increase
and then reduction of PUI. Values of PUI were highest when sample lengths and widths lied
between 150 and 200 mm, 35-50% of the top electrode size (525×400 mm2). Since patterns of
PUI change were similar with respect to lengths and widths, only lengths were varied in later
simulations. PUI was the lowest when sample length was equal to electrode length (525 mm).
Increase in sample length beyond electrode length increased PUI. Similarly, when sample
height was increased, PUI decreased after showing initial increase (Fig. 5). It was clear form
the Figs. 5 and 6 that RF power uniformity should be better for sample sizes, either
approaching to zero or approaching to maximum possible size that can be kept completely
between the RF electrodes.
When sizes approached to zero, major part of electric field directly passed through the
ground electrode without entering in samples. Because of that, RF power was more uniform in
small samples, as indicated by low PUIs. With increase in sizes, more electric field started
entering into the samples. At first, most of electric field entered obliquely as sizes were
comparatively smaller than top electrode size. Oblique electric field increased RF power non
uniformities in samples. With further increase in sample size, electric field started entering
normally (except a little part, which was getting deflected by sample edges and corners) in the
sample. This caused increase in RF power uniformity again.

88
3.4. Effect of sample vertical position on PUI
Fig. 7 shows the effect of sample vertical position on PUI. Three sample sizes were
selected based on results explained in Fig. 5. These sizes could be considered as small, medium
and big compared to the top electrode size. It was clear from Fig. 7 that trends of PUI change
depended on sample sizes as well as their relative vertical positions between the RF electrodes.
For samples of size 50×50×60 mm3, PUI increased and then decreased when a sample was
moved up from bottom to top electrode. PUI change was symmetrical around the central (z =
47.5 mm) position, with its highest value at this position. In sample size (150×150×60 mm3)
unlike size (50×50×60 mm3), PUIs were highest when samples were placed on the bottom
electrode (z = 0 mm) or in touch with the top electrode (z = 95 mm). PUI change was
symmetrical around central (z = 47.5 mm) position. For the sample size (300×300×60 mm3),
PUI change was not symmetric around the central position. After initial decrease of PUI when
moved from z = 0 to 17.5 mm, sample PUI continued to increase when it was moved towards
top electrode. Ideally, PUI change should be symmetrically distributed around the central
position, but simulated results showed that it was not true in case of large samples. The reason
could be attributed to the unequal sizes of top and bottom electrodes. The bottom (grounded)
electrode was the integral part of RF cavity with no open edges where as the top electrode had
open edges. Electric field distribution near the open edges of the top electrode must have
affected RF power uniformity of big sample sizes, when they were moved closer to the top
electrode. Based on the results, it could be concluded that RF power should be more uniform in
small samples if they are placed either in contact with top or bottom electrode but for middle
and large size samples, better RF power uniformity can be achieved in carefully selected
positions between the RF electrodes.

89
Table 1 compared the simulated PUIs of cuboid, ellipsoid and cylinder, placed at three
different vertical elevations. PUIs were lowest in ellipsoid, followed by the cylinder and
cuboid for all three positions. Ellipsoid placed in the center of RF electrodes had lowest PUI
among all selected positions.
3.5. Effect of DPs of sample and surrounding medium on sample PUI
Fig. 8 shows the effect of sample DPs on PUIs. Results indicate that smaller DPs
resulted in better RF power uniformities in samples. Dry products should provide better
uniform RF heating as they possess smaller DPs. It was also observed if loss factor was ≤ 1,
PUI continued to increase with the increase in dielectric constant. But for a loss factor >1, PUIs
first decreased and then increased with increase in dielectric constant. It was interesting to
notice that PUIs had their minimum values whenever dielectric constants were about the same
as loss factors, though this was more discernable for smaller DPs. Results in Fig. 9 show that
trends of PUI change were independent of sample sizes. PUI first decreased and then increased
between dielectric constant 6 and 14, showing its minimum at a dielectric constant value of 8
when the loss factor was 10. Fig. 10 shows the effect of surrounding material dielectric
constant on PUI. Sample DPs were set as (8- j *10), based on the previous simulations. PUI
first decreased and then increased with increase in surrounding material dielectric constant. PUI
was lowest when surrounding material dielectric constant was between 10 and 15. From the
results, it is clear that RF uniformity can be achieved when surrounding material dielectric
constant is in comparable range of sample DPs.
3.4. Effect of electrode gap on PUI

90
PUI of wheat flour decreased as electrode gap was reduced from 155 to 65 mm, as shown in
Fig. 11. As explained earlier, proportion of oblique electric field, which caused RF power non
uniformity decreased when electrode gap was reduced.
3.5. Effect of top electrode bending/configuration
Fig. 12A shows the effect of top electrode bending position on sample PUI. Results
demonstrated that top electrode bending position greatly affected sample PUI. When top
electrode was bent at 200 mm, PUI was lower compared to when it was bent at other five
positions. Similarly, Fig 12B showed the effect of top electrode bending angle on PUI of wheat
flour sample. Increase in bent angle, first decreased and then increased PUI. Sample PUI was
lowest at bent angle 20°. RF power density distribution in wheat flour in two different positions
and angles were shown in Fig 13. It was clear from the fig. 13 that top electrode configuration
affected the RF power uniformity in the sample as magnitudes of electric fields and their
distributions inside wheat flour sample changed with top electrode bending positions and
angles. Optimum RF power uniformity in a particular sample size could be achieved with a
particular top electrode bending position and angle.
Conclusions
Effects of various factors such as sample size, shape, its relative position between the
RF electrodes, top electrode configuration and DPs of sample and surrounding medium on the
RF heating of a low loss food material placed inside a 27.12 MHz RF system were studied
using a developed finite element computer model in FEMLAB 3.4. Simulated results showed
that RF heating uniformity could be improved using larger sample sizes placed in the air
between RF electrodes. Cubes and cylinders showed edge heating while ellipsoids showed
center heating. Simulated results also showed that smaller DPs provided better RF power

91
uniformities in the material. Top electrode bending (bent position and angle) affected RF
heating uniformity in the sample. The study helped understand the RF heating process,
influenced by various parameters. The developed model can further be used to optimize RF
heating process parameters in order to get uniform heating after they have been experimentally
validated.

92
Table 1
Simulated PUIs of wheat flour sample in three different shapes (a cuboid, an ellipsoid and a
cylinder), placed at three different vertical positions between RF electrodes with a fixed gap of
155 mm
Sample shape Relative position of sample Simulated PUI
Touching bottom electrode 0.23
A cuboid (150×150×60 mm3) In the center of RF electrodes 0.22
Touching top electrode 0.23
Touching bottom electrode 0.16
An ellipsoid (150×150×60 mm3) In the center of RF electrodes 0.06
Touching top electrode 0.16
Touching bottom electrode 0.22
A cylinder (150×60 mm3) In the center of RF electrodes 0.22
Touching top electrode 0.22

93
Fig. 1. Geometrical and boundary conditions of one quadrant of 12 kW, 27.12 MHz radio frequency (RF) system
(dimensions are in mm)
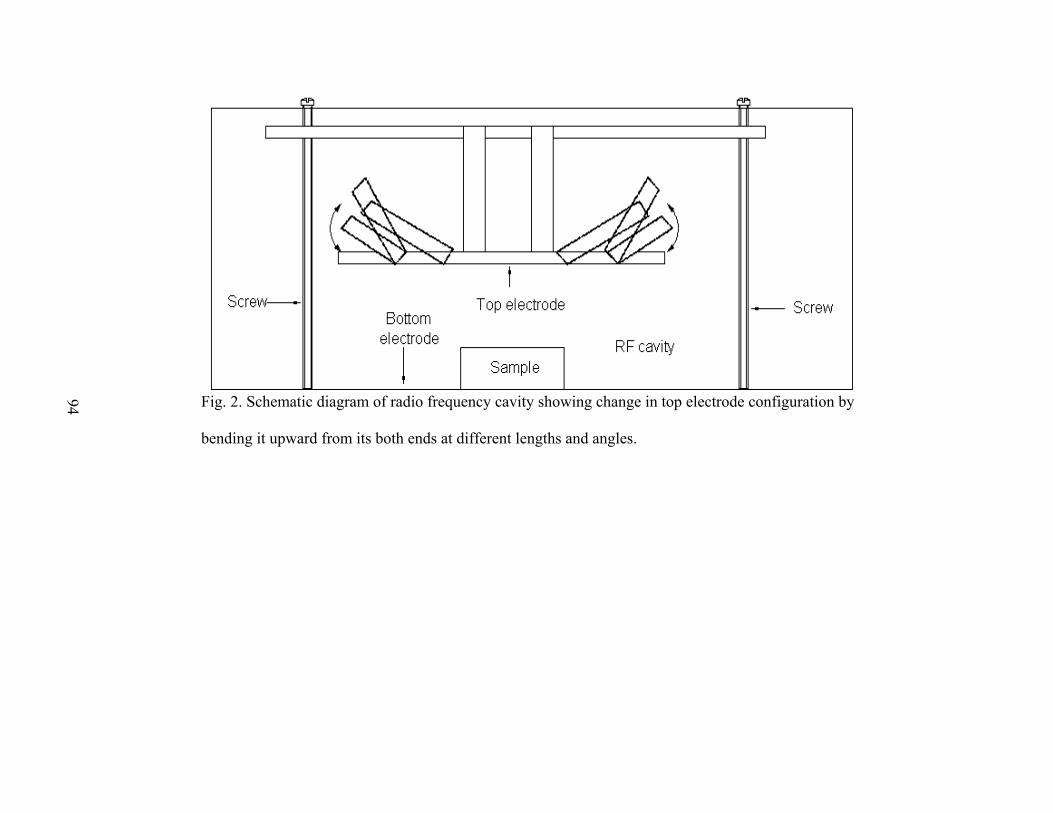
94
Fig. 2. Schematic diagram of radio frequency cavity showing change in top electrode configuration by
bending it upward from its both ends at different lengths and angles.
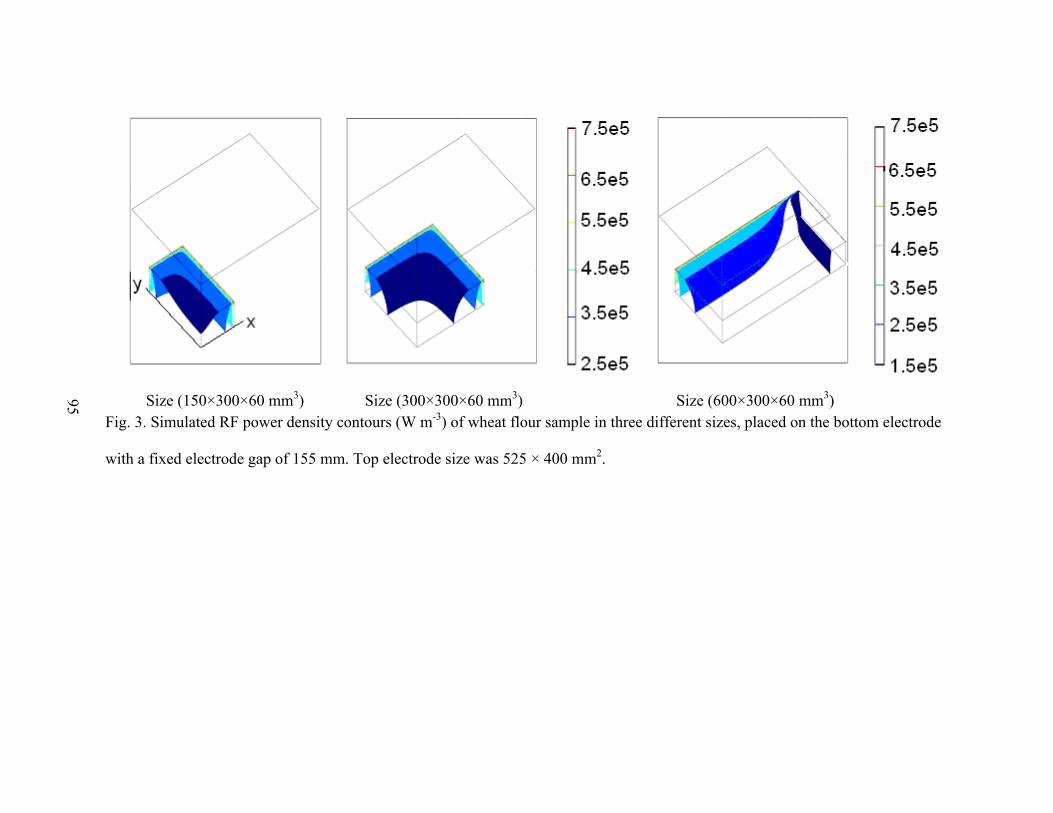
95
Size (150×300×60 mm3) Size (300×300×60 mm3) Size (600×300×60 mm3) Fig. 3. Simulated RF power density contours (W m-3) of wheat flour sample in three different sizes, placed on the bottom electrode
with a fixed electrode gap of 155 mm. Top electrode size was 525 × 400 mm2.
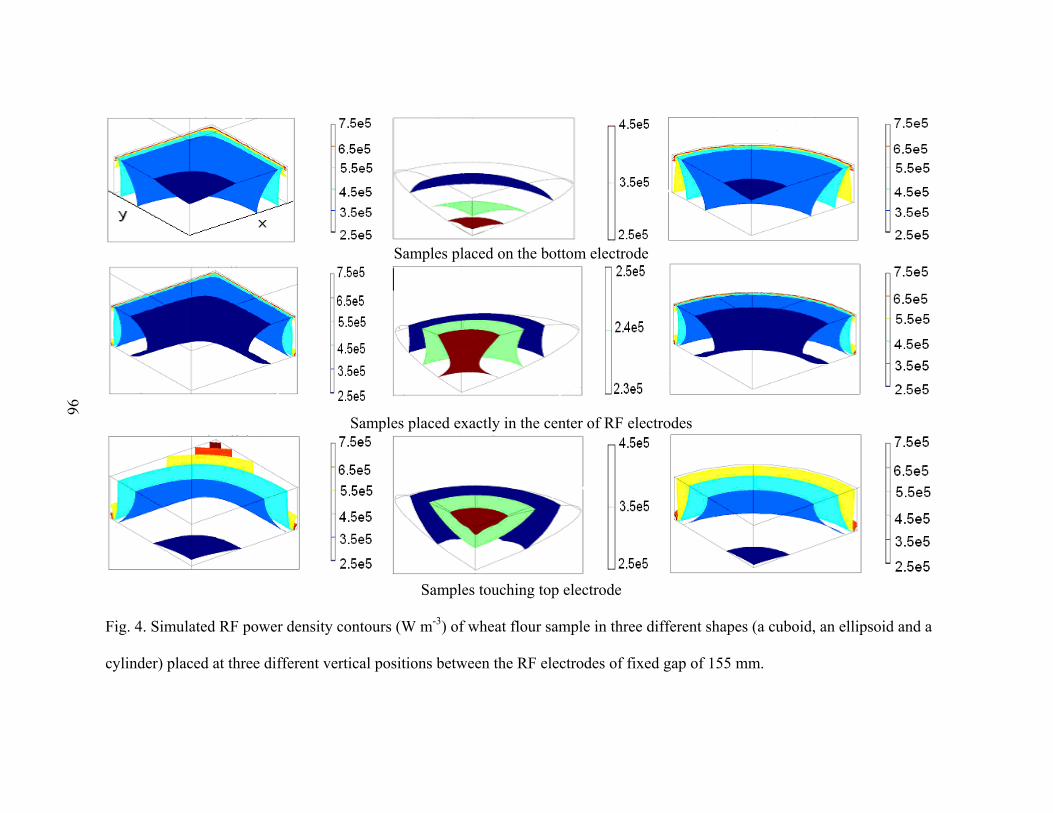
96
Samples placed on the bottom electrode
Samples placed exactly in the center of RF electrodes
Samples touching top electrode
Fig. 4. Simulated RF power density contours (W m-3) of wheat flour sample in three different shapes (a cuboid, an ellipsoid and a
cylinder) placed at three different vertical positions between the RF electrodes of fixed gap of 155 mm.

97
0.12
0.15
0.18
0.21
0.24
0 200 400 600Length of sample (mm)
PU
I
Width = 50 mmWidth = 100 mm Width = 150 mmWidth = 200 mmWidth = 250 mmWidth = 300 mm
Fig. 5. Simulated RF power uniformity indexes (PUIs) of cuboid shaped wheat flour mass with
varying sample lengths and widths. Cuboids were placed on the bottom electrode with top
electrode size (525 × 400 mm2) and a fixed electrode gap of 155 mm. Sample heights were set
as 60 mm.

98
0.15
0.18
0.21
0.24
0.27
0 20 40 60 80 100
Height of sample (mm)
PU
I
Fig. 6. Simulated RF power uniformity indexes (PUIs) of cuboid shaped wheat flour with
varying sample heights. Samples were kept on the bottom electrode with a fixed electrode gap
of 155 mm. Top electrode size was 525 × 400 mm2 and samples length and width both were set
as 150 mm.

99
Relative vertical position (z, mm) of sample0 19 38 57 76 95
PUI
0.15
0.20
0.25
50×50×60 mm3
150×150×60 mm3
300×300×60 mm3
Fig. 7. Simulated power uniformity indexes (PUIs) of cuboid shaped wheat flour in three
different sizes, kept at seven different vertical positions (along z axis) under the fixed electrode
gap of 155 mm. Coordinate system was shown in Fig.1.

100
Fig. 8. Simulated power uniformity indexes (PUIs) in cuboid shaped sample (150×150×60 mm3) with varying DPs. Samples were
placed on the bottom electrode with an electrode gap of 155 mm.

101
Fig. 9. Trends of simulated power uniformity indexes (PUIs) of samples with varying dielectric constants in five different sizes. Loss
factor value was fixed as 10.
A B C
D E

102
0.00
0.10
0.20
0.30
0.40
0.50
0 5 10 15 20 25 30
PU
I
Surrounding material dielectric constant
Fig. 10. Simulated power uniformity indexes (PUIs) in sample (150×150×60 mm3) in different
surrounding medium dielectric constant. Sample DPs was fixed as (8 10 * j− ) and it was kept
on the bottom electrode with an electrode gap of 155 mm.

103
0.00
0.05
0.10
0.15
0.20
0.25
60 80 100 120 140 160
Electrode gap (mm)
PU
I
Fig. 11. Simulated power uniformity indexes (PUIs) of cuboid shaped wheat flour
(150×150×60 mm3) with varying electrode gaps. Sample was kept on the bottom electrode with
an electrode gap of 155 mm.

104
(A) (B)
Fig. 12. Simulated power uniformity indexes (PUIs) in a cuboid shaped wheat flour (300 ×210 × 60 mm3) sample, placed on the
bottom electrode when top electrode (525×400 mm2) was bent (A) at six different positions (0, 100, 200, 300, 400 and 500 mm)
along the length of electrode, keeping bending angle fixed as 15° (B) at different angles (in degrees), keeping bending position
fixed as 200 mm.
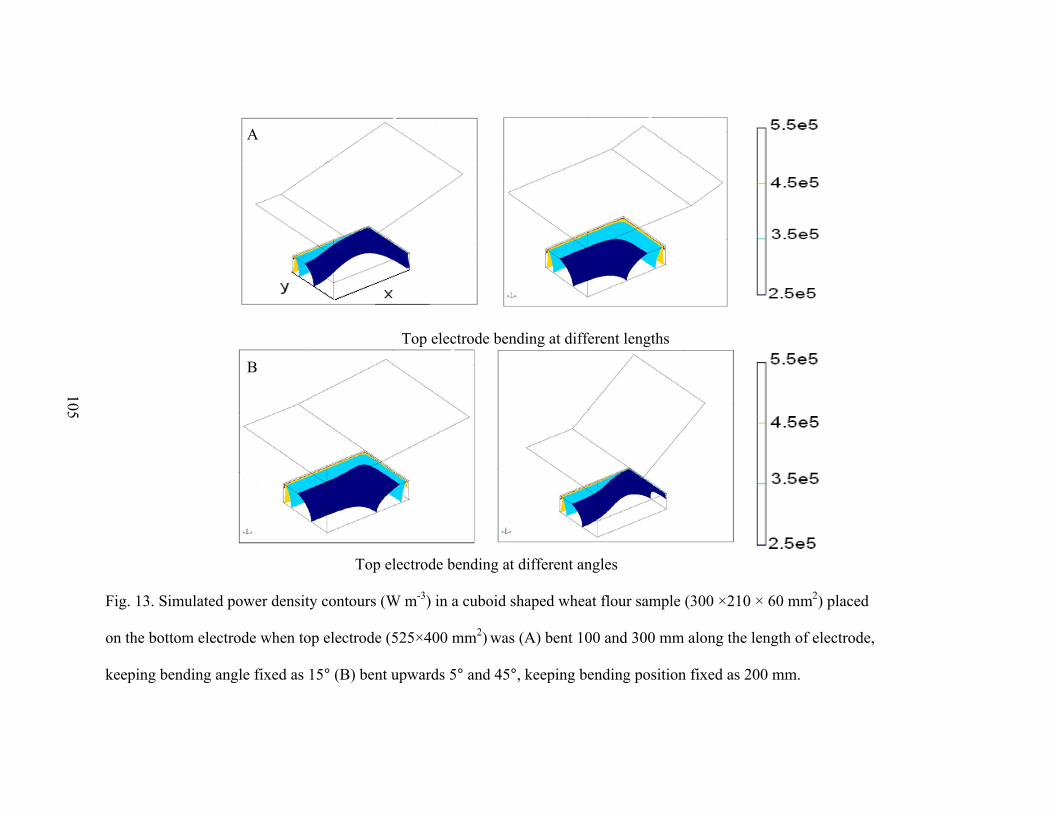
105
Top electrode bending at different lengths
Top electrode bending at different angles
Fig. 13. Simulated power density contours (W m-3) in a cuboid shaped wheat flour sample (300 ×210 × 60 mm2) placed
on the bottom electrode when top electrode (525×400 mm2) was (A) bent 100 and 300 mm along the length of electrode,
keeping bending angle fixed as 15° (B) bent upwards 5° and 45°, keeping bending position fixed as 200 mm.
A
B

106
References
Barber, H. (1983). Electroheat. 1st ed. London: Granada Publishing Limited.
Bengtsson, N.E., Green, W., & Valle, F.R.D. (1970). Radio frequency pasteurization of cured
hams. Journal of Food Science, 35(5), 682-687.
Birla, S.L., Wang, S., & Tang, J. (2008a). Computer simulation of radio frequency heating of
model fruit immersed in water. Journal of Food Engineering, 84(2), 270-280.
Birla, S.L., Wang, S., Tang, J., Fellman, J.K., Mattinson, D.S., & Lurie, S. (2005). Quality of
oranges as influenced by potential radio frequency heat treatments against
Mediterranean fruit flies. Postharvest Biology and Technology, 38(1), 66-79.
Birla, S.L., Wang, S., Tang, J., & Hallman, G. (2004). Improving heating uniformity of fresh
fruit in radio frequency treatments for pest control. Postharvest Biology and
Technology, 33(2), 205-217.
Birla, S.L., Wang, S., Tang, J., & Tiwari, G. (2008b). Characterization of radio frequency
heating of fresh fruits influenced by dielectric properties. Journal of Food Engineering,
89(4), 390-398.
Brunkhorst, C., Ciotti, D., Fredd, E., Wilson, J.R., Geveke, D.J., & Kozempel, M. (2000).
Development of process equipment to separate nonthermal and thermal effects of RF
energy on microorganisms. Journal of Microwave Power and Electromagnetic Energy,
35(1), 44-50.
Byrne, B., Lyng, J.G., Dunne, G., & Bolton, D.J. (2010). Radio frequency heating of
comminuted meats - considerations in relation to microbial challenge studies. Food
Control, 21(2), 125-131.

107
Chan, T. V. C. T., Tang, J., & Younce, F. (2004). 3-dimensional numerical modeling of an
industrial radio frequency heating system using finite elements. Journal of Microwave
Power and Electromagnetic Energy, 39(2), 87-105.
Houben, J., Schoenmakers, L., Vanputten, E., Vanroon, P., & Krol, B. (1991). Radiofrequency
Pasteurization of Sausage Emulsions as a Continuous Process. Journal of Microwave
Power and Electromagnetic Energy, 26(4), 202-205.
Lagunas-Solar, M.C., Pan, Z., Zeng, N.X., Truong, T.D., Khir, R., & Amaratunga, K.S.P.
(2007). Application of radio frequency power for non-chemical disinfestation of rough
rice with full retention of quality attributes. Applied Engineering in Agriculture, 23(5),
647-654.
Lagunas-Solar, M.C., Zeng, N.X., Essert, T.K., Truong, T.D., Pina, C., Cullor, J.S., Smith,
W.L., & Larrain, R. (2005). Disinfection of fishmeal with radiofrequency heating for
improved quality and energy efficiency. Journal of the Science of Food and
Agriculture, 85(13), 2273-2280.
Luechapattanaporn, K., Wang, Y.F., Wang, J., Tang, J.M., Hallberg, L.M., & Dunne, C.P.
(2005). Sterilization of scrambled eggs in military polymeric trays by radio frequency
energy. Journal of Food Science, 70(4), E288-E294.
Marra, F., Lyng, J., Romano, V., & McKenna, B. (2007). Radio-frequency heating of foodstuff:
solution and validation of a mathematical model. Journal of Food Engineering, 79(3),
998-1006.
Neophytou, R.I., & Metaxas, A.C. (1998). Combined 3D FE and circuit modeling of radio
frequency heating systems. Journal of Microwave Power and Electromagnetic Energy,
33(4), 243-262.

108
Petrescu, C., & Ferariu, L. (2008). Modeling of dielectric heating in radio-frequency applicator
optimized for uniform temperature by means of genetic algorithms. World Academy of
Scienece, Engineering and Technology, 47, 129-134.
Rayner, M. (2007). Multi Physics modeling of radio frequency cooking. Excerpt from the
proceedings of the COMSOL users conference, Grenoble France.
Romano, V., & Marra, F. (2008). A numerical analysis of radio frequency heating of regular
shaped foodstuff. Journal of Food Engineering, 84(3), 449-457.
Tiwari, G., Wang, S., Birla, S.L., & Tang, J. (2008). Effect of water-assisted radio frequency
heat treatment on the quality of 'Fuyu' persimmons. Biosystems Engineering, 100(2),
227-234.
Tiwari, G., Wang, S., Tang, J., & Birla, S.L. (2010). Computer simulation of radio frequency
heating of dry food materials, Part I: model development and validation. Journal of
Food Engineering Submitted for publication.
Wang, J., Olsen, R.G., Tang, J., & Tang, Z. (2008a). Influence of mashed potato dielectric
properties and circulating water electric conductivity on radio frequency heating at 27
MHz. Journal of Microwave Power and Electromagnetic Energy, 42(2), 31-46.
Wang, S., Birla, S.L., Tang, J., & Hansen, J.D. (2006). Postharvest treatment to control codling
moth in fresh apples using water assisted radio frequency heating. Postharvest Biology
and Technology, 40(1), 89-96.
Wang, S., Ikediala, J.N., Tang, J., Hansen, J.D., Mitcham, E., Mao, R., & Swanson, B. (2001).
Radio frequency treatments to control codling moth in in-shell walnuts. Postharvest
Biology and Technology, 22(1), 29-38.

109
Wang, S., Tang, J., Cavalieri, R.P., & Davies, D.C. (2003). Differential heating of insects in
dried nuts and fruits associated with radio frequency and microwave treatments.
Transactions of the ASAE, 46(4), 1175-1182.
Wang, S., Tang, J., Johnson, J.A., Mitcham, E., Hansen, J.D., Cavalieri, R.P., Bower, J., &
Biasi, B. (2002). Process protocols based on radio frequency energy to control field and
storage pests in in-shell walnuts. Postharvest Biology and Technology, 26(3), 265-273.
Wang, S., Tiwari, G., Jiao, S., Johnson, J.A., & Tang, J. (2010). Developing postharvest
disinfestation treatments for legumes using radio frequency energy. Biosystems
Engineering, 105(3), 341-349.
Wang, S., Yue, J., Chen, B., & Tang, J. (2008b). Treatment design of radio frequency heating
based on insect control and product quality. Postharvest Biology and Technology, 49(3),
417-423.
Wang, S., Yue, J., Tang, J., & Chen, B. (2005). Mathematical modelling of heating uniformity
for in-shell walnuts subjected to radio frequency treatments with intermittent stirrings.
Postharvest Biology and Technology, 35(1), 97-107.
Yang, J., Zhao, Y., & Wells, J. H. (2003). Computer simulation of capacitive radio frequency
(RF) dielectric heating on vegetable sprout seeds. Journal of Food Process
Engineering, 26(3), 239-263.

110
CONCLUSIONS AND RECOMMENDATIONS
This research was an effort to understand the behavior of radio frequency (RF) heating,
especially in dry agricultural commodities using computer simulation. Also, this research
evaluated the potential of water assisted RF heating in a Fuyu’ persimmon as an alternative
quarantine treatment method. Major results along with recommendations are summarized for
future studies:
1 Simulated and experimented results showed that RF treated wheat flour had higher
temperature values at the corners and lower sections of the sample.
2. Simulation results confirmed that non uniform distribution of RF power density caused
temperature non uniformity in the sample.
3. Sensitivity analysis of the simulated results showed that temperature uniformity in RF
treated wheat flour sample was most sensitive to the top electrode voltage among other
parameters such as sample DPs, thermal conductivity of wheat flour and heat transfer
coefficient air. Thermal conductivity of wheat flour and heat transfer coefficient of air
had negligible effect on the temperature uniformity of the sample.
4. Simulated results showed that RF heating uniformity could be improved using larger
sample sizes placed in the air between RF electrodes.
5. Cubes and cylinders showed edge heating while ellipsoids showed center heating.
6. Smaller DPs provided better RF power uniformities in food materials.
7. Simulated results also showed that top electrode bending (bent position and angle)
affected RF heating uniformity in the sample. Optimum RF power uniformity in a
particular sample size could be achieved with a particular top electrode bending position
and angle.

111
8. The developed model can further be used to optimize RF heating process parameters in
order to get uniform heating.
The following areas need further research to address the issues related to non-uniform RF
heating
1 The developed RF model used the assumption that RF waves inside the RF applicator
behaved like a quasi-static electric field because of its longer wave length compared to
RF applicator size. Very few studies have been performed considering wave nature of
RF waves. A comparative study between quasi-static and wave approaches should be
very useful to help understand the mechanism of RF heating in different food materials.
2. The developed computer model predicted that sample size, shape, its vertical position
between the RF electrodes and top electrode configuration affected RF heating.
Experimental validation for these findings is recommended.
3. In the past, some experimental studies showed that mixing or moving the food samples
between the RF electrodes could improve the temperature uniformity in the treated
sample. These findings should be theoretically validated by computer simulation.