thermophysics of alkali and related azides ii. heat
TRANSCRIPT

A-046 J. Chem. Thermodynamics 1978, 10, 1181-1200
Thermophysics of alkali and related azides II. Heat capacities of potassium, rubidium, cesium, and thallium azides from 5 to 350 K e,b
ROBERT W. CARLING cud and EDGAR F. WESTRUM, JR.”
Department of Chemistry, University of Michigan, Ann Arbor, Michigan 48109, U.S.A.
(Received 26 July I977; in revised form 7 April 1978)
The heat capacities of potassium, rubidium, &urn, and thallium azides were determined from 5 to 350 K by adiabatic calorimetry. Although the alkali-metal azides studied in this work exhibited no thermal anomalies over the temperature range studied, thaIlium azide has a bifurcated anomaly with two maxima at (233.0*0.1) K and (242.0410.02) K. The associated excess entropy was 0.90 calth K-l mol-I. The thermal properties of the azides and the corresponding structurally similar hydrogen difluorides are nearly identical. Both have linear symmetrical anions. However, thallium azide shows a solid-solid phase transition not exhibited by thallium hydrogen difluoride. At 298.15 K the values of C& S”, and -{G”(T)-HN”(0)}/T, respectively, are 18.38, 24.86, and 12.676 calth K-l mol-r for potassium azide; 19.09,28.78, and 15.58 calth K-l mol-1 for rubidium azide; 19.89, 32.11, and 18.17 calth K-l mol-’ for cesium azide; and 19.26, 32.09, and 18.69 calth K-l mol-’ for thallium azide. Heat capacities at constant volume for KNB were deduced from infrared and Raman data.
1. Introduction
An interesting precedent to the study (I) of alkali-metal and thallium azides is the long- standing interest in this laboratory in the orientational disorder of hydrogen difluoride anion, HF, in crystals. ~1~) The isostructural compounds with linear anions - KN,, RbN,, CsN,, and TlN,-crystallize in distorted CsCI-like structures as do the corresponding hydrogen difluorides. The distortion can be visualized by substituting an azide ion for a chloride ion in CsCl thereby expanding the structure in directions normal to the c-axis. Thus, a tetragonal unit cell is formed with space group, 14/ mcm-D:i.(4’
At elevated temperatures, the tetragonal structure of the alkali-metal azides studied in this research can be expected to transform to a cubic CsCl-like structure due to
n For Part I see reference I. * This work has been supported in part by the Chemical Thermodynamics Program, Chemistry
Division, National Science Foundation under Contract Nos. GP-42525X and CHE-77-10049. ’ Based in part upon a dissertation submitted to the Horace H. Rackham School of Graduate
Studies at the University of Michigan in partial fulfillment of the requirements for the Ph.D. degree by R.W.C.
’ Present address: Sandia Laboratories, Division 8313, Livermore, CA 94550, U.S.A. (’ To whom correspondence concerning this paper should be directed.
0021-9614/78/121181+20 $01.00/O 0 1978 Academic Press Inc. (London) Ltd.
1182 R. W. CARLING AND E. F. WBTRUM, JR.
thermal disorder of the azide ions. Evidence of cubic high-temperature phases of CsN, and RbN, occurring at 424 and 588 K, respectively, has been noted.c5) The transition temperature increases with decreasing cation radius and hence the corres- ponding transition for KN, would be expected to occur at approximately 748 K, well above the melting temperature of KN3. The high-temperature behavior of the alkali- metal azides is supported by the fact that similar behavior is found in the corres- ponding alkali-metal hydrogen difluorides. (W The highly ionic azides are relatively stable but do decompose, albeit not violently, at their melting temperatures. As the bonding becomes more covalent the azides become highly explosive and can be detonated by heat, light, shock, and radiation.“)
Pistorius”’ recently suggested-on the basis of extrapolations of r(p) equilibrium lines assuming negligible curvature-that RbN, and CsN, at low pressure transform to low-temperature phases near 73 and 143 K, respectively. This would be in contrast to the behavior of the corresponding alkali-metal hydrogen difluorides.“)
TIN, is known to transform-analogously to RbN, and CsN,-to a high-tempera- ture cubic modification. Kezer and Rosenwasser (lo) studied this transformation by d.t.a. and reported a transition temperature of 564 K. The reports of low-temperature transitions in TIN, are numerous. (4,s9 11-14) The lowest-temperature phase of TIN, is reported to be orthorhombic;(“) a corresponding phase is not found in T1HF,.‘9’
Low-temperature adiabatic calorimetry permitted determination of the heat capacities of these azides, the energetics of the transition in TIN,, and also whether RbN, and CsN, undergo the low-temperature phase changes predicted by Pistorius.@)
2. Experimental SAMPLE PREPARATION AND CHARACTERIZATION
KN,, RbN3, and CsN,. The preparation of each of these azides closely resembles the preparation of the same substances by Suhrmann and Clusius.(‘5’ Optical-grade potassium, rubidium, and cesium carbonates were purchased from Electronic Space Products, Inc., Los Angeles, CA. In a Teflon receiving beaker, 50 g of the desired alkali metal carbonate were dissolved in about 300 cm3 of water. Excess NaN,, in the form of an aqueous slush, was put in a round-bottom flask to which a spray trap and condenser were fused. The flask was gently warmed to insure complete dissolution of the NaN,. To the solution, dilute sulfuric acid (about 12 per cent by mass) was added dropwise from a separatory funnel. The hydrogen azide thus formed distilled into the Teflon receiving beaker, liberated COZ, and formed the desired alkali-metal azide. The distillation process was continued about 2 h to ensure complete removal of carbon dioxide from the carbonate solution. This procedure was repeated until an adequate amount of each azide was prepared.
Recrystallization of each azide from an aqueous solution was achieved by dissolving the respective azide in water, filtering the solution to remove any insoluble impurities, and then gently heating it until incipient precipitation occurred. After cooling the solution to 300 K, we added a two-fold excess of pure ethanol to enhance precipitation. The precipitated azide was filtered, washed with ethanol, and dried for several hours at 380 K. Each azide was recrystallized three times. RbN3 was heated only in the

LOW-TEMPERATURE HEAT CAPACITY OF KNs, RbNa, CsN,, AND TIN3 1183
drying oven and was later found to contain trapped solvent. Further details of this determination are postponed until after the presentation of calorimetric results. However, after 2 h in the drying oven, CsN, and KNJ were crushed to uniform size in an agate mortar and placed in a vacuum desiccator over P,Os. The dessicator was evacuated for about 4 h through a liquid-nitrogen trap. The samples of CsN, and KN, were then removed from the desiccator, placed back in the drying oven for about 4 h, and subsequently stored in a desiccator over P,O,.
X-ray diffraction analyses of KN,, RbN,, and CsN, yielded lattice parameters which agree well with those of previous investigations. A comparison of the lattice parameters of these and other azides have been reported previously(‘@ and is available in a supplementary document.(“)
The azide content of RbN, was measured by hydrogen-ion titration after oxidation of the azide ion by nitrite. (ls) Although a reasonably good result was obtained by this method (mass per cent azide indicated 39.90+0.05; theoretical: 39.96), this method was abandoned and a more straightforward analysis was undertaken for the azide content of potassium and cesium azides. The azide content was determined gravi- metrically by weighing silver azide. Samples of each azide were placed in a beaker and dissolved in 75 cm3 of 8 per cent by mass potassium nitrate solution. Silver nitrate (0.35 mol dm-j) was added dropwise to each sample until complete precipitation occurred; the beakers were then stored overnight in the dark. Subsequently the precipitates were filtered in subdued light, rinsed with water, and dried to constant mass in the oven at 380 K. The elemental analysis indicated (51.82kO.02) mass per cent N3 for KN, and (24.03 f 0.02) mass per cent N, for CsN, (theoreticd : 5 1.80 and 24.02, respectively).
TIN,. High-purity thallium was purchased in the form of rods from American Smelting and Refining Company, Central Research Laboratories, South Plainfield, New Jersey. To prepare thallium turnings, the 6 mm diameter rods were first rinsed in concentrated nitric acid to remove any oxide layer present. The turnings generated by “sharpening the rods” in a pencil sharpener were collected in a shallow Teflon dish containing pure ethanol. The turnings were transferred to a Teflon thimble in a Soxhlet apparatus, where they were held in refluxing ethanol for several hours until most of the thallium had reacted. To the ethanol solution a volume of water equal to that of the ethanol was added. The yellow thallium hydroxide precipitate that formed upon addition of the water was filtered and dissolved in warm water. Carbon dioxide, purchased from Matheson and labelled “bone dry”, was then bubbled into the thallium hydroxide solution whereupon a white flocculent Tl,CO, precipitate formed. This precipitate was filtered, washed with cold water, and then dried at 380 K for several hours.
Before precipitation of TIN,, both Tl,C03 and NaN, were recrystallized from water. Each solid was dissolved in water and the two solutions were combined whereupon a yellow precipitate of thallium azide immediately formed. The precipitate was filtered, washed with distilled water and pure ethanol, and then dried at 380 K.
The TIN, thus prepared was to be recrystallized from water (in which it is not very soluble)” 9, so solvent was continually added while heating until total dissolution occurred. The solution was then filtered while still hot to remove insoluble impurities

1184 R. W. CARLING AND E. F. WESTRUM, JR.
and allowed to cool slowly to 300 K while long acicular yellow crystals formed. These crystals were filtered, washed with pure ethanol and then dried for 6 h at 380 K. The recrystallization process was repeated three times and the product stored in a desic- cator over CaSO,.
X-ray diffraction analysis of TIN, yielded lattice parameters which are in excellent accord with those of other investigators. (16, 17) The thallium content was determined by a volumetric titration with standard potassium iodate solution as the titrant.“” The azide solution required gentle warming completely to dissolve the TIN, before analysis. Elemental analysis indicated (82.9210.02) mass per cent Tl (theoretical: 82.94). Further analyses of the sample were performed after the heat-capacity deter- minations were completed and wrll be discussed later.
Loading details. Heat-capacity measurements for all four samples were made in the Mark II adiabatic cryostat. (l,‘l) Loading information for these samples is given in table 1.
TABLE 1. Calorimeter loading information
Compound Calorimeter V
no. cm3 M” __-
g mol-1 111 AHe) P lJ s kPa gem-”
KN3 w-52 59.11 81.118 50.2650 6.6 2.032 RbN3 W-28 92.31 127.487 84.8699 c 5.7 2.825 CsN3 w-52 59.11 174.922 46.1975 7.6 3.384 TIN, w-52 59.11 246.3901 89.3849 = 6.5 5.769
a Based on 1968 IUPAC scale of atomic weights. * Crystallographic density from lattice parameters of this research, four molecules per unit cell. E Mass corrected for traces of water present.
3. Results
HEAT CAPACITY VALUES FOR KN,, RbNs, AND CsNs
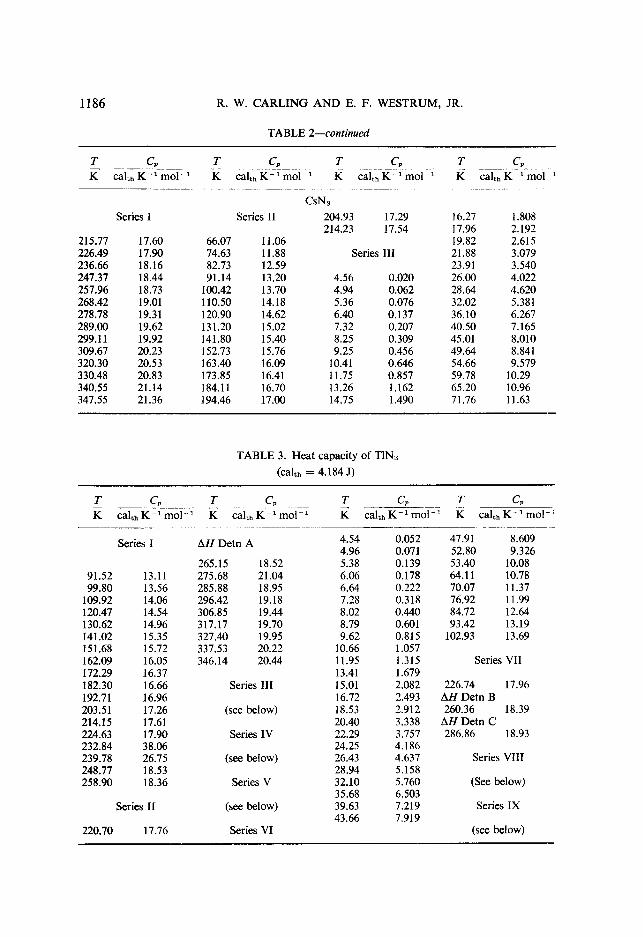
Heat capacities in chronological sequence at the mean temperatures of determination are presented in tables 2 and 3. Approximate temperature increments can usually be inferred from adjacent mean temperatures. These results have been adjusted for curvature and are considered to have a probable error of about 5 per cent at 5 K, decreasing to 1 per cent at 10 K, and to less than 0.1 per cent above 20 K. The values are based upon IPTSA8. Results from several series of determinations taken to ascer- tain the enthalpy increment through the bifurcated anomaly in TIN, have been summarized in table 4.
Molar heat-capacity curves for KN,, RbN,, and CsN, are displayed in figure 1. No thermal anomalies due to structural changes in these compounds were observed; however, the heat capacity of RbN, revealed a small bump located at (257.310.8) K which was believed to result from the fusion of water trapped in the sample. To test this interpretation, the freezing temperature of a saturated RbN, aqueous solution was determined with a Hewlett-Packard quartz thermometer as 257.5 K and supports the interpretation of the anomaly as due to residual water trapped in the RbN,

LOW-TEMPERATURE HEAT CAPACITY OF KNu, RbN3, CsN,, AND TIN3 1185
TABLE 2. Heat capacities of KN,, RbNo, and CsN, (calth == 4.184 J)
T _ .-G. T c, T CP T CP K calth K 1 moi- 1 K calth K-l mole1 K calth K-l mol L k calth K-l mol i
Series I
209.54 16.16 215.15 16.34 223.78 16.56 233.99 16.83 244.27 17.08 254.43 17.34 264.66 17.59 275.45 17.84 286.31 18.10 296.79 18.34 307.45 18.57 318.30 18.81 329.04 19.04 339.68 19.26
Series 1
149.25 15.13 151.62 15.23 157.68 15.45 166.99 15.75 176.96 16.05 187.02 16.34 196.92 16.60 206.88 16.87 216.91 17.14 226.81 17.39 236.78 17.65 246.82 17.92 256.72 266.60 18.44 277.09 18.67 287.47 18.92 297.75 L9.18 308.25 19.42 318.98 19.67 329.60 19.90 340.14 20.14 346.18 20.22
Series 11
51.78 7.794
KN, 19.43 Series I11
96.01 103.34 112.49 121.94 131.74 141.94 152.25 162.66 173.04 183.20 193.42 203.69 213.79
56.54 63.72 71.17 77.96 84.28 91.21 98.77
107.01 115.94
Series II 5.64 7.07
11.26 8.28 11.80 9.38 12.39 10.34 12.93 II.39 13.44 12.62 13.90 12.52 14.31 13.96 14.71 15.29 15.09 16.73 IS.40 18.35 15.69 20.06 16.00 21.90 16.29
RbN, 8.558 7.44 9.599 8.14
10.48 8.92 11.19 9.72 11.80 10.56 12.34 11.48 12.82 12.98 13.30 13.96 13.76 14.95
16.17 Series III
103.92 13.12 113.12 13.63 121.95 14.06 131.35 14.47 141.32 14.87 151.03 15.22 160.52 15.53
Series IV
4.18 0.000 4.74 0.020 5.27 5.76 6.26 6.80
0.020 0.028 0.037 0.047
17.59 19.14 20.93 23.05 25.62 28.52 31.64 35.12 38.74 44.07 48.30 53.17 58.82
0.014 0.023 0.036 0.053 0.074 0.089 0.120 0.119 0.173 0.238 0.317 0.434 0.583 0.768
0.072 0.086 0.123 0.171 0.234 0.270 0.424 0.545 0.678 0.840 1.061 1.318 1.644 2.043 2.566 3.165 3.831 4.584 5.337 6.399 7.219 8.025 8.900
Series V
242.81 17.82 252.44 18.46
23.99 I.012 26.31 1.329 28.73 1.688 31.44 2.137 34.76 2.727 38.69 3.456 43.12 4.281 48.08 5.194 53.44 6.140 58.85 7.025 64.69 7.914 70.70 8.707 76.23 9.373 x1.99 IO.02 89.1 I IO.72 97.59 11.39
261.90 18.90
Series VI
242.74 17.78 AH Detn. 280.69 18.85
Series VII
243.18 17.78 AH Detn. 268.04 18.44
Series VII I
242.84 17.77 247.56 17.94 251.31 18.16 253.64 18.29 255.50 18.46 257.28 20.08 259.03 19.29 260.84 18.66 262.69 18.46 265.00 18.39 268.69 18.49
1186 R. W. CARLING AND E. F. WESTRUM, JR.
TABLE 2-continued
T G T G T G T G < &, K-’ mol-1 z calth K - 1 rnofq ic cal,,K-lmol-l I? calth K-l mol-1
Series I
215.77 17.60 66.07 11.06 226.49 17.90 74.63 11.88 236.66 18.16 82.73 12.59 247.37 18.44 91.14 13.20 257.96 18.73 100.42 13.70 268.42 19.01 110.50 14.18 278.78 19.31 120.90 14.62 289.00 19.62 131.20 15.02 299.11 19.92 141.80 15.40 309.67 20.23 152.13 15.76 320.30 20.53 163.40 16.09 330.48 20.83 173.85 16.41 340.55 21.14 184.11 16.70 347.55 21.36 194.46 17.00
Series II
CsN, 204.93 17.29 214.23 17.54
Series III
4.56 0.020 4.94 0.062 5.36 0.076 6.40 0.137 7.32 0.207 8.25 0.309 9.25 0.456
10.41 0.646 11.75 0.857 13.26 1.162 14.75 1.490
16.27 1.808 17.96 2.192 19.82 2.615 21.88 3.079 23.91 3.540 26.00 4.022 28.64 4.620 32.02 5.381 36.10 6.267 40.50 7.165 45.01 8.010 49.64 8.841 54.66 9.519 59.78 10.29 65.20 10.96 71.76 11.63
TABLE 3. Heat capacity of TIN,
(calt,, = 4.184 J)
T G T CP E ca& K-l mol-1 E calth K-l mol-’
__-
Series I AH Detn A
265.15 18.52 91.52 13.11 275.68 21.04 99.80 13.56 285.88 18.95
109.92 14.06 296.42 19.18 120.47 14.54 306.85 19.44 130.62 14.96 317.17 19.70 141.02 15.35 327.40 19.95 151.68 15.72 337.53 20.22 162.09 16.05 346.14 20.44 172.29 16.37 182.30 16.66 Series III 192.71 16.96 203.51 17.26 (see below) 214.15 17.61 224.63 17.90 Series IV 232.84 38.06 239.78 26.75 (see below) 248.77 18.53 258.90 18.36 Series V
Series 11 (see below)
220.70 17.76 Series VI
T G T G e calth K-’ mol-’ E calth K-l mol-ml
4.54 0.052 4.96 0.071 5.38 0.139 6.06 0.178 6.64 0.222 7.28 0.318 8.02 0.440 8.79 0.601 9.62 0.815
10.66 1.057 11.95 1.315 13.41 1.679 15.01 2.082 16.72 2.493 18.53 2.912 20.40 3.338 22.29 3.757 24.25 4.186 26.43 4.637 28.94 5.158 32.10 5.760 35.68 6.503 39.63 7.219 43.66 7.919
47.91 8.609 52.80 9.326 53.40 10.08 64.11 10.78 70.07 11.37 76.92 11.99 84.72 12.64 93.42 13.19
102.93 13.69
Series VII
226.74 17.96 AH Detn B 260.36 18.39
AH Detn C 286.86 18.93
Series VIII
(See below)
Series IX
(see below)

LOW-TEMPERATURE HEAT CAPACITY OF KN3, RbNa, CsNa, AND TN 1187
TABLE 3--continued
228.17 4.20 18.10 18.04 231.90 2.06 28.66 18.57 233.24 0.70 104.3 100.6 234.34 1.54 41.81 41.81 236.18 2.17 26.68 26.57 238.43 2.38 23.39 23.33 240.74 2.26 25.20 24.53 242.83 1.94 31.00 30.75 245.16 2.77 18.58 18.68
274.37 0.91 19.00 18.85 275.27 0.92 18.91 18.78 276.84 2.28 18.69 18.76
227.62 4.71
AH Detn E AH Detn F 270.30 1.98 271.72 0.90
247.94 2.19 18.37 IS.37 272.48 0.67 '51.42 4.19 18.30 18.30 273.16 0.76
Series IV
228.22 3.55 230.25 0.52 230.77 0.52 231.28 0.52 231.80 0.52 232.31 0.51 232.73 0.34 233.00 0.30 233.27 0.35 233.66 0.50 234.22 0.68 234.96 0.86 235.86 0.98 236.87 1.06 237.93 1.10 239.03 1.12 240.13 1.10 241.19 1.04 241.97 0.53 242.48 0.50 243.00 0.56 243.94 1.32 245.27 1.35
AH Detn D 273.48 0.90
18.03 18.03 18.12 18.12 18.22 18.20 18.25 18.34 18.52 18.52 18.82 18.86 33.09 19.71 123.2 123.2 95.66 95.46 64.63 64.63 44.52 43.90 33.28 33.28 27.67 27.67 24.94 24.94 23.60 23.60 23.20 23.20 23.62 23.62 25.59 25.59 59.98 72.00 24.00 24.00 20.35 20.35 19.17 19.17 18.66 18.66
274.01 0.97 275.52 2.10 277.62 2.12
240.45 2.03 241.61 0.31 241.83 0.13 241.94 0.09 242.00 0.04 242.04 0.03 242.08 0.07 271.33 1.82 272.29 0.18 272.41 0.09 272.49 0.08 272.56 0.08 272.62 0.07 272.71 0.13
19.42 19.39
231.50 2.63 19.44 18.40 232.84 0.10 25.61 25.61 232.90 0.09 30.40 30.40 232.94 0.08 35.44 35.44 232.98 0.07 38.42 45.00
Series III
Series V
18.02 18.02
19.28 21.17
19.28 21.10
32.27 26.90 27.35 20.06 19.00 18.94 19.06 18.77 18.73 18.73
Series VIII
24.17 23.96 27.20 27.20 35.28 35.28 55.34 55.34
118.6 118.6 164.1 164.1
76.53 76.53 20.39 20.29 24.58 24.26 26.11 26.11 26.95 27.78 29.90 29.90 32.13 32.13 36.96 36.96
Series IX
a The symbol <C,) represents mean values of the heat capacity as calculated directly from finite AH/AT without curvature correction.
* The symbol C, in columns adjacent to <C, > represents the value of the heat capacity read from the smoothed curve at temperature T. Elsewhere in the table it represents C, analytically corrected for curvature.

1188 R. W. CARLING AND E. F. WESTRUM, JR.
TABLE 4. Enthalpy determinations for overlapping anomalies in TIN3 (Cal,, = 4.184 J)
T1 7-2 H”O-Z)--HV-I) H”(261 K)--H”(220 K) _~- Designation K i-L
~. __--. ~_~ calth mol - 1 calth mol-l
A (Series II) 225.91 259.52 804.93 937.63 B (Series V) 229.97 253.80 627.90 938.30 E (Series VII) 229. I I 255.54 615.64 938.22
Mean : 938.0-+0.5 Lattice: 742.,&2
Excess : 195.,&2 -
0 0 10 20 30
T/K
FIGURE 1. Experimental heat capacities: G, KN3; A, RbN3; 0, CsN,.
sample. From the excess enthalpy in the region of this small bump divided by the enthalpy of fusion of water,(“) a value 0.07 mass per cent of H,O was computed.
HEAT CAPACITY VALUES FOR TIN3
The molar heat capacity of TIN, displayed in figures 2 and 3 revealed a bifurcated anomaly with the two maxima cccurring at (233.0&0.1) and (242.04f0.02) K. In addition, a small bump at 272.7 K was thought to be due to the fusion of water in the sample. Iqbal and Malhotra(“’ noted a transition in the Raman spectra occurring on

LOW-TEMPERATURE HEAT CAPACITY OF KN,, RbN3, CsN,. AND TIN:3 I189
160 -
T/K
FIGURE 2. Experimental heat capacities: --, TIN,: - - -, TIHF,.
LA) 240 260
T/K
SCALE CHAhGE
FIGURE 3. Experimental heat capacity of TINa in the region of the the two transitions and the thermal anomaly attributed to the presence of water. 0, experimental values; -, smoothed curve kompare text).

1190 R. W. CARLING AND E. F. WESTRUM, JR.
warming to 278 K. On cooling the sample two of the spectral bands split into four bands at 269 K and persisted as low as 95 K. Iqbal now considers that his previous interpretation of a phase change at 278 K is incorrect,(23) and that his spectral result was due to sluggishness of the first-order transition near 240 K when the crystal was warmed slowly. Several analytical tests were performed to ascertain the presence or absence of water in the sample. An infrared spectrum was taken on a Nujol mull, but nothing found could be attributed to water. The freezing temperature of a saturated aqueous TIN, solution was determined with a Hewlett-Packard quartz thermometer as only -0.03 K, more than 0.4 K above the observed anomaly. Although the in- frared spectrum taken on the calorimetric sample of TINJ showed no evidence of water in the sample, the concentration of water may have been below detection limits. Recent neutron-diffraction experiments down to about 250 K show no evidence of a transition near 270 K.(4) The excess enthalpy (about 17.8 cal,, mol-‘) in the region of this anomaly is, therefore, attributed to water, the mass fraction of which is esti- mated to be 0.001 based on the enthalpy of fusion of water.(22)
IMPURITY ADJUSTMENT
Adjustments for the small amount of water in the samples of RbN3 and TIN, were made on the experimental heat capacity by the use of the heat capacity of pure water determined by Giauque and Stout. (24) These corrections have been made on all RbN, and TIN, values in tables 5 and 6, with the exception of the results taken in the vicinity of the fusion maxima.
TABLE 5. Thermophysical properties of KN3, RbN3, snd CsNa (calth = 4.184 J)
T G S"(T)--s"(O) H"(T)--H"(O) -{G"(T)--H"(O)]/T K c& K-l mol-’ calth K-l molki calth mol - 1 calth K-l mol-l
5 10 15 20 25 30 35 40 4.5 50 60 70 80 90
100 110 120 130 140 150 160 170
0.008 0.060 0.220 0.576 1.444 1.895 2.771 3.693 4.620 5.525 7.198 8.631 9.816
10.783 11.577 12.242 12.817 13.327 13.791 14.218 14.614 14.979
KNa (0.003) 0.022 0.071 0.178 0.364 0.637 0.994 1.424 1.912 2.446 3.605 4.825 6.058 7.272 8.450 9.586
10.676 11.722 12.727 13.694 14.624 15.52
(0.010) 0.167 0.798 2.700 6.916
14.450 26.078 42.232 63.02 88.39
152.19 231.55 323.98 427.14 539.1 658.3 783.6 914.4
1050.0 1190.1 1334.3 1482.3
(t(g)
0:01a 0.043 0.088 0.155 0.249 0.368 0.512 0.678 1.068 1.517 2.008 2.526 3.059 3.601 4.146 4.689 5.227 5.760 6.285 6.802

LOW-TEMPERATURE HEAT CAPACITY OF KN3. RbN,, CsNs, AND TIN, 1191
TABLE 5-continued
T ii
CP S’(T)-S’(O) _- __-. ~. calth K-l mole1 cal,,, K-l mol-’
180 190 200 210 220 230 240 2.50 260 270 280 290 300 310 320 330 340 350 273.15 298.15
15.32 15.63 15.91 16.19 16.45 16.70 16.96 17.21 17.47 17.72 23.07 17.97 23.72 18.20 18.42 18.63 18.83 19.04 19.26 19.49 17.80 18.38
5 0.014 IO 0.181 15 0.673 20 1.471 25 2.432 30 3.475 35 4.551 40 5.585 45 6.569 50 7.482 60 9.072 70 10.357 X0 11.381 90 12.203
100 12.878 110 13.449 120 13.945 130 14.388 140 14.788 150 15.15 160 15.49 170 15.81 180 16.10 190 16.38 200 16.65 210 16.92 220 17.19 230 17.45 240 17.71 250 17.96 260 18.21 270 18.45
-----_____- - 16.39 17.22 18.03 18.82 19.57 20.3 1 21.03 21.73 22.41
24.35 24.97 25.58 26.18 26.76 27.33 27.89 23.28 24.86
RbNa
(0.007) 0.055 0.210 0.507 0.936 1.471 2.088 2.764 3.479 4.219 5.728 7.227 8.679
10.069 11.391 12.646 13.837 14.972 16.05 17.09 18.07 19.02 19.94 20.81 21.66 22.48 23.27 24.04 24.79 25.52 26.23 26.92
H”(T)--H’(O) -{c”(T)-Zf’(O);./T calt, mol - 1 calth K- 1 mol. i
1633.7 1788.5 1946.2 2106.7 2269.9 2435.7 2604.0 2774.9 2948.3 3124.2 3302.7 3483.6 3666.1 3851.9 4039.2 4228.6 4420.1 4613.9 3180.2 3632.6
(0.027) 0.420 2.402 7.665
17.377 32.120 52.19 17.56
107.97 143.13 226.16 323.55 432.43 550.5 676.0 807.7 944.7
1086.4 1232.3 1382.1 1535.3 1691.8 1851.4 2013.8 2179.0 2346.9 2517.4 2690.6 2866.4 3044.8 3225.6 3408.9
7.310 7.810 8.301 8.783 9.251 9.721
10.178 10.626 11.066 11.498 11.923 12.341 12.75 1 13.156 13.553 13.945 14.330 14.709 11.633 12.676
(0.002) 0.014 0.049 0.124 0.241 0.400 0.596 0.825 I .080 I .356 I.959 2.605 3.274 3.952 4.631 5.303 5.965 6.614 7.250 7.872 8.479 9.071 9.650
10.214 10.765 11.304 11.830 12.344 12.847 13.340 13.822 14.294

1192 R. W. CARLING AND E. F. WESTRUM, JR.
TABLE 5-contimed
T
K
280 290 300 310 320 330 340 350 273.15 298.15
5 10 15 20 25 30 35 40 45 50 60 70 80 90
100 110 120 130 140 150 160 170 180 190 200 210 220 230 240 250 260 270 280 290 300 310 320 330 340 350 273.15 298.15
S”(T)-S”(O) .__ GdP~~ calth K-l mol-’ calt,, K-’ mol-l
18.68 18.91 19.14
27.59 28.25 28.90 29.53 19.37
19.59 19.82 20.04 20.25 18.52 19.09
0.051 0.564 1.533 2.656 3.789 4.926 6.038 7.062 8.002 8.858
10.319 11.477 12.386 13.102 13.679 14.161 14.581 14.964 15.32 15.66 15.99 16.30 16.60 16.89 17.17 17.44 17.70 17.97 18.24 18.51 18.79 19.07 19.36 19.65 19.94 20.23 20.52 20.82 21.12 21.43 19.16 19.89
30.15 30.76 31.35 31.93 27.13 28.78
CsN3
(0.001) 0.161 0.563 1.157 1.871 2.662 3.506 4.380 5.267 6.155 7.904 9.585
11.180 12.681 14.093 15.42 16.67 17.85 18.97 20.04 21.06 22.04 22.98 23.89 24.76 25.61 26.42 27.22 27.99 28.74 29.47 30.18 30.88 31.57 32.24 32.90 33.54 34.18 34.80 35.42 30.40 32.11
N”(T)--H”(O) -P3T)--H”@)W- calth mol - 1 calth K-l mol-’
3594.5 14.757 3782.5 15.21 3972.7 15.66 4165.2 16.09 4360.0 16.52 4557.1 16.95 4756.4 17.36 4957.9 17.77 3467. I 14.441 3937.4 15.58
(0.003) (O.ooo) 1.303 0.03 1 6.420 0.135
16.874 0.313 32.987 0.552 54.77 0.837 82.21 1.157
115.00 1.505 152.64 1.874 194.88 2.258 291.03 3.054 400.24 3.868 519.7 4.683 647.3 5.489 781.3 6.280 920.6 7.051
1064.3 7.801 1212.1 8.529 1363.5 9.235 1518.4 1676.7 1838.2 2002.7 2170.1 2340.4 2513.4 2689.1 2867.4
9.921 10.585 11.231 11.858 12.467 13.060 13.638 14.201 14.749
3048.4 15.28 3232.2 15.81 3418.6 16.32 3608.0 16.82 3800.1 17.31 3995.2 17.79 4193.2 18.26 4394.0 18.72 4597.8 19.17 4804.5 19.62 5014 20.06 5227 20.49 3668.2 16.98 4156.3 18.17

LOW-TEMPERATURE HEAT CAPACITY OF KNZ, RbNs. CsN3, AND TIN, 1193
TABLE 6. Thermophysical properties of TINI (c& = 4.184 J)
T G S”(T)-S’(O) H”(T)--H”(O)
x calth K-l mol-1 -iGo(-H”(W/T
calth K-l mold1 calrh mol-1 caltn K-l mol-1
5 0.076 (0.033) (0.125) (O.@w 10 0.874 0.277 2.117 0.066 15 2.073 0.856 9.457 0.226 20 3.247 1.615 22.791 0.476 25 4.333 2.458 41.779 0.787
30 5.356 3.339 66.02 1.139 35 6.350 4.240 95.30 1.517 40 7.283 5.150 129.42 1.914 45 8.122 6.057 167.96 2.324 50 8.890 6.953 210.54 2.743
60 10.206 8.694 306.23 3.591 70 11.295 10.352 413.91 4.439 80 12.195 11.921 531.5 5.277 90 12.941 13.402 657.3 6.098
100 13.561 14.798 789.9 6.899
110 14.084 16.12 928.2 7.678 120 14.530 17.36 1071.3 8.433 130 14.919 18.54 1218.6 9.166 140 15.27 19.66 1369.6 9.876 150 15.59 20.72 1523.9 10.564
160 15.89 21.74 1681.3 11.231 170 16.19 22.71 lE41.7 11.878 180 16.49 23.64 2005.1 12.505 190 16.78 24.54 2171.4 13.116 200 17.08 25.41 2340.8 13.709
210 17.39 220 17.70 230 18.02 233.00 a 123.2 242.04 a 164.1
26.25 2513.1 14.286 27.07 2688.6 14.849 27.86 2867.2 15.40
250 18.11 29.90 3068.7 17.62 260 18.40 30.62 3251.3 18.11 270 18.63 31.32 3436.5 18.59 280 18.85 32.00 3623.9 19.05 290 19.07 32.66 3813.5 19.51
300 19.30 33.31 4005.3 19.96 310 19.54 33.95 4199.5 20.40 320 19.80 34.57 43%.2 20.84 330 20.06 35.19 4595.4 21.26 340 20.32 35.79 4797.3 21.68 350 20.57 36.38 5001.7 22.09
273.15 18.70 31.53 3495.3 18.74 298.15 19.25 33.19 396P.6 19.88
LI Peak of transition 69

1194 R. W. CARLING AND E. F. WESTRUM, JR.
THERMAL FUNCTIONS
The experimental heat capacities in the non-transition regions were curve-fitted to polynomials in reduced temperature by the method of least-squares and then inte- grated to yield values of the thermal functions at regular temperature intervals presented in tables 5 and 6. The thermodynamic functions have a probable error of less than 0.1 per cent above 50 K. Below 5 K, entropy and enthalpy increments were obtained from plots of C,fT against T2. No adjustments for contributions due to isotopic mixing or nuclear spin were made; hence, the values tabulated are practical values for use in chemical thermodynamic calculations.
4. Discussion POTASSIUM, RUBIDIUM, AND CESIUM AZIDES
That KNJ, RbNa, and CsN, have no low-temperature thermal anomalies in the heat capacity is shown in figure 1. Pistorius predicted low-temperature phase transitions for RbN3 and CsN,(*) based on the assumption that p(T) equilibrium lines could be extrapolated linearly to 101 kPa. These lines may be concave downwards so that the low-temperature phases of RbN3 and CsN, would only be encountered at higher pressures. A similar prediction by White and Pistorius(25) was made for CsHF,, but no thermal anomaly was detected below 300 K in heat-capacity measurements of CsHF,.“’ For CsHF,, as for RbN, and CsN,, this phase transition would only be encountered at pressures higher than 100 kPa. An extrapolation similar to that for CsHF, is not possible for RbHF, because the phase diagram is incomplete.
Figure 4 illustrates the heat capacities of KN,, RbN,, and CsN, and those of the respective MHF,‘s to facilitate comparison between the azides and the hydrogen difluorides. The similarities are to be expected since all the compounds consist of linear, symmetrical anions which belong to the same space group, 14/mcm-D::, and the contributions from internal frequencies of the anions are small. The only difference arises from the slightly larger molar masses of the azides relative to their respective hydrogen difluorides. Table 7 cites the entropies at 298.15 K for the azides and the corresponding hydrogen difluorides for further comparison.
THALLIUM AZIDE
Reproducibility of enthalpy increments over the transition region is shown in table 4. The lattice heat capacity was deduced from graphical extrapolations of effective On’s against temperature into the transition region from above and below to get two values of @lattice). These values of O,(lattice) between 220 and 261 K were converted to lattice heat-capacity values extrapolated to 242 K to evaluate the excess enthalpy and entropy. From the difference between the integrated experimental heat-capacity curve and the estimated lattice contribution the total enthalpy and entropy of the tran- sitions were obtained. The lattice enthalpy (H”(261 K)-H”(220 K)} was determined to be 742.1 Cal,, mol -I. The resulting entropy and enthalpy increments of the tran- sitions were found to be AS, = (0.89+0.01) caJh K-’ mol-’ and AH, = (195.,+2) caltr, mol-‘. If a lower estimate of the lattice contribution had been chosen the lattice enthalpy (H”(261 K) - H"(220 K)) would have been 738 Cal,,, mol-‘. The

LOW-TEMPERATURE HEAT CAPACITY OF KNa, RbNs, CsNa, AND TIN,’ 1195
0 loo 200 300
T/K
FIGURE 4. Smoothed heat capacities. A, KN3; A, KHFs; 0, RbN2; R, RbHF2; C, CsN3; 0, CsHF2. Data for the MHFz compounds are from Burney and Westrum.
TABLE 7. Entropies for the azides and hydrogen difluorides at 298.15 K (caltb = 4.184 J)
Cation Na K Rb cs TI
S(MNs)/calth K- ’ mol-l 23.15 a 24.86 28.78 32.11 33.19 S(MHF,)/caI,, K-’ mol-r 21.73 b 24.92 e 2S.70 d 32.30 d 34.92 ‘[
a Carling and Westrum. (I) b Bumey and Westrum.‘*’ c Westrum and Pitzer.c3) d Bumey and Westrum.@)
resulting total entropy and enthalpy increments of the transitions would have been AS, = (0.91+0.01) Cal,, K-’ mol-r and AH, = (200. 5 f 2) Cal,, mol- ‘. Although the thermal properties of the components of the bifurcated anomaly cannot be resolved unambiguously, the apparent enthalpies and entropies associated with the lower peak are chosen as (160+ 10) Cal,, mol-’ and (0.71 kO.05) Cal,, K-’ mol-’ and with the upper (40+ 10) Cal,, mol- ’ and (0.18 + 0.05) Cal,, K- ’ mol- ‘, respectively.
Thermal effects in TlN, have been studied by a variety of other methods also. A phase transition detected by d.t.a. at about 233 K has been reported.c3) The infrared and Raman spectra indicated transition temperatures of 225 K,(“,26) and 240 K (13) A readily reversible transition at (248 + 5) K was found in the thermal expansion. ‘(12) Pressure equilibrium studies indicated a transition at (193 + 30) K.(*) More recent d t a . . . work(r4’ indicated a transition temperature of (243.4f 1 .O) K. Although evidence for two closely-spaced transitions has not previously been reported, it seems plausible that the range in reported transition temperatures observed by different techniques may arise from one or other of the two transitions observed in the present research.

1196 R. W. CARLING AND E. F. WESTRUM, JR.
The present work has yielded two transitions at 233 and 242 K and the following discussion is an attempt to elucidate the phase relations at high pressures for TINS. Figure 5a shows the phase diagram based on the work of Pistorius.(r4) Recent attempts to resolve the problems in the light of the present results using d.t.a. at high pres- surest2’) produced no additional information. A lack of reproducibility and the minute size of d.t.a. signals involved do not allow definite conclusions. Calorimetric studies under hydrostatic pressure conditions or high-pressure X-ray diffraction studies would be most useful in resolving the situation.
The first possibility is that the two transitions present merge at higher pressures at a IV/III/II triple point, and the resulting phase boundary is the III/II boundary reported by Pistorius. Close examination of the determined slope of the III/II phase boundary shows this to be impossible. An added disqualification is the fact that the high volume change present at the III/II transition was not apparent in the transition from the II to IV phase. (Pistorius presents a detailed discussion of this.)(r4)
t$ 242 h
$$ 242 E-4
233
0 0.4 u 0.4 p/GPA p/GPA
FIGURE 5. (a) Phase diagram at low pressures of TINa system according to Pistorius;“4) (b) possible revision proposed by Clark.(“‘)
There remain two possibilities which are both acceptable. Figure 5b illustrates two possible slopes for a proposed IV/V phase boundary. The first one indicates a II/v/IV triple point at 0.15 GPa near 244 K. This value is chosen because of the disappearance of d.t.a. signals reported by Pistorius at this point. From this assumption it is possible to calculate the volume changes on the IV/V and V/II boundaries using the Clausius- Clapeyron equation. These support the contention that the IV/III phase boundary carries most of the volume change associated with the III/II transition. The unique feature shown in figure 5b is the existence of phase IV which is different from phase III. The existence of this phase has an added importance because it alters certain crystal-chemical arguments concerning the high-pressure phases TlN,(III), RbN,(III), and CsN,(III). From previous data on all compounds mentioned, arguments have been advanced(14) to show that these phases are probably isostructural and that they are related to the orthorhombic low-temperature phase(‘2*28) found for TIN, at atmospheric pressure. However, Raman data@‘) are said to provide evidence that
LOW-TEMPERATURE HEAT CAPACITY OF KNs, RbN3, CsN3, AND TINa 1197
these phases may, in fact, be different. The presence of the TlN, IV/III phase boundary indicates that they are apparently so. The change from the tetragonal phase II through phase IV, and finally to phase III may be from an eight-fold to a 4-4 coordination with four long azide-metal bonds and four short azide - metal bonds.(“) Such 4 - 4 coordination has been observed in AgN,,(29) with distortion which is a consequence of weak covalent bonding between the azide and the thallium ions. At higher temperature the thermal energy masks these distortions.
Since “aged” samples of TIN, are reported to exhibit a transition at 225 K,(13) we note that the calorimetric sample employed in our endeavor was about six months old. Until details of this “time-dependent” transition are known ,we consider the reported transition at 225 K to be that observed at 233 K in this study.
As in the comparison between NaN, and NaHF,,(‘) it is noted that TIN, and TlHF, do not exhibit the same thermal behavior; the entropy at 298.15 K of TlHF, is about 5 per cent larger than that of TIN, (compare table 7). Hassel et ~1.~~~) performed analytical tests and an X-ray diffraction analysis on a material initially identified as TlHF,. These analytical tests were later shown to be incorrect and the proper formula of the compound identified as TlH,F, .+H20.(32) Lee(33’ suggested that the heat- capacity determinations by Burney(‘) might have been taken on a sample of the hemihydrate. If the calorimetric TlHF, sample, whose heat capacity and composition were determined in this laboratory, was partially hydrated this might explain the seemingly large value of S” for thallium hydrogen difluoride at 298.15 K. However, the analysis of the calorimetric sample of TlHF2 was in good agreement with theoretical.“) Evidence for hydration such as Hassel encountered was sought but not detected.
It seems probable that the difference in S”(298.15 K) between TIN, and TlHF, is due to two factors. Firstly, TIN, is orthorhombic below 233 K, while TlHF, is tetragonal below this temperature. Secondly, the heat capacity of TlHF, begins to rise sharply near 300 K possibly as a premonitory effect-similar to that in CsHF, (compare figure 4)-heralding the onset of a transition in TlHF, noted in a recent report.(34’
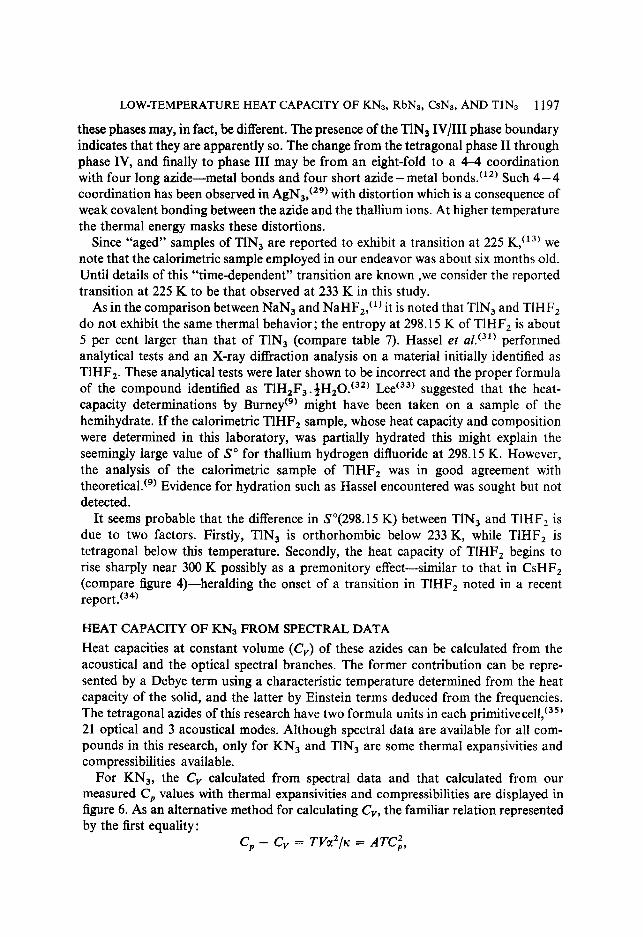
HEAT CAPACITY OF KN3 FROM SPECTRAL DATA Heat capacities at constant volume (C,) of these azides can be calculated from the acoustical and the optical spectral branches. The former contribution can be repre- sented by a Debye term using a characteristic temperature determined from the heat capacity of the solid, and the latter by Einstein terms deduced from the frequencies. The tetragonal azides of this research have two formula units in each primitivece11,(35’ 21 optical and 3 acoustical modes. Although spectral data are available for all com- pounds in this research, only for KN, and TlN, are some thermal expansivities and compressibilities available.
For KN,, the C, calculated from spectral data and that calculated from our measured C, values with thermal expansivities and compressibilities are displayed in figure 6. As an alternative method for calculating C,, the familiar relation represented by the first equality:
C, - C, = TVa2/~ = ATC;,

1198 R. W. CARLING AND E. F. WESTRUM, JR.
in which Y denotes molar volume, a thermal expansivity, and rc isothermal compres- sibility may be recast as the term shown at the right (in which the symbol A denotes Vc12/rcCi). A remains approximately constant over significant temperature ranges.(36) For KN3, a value of A of 1.08 x 10e5 mol Cal,’ at 293 K was derived from the molar volume of 39.9 cm3 mol-‘, a temperature-dependent thermal expansivity valid from 100 to 300 K (with a 293 K value of 144x low6 K-1,(37) favored over an earlier value of 182 x low6 K-1,(38)), an a compressibility of 54.1 TPa-‘. For TIN,, the d
0 loo 200 300 T/K
FIGURE 6. Comparison of heat capacity of KN3 evaluated by different methods. -, C, (expt); ---_ Cv(calc. from spectral data); -.-, &(calc. from C,(expt) adjusted for thermal expansivity and compressibility). The deviations, 0, between the experimental C, points and the smoothed curve and - - - between the &(from spectral data) and &(calc. from C,,) are depicted in the upper portion of the figure.
value of A of 1.21 x 10e5 mol Cal,’ was deduced from V = 41.7 cm3 mol-‘, c1 = 135 x 10m6 K-’ below the TIN, transition and 160 x 10e6 K-r above the tran- sition,(12) and K = 46.3 TPa- . 1 (39) Values of C,(expt) and of C,(calc.) from the expression above, displayed in figures 6 and 7 show good agreement with C,(spect.) at high temperatures but deviate as the temperature decreases. Such deviation has been observed in other sohds also. (35) Evaluation of C, from spectral data for NaN3 and the other two compounds of this study can be found elsewhere;(‘@ (however, only for KN, and TIN, are a and K available). For each of these azides the spectroscopic

LOW-TEMPERATURE HEAT CAPACITY OF KNa, RbNa, CsN3, AND TIN3 1199
0 100 200 300 400
T/K
FIGURE 7. Comparison of heat capacity of TIN8 evaluated by different methods. -, C,(expt); ---- C&alc. from spectral data); -.-, C&k. from C,(expt) adjusted for thermal expansivity and compressibility). The deviations, 0, between the experimental C, points and the smoothed curve and - __ -, between the Cv(from spectral data) and &(calc. from C,> are depicted in the upper portion of the figure.
C, exceeds the measured C, at lower temperatures. The relative success of the calcu- lation for KN, probably stems from the greater separation of optical and acoustical branches occasioned by the comparable masses of the two ions.
The authors express their appreciation to the Chemical Thermodynamics Program of the Chemistry Section, National Science Foundation for partial support of this endeavor and to E. I. Du Pont for fellowship support for R. W. Carling. We acknow- ledge the cooperation of A. J. Highe and C. G. Galeas, in the experimental measure- ments. Dr Brian Clark’s helpful discussions are also acknowledged.
REFERENCES 1. Part I. Carhng, R. W.; Westrum, E. F., Jr., J. Chem. Thermo&numics 1976, 8, 565. 2. Westrum, E. F., Jr.; Burney, G. J. Phys. Chem. 1961, 65, 344. 3. Westrum, E. F., Jr.; Piker, K. S. J. Am. Chem. Sot. 1949, 71, 1940. 4. Choi, C. S. ; Prince, E. J. Gem. Phys. 1976, 64, 4510. 5. Mueller, H. J.; Joebstl, J. A. Z. Krist. 1965, 121, 385 6. Landee, C. P.; Westrum, E. F., Jr., unpublished results. 7. Evans, B. L. ; Yoffe, A. D. ; Gray, P. Chem. Revs. 1959, 59, 515. 8. Pistorius, C. W. F. T. J. Chem. Phys. 1969,51,2604. 9. Burney, G. A.; Westrum, E. F., Jr. J. Phys. Chem. 1961, 65, 349.
10. Kezer, 0. F.; Rosenwasser, H. Nature 1966,210, 1354. 11. Iqbal, Z.; Malhotra, M. L. J. Chem. Phys. 1972, 57, 2637.

1200 R. W. CARLING AND E. F. WESTRUM, JR.
12. Mauer, F. A.; Hubbard, C. R.; Hahn, T. A. J. Chem. Phys. 1973,59, 3770. 13. Iqbal, 2. ; Christoe, C. W. Chem. Phys. Letr. 1974,29, 623. 14. Pistorius, C. W. F. T. J. Chem. Phys. 1974, 60, 3720. 15. Suhrman, V. R.; Clusius, K. 2. Anorg. Chem. 1926, 152, 52. 16. Carling, R. W., Ph.D. thesis, The University of Michigan, Ann Arbor, Michigan, 1975 D&s. A&s.
1976,36, 5056-B. 17. For detailed supplementary data concerning X-ray analysis of the samples used in this research,
see NAPS document No. 02771 for 12 pages of supplementary material. Order from ASIS/ NAPS, c/o Microfiche Publications, 440 Park Avenue South, New York, New York 10016 U.S.A. Remit in advance for each NAPS accession number. Make checks payable to Micro- fiche Publications. Photocopies are $5.00. Microfiche are 83.00. Outside the U.S. and Canada postage is $2.00 for a photocopy or $1 .OO for a fiche.
18. Clem, R. G.; Huffman, E. H. Anal. Chem. 1%5,37, 366. 19. Suzuki, S. J. Chem. SOC. Jpn., Pure Chem. Sect. 1952, 73, 150. 20. Vogel, A. I. A Text-Book of Inorganic Analysis, 3rd edition. Wiley: New York. 1961. 21. Westrum, E. F., Jr.; Furukawa, G. T.; McCullough, J. P. Adiabatic low-temperature caiori-
metry. In Experimental Thermodynamics vol. I. McCullough, J. P.; Scott, D. W.: editors. Butterworths: London. 1968.
22. Rossini, F. D.; Wagman, D. D.; Evans, W. H.; Levine, S.; Jaffe, I. Nat. Bur. Stand. Circular No. 500, U.S. Government Printing office, Washington, D.C. 1952.
23. Iqbal, Z. Personal communication. 1975. 24. Giauque, W. F.; Stout, J. W. J. Am. Chem. Sot. 1939, 58, 1144. 25. White, A. J. C.; Pistorius, C. W. F. T. J. Chem. Phys. 1972,56, 4318. 26. Iqbal, Z. Advan. Raman Spec. 1972, 1, 188. 27. Clark, J. B. Personal communication. 1976. 28. Haase, O., unpublished results. 29. Christoe, C. W.; Iqbal, Z. Solid State Cornman. 1974, 15, 859. 30. West, C. D. Z. Krist. 1936, 95, 421. 31. Hassel, V. 0.; Kringstad, H. Z. Anorg. Allg. Chem. 1930, 191, 36. 32. Ha&, V. 0.; Kringstad, H. Z. Anorg. A&. Chem. 1932,208,382. 33. Lee, A. G. The Chemistry of l%alliam. Elsevier: New York. 1971. 34. ZiPBerman, B. D.; Fedotova, T. D.; Gabuda, S. P. Zh. Strukt. Khim. 1976, 17, 273. 35. Hathaway, C. E.; Temple, P. A. Phys. Rev. B 1971, 3, 3497. 36. Zemansky, M. W. Heat and TLhermodynamics. McGraw-Hill: New York. 1957. 37. Mauer, F. A.; Hahn, T. A. AZP Conference Proc. 1971, 3, 139. 38. Parsons, R. B.; Yoffe, A. D., Acta Cryst. 1966, 20, 36. 39. Weir, C. E.; Block, S.; Piermarini, G. J. J. Chem. Phys. 1970,53,4265.