thermoluminescence dosimetry at the vienna triga mark … · 2008-09-23 · vienna triga mark-ii...
TRANSCRIPT

UID ATU 37675002 DVR 0005886TU Handelsgericht Wien Bankverbindung: Bank Austria-Creditanstalt AG Konto 51429141901 BLZ 12000 BIC BKAUATWW IBAN AT141200051429141901
THERMOLUMINESCENCE DOSIMETRY AT THE
VIENNA TRIGA MARK-II RESEARCH REACTOR
T. Bílý & M. Hajek
AIAU 27606
February 2007

Content:
Index to abbreviations ............................................................................................................. 3
1. Introduction ...................................................................................................................... 41.1. Gamma ray physics in nuclear reactor ................................................................................................ 4
1.1.1. Sources of gamma radiation in reactor ............................................................................................ 41.1.2. Measurement of gamma radiation in reactor ................................................................................... 8
1.2. Thermoluminescence ............................................................................................................................ 9
2. Thermoluminescent measurements on TRIGA reactor ............................................. 102.1. MCP 7 and TLD 700H ....................................................................................................................... 10
2.2. TLD 700 and TLD 600 ....................................................................................................................... 11
2.3. TL Measurements on TRIGA reactor ................................................................................................. 12
2.4. Evaluation of TRIGA results .............................................................................................................. 16
2.5. Calibration of TLDs for reactor measurements ................................................................................. 182.5.1. Calibration of MCP 7 .................................................................................................................... 202.5.2. Calibration of TLD 700 ................................................................................................................. 24
3. Conclusions ..................................................................................................................... 25
Acknowledgement .................................................................................................................. 26
Sources: ................................................................................................................................... 27

Index to abbreviations AKH ... General Hospital in Vienna (Allgemeine Krankenhaus) ATI ... Atomic Institute at Vienna University of Technology DNR ... Department of Nuclear Reactors FNEPS ... Faculty of Nuclear Engineering and Physical Sciences FP ... fission products ICF ... individual calibration factor TL ... thermoluminescent TLD ... thermoluminescent dosimeter
4
1. Introduction
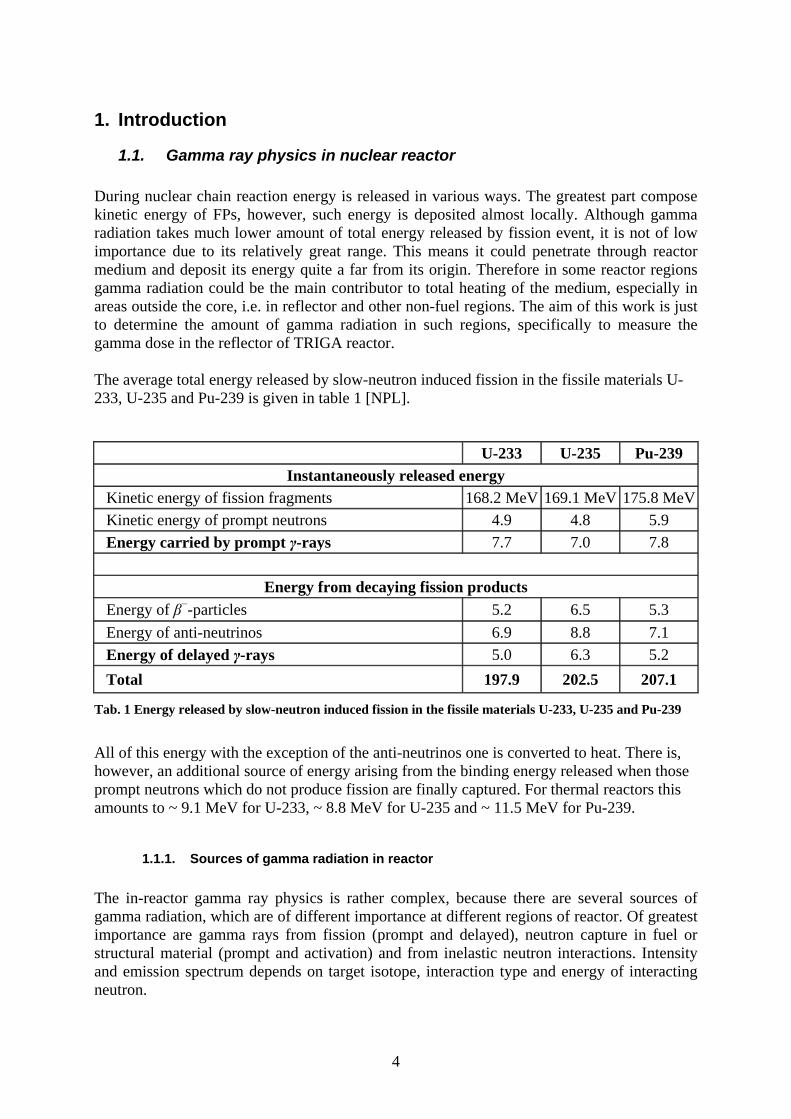
1.1. Gamma ray physics in nuclear reactor During nuclear chain reaction energy is released in various ways. The greatest part compose kinetic energy of FPs, however, such energy is deposited almost locally. Although gamma radiation takes much lower amount of total energy released by fission event, it is not of low importance due to its relatively great range. This means it could penetrate through reactor medium and deposit its energy quite a far from its origin. Therefore in some reactor regions gamma radiation could be the main contributor to total heating of the medium, especially in areas outside the core, i.e. in reflector and other non-fuel regions. The aim of this work is just to determine the amount of gamma radiation in such regions, specifically to measure the gamma dose in the reflector of TRIGA reactor. The average total energy released by slow-neutron induced fission in the fissile materials U-233, U-235 and Pu-239 is given in table 1 [NPL].
U-233 U-235 Pu-239 Instantaneously released energy
Kinetic energy of fission fragments 168.2 MeV 169.1 MeV 175.8 MeV Kinetic energy of prompt neutrons 4.9 4.8 5.9 Energy carried by prompt γ-rays 7.7 7.0 7.8
Energy from decaying fission products
Energy of β−-particles 5.2 6.5 5.3 Energy of anti-neutrinos 6.9 8.8 7.1 Energy of delayed γ-rays 5.0 6.3 5.2 Total 197.9 202.5 207.1
Tab. 1 Energy released by slow-neutron induced fission in the fissile materials U-233, U-235 and Pu-239
All of this energy with the exception of the anti-neutrinos one is converted to heat. There is, however, an additional source of energy arising from the binding energy released when those prompt neutrons which do not produce fission are finally captured. For thermal reactors this amounts to ~ 9.1 MeV for U-233, ~ 8.8 MeV for U-235 and ~ 11.5 MeV for Pu-239.
1.1.1. Sources of gamma radiation in reactor
The in-reactor gamma ray physics is rather complex, because there are several sources of gamma radiation, which are of different importance at different regions of reactor. Of greatest importance are gamma rays from fission (prompt and delayed), neutron capture in fuel or structural material (prompt and activation) and from inelastic neutron interactions. Intensity and emission spectrum depends on target isotope, interaction type and energy of interacting neutron.
5
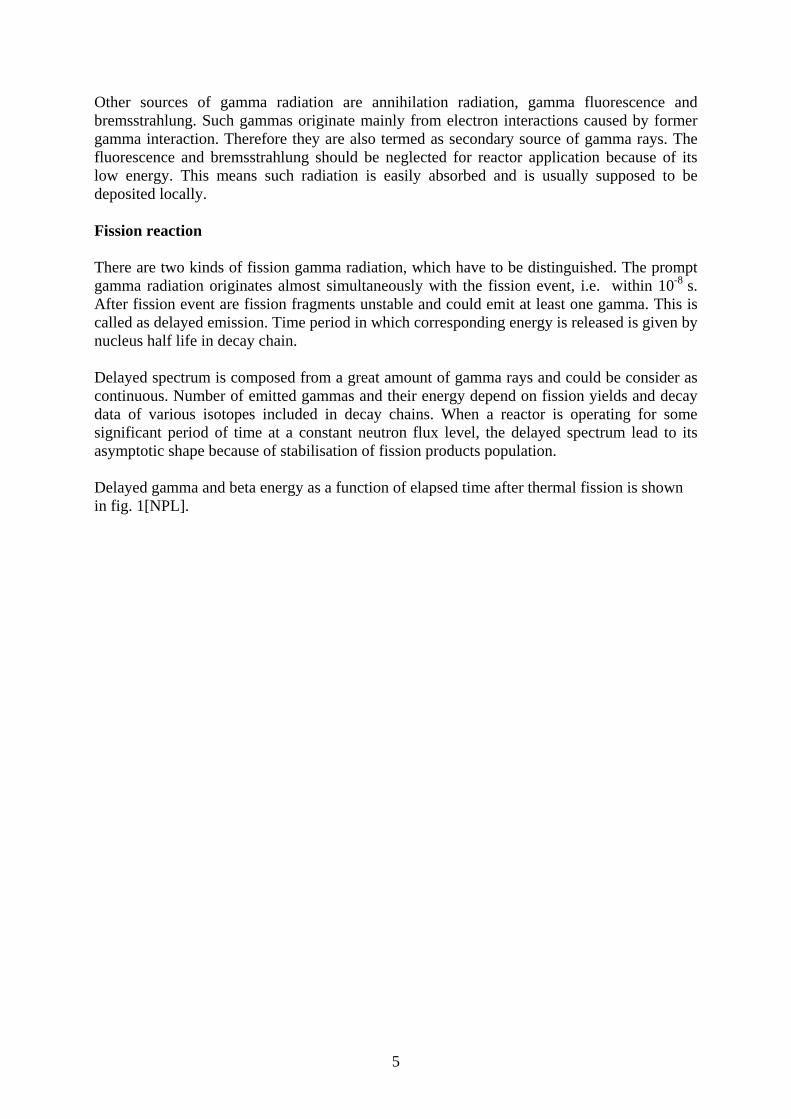
Other sources of gamma radiation are annihilation radiation, gamma fluorescence and bremsstrahlung. Such gammas originate mainly from electron interactions caused by former gamma interaction. Therefore they are also termed as secondary source of gamma rays. The fluorescence and bremsstrahlung should be neglected for reactor application because of its low energy. This means such radiation is easily absorbed and is usually supposed to be deposited locally. Fission reaction There are two kinds of fission gamma radiation, which have to be distinguished. The prompt gamma radiation originates almost simultaneously with the fission event, i.e. within 10-8 s. After fission event are fission fragments unstable and could emit at least one gamma. This is called as delayed emission. Time period in which corresponding energy is released is given by nucleus half life in decay chain. Delayed spectrum is composed from a great amount of gamma rays and could be consider as continuous. Number of emitted gammas and their energy depend on fission yields and decay data of various isotopes included in decay chains. When a reactor is operating for some significant period of time at a constant neutron flux level, the delayed spectrum lead to its asymptotic shape because of stabilisation of fission products population. Delayed gamma and beta energy as a function of elapsed time after thermal fission is shown in fig. 1[NPL].
6
Figure 1 Gamma and beta energy from fission product decay as a function of time after thermal fission
Usually the mean energy of gammas emitted through fission is a bit lower compare to
that emitted by neutron capture (usually slightly above 1 MeV). Shape of emission spectrum is approximately the same for all fission nuclides.
Neutron capture
Initial product of neutron capture is creating of an excited compound nucleus. The nucleus could release its excitation energy by different ways, i.e. by emitting different types of particles such as α, β, γ. If the deexcitation is realized by emitting gamma rays only, it is

7
called as radiative neutron capture. Gamma emission belongs to prompt one, i.e. takes place approximately 10-12 s after capture event. Only a few elements emits only one gamma quantum; the deexcitacion usually goes through several intermediate states producing up to four gammas.
Nuclear levels system is characteristic for each nucleus; therefore, the emission
spectrum depends on target isotope. It relies also on energy of incident neutron which determines the compound nucleus excitation level. Released energy is equal to sum of neutron binding energy in compound nucleus and kinetic energy of incident neutron. Binding energy varies from 2,2 MeV for hydrogen up to 11 MeV for silicon and in average lies between 6 and 7 MeV. The capture emission spectrum is usually harder than fission or inelastic one. Next, the capture emission spectrum is generally harder for structural materials than for fission or fertile isotopes. After deexcitation caused by gamma radiation the compound nucleus could be still in an unstable state due to neutron excess and could undergo further decay through β- emission. In most case this is accompanied by further gamma ray emission.
Gamma rays could also arise from such capture reaction as (n,α), (n,p), (n,t), etc. are. Nevertheless the threshold energy of such reactions is usually great and their cross section low, hence their contribution is negligible for most cases. The only exception is a 10B (n,α) reaction, which could occur even for thermal energy of incident neutrons and is important for reactor control. In 93% cases it lead to excited 7Li nucleus, which deexcited by gamma ray emission with energy of 0,478 MeV.
Inelastic scattering When neutron undergoes an inelastic scattering it is firstly captured and creates a compound nucleus. Then the release of neutron with lower energy takes place, whereas the target nucleus remains in an excited state. Target nucleus returns to the ground state by emission of one or more gammas approximately 10-14 s after scattering event. Gamma rays emission energy corresponds to excitation energy of compound nucleus, emission spectrum to energy levels of nucleus and decay scheme. Nucleus could be excited to different states according to energy of incident neutron. Finally, this could realize only if the energy of incident neutron is greater than threshold energy of reaction Es given as Es = (1+ 1/A)E1, where E1 is an energy of first excitated state and A corresponds to number of nucleons in target isotope. Therefore, the production of gamma radiation through inelastic scattering takes place only if the incident neutron spectrum is hard enough.
8
1.1.2. Measurement of gamma radiation in reactor
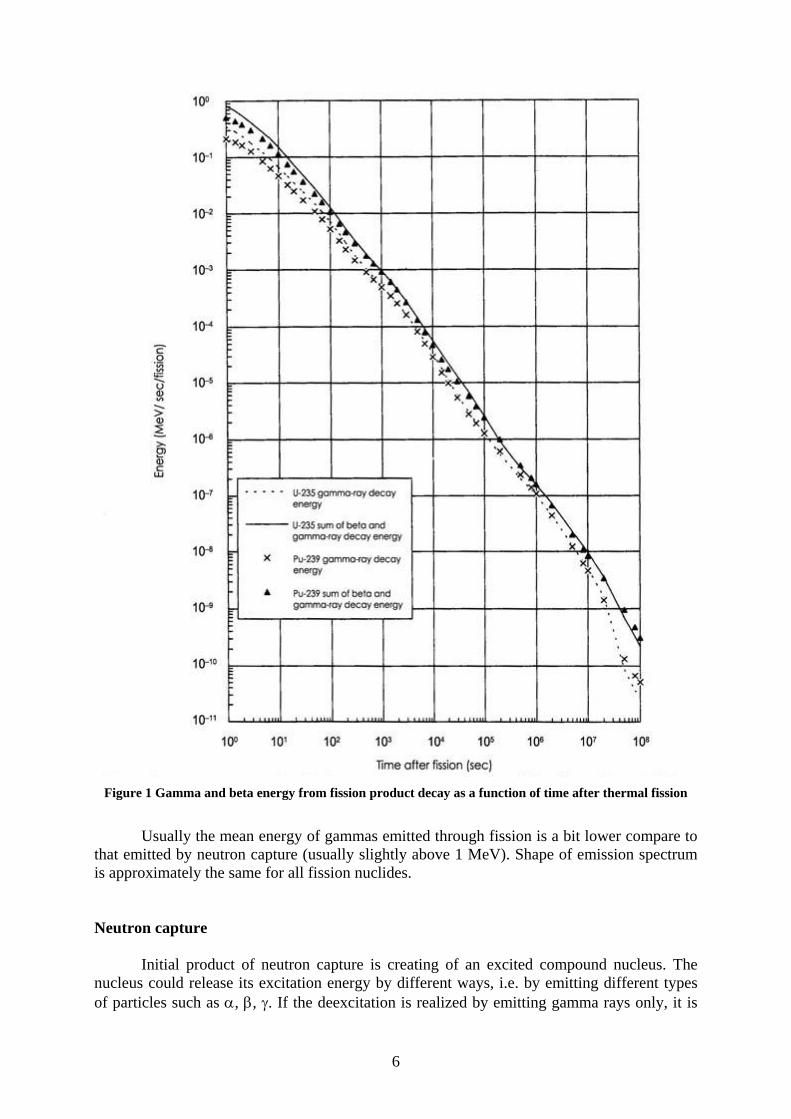
When measuring of gamma fields in reactor several things have to be held in mind. First, measured quality at given place does not correspond to gamma ray source in that place but to amount of there deposited energy of gamma rays. The greatest difference of these two qualities arises near the boundary of regions with different gamma ray sources, for example at core/reflector boundary. Another complicate task is how to handle with delayed emission, especially when measuring on research reactor with complex operational history, i.e. when reactor does not operate in a steady state at given power level for a significant period of time. There are two opposite delayed effects; residual radiation of fission product due to former operation and non-saturation emission of gamma rays. Although gamma rays energy from fission product decays as a function of time after fission event is relatively good known, in research reactor praxis is the estimation of such FP background rather difficult. Because of complex operational history is not the FP gamma emission in steady state and is hard to calculate. TL dosimeters shows best characteristics when relatively small doses are measured (in case of LiF dosimeters it means doses below maximal few grays). Therefore experiments often have to be carried out at a reactor power, which is significantly smaller than the nominal one. Consequently, the FP background could be even higher then the total gamma emission resulting from low power measurements. Thus, this effect has to be taken into account and such background has to be properly subtracted. The easiest way how to deal such effect is to hold through an additional measurement with reactor out of operation just before actual irradiation of TLDs at given power. Usually, experiments are carried out quite a short time after start up of the reactor. Of course, delayed gamma ray source is not saturated yet and therefore not all of steady state gamma emission is measured. The longer reactor operates at a given level, the greater part of delayed gammas is measured and the delayed emission gets closer to its saturation state. Moreover the not measured delayed portion varies also region to region as the importance of particular sources of gamma rays vary. As stated above, there are two opposite effects leading to over- and underestimating of measured dose respectively. The former effect strongly depends on reactor operational history, the latter, on the other hand, depends only on time elapsed after reactor start up and bringing it at certain power level and on the place of measurement.

9
1.2. Thermoluminescence Thermoluminescence is defined as „the thermally stimulated emission of light following the previous absorption of energy from radiation“ [McK] When a TL dosimeter is irradiated, some part of incident ionising radiation is deposited in TLD by creating electron/holes pairs which could be trapped at various levels. If the trap is depth enough (i.e. the energy difference between conduction band and the trap) then trapped charge carriers stays until their escape probability is not increased by some way. One way how to bring the amount of energy needed to release traps is heating of TLD. Through heating process charge carriers returns into stable state by recombination of electron/holes pairs. This lead to release of some amount of energy which could takes place also by emission of visible light. Its quantity measured via photomultiplier tube is proportional to radiation dose. Generally, advantages of TLDs are their small size enabling measurement in almost arbitrary place and resulting in great space resolution, possibility of placing detectors to the proximity of samples to be irradiated and possibility of simultaneously measurements on various positions. On the other hand the thermoluminescent measurements are very time consuming because dosimeters have to be prepared before irradiation and read out after that to gain information about measured doses. Therefore, also the results are known only after finishing the experiment. Moreover, sensitivity of TL chips strongly depends on experimental conditions such as heating and annealing procedures, handling with TLDs, etc. For in-reactor measurements only such TL detector types are proper which enables to distinguish between neutron and gamma doses. This is the case of LiF type dosemetres which are usually provided with three different lithium isotopes ratio; enhanced on Li-6, natural composition of Li-6 and Li-7 and enhanced on Li-7 (99,96-99,99% Li7, 0,01-0,04% Li6). Due to high neutron cross section of Li-6 especially in thermal region are the first two types very sensitive to neutrons; on the other hand, Li-7 due to its very small neutron cross section is almost insensitive to neutrons. Finally, by measurement with coupled detectors with different sensitivity to neutrons, i.e. with different Li-6 and Li-7 content, gamma and neutron doses could be separated.
10
2. Thermoluminescent measurements on TRIGA reactor In this investigations following types of TL detectors were used:
- TLD 700H ... LiF:Mg,Cu,P enhanced on Li7 produced by Harshaw - MCP7 ... LiF:Mg,Cu,P enhanced on Li7 produced by TLD Poland - TLD 600 ... LiF:Mg,Ti enhanced on Li6 produced by Harshaw - TLD 700 ... LiF:Mg,Ti enhanced on Li7 produced by Harshaw
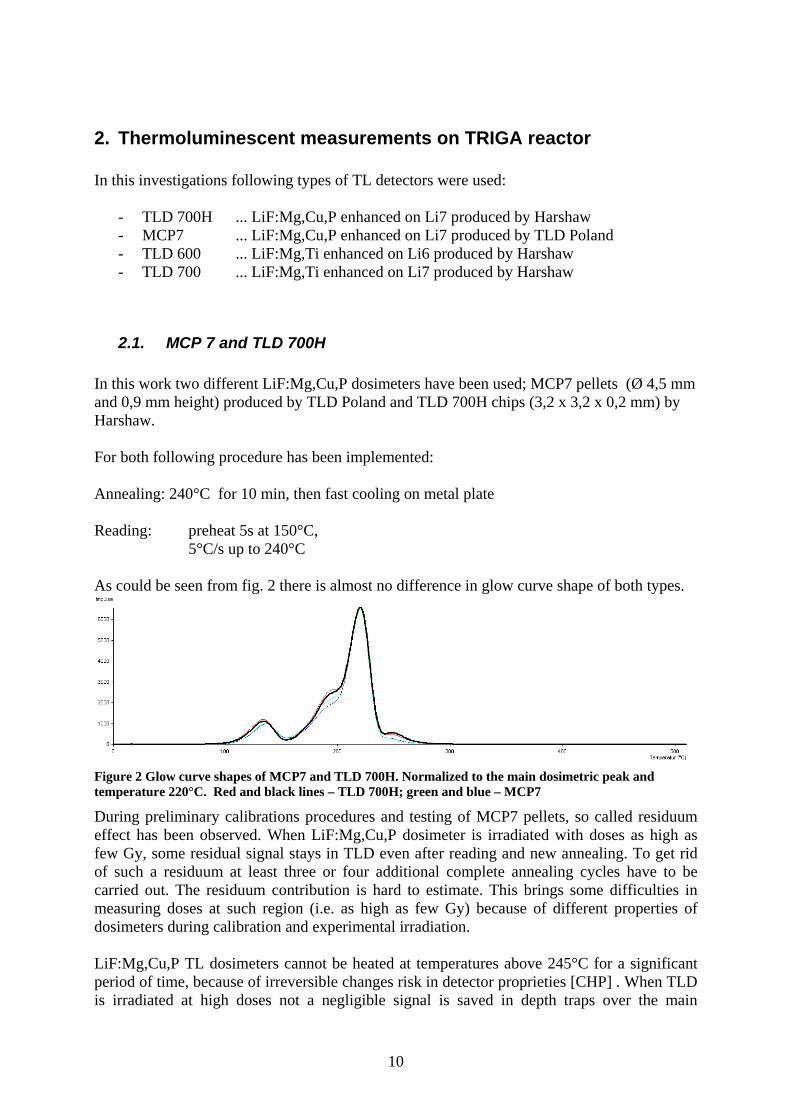
2.1. MCP 7 and TLD 700H In this work two different LiF:Mg,Cu,P dosimeters have been used; MCP7 pellets (Ø 4,5 mm and 0,9 mm height) produced by TLD Poland and TLD 700H chips (3,2 x 3,2 x 0,2 mm) by Harshaw. For both following procedure has been implemented: Annealing: 240°C for 10 min, then fast cooling on metal plate Reading: preheat 5s at 150°C,
5°C/s up to 240°C As could be seen from fig. 2 there is almost no difference in glow curve shape of both types.
Figure 2 Glow curve shapes of MCP7 and TLD 700H. Normalized to the main dosimetric peak and temperature 220°C. Red and black lines – TLD 700H; green and blue – MCP7
During preliminary calibrations procedures and testing of MCP7 pellets, so called residuum effect has been observed. When LiF:Mg,Cu,P dosimeter is irradiated with doses as high as few Gy, some residual signal stays in TLD even after reading and new annealing. To get rid of such a residuum at least three or four additional complete annealing cycles have to be carried out. The residuum contribution is hard to estimate. This brings some difficulties in measuring doses at such region (i.e. as high as few Gy) because of different properties of dosimeters during calibration and experimental irradiation. LiF:Mg,Cu,P TL dosimeters cannot be heated at temperatures above 245°C for a significant period of time, because of irreversible changes risk in detector proprieties [CHP] . When TLD is irradiated at high doses not a negligible signal is saved in depth traps over the main

11
dosimetric peak. Therefore, some signal stays in such traps in TLD even after annealing at 240°C. Thus this residuum could be observed also by next reading out the TLD. Problem arises because of overlapping of both residuum and main dosimetric peak signal and consequent interferention and distortion of the true dose information. The residuum effect is shown on fig. 3. Set of pellets was repeatedly annealed, irradiated with the Cs-137 gamma dose of 0,391 mGy (detector-source distance was 2m) and read out. The annealing and reading procedure was at each time the same and its details are stated above. Figure shows the glow curve structure of the same pellets after one and four whole annealing-irradiation-reading cycles. Black and red lines correspond to the former, blue and green ones to the latter. After four cycles residuum is no more observable and the glow curve shape fully correspond to the standard one. This residuum arises from pellet last irradiation described in [RP] which reached few Gy. Similar residuum was observed in whole batch.
Figure 3 Effect of former irradiation with high doses – residuum Red, black – glow curve after one annealing cycles; blue, green line – after four annealings for pellet #45 and #46 respectively.
There was another observation made; glow curve structure of LiF:Mg,Cu,P strongly depends on cooling down rate after annealing. This was observed in both TLD 700H and MCP7. Figure 4 shows the differences in glow curve structure after post annealing cooling down on metal and glass plates. Of course, natural cooling down to ambient temperature takes places by different cooling rates for each material. Therefore, great attention has to be paid to carry out the post annealing cooling down each time in the same way.
Figure 4 Effect of post annealing cooling down rate. Pellets irradiated with 0,391mGy. Green,blue – glass plate cooling ; red, black – metal plate cooling
2.2. TLD 700 and TLD 600 LiF: Mg,Ti enriched on 7Li in case of TLD 700 or on 6Li for TLD 600 belongs to most standard dosimeters in TL praxis. This dosimeter is employed at ATI for many years and its

12
properties are good known. Within this work 5 pieces of 3,2 x 3,2 x 0,9 mm3 TLD 700 and 7 pieces of TLD 600 with the same dimensions was employed. Following procedure is standardly used for TLD 700 and 600: Annealing: 400°C for 1 hour, then slow cooling in oven to ambient temperature. Reading: 5°C/s up to 480°C.
2.3. TL Measurements on TRIGA reactor For reactor experiments TL chips were encapsulated in a system of two polyethylene capsules (see fig. 5) and irradiated in reflector channel (cca. 2 cm from core boundary) connected to fast pneumatic transfer system. This system enables insertion and removal time as low as 20 ms, therefore, such manipulations bring no additional error to measured value and very low measuring times like 5 seconds could be implemented. Hence irradiation of dosimeters during their transportation through the core should be neglected. To gain an informative estimation of doses in the fast post channel four TLD 700 chips were irradiated at maximal power level of 250 kW for 5 s. Measured dose was nevertheless too large to get any precise dose information, thus, only very rough estimation of 40 Gy could be made. For such doses application of LiF type TLDs seems to be unsuitable. To turn profit from TLD technique measurement should be carry out in low dose region. This is achievable by measuring at very low reactor powers. These, on the other hand have to be distinguishable above the background (fission product decay from former operation). To find an appropriate power level, following set of irradiation was to be carried out. Before reactor start up, gamma background was to be measured employing MCP7 and TLD 700H. After that capsules with coupled TLD 700 and 600 were irradiated at 10, 50 and 100 W for 5s. Additional measurement was made for MCP7 and TLD 700H at 10 W for 5s to test the shape of their glow curves in mixed (n,γ) field. Unfortunately background measurement failed because of fast transfer system malfunction. Results from TLD 700 and TLD 600 chips are shown in fig. 6 and 7 and table 2.
Figure 6 TLD 700 irradiated at 10 W (red, blue), 50 W (green, pink) and 100 W (black). One NG3 filter was used.
Figure 5 Capsules for reactor irradiation
13
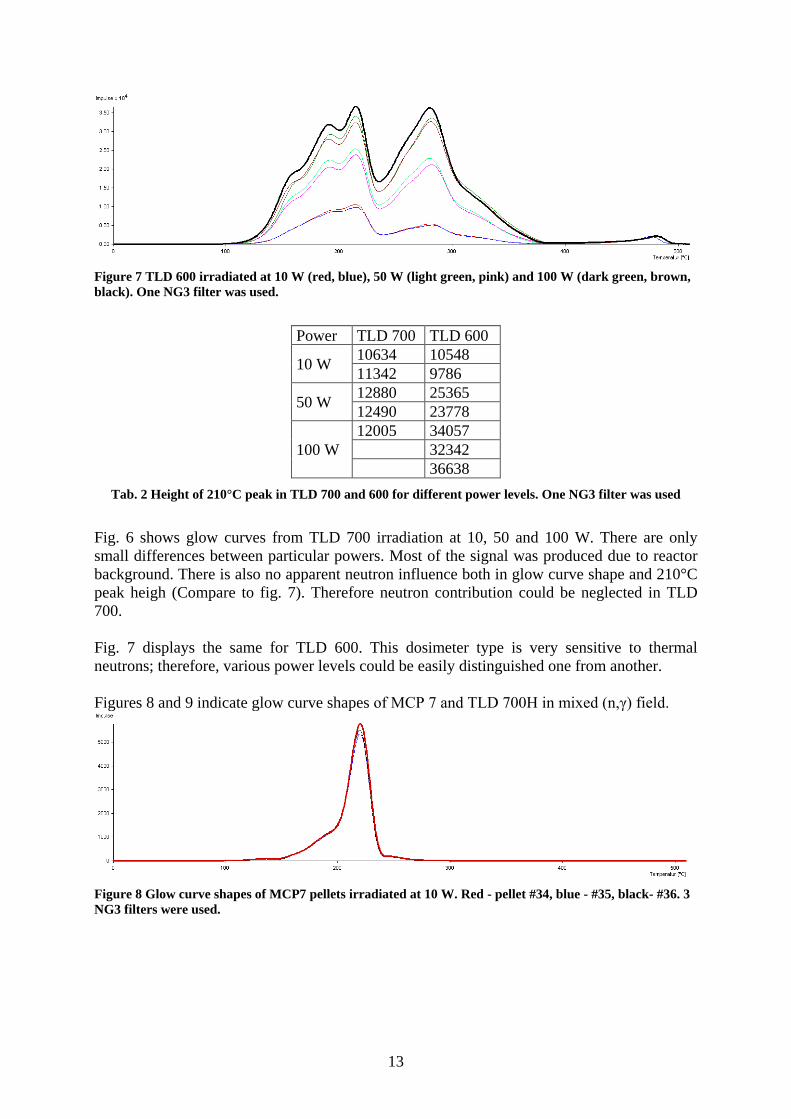
Figure 7 TLD 600 irradiated at 10 W (red, blue), 50 W (light green, pink) and 100 W (dark green, brown, black). One NG3 filter was used.
Power TLD 700 TLD 600
10 W 10634 10548 11342 9786
50 W 12880 25365 12490 23778
100 W 12005 34057 32342 36638
Tab. 2 Height of 210°C peak in TLD 700 and 600 for different power levels. One NG3 filter was used
Fig. 6 shows glow curves from TLD 700 irradiation at 10, 50 and 100 W. There are only small differences between particular powers. Most of the signal was produced due to reactor background. There is also no apparent neutron influence both in glow curve shape and 210°C peak heigh (Compare to fig. 7). Therefore neutron contribution could be neglected in TLD 700. Fig. 7 displays the same for TLD 600. This dosimeter type is very sensitive to thermal neutrons; therefore, various power levels could be easily distinguished one from another. Figures 8 and 9 indicate glow curve shapes of MCP 7 and TLD 700H in mixed (n,γ) field.
Figure 8 Glow curve shapes of MCP7 pellets irradiated at 10 W. Red - pellet #34, blue - #35, black- #36. 3 NG3 filters were used.

14
Figure 8 Glow curve shapes of TLD 700H chips irradiated at 10 W. Green - chip # 87, black - #88. 2 NG3 filters were used.
From the first set of reactor measurements following conclusions have been done:
1) It would be very difficult to distinguish measured gamma doses with TLD 700 at various power levels because of low signal-to-background ratio. Either higher powers or better statistics is needed.
2) Neutron contribution to TLD 700 signal could be neglected (Compare 210°C peak heights for TLD 600 and 700). Therefore TLDs 600 need not to be employed in further investigations.
3) Shapes of MCP7 and TLD 700H glow curves are not influenced by neutrons and correspond to such ones which are obtainable in pure gamma field.
Second set of reactor irradiations comprised three capsules with coupled MCP7 and TLD 700H (three dosimeters from each type in each sample) to be irradiated at 10, 50 and 100 W, and two capsules with TLD 700 to be irradiated at 500 W and 1 kW. Moreover measurement was also carried out before and after reactor operation. Unfortunately most of TLD 700H chips were destroyed most likely during transportation through fast post into experimental channel. Therefore only MCP 7 and TLD 700 results were taken into account and only for them calibration was carried out. Measured doses (i.e. with background from former reactor operation) for TLD 700 at 500 W and 1000 W in fast post channel of TRIGA reactor are summarized in table 3.
Imp. (Peak 210°C) Dose (mGy)
500 W chip #1 9417 734,86 chip #2 8592 670,48 chip #3 8980 700,75 average 8996,3 702,03 st. deviation 337,0 26,30 st. deviation (%) 3,75 3,75 1000 W chip #4 17056 1330,97 chip #5 17045 1330,11 average 17050,5 1330,54 st. deviation 5,5 0,43 st. deviation (%) 0,03 0,03
Tab. 3 Doses in fast post channel at different reactor powers (TLD 700)
15
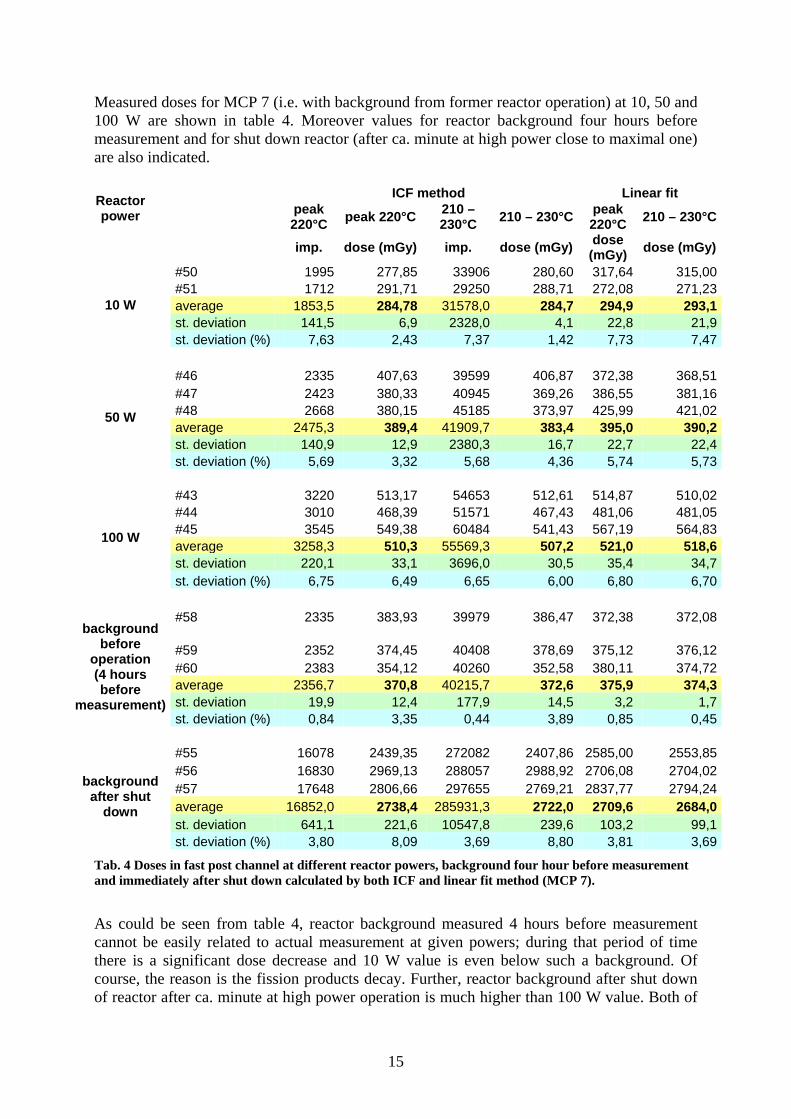
Measured doses for MCP 7 (i.e. with background from former reactor operation) at 10, 50 and 100 W are shown in table 4. Moreover values for reactor background four hours before measurement and for shut down reactor (after ca. minute at high power close to maximal one) are also indicated. Reactor power
ICF method Linear fit peak 220°C peak 220°C 210 –
230°C 210 – 230°C peak 220°C 210 – 230°C
imp. dose (mGy) imp. dose (mGy) dose (mGy) dose (mGy)
10 W
#50 1995 277,85 33906 280,60 317,64 315,00 #51 1712 291,71 29250 288,71 272,08 271,23 average 1853,5 284,78 31578,0 284,7 294,9 293,1 st. deviation 141,5 6,9 2328,0 4,1 22,8 21,9 st. deviation (%) 7,63 2,43 7,37 1,42 7,73 7,47
50 W
#46 2335 407,63 39599 406,87 372,38 368,51 #47 2423 380,33 40945 369,26 386,55 381,16 #48 2668 380,15 45185 373,97 425,99 421,02 average 2475,3 389,4 41909,7 383,4 395,0 390,2 st. deviation 140,9 12,9 2380,3 16,7 22,7 22,4 st. deviation (%) 5,69 3,32 5,68 4,36 5,74 5,73
100 W
#43 3220 513,17 54653 512,61 514,87 510,02 #44 3010 468,39 51571 467,43 481,06 481,05 #45 3545 549,38 60484 541,43 567,19 564,83 average 3258,3 510,3 55569,3 507,2 521,0 518,6 st. deviation 220,1 33,1 3696,0 30,5 35,4 34,7 st. deviation (%) 6,75 6,49 6,65 6,00 6,80 6,70
background before
operation (4 hours before
measurement)
#58 2335 383,93 39979 386,47 372,38 372,08
#59 2352 374,45 40408 378,69 375,12 376,12 #60 2383 354,12 40260 352,58 380,11 374,72 average 2356,7 370,8 40215,7 372,6 375,9 374,3 st. deviation 19,9 12,4 177,9 14,5 3,2 1,7 st. deviation (%) 0,84 3,35 0,44 3,89 0,85 0,45
background after shut
down
#55 16078 2439,35 272082 2407,86 2585,00 2553,85 #56 16830 2969,13 288057 2988,92 2706,08 2704,02 #57 17648 2806,66 297655 2769,21 2837,77 2794,24 average 16852,0 2738,4 285931,3 2722,0 2709,6 2684,0 st. deviation 641,1 221,6 10547,8 239,6 103,2 99,1 st. deviation (%) 3,80 8,09 3,69 8,80 3,81 3,69
Tab. 4 Doses in fast post channel at different reactor powers, background four hour before measurement and immediately after shut down calculated by both ICF and linear fit method (MCP 7).
As could be seen from table 4, reactor background measured 4 hours before measurement cannot be easily related to actual measurement at given powers; during that period of time there is a significant dose decrease and 10 W value is even below such a background. Of course, the reason is the fission products decay. Further, reactor background after shut down of reactor after ca. minute at high power operation is much higher than 100 W value. Both of

16
background measurements shows the necessity of proper measurement arrangement; i.e. it cannot be measured shortly after former higher power operation compare to that used for TL irradiation. If background value should to be taken into account it would have been gained as close to actual measurement as possible. Moreover, it is surely beneficial to hold experiments after the reactor is shut down for sufficient period of time or is operated at much lower power than needed for TL irradiation because of low background influence on actual measured value; most of short-live fission product decayed and background stays relatively constant through the measurement.
2.4. Evaluation of TRIGA results All irradiation of TL dosimeters in second set of reactor experiment was carried out within 10 minutes. Therefore reactor background should stays approximately at some constant level and crude measured values (i.e. without background subtraction) should be comparable.
0
200
400
600
800
1000
1200
1400
0 200 400 600 800 1000 1200
Reactor power (W)
Dos
e (m
Gy)
ICF linear fit
Graph 1 Comparison of gamma doses/5 sec at different reactor powers gained with different TL dosimeters type (background not subtracted); 10W, 50W and 100W - MCP 7 , 500 W and 1000W - TLD 700; ICF and linear fit method respectively are valid for MCP results only; for TLD 700 common calibration factor was applied. Uncertainties are at 3 σ level.
Obviously there are some discrepancies between MCP and TLD 700 results. When making a linear extrapolation of MCP results to 1000W1, the resulted dose is ca. two times higher than that for TLD 700. On the contrary, extrapolation of TLD 700 results to 100 W2
1 MCP linear fit formula Dose (mGy) = 2,5024 x reactor power (W)+ 261,36 was obtained from ICF results for 220°C peak height. 2 TLD 700 linear fit formula is : Dose (mGy) = 1,257x reactor power (W)+ 73,522
shows ca. 2,5 times lower value comparable to MCP 7 measurement. Moreover, there are substantial differences when extrapolating both MCP and TLD 700 results to zero value, i.e. to

17
background one (261,4 mGy/5s for MCP 7, 73,5 mGy/5s for TLD 700). Some possible factors for explaining such a phenomenon are stated below. - For MCP measurement there are relatively small signal-to-background ratio; i.e. it is not
an easy task to distinguish between background and actual signal belonging to given dose. This together with standard deviation of ca. 5% at 1σ level makes these results generally not reliable.
- There are some slight differences between these two TL dosimeter types, especially different shape of photon energy dependence curve.
- Measurements were carried out to close after reactor reached desired power level, i.e. in strongly non-saturated state of delayed gamma emission, which could contribute significantly to total gamma dose at given position in reflector. Each irradiation took only 5 s, therefore, supposing the course of delayed gamma rays saturation differs significantly half a minute and one and half a minute after reaching desired power, it is clear that also total gamma dose would be different in some way.

18
2.5. Calibration of TLDs for reactor measurements Calibration of TLDs took place in AKH with Co-60 Theratron gamma source. Dosimeters were placed in polystyrene holder and irradiated in distance greater than 1 meter from the source of radiation. Dosimeters were calibrated in energy dose in water units. First of all dose rate at irradiation position was measured through IC 2570/1 Farmer Dosemeter A ionisation chamber. From this value times needed to achieve desired doses was calculated. Then, TLDs were irradiated by required doses. Simultaneously, real doses were determined via ionisation chamber. There are two possibilities how to determine energy dose in water [Doc].
1) via calibration factor transforming reading of device to energy dose in water It holds
MNkD wtpw ⋅⋅= , , where Dw is energy dose in water, kp,t pressure and temperature correction factor,
0
0, T
Tppk tp ⋅=
with p0 = 1013 mbar and T0 = 293,15K Nw calibration factor transforming reading of device to energy dose in water, for used device Nw = 1,06 ± 0,01 M reading of device Therefore for energy dose in water states
MNTT
ppD ww ⋅⋅⋅=
0
0
2) via Air Kerma
For air kerma Ka holds similarly
MNkD ktpa ⋅⋅= , , where Nk via calibration factor transforming reading of device to energy dose in water,

19
for used device Nk = 0,97 ± 0,01 Energy dose in water should be expressed as
a
a
en
w
en
a
a
en
w
en
w KDD ⋅
≈⋅
=
ρµρµ
ρµρµ
where w
en
ρµ ,
a
en
ρµ are mass attenuation coefficients in water and air respectively.
For Co-60 (gamma emissions at 1,1731 MeV and 1,3325 MeV, i.e. E = 1,25 MeV ) holds
gcmw
en /10961,2 22−×=
ρµ
, gcma
en /10662,2 22−×=
ρµ
Thus
MNTp
KD kaw ⋅⋅⋅⋅=⋅≈15,293
1013112,1112,1
where p = h – Δ , with Δ= Δ(T) and h is reading of barometer in mbar. Therefore
MNmbarh
KTD kw ⋅⋅∆−
⋅≈)()(8426,3
Table 4 shows dose rate at irradiation position determined by both methods. Irradiation time (s)
Dw (mGy) Dose rate (mGy/s) Dose ratio (via Nw/ via Air kerma) M (Gy) via Nw via Air Kerma via Nw via Air Kerma
60 0,1905 232,42 236,51 3,87 3,94 0,983 60 0,1907 232,67 236,76 3,88 3,95 0,983 60 0,1907 232,67 236,76 3,88 3,95 0,983
average 3,88 3,94 0,983
Tab. 5 Calibration set up
It could be seen that both methods differs one from another by less than 2 %. For calibration purposes it was decided to use determination of gamma doses via air kerma.

20
The aim of calibration was to obtain ICFs for MCP 7 TL dosimeters used in reactor experiment, to check their linearity in dose regions expected for that experiment and to earn calibration factor for TLD 700; ICFs could not be implemented in case of TLD 700 chips because these were not numbered. Thus it could not be distinguished one from others.
2.5.1. Calibration of MCP 7 To prevent troubles with residual signal (see 2.1) annealing procedure of MCP 7 detectors was repeated for five times. Linearity check of MCP 7 dosimeters was carried out for doses of 48,05, 151,72, 200,76 and 247,31 mGy. Reading out the dosimeters was executed in the same setup as for reactor experiment, i.e. 3 NG3 filters were used. Therefore no additional error due to uncertainty of filter factors was adopted. Results are summarized in table 5.
Dose (mGy)
Pellet nr.
Imp. (peak 220°C)
Imp. (210°C - 230°C)
48,05 #36 293 5107 48,05 #37 338 5682 48,05 #49 362 6144 48,05 #50 345 5806 48,05 #51 282 4868
average 324 5521,4 st. dev. (1σ) 31,00 467,56 st. dev. % 9,57 8,47
151,72 #43 952 16176 151,72 #44 975 16739 151,72 #45 979 16949 151,72 #55 1000 17144 151,72 #56 860 14622 151,72 #57 954 16308
average 953,3 16323 st. dev. (1σ) 44,8 832,09 st. dev. % 4,69 5,10
200,76 #46 1150 19539 200,76 #47 1279 22261 200,76 #48 1409 24257 200,76 #58 1221 20768 200,76 #59 1261 21422 200,76 #60 1351 22924
average 1278,5 21861,8 st. dev. (1σ) 84,07 1517,12 st. dev. % 6,58 6,94
247,31 #31 1456 24688 247,31 #32 1531 26278 247,31 #33 1700 28942 247,31 #34 1602 27412 247,31 #35 1496 25405
average 1557 26545 st. dev. (1σ) 86,11 1504,44 st. dev. % 5,53 5,67
Tab. 6 Calibration of MCP 7
21
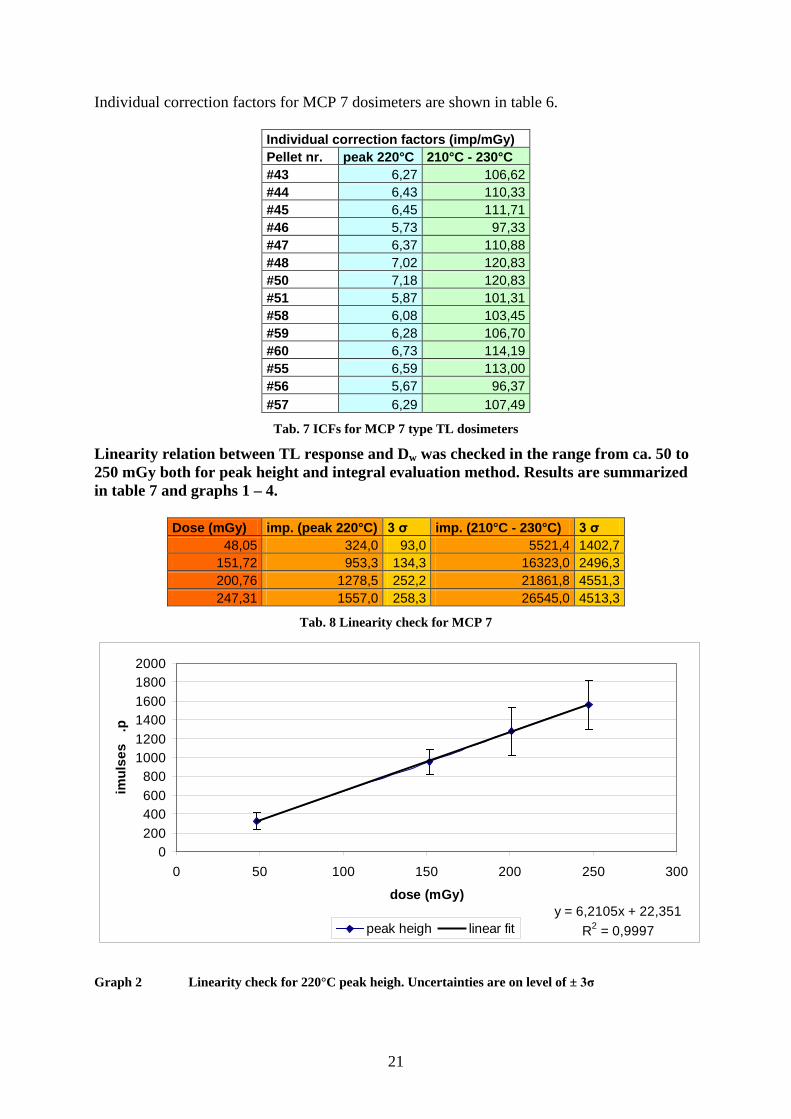
Individual correction factors for MCP 7 dosimeters are shown in table 6.
Individual correction factors (imp/mGy) Pellet nr. peak 220°C 210°C - 230°C #43 6,27 106,62 #44 6,43 110,33 #45 6,45 111,71 #46 5,73 97,33 #47 6,37 110,88 #48 7,02 120,83 #50 7,18 120,83 #51 5,87 101,31 #58 6,08 103,45 #59 6,28 106,70 #60 6,73 114,19 #55 6,59 113,00 #56 5,67 96,37 #57 6,29 107,49
Tab. 7 ICFs for MCP 7 type TL dosimeters
Linearity relation between TL response and Dw was checked in the range from ca. 50 to 250 mGy both for peak height and integral evaluation method. Results are summarized in table 7 and graphs 1 – 4.
Dose (mGy) imp. (peak 220°C) 3 σ imp. (210°C - 230°C) 3 σ 48,05 324,0 93,0 5521,4 1402,7
151,72 953,3 134,3 16323,0 2496,3 200,76 1278,5 252,2 21861,8 4551,3 247,31 1557,0 258,3 26545,0 4513,3
Tab. 8 Linearity check for MCP 7
y = 6,2105x + 22,351R2 = 0,9997
0200400600800
100012001400160018002000
0 50 100 150 200 250 300
dose (mGy)
imul
ses
.p
peak heigh linear fit
Graph 2 Linearity check for 220°C peak heigh. Uncertainties are on level of ± 3σ

22
y = 0,161x - 3,5545R2 = 0,9997
0
50
100
150
200
250
300
0 200 400 600 800 1000 1200 1400 1600 1800
impulses
dose
(mG
y)
Graph 3 Calibration curve for 220°C peak height
y = 105,98x + 398,74R2 = 0,9997
0
5000
10000
15000
20000
25000
30000
35000
0 50 100 150 200 250 300
dose (mGy)
impu
lses
.
integral Linear fit
Graph 4 Linearity check for integral from 210°C to 230°C. Uncertainties are on level of ± 3σ

23
y = 0,0094x - 3,7195R2 = 0,9997
0
50
100
150
200
250
300
0 5000 10000 15000 20000 25000 30000
impulses
dose
(mG
y)
.
Graph 5 Calibration curve for integral from 210°C to 230°C.
To prove the correctness of ICF method, its results were checked against linear fit shown in graphs 2 and 4. Obviously ICFs are within 13% accordance with linear fit both for peak height and integral from 210°C to 230°C.
Comparison of doses gained by ICF and linear fit method
Pellet # (ICF/ lin_fit) for peak 220°C (ICF/ lin_fit) for 210-230°C #50 0,87 0,89 #51 1,07 1,06 #46 1,09 1,10 #47 0,98 0,97 #48 0,89 0,89 #43 1,00 1,01 #44 0,97 0,97 #45 0,97 0,96 #58 1,03 1,04 #59 1,00 1,01 #60 0,93 0,94 #55 0,94 0,94 #56 1,10 1,11 #57 0,99 0,99
Tab. 9 ICFs vs. linear fit method

24
2.5.2. Calibration of TLD 700 As stated above for TLD 700 only common calibration factor was determined. Similar to MPCs also for TLD 700 the same readout arrangement as that used in reactor experiment was applied, i.e. 1 NG3 filter. Results are summarized in table 9.
Chip nr. Peak height #1 13709 #2 12971 #3 12665 #4 12461 #5 12287 average 12818,60 st. dev. 500,02 st. dev. % 3,90 irradiation dose (Gy) 1,0003 f (imp/Gy) 12814,76
Tab. 10 Calibration of TLD 700
Therefore, doses were calculated according to following relation
fheight)(peak impulses of nr.
=wD ,
where f is common calibration factor in imp/Gy.

25
3. Conclusions Thermoluminescent measurement of gamma dose in fast post channel of TRIGA reactor was executed. For investigation purposes following types of TL dosimeters were employed: MCP 7, TLD 700H, TLD 600 and TLD 700. First of all MCP 7 was tested against TLD 700H, residuum effect of and effect of different cooling conditions was examined. For both of these LiF:Mg,Cu,P dosimeters great care have to be paid to annealing procedure to gain reproducible results. Especially, cooling down rate after annealing should change the glow curve shape significantly. Residuum problems could be avoided by annealing the dosimeters for several times. Next, a set of measurements was carried out to found optimal signal-to-background ratio, i.e. to found optimal reactor power for TL irradiation. This power should be low enough to take profit from TL method and high enough to be distinguishable from reactor background. Moreover, glow curve shapes of MCP 7, TLD 700H and TLD 700 were tested in mixed (n,γ) field and sensitivity of TLD 700 to thermal neutrons was observe in qualitative way; i.e. by irradiating coupled TLD 700 and TLD 600 chips at different power levels. It could be stated that no differences between MCP 7, TLD 700H and TLD 700 glow curve shapes were found comparable to similar shapes in pure gamma field. Also, neutron contribution to TLD 700 TL signal is negligible. Further, gamma dose in fast post channel was measured by MCP 7, TLD700H and TLD 700 dosimeters. Unfortunately, most of TLD 700H chips were crashed most likely during transportation into the core by fast post and hence their results are missing. MCP 7 pellets were irradiated at 10, 50 and 100 W, TLD 700 chips at 500 and 1000 W. There are some discrepancies in MCP 7 and TLD 700 results, i.e. extrapolation of MCP 7 to 1000 W gives ca. two times higher doses comparable to TLD 700. Also extrapolations of both MCP 7 and TLD 700 measured value to zero power, i.e. to reactor background differs significantly. Dose rates at 1000 W for TLD 700 was determined 266,113
Supposing linear relation holds between gamma dose and reactor power, background from former operation could be easily subtracted. Then dose rate related to TLD 700 at 1000 W is 251,4 ± 10,5 (1σ) mGy/s. For MCP 7 at 100 W gives this procedure the value of dose rate equal to 48,9
± 0,09 (1σ) mGy/s and for MCP 7 at 100 W as 102,86 ± 6,70 (1σ) mGy/s (both without subtracting reactor background).
4
Generally, many valuable experiences on TL dosimetry in reactor environment were gained. Through some inconsistency in measured values estimation of gamma dose rates in reflector of TRIGA reactor was obtained.
± 14,1 (1σ) mGy/s. However there are some doubts about linear relation, especially due to quite a different predicted background for each dosimeter type. Although, only five TLD 700 chips were used in this investigations, its results seems more reliable, particularly due to high uncertainty of MCP 7 results with subtracted background.
3 This value was obtained as an average of four results (ICF and linear fit for 220°C peak height and integral from 210-230°C) 4 Value was gained as an average of ICF method for 220°C peak height and integral from 210-230°C. For background separation 50 and 100 W values was applied.

26
Acknowledgement
I would like to express my thanks to my local advisor Dipl.Ing. Dr. Michael Hajek and ADir.Ing. Manfred Fugger for their continuous support and for many valuable remarks concerning my work and Dipl.Ing. Johannes Sterba for providing reactor irradiation of TLDs in fast post channel.
27
Sources: [LUE] A. Lüthi: Development and Validation of Gamma-Heating Calculational Methods for Plutonium-Burning Fast Reactors, EPFL, Lausanne 1998 [NPL] national physical laboratory UK web site, state 26.1.2007
http://www.kayelaby.npl.co.uk/atomic_and_nuclear_physics/4_7/4_7_1.html [CHP] Y.S. Horowitz, LiF:Mg,Ti Versus LiF:Mg,Cu,P: The Competition Heats Up, Radiation Protection Dosimetry 47:135-141 (1993) [McK] S.W.S. McKeever: Thermoluminescence of solids, Cambrige: Univ. Press, 1985 [RP] T. Bílý: Experimental Examination of Methodology of Gamma Filelds Measurements by TL Dosemetres (in Czech), research project, DNR FNEPS in Prague, 2006 [Doc] Documentation for Co-60 THERATRON irradiator at AKH in Vienna