thermoluminescence dating of minerals — traps for the unwary
TRANSCRIPT
Journal of Electrostatics, 3 (1977) 281--288 281 © Elsevier Scientific Publishing Company, Amsterdam -- Printed in The Netherlands
T H E R M O L U M I N E S C E N C E D A T I N G O F M I N E R A L S - - T R A P S F O R THE U N W A R Y
A.G. WINTLE
Research Laboratory for Archaeology, Oxford University, 6 Keble Road, Oxford (Gt. Britain)
Summary
Minerals with well-defined TL peaks are likely candidates for archaeological dating ma- terials; they are short-listed by a trap depth measurement using the initial rise method. But experience shows that this test alone is inadequate to guarantee stability. It is vital to subject apparently satisfactory materials to further kinetic analysis. For example, for a sample of labradorite feldspar which has a broad TL peak centred at about 320 ° C, the initial rise method gave associated trap depths of 1.6 -+ 0.2 eV. However, after storage at 10°C for 25 hours, only 50% of the TL obtained immediately after irradation was mea- sured. This instability, termed anomalous fading, was found to occur for feldspars in re- cent lava, and resulted in extremely low ages being determined for dated flows. Anoma- lous fading was also found in samples of zircon and fluorapatite.
Initial rise analysis of the 325°C peak in a quartz sample gave a trap depth of 1.05 -+ 0.03 eV indicating a meanlife at 20 ° C of only 200 years. However, the dating programme carried out on quartz inclusions with this TL peak show that it has experienced negligible loss of electrons during the 1900 years since firing. Isothermal decay and the study of peak temperature with heating rate gave trap depths of 1.7 -+ 0.1 eV and 1.69 -+ 0.02 eV, respectively. The discrepancy between these values and that obtained by the initial rise method was conclusively shown to be due to thermal quenching of the luminescence cen- tres.
The criterion for acceptable dating materials should be good agreement between several methods of analysis, as is exemplified by corroborated dating, for a well-defined peak in calcite. A peak occurring at 275°C occurs in most samples of crystalline calcite, the initial rise method and the peak shift with temperature trap-depth procedure give 1.75 _+ 0.03 eV for all the samples.
1. I n t r o d u c t i o n
During the past fifteen years, a thermoluminescent (TL) dating method has been developed to determine the age of pottery. Two techniques have evolved in parallel with each other utilizing the appropriate radiation dosi- metry for differing grain sizes in the pot, namely, fine grains (2--8 micron diameter) which are a mixture of feldspars, quartz and clay minerals and quartz inclusions (95--125 micron diameter). In the last three years, a dating technique using zircon grains has also been developed [1] which makes use

282
of their high uranium content. Many minerals have been shown to exhibit TL [2] but the TL characteristics relevant to the dating of quartz alone have been studied extensively [3]. The more common TL minerals are given in Table 1.
Before the present TL dating methods can be applied to a new mineral the stability of its TL over archaeological time must be established by kinetic studies. To obtain the activation energy for a particular TL glow peak, it is usual to employ the initial rise method. The activation energy obtained in this way can be combined with the glow peak temperature and heating rate to predict the long term stability of the trapped charge carriers giving rise to the peak.
Experience shows that this test alone is inadequate to guarantee stability and it is vital to subject apparently satisfactory materials to further kinetic analysis. In this paper, two phenomena which affect such studies are report- ed; these effects are not peculiar to geological materials and are of relevance to all TL studies. Detailed studies are also reported of a particular glow peak in calcite which showed consistent activation energy analysis in agreement with the long-term stability shown by geological samples.
2. Anomalous fading
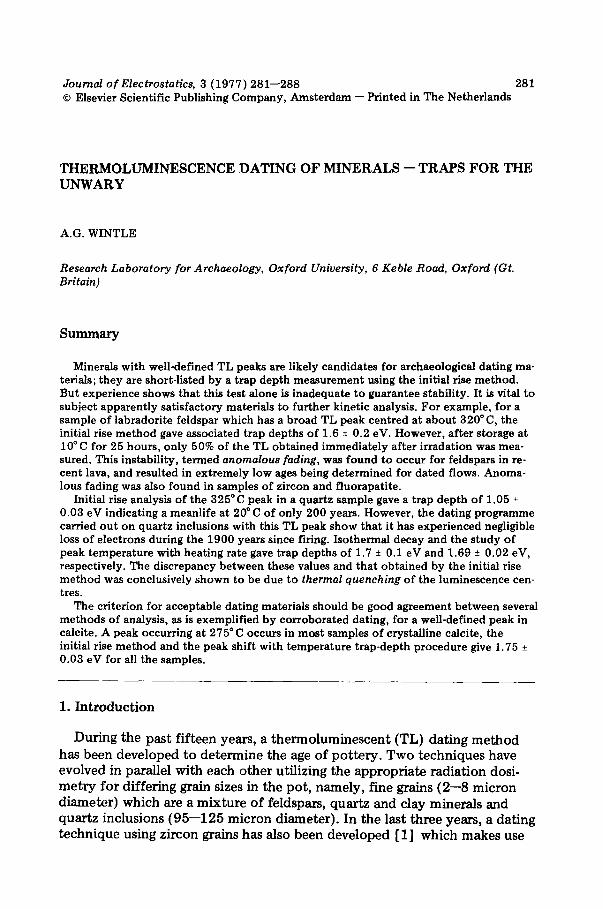
During an attempted dating study of recent volcanic lava, short-term in- stability of the high temperature TL was found and this loss of TL was term- ed "anomalous fading" [4]. This instability was confirmed by obtaining ages that were up to an order of magnitude too young compared with their known ages when conventional TL dating techniques were applied [5]. Sim- ilar loss of TL from laboratory irradiated samples have been reported for lunar samples [6]. As the major part of the TL in both lava and lunar sam- ples is due to feldspars, a sample of the plagioclase feldspar labradorite was studied in detail.
A typical glow curve is shown in Fig. l(a), while Fig. l(b) shows the per- centage of TL at a glow curve temperature of 300°C after the sample has been stored at 10°C. When the initial rise method was applied below the broad peak centred at 320°C (heating rate, 6°C s- 1 ) trap depths of 1.6 + 0.2 eV were obtained implying more than adequate stability for dating lavas less than 50,000 years old.
TABLE 1
Thermoluminescent minerals
quartz flint calcite limestone feldspars clays zircon fluorapatite
283
However, when isothermal decay curves were obtained for storage tem- peratures between - 1 8 and 157°C, two exponential decay components were found. Plots of their mean lives as a function of reciprocal temperature gave activation energies of 0.19 + 0.01 and 0.31 -+ 0 .02 eV for the two compo- nents. The isothermal decay curves predict stability of over a million years at liquid nitrogen and liquid helium temperatures, 77 and 20 K, but 22% loss of TL was found in 10 hours at both these storage temperatures. Further stud- ies showed that "anomalous fading" is non-radiative and also that it does not vary with the type of ionizing radiation used.
From the experimental data, three mechanisms have been proposed as likely explanations for "anomalous fading":
(a) defect diffusion, allowing non-radiative escape of the trapped electrons when the diffusing defect encounters a trapping site;
(b) direct transfer of an electron from a trap to a centre. In the tempera- ture range - 18 to 157°C, thermally assisted transfer occurs followed by non- radiative recombination. The temperature dependence is of the form ~-1 = A exp (-B/kT) where T (S) is the mean life for storage at a temperature T(K), B is the activation energy (eV) and A is the pre-exponential factor (s- 1 ) which, for the two decays analysed here, is many orders of magnitude below those associated with normal thermal activation processes; typically A ~ 1
E"
~ - o
(a)
100 200 300 4 0 0 T (°C)
100 (b)
(1) 13~ hrs
( i i ) 24 hrs
0 100 200 300 400 T (°C)
Fig. 1 (a) TL glow curve for labradorite after beta irradiation. (b) % TL left after storage at 10°C for lSA and 24 hours.

284
s -1 . This may be thought of as the product of a pre-exponential factor of order 1014 s -1 connected with the thermal activation energy B and a factor of order 10-14 determined by the probabil i ty of an electron tunnelling through a potential barrier to the recombination centre. At lower tempera- tures, decay still occurs, and this may be explained by a direct transition through the forbidden gap which needs no thermal activation, or by the thermal dependence of the activiation energy B;
(c) decay of available activated luminescence centres, resulting in a de- crease in the probabil i ty of luminescence being produced by an electron when released from its trap during a glow curve by electrons being thermally excited from the valence band. Again, the temperature dependence is of the form r -1 = A exp ( - B / k T ) where B, the activation energy, is that needed to excite an electron from the valence band. The very low value of A allows a substantial proport ion of the centres to remain activated during the glow curve. At low temperatures, one is forced to turn to the previously suggested temperature dependence of the activation energy B.
TL alone is unable to differentiate between these models. Models (b) and (c) are the most likely, however, and since traps are no t involved in (c) an alternative way of measuring the trapped electron population, e.g. ESR, TSEE and TSC, should not show fading if (c) holds. Such studies have been used in an a t tempt to circumvent the effect of anomalous fading in dating. These involve re-excitation of TL by U.V. illumination and studies on sam- ples of fluorapatite and zircon, which also exhibit "anomalous fading" are reported elsewhere in these proceedings [ 7].
3. Thermal quenching
When quartz grains are heated at 20°C s -1 , two TL peaks occur between 300 and 400°C. In his Romano-British dating programme, Fleming [8] has shown that the natural dose recorded by the lower peak, 325 ° C, was within 2.5% of the values obtained for the 375°C peak which was used for dating; this implies negligible thermal untrapping of electrons from the 325°C traps during the 2,000 years since firing. On the other hand, using an initial-rise determination of the trap depth for the 325°C peak, and the associated pre- -exponential factor, gave a mean life at 20°C of only 3,000 years [9] . This discrepancy was found to be due to thermal quenching of the luminescence centres used by the 325°C peak [10] .
Using a first-order kinetic theory, it is possible to show the effect of ther- mal quenching on the various methods of trap depth determination. If the number of trapped electrons at time t is n, then the TL intensity, I, during a glow curve is given by
I = - C d n / d t = C n s exp ( - E / k T ) , (1)
where C is the luminescence efficiency and is assumed constant, E is the acti-

285
vation energy (eV), s is the pre-exponential factor (s- ' ) and T is the glow curve temperature (K). During the initial part of the glow curve, n is virtual- ly constant and hence a plot of In I versus T -~ is linear and has a slope pro- portional to E; this is the basis of the initial-rise technique.
However, when thermal quenching occurs, C is no t a constant and is of the form
1 C(T) = I + g exp (- W/kT), (2)
where W is an energy depth characterising the non-radiative process and K is a dimensionless constant. When K exp (- W/kT) is large, C converges to K -' exp (W/kT) and hence eqn. (1) becomes
I = n s K -1 exp [- (E;TW) 1, (3)
and hence a plot of In I versus T -1 is still linear but has a slope proportional to ( E - W).
The first-order kinetic behaviour of the 325°C was confirmed by the lin- earity of a plot of In I/n versus T -1 and hence isothermal decay measure- ments were also made. The mean life T, at a temperature T, of a trapped elec- tron is given by
r = s -l exp (E/kT), (4)
and hence E can be obtained from a plot of In r versus T -~ . This technique is independent of the luminescence efficiency and is solely dependent on the rate of untrapping of electrons.
Another method that is independent of C is that developed by Hoogen- straaten that uses the relationship between peak temperature T m (K) and heating rate ~ (°C s -~ ) [11]. Differentiation of eqn. (1) with respect to T gives
- - 7 exp , (5)
and hence E can be obtained from a plot of In ~Tr~ versus T ~ . These three methods of trap depth determination were applied to an ar-
chaeological quartz sample which had a 325°C peak giving the following re- sults:
(a) initial-rise : E = 1.05 -+ 0.03 eV (b) isothermal decay : E = 1.70 -+ 0.1 eV (c) Hoogenstraaten's : E = 1.69 -+ 0.02 eV These results show the effect of thermal quenching on initial-rise measure-
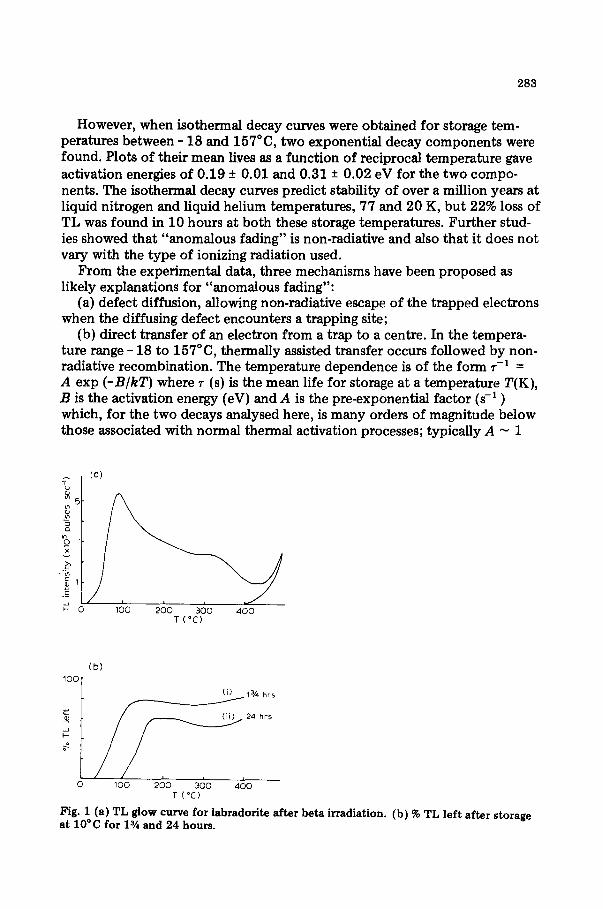
ments and enable the energy depth characterising the non-radiative process at the luminescence centre to be obtained: W -- 1.69 -- 1.05 = 0.64 eV. This was confirmed by observing the prompt luminescence (RL) during irradiation with a 90 Sr/90 y beta source. Figure 2 shows In RL plotted versus T -1 and also In C = In [1 + K exp (- W/kT)] versus T -1 for W -- 0.64 eV and K = 2.8 × 10 7 .

2 8 6
From this study, it can be seen that the initial-rise method of trap depth determination cannot be applied alone in order to predict TL stability. For a trap depth of 1.05 eV as given by the initial-rise method, a pre-exponential factor factor of order 108 s -~ was obtained using eqn. (5), and using this in eqn. (4) a mean life of 200 years at 20°C was predicted. However, using the trap depth E = 1.69 eV determined by Hoogenstraaten's method, a pre-exponential fac- tor of order 1014 s -~ was obtained giving a mean life of 3 × 10⁷ years at 20 ° C. Hence, use of the initial-rise method alone would cause this peak to be considered unsuitable for use in archaeological dating studies.
4. First-order kinetic behaviour
The TL properties of a range of calcites have been investigated as part of a dating feasibility study. Most of the crystalline calcite specimens had well- -defined peaks including one at 275 + 2°C in a glow curve when a heating rate of 5°C s -1 was used. Two other peaks often occurred at higher tempera- tures but they do not have a satisfactory dose response for dating. Kinetic studies of the 275°C peak have been carried out on small samples used in the dating study, the initial-rise method being most commonly used. Table 2 gives the results of trap depth determinations for six samples under study; the trap depths obtained agree between samples and also between methods.
In one sample, 26 h l , the 275°C peak had a width at half height of 36°C which agrees well with the calculated half width for a first-order kinetic peak at 275°C for a heating rate of 5°C s -1 having a trap depth of 1.75 eV. For
1.0 ~ ^ ^ ^ ~
/ O,8
0.6 C
0.,4 /
0.3 /
0,2
} 0.1 / 0.8
T -I x 10 ~ (K-*) Fig. 2. Theoret ica l p lo t o f In C v e r s u s T -~ fo r K = 2 .8 X 107 a n d W = 0 . 6 4 eV; the crosses a re e x p e r i m e n t a l v a l u e s o f R L a t 4 6 5 n m v e r s u s T -~ .

287
this sample, it was possible to obtain the trap depth from the phosphores- cence decay curves obtained at various holding temperatures. In most of the o ther samples, the peak is broader, suggesting a distribution of trap depths, and, for this reason, the isothermal decay me thod could no t be applied; this could also account for the slight but significant variations in the energies in Table 2.
The occurrence of so deep a trap at such a low glow curve temperature is unusual when compared with quartz, for example. Using the peak tempera- ture 275°C, heating rate 5°C s -I and trap depth 1.75 eV, a pre-exponential factor 4 X 10 Is s -1 is obtained and the mean lives at various temperatures may be calculated and are given in Table 3. A check of this long-term stabili- ty is being provided by the dating study carried out on known age calcite.
5. Conclusions
Before a dating project can be a t tempted, the first criterion that must be met is tha t the sample should exhibit a TL peak that is sufficiently stable. The above studies have shown that more than one me thod of kinetic analysis must be applied to each new mineral in order to be sure tha t meaningful trap depths are obtained. Such a comment also applies to kinetic studies on o ther TL materials.
TABLE 2
Results of trap depth analyses of crystalline calcite
Oxford Provenance Peak Heating Method Trap depth TL ref temperature rate (eV)
(°C) (K s -~ )
26 hl Gavel Pot, 275 5.0 1 1.77 + 0.03 Yorkshire 2 1.75 + 0.05
3 1.74 +- 0.03 26 gl Orgnac, 275 5.0 1 1.75 + 0.03
France 26 fl Majorca, 274 5.0 1 1.79 + 0.03
Spain 2 1.60 + 0.2 126 m2 Korsnas, 276 5.0 1 1.69 ~-1.80
Finland 2 1.77 + 0.2 126 p2 Alberta, 274 5.0 1 1.72 -+ 0.03
Canada 2 1.80 + 0.2 126 p17 Kentucky, 275 5.0 1 1.73 -+ 0.03
U.S,A.
Methods: 1 initial rise; 2 Hoogenstraaten, peak shift with heating rate; 3 phosphorescence decay.

288
TABLE 3
Calculated mean lives for a peak at 275°C for a heating rate of 5°C s -~ and having a trap depth of 1:75 eV
Temperature (°C) Mean life (x 106 years)
0 1500 5 390
10 110 15 31 20 9 25 3
Acknowledgements
This work forms part of a research project financed by the Nuffield Foun- dation; it follows initial investigations during which I was supported by a NERC research studentship.
References
1 S.R. Sutton and D.W. Zimmerman, Archaeometry, 18 (1976) 125. 2 D.J. McDougall, in D.J. McDougall (Ed.), Thermoluminescence of Geological Materi-
als. Academic Press, New York, 1968, p. 527. S.J. Fleming, D. Phil Thesis, Oxford University, 1969. A.G. Wintle, Nature, 245 (1973) 143. A.G. Wintle, D. Phil Thesis, Oxford University, 1974. G.F.J. Garlick and I. Robinson, in S.K. Runcorn and H.C. Urey (Eds.), The Moon, Symposium IAU, Reidel, Dordrecht, The Netherlands, 1972, p. 324. I.K. Bailiff, S.G.E. Bowman, S.F. Mobbs and M.J. Aitken, in these Proceedings, p. 269; J. Electrostatics, 3 (1977) 269. S.J. Fleming, Archaeometry, 12 (1970) 133. M.J. Aitken and S.J. Fleming, in F.H. At t ix (Ed.), Topics in Radiation Dosimetry, Suppl. 1 Academic Press, New York, 1972, p. 1--78.
10 A.G. Wintle, Geophys. J.R. Astron. Soc., 41 (1975) 107. 11 W. Hoogenstraaten, Philips Res. Rep., 13 (1958) 515.
3 4 5 6
8 9