thermatel mass flow measurement technical … applies a correction in the flow measurement based...
TRANSCRIPT

Thermatel®Thermal Dispersion Mass Flow
Measurement Handbook


Table of Contents
Introduction ....................................................................................................1
What is Mass Flow Measurement?...................................................................1
Types of Flow Transmitters ..............................................................................4
Differential Pressure.........................................................................................4
Orifice .............................................................................................................4
Venturi ............................................................................................................6
Averaging Pitot Tube .......................................................................................7
Vortex Shedding ..............................................................................................7
Turbine Flow Meters .......................................................................................8
Ultrasonic Flow ...............................................................................................9
Coriolis............................................................................................................9
Pressure/Temperature Correction...................................................................10
Multi-Variable Transmitters ...........................................................................10
Thermal Mass Flow.......................................................................................11
Different Types of Thermal Mass Flow Meters ..............................................13
Response Time. .............................................................................................14
Temperature Compensation ..........................................................................15
Pressure Effects ..............................................................................................17
Calibration ....................................................................................................18
Calibration vs. Configuration ........................................................................18
Accuracy ........................................................................................................19
Flow Profile ...................................................................................................19
Installation Options.......................................................................................23
Accuracy vs. Repeatability .............................................................................24
Limitations of Technology .............................................................................25
Applications...................................................................................................26
Difficult Applications ....................................................................................27
Unique Features.............................................................................................28
Reference.......................................................................................................29
Common Conversion Factors ........................................................................30
Gas Density at Standard Conditions .............................................................31

1
Introduction
Accurate mass flow measurement of gas is difficult to obtain. The main reasonis that gas is a compressible fluid. This means that the volume of a fixed massof gas depends upon the pressure and temperature it is subject to.
Consider a balloon containing one actual cubic foot of gas at room tempera-ture (70° F) and atmospheric pressure. An increase in the room temperaturecauses the balloon to expand. An increase in the pressure surrounding the bal-loon results in a decrease in volume. Although the volume of the balloonchanges with variations in pressure and temperature, the mass of the gas insidethe balloon has remained the same. This illustrates how pressure and tempera-ture affect the actual volume.
There are many well established methods of measuring the actual volumetricflow rate. However, the measured flow rate will vary with changes in tempera-ture and pressure. For virtually all industrial process operations, the user wantsto measure the mass flow rate instead of the actual flow rate. Chemical reac-tions work on the basis of mass relationships of ingredients. Combustion isbased upon the mass flow rate of the air and the fuel. Gas consumption in afacility is based upon mass flow rate. To accurately measure mass flow, theactual flow rate must be adjusted to correct for any change in temperatureand pressure.
Thermal mass flow technology is a method of gas flow measurement that doesnot require correction for changes in process temperature or pressure. Thermalmass flow technology also has a benefit of measurement at low velocities andgreater turndown capabilities than those obtainable with other flow measure-ment devices.
What is Mass Flow Measurement?
Mass Flow is the measurement of the flow rate without consideration of theprocess conditions. Mass flow is equivalent to the actual flow rate multipliedby the density. M = Q × where Q is the actual flow and is the density. Asthe pressure and temperature change, the volume and density change, howeverthe mass remains the same.
To obtain standardization of gas flow measurement, Standard conditions ofTemperature and Pressure (STP conditions) are utilized. Gas flow measured atSTP conditions is corrected from the actual process conditions to standardconditions; this will be discussed in more detail later.
Turndown = Normal Maximum FlowMinimum Measurable Flow

2
The simplest way of measuring mass flow of gas is in units of cubic feet perminute or cubic meters per hour, corrected to STP conditions. This is referredto as SCFM (standard cubic feet per minute) or the metric equivalent ofNm3/h (normal cubic meters per hour). The density of a gas at standard con-ditions is known, thus providing a relationship between SCFM and poundsper hour or between Nm3/h and kg/h.
The conversion between the volume at actual conditions and the volume atstandard conditions is based on the ideal gas law — actual volume increasesin direct proportion to an increase in absolute temperature, and decreasesin direct portion to an increase in absolute pressure. Consider the balloonexample — as the temperature increases, the volume expands; as the pressureincreases, the volume shrinks.
Absolute pressure of zero psia (pounds per square inch at absolute conditions)is a perfect vacuum. One atmosphere of pressure is defined as 14.69 psia orzero psig. The conversion between psia and psig is easy: PSIA = PSIG + 14.69.If you have a pressure gauge calibrated for psig, it will read zero at sea leveland only measure gauge pressure above atmospheric pressure. The followingchart will help clarify this.
Absolute zero is defined as the temperature where molecular motion stops. Itis defined as 0 K (Kelvin) which is -273.16° C or 0° R (Rankine) which is-459.67° F. To convert between actual temperature and absolute temperature,simply add 460 to the temperature in degrees Fahrenheit or 273 to the tem-perature in Celsius.
Vacuum (negative gauge pressure)Absolute Pressure (psia)
Gauge Pressure (psig)
Atmospheric Pressure (psia)
System Pressure (1)
Atmospheric Pressure
System Pressure (2)
Absolute Zero Pressure

3
Once we establish a set of conditions as a standard temperature and pressure(STP conditions), we can convert between the flow rate at actual conditionsand the flow rate at standard conditions.
The subscript (a) refers to actual conditions; the subscript (s) refers to stan-dard conditions.
Unfortunately, not all STP conditions are universal. Many users consider oneatmosphere and 70° F as STP. Some industries use one atmosphere and 60° Fas standard; others use one atmosphere and 32° F as standard. The metricequivalent is Normal conditions which are based on a pressure of one bar(14.5 psia) and 0° C.
The important issue is that Standard Conditions are not Standard and a massflow meter needs to be able to permit the user to select the desired STP condi-tion. An error of approximately 8% will occur if there is a difference in STPconditions between 70° F and 32° F.
Once a set of standard conditions is identified, the density of that gas at theseconditions is known. Therefore, it is a simple matter to convert from SCFMto mass in pounds per hour:
In this formula, the density in pounds per cubic foot is the density at the spec-ified STP conditions. A list of common gases and their density is in theappendix.
SCFM = ACFMT(s)
T(a)
P(a)
P(s)( ) ( )
poundshour
= SCFM x poundscubic foot
x 60 minuteshour

4
Types of Flow Transmitters
There are many types of flow transmitters — some are used for both liquidand gas flow measurement, while others are specifically used for one fluid. Thefollowing table identifies many of the different types of flow transmitters andtheir use in liquid, steam, or gas service, and if they measure actual flow ormass flow.
As shown, there are many technologies to measure the flow rate of gas. Mostof these methods measure the flow rate at the actual operating pressure andtemperature and require pressure and temperature correction to obtain themass flow.
The following discusses some of the common types of flow measurement:
Differential Pressure
Measuring the pressure difference across a flow element is the most commonmethod of flow measurement. There are several types of flow elements.
Orifice
The most common flow element is the orifice plate as shown in Figure 1.
Technology Liquids Steam Gas Actual Flow Mass Flow
DifferentialPressure X X X X
Vortex X X X X
Turbine X X X X
Magnetic X X
PositiveDisplacement X X X
Variable Area X X X X
Coriolis X X X
Ultrasonic X X X X
Thermal X X
Differential Pressure
Differential PressurePressure
Flow
Reference
Orifice PlateFigure 1

5
This method of flow measurement utilizes a proven technical concept called“Bernoulli’s Equation.” This relation states that the pressure drop across aflow restriction is based upon the square of the flow:
The flow rate is based upon flow at actual conditions.
The pressure drop across the flow element is proportional to the square of theflow. If the pressure drop (∆P) is equal to “a”, and the flow rate doubles, thepressure drop increases to 4a. If the flow rate triples, then the pressure dropincreases to 9a. Therefore the signal strength increases as the flow rateincreases. At zero flow there is no signal, and the signal strength slowlyincreases as the flow increases as shown in the chart below. This results inpoor low flow sensitivity.
Basic limitations of this type of flow measurement are:
1. Limited turndown. A 3:1 turndown causes a 9:1 reduction in pressuredrop. A 4:1 turndown causes a 16:1 reduction in pressure drop. Therebecomes a limit on the turndown ratio of any differential pressuremeasurement instrument due to the DP transmitter. Some newer DPtransmitters permit turndown ratio as high as 8:1. However, this isbased on the maximum possible flow rate that the flow element canhandle and does not necessarily reflect the user’s actual requirements.
2. Limited low flow measurement. There is a minimum flow rate,which generates a pressure drop that can be measured with anydifferential pressure measurement instrument. This is illustrated inthe above graph.
00
2
4
6
8
10
12
14
16
18
0.5 1.0 1.5 2.0 2.5
Pre
ssur
eD
rop
Flow Rate
Flow = constant ×∆P( )
1⁄2

6
3. Creates pressure drop. Because the flow measurement is based uponmeasuring a differential pressure, the flow measurement requires thatadditional pressure drop be added to the process, which increasesoperating cost. The pressure drop created by the primary element isfrequently overlooked when considering operating cost.
4. Measures actual flow rate. Any differential pressure flow device meas-ures the actual flow rate in ACFM. To determine the mass flow rate,correction from actual conditions to standard (mass) conditions isrequired. To determine mass flow from actual flow, it is necessary tomeasure:
— Differential pressure
— Absolute pressure
— Absolute temperature
These measurements are then sent to a flow computer that calculates the massflow rate in SCFM, using the equations previously discussed.
Venturi
A venturi flow element is very similar to the operation of the orifice plate,except that, due to the construction of the venturi, there is a recovery of ener-gy reducing the overall pressure drop. A typical venturi flow element is shownin Figure 2.
While reduction in energy consumption is desirable, a venturi flow element isconsiderably more expensive than an orifice plate; and, still suffers similar lim-itations, with respect to low flow sensitivity and sensitivity to changes inprocess pressure and temperature.
Venturi Flow ElementFigure 2

7
Averaging Pitot Tube
The averaging pitot tube can be an effective differential pressure measurementdevice. It is an insertion device that measures the average velocity across thepipe as shown the illustration below. While this type of instrument is effectivefor liquid and steam flow, it has limitations with air flow measurement, partic-ularly low flow sensitivity and turndown.
The flow measurement is based on determining the velocity pressure, which isthe difference between the total pressure (measured on the upstream side) andthe static pressure (measured on the downstream side). The velocity pressureprovides an indication of the actual velocity at the operating temperature andpressure. The averaging pitot tube samples at various points across the pipe orduct in order to reduce the effect of flow profile. Refer to Figure 3.
Vortex Shedding
This technology is well accepted for flow measurement at high flow rates. Theprinciple of operation is based upon the shedding or the creation of vorticesfrom a blunt element. The instrument counts the number of vortices created;and, through a known relationship, converts this to the actual flow ratethrough the element. Refer to Figure 4.
TotalPressure Static
Pressure
Averaging Pitot TubeFigure 3
Flow
Still Fluid
Shear Layer
High Velocity Fluid
AlternateVortices
Vortex SheddingFigure 4

8
There is an empirical relationship between the number of vortices and theflow rate. There are limitations when using this technology for measurementof gas flow rates:
1. Vortex flow meters measure the actual flow rate, moving past the flowelement. To convert to mass flow, it is necessary to measure pressure,temperature, and use a flow computer to calculate mass flow.
2. Minimum flow rate. There is a minimum flow velocity that generatesvortices. At flow rates below this minimum flow rate, the instrumentwill not generate vortices. For many gas flow applications, the flowrate may not be high enough to create vortices. This reduces theability to detect low flow rates and reduce overall turndown of theinstrument. This is a physical limitation that exists for all vortexflow meters.
While vortex flow transmitters are occasionally used for high velocity gas flow,their most common applications are for liquid or steam flow.
Turbine Flow Meters
Frequently used for air and gas flow measurement, turbine flow meters areavailable as both an in-line body and an insertion probe.
The vanes of the turbine flow meter spin as the fluid moves — the greater theflow rate, the faster the vanes will turn. Various methods are used to count thepulse rate (number of turns) of the vanes.
Turbine meters can be accurate for measuring the actual gas flow rate; but,like other devices, they require pressure and temperature correction to obtainmass flow measurement. Turbine meters also have a minimum velocity thatthey can detect, and may require some type of lubrication of the bearings.
Many applications for turbine flow meters are for smaller, in-line flow bodieswhere pressure and temperature are fairly constant.

9
Ultrasonic Flow
Ultrasonic technology is used to measure the velocity of the fluid in a closedpipe. The sensors can be either insertion type or a non-invasive type, whichclamp onto the side of the pipe. Multi path designs provide full coverage ofthe flow in the pipe.
Originally closed pipe ultrasonic technology was used for liquid flow measure-ment. Advances in the technology now permit it to be used for gas flow meas-urement, where the actual velocity in the pipe is measured. Some units willalso determine gas density, in addition to velocity, and calculate the mass flow.These units tend to be extremely expensive.
Coriolis
Coriolis is a direct form of mass flow measurement, which does not rely uponthe physical properties of the fluid. When first developed, Coriolis flow metersdid not have the sensitivity for gas flow measurement; however, the technologyhas improved and Coriolis is now used to measure gas flows.
The advantage of Coriolis is that it is a true, high accuracy, mass flowmeasurement, independent of the properties of the fluid. Disadvantages arethat it is available only as an in-line device in sizes typically up to four inches.Coriolis flowmeters are expensive to purchase and install. May not be suitablefor low flow, low pressure applications. Pressure drop across a Coriolisflowmeter is also a consideration.
Pressure/Temperature Correction
As previously discussed, many flow meters measure the actual flow rate ratherthan the mass flow rate. In order to obtain a mass flow measurement, it is nec-essary to correct for the actual pressure and temperature. Figure 5 illustrateswhat is necessary to obtain a mass flow measurement from a differential pres-sure flow measurement device (the most common form of flow measurement).The differential pressure across a flow element must be measured to obtainthe actual flow rate; then, the actual flow rate must be corrected for pressureand temperature. This requires three separate instruments to measure differential

10
pressure, pressure, and temperature. These signals are sent to a flow computerto determine the mass flow rate. Thermal mass flow technology replaces all ofthis with one instrument that directly measures the mass flow rate of the gas.
Multi-Variable Transmitters
A multi-variable transmitter combines the function of the three transmitters(∆P, P, and T) and the flow computer into one transmitter. The multi-variabletransmitter measures the pressure and temperature of the gas, the pressuredrop and then calculates the mass flow.
While only one 4–20 mA signal is generally available, measurement of theother variables is available via HART communication. The functionality ofthree transmitters in one device reduces the installation cost of differentialpressure mass flow measurement.
Multi-variable transmitters are frequently used with averaging pitot tubes.Turndown ratios up to 8:1 are obtainable. This turndown ratio is based on themaximum allowable flow rate that the averaging pitot tube can detect. Theactual turndown rate for the user’s specific application will be less, dependingupon the maximum flow the user wants to detect. Limitations in low flowmeasurement capabilities still exist.
Multi-variable transmitters are also integrated into some vortex flow transmit-ters. These instruments measure the actual flow rate using a vortex; then, alsomeasure the pressure and temperature and provide a correction to mass flow.These instruments tend to be rather expensive.
FlowComputer
∆ P P T
Mass Flow
Actual to Mass Flow ConversionFigure 5

11
Thermal Mass Flow
Thermal Mass Flow offers many advantages over other, more traditional,methods of measuring gas flow.
1. Mass flow measurement. Thermal mass flow transmitters provide ameasurement of the mass flow rate of the gas based upon heat trans-fer. The gas flows past a heated surface creating a cooling effect. Heattransfer is caused by the mass (or molecular) flow of the gas providinga mass flow measurement. Correction of the gas flow rate for pressureand temperature is not required.
2. Excellent low flow sensitivity. Thermal technology can measure veloci-ties down to 25 standard feet per minute —much lower than anyother flow device. The heat transfer rate is greatest at low flow ratesand decreases as the flow rate increases. This makes this technologyespecially sensitive for low velocity measurement.
3. Excellent turndown. Magnetrol’s Thermal Mass Flow Transmitteroffers the ability to measure the low velocities as well as high flowrates. This can provide a turndown rate of 100:1 or more dependingupon the application requirements.
4. Low pressure drop. The insertion probe has little blockage of thepipe, thereby, creating very low pressure drops.
5. Ease in installation. Using an insertion probe, the instrument caneasily be installed in a pipe or duct.
6. Factory Calibrated. Each instrument is calibrated by Magnetrolfor the application specific requirements and configured to the user’sspecifications. The instrument can be installed and placed directlyinto service without any need for field set up, calibration, oradjustment.
7. Lowest installed cost. When considering options to measure massflow, the TA1/TA2 has the lowest installed cost while providing excel-lent performance. No additional instrumentation is required to obtaina mass flow measurement.
8. Linear output signal. The TA1 and TA2 provide an output signalwhich is linear with the mass flow rate. Compare this againstdifferential pressure flow measurement which provides a non-linear –square root curve of flow vs. signal which then must be linearized bythe user.

12
Magnetrol offers two different thermal dispersion mass flow transmitters withdifferent functionality to meet the user’s application requirements:
The sensor used with Magnetrol’s Thermal Mass Flow Transmitters is illustratedin Figure 6.
The sensors on the TA1/TA2 are protected to prevent possible damage from“bottoming out” when inserted into a pipe. This is an important considera-tion if the probe is installed into the pipe with a compression fitting. Thereare two sensors — a heated sensor (shown on the right) and a reference sensorwhich measures the temperature of the gas. Precision matched PlatinumRTDs are used for the temperature measurement. A mass balancing element isused to ensure that both sensors will respond the same to changes in temperature.
RTD
Heater
Mass BalancingElement
ReferenceSensor
TA1/TA2 SensorFigure 6
Model TA1 Model TA2

13
Different Types of Thermal Mass Flow Meters
There are two different technologies utilized for thermal mass flow measure-ment. Both methods obtain the same results, and the user should not carewhich method is used. Magnetrol has experience with both types.
Constant Power
This technology uses a constant power to the heater. The instrument measuresthe temperature difference between the heated sensor and the reference sensor,which measures the process temperature. The temperature difference decreasesas the flow rate increases. This is the method utilized in the TA1.
At low flow rates the temperature difference between the sensors is greatest.As the flow rate increases, the temperature difference decreases. A curve oftemperature difference versus mass flow rate is shown in the chart below.
The change in temperature difference with mass flow rate is very large at the
low flow rates – this provides excellent low flow sensitivity as previously men-tioned. As the flow rate increases, the temperature difference decreases yet thecurve still shows good sensitivity at very high flow rates providing high turn-down capabilities.
Constant Temperature Difference
This technology maintains a constant temperature difference between theheated sensor and the reference sensor. The instrument controls the amount ofpower to the heater to maintain this temperature difference. As the flow rateincreases, more power is required to maintain this constant temperature differ-ence. Refer to the chart at right. This is the technology used in the TA2.
Tem
per
atur
eD
iffer
ence
Mass Flow Rate

14
As shown in the illustration, at low mass flow rates, there is little heat transfer,and thus the amount of power required to maintain the desired temperaturedifference is low. As the mass flow rate increases, the amount of powerrequired to maintain a constant temperature difference increases.
As with the constant power operation, changes in heat transfer are greatest atlow velocities thus providing excellent low flow sensitivity. As the mass flowrate increases, the power increases as shown. This permits flow measurementat very high flow rates providing high turndown capabilities.
With both the TA1 and TA2, there is an inherently non linear signal betweenmass flow rate and signal (either temperature difference or power). The instru-ment linearizes the signal to produce a linear 4-20 mA output signal over thedynamic range of the instrument.
The user can easily modify the 4 and 20 mA points if desired in the field.Other field configuration may include changing the pipe or duct size, unitsof measurement, damping, and other specific application factors.
Response Time.
Magnetrol’s first Thermal Dispersion Mass Flow Transmitter – the TA1 usesa constant power operation. The technology has performed very well, howeverit suffers from slow response to changes in flow rate. With the developmentof the TA2, we desired to have a faster response time which is available witha Constant Temperature Difference operation.
Both the TA1 and TA2 use the same sensor. There is an inherent timeresponse for the thermal mass of the sensor to heat up or cool down dueto changes in flow rate. The difference in response time between the twotechnologies is explainable.
Po
wer
Mass Flow Rate

15
Constant Power operation is a passive operation. The temperature difference isdependent upon how long it takes for the heated sensor to heat up or cooldown with flow changes. The response time depends upon the amount of thestep change, if there is an increase or decrease in flow rate, and the type of gas.
The constant temperature difference operation used in the TA2 has a fasterresponse time to changes in flow. The TA2 controls the power to the heater toalways maintaining a constant temperature difference between the referenceRTD and the RTD measuring the temperature of the heater. The responsetime of the TA2 compared with the response time of the TA1 is shown in thechart below.
The TA2 uses control algorithms in the instrument to provide a response timethat is significantly faster than the TA1. The result is an instrument that pro-vides improved real time gas flow measurement.
Temperature Compensation
Thermal Mass Flow Transmitters measure heat transfer and infer the massflow based upon calibration information. Calibration will be discussed inmore detail later.
However, the gas properties that affect convective heat transfer are affected bychanging temperature.
Magnetrol has done extensive testing and analysis on the effect of changes inflow at different temperatures and has developed a proprietary method ofproviding temperature compensation over the entire operating range of theinstrument. The chart at provides typical curves for the TA1 showing flow vs.temperature difference over a range of temperatures.
00
25
50
75
100
TA1TA2
10 20 4030 50 60
%C
hang
e
Seconds

16
Magnetrol compensates temperature over the entire operating temperaturerange of the instrument. The TA1/TA2 measures the temperature andthen applies a correction in the flow measurement based upon the operatingtemperature.
The chart below shows the same data after we apply our temperaturecompensation.
The same effect occurs with the TA2 using constant temperature difference.The charts below show data from the TA2 with and without temperaturecompensation.
These illustrations demonstrate the effectiveness Magnetrol’s temperature com-pensation of the mass flow measurement based upon varying gas properties.
Po
wer
mW
Mass Flow
100° F200° F300° F400° F
TA2 CompensatedFlow Data
Del
taT
Mass Flow
70° F150° F250° F350° F
TA1 UncompensatedFlow Data
Po
wer
mW
Mass Flow
100° F200° F300° F400° F
TA2 UncompensatedFlow Data
Del
taT
Mass Flow
70° F150° F250° F350° F
TA1 CompensatedFlow Data

17
Some thermal mass flow manufacturers just temperature compensate the elec-tronic circuit. What these manufacturers overlook is that the gas propertiesthat affect convective heat transfer are temperature dependent. Thus changingtemperature changes heat transfer. Magnetrol provides real time temperaturecompensation that measures the temperature of the gas and automaticallycorrects the mass flow measurement based on temperature variations.
Without real time temperature compensation, the accuracy of the flow meas-urement will degrade with temperature changes. In some competitive designs,the rated accuracy is only good within 50° F of the calibration temperature.
If the instrument does not provide a temperature measurement, the instru-ment can not provide real time temperature compensation. This is especially aconsideration with other manufacturer’s constant temperature difference oper-ation; these designs have a reference RTD and a self heated RTD. The refer-ence RTD is used in the electronic circuit and does not provide temperaturemeasurement. Thus these instruments do not provide real time temperaturecompensation.
Another consideration in using a self heated RTD is that the resistance of theself-heated RTD changes with temperature. Without knowing the tempera-ture, the instrument cannot compensate for the changing resistance of theheated RTD.
Magnetrol’s advanced real time temperature compensation is an important fea-ture which provides superior performance for the Model TA1 and TA2.
Pressure Effects
Heat transfer is affected by changing temperature. This is based upon boththeory and Magnetrol’s own experience. However, heat transfer is not affectedby changing pressures. The chart below demonstrates that pressure does notaffect thermal mass flow measurement.
Sig
nal
Mass Flow
14.7 psia25 psia
100 psia
An increase in pressure will increase the gas density – there is the sameamount of heat transfer with a low velocity, high density gas as there is with ahigh velocity, low density gas.

18
Calibration
Each instrument is calibrated for the gas and the specified flow rate.Calibration involves flowing a known amount of gas over the sensor andmeasuring the signal. This is repeated for at least 10 different flow rates. Acurve fit of the data versus flow rate is developed and then loaded into anEPROM in the instrument. The calibration is NIST traceable. A calibrationcertificate is included with the instrument and all calibration data is retainedat Magnetrol for future reference.
When installed and placed into operation, the instrument measures a signal,and then converts that signal to the flow rate for the user’s application. Theinstrument adjusts for differences in area and blockage effect between the cali-bration fixture and the field installation.
Each gas has different thermal properties that effect convective heat transfer.An instrument calibrated for air will not give accurate measurements if usedfor natural gas. Each instrument is calibrated for a specified gas over themaximum flow rate specified.
Each instrument has its own unique calibration. The sensor and the electron-ics are a matched pair—each has a serial number to enable matching the unitsin the field. This has been a difficulty with this technology. Previously, if theprobe needs to be replaced, the probe and associated electronics must becalibrated together as a unit. There are tolerances in both the probe and theelectronics which effect the calibration. With the development of the TA2,Magnetrol has developed a method by which the probe (or circuit boards)can be field replaced. A new calibration certificate will be provided with thereplacement probe and the user will enter these new probe calibration factorsinto the instrument using either the key pad and display or via HART.
The cable length is totally independent of the calibration. This enables thecustomer to provide their own cable or to change the cable length in the field.Some competitors’ units require that the instrument be calibrated with thespecified cable length, and any change in cable will affect the accuracy.
Calibration vs. Configuration
Often users will want to calibrate an instrument in the field. Often what theyreally want to do is to configure the instrument in the field. Calibrationrequires a flow bench; configuration of the instrument for the specific applica-tion is very simple permitting the user to change pipe or duct size, range andspan of the 4-20 mA signal, units of measurement, installation factors. Theuser has full capability to configure the TA1 or TA2 to fit the application.

19
Accuracy
The accuracy of the TA1/TA2 is well accepted in the industry. Our statedaccuracy is ± 1% of reading plus 0.5% of full scale.
The accuracy component is made up of both a measurement of reading and apercentage of overall span. At 100% of full scale, the accuracy will be ±1.5 %.As the flow decreases, the accuracy is represented in the chart above. All cali-bration points must fall within these boundaries.
Flow Profile
While Magnetrol goes to great extent to provide an instrument with excellentaccuracy, our accuracy is the calibration accuracy. When the probe is insertedinto a pipe or duct, the sensor will measure the flow at that point. Thereforethe measured flow is affected by the flow profile at the location of the sensor.
When a fluid flows in a pipe, it develops a flow profile. A flow profile willeither be laminar or turbulent. These terms are sometimes misused.
In laminar flow, each fluid particle travels in a straight line as it flows throughthe pipe. Refer to Figure 7.
The fluid moves in layers with each layer sliding over the other. The velocityof the fluid at the wall is zero and increases as the distance from the wallincreases as shown in Figure 9.
00 20 40 60 80 100
-10
-5
5
0
10
15
Err
or
Laminar FlowFigure 7
Flow

20
With turbulent flow, the flow path consists of eddies and swirls within thefluid; there is intermixing as the fluid flows. Typical turbulent flow is shown inFigure 8.
Turbulent flow and laminar flow have very specific definitions based upon itsReynolds number.
Reynolds Number is defined as:
Reynolds Number shows the relationship between:
V = Velocity
D = Diameter
= Density
µ = Viscosity
Reynolds numbers less than 2,000 are laminar flow, larger than 4,000 are tur-bulent flow, and between 2,000 and 4,000 are considered transition zone.
The flow profile in the pipe for laminar flow and turbulent flow are consider-ably different. With laminar flow the flow moves straight ahead without mix-ing. The velocity at the wall is zero and the velocity profile across the pipe willlook something like Figure 9. Because there is no mixing, the velocity at thecenterline is much greater than the average velocity.
Turbulent FlowFigure 8
Flow
Larimar Flow ProfileFigure 9
Re =VDµ[ ]

21
A fully developed turbulent flow profile is shown in Figure 10.
Virtually all gas flow applications will be in the turbulent flow area.Theoretically the velocity at the pipe wall is zero and the velocity at thecenterline is approximately 20% higher than the average velocity. Inturbulent flow, the flow profile will change slightly with Reynolds Numberas shown in Figure 11.
In turbulent flow, the location of the average velocity will range between0.07 D (1⁄14 the diameter) to 0.13 D (1⁄8 the diameter), depending upon theReynolds number. At this location, changes in velocity (Reynolds number)will change the flow profile.
The center line velocity in turbulent flow is approximately 20% greater thanthe average velocity. The lower portion of Figure 11 shows a laminar flowprofile — the centerline velocity is approximately twice the average velocity.
Another factor, which is not shown, but will also affect the velocity profile, isthe roughness factor of the pipe. Rough pipe will have a different velocityfactor than smooth pipe.
V max
0.07
V avg
V avg
0.13 D
0.15 D
V avg
V max
RD < 2000
RD < 4000
RD < 3,000,000
Laminar Flow Profile
Turbulent Flow Profile
Laminar vs. Turbulent Flow ProfileFigure 11
Turbulent FlowFigure 10

22
There are difficulties locating the sensor at the point of average velocity. Thislocation may be difficult to accurately determine as the profile will change withchanges in velocity. The velocity profile is very sensitive at this point; a slightvariation in flow profile will cause a major change in the flow measurement.
The best place to locate the sensor is at the centerline of the pipe. The pipecenterline is easy to determine, and changes in profile will have minimal effecton the flow profile. The disadvantage is that the centerline velocity of a fullydeveloped turbulent flow profile is 20% theoretically higher than the averagevelocity.
These flow profiles are based on what is referred to as a fully developed turbu-lent flow profile. This flow profile will exist in a long straight section on pipe.As the gas flows around an elbow, the momentum causes the gas velocity onthe outside of the elbow to increase and the velocity on the inside to decrease.This is shown in the Figure 12.
In addition to changing the flow profile, as the gas flows around an elbow, arotational component, or swirl is introduced into the flow profile as shown inFigure 13.
With sufficient straight run of pipe, swirl patterns will dissipate and a fullydeveloped turbulent flow profile will redevelop. Historically, 10 diametersupstream and 5 diameters downstream was considered as adequate straightrun. Recent testing by NIST has demonstrated that these dimensions may notbe sufficient, especially if there are two elbows. Magnetrol’s brochure 54-131provides additional information on recommended probe locations.
Swirl Flow ProfileFigure 13
Turbulent Flow ProfileFigure 12

23
For flow measurement in larger ducts, a single probe can be used to obtain arepeatable flow measurement suitable for combustion air flow applications. Insome applications, the probe has been inserted directly following an elbow.Refer to Figure 14.
The effect of flow profile variations and swirl patterns may result in the probebeing positioned at a location where the flow profile is different that the flowprofile during calibration.
For most process flow measurement, there is insufficient room to obtain a per-fect flow profile. The basic rule is to attempt to get as much straight run aspossible and position the probe to get two to three times the upstream asdownstream distance.
Installation Options
There are various options for installing the probe into the pipe or the duct.Perhaps the most common and simplest is the simple compression fittingshown in the Figure 15 below.
Insertion probes with compression fittings can fit into pipe sizes11⁄2" and larger.
A standard bored-through compression fitting is commercially availablethrough Magnetrol or Swagelok, Parker-Hannifin, and others. Either a 3⁄4" NPTor 1" NPT for 3⁄4" tubing is useable.
Flow Measurement in Larger DuctsFigure 14
Typical Probe InstallationFigure 15
24
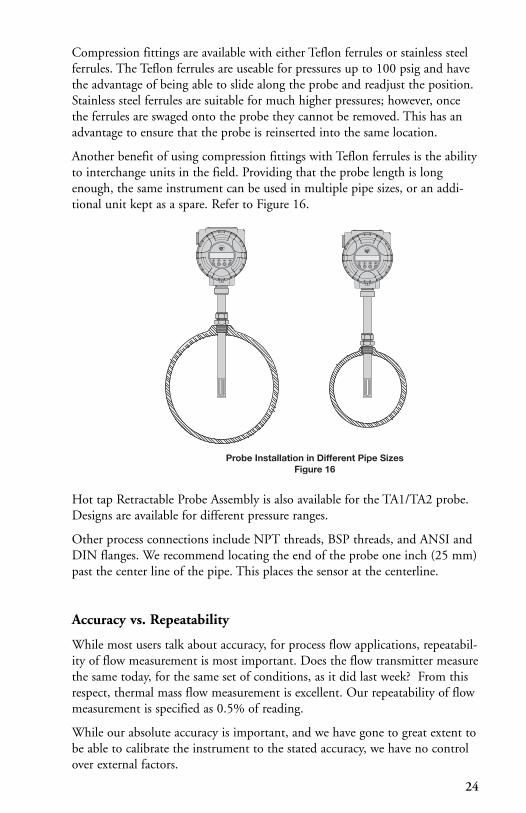
Compression fittings are available with either Teflon ferrules or stainless steelferrules. The Teflon ferrules are useable for pressures up to 100 psig and havethe advantage of being able to slide along the probe and readjust the position.Stainless steel ferrules are suitable for much higher pressures; however, oncethe ferrules are swaged onto the probe they cannot be removed. This has anadvantage to ensure that the probe is reinserted into the same location.
Another benefit of using compression fittings with Teflon ferrules is the abilityto interchange units in the field. Providing that the probe length is longenough, the same instrument can be used in multiple pipe sizes, or an addi-tional unit kept as a spare. Refer to Figure 16.
Hot tap Retractable Probe Assembly is also available for the TA1/TA2 probe.Designs are available for different pressure ranges.
Other process connections include NPT threads, BSP threads, and ANSI andDIN flanges. We recommend locating the end of the probe one inch (25 mm)past the center line of the pipe. This places the sensor at the centerline.
Accuracy vs. Repeatability
While most users talk about accuracy, for process flow applications, repeatabil-ity of flow measurement is most important. Does the flow transmitter measurethe same today, for the same set of conditions, as it did last week? From thisrespect, thermal mass flow measurement is excellent. Our repeatability of flowmeasurement is specified as 0.5% of reading.
While our absolute accuracy is important, and we have gone to great extent tobe able to calibrate the instrument to the stated accuracy, we have no controlover external factors.
Probe Installation in Different Pipe SizesFigure 16

25
Factors which can affect total system accuracy, include:
1. Blockage effect. The sensor and probe block a portion of the flowpath, reducing the cross sectional flow area. Magnetrol takes thisblockage into account with area compensation built into the software.This feature is not available on all competitors’ units.
2. Error in entering flow area. If this information is entered inaccurately,the flow rate will be in error.
3. Standard conditions are not always standard. The TA1/TA2 permitsthe user to select the desired standard conditions. The TA1/TA2 willadjust the flow measurement based on different STP conditions. Anerror of approximately 8% will occur with differences in STP condi-tions between 70° F and 32° F.
4. Flow profile. As discussed above, flow profile can have a significantimpact on flow measurement. The TA1/TA2 has the ability to correctthe flow measurements for flow profile.
Magnetrol has taken into account many factors to provide the user with theability to configure the instrument to their own requirements, thereby, provid-ing the best possible overall performance.
Limitations of Technology
While thermal mass flow measurement offers many advantages, there are alsosome limitations:
1. Condensed moisture. Droplets of moisture coming in contact withthe heated sensor will cause additional cooling of the sensor. Moisturein the vapor state is not a problem. Applications where condensedmoisture is present must be avoided. The effect of moisture on theflow measurement is show in the chart below.
0
200
100
400
300
600
500
800
700
Water Introduced
Mas
sVe
loci
ty
Time (15 second intervals)
26
2. Changing gas compositions. The instrument is calibrated for theheat transfer created by a particular gas composition. If the gascomposition changes, the heat transfer rate will change, which affectsthe overall accuracy of flow measurement. Minor changes incomposition (such as variations in the humidity of air) will nothave a noticeable effect.
3. Buildup. Buildup on the sensor will reduce the heat transfer rate, thuscreating less cooling and indicating a lower flow than actual. Forapplications where buildup may be present, it is suggested that afterstartup, the condition of the sensor is periodically checked and ahistory of frequency of cleaning be developed and followed.
Applications
There are many applications for thermal dispersion mass flow measurement.Some of the more typical and successful applications are:
1. Compressed air/gas. Measurement and totalization of compressed airor gas flow is utilized for internal plant allocation and measurementof overall consumption.
2. Combustion air flow. Measurement of the mass flow rate of combus-tion air is desirable when determining fuel to air mixtures for propercombustion control. Thermal mass measurement is very appropriatedue to combination of direct mass measurement, excellent low flowsensitivity, wide turndown, and low pressure drops.
3. Natural gas. In-plant measurement of natural gas flows to boiler, fur-naces, dryers, and heaters is an ideal application for thermal mass flowmeasurement. While the composition of natural gas may vary slightlyduring the year, these changes will be minor; and, the advantages ofthermal mass flow measurement will outweigh the limitations of othertechnologies.
4. Digester/Bio-Gas. Difficult application due to low flow rates and lowpressures. Gas is a mixture of Carbon Dioxide and Methane. Gas isvery wet. Thermal dispersion is a proven method to measure andtotalize this flow.

27
There are many other applications for thermal dispersion mass flow measure-ments, however, it is difficult to list all them all. Main factors to consider are:
1. Is the gas composition relatively constant?
2. Is the flow range within the acceptable rates, considering the flow rateand the pipe size?
3. Is there any condensed moisture in the gas flow?
4. Is there particulate matter?
If any answers are questionable, check with Magnetrol to ensure that theapplication is suitable.
Difficult Applications
1. Flare lines. Thermal dispersion mass flow offers many benefits forflare lines — wide turndown, low flow detection, and low pressuredrop. Thermal flow measurement has successfully been used in thisapplication. However, consideration must be given to changes in gascomposition.
Different gases have different thermal properties that affect convectiveheat transfer. Changes in gas composition will change heat transferrates, resulting in inaccuracies in flow measurement.
If used in a flare line with relatively constant gas compositions, thereis no difficulty. However, if used in an application with wide varia-tions in gas composition, especially major changes in concentration ofhydrogen, the user must be made aware of the considerable potentialfor inaccurate flow measurement. Hydrogen cools the sensor muchgreater than other gases; a small flow of hydrogen will appear like amuch larger flow of other hydrocarbons.
In many cases with changing gas composition, the instrument is cali-brated for a typical gas analysis. Magnetrol can provide some esti-mates on how gas composition changes will effect the flow measure-ment. If there are changes in composition, the instrument will stillprovide trend indication.
2. Stacks. While thermal mass flow measurement has successfully beenused for measurement of stack flow, generally multiple point arraysystems are utilized for large diameter stacks. Another option is to usefour or more single point probes inserted from opposite sides of thestack. An external device is needed to average the flow rates.

28
Unique Features
There are several unique features of the TA1/TA2:
1. Temperature compensation, over the entire dynamic range of theinstrument, by measuring the temperature and adjusting the flowmeasurement for changes in physical properties. For more informa-tion, review the section on Temperature Compensation.
2. Area blockage. When the probe is installed in a pipe, a certainamount of the cross sectional area is blocked. The smaller the pipe,the greater the blockage effect. The instrument measures the velocitypast the sensors. Competitors’ units simply multiply the velocity bythe cross sectional area to obtain flow rate. By doing this, they areassuming that there is zero blockage of the pipe due to the insertionof the probe. This can cause a considerable error in the flow measure-ment. The TA1 and TA2 automatically adjust the blockage factorbased upon the flow area.
3. Self-Diagnostics. The TA1/TA2 has greater self-diagnostics thanfound on competitors units. The electronics monitor the return signalfrom the sensor to ensure that the sensor is operating within range.The electronics also conduct self-diagnostics on the electronics toensure that there is no drift or failure of the electronic circuit. TheTA2 provides additional diagnostics permitting the user to individu-ally check the status of the heater and RTDs.
4. Software. The TA1/TA2 software has the same feel as similarMagnetrol products. This intuitive programming makes it easy for theuser to configure and operate the instrument.
5. Flow profile compensation. Advanced users can factor the flow meas-urement for flow profile.
6. Two 4–20 mA outputs—one for flow and one for temperature (TA1only). The 4–20 mA signals can be set up for either active and passiveoperation.

29
7. Selectable STP conditions. The TA1 and TA2 permit the user toselect STP conditions utilized at their facility. Without having thisoption, flow errors of approximately 8% can occur.
9. Digital communication capabilities. The TA1 provides RS-485Modbus communication while other competitive units provide onlyproprietary protocol.
9. HART. The TA2 provides HART communication with a full opera-tional DD which permits the user to virtually do anything overHART which can be accessed via the key pad and display.
10. The TA2 has an optional Probe Simulation Module. This device per-mits the user to replace the probe with a known standard to verifyproper operation of the transmitter.
References:
David Spitzer, Industrial Flow Measurement, 1990. Instrument Society ofAmerica
Richard W. Miller, Flow Measurement Engineering Handbook, SecondEdition, 1989, McGraw-Hill Book Company
30
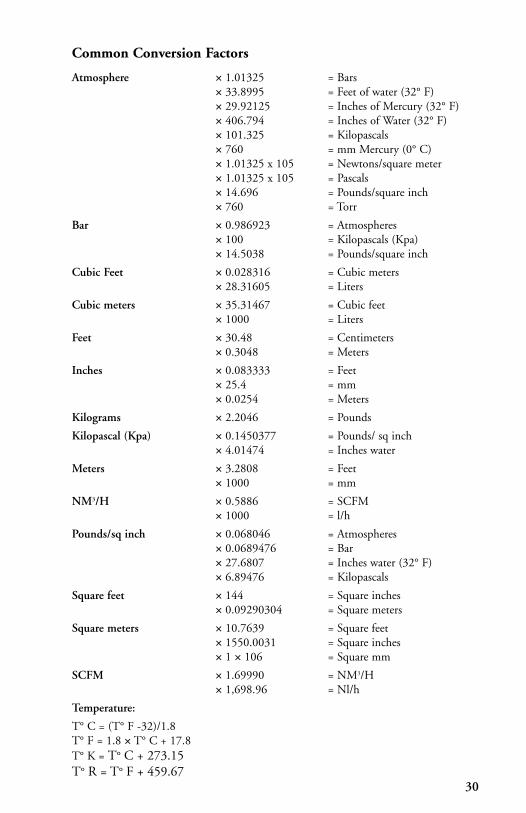
Common Conversion Factors
Atmosphere × 1.01325 = Bars× 33.8995 = Feet of water (32° F)× 29.92125 = Inches of Mercury (32° F)× 406.794 = Inches of Water (32° F)× 101.325 = Kilopascals× 760 = mm Mercury (0° C)× 1.01325 x 105 = Newtons/square meter× 1.01325 x 105 = Pascals× 14.696 = Pounds/square inch× 760 = Torr
Bar × 0.986923 = Atmospheres× 100 = Kilopascals (Kpa)× 14.5038 = Pounds/square inch
Cubic Feet × 0.028316 = Cubic meters× 28.31605 = Liters
Cubic meters × 35.31467 = Cubic feet× 1000 = Liters
Feet × 30.48 = Centimeters× 0.3048 = Meters
Inches × 0.083333 = Feet× 25.4 = mm× 0.0254 = Meters
Kilograms × 2.2046 = Pounds
Kilopascal (Kpa) × 0.1450377 = Pounds/ sq inch× 4.01474 = Inches water
Meters × 3.2808 = Feet× 1000 = mm
NM3/H × 0.5886 = SCFM× 1000 = l/h
Pounds/sq inch × 0.068046 = Atmospheres× 0.0689476 = Bar× 27.6807 = Inches water (32° F)× 6.89476 = Kilopascals
Square feet × 144 = Square inches× 0.09290304 = Square meters
Square meters × 10.7639 = Square feet× 1550.0031 = Square inches× 1 × 106 = Square mm
SCFM × 1.69990 = NM3/H× 1,698.96 = Nl/h
Temperature:
T° C = (T° F -32)/1.8T° F = 1.8 × T° C + 17.8T° K = T° C + 273.15T° R = T° F + 459.67

31
Gas
Chem
icalForm
ulaM
olecular
Weig
htD
ensitylb
/ft 3(1)
Density
kg/m
3(2)
Gravity
SG
Air
-28.96
0.07481.2740
1.000Ammonia
NH3
17.030.0440
0.74910.588
Argon
Ar
39.950.1032
1.75721.379
65%Methane,
Bio
Gas
35%CO2
25.830.0668
1.13630.892
Butane
C4 H
1058.12
0.15022.5567
2.007Butylene
C4 H
856.11
0.14502.4681
1.937Carb
onDioxid
eCO2
44.010.1137
1.93591.520
Carb
onMonoxid
eCO
28.010.0724
1.23210.967
Chlorine
Cl2
70.910.1833
3.12052.449
Ethane
C2 H
630.07
0.07771.3227
1.038Ethylene
C2 H
428.05
0.07251.2340
0.969Helium
He
4.000.0103
0.17610.138
Hexane
C6 H
1486.18
0.22273.7908
2.976Hyd
rogenH2
2.020.0052
0.08870.070
Methane
CH4
16.040.0415
0.70570.554
Nitrogen
N2
28.010.0724
1.23230.967
Oxygen
O2
32.000.0827
1.40761.105
Pentane
C5 H
1272.15
0.18653.1738
2.491Prop
aneC3 H
844.10
0.11401.9397
1.523Prop
yleneC3 H
642.08
0.10881.8510
1.453Sulfur
Dioxid
eSO2
64.060.1656
2.81912.213
1.Gas
Density
at70°
Fand
14.7psia
2.Gas
Density
at0°
Cand
1bar
Gas
Density
atStand
ardC
ond
itions


CORPORATE HEADQUARTERS:5300 Belmont Road • Downers Grove, Illinois 60515-4499 USA
Phone: 630-969-4000 • Fax: 630-969-9489www.magnetrol.com • [email protected]
EUROPEAN HEADQUARTERS:Heikensstraat 6 • 9240 Zele, Belgium
Phone: 052 45.11.11 • Fax: 052 45.09.93
BRAZIL: Av. Luis Stamatis, 620-Jacana • Sao Paulo CEP 02260-001
CANADA: 145 Jardin Drive, Units 1 & 2 • Concord, Ontario L4K 1X7
CHINA: Room #8008 • Overseas Chinese Mansion • 129 Yan An Road (W) • Shanghai 200040
DEUTSCHLAND: Alte Ziegelei 2–4 • D-51491 Overath
DUBAI: P.O. Box-293671 • 803, Green Tower, Baniyas Street • Dubai, United Arab Emirates
INDIA: C-20 Community Centre • Janakpuri, New Delhi 110 021
ITALIA: Via Arese, 12 • 20159 Milano
SINGAPORE: No. 48 Toh Guan Road East #05-123• Enterprise Hub • Singapore 608586
UNITED KINGDOM: Regent Business Centre • Jubilee Road • Burgess Hill, West Sussex RH15 9TL
Copyright © 2007 Magnetrol International. All rights reserved. Printed in the USA.Bulletin: 54-621.3 • Effective: September 2007
Worldwide Level and Flow SolutionsSM