thermal conductivity of compacted mixtures of mine
TRANSCRIPT
Geotechnical Research Centre Faculty of Engineering
The University of Western Ontario
Research Report GEOT-12-04
Thermal Conductivity of Compacted Mixtures of Mine Tailings and Tire Crumbs
Joon Kyu Lee and Julie Q. Shang
The University of Western Ontario Department of Civil and Environmental Engineering Faculty of Engineering Science
1
1PhD Candidate, Dept. of Civil and Environmental Engineering, Univ. of Western Ontario, London, ON,
Canada N6A 5B9 (Corresponding author). E-mail: [email protected] 2Professor, Dept. of Civil and Environmental Engineering, Univ. of Western Ontario, London, ON,
Canada N6A 5B9. E-mail: [email protected]
Thermal Conductivity of Compacted Mixtures of
Mine Tailings and Tire Crumbs
Joon Kyu Lee1 and Julie Q. Shang2
ABSTRACT: The thermal conductivity of compacted mine tailings and tire crumbs mixtures is
studied as affected by the water content, mixing ratio of tailings and tire crumbs, compactive
effort and size of tire crumbs. The results show a clear correlation between the thermal
conductivity and bulk density of the mixtures. Furthermore, the anisotropic thermal conductivity
of the compacted mixtures is investigated and the results reveal that the effect is more
pronounced when the mixtures have lower water contents. The experimental data are processed
via analysis of variance (ANOVA) and the results indicate that the factors included in the
simulation are statistically significant. A multiple linear regression model is proposed to relate
the thermal conductivity with the mixture composition and compaction conditions. The
interpretation methods developed in this study can be extended to enhance the understanding to
the thermal characteristics of compacted geomaterials in engineering applications.
KEYWORDS: Thermal conductivity; Compaction; Anisotropy; Statistics; Mine tailings; Tires;
Recycling
2
Introduction
Geomaterials mostly consist of mineral solids, water and air at various proportions. The study on
heat transfer through geomaterials is important in geoengineering applications such as oil and
gas pipelines, high-power electric cables, radioactive waste disposal facilities, ground heat
exchangers, etc. Thermal transport takes place through conduction, convection and radiation, in
which conduction is most predominant in granular materials and is quantified by the thermal
conductivity.
The thermal conductivity of a geomaterial is strongly dependent on the volumetric fractions
of its constituents. The thermal conductivities of basic geomaterial constituents vary across
several orders of magnitude, for example, mineral solids (order of 10 W/mK), water (order of 1
W/mK) and air (order of 0.01 W/mK). Numerous studies have been reported on the thermal
conductivity of geomaterials as influenced by the properties associated to their constituents, i.e.,
dry density, water content, degree of saturation, water vapors and ices, water flow, electrolyte
type and concentration, and mineralogical compositions (Horai 1971; Steiner and Komle 1991;
Abu-Hamdeh and Reeder 2000; Tarnawski et al. 2000; Bachmann et al. 2001; Ochsner et al.
2001; Yun et al. 2011). Moreover, the structure of geomaterials has a significant impact on their
thermal conductivity. The term of structure refers to the combined effects of fabric (the
geometrical configuration of solid particles of all size ranges, shapes and surface roughness) and
bonding (the inter-particulate forces that hold particle together, including cementation,
electrostatic, electromagnetic and other forces) (Mitchell and Soga 2005). Woodsinde and
Messmer (1961) pointed out that the cementation of particles is an effective process to increase
the thermal conductivity of geomaterials. Narsilio et al. (2010) found that the improved
extent/quality of contacts between inter-particles leads to better thermal conduction.

3
Reusing solid wastes in civil engineering applications can be beneficial to reduce
greenhouse gas emissions. The solid wastes that have potential to be recycled for use as
construction materials include scrap tires and mine tailings. Waste rubber tires exhibits low
density, high durability, good thermal insulation, high energy absorption as well as relatively low
cost. The scrap tires are grinded to particles of various sizes for practical purposes. According to
ASTM D 6270-08, granulated rubber is defined as particulate rubber composed of mainly non-
spherical particles, normally less than 12 mm in size, that is commonly known as tire crumbs
(Edincliler et al. 2010). On the other hand, tailings from mining activities are ground rock
particles from which valuable metals and minerals are extracted. Mine tailings are
conventionally disposed on site and often used as fill material where natural soils are not
available or abundant, provided that the generation of acid mine drainage (AMD) is prohibited.
In combination, tire particles and mine tailings may be utilized in construction as fills. Lee and
Shang (under review) examined the thermal characteristics of dry mixtures of low reactivity
mine tailings and tire crumbs, suggesting their potential beneficial use as lightweight fill
materials with enhanced thermal insulation. A prediction model for the thermal conductivity and
an analysis chart for estimating the volumetric heat capacity for mine tailings and tire crumbs
mixtures in dry state are presented by the same authors.
This paper is the continuation of the work by Lee and Shang (under review), in which
thermal conductivity measurements were performed on wet mixtures of mine tailings and tire
crumbs. Forty specimens were compacted under various water contents, mixing ratios,
compactive efforts and tire crumbs sizes in the laboratory. Experimental results were presented
to illustrate the general relations of thermal conductivity with the influencing factors. The
thermal conductivity anisotropy of the compacted mixtures is also observed. Statistical data
4
analysis was conducted to identify the significance of these influencing factors. A stepwise
multiple linear regression analysis was also carried out to establish an empirical model for
predicting the thermal conductivity of the compacted mine tailings and tire crumbs mixtures.
Experimental Design
To study the thermal conductivity characteristics of compacted mixtures of mine tailings and tire
crumbs, an experimental program was designed and performed. The materials, specimen
preparation, and devices and methodology are described in this section.
Materials
In this study, mine tailings and tire crumbs are the host materials used to produce the mixtures.
Distilled water with the temperature of about 20 °C was used in compaction of the mixtures. The
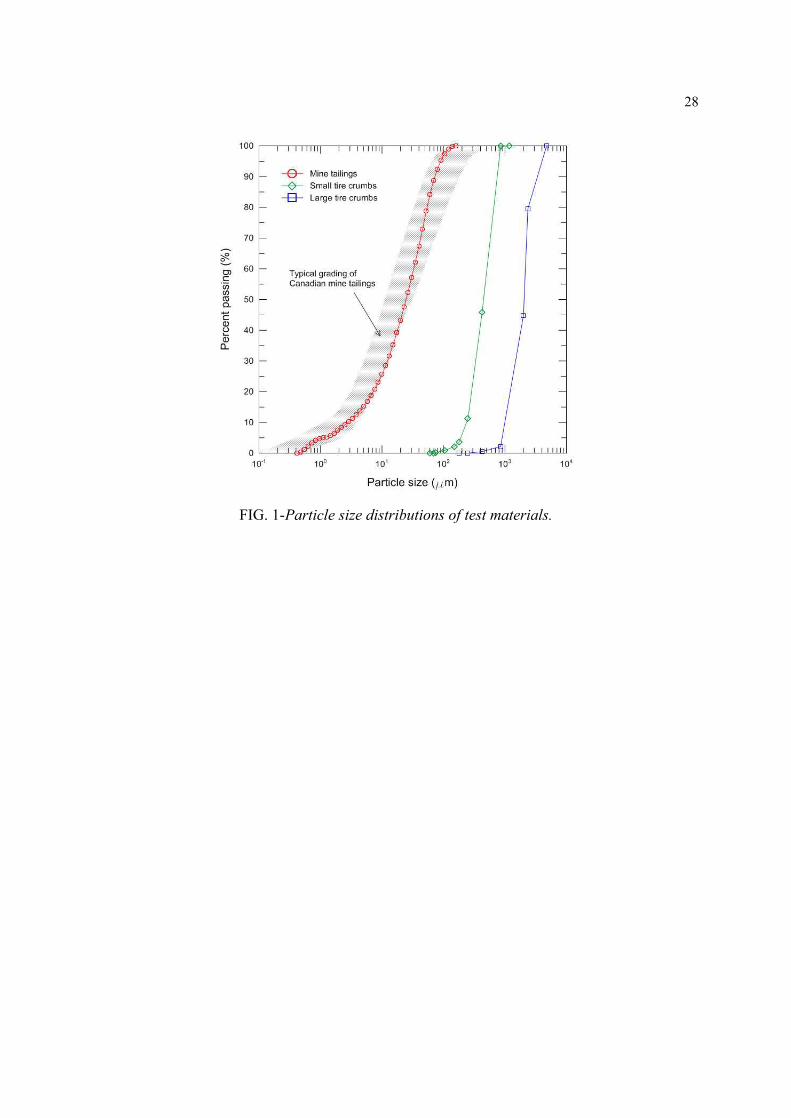
physical properties of the mine tailings and tire crumbs are summarized in Table 1, whereas Fig.
1 shows the particle size distributions.
The dry mine tailings were recovered from the Musselwhite mine located in northern
Ontario, Canada. The specific gravity of mine tailings is 3.37, which is greater than that of most
soils. The Atterberg limit tests on tailings particles finer than 75 μm indicated that the mine
tailings are non-plastic. The tailings comprise a wide range of particle sizes (0.42 to 138 μm),
which is in the typical grading range of Canadian hard rock tailings (Bussiere 2007). The
detailed mineralogical properties of the tailings tested in this study have been reported by Wang
et al. (2006). According to their results, the mine tailings contain relatively low percentage of
sulphide minerals (i.e., 3% pyrrhotite by mass), comparing to that of other sulphide-containing
mine tailings published in the literature (e.g., 80% pyrrhotite: Amaratunga 1995, 54% pyrite:
Ouellet et al. 2006), hence the tailings exhibits relatively low reactivity.
5
The tire crumbs of two particle sizes were supplied by a tire recycling facility located in
Ontario. Both tire crumbs contain no steel wires. The small tire crumbs contain a small amount
of fiber dust. The specific gravities of small and large tire crumbs are measured as 1.19 and 1.16,
respectively, which are comparable to those of tire derived aggregates reported in ASTM D
6270-08. The particle sizes of small tire crumbs vary from 0.069 to 1.18 mm with the median
particle size of 0.46 mm, whereas the particle sizes for large tire crumbs range from 0.25 to 4.75
mm with the median particle size of 2.1 mm. Based on the coefficients of uniformity and
curvature ( uC and cC ), both tire crumbs can be characterized as poorly graded materials.
Specimen Preparation
The mixing ratio of tire crumbs in the mixtures, mR , is based on the dry mass of solids and
defined as
TCMT
TCm mm
mR+
= (1)
where TCm is the mass of tire crumbs and MTm is the mass of mine tailings. Initially, six dry
mixtures of mine tailings and tire crumbs were prepared: five with the mixing ratios of 0.0, 0.1,
0.2, 0.3 and 0.4 for small tire crumbs, and one with 0.2 for large tire crumbs. Each mixture was
thoroughly mixed in a mechanical mixer.
After the preparation of a dry mixture, a predetermined mass of the mixture was mixed with
distilled water of known mass to obtain the desired gravimetric water content. For each mixture,
five molding water contents of 5 to 25% with an increment of 5% were used. After mixing with
water, the mixture was compacted into a cylindrical mold of volume 943.7 cm3 (101.6 mm
diameter and 116.4 mm height) in accordance with the standard Proctor compaction procedures
6
of ASTM D 698-07. In the case of mixtures with small tire crumbs with a mixing ratio of 0.2,
two specimens were also prepared with the modified Proctor in ASTM D 1577-09 and reduced
Proctor suggested by Daniel and Benson (1990). The reduced Proctor procedure is identical to
the standard Proctor procedure but the number of blows per layer is reduced from 25 to 15.
These compactive efforts were designed to simulate the compaction states generally encountered
in the field. To minimize the variability in the compactive effort applied to each mixture, an
automatic compaction equipment was utilized. Following compaction, the excess mixture was
trimmed off from the mold, then the mass of the specimen in the mold was measured to
determine the bulk density and dry density.
In this study, 40 specimens were tested and their identifications are presented in Table 2,
with the mnemonic abbreviation noted below the table. For example, TC0.2-SP-S-W15
represents a specimen with the 0.2 mixing ratio of small tire crumbs and 15% water content,
compacted under standard Proctor energy.
Devices and Methodology
All thermal conductivity measurements were made using a KD2 Pro thermal property analyzer.
It consists of a handhold controller and a sensor. The sensor has two-parallel stainless-steel
probes of 1.3 mm diameter and 30 mm length at a spacing 6 mm, which is inserted into subject
medium. One of probes contains a heating element to generate a heat pulse into the medium
between the probes and the other contains a thermocouple to measure the heat transported from
the medium. The thermal conductivity of the medium is automatically determined from the
temperature evolution with time based on the transient line heat source theory reported by
Kluitenberg et al. (1995). This device reproduces thermal properties of reference materials with

7
±5% accuracy within the temperature range of - 50 °C to 150 °C and a single measurement
approximately takes 2 minutes.
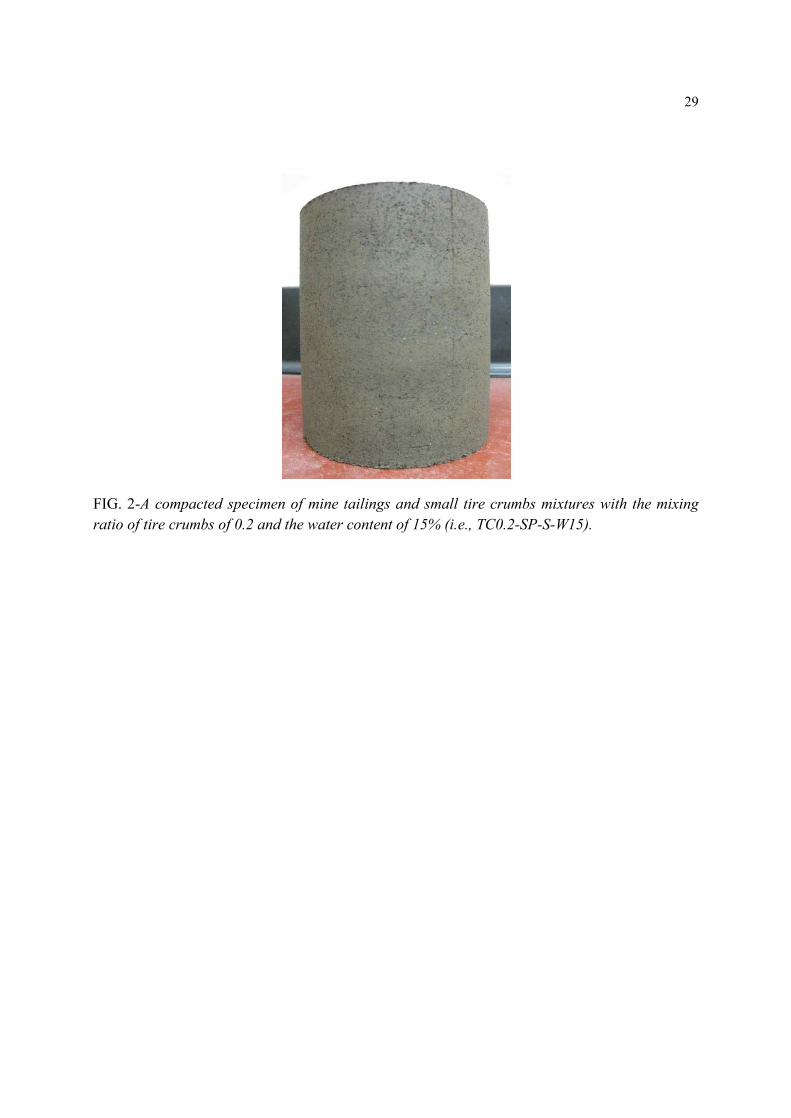
For the thermal conductivity measurement, the compacted mixture of mine tailings and tire
crumbs was extruded from the mold using a hydraulic jack. Figure 2 shows a uniformly
compacted specimen with the mixing ratio of small tire crumbs of 0.2 and the water contents of
15%, i.e., specimen TC0.2-SP-S-W15. In order to explore the anisotropy of the thermal
conductivity, the direction of measurement direction on the specimen was controlled: 1) the
thermal conductivity along the principal axis of the cylinder (representing the horizontal thermal
conductivity) was measured by inserting the sensor perpendicular to the orientation of
compaction; 2) the thermal conductivity perpendicular to the principal axis of the cylinder
(representing the vertical thermal conductivity) was measured by inserting the sensor parallel to
the orientation of compaction. At top and bottom layers of the compacted specimen, respectively,
two sets of horizontal and vertical thermal conductivities were tested with eight readings taken in
each specimen. The thermal conductivity measurements were carried out at the room
temperature of 20 ± 0.5°C.
Methods of Data Analysis
Based on the results of thermal conductivity measurement on compacted mine tailings and tire
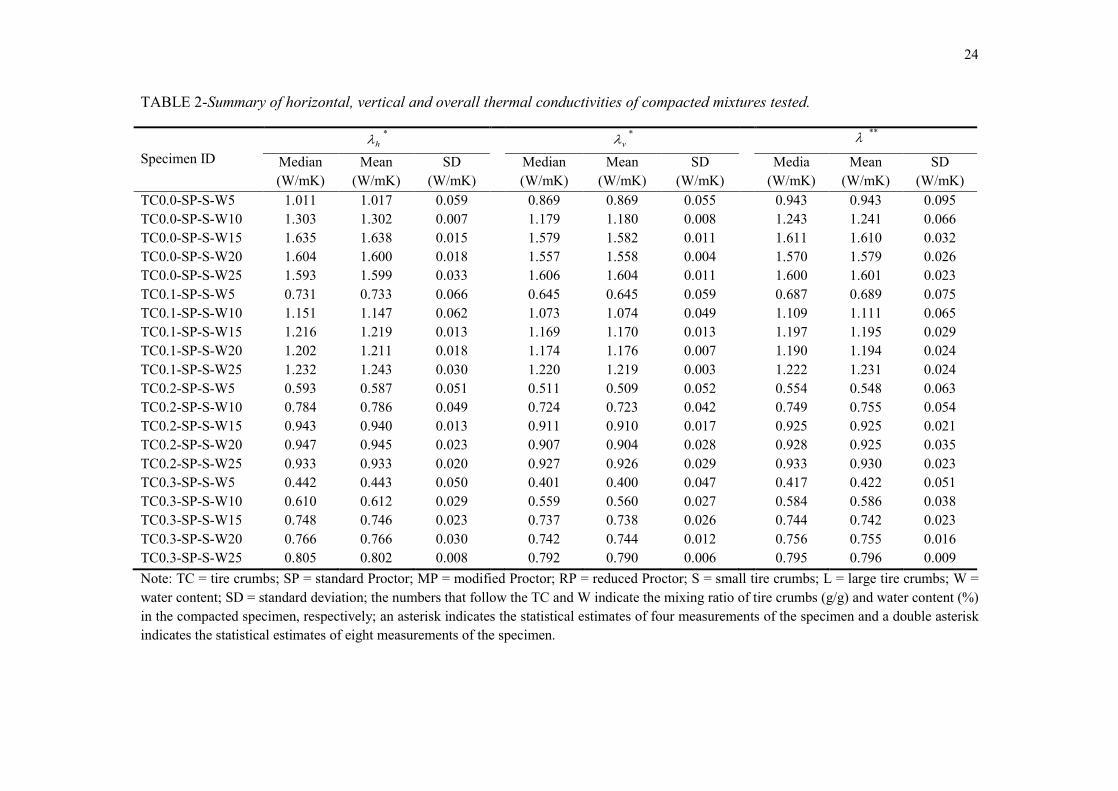
crumbs mixtures, statistical analyses were performed as follows: 1) the mean, median and
standard deviation of four readings corresponding to the “horizontal” and “vertical” thermal
conductivities ( hl and vl ) were calculated; 2) the same statistical estimates of eight readings
from all horizontal and vertical thermal conductivities measured from each specimen were
8
computed and represented as the “overall” thermal conductivity l . The summary of the thermal
conductivity measurement and statistical data is presented in Table 2.
To observe the trends of thermal conductivity against the effects of the influencing factors
(i.e., water content, mixing ratio, compactive effort and tire crumbs size) of the compacted
mixtures, the means of horizontal, vertical and overall thermal conductivities and their standard
deviations were plotted with respect to the influencing factors. Analysis of variance (ANOVA)
was then carried out to assess, in quantitative terms, the relative contributions of the influencing
factors on the thermal conductivity of compacted mixtures. Stepwise multiple linear regression
analysis was also employed to predict the thermal conductivity of the compacted mixtures. These
statistical analyses were conducted by using 320 raw data (= 40 specimens × 8 test points).
Results and Discussion
Compaction Characteristics
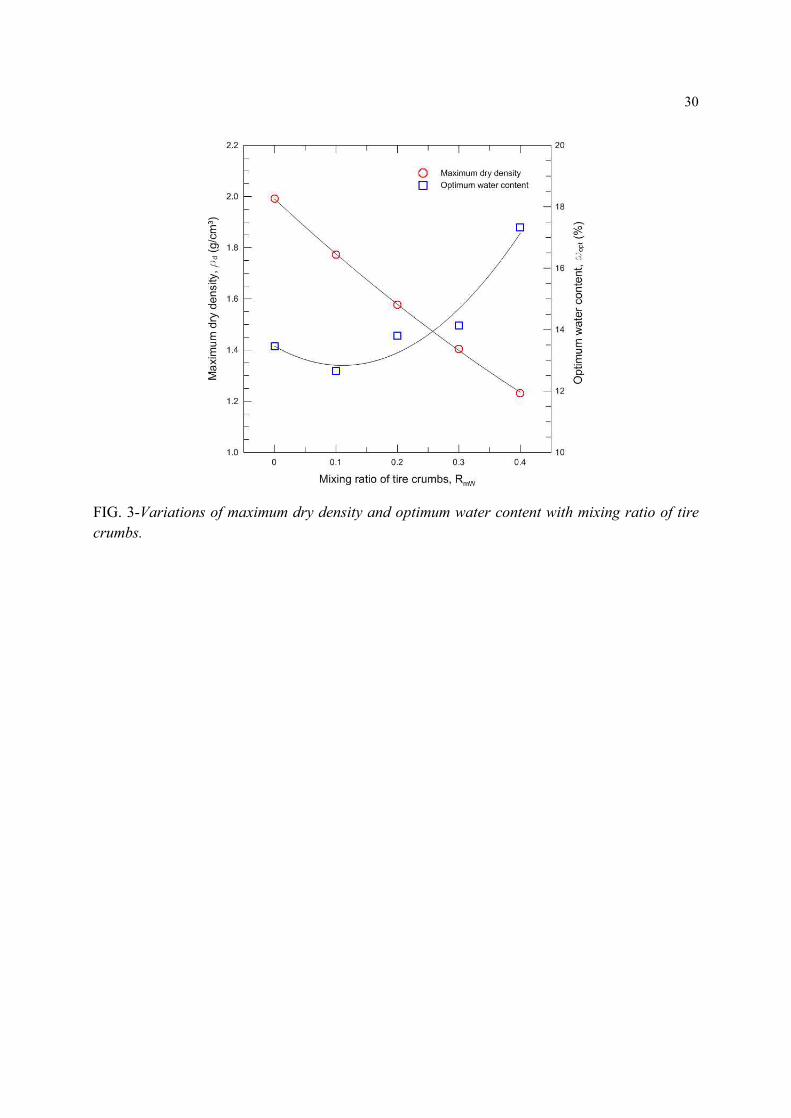
Figure 3 shows the changes in maximum dry density, maxdr , and optimum water content, optw ,
with the mixing ratio of small tire crumbs. The maximum dry density ranges from 1.99 to 1.23
g/cm3, while the optimum water content varies from 12.7 to 17.3%. The maximum dry density
decreases with the increase in the mixing ratio of tire crumbs. This is due to the reduced specific
gravity of the mixtures with higher fraction of tire crumbs. On the other hand, the optimum water
content slightly decreases first, then increases with increasing mixing ratio of tire crumbs. This
can be interpreted as that with the increase of tire crumbs, more water is required to re-orientate
solid particles during compaction. Similar compaction behavior was reported for mixtures of
soils and tire particles in the literature (Cetin et al. 2006; Christ and Park 2010). Moreover, the
significant increase of optimum water content is observed in the mixing ratios of tire crumbs mR

9
> 0.3. In this case, the compacted mixtures transit from a rigid mine tailings dominated fabric to
a soft tire crumbs dominated fabric, based on the packing mechanism on a binary mixture of
particles of different sizes (Lade et al. 1998).
Thermal Conductivity Characteristics
Figures 4-6 show the bulk density, br , and thermal conductivity, l , of the compacted
specimens of mine tailings and tire crumbs mixture versus the water content, as related to the
mixing ratio of tire crumbs, compactive effort and tire crumbs size, respectively.
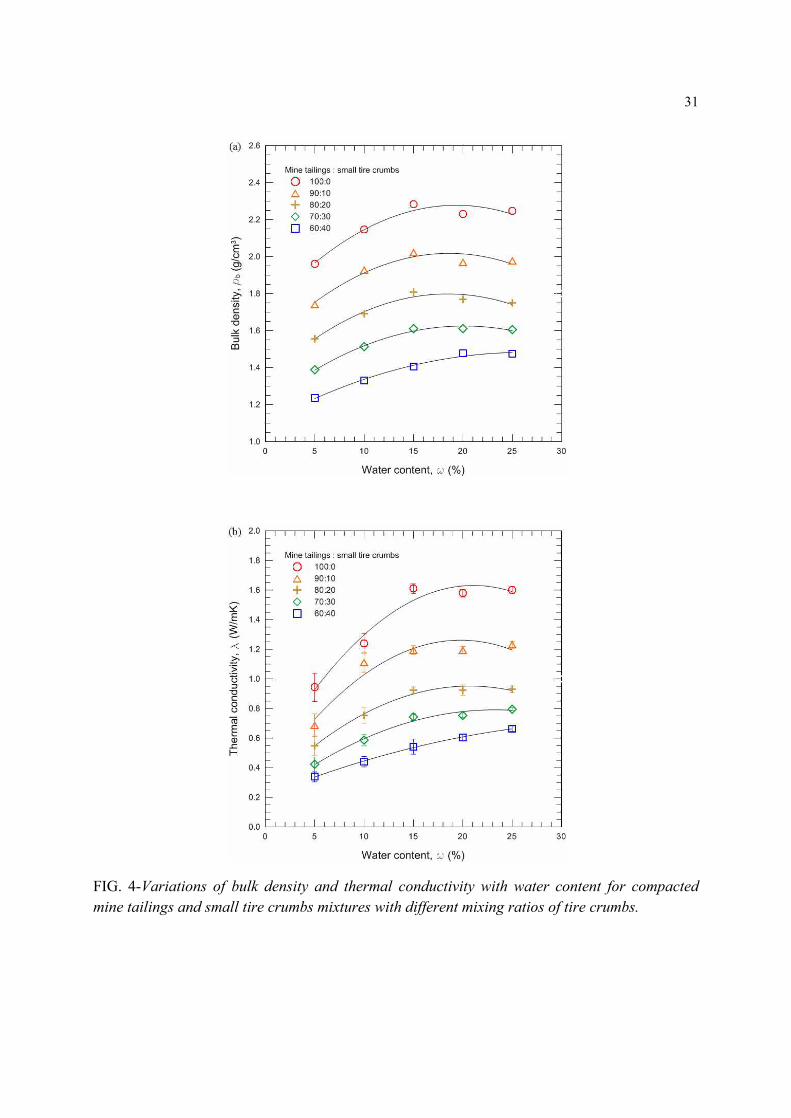
Figure 4 illustrates the variations of bulk density and thermal conductivity for the
compacted mixtures with different mixing ratios of small tire crumbs. The bulk density of the
specimens decreases with increasing mixing ratio of tire crumbs for a given water content. For
example, the bulk densities are 2.28, 2.02, 1.81, 1.61 and 1.41 g/cm3, respectively, when the
mixing ratio of tire crumbs are 0, 0.1, 0.2, 0.3 and 0.4 at a water content of 15%. The bulk
density decreases by 38% when the mixing ratio of tire crumbs is increased from 0 to 0.4 at a
water content of 15%. Furthermore, at a given water content, the thermal conductivity of the
specimens decreases with increasing mixing ratio of tire crumbs. For instance, the thermal
conductivities are 1.610, 1.195, 0.925, 0.742 and 0.543 W/mK, respectively, when the mixing
ratio of tire crumbs are 0, 0.1, 0.2, 0.3 and 0.4 at a water content of 15%. The thermal
conductivity decreases by 66% when the mixing ratio of tire crumbs is increased from 0 to 0.4 at
a water content of 15%. The reduction of both the bulk density and thermal conductivity is
mainly due to the low density and low thermal conductivity of tire rubber particles. However, it
should be noted that the air content of the specimens increases with increasing mixing ratio of
tire crumbs, which adds to the decrease in bulk density and thermal conductivity to a minor
10
extent. This is attributed to the fact that the angular shape and rough surface of rubber particles
that are produced through the mill process have a tendency to entrap air. It is inferred from these
results that recycled tire crumbs have potential applications as lightweight fill materials with
improved thermal insulation.
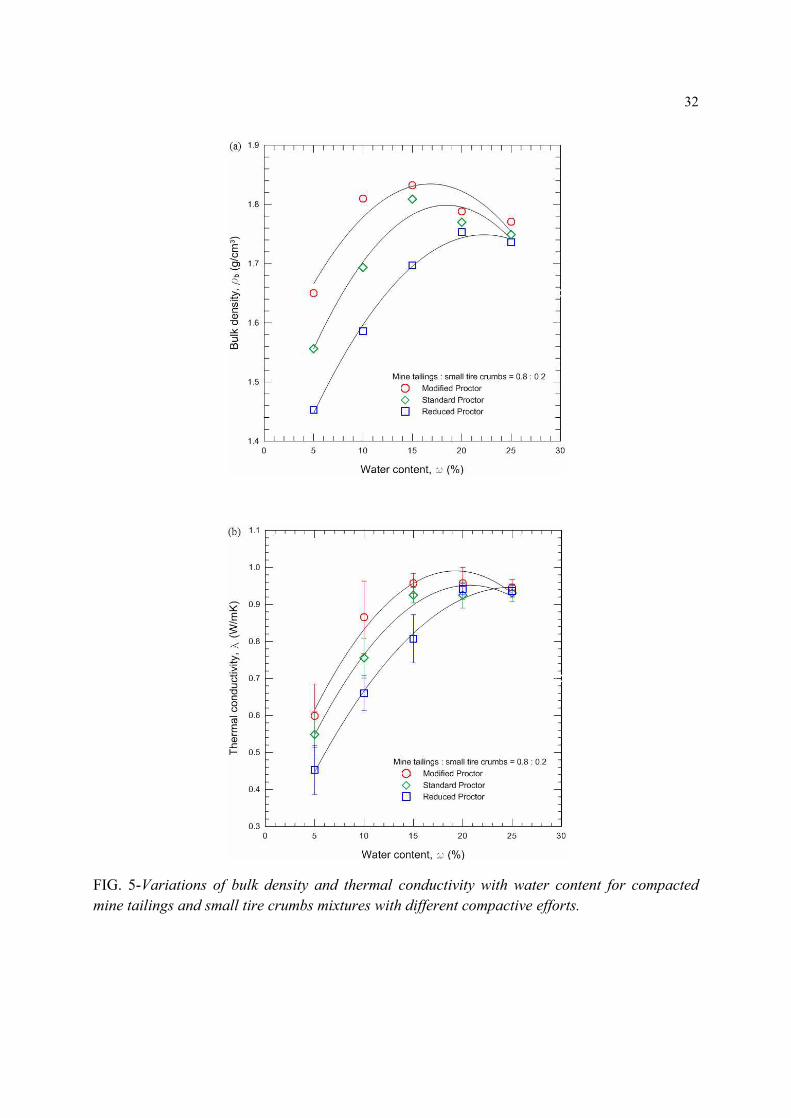
Figure 5 highlights the effect of compactive effort on the bulk density and thermal
conductivity of compacted mixtures of small tire crumbs with the mixing ratio of 0.2. The
highest values of bulk density and thermal conductivity of the specimens are attained at the
modified Proctor, followed by the standard Proctor and the reduced Proctor. As seen in Fig. 5, at
a constant water content of 15%, specimens with bulk densities of 1.83, 1.81 and 1.70 g/cm3
corresponding to modified, standard and reduced Proctors have thermal conductivities of 0.957,
0.925 and 0.807 W/mK, respectively. The increase in the thermal conductivity with the increase
of compactive effort is probably because the higher compactive effort induces better contact
between neighboring solid particles for heat transfer.
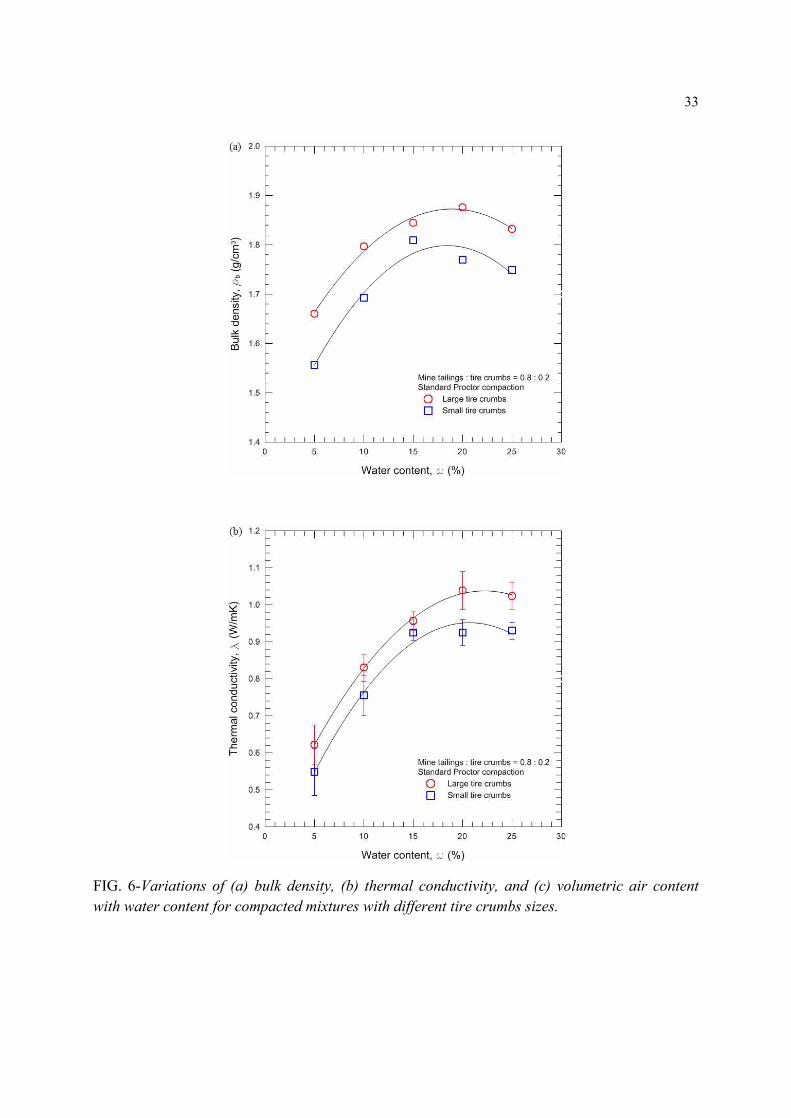
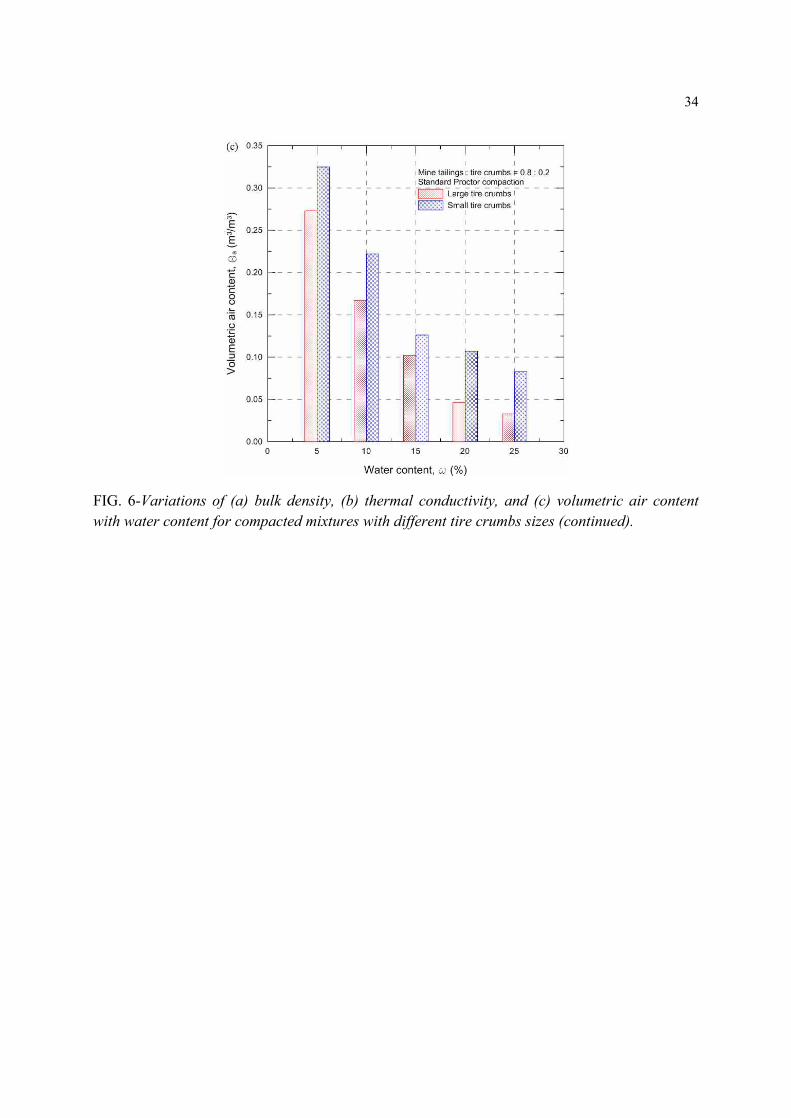
Figure 6 compares the bulk densities and thermal conductivities of the compacted mixtures
with the same mixing ratio of tire crumbs but different tire crumbs sizes. As shown in Figs. 6(a)
and 6(b), the specimens with small tire crumbs have the lower bulk density and thermal
conductivity than those mixed with large tire crumbs. Quantitatively, the bulk densities of the
specimens with small tire crumbs are 2 to 6% less than those of large tire crumbs and the thermal
conductivities are 3 to 12% lower. The differences in both the bulk density and thermal
conductivity of the specimens with different tire crumbs size are highly related to the air content
in their matrix since air has much lower density/thermal conductivity than water and solids: the
increase in the air content with decreasing tire crumbs size leads to lower bulk density and

11
thermal conductivity. It is confirmed in Fig. 6(c), in which the volumetric air content aq (the
volumetric ratio of air to the total volume of a compacted mixture) is determined by
s
dda G
w rrq --=1 (2)
where w is the water content, dr is the dry density of the mixture and sG is the specific gravity
of the mixture. As seen in Fig. 6, the volumetric air content of specimens with small tire crumbs
is more than that of specimens with large tire crumbs under all water contents. This is likely due
to the fact that small tire crumbs exhibits higher specific surface that results in higher air-
entrainment in their rough surface than large tire crumbs. Given the conduction mechanism at the
microscale, the decrease in the air content with decreasing tire crumbs size attenuates the thermal
bridge between solid particles and contributes to the decrease in heat conduction.
In general, it is observed in Figs. 4-6 that the changes of bulk density and thermal
conductivity with the water content display a similar trend: at a given compactive effort, the bulk
density and thermal conductivity increase with increasing water content, until the maximum bulk
density and maximum thermal conductivity are reached. Then, both the bulk density and thermal
conductivity slightly decrease with further increase in the water content. This trend can be
explained as follows: as water is added to a mine tailings and tire crumbs mixture, it replaces the
air, provoking increased bulk density as well as forms a thin film around the tailings solids and
rubber particles, acting as a thermal bridge for heat transfer; as the water content increases, the
pore air is replaced by water and solids, causing significant increases in the bulk density and
thermal conductivity; however, beyond a certain water content, the water takes up the space that
would have been occupied by the solids with little change of air volume near saturation, resulting
in slight reduction of bulk density and thermal conductivity (see Fig. 6). It is also found that a
12
maximum thermal conductivity tends to occur at the optimal water content corresponding to the
maximum bulk density, indicating the closest arrangement of solid particles. Similar
observations were obtained for fine-grained soils by Salomone and Kovacs (1983, 1984) who
used the term “critical water content” that is correlated to the optimum water content. Thus, it
can be demonstrated that the influence of water content on the thermal conductivity of the
compacted mine tailings and tire crumbs mixtures is more prominent when the water content is
less than the critical water content. On the other hand, the impact is minor when the water
content is higher than the critical water content. The critical water content is dependent on the
mixing ratio of tire crumbs, compactive effort and tire crumbs size, which is essentially
associated to the gradation, size, shape, surface roughness of the materials. Meanwhile, it is
worth noting that the thermal conductivity difference that is attributable to varying water
contents leads to the difference in microstructures formed during compaction. For instance,
Delage et al. (1996) investigated the impacts of water content change on the fabric of compacted
soils and pointed out that compaction on the dry side induces aggregate-dominated fabric
whereas the wet side causes matrix-dominated fabric without apparent aggregates.
Figure 7 shows the thermal conductivity, l , versus bulk density, br , of all specimens. The
thermal conductivity increases with increasing bulk density with a linear correlation (R2 = 0.93).
Therefore, one may recognize that the bulk density is a key property in heat transfer of
compacted geomaterials.
Anisotropy of Thermal Conductivity
Compacted geomaterials may form anisotropic fabrics attributed to the pore structure and
particle orientation. The fabric anisotropy often induces the anisotropy of engineering properties

13
(Mitchell and Soga 2005). In particular, the anisotropy of thermal conductivity of compacted
geomaterials may be significant in hear transfer.
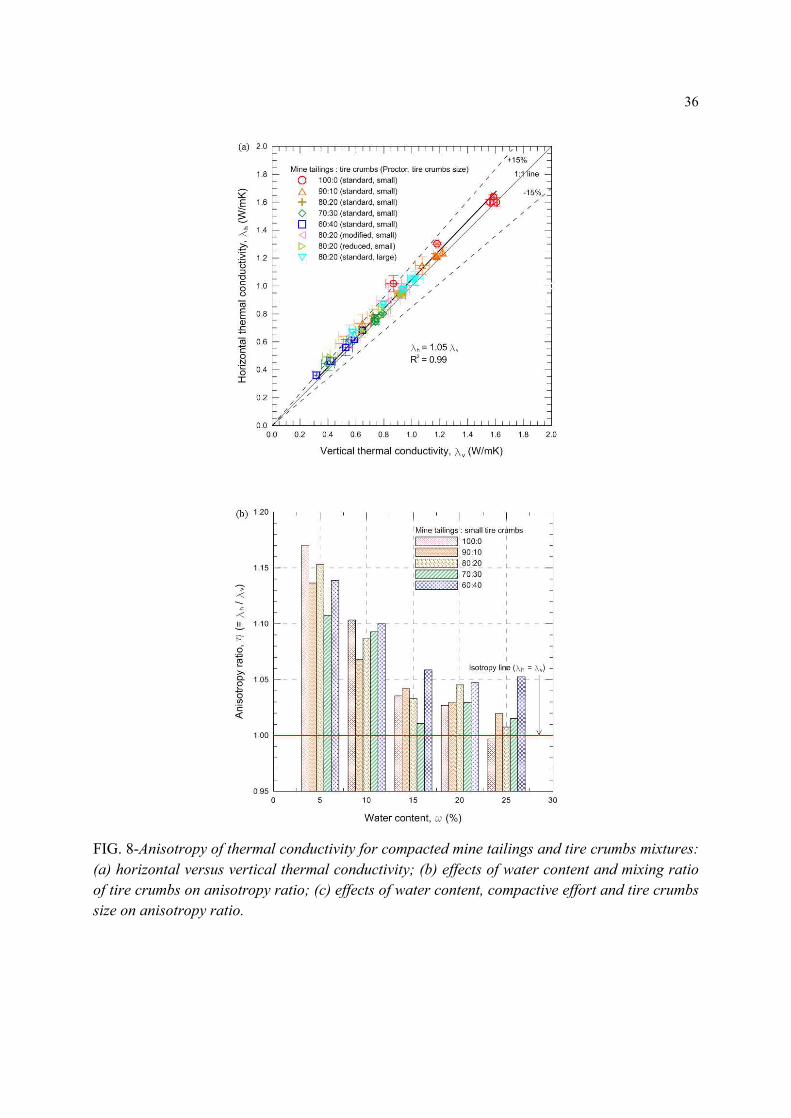
The horizontal thermal conductivity, hl , versus vertical thermal conductivity, vl , for all
specimens are plotted in Fig. 8(a). The thermal conductivity of the compacted mine tailings and
tire crumbs mixtures shows to be slightly anisotropic: the horizontal thermal conductivities are
higher than the vertical thermal conductivities with a difference less than 15%. The anisotropy
ratio h of thermal conductivity can be expressed as
v
h
llh = (3)
The linear regression of data in Fig. 8(a) yields an anisotropy ratio of 1.05 (R2 = 0.99). The
anisotropy may, in part, be due to the pore orientation as well as mineral and rubber bedding.
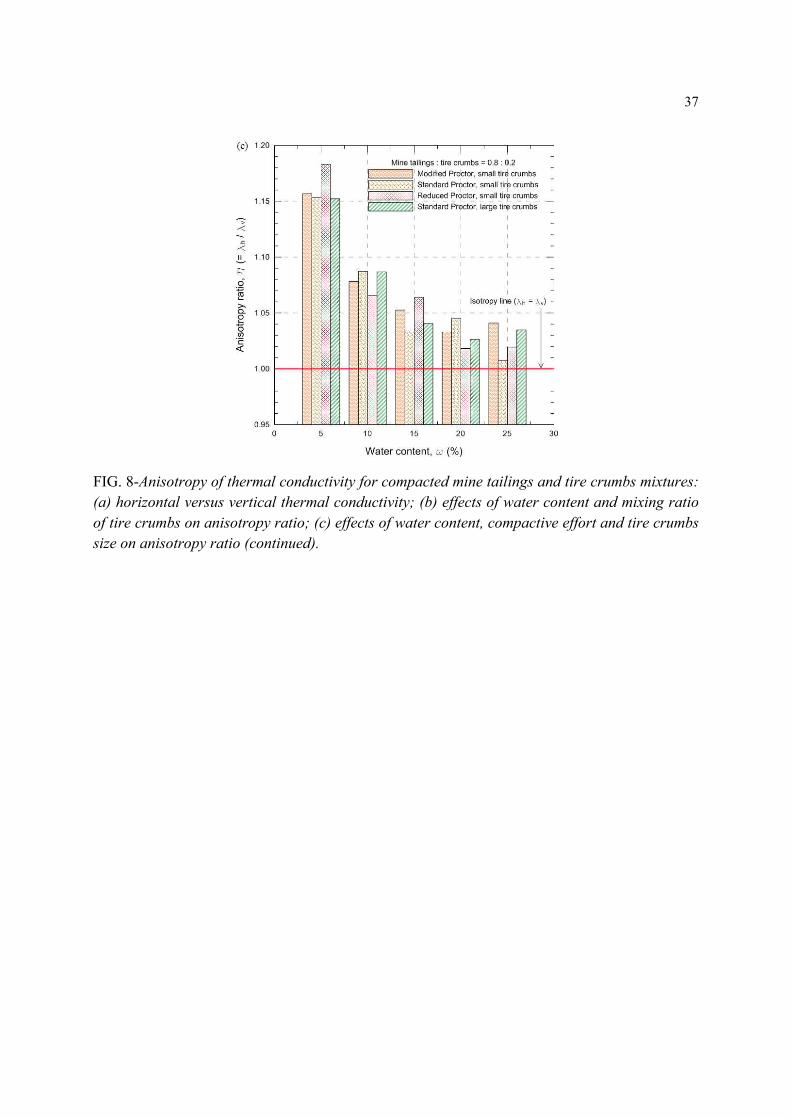
Meanwhile, the role of water content in the thermal conductivity anisotropy of the compacted
mine tailings and small tire crumbs mixture is illustrated in Figs. 8(b) and 8(c). The anisotropy
impact is more evident at lower water contents, regardless of the mixing ratio of tire crumbs,
compactive effort and tire crumbs size. In general, there is no significant effect of the mixing
ratio of tire crumbs on the thermal conductivity anisotropy. Anisotropy is also independent of the
compactive effort and tire crumbs sizes considered in this study. This observation on the
influence of water content to the thermal conductivity anisotropy of the compacted mixtures is
consistent with the understanding of the microstructure of compacted geomaterials, discussed
previously.
Statistical Analyses
14
The experimental results on compacted mixtures of mine tailings and tire crumbs have been
presented in Figs. 4-6 to demonstrate the correlations of the thermal conductivity as related to the
compositional and compaction factors. In this section, the statistical significance of these data is
analyzed. An ANOVA study was conducted by the general linear modeling procedure of a
statistical analysis software (SAS). Statistical significance was established when the calculated
F values exceeded the critical F values for a significance level of 5% (Montgomery et al. 2004).
The calculated F values, defined as the ratio of the between-samples sum of squares to the error
sum of squares, estimate the random error. The critical F value is the upper limit of the F ratio
and can be found in statistical references. The p value is the tail probability for a given
distribution, which will be less than 0.05 whenever the calculated F value is greater than the
critical F value, which is an indicator of the statistical significance in relation to the contribution
of a given variable.
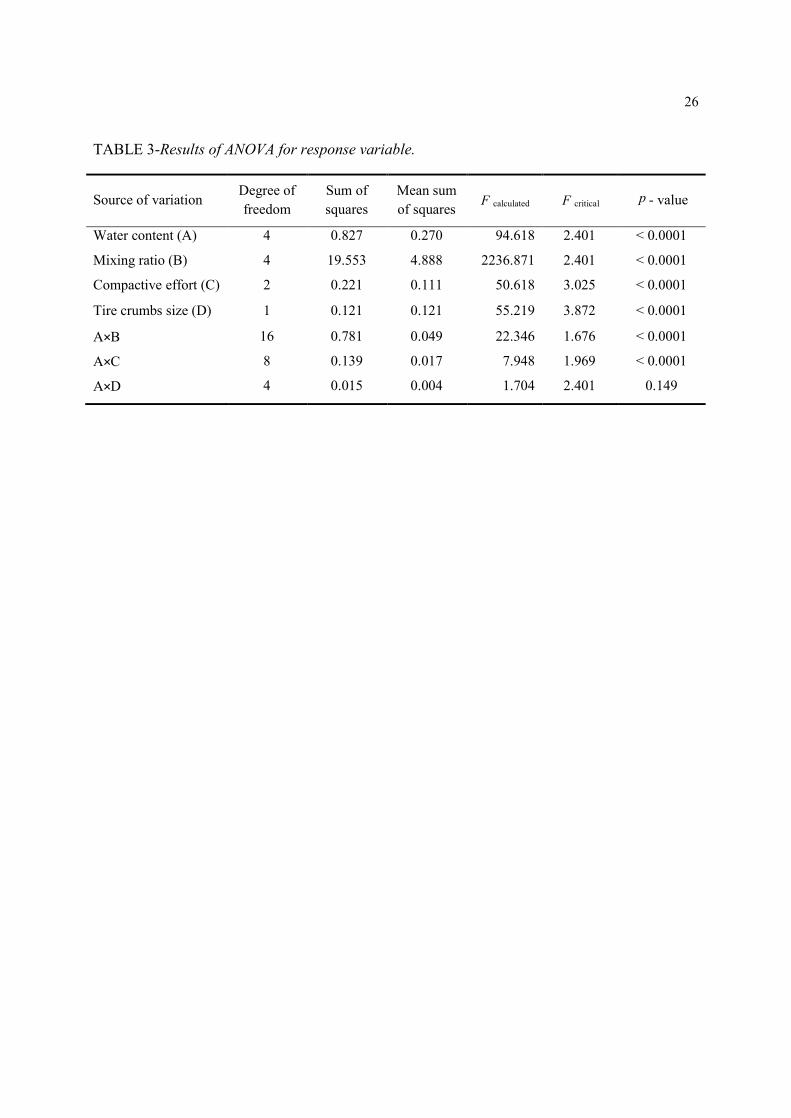
A four-factor ANOVA was carried out with the thermal conductivities measured on
compacted mine tailings and tire crumbs mixtures, which included four variables: water content
(A); mixing ratio of tire crumbs (B); compactive effort (C); and tire crumbs size (D); and their
two way interactions with the water content (AB, AC and AD). The results of the ANOVA
analysis are summarized in Table 3. It is shown that at a 95% confidence level, all factors affect
the thermal conductivity significantly, and the mixing ratio of tire crumbs has the most
significant influence. The significance of the four factors on the thermal conductivity of the
compacted mixtures is identified in the following order: the mixing ratio of tire crumbs, water
content, whereas the tire crumbs size and compactive effort show the similar significance level.
On the other hand, the two way interactions between the water content and other two factors, the
mixing ratio of tire crumbs and compactive effort, are statistically significant; while the

15
interaction of water content and tire crumbs size is not significant statistically to the variations of
the thermal conductivity.
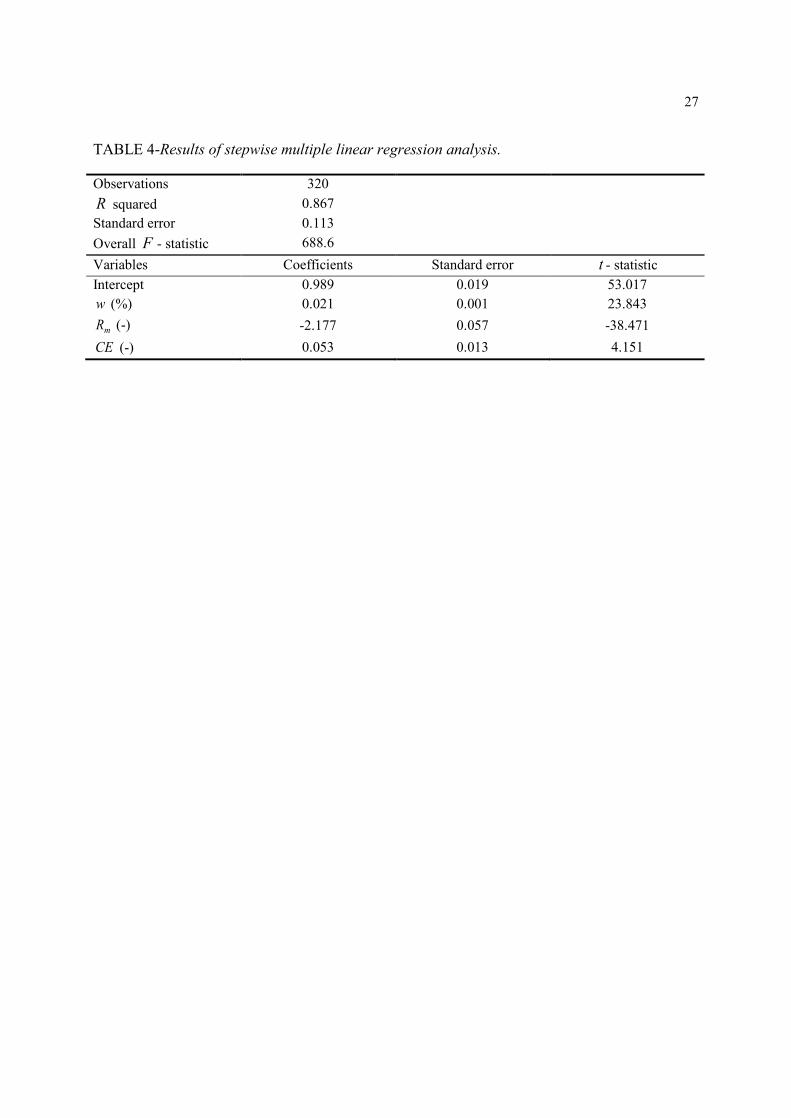
A stepwise multiple linear regression analysis was utilized to develop an empirical model to
capture the impact of the influencing factors on the thermal conductivity of the compacted mine
tailings and tire crumbs mixtures. Since the compactive effort is not a quantitative variable, a
multisource regression model that includes class independent variables as well as quantitative
independent variables was established. The development of the multisource regression model in
geoengineering applications were reported in the literature (Benson and Trast 1995; Nazzal et al.
2007). In stepwise regression procedures, the regression model was optimized by repeating the
procedures that add or delete an independent variable after checking its correlation with the
dependent variables until the selection of an additional independent variable did not increase the
coefficient of determination (R-squared) by a 5% level of significance (Brook and Arnold 1985).
The significance of the variables in a regression model can be evaluated by comparing the
calculated t value, defined as the ratio of the regression coefficient ib and its standard error SE ,
and the student’s t distribution. In other word, if the absolute value of calculated t value is less
than the student’s t distribution at a designed significance level, the variable is not affected
significantly to the regression model.
According to the stepwise regression analysis, it is found that the following equation best
fits the data:
CERw m 053.0177.2021.0989.0 +-+=l (4)
in which w is the water content, mR is the mixing ratio of tire crumbs. CE is the integer class
index representing compactive effort (compactive effort index): the CE = 1 is designated to the
16
energy level of the modified Proctor compaction; the CE = 0 is designated to the energy level of
the standard Proctor compaction; and the CE = -1 is designated to the energy level of the
reduced Proctor compaction. The tire crumbs size did not give any additional information with
statistical significance. One of possible reasons for this is that the data set is limited to only two.
The values of regression coefficient of the variables suggest that increasing water content and
compactive effort leads to the increase in the thermal conductivity whereas increasing mixing
ratio of tire crumbs results in the decrease in the thermal conductivity. This is consistent with the
trends observed in Figs. 4-6.
Table 4 presents the results of regression analysis on Eq 4 under a confidence level of 95%.
The coefficient of determination and standard error of the regression model are 0.867 and 0.113,
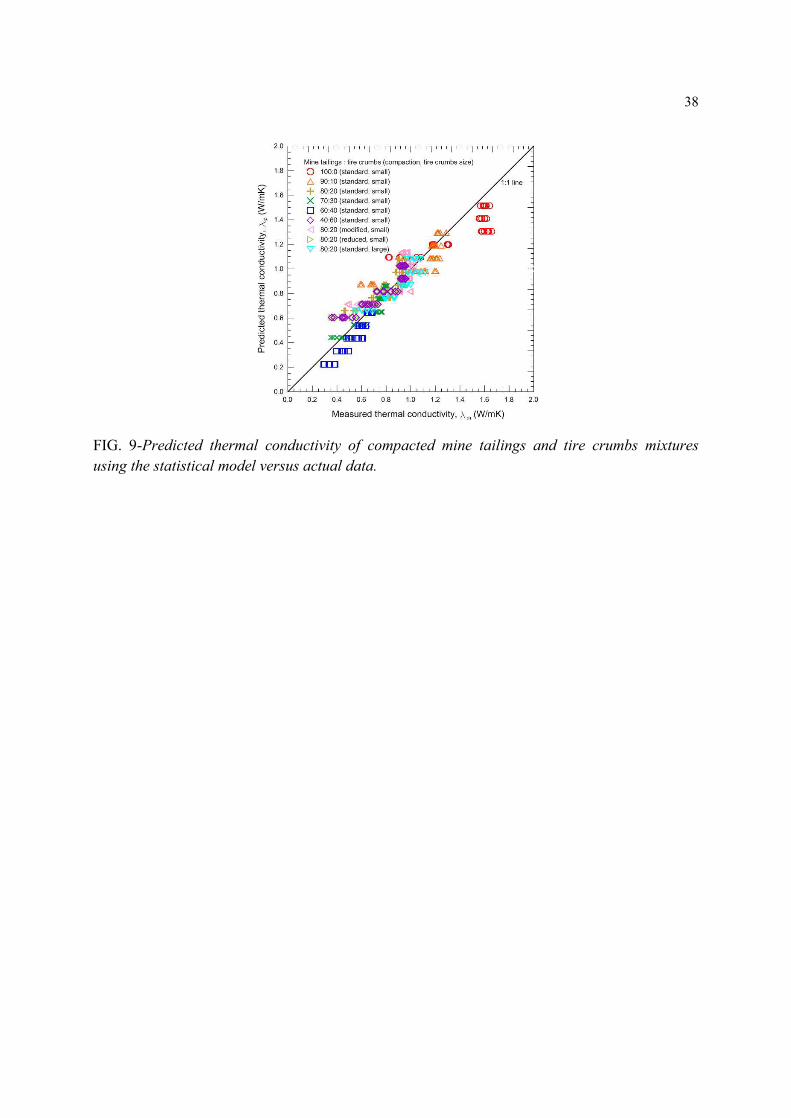
respectively, indicating Eq 4 fits the measured data very well. Figure 9 shows that the predicted
thermal conductivity pl , using the proposed model yields good agreement with the measured
thermal conductivity ml . The overall F value is 688.6, much greater than the F value at the
probability of 95% = 2.633. This indicates that the regression equation (Eq 4) with four variables
is statistically significant. Moreover, all absolute t values in Table 4 are greater than the t value
= 1.968 at the probability of 95%, implying that the water content, mixing ratio of tire crumbs,
compactive effort index and intercept are contributed significantly to the regression model.
Comparing to the t values obtained, the effect of the mixing ratio of tire crumbs to the observed
trend is greater than those other influencing factors, which is consistent with the results from the
four factor ANOVA test. Consequently, the regression equation relating to the water content w ,
mixing ratio of tire crumbs mR and compactive effort index CE is highly significant at 95%
confidence limits as indicated by statistical analyses. The results provide a insight to the thermal
17
conductivity of the compacted mine tailings and tire crumbs mixtures as affected by the water
content, mixing ratio of tire crumbs, compactive effort and tire crumbs size.
Conclusions
Mine tailings and tire crumbs are recycled solid wastes, and their mixtures can be beneficially
used as lightweight fill materials with improved thermal insulation for geoengineering
applications. Results of thermal conductivity tests performed on compacted mixtures of mine
tailings and tire crumbs are presented, and analyzed to identify the effect of water content,
mixing ratio of tire crumbs, compactive effort and tire crumbs size on the thermal conductivity.
The anisotropy of thermal conductivity was observed on compacted mixtures. The following is
the main conclusion of this study.
The thermal conductivity of the compacted mine tailings and tire crumbs mixtures depends
on the water content, mixing ratio of tire crumbs, compactive effort and tire crumbs size. The
thermal conductivity is sensitive to the water content when it is lower than a critical water
content, while it is almost independent of the water content after the critical water content is
exceeded. The thermal conductivity decreases with increasing the mixing ratio of tire crumbs. A
higher compactive effort leads to a higher thermal conductivity, and the compacted mixtures
with small tire crumbs have lower thermal conductivity than those with large tire crumbs. Linear
relationship is established between the thermal conductivity and bulk density for all specimens
tested.
There is a clear indication of thermal conductivity anisotropy of the compacted mixtures:
the horizontal thermal conductivities are higher than the vertical thermal conductivities with a
difference less than 15%. The anisotropy ratio of the thermal conductivity is estimated to be 1.05.
18
The thermal conductivity anisotropy is dependent on the water content: as the water content
increases, the thermal conductivity anisotropy reduces. In contrast, the mixing ratio of tire
crumbs, compactive effort and tire crumbs size show little influence on the thermal conductivity
anisotropy.
The ANOVA results indicates that the thermal conductivity of the compacted mixtures are
significantly affected by the water content, mixing ratio of mine tailings and tire crumbs,
compactive effort and size of tire crumbs at a confidence level of 95%. The stepwise multiple
linear regression analysis showed that the thermal conductivity of the compacted mixtures can be
predicted using a general model consisting of the mixture composition as quantitative variable
and compaction condition as an index variable.
The findings and interpretation methods presented in this study will be helpful for
comprehending the thermal conductivity behaviors of compacted rubberized geomaterials.
Acknowledgements
The authors acknowledge the financial support provided by the National Science and
Engineering Research Council of Canada (NSERC) and the University of Western Ontario,
London, Canada. The contribution of Goldcrop Musselwhite Mine and Emterra Tire Recycling
for providing test materials is also highly appreciated.
References
Abu-Hamdeh, N.H., and Reeder, R.C., 2000, “Soil Thermal Conductivity: Effects of Density,
Moisture, Salt Concentration, and Organic Matter,” Soil Sci. Soc. Am. J., Vol. 64, No. 4, pp.
1285-1290.
19
Amaratunga, L.M., 1995, “Cold-bond Agglomeration of Reactive Pyrrhotite Tailings for Backfill
Using Low Cost Binders: Gypsum β-Hemihydrorate and Cement,” Miner. Eng., Vol. 8, No.
12, pp. 1455-1465.
ASTM D698-07, 2007, “Standard Test Methods for Laboratory Compaction Characteristics of
Soil Using Standard Effort [12,400 ft-lb/ft3 (600 kN-m/m3)],” Annual Book of ASTM
Standards, West Conshohocken, Pa.
ASTM D6270-08, 2008, “Standard Practice for Use of Scrap Tires in Civil Engineering
Applications,” Annual Book of ASTM Standards, West Conshohocken, Pa.
ASTM D1557-09, 2009, “Standard Test Methods for Laboratory Compaction Characteristics of
Soil Using Modified Effort [56,000 ft-lb/ft3 (2700 kN-m/m3)],” Annual Book of ASTM
Standards, West Conshohocken, Pa.
Bachmann, J., Horton, R., Ren, T., and Van Der Ploeg, R.R., 2001, “Comparison of the Thermal
Properties of Four Wettable and Four Water-repellent Soils.” Soil Sci. Soc. Am. J., Vol. 65,
No. 6, pp. 1675-1679.
Benson, C.H., and Trast, J.M., 1995, “Hydraulic Conductivity of Thirteen Compacted Clays,”
Clays Clay Miner., Vol. 43, No. 6, pp. 669-681.
Brook, R.J., and Arnold, G.C., 1985, Applied Regression Analysis and Experimental Design,
Marcel Dekker, New York.
Bussiere, B., 2007, “Colloquium 2004: Hydrogeotechnical Properties of Hard Rock Tailings
from Metal Mines and Emerging Geoenvironmental Disposal Approaches,” Can. Geotech.
J., Vol. 44, No. 9, pp. 1019-1052.
Cetin, H., Fener, M., and Gunaydin, O., 2006, “Geotechnical Properties of Tire-cohesive Clayey
Soil Mixtures as a Fill Material,” Eng. Geol., Vol. 88, No.1-2, pp. 110-120.
Christ, M., and Park, J., 2010, “Laboratory Determination of Strength Properties of Frozen
rubber-sand Mixtures,” Cold Reg. Sci. Technol., Vol. 60, No. 2, pp. 169-175.
20
Daniel, D.E., and Benson, C.H., 1990, “Water Content-density Criteria for Compacted Soil
Liners,” J. Geotech. Geoenviron. Eng., Vol. 116, No. 12, pp. 1811-1830.
Delage, P., Audiguier, M., Cui, Y., and Howat, M.D., 1996, “Microstructure of a Compacted
Silt,” Can. Geotech. J., Vol. 33, No. 1, pp. 150-158.
Edincliler, A., Baykal, G., and Saygili, A., 2010, “Influence of Different Processing Techniques
on the Mechanical Properties of Used Tires in Embankment Construction,” Waste Manage.,
Vol. 30, No. 6, pp. 1073-1080.
Horai, K.I., 1971, “Thermal Conductivity of Rock-forming Minerals,” J. Geophys. Res., Vol. 76,
No. 5, pp. 1278-1308.
Kluitenberg, G.J., Bristow, K.L., and Das, B.S., 1995 “Error Analysis of Heat Pulse Method for
Measuring Soil Heat Capacity, Diffusivity, and Conductivity,” Soil Sci. Soc. Am. J., Vol. 59,
No. 3, pp. 719-726.
Lade, P.V., Liggio, C.D., and Yamamuro, J.A., 1998, “Effects of Non-plastic Fines on Minimum
and Maximum Void Ratios of Sand,” Geotech. Test. J., Vol. 21, No. 4, pp. 336-347.
Lee, J.K., and Shang, J.Q. (under review). “Thermal Properties of Mine Tailings and Tire
Crumbs Mixtures,” J. Geotech. Geoenviron. Eng..
Mitchell, J.K., and Soga, K., 2005, Fundamentals of Soil Behavior, 3rd ed., John Wiley & Sons,
New Jersey.
Montgomery, D.C., Runger, G.C., and Hubele, N.F., 2004, Engineering Statistics, 3rd ed., John
Wiley & Sons, New York.
Narsilio, G.A., Kress, J., and Yun, T.S., 2010, “Characterization of Conduction Phenomena in
Soils at the Particle-scale: Finite Element Analyses in Conjunction with Synthetic 3D
Imaging,” Comput. and Geotech., Vol. 37, No. 7-8, pp. 828-836.
Nazzal, M., Abu-Farsakh, M., and Mohammad, L., 2007, “Laboratory Characterization of
Reinforced Crushed Limestone Under Monotonic and Cyclic Loading,” J. Mater. Civil Eng.,
Vol. 19, No. 9, pp. 772-783.
21
Ochsner, T.E., Horton, R., and Ren, T., 2001, “A New Perspective on Soil Thermal Properties,”
Soil Sci. Soc. Am. J., Vol. 65, No. 6, pp. 1641-1647.
Ouellet, S., Bussiere, B., Mbonimpa, M., Benzaazoua, M., and Aubertin, M., 2006, “Reactivity
and Mineralogical Evolution of an Underground Mine Sulphidic Cemented Paste Backfill,”
Miner. Eng., Vol. 19, No. 5, pp. 407-419.
Salomone, L.A., and Kovacs, W.D., 1983, “The Use of Property Tests to Determine the Thermal
Properties of Soils,” Geotech. Test. J., Vol. 6, No. 4, pp. 173-180.
Salomone, L.A., and Kovacs, W.D., 1984, “Thermal Resistivity of Soils,” J. Geotech. Eng., Vol.
110, No. 3, pp. 375-389.
Steiner, G., and Komle, N.I., 1991, “A Model of the Thermal Conductivity of Porous Water Ice
at Low Gas Pressure,” Planet. Space Sci., Vol. 39, No. 3, pp. 507-513.
Tarnawski, V.R., Leong, W.H., and Bristow, K.L., 2000, “Developing a Temperature-dependent
Kersten Function for Soil Thermal Conductivity,” Int. J. Energ. Res., Vol. 24, No. 15, pp.
1335-1350.
Wang, H.L., Shang, J.Q., Kovac, V., and Ho, K.S., 2006, “Utilization of Atikokan Coal Fly Ash
in Acid Rock Drainage Control from Musselwhite Mine Tailings,” Can. Geotech. J., Vol.
43, No. 3, pp. 229-243.
Woodsinde, W., and Messmer, J.M., 1961, “Thermal Conductivity of Porous Media,” J. Appl.
Phys., Vol. 32, No. 9, pp. 1688-1706.
Yun, T.S., Dumas, B., and Santamarina, J.C., 2011, “Heat Transport in Granular Materials
During Cyclic Fluid Flow,” Granular Matter, Vol. 13, No. 1, pp. 29-37.
Nomenclature
cC coefficient of curvature
uC coefficient of uniformity
CE compactive effort index
22
10D effective size of particles (μm)
50D median size of particles (μm)
sG specific gravity
MTm mass of mine tailings (g)
TCm mass of tire crumbs (g)
mR mixing ratio of tire crumbs in a mixture
w water content (%)
optw optimum water content (%)
h anisotropy ratio of thermal conductivity
aq volumetric air content (m3/ m3)
l thermal conductivity (W/mK)
hl horizontal thermal conductivity (W/mK)
ml measured thermal conductivity (W/mK)
pl predicted thermal conductivity (W/mK)
vl vertical thermal conductivity (W/mK)
br bulk density (g/cm3)
dr dry density (g/cm3)
23
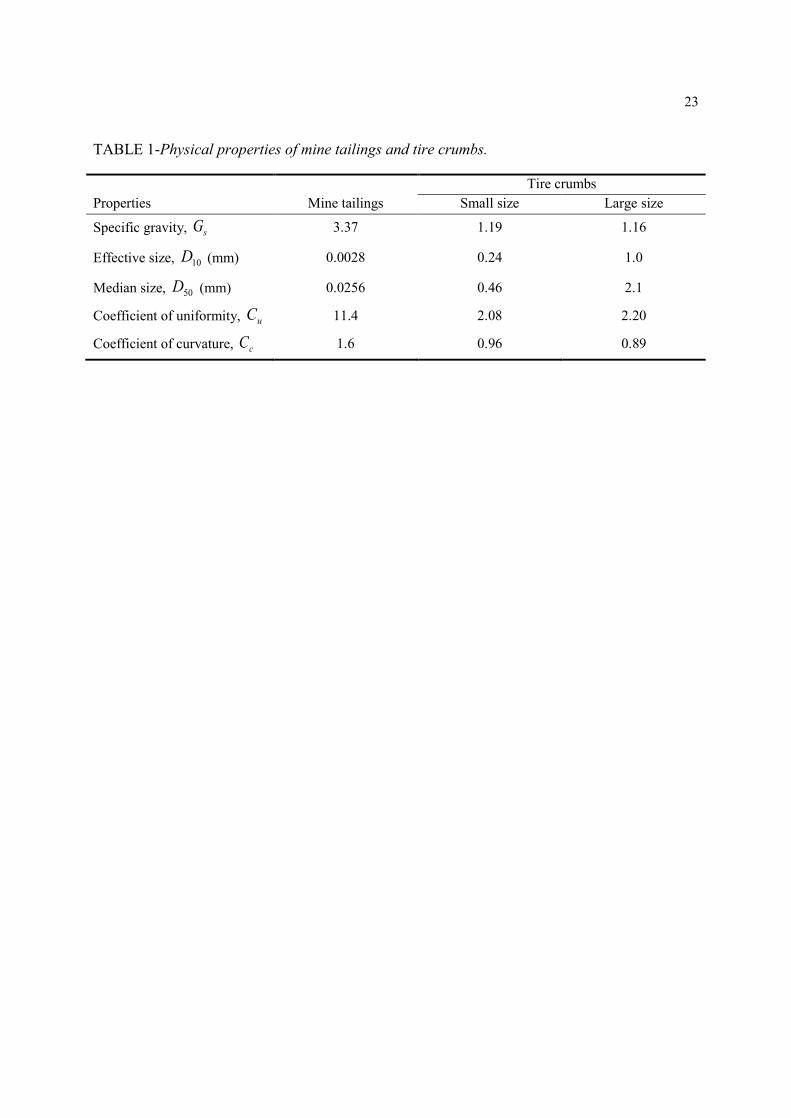
TABLE 1-Physical properties of mine tailings and tire crumbs.
Tire crumbs Properties Mine tailings Small size Large size
Specific gravity, sG 3.37 1.19 1.16
Effective size, 10D (mm) 0.0028 0.24 1.0
Median size, 50D (mm) 0.0256 0.46 2.1
Coefficient of uniformity, uC 11.4 2.08 2.20
Coefficient of curvature, cC 1.6 0.96 0.89
24
TABLE 2-Summary of horizontal, vertical and overall thermal conductivities of compacted mixtures tested.
Specimen ID hl
*
vl* l **
Median (W/mK)
Mean (W/mK)
SD (W/mK)
Median (W/mK)
Mean (W/mK)
SD (W/mK)
Media (W/mK)
Mean (W/mK)
SD (W/mK)
TC0.0-SP-S-W5 1.011 1.017 0.059 0.869 0.869 0.055 0.943 0.943 0.095 TC0.0-SP-S-W10 1.303 1.302 0.007 1.179 1.180 0.008 1.243 1.241 0.066 TC0.0-SP-S-W15 1.635 1.638 0.015 1.579 1.582 0.011 1.611 1.610 0.032 TC0.0-SP-S-W20 1.604 1.600 0.018 1.557 1.558 0.004 1.570 1.579 0.026 TC0.0-SP-S-W25 1.593 1.599 0.033 1.606 1.604 0.011 1.600 1.601 0.023 TC0.1-SP-S-W5 0.731 0.733 0.066 0.645 0.645 0.059 0.687 0.689 0.075 TC0.1-SP-S-W10 1.151 1.147 0.062 1.073 1.074 0.049 1.109 1.111 0.065 TC0.1-SP-S-W15 1.216 1.219 0.013 1.169 1.170 0.013 1.197 1.195 0.029 TC0.1-SP-S-W20 1.202 1.211 0.018 1.174 1.176 0.007 1.190 1.194 0.024 TC0.1-SP-S-W25 1.232 1.243 0.030 1.220 1.219 0.003 1.222 1.231 0.024 TC0.2-SP-S-W5 0.593 0.587 0.051 0.511 0.509 0.052 0.554 0.548 0.063 TC0.2-SP-S-W10 0.784 0.786 0.049 0.724 0.723 0.042 0.749 0.755 0.054 TC0.2-SP-S-W15 0.943 0.940 0.013 0.911 0.910 0.017 0.925 0.925 0.021 TC0.2-SP-S-W20 0.947 0.945 0.023 0.907 0.904 0.028 0.928 0.925 0.035 TC0.2-SP-S-W25 0.933 0.933 0.020 0.927 0.926 0.029 0.933 0.930 0.023 TC0.3-SP-S-W5 0.442 0.443 0.050 0.401 0.400 0.047 0.417 0.422 0.051 TC0.3-SP-S-W10 0.610 0.612 0.029 0.559 0.560 0.027 0.584 0.586 0.038 TC0.3-SP-S-W15 0.748 0.746 0.023 0.737 0.738 0.026 0.744 0.742 0.023 TC0.3-SP-S-W20 0.766 0.766 0.030 0.742 0.744 0.012 0.756 0.755 0.016 TC0.3-SP-S-W25 0.805 0.802 0.008 0.792 0.790 0.006 0.795 0.796 0.009 Note: TC = tire crumbs; SP = standard Proctor; MP = modified Proctor; RP = reduced Proctor; S = small tire crumbs; L = large tire crumbs; W = water content; SD = standard deviation; the numbers that follow the TC and W indicate the mixing ratio of tire crumbs (g/g) and water content (%) in the compacted specimen, respectively; an asterisk indicates the statistical estimates of four measurements of the specimen and a double asterisk indicates the statistical estimates of eight measurements of the specimen.
25
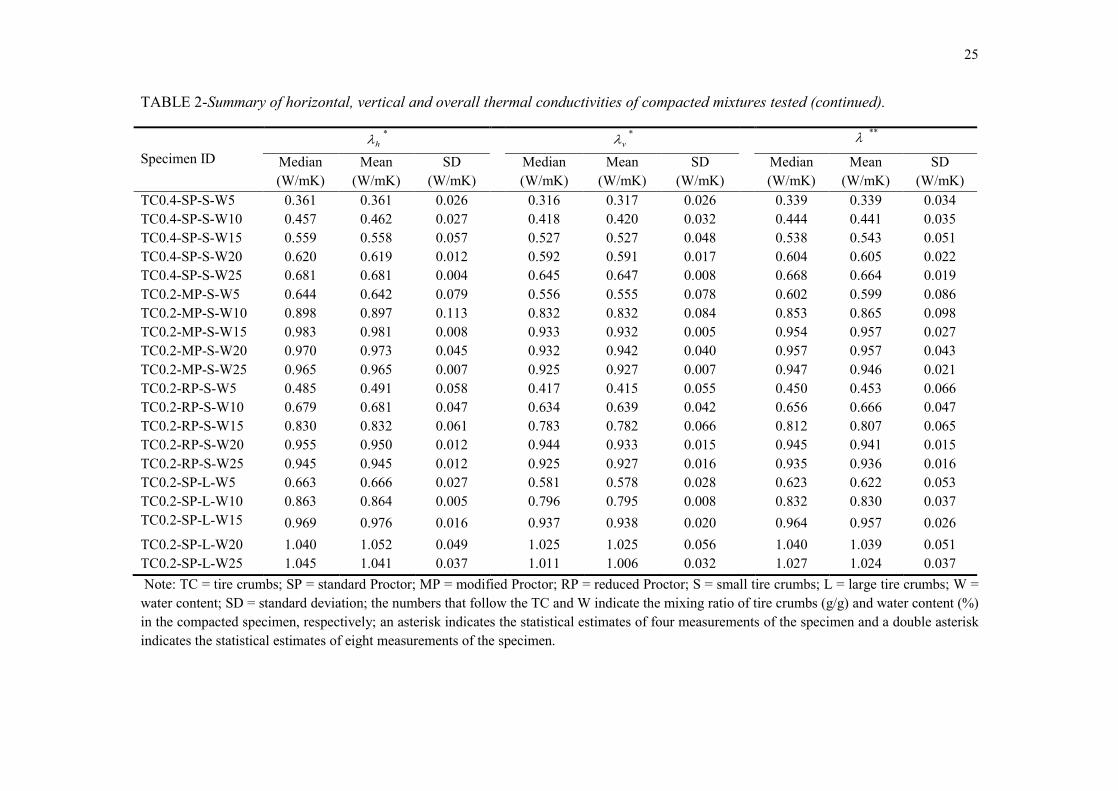
TABLE 2-Summary of horizontal, vertical and overall thermal conductivities of compacted mixtures tested (continued).
Specimen ID hl
*
vl* l **
Median (W/mK)
Mean (W/mK)
SD (W/mK)
Median (W/mK)
Mean (W/mK)
SD (W/mK)
Median (W/mK)
Mean (W/mK)
SD (W/mK)
TC0.4-SP-S-W5 0.361 0.361 0.026 0.316 0.317 0.026 0.339 0.339 0.034 TC0.4-SP-S-W10 0.457 0.462 0.027 0.418 0.420 0.032 0.444 0.441 0.035 TC0.4-SP-S-W15 0.559 0.558 0.057 0.527 0.527 0.048 0.538 0.543 0.051 TC0.4-SP-S-W20 0.620 0.619 0.012 0.592 0.591 0.017 0.604 0.605 0.022 TC0.4-SP-S-W25 0.681 0.681 0.004 0.645 0.647 0.008 0.668 0.664 0.019 TC0.2-MP-S-W5 0.644 0.642 0.079 0.556 0.555 0.078 0.602 0.599 0.086 TC0.2-MP-S-W10 0.898 0.897 0.113 0.832 0.832 0.084 0.853 0.865 0.098 TC0.2-MP-S-W15 0.983 0.981 0.008 0.933 0.932 0.005 0.954 0.957 0.027 TC0.2-MP-S-W20 0.970 0.973 0.045 0.932 0.942 0.040 0.957 0.957 0.043 TC0.2-MP-S-W25 0.965 0.965 0.007 0.925 0.927 0.007 0.947 0.946 0.021 TC0.2-RP-S-W5 0.485 0.491 0.058 0.417 0.415 0.055 0.450 0.453 0.066 TC0.2-RP-S-W10 0.679 0.681 0.047 0.634 0.639 0.042 0.656 0.666 0.047 TC0.2-RP-S-W15 0.830 0.832 0.061 0.783 0.782 0.066 0.812 0.807 0.065 TC0.2-RP-S-W20 0.955 0.950 0.012 0.944 0.933 0.015 0.945 0.941 0.015 TC0.2-RP-S-W25 0.945 0.945 0.012 0.925 0.927 0.016 0.935 0.936 0.016 TC0.2-SP-L-W5 0.663 0.666 0.027 0.581 0.578 0.028 0.623 0.622 0.053 TC0.2-SP-L-W10 0.863 0.864 0.005 0.796 0.795 0.008 0.832 0.830 0.037 TC0.2-SP-L-W15 0.969 0.976 0.016 0.937 0.938 0.020 0.964 0.957 0.026 TC0.2-SP-L-W20 1.040 1.052 0.049 1.025 1.025 0.056 1.040 1.039 0.051 TC0.2-SP-L-W25 1.045 1.041 0.037 1.011 1.006 0.032 1.027 1.024 0.037 Note: TC = tire crumbs; SP = standard Proctor; MP = modified Proctor; RP = reduced Proctor; S = small tire crumbs; L = large tire crumbs; W = water content; SD = standard deviation; the numbers that follow the TC and W indicate the mixing ratio of tire crumbs (g/g) and water content (%) in the compacted specimen, respectively; an asterisk indicates the statistical estimates of four measurements of the specimen and a double asterisk indicates the statistical estimates of eight measurements of the specimen.
26
TABLE 3-Results of ANOVA for response variable.
Source of variation Degree of freedom
Sum of squares
Mean sum of squares F calculated F critical p - value
Water content (A) 4 0.827 0.270 94.618 2.401 < 0.0001
Mixing ratio (B) 4 19.553 4.888 2236.871 2.401 < 0.0001
Compactive effort (C) 2 0.221 0.111 50.618 3.025 < 0.0001
Tire crumbs size (D) 1 0.121 0.121 55.219 3.872 < 0.0001
A×B 16 0.781 0.049 22.346 1.676 < 0.0001
A×C 8 0.139 0.017 7.948 1.969 < 0.0001
A×D 4 0.015 0.004 1.704 2.401 0.149
27
TABLE 4-Results of stepwise multiple linear regression analysis.
Observations 320 R squared 0.867 Standard error 0.113 Overall F - statistic 688.6 Variables Coefficients Standard error t - statistic Intercept 0.989 0.019 53.017 w (%) 0.021 0.001 23.843
mR (-) -2.177 0.057 -38.471 CE (-) 0.053 0.013 4.151
28
FIG. 1-Particle size distributions of test materials.
29
FIG. 2-A compacted specimen of mine tailings and small tire crumbs mixtures with the mixing ratio of tire crumbs of 0.2 and the water content of 15% (i.e., TC0.2-SP-S-W15).
30
FIG. 3-Variations of maximum dry density and optimum water content with mixing ratio of tire crumbs.
31
FIG. 4-Variations of bulk density and thermal conductivity with water content for compacted mine tailings and small tire crumbs mixtures with different mixing ratios of tire crumbs.
32
FIG. 5-Variations of bulk density and thermal conductivity with water content for compacted mine tailings and small tire crumbs mixtures with different compactive efforts.
33
FIG. 6-Variations of (a) bulk density, (b) thermal conductivity, and (c) volumetric air content with water content for compacted mixtures with different tire crumbs sizes.
34
FIG. 6-Variations of (a) bulk density, (b) thermal conductivity, and (c) volumetric air content with water content for compacted mixtures with different tire crumbs sizes (continued).

35
FIG. 7-Relationship between thermal conductivity and bulk density for all compacted mixtures.
36
FIG. 8-Anisotropy of thermal conductivity for compacted mine tailings and tire crumbs mixtures: (a) horizontal versus vertical thermal conductivity; (b) effects of water content and mixing ratio of tire crumbs on anisotropy ratio; (c) effects of water content, compactive effort and tire crumbs size on anisotropy ratio.
37
FIG. 8-Anisotropy of thermal conductivity for compacted mine tailings and tire crumbs mixtures: (a) horizontal versus vertical thermal conductivity; (b) effects of water content and mixing ratio of tire crumbs on anisotropy ratio; (c) effects of water content, compactive effort and tire crumbs size on anisotropy ratio (continued).
38
FIG. 9-Predicted thermal conductivity of compacted mine tailings and tire crumbs mixtures using the statistical model versus actual data.