thermal conductivity of cementitious grouts for
TRANSCRIPT

BNL-65129 INFORMAL REPORT
THERMAL CONDUCTIVITY OF CEMENTITIOUS GROUTS FOR GEOTIHERMAL HEAT PUMPS
PROGRESS REPORT FY 1997
Mark L. Allan
November 1997
Prepared for: Office of Geothermal Technologies United States Department of Energy Washington, DC 20585
Energy Efficiency and Conservation Division
OFFlClAL FILE COF’Y

DISCLA.MER
This report was prepared as an account of work sponsored by an agency of the United States Government. Neither the United States Government nor any agency thereof, nor any of their employees, nor any of their contractors, sub-contractors, or their employees makes any warranty, express or implied, or assumes any legal liability or responsibility for the accuracy, completeness, or usefulness of any information, apparatus, product or process disclosed, or represents that its use would not infringe privately lowned rights. Reference herein to any specific commercial product, process, or service by trade name, trademark, manufacturer, or otherwise, does not necessarily constitute or imply its endorsement, recommendation, or favoring by the United States Government or any agency thereof., The views and opinions of authors expressed herein do not necessarily state or reflect thoe of the United States Government or any agency, contractor, or subcontractor thereof.

BNL-65129 INFORMAL REPOlRl
THERMAL CONDUCTIVITY OF CEMENTITIOUS GROUTS FOR GEOTHERMAL HEAT PUMPS
PROGRESS REPORT FY 1997
BY:
MARITA L. ALLAN
NOVEMBER 1997
Prepared for:
Office of Geothermal Technologies United States Department of Energy
\niIashington, DC 20585
Under Contract No. IDE-AC02-76CH00016
Brookhaven National Laboratory Upton, NY 11973-5000

TABLE OF CONTENTS
SummarY ....................................................................................................................................... vii
Acknowledgements ..................................................................................................................... ix
1.0 Introduction ........................................................................................................................... 1
2.0 Experimental Procedure ...................................................................................................... 2
2.1 2.2 2.3 2.4 2.5 2.6 2.7 2.8 2.9 2.10 2.11 2.12 2.13 2.14
Materials ........................................................................................................... 2 Mixing ............................................................................................................... 4 Specific Gravity .................................................................................................... 4 Rheology ............................................................................................................ 4 Bleeding .............................................................................................................. 4
ThermaI Conductivity Measurements ..................................................................... 4 Permeability ......... . .................................................................................................. 5 Linear Shrinkage ........ .......................................................................................... .6 ,, Linear Coefficient of Thermal Expansion ................................................................... 6 Bond Strength.. ............................. ........................................................................... 7 Sulphate Resistance ................................................................................................ 7 Wet-Dry Cycles ......... . ........................................................................................... 8 Environmental Impact ............................................................................................ 8 Simulated Boreholes ,, ............................................................................................... 9
3.0 Results ..................................................................................................................... 10
3.1 Rheology ................ ......................................................................................... 10
3.2 Bleeding .............................................................................................................. 15
3.3 Thermal Conductivity Measurements .................................................................. 15
3.4 Permeabiity ......................................................................................................... .20 3.5 Linear Shrinkage .................................................................................................... .22 3.6 Liiear Coefficient of Thermal Expansion ................................................................ .22 3.7 Bond Strength ..................................................................................................... 22 3.8 Sulphate Resistance ............................................................................................... 26
3.9 Wet-Dry Cycles ..................................................................................................... 26 3.10 Environmental Impact ............................................................................................. 27
3.11 Temperature-Tie ...... ......................................................................................... 28 3.12 Microstructure .................................................................................................. 31
4.0 Discussion ...................................................................................................................... 34 4.1 Thermal Conductivity ........................................................................................ .34 4.2 Rheology ............ . ............................................................................................ 36
4.3 Bleeding .................. . .................................................................................. 37
4.4 PelIlleabity ........... . ................................................................................................. 38
4.5 Linear Shrinkage ...................................................................................................... 39
4.6 Cbefkient of Thermal Expansion ............................................................................. 39
4.7 Bond Strength ....................................................................................................... .40

IhI& of Cants (Continued...)
4.8 4.9 4.10 4.11 4.12 4.13 4.14 4.15 4.16 4.17 4.18
Mkrostructure. . . . ,. . . . . . . , . . . . . . . . . . . . . . . . . . . . . . . . . . . . . . . . . . . . . . . . . . . . . . . . . . . . . . . . . . . . . . . . . . . . . . . . . . . . . . . . . . . . . . . . . . .40 Sulphate Resistance.. . . . . . . . . . . . . . . . . . . . . . . . . . . . . . . . . . . . . . . . . . . . . . . . . . . . . . . . . . . . . . . . . . . . . . . . . . . . . . . . . . . . . . . . . . . . .4 1 wet-Dly Durabiity . . . . . . . . . . . . . . . . . . . . . . . . . . . . . . . . . . . . . . . . . . . . . . . . . . . . . . . . . . . . . . . . . . . . . . . . . . . . . . . . . . . . . . . . . . . . . . . 41 Freeze-Thaw Durability . . . . . . . . . . . . . . . . . . . . . . . . . . . . . . . . . . . . . . . . . . . . . . . . . . . . . . . . . . . . . . . . . . . . . . . . . . . . . . . . . . . . . . . . 41 Environmental Impact II.. . . . . . . . . . . . . . . . . . . . . . . . . . . . . . . . . . . . . . . . . . . . . . . . . . . . . . . . . . . . . . . . . . . . . . . . . . . . . . . . . . . . . . . . . . .4 1 Temperature-Time.. . . . . . . . ,. . . . . . . . . . . . . . . . . . . . . . . . . . . . . . . . . . . . . . . . . . . . . . . . . . . . . . . . . . . . . . . . . . . . . . . . . . . . . . . . . . . . -42 Grout Mixing.. . . . . . . . . . . . . . . . ., . . . . . . . . . . . . . . . . . . . . . . . . . . . . . . . . . . . . . . . . . . . . . . . . . . . . . . . . . . . . . . . . . . . . . . . . . . . . . . . . . . . .42 BoreLengthDesign . . . . . . . . . . . . . . . . . . . . . . . . . . . . . . . . . . . . . . . . . . . . . . . . . . . . . . . . . . . . . . . . . . . . . . . . . . . . . . . . . . . . . . . . . . . . . . . 44 costs . . . ..~................................................................................................................. 45 Thermal Resistance Tests . . . . . . . . . . . . . . . . . . . . . . . . . . . . . . . . . . . . . . . . . . . . . . . . . . . . . . . . . . . . . . . . . . . . . . . . . . . . . . . . . . . . 47 Future Work . . . . . . . . . . . ..~................~........................................................................ 47
5.0 Conclusions ................................................................................................................. .47
6.0 References ................................................................................................................. .48
Vi

SUMMARY
The thermal conductivity of cementitious grouts was investigated in order to determine suitability of these materials for grouting vertical boreholes used with geothermal heat pump systems. In addition, other relevant physical and mechanical properties were determined. Emphasis was placed on evaluation of cement-sand grouts to take adlvantage of ready availability, simplicity, low cost, widespread use for other applications and good thermal properties. Different sand gradations were tested to determine effects on thermal conductivity and compatibility with pumpability requirements. The roles of mix variables such as water/cement ratio and sand/cement ratio were measured. Superplasticizer was used to improve tlow characteristics and supplementary cementing materials (fly ash and ground granulated blast furnace slag) were used to improve durability. The compatibility of optimizing thermal conductivity with other property criteria was investigated. The cement-sand grouts were tested for rheological characteristics, bleeding, permeability, bond to HDPE pipe, shrinkage, coefficient of thermal expansion, exotherm, durability and environmental impact. Comparisons were made with conventional neat cement grout to quantity the benefit of adding sand to the grout formulations.
It was found that the thermal conductivities of the cement-sand grouts ranged from 1.73 1 to 2.644 W/m.K (1.000 to 1.528 Btu/hr.ft.“F), depending on sand/cement ratio and sand type. This compares with 0.803 to 0.868 W/m.K for neat cement grouts, 0.75 to 0.80 W/m.K for conventional high-solids bentonite grout and 1.,46 W/m.K for thermally enhanced bentonite. The thermal conductivity of neat cement and bentonitic grouts decreases significantly under drying conditions. The reduction in conductivity of cement-sand grouts depends on mix proportions and is typically 5- 11% for the mixes of interest.
The permeability of the bulk cement-sand grouts was of the order of 10“’ cm/s. Permeability tests performed on grout cast around a length of polyethylene pipe showed that increased flow occurred due to a higher permeability pathway at the grout-pipe interface. The magnitude of permeability increase depended on mix proportio’ns at it was found that grouts containing sand had values still of the order of 10“’ cm/s whereas flow in neat cement grout-pipe specimens increased an order of magnitude.
Mechanical bond strength was measured and it was found that the bond between neat cement grout and pipe was weak. Addition of sand to the grout improved bond strength significantly. Improved bonding was correlated with decreased shrinkage of the cement-sand grouts as compared to neat cement grouts. Shrinkage for the developed grouts depended on sand content, super-plasticizer dosage and water/cement ratio. After 91 days the linear shrinkage of cement-sand grouts was typically 0.24 to 0.28%, whereas neat cement grout with water/cement ratio = 0.8 shrunk 0.59%.
The peak temperatures measured in a simulated 4 in. diameter borehole were 5 1.2”C for a Type I cement-sand grout and 36.7”C for a slag-modified grout. Reduction of grout exotherm by addition of blast furnace slag or fly ash did not result in improved bonding. This was explained by the counterbalancing effect of increased initial shrinkage associated with the use of slag or fly ash.
Vii

Leach tests showed that the developed grouts do not adversely affect water quality other than an increase in pH which tends to be mitigated with time. Quantities of heavy metals in the leachate were below the maximum levels stated in the EPA. Drinking Water Standards. Resistance to sulphate attack of the grouts was evaluated since some groundwaters contain sulphates in concentrations that are deleterious to cementitious materials. It was determined that the potentially adverse effects of sulphates could be overcome by adding ground granulated blast furnace slag or fly ash to the grouts, or by using sulphate resistant cements (Types II and V). Wet-dry cycles demonstrated that conventional neat cement grouts are prone to severe cracking and that crack resistance is greatly improved by addition of sand.
The estimated cost of superplasticized grout with sand&ment = 2.5, water/cement = 0.6 and thermal conductivity = 2.53 1 W/m.K is 15.9 c/litre (60.1 c/ gallon). A grout with sand/cement = 2.13, water/cement = 0.57 and thermal conductivity = 2.421 W/m.K has an estimated cost of 16.1 c/&e (60.9 &allon). The required bjore lengths for residential, commercial and school applications were compared for different grout th,ermal conductivities by a team of students at the University of Alabama. For the test cases the theoretical reductions in bore length would be around 8% by raising thermal conductivity from 1.46 to 2.42 W/m.K. Previous analysis showed that use of cement-sand grouts with thermal conductivity of 2.34 W/m.K would theoretically allow bore length reductions of 22-37% compared with a neat cement grout having a conductivity of 0.84 W/m.K.
Although cement-sand grouts can be mixed in a low shear paddle mixer currently used for high solids bentonite GHP grouts, a l&h shear colloidal type mixer is preferred due to reduced mixing time, rapid discharge, improved mixing and superior grout properties.
In FY 98 it is planned to conduct a field demonstration using one of the developed grouts. In-situ thermal conductivity measurements will be performed and compared with laboratory data. Heat pump performance will be mor&ored over heating and cooling seasons. The field demonstration will enable quantitative comparison of the selected cement-sand grout with conventional grouts under actual working conditions. Further studies of bonding of cementitious grouts to U-tube and surrounding formation will be conducted, includiig analysis of the effect of contact resistance on heat transfer.
viii

KKNOWLEDGEMENTS
This work was funded by the U.S. Department of Energy Office of Geothermal Technologies. Special thanks are due to Lew Pratsch and Ray LaSala of DOE for their support and assistance.
ix

__ _*_._ -----
1.0 INTRODUCTION
Grout is used to seal the annulus between the borehole and heat exchanger loops in vertical geothermal (ground coupled, ground source, GeoExchange) heat pump systems. The grout provides a heat transfer medium between the heat exchanger and surrounding formation, controls groundwater movement and prevents contamination of water supply. Enhanced heat pump coefficient of performana (COP) and reduced up-front loop installation costs can be achieved through optimization of the grout thermal conductivity.
Granular bentonite-water mixes are commonly used as grouting materials (E&hart, 1991). However, these grouts have relatively low thermal conductivity that typically ranges from 0.65 to 0.90 W/m.K (Remund and Lund, 1993). In addition, bentonite grouts are subject to seepage, shrinkage and desiccation. Instability of bentonite grouts in dry soils has a severe impact on heat transfer due to significant decrease in thermal conductivity and loss of thermal coupling associated with dehydration. Bentonite grouts are not recommended for sealing groundwater monitoring wells in the vadose zone of arid regions due to desiccation (ASTM D 5092-90). The thermal conductivity ofbentonite grouts can be improved through incorporation of filler materials such as quartzite sand (Remund and Lund, 1993).
Properly designed and mixed cementitious grouts have potential for use as GHP grouts provided thermal conductivity, cost, durability and other requirements can be grouts are relatively inexpensive, safe and easy to work with, and comprised materials. Implementation of grouting technology from geotechnical, civil engineering applications would be of benefit to the GHP industry.
met. Cementitious of readily available and environmental
The objective of the work reported was to characterize thermal conductivity and other pertinent properties of conventional and filled cementitious grouts. Cost analysis and calculations of the reduction in heat exchanger length that could be achieved with such grouts were performed by the University of Alabama.
Two strategies to enhance the thermal conductivity of cementitious grouts were used simultaneously. The first of these was to incorporate high thermal conductivity filler in the grout formulations. Based on previous tests (Allan and Kavanaugh, in preparation), silica sand was selected as a suitable filler. The second strategy was to Ireduce the water content of the grout mix. By lowering the water/cement ratio, the porosity of the hardened grout is decreased. This results in higher thermal conductivity. Lowering the water/cement ratio also improves such properties as permeability, strength, and durability. The addition of a liquid super-plasticizer (high range water reducer) to the grout mixes enabled reduction of water/cement ratio while retaining pumpability. Super-plasticizers are commonly used in the concrete and grouting industry to improve rheological properties.

.- .-_ _-._ __.__ _ _ . .
2.0 EXPERIMENTAL PROCEDIJRE:
2.1 Materials
Types I, II and V cement (ASTM C 150) were used. Fly ash (FA) and ground granulated blast fLrnace slag (BFS) were used as partial replacement for Type I cement in some of the grout formulations. These supplementary cementing materials are recognized for their ability to enhance durability in adverse environments (e.g., aggressive groundwater), reduce heat of hydration and reduce cost. The fly ash conformed to ASTM C 6 118 Class F. This is a low calcium fly ash produced f?om combustion of bituminous coal. The blast timace slag was ASTM C 989 Grade 100. Cement replacement levels of 40, 60 and 75% by mass were used. The combined cement and fly ash or slag is referred to as “cement.itious material”.
The superplasticizer (SP) used was a sulfonated naphthalene type with a solids content of 42% by mass and was supplied by Master Builders Technologies (Rheobuild 1000). This chemical admixture tinctions as a dispersant and increases grout fluidity. Thus, superplasticizer allowed the water content of the grout to be reduced while maintaining pumpability. The aim was to keep the water/cementitious material ratio (w,“c) as low as possible in order to improve thermal properties, reduce permeability, and increase durability. The grout used for backfilling vertical GHP heat exchangers must be self-levelling without vibration and must form a uniform heat transfer medium free from air gaps and appropriate use of superplasticizers helps to achieve these properties.
Silica sand was chosen as a particulate filler to increase thermal conductivity of the cementitious grouts. This decision war; based on previous data that showed the efficacy of sand for improving thermal properties, ready availability, low cost, compatibility with grout mixing and placement equipment and ease of use. Different gradations of sand were evaluated. These were a locally available “Builder’s sand”, blasting sand, concrete sand conforming to the gradation for fine aggregate (Grading 1) given in ASTM C 33 and sand conforming to the gradation for fine aggregate given by AC1 Committee 304 (199 :I.). These will be referred to as Numbers 1, 2, 3 and 4, respectively. The blasting sand (Flintsho? 4.0) was supplied by U.S. Silica Co. This sand has a rounded shape and an average mesh size: of 3 8-40. The sand conforming with AC1 304 was obtained from New Jersey Pulverizing Co. Sieve analysis results for the other tested sands are presented in Table 1. Gradations from ASTM C3:1 and AC1 Committee 304 are given in Table 2. The ratio of sand to cementitious material (s/c) by m;tss was varied from 1.4 to 2.5, depending on the type of sand used.
Steel microfibres were investigated to determine potential for increasing thermal conductivity of cement-sand grouts. The volume f?action of microfibres added was varied from 0.05 to 0.1. The microfibres were supplied. by Novocon.. The sand used in the mixes was Flintsho? 4.0.
A small proportion of Wyoming bentonite (sodium montmorillonite) was added to some of the cementitious grouts to reduce bleeding, promote fUlLvolume set, and improve sand carrying capacity (i.e., reduce settling).
2

Table 1. Sieve Analysis of Sands Used
Sieve No. (Size, urn)
4 (4750)
8 (3350)
16 (1180)
30 (595)
50 (297)
100 (149)
200 (75)
Builder’s, Sand (1)
99.92
97.15
89.70
65 61
22 08
5.04
.,
Percentage Passing
Concrete Sand (2)
99.95
96.50
83.69
49.52
11.04
1.76
Grout Sand (4)
100
100
98.84
66.83
52.39
10.75
0.62
Table 2. ASTM C 33 and AC1 Committee 304 Sand Gradations
Sieve No. (Size, pm)
4 (4750)
8 (3350)
16 (1180)
30 (595)
50 (297)
100 (149)
200 (75)
Percentage Passing (%)
ASTR4 C 33 AC1 304, Grading 1
95-100
80-100 100
50-85 95-100
25-60 55-80
10-30 30-55
2-10 10-30
., O-10
The w/c of the grouts was varied depending on sand and superplasticizer content. Most superplasticized cement-sand grouts had w/c around 0.5-0.6. Comparisons of the super-plasticized cement-sand grouts were made against neat cement grouts with w/c up to 0.8 and an un- superplasticized cement-sand grout wrth w/c = 0.‘75. The cementitious grouts were intended to be mixable and pumpable with conventional grouting equipment.
3

A commercially available non-shrink metallic aggregate grout (Embeco@ 885 Grout, Master Builders Technologies:) was also tested for comparison. This is a prepackaged material. The preblended dry ingredients were mixed with water. The tested ratio of water to dry ingredients (by mass) was 0.19.
2.2 Mixing
Grouts for rheological studies were prepared in a 1 I(35 fl. oz.) capacity blender. Depending on the quantity, grouts containing sand were either mixed in a Hobart planetary mixer, an air-driven grout paddle mixer or an air-driven colloidal grout mixer. The paddle mixer was a ChemGrout CG- 55OP model with a 34 gallon mixing tank and equipped with a 5 gpm capacity piston type pump. The mixing time used with the paddle m.ixer was five minutes. The high shear, colloidal mixer was a ChemGrout CG620 model with a capacity of 60 gallons. Due to higher efficiency, the mix time was 30 to 60 seconds. The properties of’ the grout, ;particularly in the unhardened state, depend on the type of mixer used. Thus, some variation between the properties reported here can be expected if different mixing equipment is used.
2.3 Specific Gravity
The specific gravity of the unhardened grouts was measured following ASTM D 854-83.
2.4 Rheology
The rheological properties of grouts without sand were investigated using a Farm 35A viscometer. The effects of super-plasticizer, w/c and mineral admixtures on rheology were determined. Grout was added to the viscometer immediately after mixing in the blender and the ambient temperature was 21°C. Shear stress-shear rate curves were determined using a procedure of progressive step decrease in shear rate. The grout was rotated for 60 s at a shear rate of 1021 s-l (rotor speed = 600 r-pm). The shear stress at 60 s was recorded and the shear rate was decreased to 511 s-’ (300 x-pm). The new shear stress was recorded after a period of 20 s and the shear rate was decreased to 340 s-’ (200 t-pm). This stepwise procedure was repeated at 20 s increments for decreasing shear rates of 170, 10.2 and 5,l s-r. The method is described by Smith (1990).
2.5 Bleeding
Bleeding of selected grouts was measured following the procedure given in ASTM C 940-89. An 800 ml quantity of freshly mixed gyout was poured into 1000 ml glass volumetric cylinder and covered. The heights of grout and any bleed water were monitored up to 3 hours.
2.6 Thermal Conductivity Measurelments
The cementitious grouts were cast as blocks 75 mm x 125 mm x 25 mm. Three specimens per batch were cast. The blocks were Br;;ealed to prevent evaporation, demoulded after 24 hours and
4

placed in a water bath to cure. The hardened grouts were tested for thermal conductivity at an age of 14 days. The grouts were then dried in an oven at 40°C over a period of seven days, allowed to cool, and re-tested to determine the efkt of loss of moisture. The variables studied were sand type, s/c, w/c, fly ash, blast furnace slag, and micr0fibre.s. The thermal conductivity of Embeco@ 885 was measured also. Selected grouts were re-saturated after drying and thermal conductivity was re- measured.
Thermal conductivity was measured using aL Shotherm QTM-D2 Thermal Conductivity Meter. This meter uses the hot wire method to calculate the thermal conductivity, fc. Equation 1 is the basic expression for measurement of ;1 by this method. The hot wire test is a transient method and therefore overcomes the problem o:f moisture migration and subsequent decrease in thermal conductivity of moist grouts that would occur with a steady state method. A probe consisting of a heater and thermocouple on the surface of a sole plate with known thermal conductivity is placed on the surface of the material to be tested. Constant current is passed through the heater wire and the electromotive force of the thermocouple at the time is automatically recorded. The thermal conductivity is obtained Tom Equation 2. Three measurements per specimen were made. Thus, the total number of measurements per grout formulation was nine.
qzn’:t2/‘,) A=_-__-
4x(7’;-T,)
where k = thermal conductivity (W/m.K) q = rate of heat flow per unit length (W/m) t, = time 1 (s) t, = time 2 (s)
T, = temperature at t, (K) T, = temperature at t, (K)
~ _ H2i..n(t2/t,) --u--H
v;!-v,
where I = current (A) K and H = constants V, = electromotive force of thermocouple at ti (mv) V, = electromotive force of thermocouple .at h (mV)
2.7 Permeability
(1)
(2)
The water permeability (hydra&: conductivity) of the grouts under saturated conditions was measured in a flexible wall triaxial cell permeameter on cylindrical specimens 76 mm diameter and
5

l ’
60 mm long. The permeant was de-aired tap water. The applied pressure gradient was 207 kPa (30 psi) over the length of the specimen The confining pressure applied to seal a latex membrane to the side surface of the grout specimen was 414 kPa (60 psi). The experimental set-up followed that given in ASTM D 5084-90.
Two series of permeability tests were performed. The first series was on bulk grouts. The materials were cast in 150 mm high cardboard cylinders and cut to size after curing using a diamond saw. The second series was on an annulus ofgrout cast around a axial length of 1 in. ID (1.3 in. OD) HDPE Driscopipe@ 5300 (Phillips 66,:). These specimens were also 150 mm high prior to cutting. Ah specimens were insulated for 28 hours after casting so that thermal effects similar to those which may occur in a borehole were simulated. Specim’ens were demoulded after 24 hours and cured for 28 days in a water bath. The ends of th.e pipe were plugged before conducting permeability tests so that water would flow either through the grout olr between the grout-pipe interface. This indicated how permeability of the grout-pipe system may be influenced by grout shrinkage. Three specimens per batch were tested.
All specimens were vacuum saturated with de-aired water prior to measurement. Volumetric flow rates in and out of the specimens were monitored and measurements commenced when equilibrium was reached. Cement-sand grouts with different s/c and w/c were tested. Permeability of selected neat cement grouts was measured for comparison. All permeability tests were conducted at room temperature.
2.8 Linear Shrinkage
The procedure used to measure linear shrinkage of the grouts is described in ASTM C 490- 93a. Grout was cast as beams with of dimensions 2 inx 2 in. x 11.25 in. and the gauge length between embedded studs was 10 in. Four specimelns per type of grout were cast. The beams were covered with polyethylene to prevent evaporation and plastic shrinkage cracking. After 24 hours the beams were demoulded and measured for length. Following the initial measurement the beams were stored in polyethylene bags so that mo:isture content was held constant. Thus, the effect of drying or wetting on length change was not measured and this will be investigate in the future. Change in length was measured usiig a comparator and monitored for up to 91 days. Neat cement grouts and cement-sand grouts prepared with difTerent sand types and proportions were compared. Some mixes contained either fly ash or blast furnace slag.
2.9 Linear Coeficient of Thermal Expansion
The linear coefficient of thermal! expansion of a selected cement-sand grouts was measured as de&bed in ASTM C 53 l-85. The grout had w/c = O/6, s/c = 2.5 and SP/c = 10 ml/kg. The sand type was 4. The same moulds and grout preparation procedure for linear shrinkage tests were used. Four beams were cast and maintained in a polyethylene bag after demoulding. The linear coefficient ofthermal expansion (CTE) tests commenced when the beams were 91 days old. The length of the beams was measured at temperatures of 21 and 5O’“C and CTE calculated.
6
_--I __ -._-. -
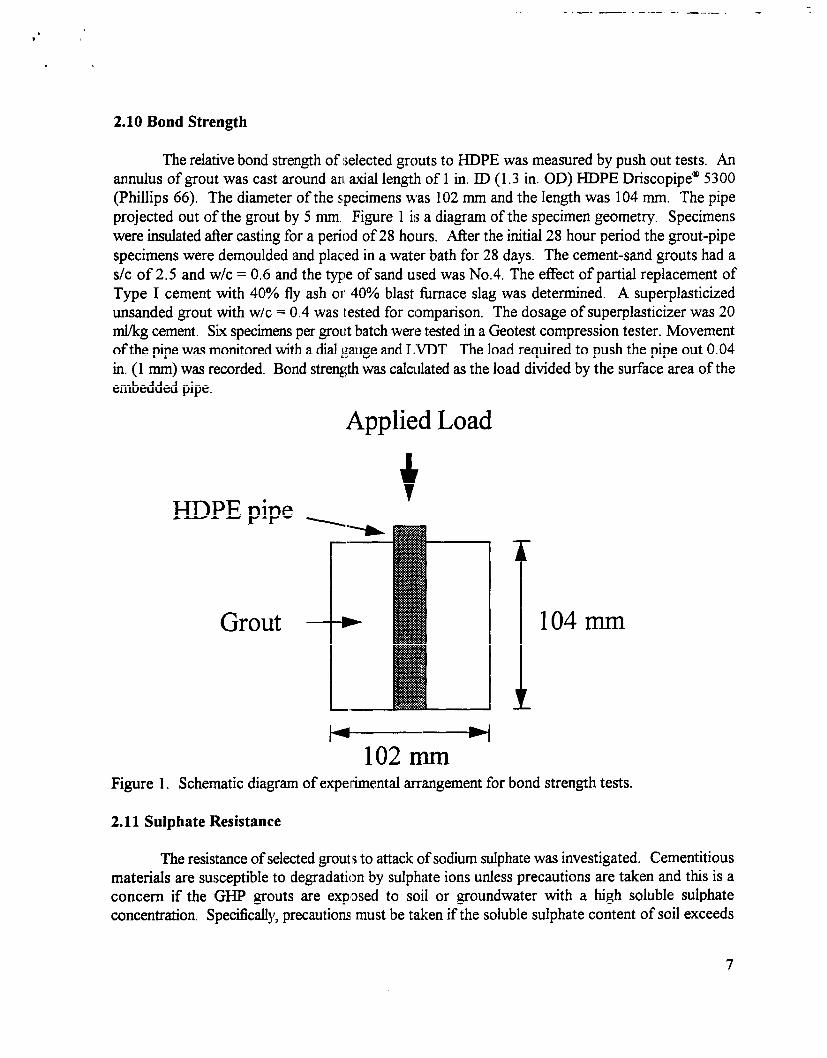
2.10 Bond Strength
The relative bond strength of selected grouts to HDPE was measured by push out tests. An annulus of grout was cast around an axial length of 1 in. ID (1.3 in. OD) HDPE Driscopipe@’ 5300 (Phillips 66). The diameter of the slpecimens was 102 mm and the length was 104 mm. The pipe projected out of the grout by 5 mm. Figure 1 is a diagram of the specimen geometry. Specimens were insulated after casting for a period of 28 hours. After the initial 28 hour period the grout-pipe specimens were demoulded and placed in a water bath for 28 days. The cement-sand grouts had a s/c of 2.5 and w/c = 0.6 and the type of sand used was No.4. The effect of partial replacement of Type I cement with 40% fly ash or 40% blast &mace slag was determined. A superplasticized unsanded grout with wlc = 0.4 was tested for comparison. The dosage of superplasticizer was 20 ml/kg cement. Six specimens per grout batch were tested in a Geotest compression tester. Movement of the pipe was monitored with a dial gauge and LVDT. The load required to push the pipe out 0.04 in. (1 mm) was recorded. Bond strength was calculated as the load divided by the surface area of the embedded pipe.
..Applied Load
1 104mm
102 mm Figure 1. Schematic diagram of experimental arrangement for bond strength tests.
2.11 Sulphate Resistance
The resistance of selected grouts to attack of sodium sulphate was investigated. Cementitious materials are susceptible to degradation by sulphate ions unless precautions are taken and this is a concern if the GHP grouts are exp8:)sed to soil or groundwater with a high soluble sulphate concentration. Specifically, precautions mu,st be taken if the soluble sulphate content of soil exceeds
7
.’
0.1% or, in the case of water exposure, 150 pprn in water (Kosmatka a, 1991). Cylinders 76 mm diameter and 150 mm long were! cast for the sulphate exposure tests. The grouts were superplasticized and had s/c = 2.0 and! w/c = 0.5. Concrete sand (2) was used. Type I cement based grout was compared with that prepared with Types II (moderate) and V (sulphate resistant) cement. In addition, the sulphate resistance oi:’ grout with 40% of Type I cement replaced with either fly ash or blast furnace slag was investigated.
The cylinders were cured fbr 28 days in a water bath. Following this, the ends of the specimens were dipped in molten wijx and the specimens were placed in a bath of 50 g/l (0.35 M) NaJO,. The purpose of wax coating the ends of the specimens was to promote radial difision of sulphate ions. The Na$O, solution was replaced on a monthly basis to ensure maintenance of the SO,‘- concentration. The pH was riot controlled. The specimens were visually inspected for degradation every two weeks.
2.12 Wet-Dry Cycles
The durability of the cementitious grouts to wet-dry cycles was investigated. Cylinders 76 mm diameter and 150 mm long were ci& and cured for 28 days in water. Cement-sand grouts based on Type I cement, 40% cement/60% 8.1~ ash and 40% cement/60% slag were tested. The s/c of these grouts was 2.5 and w/c was 0.6. The sand type was 4. The cement-sand grouts were compared with unsanded grouts. The first of these did not. contain superplasticizer and had a w/c of 0.8. The second contained superplasticizer at a dosage of 20 ml/kg cement and a w/c of 0.4. Following the curing period the grout cylinders were subjected to 12 wet-dry cycles consisting of 5 hours in water at 21°C and 43 hours in an oven at 60°C. Three specimens per batch were and the specimens were observed for visible cracking.
2.13 Environmental Impact
Environmental impact of the ;;routs in terms of water quality was determined. Leaching of fresh and hardened grout constituents in water was examined. The experimental arrangement consisted of a 2 kg layer of washed and dried 20-30 Standard Ottawa sand (ASTM C 190), a 5 kg layer of grout, another 2 kg layer of washed and dried 20-30 Standard Ottawa sand, and a 2 kg layer of deionized water all confined within a polyethylene lined vessel. The top layer of sand and the deionized water were placed immediate1.y after the grout. Hence, the impact of the grout in the unhardened state was included. The arrangement is shown schematically in Figure 2 and is based on a set up described by Widmann (1996). The first change of water was at 7 hours after placing the grout and other materials. Following this the water was changed at intervals of 1, 7, 14, 21 and 28 days. The pH of the water was measl.lred. Samples for heavy metal analysis were first acidified to a pH ~2 with nitric acid to prevent precipitation. Analysis was performed using inductively coupled plasma-mass spectroscopy (VG Elemental Plasma Quad).
Three superplasticized cement-sand grout mixes were tested. One was based on Type I cement, whereas the others had 40% replacement of Type I cement with fly ash and blast fimace
8

.- -. I ~~-- ..-. -..-
slag, respectively. The s/c of all the grouts was ;!.5 and the w/c was 0.6. The sand used was No. 4.
Polyethylene Container
Deionized Water
Sand
++ Grout
1 _ -t_ Sand
Figure 2. Schematic diagram of experimental arrangement for environmental impact studies.
2.14 Simulated Boreholes
A number of simulated boreholes were grouted to check for grout pumpabiiity, uniformity of grouting and to determine temperature-time profiles as described in Section 2.16. The first test was performed on a tube containing a C-loop that *was prepared by the University of Alabama and returned for testing. A 4 in. inner diameter 10 ft. long tube was filled with Mix 108 (w/c = 0.6, s/c = 2.5). Other tests involved grouting a 4 in. inner diameter 20 A. long insulated Schedule 40 PVC tube that contained an axial length of 1 in. ID (1.3 in. OD) HDPE Driscopipe@ 5300. This gave a grout thiclcness of 34.3 mm (1.35 in.). The insulatio:n was 1 in. thick fibreglass. Thermocouples were embedded in the grout and temperature versus time was monitored an a data logger. One of the tubes was filled with Mix 108 and the other with Mix 109. The grouts were mixed in the paddle mixer and pumped with the piston pump.
9

3.0 RESULTS
3.1 Rheology
The rheological behaviour of the cementitious grouts without sand is depicted in Figures 3-7. The effect of w/c on the shear stress-shear rate curve for neat cement grouts (no superplasticizer) is shown in Figure 3. Figures 4 and 5 indicate the effect of superplasticizer dosage on rheology for grouts with w/c = 0.5 and 0.6, respectl!vely. The dlosage is expressed as millilitres of superplasticizer per kilogram of cementitious material (i.e., cement plus any slag or fly ash). The influence of blast furnace slag and fly ash on rheology is shown in Figures 6 and 7. The w/c for all grouts in Figures 6 and 7 was 0.S and the superplasticl:zer dosage was 15 ml/kg cementitious material.
Neat Cement Grouts Effect of Water/Cement Ratio
60
0 100 200 300 400 500 600 700 800 900 1000 1100 1200 SHEAR RATE (l/s)
I -5 w/c 0.5 ----- w/c 0.6 + w/c 0.8
++ w/c II .o -A- w/c 1.2 I I” I
-
Figure 3. Effect of water/cement ratict on rheology of neat cement grouts.
10

. .
w/c = 0.5 Effect r)f superplasticizer dosage
0 100 200 300 400 500 600 700 800 900 1000 1100 1200
SHEAR FIATE (l/s)
+ SP/c = 10 ml/kg -@- SP/c = 15 ml/kg + SP/c = 20 ml/kg ..--
Figure 4. Effect of superplasticizer dosage on rheology of grout with w/c = 0.5.
11

- -._
w/c == 0.6
0 100 200 300 400 500 600 700 600 900 1000 1100 1200 SHEAR RATE (l/s)
I-CNoSP %- SPJc = 10 ml/kg 4% SP/c = 20 ml/kg
Figure 5. Effect of superplasticizer dosage on rheology of grout with w/c = 0.6.
12

w/c == 0.5 SP/c = 15 ml/kg
0 100 200 300 400 500 6800 700 800 900 1000 1100 1200 SHEAR RATE (l/s)
* Type I cement -+f+ 40% BFS/&l% cement ‘+ 60% BFS/40% cement -E3- 75% BFS/25% cement
Figure 6. Effect of blast fixnace slag ::)n rheology of grout with w/c = 0.5.
13

._ -- ..--- _.-._ ~~ -
4’
.
w/c =: 0.5 W/c = 15 ml/kg
40
35
30
+ 25$-------t---t-+--t- --+----I
0 100 200 300 400 500 600 700 800 900 1000 1lUU 1zuu
SHEAR RATE (l/s)
-W- Type I cement +E- 40% FA/G(l% cement +S 60% FA/40% cement -6- 75% FA/25% cement
Figure 7. Effect of fly ash on rheologir of grout with w/c = 0.5.
14

.
3.2 Bleeding
The results of the bleed tests on grouts containing AC1 304 sand at a s/c = 2.5, w/c = 0.6 and superplasticizer dosage == 10 ml/kg cementitious material are presented in Table 3. These mixes were prepared in a Hobart mixer. Different results may be obtained with other mixers.
Table 3. Bleed Test Results
Time (hr)
0.5
1
1.5
2
2.5
3
Plain
0.25
0.50
0.62
0.62
0.62
0.62
% Bleed
40% BFS
1.24
1.86
2.48
2.61
2.73
2.73
40% FA
0.99
1.23
1.85
1.97
2.10
2.10
3.3 Thermal Conductivity
The thermal conductivities of neat cement grouts are presented in Table 4. The water/cementitious material ratio is indicated. The mean and standard deviation for three different specimens are reported. R.esults for cementitious grouts with different sand types and s/c are reported in Table 5. The effects of fly ash and slag for grouts with w/c = 0.6 and s/c = 2.5 are given in Table 6. Table 7 presents the thermal conductivities of grouts containing microfibres. The results for the Embeco@ 885 grout are given in Table 8.
The increase in thermal cond .ictivity with s/c is shown in Figure 8 for a grout with 40% slag/60% cement, w/c == 0.45 and Hintshot@ 4.0 sand. Figure 9 shows the effect of fly ash replacement level and s/c on thermal. conductivity for w/c = 0.45 and Flintshot’ 4.0 sand. The equivalent resu1t.s for blast furnace slag-modified grout are depicted in Figure 10.
15

-.__; - -__ _.-. _ - _ -..-
2.75 /=--“-’ ’ ’ ’ ’ ’ ’ J- ’ ”
2.50 -
2.25 -
2.00 -
1.75 -
r-
f
z
z
i
1.50 L_l-_u__L_-_, 1.0 1.5 2.0 2.5
SAND/CEMENTITIOUS MATERIAL
Figure 8. Effect of sandkementitious material ratio on thermal conductivity of slag-modified grout.
2.7 5 I_ ---I I I I
I 2J.50 -
2:.25 1
2.00 .l
1.75 .L
(@s/cm = 1.2jj vs/cm = 2.01
P P ’ ! P P
1.50 C-l-.._-I 0 20 40 60 80
SLAG REPLACEMENT LEVEL (%)
Figure 9. Effect of slag replacement level on thermal conductivity at two different sand/cement (s/cm) ratios.
16

c
?z 2.75 ‘;---,-v---~
i 1
’ z 2.50 --
z : P ?I E l--
z 2.25 Y --
% z 2.,00 --
0”
$ 1.75 -. +
E I I $1
E 1.50 k I..-( 1 I
0 20 40 60 80
FLY ASH REPLACEMENT LEVEL (%)
Figure 10. Effect of fly ash replacemtx-rt level on thermal conductivity at two different sand/cement (s/cm) ratios.
Table 4. Thermal Conductivities of Untilled Ce:mentitious Grouts (mix proportions by mass). (1 W/m.K = 0.578 Btu/hr.ft.“F).
Grout Type
Super-plasticized
Neat cement
Neat cement
Water/ Cement Ratio
*-
0.40
0.60
0.80
Thermal Conductivity, W/m.K
14 Days After Drying
0.868 f 0.019 0.706 f 0.010
0.836 f 0.012 0.585 * 0.008
0.803 l 0.011 0.456 * 0.009
17

_ .._ .-. .---- -~ -.._ -_ ~___._ -._ .-
Table 5. Thermal Conductivity of Cement-Sand Grouts with Different Sands (mix proportions by mass). (1 W/m.K = 0.578 Btu/hr.ft.“F).
‘. This grout will be referred to as Mix 108.
Table 6. Thermal Conductivity of Grouts with AC1 304 Sand and Partial Cement Replacement with Blast Furnace Slag or Fly Ash (mix proportions by mass). (1 W/m.K = 0.578 Btu/hr.ft.“F).
% BFS or FA
40% BFS2
60% BFS
40°/ FA3
Water/ Sand/ Cementitious Cementitious
0.6 2.5
0.6 2.5
06 35
Thermal Conductivity, W/m.K
14 Days After Drying
2.519 f 0.043 2.282 f 0.033
2.508 f 0.040 2.267 zt 0.044
3 530 f 0 033. 2 706 f 0.041
2. This grout will be referred to as Mix 109. 3. This grout will be referred to as Mlz: 110.
18

Table 7. Thermal Conductivity of Grouts with Flintshot’ 4.0 Sand and Microfibres. (1 W/m.K = 0.578 Bttr/hr.A:.“F).
Volume Fraction
Fibres (%)
0.0
0.05
0.1
01
Water/ Sand/ Cementitious Cementitious
0.47 2.5
0.47
‘!
2.5
0.45 2.0
047 35
Thermal Conductivity, W/m.K
14 Days After Drying
2.644 * 0.038 2.328 f 0.050
2.596 f 0.041 2.323 * 0.045
2.376 * 0.033 2.189 f 0.032
2613 *0049 7314 *to59
Table 8. Thermal Conductivity of Embeco@ 885 Grout. (1 W/m.K = 0.578 Btu/hr.ft.“F).
The mix proportions of the grouts with AC1 304 sand that had the most promising thermal conductivities are summarized in Table 9. These mixes will be referred to by their designated mix numbers throughout this report.
Table 9. Mix Proportions of Grouts Studied Further
Mix 1108 Mix 109 Mix 110
Cement (kg/m3) 530 315 312
Blast Furnace Slag (kg/m3) 0 210 0
Fly Ash (kg/m3) 0 0 208
Water (l/m’) 3 18 315 312
Sand (kg/m3) 13215 1313 1300
Super-plasticizer (l/m’) I 5.3 5.25 5.2
Specific Gravity 2.18 2.16 2.14
19
. .
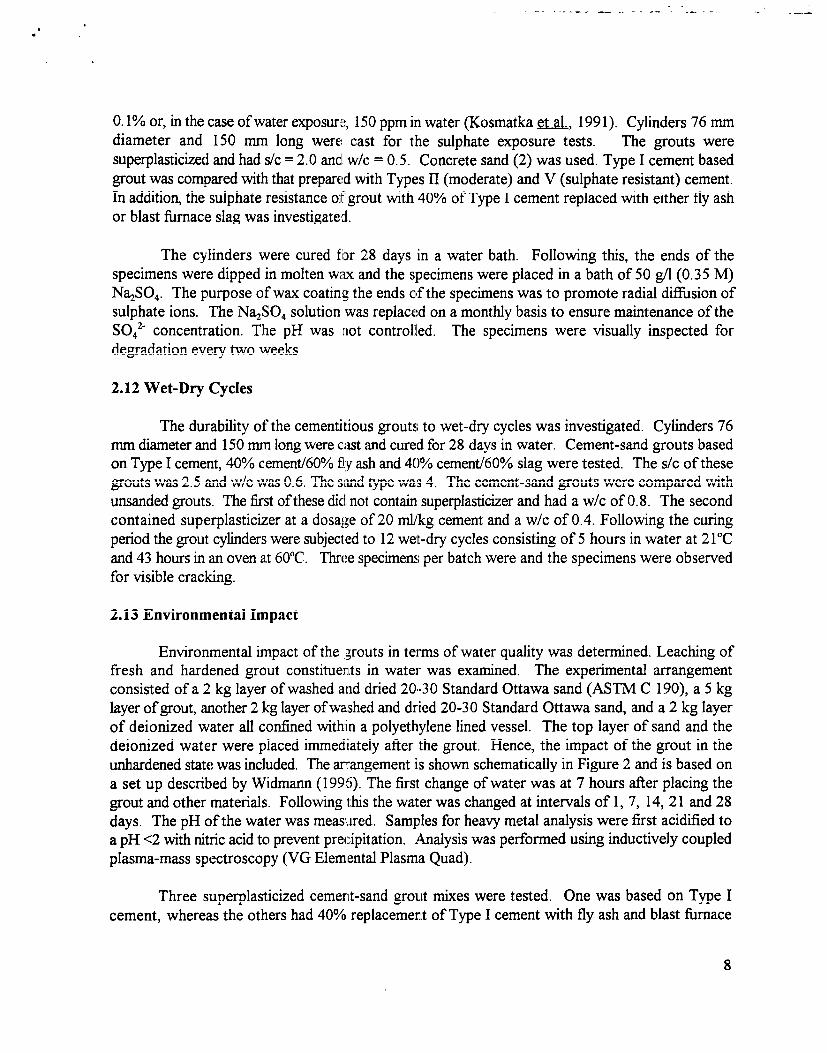
3.4 Permeability
The permeability results for grouts without sand are presented in Table 10 and the results for sanded grout are presented in Table 11. The permeabilities of grout-pipe specimens are given in Table 12. The results of bulk versus bonded permeabilities are also compared graphically in Figure 11.
Table 10. Permeability Data for Grouts without Sand (mix proportions by mass).
Grout Type
w/c = 0.4, SP/c = 20 ml/kg
w/c = 0.8
w/c = 0.4, 40% BFS, SP/c = 20 ml/Ikg I 9.2 x 10-r’ f 1 x 10-l’ 0
w/c = 0.4, 40% FA, SP/c = 20 ml/kg 1.1 x 1O“O f 2 x lo’”
Table 11. Permeability of Cement-Sand Grouts (mix proportions by mass, sand type indicated).
Grout Type Permeability (cm/s)
w/c = 0.75, s/c = 2, No SP (Flintsho? 4.0 ) I 1.1 x 10⁻⁹k 1.7x lo-lo
w/c = 0.5, s/c = 2.5 SP/c = 20 ml/kg (ASTM 2.9 x lo-‘Of 4 x 10-l’ c 33)
w/c = 0.52, s/c = 2.5 SP/c = 15 ml/kg (AC1 304)
3.3 x lo-iof 6 x 10-l’
w/c = 0.6, s/c := 2.5 SP/‘c = 10 ml/kg, (AC1 5.1 x lo-lo* 1 x lo-lo 304), Mix 108
w/c = 0.6, s/c == 2.5, 40% BFS, SP/c. = 10 4.9 x lo-lo& 7 x lo-” ml/kg (AC1 3 04), Mix 1.09
w/c = 0.6, s/c == 2.5, 40% Fq SP/c :::: 10 5.8 x 10‘lo* 9 x 10-l’ ml/kg (AC1 304), Mix 110
20

. I
Table 12. Permeability of Grout-Pipe Specimens (mix proportions by mass).
Grout Type Permeability (cm/s)
w/c = 0.8 4.1 x1o-9 * 5 xlo-1° II
w/c = 0.4, SP/c = 20 ml/kg 1.5 x1o-9 * 3 x10-lo
w/c = 0.52, s/c = 2.5 SP/c = 15 ml/kg (AC1 6.6 x lO“Oh 1 x lo-lo
304)
w/c = 0.6, s/c = 2.5 SP/c = 10 ml/k,; (AC1 7.2 x lo-‘Of 9 x 10-l’
304), Mix 10s I.
w/c = 0.6, s/c = 2.5, 40% BFS, SP/r:: = 10 7.1 x lo-‘Of 8 x 10‘”
ml/kg (AC1 304), Mix 109
w/c = 0.6, s/c = 2.5, 40% FA, SP/c := 10 8.5 x lo-‘Ok 1.2 x lo-lo ml/kg (AC1 304), Mix 110
5x1 o-9
0 w/c:= 0.4 w/c q : 0.8 108 109 110
Grout Mix
Figure 11. Permeability of bulk grout *and grout-pipe specimens.
21

.
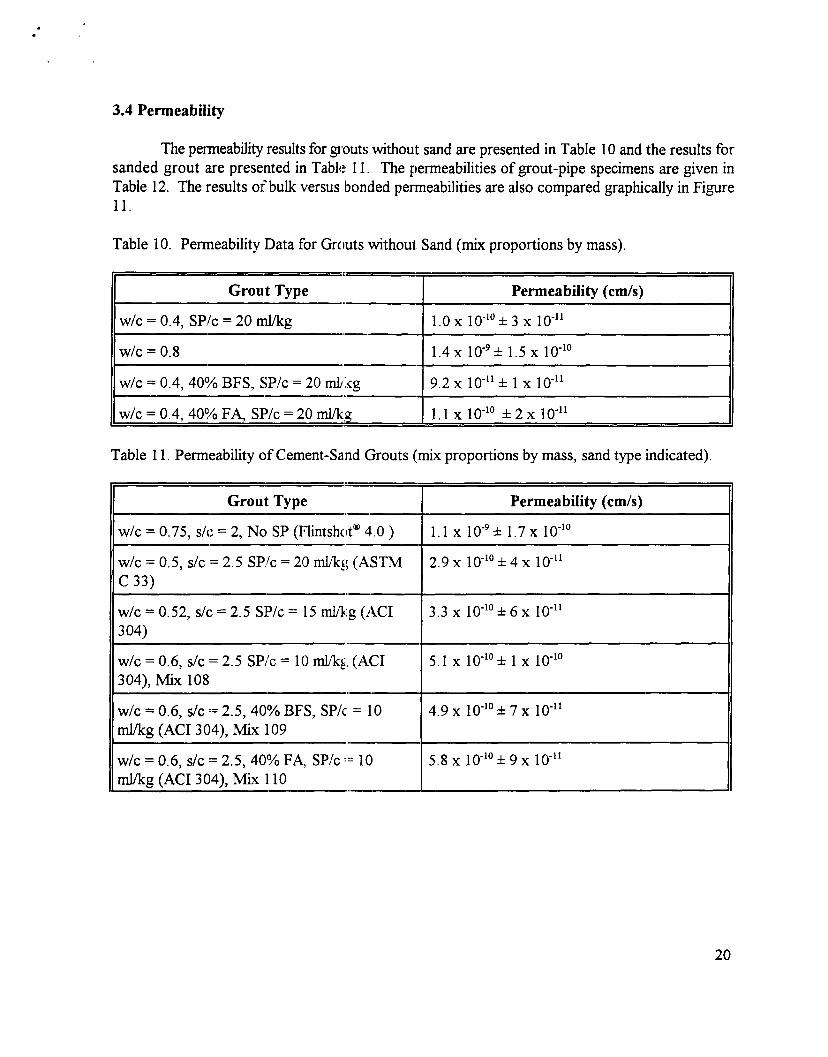
3.5 Linear Shrinkage
Figure 12 is a plot of linear shrinkage versus time for grouts without sand. The w/c ratios are indicated. The mix with w/c = 0.4 :had a superplasticizer dosage of 20 ml/kg cement. The other grouts did not contain any superplasticizer. Figure 13 show the effect of different sands and values of w/c and s/c. The influence of fly ash and slag are depicted in Figure 14 (Mixes 108, 109 and 110).
3.6 Linear Coeffkient of Thermal Expansion
The average linear coefficient r:)f thermal expansion for cement-sand grout with w/c = 0.6, s/c = 2.5 and SP/c := 10 rnlkg (Mix 108) ‘was 1.65 x 10~5PC (9.17 x 10a/“F). The grout CTE value can be compared with Driscopipe@ which has a linear CTE of 1.2 x 10m4/“F (2.2 x 10‘4/oC) and a circumferential CTE of 0.6 x 10°4/“F 1c1.1 x 1 O”‘/‘C).
3.7 Bond Strength
The specimens prepared from unsanded grout with w/c = 0.4 were loosely bonded to the embedded HDPE pipe and very low if’orces were required to move the pipe 1 mm. In contrast, the cement-sand grouts were soundly bcbnded to the pipe. The results of the bond strength tests are presented in Table 13 and Figure 15. Y’he average and standard deviation for six specimens are given.
Table 13. Bond Strength Results
Grout Type I Bond Strength &Pa)
w/c = 0.4, SP/c = 20 ml/kg I 3.6 f 0.7
w/c = 0.6, s/c ‘= 2.5, SP/c = 10 ml/k; (Mix 108) I 72.4 * 12.9
w/c = 0.6, s/c := 2.5, SP/c = 10 ml/k:.;:, 40% BFS (Mix 109) I 73.0 f 10.3
w/c = 0.6. s/c I= 2.5. SP/c = 10 mlka. 40% FA Mix 110) I 47.0 * 10.8
22

.
LINEAR SHRINKAGE NEAT CEME.NT GROUTS
w rn I I I I I I I I I 1-i I irr7
TIME (days)
Figure 12. Linear shrinkage of neat cement grouts with different water/cement ratios.
23

LINEAR SHRINKAGE CEMENT-SAND GROUTS
TIME (days)
-W- w/c = 0.75,s/c = 2 * w/c = 0.5,slc = 2.5 * w/c = o.s,s/c = 2.5 I
Figure 13. Effect of water/cement, sand/cement and sand ty-pe on linear shrinkage.
24
LINEAR SHRINKAGE w/c = 0.6, s/c = 2.5
0.35.
0.30.
CT 0.20-
iz z 4
0.15
O.lO- (
#=
1-
C-
t-
tc
_
/
= - -
3 4
-
4
_-
-2 ---(I
_-
_-
5 55 60 65 70 75 80 85 60 6
TIME (days)
-C Type I cement *‘. 40% BFS/6O% cement +I& 40% FA/60% cement
Figure 14. Effect of slag and fly ash OI’I. linear shrinkage of grout with w/c= 0.6 and s/c = 2.5.
25

80
60
108 109 110
Grout Mix
Figure 15. Bond strengths for neat cement (w/c = 0.4) and cement-sand grouts.
3.8 Sulphate Resistance
The cylinders exposed to a sodium sulphate solution were examined periodically for
indications of cracking. The 100% Type I ceme:nt grout mix exhibited surface cracking after four
months of exposure. The deterioration progressively worsened. Up to six months the other grouts (Type II cement, Type V cement, 40% BFS/60% Type I, 40% FA/ 60% Type I) did not show any visible deterioration.
3.9 Wet-Dry Cycles
The grouts without any sand (w/c == 0.4 and w/c = 0.8) cracked after the first wet-dry cycle. The degree of cracking increased as cycling progressed. The mix with w/c = 0.8 had a greater susceptibility to cracking. The cement-sand groins with w/c = 0.6 and s/c = 2.5 displayed surface cracking with maximum crack width of approximately 100 urn.
26
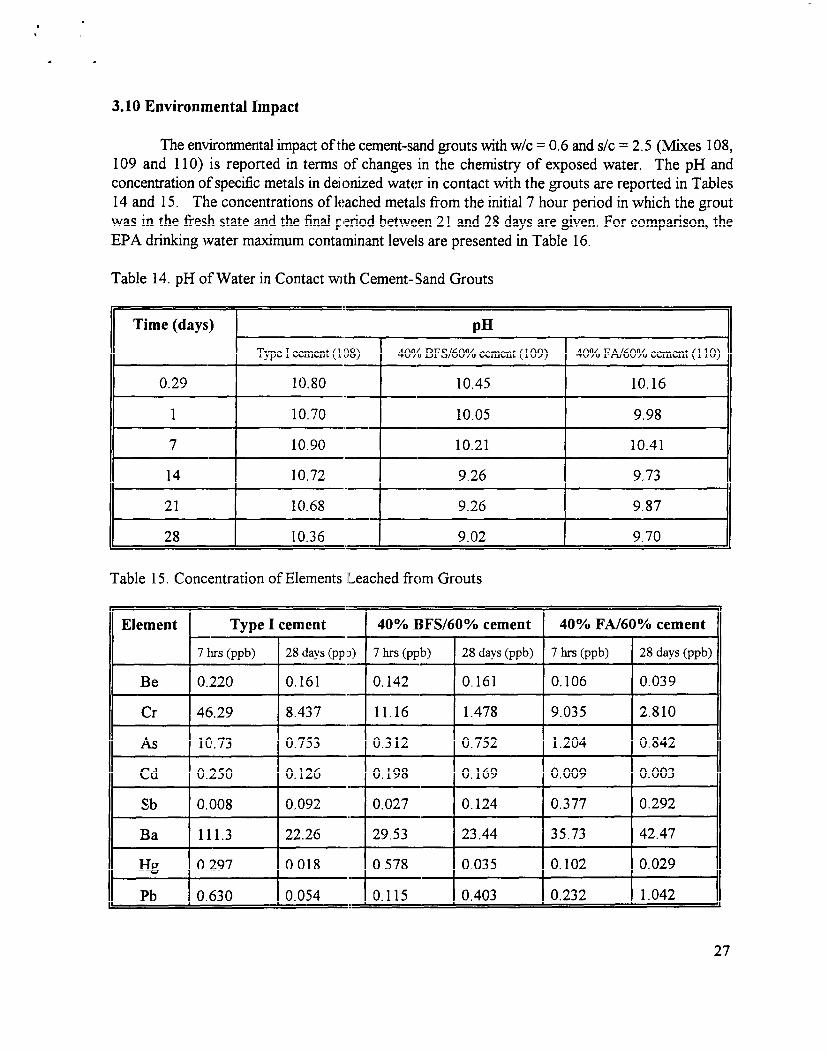
3.10 Environmental Impact
The environmental impact of the cement-sand grouts with w/c = 0.6 and s/c = 2.5 (Mixes 108, 109 and 110) is reported in terms ‘of changes in the chemistry of exposed water. The pH and concentration of specific metals in deionized water in contact with the grouts are reported in Tables 14 and 15. The concentrations of leached metals from the initial 7 hour period in which the grout was in the fi-esh state and the final period between 21 and 28 days are given. For comparison, the EPA drinking water maximum contaminant levels are presented in Table 16.
Table 14. pH of Water in Contact with Cement-Sand Grouts
Time (days) 1 II Ici)R)I BFS/60% cement (109) 1 40% FA/60% cement (110) 11
0.29 10.80 10.45 10.16
1 10.70 10.05 9.98
7 10.90 10.21 10.41
14 10.72 9.26 9.73
21 10.68 9.26 9.87
28 I 10.36 L r 9.02 9.70
Table 15. Concentration of Elements ILeached from Grouts
Be I 0.220 I 0.161 I 0.142 I 0.161 I 0.106
Cr 1 46.29 I 8.437 I 11.16 I 1.478 I 9.035 I 2.810
A3 I 10.73 I 0.753 I 0.3 12 I 0.752 I 1.204 I 0.842
Cd I 0.250 I 0.126 I 0.198 I 0.169 I 0.009 I 0.003
~ ~~~ Sb I_ 0.008 I 0.092 I 0.027 I 0.124 I 0.377 I 0.292
Ba 111.3 22.26 ,, 1 29.53 1 23.44 35.73 42.47
Hg 0.297 0.018 I ! 0.578 0.035 0.102 0.029
Pb 0.630 0.054 : IO.115 IO.403 0.232 1.042
27

Table 16. EPA Drinking Water Maximum Contaminant Levels
Element Maximum Contaminant Level (ppb)
Be 4 ..-
Cr 100
As 50
Cd 5
Sb 6
Ba 2000
Hs 2
Pb 15
3.11 Temperature-Time
Temperature versus time data was obtained for the grout cast in the insulated 20 ft. x 4 in. PVC tubes. Figure 16 is a typical pl#::)t obtained for Mix 108. (108-2) The initial temperature was 16.7”C (62.1”F). The peak temperature was 5 12°C (124.1”F) and this occurred at an elapsed time of 12 hours and 20 minutes. Figure ‘I. 7 shows the temperature-time profile for Mix 109. For this grout the initial1 temperature was 17.O”C (62.7”F) and the peak temperature was 36.7”C (98.O”F). Addition of 40% slag to the grout alsc delayed the exotherm and the peak temperature was reached 17 hours and 46 minutes after completion of grouting. Mix 109 also exhibits a flatter temperature profile.
28

120
90
68
38
0
ll:! ii-:
t:21 -97 11-11-97 ii-ii-~97 11-12-97 11-12-97 11-13-97 11-13-97
188-Z .- 288 WV channel #5
‘Time-Date
Figure 16. Typical temperature-time profile for Mix 108 in simulated borehole.
29

7:B6 -I
59:86 88:8i3 :88 12:Eie:m a13:ee:ee 12:m3:ae 00:80:00 Edi 11-17-97 11-18-97 ii-m-97 H-19-97 11-19-97 11-20-97 11-m-97
189-l - ZBB mU channel 85
Time-Date
Figure 17. Typical temperature-time profile for Mix 109 in simulated borehole.
30

3.12 Microstructure
Specimens used in the permeability tests were sectioned and viewed under an optical microscope to examine the distribution of the sand filler and the integrity of the bond to HDPE. In addition, the 20 ft. x 4 in. tubes were sectioned for analysis. For the 76 mm diameter permeability specimens it was found that grouts without sand had the greatest gaps at the grout-pipe interface. The neat cement grout with w/c = 0.4 and SP/c =: 20 ml/kg had a gap of 0.02 to 0.4 mm. The slag- modified grout without sand (w/c = 0.4 and SP/% = 20 ml/kg) also exhibited disbondment and the width of this was 0.02 to 0.33 mm. The unsanded grout with 40% fly ash had a gap 0. I 1 to 0.22 mm at the interface. Microcracks were also observed in this grout.
Addition of sand to the grouts was found to improve the bond integrity and this concurs with the permeability and bond strength results. Mix 108 exhibited regions where grout was intimately bonded to the pipe. Some discontinuous gaps 0.02 mm wide were also visible at 50 x magnification. Similar observations were made for the sanded1 slag-modified grout (109). The sanded fly-ash modified grout (110) had a continuous gap at the interface around 0.02 - 0.2 mm wide, in addition to some voids. Figures 18-22 are examples of the HDPE-grout interface at 50 x magnification. In the micrographs the HDPE is the dark area in the right hand side. Figure 18 is for the neat cement grout with w/c = 0.4. Figures 19 and 20 show an inter-facial gap in Mixes 108 and 109, respectively. Small air voids in an otherwise bonded area at the interface are evident in Figure 2 1. Figure 22 shows an area with a discontinuous gap. The grout is bonded in the upper part of the micrograph.
The sections cut Corn the Mixes 108 and 109 grouted 4 in. diameter tubes showed gaps 0.06 - 0.075 mm wide at the interface, which is greater tlhan that observed on the smaller permeability test cylinders. The increased gap width is probably due the higher exotherm experienced in the tubes than in the 3 in. diameter cylinders.
31

. .
Figure 18. HDPE-grout interface for neat cement grout with w/c = 0.4 at 50 x magnification.
Figure 19. HDPE-grout interface for Mix: 108 at 50 x magnifkation.
32

, . .
Figure 20. HDPE-grout interface for Mix 109 at 50 x magnification.
Figure 2 1. HDPE-grout interface for h4ix 109 at 50 x magnifkation showing bonded area.
33

Figure 22. HDPE-grout interface fomr Mix 109 at 50 x magnification showing discontinuous gap.
4.0 DISCUSSION
4.1 Thermal Conductivity
The effect of water/cementitious material ratio (w/c) is demonstrated by comparing the results for unfilled mix:es with ratios of 0.4, 0.6, and 0.8 in Table 4. Thermal conductivity increases with decreasing w/c. When the amount o:fwater in th.e original mix exceeds that required for hydration of cement the excess can be evaporated, thus leaving pores in the hardened grout. High w/c grouts will have greater porosity and lower t:.hermal conductivity than low w/c grouts.
Heat transfer studies by Braud 81: 199 1) and I3raud and McNamara (1989) have shown that neat cement grout performs similarly to commercial bentonite grouts (Volclay, Benseal and Quick-Gel) under the test conditions used. This i:i in agreement with the relatively low thermal conductivity of neat cement grouts.
Retention of thermally conductive prclperties under dry conditions is an important requirement. The neat cement grout Ah w/c = 0.8 showed a significant decrease in mean thermal conductivity of 43.2% on oven drying. Comparison with the super-plasticized grout with w/c = 0.4 demonstrated that the percentage decrease in thermal conductivity on drying was reduced to 18.7% by lowering w/c.
34

The importance of m aximizkg sand content to improve thermal conductivity is illustrated in Figure 8. The grout was a 40% slag/60% cement mix and the sand was No. 3. The graph shows a linear relationship between thermal! conductivity and s/c. Figure 9 shows the effect of partial replacement of cement with Class F lly ash for two different values of s/c. Fly ash content had only a slight influence on thermal conductivity. Therefore, fly ash can be added to grouts to seal boreholes for geothermal heat pump systems without loss of thermal performance. Fly ash can also be expected to improve durability and reduce heat of hydration as discussed below. The use of Class C fly ash is a possible alternative. The results confirm the improvement in thermal conductivity with increasing sand content. The thermal conductiv#ity data for the blast firmace slag-modified grouts presented in Figure 10 are similar to those for the fly ash grouts.
Table 5 presents the results for different sands, s/c and w/c. For Flintsho? 4.0, relatively high values of thermal conductivity were achieved whe:n s/c = 2.0 and 2.5. This sand appears suitable for use in grouts for GHP applications. In the moist condition the grout with w/c = 0.75 and s/c = 2.0 had a reasonable thermal conductivity, although the value is less than that for the grout with the same s/c and w/c = 0.45. However, after (oven drying the grout with w/c = 0.75 had a 3 1% decrease in themral conductivity. The grouts with w/c = 0.6 ;and s/c = 2.5 underwent conductivity decreases of 8.8 to 12%, whereas the mix with WI’I; = 0.45 and s/c = 2.0 lost 5.4%.
The grouts containing Builder’s sand (No. 1) had relatively low thermal conductivities. This was attributed to the excessive porosity in the cured grouts associated with the poor flow characteristics. The mix with s/c = .i!.O had the lowest thermal conductivity and did not show the typical increase with increasing s/c that other sands provided. The grout with s/c = 2.0 was not self- levelling and therefore contained voids in the hardened state which reduced thermal conductivity. Poor flowability of grouts with sand No. 1 was due to the unsuitable particle gradation. Based on the low thermal conductivities and antic:ipat.ed problems with pumpability, sand No. 1 was eliminated from further study.
Sand conforming to the grad:.:ng for fine aggregate in ASTM C 33 (Concrete sand, No. 2) resulted in relatively high thermal conductivit:ies and retention of conductivity under drying conditions. The grouts did not have good flowability and this is discussed further in Section 4.2. Grouts containing AC1 304 (No. 4) sand displayed suitable flowability and thermal conductivity. The values of w/c used were higher than those for most of the other grouts in Table 5. This corresponded with lower super-plasticizer dosage (Section 4.2). The percentage decrease in thermal conductivity for this grout on drying was higher th,zm that for the grouts with w/c = 0.45. The grout with w/c = 0.6 and s/c = 2.5 (Mix 1 OS) had relatively high thermal conductivity in moist and dry states, The grout containing Flintshot@ 4.0 sand with w/c = 0.47 and s/c = 2.5 had higher thermal conductivity but required a greater dosage of superplasticizer. The grouts containing No. 4 sand were selected for further study and characterization Iof other properties.
The effects of partial replacement of cem.ent with fly ash or blast furnace slag on thermal conductivity of grouts with AC1 304 (Vo. 4) sand,, s/c = 2.5 and w/c = 0.6 are indicated in Table 6. The values were similar to those for grout.s without these additives.
35

Selected grouts that had been oven dried were re-saturated and the thermal conductivity was re-measured. It was found that the t.hermal conductivity returned to its original value. Therefore, the decrease in conductivity on drying of the cement-sand grouts is reversible.
The grouts containing microfibres (Tablie 7) did not show a significant increase in thermal conductivity. Consequently, addition of microfibres was not pursued further. The lack of increase in thermal conductivity .is most likely, due to insufficient volume fraction.
The thermal conductivities of the prepack:aged metallic aggregate grout (Embeco@ 885) are given in Table 8. The values were lower than most of the cement-sand grouts and this material appears unsuitable for the application of interest. When viewed under a microscope the specimens had a high degree of porosity, partic~lilarly surrounding the iron particles, that would have reduced thermal conductivity. Hence, the potential benefits of high thermal conductivity filler appear to have been negated by the porosity at the interface between the cement paste and iron particles. Embeco@ 885 is marketed as a non-shrink grout and it is unknown whether the iron particles were surface treated with corrosion inhibitors or F:romoters. The grout could possibly contain other expansive admixtures, although this was not confiied. Embleco@ 885 is also relatively expensive compared to the cement-sand grouts.
The results obtained for cement-sand grouts can be compared with published data for concrete. Thermal conductivity of concrete is dependent on the mineralogical composition of aggregate used in the mix, as well 11,s that of the cement paste. Ranges of values for different aggregates are provided by Neville (1 91J6), Mindess and Young (1991) and AC1 207.1R (1982). For example, quartzite aggregate results in thermal conductivities around 3.5-4.3 W/m.K, whereas basalt aggregate concrete has values around 1.4-2.0 W/m.K. Degree of saturation of concrete also determines the t.hermal conductivity.
4.2 Rheology
Figure 3 shows that the rheology of grouts is strongly dependent on w/cm. None of these
grouts contained superplasticizer. At hgh values of w/c (1 .O and 1.2) the grouts approach Bingham- type behaviour in that the shear stress-shear rate curve displays linearity beyond the yield stress. At lower w/cm, the grouts exhibit shear thinning beihaviour at low shear rates and thus, are not true Bingham plastics. Since rheological properties are influenced by shear rate and thermal history, the results obtained for laboratory mixing cl::)nditions maiy differ from those achieved with fill scale mixing equipment.
The effect of superplasticizer dosage is illustrated in Figures 4 and 5. The results can also be
compared with the grouts in Figure .i; without any superplasticizer. The superplasticized grouts
behave as Bingham plastics and yield stress is decreased with increasing dosage of superplasticizer. The order of superplasticizer addition can affect the rheological behaviour of grouts and this is discussed further by Allan and Kukacka (I. 996).
36

When w/c = 0.5 and SP/c = 15 ml/kg, increasing additions of blast f%nace slag tend to make the grout more viscous as indicated in Figure! 6. The fly ash-modified grouts were minimally influenced by the proportion of fly ash (Figure 7). However, it is noted that previous tests at BNL with other fly ashes have shown different results’ (Allan, 1996).
The grouts containing sand were intended to be pumpable. Therefore, a balance between w/c, s/c, superplasticizer dosage and bentonite content while maintaining other properties such as thermal conductivity was required. The Builder’s and concrete (ASTM C 33) sands produced grouts with poor flowability. Increasing w/c and superplasticizer resulted in bleeding and settling of coarse particles. Segregation of coarse fraction was a particular problem with the concrete sand. Attempts to improve sand-carrying capacity and reduce bleeding by increasing the bentonite content resulted in viscous, thixotropic grouts that lacked adequate pumpability. The angular nature of the concrete sand did not facilitate good flowability The Flintshot@ 4.0 and AC1 304 sands produced the best flow characteristics. Lower w/c could be used with the Flintshot@ 4.0 which has rounded particles. The grouts with AC1 304 sand required relatively high w/c at s/c = 2.5 and this was compensated with lower superplasticizer dosage to reduce costs and shrinkage associated with superplasticizers. Bentonite was eliminated from these grouts to simplify the mixing procedure. Some bleeding occurred due to the absence of benton.it:e and the w/c of 0.6 when the grouts were mixed in low shear mixers.
4.3 Permeability
The permeability data in Table: 9 demonstrate that increasing w/c from 0.4 to 0.8 causes an order of magnitude increase in neat cement grout permeability. Fly ash and blast firmace slag have slight effects on permeability. The role of w/c is also evident in Table Il. Even at w/c = 0.75 the grout permeability is below the required limit of lO_’ cm/s. The grouts with w/c = 0.6 and s/c = 2.5 (Mixes 108, 109 and 110) have higher permeabilit-ies than those with w/c = 0.5-0.52 and previously tested grouts with w/c = 0.45 (Allan and Kukacka, 1996).
Table 12 shows that the permeability of the grout-pipe specimens is greater than that for the bulk grouts. This is attributed to a higher permeability pathway at the pipe interface which was confirmed by microstructure studies. The most permeable system was that for neat cement grout with w/c = 0.8. The results show that addition of sand to the grout reduces the magnitude of permeability rise. The permeabilities of the grout-pipe specimens tended to be more variable than the bulk grouts. Despite the increase in permeability associated with imperfect bonding the values are below 10.’ cm/s, which is the recommended value for GNP grouts (E&hart, 1991).
The grout-pipe specimens were wet cured tier demoulding. Therefore, autogenous shrinkage would have been minimized and lower than that for the linear shrinkage beams stored in sealed polyethylene bags. Higher permeabilities could be expected if greater shrinkage occurs in-situ. Also, changes in dimensions of the HDP’YE U-tube due to higher or lower fluid temperatures will affect the permeability of the bond. The in-situ moisture conditions during curing will affect the permeability to some degree. It is also noted that the specimens only contained one length of pipe
37
whereas two are present for an actual heat exchanger. Therefore, permeabilities may be higher than those measured if flow paths exist at the U-tube-grout interfaces. Confining pressure may be an additional factor affecting permeability at the interface. It is planned to rnodti the permeameter to accept 102 mm (4 inch) diameter specimens. Larger specimens will permit casting grout around two lengths of pipe and this will be a better replication of the U-tube-grout system.
The permeability of sanded icxmentitious grouts can be compared with that for bentonite grouts used to seal boreholes. These latter grou.ts typically have permeabilities in the range of lo” to 10.’ cm/s (Lutenegger and DeGroot, 1994; Edil u 1992).
4.4 Bleeding
As discussed above, grouts with high w/c and superplasticizer dosage were prone to bleeding when mixed in low shear mixers. This could be corrected with small additions of bentonite although this tended to reduce flowability. The decision was made to remove bentonite from Mixes 108, 109 and 110. The results in Table 3 show that addition of slag or fly ash increase bleeding. Mix 108 has a reasonably low value. However, ifit is found that bleeding poses a problem, the grouts could be reformulated to control bleeding. A poosibility would be to use a suitable water-soluble polymer to control bleeding such as welan gum (Skaggs et al., 1994; Khayat and Yahia, 1997). Furthermore, use of a more efficient high shear mixer can pemlit a decrease in w/c and reduce bleeding.
4.5 Linear Shrinkage
Figure 12 illustrates the effect Iof w/c and superplasticizer on linear shrinkage versus time of neat cement grouts. As expected, the highest shrinkage occurs at the highest w/c. The superplasticized grout with w/c = 0.4 and SP/c = 20 ml/kg cement had greater shrinkage than the mix with w/c= 0.6 and no superplasticizer. This indicates that superplasticizer dosage should be kept as low as possible. The higher cement content of the w/c = 0.4 grout also contributed to increased shrinkage. The shrinkage of grouts containing sand is also dependent on w/c and superplasticizer. Figure 13 shows that grout with high w/c (0.75) and no superplasticizer actually has lower shrinkage after 91 days than a superplasticized mix with w/‘c = 0.5 and a higher s/c. Shrinkage in the first 14 days is lower for the superplasticized grout. The figure also shows that when w/c = 0.5 and s/c = 2.5, the grout with concrete sand has lower shrinkage than that with Flintshot@ 4.0. Both these grouts had SP/c = 15 ml/kg cement.
The results for the grouts with sand No. 4, w/c = 0.6, s/c = 2.5 and SP/c = 10 ml/kg in Figure 14 indicate that the early sue is lower for the grout without slag or fly ash. As time progresses the % shrinkage is similar for the three mixes. Comparison between Figures 13 and 14 shows that the superplasticized grouts with w/c = 0.6 and s/c = 2.5 have slightly greater 91 day shrinkage than that for unsuperplasticized grout with w/c = 0.75 and s/c = 2. Final shrinkage at w/c = 0.6 was similar for the grout with w/c = 0.5 and concrete sand. This latter grout had a higher superplasticizer dosage.
38

Shrinkage of cementitious materials is typically categorized as plastic, drying and autogenous. This is discussed further by Neville (1996). While the grout in the borehole will not be subject to evaporation, suction of water into surrounding dry soil or rock may occur and contribute to plastic shrinkage. If the surrounding formation is moist as a result of drilling fluids or groundwater when the grout is placed, plastic shrinkage will be reduced. Autogenous shrinkage is associated with self- desiccation and represents &t-i&age when there is no moisture loss or gain. Drying shrinkage of the grout may occur in dry subsurface conditions or when heat is rejected by the heat exchanger into the ground. A subsequent increase in moisture content will result in swelling, although initial drying shrinkage is not fully reversible on wetting (Neville, 1996). Volume changes can be expected with seasonal variations and GHP operational mode. The presented data does not include the effects of moisture transients on grout shrinkage/expansion and this requires further investigation.
The use of expansive admixt~es, such as aluminium powder, calcium sulfoaluminate, calcium oxide and calcium sulfate to compensate for shrinkage is not recommended without further study as these materials may increase porosity therefore dlecrease thermal conductivity.
4.6 Coefficient of Thermal Expansion
The linear CTE data indicate the magnitude of thermal mismatch between the grout and polyethylene pipe. Thus, the two materials will not expand and contract equally with variations in temperature. Expansion and contraction of the pipe associated with changes in fluid temperature will affect bonding and contact resistance.
Knowing the circumferential C’IE of the HDPE pipe, the change in circumference due to the measured grout exotherm can be calculated. For Mix 108 the circumference would increase 0.397 mm from the initial to peak temperature, assuming that the pipe and grout are at equal temperatures. This equates to a diameter change of 0.126 mm. The set time of the grout is 8 hours at which time the temperature is 32°C. This corresponds to a pipe circumference change of 0.176 mm and a diameter change of 0.056 mm. Therefore, the diameter of the pipe when the grout sets is not as great as that at the peek temperature. Expansion of the pipe after the grout has set but before it has gained significant strength may result in deformation.
The slag-modified grout had lower heat of hydration and lower peak temperature. The calculated maximum circumferential expansion of HDPE pipe surrounded by Mix 109 in the simulated borehole test is 0.226 mm. The correspondiig change in diameter is 0.072 mm. Addition of slag also increases set time by about one hour. At the set time the temperature was 25.3”C. The circumference and diameter changes of the embedded pipe at this temperature are 0.095 and 0.030 mm, respectively. The predicted expansion of the pipe is significantlly lower for the slag-modified grout.
The assumption that the pipe and grout are at the same temperature is a simplification since there will be a small heat loss from the pipe to air on the inner surface and from the grout to the ins&ion. Hence, the calculated expansions represent maximums for the studied system. Of course, the grout also undergoes thermal expansion and t.his has been neglected in the calculations.
39

As a point of interest, the linear coefficient of thermal expansion for copper is 17 x 1 O?“C (Van Vlack, 1982) which is very close to the measured value on Mix 108 (16.5 x lO?OC).
4.7 Bond Strength
The bond strength results can be correlated with the permeability measurements of grout-pipe specimens, shrinkage data and the microstructure of the interface (Section 4.8). The superplasticized neat cement grout with w/c = 0.4 had weak bonding. Since the polyethylene is hydrophobic and the surface is smooth, chemical and mechanical bonding will be minimal. Hence, the dimensional stability of the grout-pipe system is important. Relative:ly high shrinkage of super-plasticized neat cement results in very low bond strength. Neat cement grout will also have a higher exotherm than a cement- sand grout and this will result in greater expansion of embedded HDPE pipe. The bond strengths for Mixes 108 and 109 were virtually the same, despite the lower exotherm of the slag-modified grout. The fly ash-modified grout (Mix 110:) had a significantly lower bond strength and this is attributed to higher shrinkage.
The bond strength specimens were wet cured and all measurements were performed at room temperature. Differences in bond strength may arise from different curing conditions or thermal expansion/contraction of the U-tube.
Bond strength of grouts for rock anchors has been investigated using pullout tests (Benmokrane et., 1995). It was found that bonding to stranded cable and steel threadbar were increased by addition of an expansive agent to the grout (aluminium powder) and by addition of sand. Reduction of w/c also improved bond. strength.
4.8 Microstructure
The improvement in bond strength with addition of sand to the grout was associated with smaller inter-facial gaps as the rnicrogmphs depict. The presence of gaps at the grout-pipe interface will result in increased contact resistance that will in turn affect heat transfer. Depending on subsurface conditions, the gaps may be :filled with a:ir or water. Heat transfer will therefore occur via three possible paths: grout-air-HDPE; grout-water-HDPE; and grout-HDPE. Interstitial heat transfer will be less effective than solid-solid conduction -where the grout is soundly bonded to the pipe. It would be a worthwhile activity to calculate the effect of gap width on contact resistance to give a quantitative measure of the impact of imperfect bonding.
The lower bond strength of the fly ash-modified grout is in agreement with the observations of greater interfacial gap and higher early shrinkage compared with the other grouts. The microstructure at the interface and the bond strengths were similar for the plain and slag-modified mixes. It appears that the higher early shrinkage of the slag-modified grout is counterbalanced by the smaller predicted expansion of the piple during the lower grout exotherm.
40
The gap widths of 0.06-0.075 mm observed in simulated 4 in. diameter boreholes are higher than the predicted radial expansion of the embeldded HDPE pipe from room to peak temperature. Hence, the gap is not solely due to subsequent contraction of the pipe after the temperature decreases.
4.9 Sulphate Resistance
As expected, the grout made from ordinary Portland (Type I) cement showed the least resistance to sulphate attack. Sulphate resistant cements (Types II and V) and partial replacement of Type I cement with blast furnace slag or fly ash improved durability. These findings are in agreement with previous studies (e.g., Neville, 1996; Lea, 1971; Biczok, 1972; Frearson, 1986; Lawrence, 1990). Longer term sulphate durability tests on grouts with w/c = 0.45 have shown that 80% replacement with slag results in better performance than 30% (Allan and Kukacka, 1997). It is recommended that measures be taken to prevent sulphate attack in areas where soils or groundwater have high soluble sulphatts: content. In addition, aggressive conditions may require low (CO. 5) w/c to further ensure satisfactory durability.
4.10 Wet-Dry Durability
The wet-dry cycle tests demonstrated the importance of maximizing the sand content of the grout to reduce susceptibility to cracking. Previous studies (Allan and Kukacka, 1995; 1996; Onofrei et, 1992) have shown that crack healing can occur under repeated wet-dry cycles due to formation of CaCO, in cracks. Permeability tests on cracked grout (Allan and Kukacka, 1996) indicate that resistance to the formation of permeable cracks is improved by use of Types II or V cements, or partial replacement of Type I cement with slag or silica fume.
4.11 Freeze-Thaw Durability
Evaluation of freeze-thaw durability of the cement-sand grouts had not been completed at the time of writing. Tests following ASTM C 666 are planned. Low values of w/c will favour freeze- thaw durability. It is common practice :m the concrete industry to use air entraining agents to improve freeze-thaw resistance. However, thi:; would result in decreased thermal conductivity.
4.12 Environmental Impact
It is essential that the grout used. to seal vertical boreholes for geothermal heat pumps has no detrimental influence on groundwater quality. Cementitious materials are widely used for potable water retaining structures and for sealing water wells. Cement, fly ash from coal-fired power stations and blast furnace slag have very low c:oncentrations of heavy metals. These metals are not readily soluble in water. Once hydrated, the leachability of heavy metals from cement-based materials is reduced further. The results in Table 14 show that the concentration of leached elements from the grouts of interest do not exceed EPA drinking water levels. The environmental impact of cement- based materials has also been studied by Sprung ti (1994) and found to not pose a threat to
41

drinking water quality. The pH of ,water in continuous contact with cement-based materials can increase due to leaching of Ca(OH), liiom cement as indicated in Table 13. This behavior stabilizes with time and the alkalinity of cement-based materials is reduced by inclusion of fly ash or slag in the mix.
The neat superplasticizer used in this research contained a maximum of 0.07% formaldehyde. This does not pose an environmental or health threat since the superplasticizer becomes chemically bound with hydrated cement. Onofrel. && (1992) have studied the leachability of superplasticizers labelled with 35S and concluded that only small fractions are released from hardened grout.
Federal and state regulations regarding grouting of vertical boreholes have been collated and posted on the World Wide Web by Professor Karen Den Braven of the University of Idaho (http://www.uidaho.edu/ghpc:). Bentonite, neat cement and cement-bentonite grouts are covered.
4.13 Temperature-Time
The temperature-time profiles; measured on the simulated boreholes demonstrate the effect of slag in reducing exotherm. Although not measured, addition of fly ash can also be expected to reduce peak temperatures. Higher temperatures may occur in-situ, depending on thermal conductivity of the surrounding soil. The results of the temperature measurements can be compared with those of Johnson et (1980) who measured the effect of pipe diameter and grout thickness on temperature at the pipe/grout intelface. The pipe diameters were greater than that used in this work and the grout was surrounded by soil. For grout thickness of 1.5 in. (38.1 mm) the peak temperature was around 40°C and this occurred at 10 hours. The peak temperature depends on grout thickness and a value around 65°C y;vas measured at the grout/casing interface for a neat Type I portland cement grout with a thickness of 3.625 in. (92 mm) by the same authors. Molz and Kurt (1979) have calculated temperature proties for water-plastic pipe-grout-soil and air-plastic pipe-grout soil systems. The findings are not directly comparable due to the different pipe sizes.
4.14 Grout Mixing
The relative merits of low she,ar paddle v,ersus high shear colloidal grout mixers have been discussed by Houlsby (1990), Domone and. Jefferis (1994) and Widmann (1996). Paddle mixers are less expensive than colloidal mixers, but also less eflective and require greater mixing time. Discharge from the mixing tank to the pump hopper is by gravity and, hence, is slower. The improved sand carrying capacity, decreased water requirement, reduced bleeding and greater flowability of grouts mixed colloidal mixers has been documented previously. Colloidal mixers improve wetting of the cement and sand particles and prevent segregation. Mixer studies in this work confirmed that a colloidal mixer would be preferred for GHP cement-sand grouts. However, the grouts can also be mixed in a paddle mixer if necessary a.:nd if a relatively high w/c is used.
Mix 108 with w/c = 0.6 that was mixed in the ChemGrout paddle mixer for grouting the 20 fi long tubes was pumpable but an improvement in fluidity is recommended before this grout is used
42

in the field. This will necessitate either increasing w/c or the superplasticizer dosage if this particular mixer is used. The sand content could be reduced, but this would result in lower thermal conductivity. Irrespective of the mixer ,used, it is recommended that trial mixes be performed and water or superplasticizer adjusted so that suitable pumpability is achieved. Variations in sand gradations form the sand used in this work will also require trial mixes to determine appropriate w/c. Any changes in mix proportions should be documented. It is cautioned that excessive water or superplasticizer beyond that required rvill be detrimental to properties of the grout such as bleeding, shrinkage, permeability, thermal conductivity, and durability.
Colloidal mixers are usually used in conjunction with a larger capacity agitator in which the grout is stored and agitated until use:. This is necessary to keep the particles in suspension, and, in the case of thixotropic grouts, keep the grout mobile and fluid. A colloidal mixer-agitator plant is more expensive than a single paddle mixer, The advantages of the plant include shorter mixing time, more rapid discharge, superior mixing and resultant grout properties. Colloidal mixers are available in a range of capacities (typically 60-‘127 gallons:), including trailer mounted units. Hence, they are readily suitable for GHP grouting. Pa’ddle mixers are recommended for high solids bentonite grouts that are currently being used ( E&hart, 1991). Centrifugal pumps or propeller type mixers should not be used for mixing cement-sand grouts since ,mixing will be unsatisfactory. Concrete ready mix trucks are also inappropriate for mixing of any type of grout.
With regard to mixing grout when bagged quantities of cement and sand are used, for s/c = 2.5 it is necessary to mix one 94 lb bag of cement to 2.35 100 lb bags of sand. For practical purposes, it may be simpler and quicker to mix the grout at a ratio of one bag of cement to two bags of sand. This gives an s/c= 2.13. Tests showed that such a grout would have a decreased water requirement (w/c = 0.57) and a lower thermal conductivity than that for s/c = 2.5 (Table 5). Preblending the cement and sand in the appropriate proportions would overcome the need for separate additions and ensure that the correct ra.tio is used. However, this will increase the grout cost. Since the grout properties in both the unhardened and hardened states are highly sensitive to w/c and superplasticizer dosage, it is critical that tlhe amounts of water and superplasticizer required for a grout batch be measured accurately. This can be achieved through use of graduated containers or with a water meter.
The procedure for mixing the cement-sand grouts in either a paddle or colloidal mixer is as follows (e.g., Houlsby, 1991):
1. 2. 3. 4. 5. 6. 7.
Place required measured quantity rof water in mixer. Place required measured quantity of liquid superplasticizer in mixer. Start mixer. Place required measured quantity of fly ash or blast furnace slag in mixer if used. Place required measured quantity of cement in mixer. Place required measured quantity of sand in mixer. Mix grout for specified time.
43
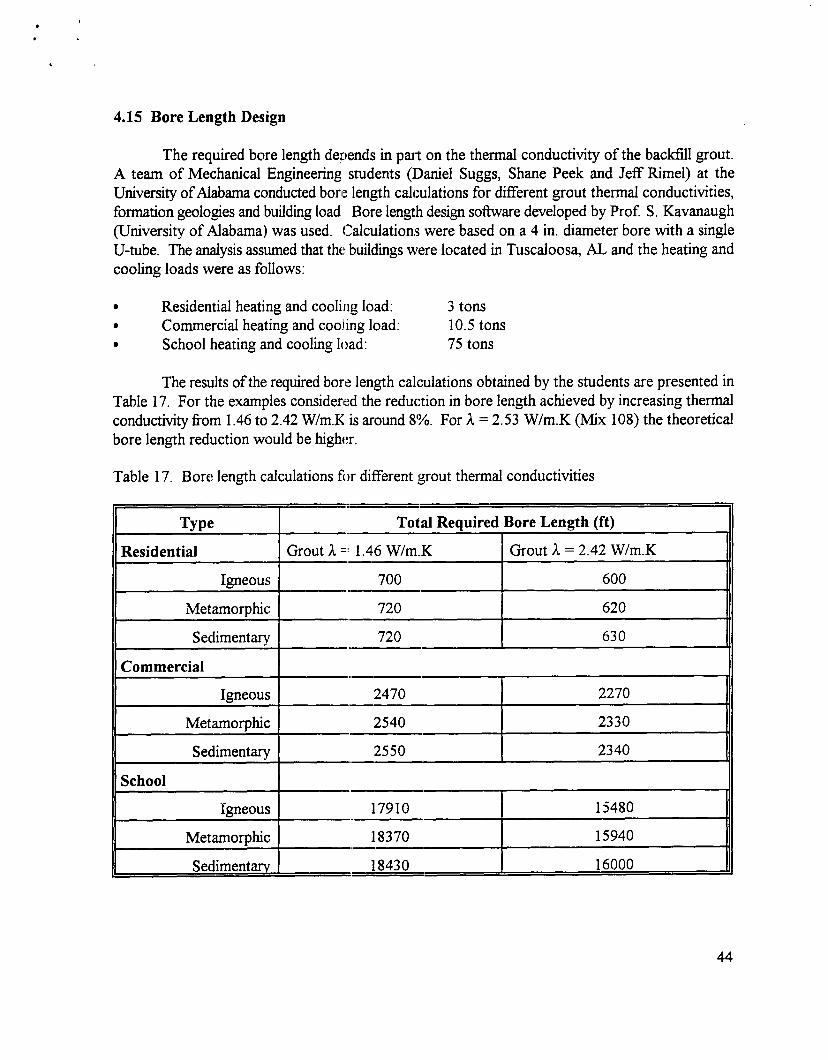
4.15 Bore Length Design
The required bore length depends in part on the thermal conductivity of the backfill grout. A team of Mechanical Engineering students (IDaniel Suggs, Shane Peek and Jeff Rimel) at the University of Alabama conducted bore length calculations for different grout thermal conductivities, formation geologies and building load Bore length design software developed by Prof. S. Kavanaugh (University of Alabama) was used. Calculations were based on a 4 in. diameter bore with a single U-tube. The analysis assumed that the buildings were located in Tuscaloosa, AT., and the heating and cooling loads were as follows:
. Residential heating and cooling load: 3 tons
. Commercial heating and cooii:ing load: 10.5 tons
. School heating and cooling load: 75 tons
The results of the required bore length calculations obtained by the students are presented in Table 17. For the examples considered the reduction in bore length achieved by increasing thermal conductivity from 1.46 to 2.42 W/m.K is around 8%. For A = 2.53 W/m.K (Mix 108) the theoretical bore length reduction would be higher.
Table 17. Bore length calculations for different grout thermal conductivities
Type
Residential Grout h =: 1.46 W/m.
Igneous
Metamorphic
Sedimentary
Commercial
Igneous
Metamorphic
Sedimentary
School
Igneous
Metamorphic
Sedimentarv
44

4.16 Costs
Cost analysis of the cement-sand grouts was undertaken in conjunction with a team of Mechanical Engineering students at the University of Alabama. The analysis included costs associated with freight,, labor, drilling etc. The following material costs were obtained from suppliers and used in the analysis:
. Cement: $5.15/94 lb bag
. Silica Sand: $3.00/100 lb bag
. Superplasticizer: $525/gal
By way of comparison., the coats for bulk quantities are $86.25/tori for cement and $15 .OO/ton for sand. Other costs are summarize~:1 in Table 18.
Table 18. Summary of typical costs rl.ssociated with grouting.
Drilling
Freight
Labor and Equipment
Length
0-2~00 ft
Description
<7500 lb
>75OO lb
T4’pe ..-
Foreman
Labcorer
G-rout machine
Light truck
cost
$7.00/A (Varies with
geology)
cost
$1.20/mile
$1 .OO/mile
Rate
$22.25/hr
$13.5O/hr
$120.00/day
$173.00/day
The economic outcome of using a more thermally conductive grout is reduced drilling time and costs associated with shorter bore length. The estimated costs of two different cement-sand grouts are compared in Table 19.
The grout costs and required bore length data can be combined to give an indication of impact of using different grout types. This [enables comparison of thermally enhanced bentonite grout (thermal conductivity = 1.46 W/m.K, specific gravity = 1.64) and cement-sand grouts. The results
of sample calculations are presented in Table 20. A 4 in. diameter borehole and a single U-tube with 1.125 in. OD pipes have selected as an example. This would require 55 US gallons per 100 lineal
45

1
I
, ,
feet, assuming no loss of grout to the formation. A cost of $0.80/gallon has been assumed for the thermally enhanced bentonite grout. For the described assumptions the grout costs can be reduced by around 34% by using the cement-s#and grout with thermal conductivity = 2.42 W/m.K (Mix 111). IfJ. = 2.53 W/m.K (Mix 108) is used the savings would be greater due to the shorter predicted bore length and slightly lower grout cost. These savings are in addition to the reduction in drilling costs associated with the shorter bore lengths.
Table 19. Cost of cement-sand groLrts
Mix 111
tis ,:,,r8 584
Super-plasticizer (Urn”) 1
Total Cost (%/litre)
Total Cost (%/LJS gal)
Thermal Conductivitv rW/m.K)
Specific Gravitv :_-L- 2.18 2.17
Table 20. Grout material costs for re:lquired borer length
46

, ’ ,
4.17 Thermal Resistance Tests
The team of students at the Urliversity of Alabama designed, built and tested a rig to measure the net thermal resistance per unit length of vertical loop systems. This rig uses a 10 ft. length of 4 in. diameter tube containing a single U-tube that is backfilled with the test material. The tube is placed inside an 8 in. diameter PVC pipe. Cold well water was circulated in this jacket. The system was run for 24 hours prior to testing in order to achieve steady state, The temperature of water entering the tube was 95°F (35°C). Tests were conducted with saturated sand and Mix 108 as back6ll. The experimental net thermal resistance per unit length was determined to be 0.129 to 0.156 fi-F-hr/Btu (depending on flow rate) iand 0.143 ft-F-hriBtu for Mix 108. The rig will enable fLture testing of different grouts under different operating conditions and experimental verification of theoretical calculations.
4.18 Future Work
In FY 98 it is planned to conl:luct a field demonstration using one of the developed grouts. In-situ thermal conductivity measurements will be performed and compared with laboratory data. Heat pump performance will be monitored over heating and cooling seasons. The field demonstration will enable quantitative comparison of 1: he selected cement-sand grout with conventional grouts under actual working conditions. Further studies of bonding of cementitious grouts to U-tube and surrounding formation will be conducted, including analysis of the effect of contact resistance on heat transfer. Freeze-thaw durability tests will be completed. Collaboration with the University of Alabama to measure thermal resistance per unit Ilength for different grouts is also planned.
5.0 CONCLUSIONS
Research has shown that superplasticized cement-silica sand grouts have thermal conductivities in the range of 1.73 1 110 2.644 W/m.K (1.000 to 1.528 Btu/hr.A.“F), depending on sand/cement ratio and sand gradation. Cement-sand grouts have higher thermal conductivity than neat cement or bentonite grouts. Sand that. meets the gradation specsed in AC1 304 or [email protected] (US Silica) are suitable for use. Shrinkage resistance, bond strength and durability are improved by addition of sand. Exotherm of the grout can be reduced by addition of such additives as blast furnace slag but this does not directly result in improved bonding between HDPE heat exchanger pipe and grout. The improvements in thermal conductivity are predicted to decrease required bore length, and therefore reduce drilling and material:;, costs associated with installation of vertically oriented heat exchangers for geothermal heat pumps.
Some variations in grout mix proportions may be necessary to achieve required pumpability, depending on type of grout mixer used and exact sand gradation. Thus, trial mixes are recommended before full scale grouting. Further research and field demonstrations are necessary to capitalize on the usefblness of thermally conductiv:: cementitious grouts for improving ground heat exchanger performance and reducing borehole length. In particular, it is important to obtain quantitative data verifying in-situ characteristics and eff ictiveness.
47

6.0 REFERENCES
AC1 207. IR-70, Mass Concrete for .[>ams and Other Massive Structures, AC1 Manual of Concrete Practice, Part 1, 1982.
AC1 304. lR, Guide for the Use of Prcplaced Aggregate Concrete for Structural and Mass Concrete Applications, American Concrete Iwtitute Materials Journal, V. 88, No. 6, pp. 650-668, 1991.
M.L. Allan, Latex-Modified Grouts for In-Situ Stabilization of Buried Transuranic/Mixed Waste, BNL 63 199, 1996.
M.L. Allan and S.P. Kavanaugh, Thermal Conductivity of Cementitious Grouts and Impact on Heat Exchanger Length Design for Geothermal He;at Pumps, Submitted to International Journal of HVAC&R Research, June 1997.
M.L. Allan and L.E. Kukacka, Strength and Durability of Polypropylene Fibre Reinforced Grouts, Cement and Concrete Research, V. Z5, No. 3, pp. 511-521, 1995.
M.L. Allan and L.E. Kukacka, Coinparison Between Slag- and Silica Fume-Modified Grouts. American Concrete Institute Materials Journal, ‘V. 93, No. 6, pp. 559-568, 1996.
M.L. Allan and L.E. Kukacka, Permeability and Leach Resistance of Grout-Based Materials Exposed to Suiphates, in IMechanisms of Chemical Degradation of Cement-Based Systems, K.L. Scrivener and J.F. Young (eds), E and FN Spon, London, 1997.
B. Benrnokrane, A. Chennouf and H. ;Z;. Mitri, Laboratory Evaluation of Cement-Based Grouts and Grouted Rock Anchors, International Journal of Rock Mechanics and Mining Sciences and Geomechanics Abstracts, V. 32, No. ‘7, pp. 633-642, 1995.
I. Biczbk, Concrete Corrosion and C’#oncrete Protection, AkadCmiai Kiad6, Budapest, 1972.
H.J. Braud, Grout Effect in Vertical Heat Pump Bores, Proceedings of International Energy Agency Ground Coupled Heat Pump Conference, 1991.
H. J. Braud and S. McNamara, Enhancement of Heat Transfer to Earth in Ground Coupled Heat Pump Bores, ASAEXSAE Meeting, Quebec, 1989.
P.L.J. Domone and S.A. Jefferis (ed!s), Structural Grouts, Blackie Academic and Professional, London, 1994.
F. Eckhart, Grouting Procedures f:)r Ground-,Source Heat Pump Systems, Oklahoma State University, Ground Source Heat Pump Publicatiolns, 199 1.
48

T.B. Edil, M.M.K. Chang, L.T. Lan, and T.V. Riewe, Sealing Characteristics of Selected Grouts for Water Wells, Ground Water, V. :;O, No. 3, p:p. 351-361, 1992.
J.P.H. Frearson, Sulfate Resistance of Combinations of Portland Cement and Ground Granulated Blast Furnace Slag, in Fly Ash, Silica Fume, Slag and Natural Pozzolans in Concrete, American Concrete Institute SP 114, Detroit, pp. 1495-15:!4, 1986.
AC. Ho&y, Construction and Design of Cement Grouting, John Wiley and Sons, New York, 1990.
R.C. Johnson, C.E. Kurt, and G.F. IDunham, Well Grouting and Casing Temperature Increases, Ground Water, V. 18, No.1, pp. 7-U., 1980.
K.H. Khayat and A. Yahia, Effect of? Welan Gum-High-Range Water Reducer Combinations on Rheology of Cement Grouts, American Concrete Institute Materials Journal, V. 94, No. 5, 1997.
S.H. Kosmatka, W.C. Panarese, G.E. Allen and S. Cumming, Design and Control of Concrete Mixtures, Fifth Ed., Portland Cement Association, 1991.
C.D. Lawrence, Sulphate Attack on Ccncrete, Magazine of Concrete Research, V. 42 No. 153, pp. 249-264, 1990.
FM. Lea, The Chemistry of Cement and Concrete, Chemical Publishing Co., New York, 1971
A.J. Lutenegger and D.J. DeGroot, Hydraulic Conductivity of Borehole Sealants, in Hydraulic Conductivity and Waste Contaminant Transport in Soil, D.E. Daniel and S.J Trautwein (Eds.) ASTM STP 1142, American Society for Testing and Materials, Philadelphia, 439-460, 1994.
S. Mindess and J.F. Young, Concrete, Prentice-Hall, Englewood Cliffs, 198 1.
F.J. Molz and C.E. Kurt, Grout-Induced Temperature Rise Surrounding Wells, Ground Water, V. 17 No. 3, pp. 264-269, 1979.
AM. Neville, Properties of Concrete, :Fourth Edit.ion, John Wiley and Sons, New York, 1996.
M. Onof&, M.N.. Gray, W.E. Coons, and S.R Alcorn, High Performance Cement-Based Grouts for use in a Nuclear Waste Disposal Facility, Waste Management, V. 12, No. 2, pp. 133-154, 1992.
C.P. Remund and J.T. Lund, Thermal Enhancement of Bentonite Grouts for Vertical,GSHP Systems, in Heat Pump and Refrigeration System;;,, K.R. Den Braven and V. Mei (Eds.), American Society of Mechanical Engineers, 29, pp. 95-10Ctz, 1993.
C.B. Skaggs, W.G. Rakitsky and SF. Whitaker, Applications of Rheological Modifiers and Superplasticizers in Cementitious Systems, in Fourth UNMET/AC1 International Conference on
49

Superplasticizers and other Chemical Admixtures in Concrete, American Concrete Institute SP 148, Detroit, 1994.
D.K. Smith, Cementing, Society of Petroleum Engineers, New York, 1990.
S. Sprung, W. Rechenberg, and G. Bachman, Enviionmental Compatibility of Cement and Concrete, in Environmental Aspects of Construction with Waste Materials, J.J.J.M Gourmans, H.A. van der Sloot and Th.G. Aalbers (Eds.), Elsevier Science!, Amsterdam, pp. 369-385, 1994.
L.H. Van Vlack, Materials for Engineering, Addison-Wesley, Reading, 1982.
R. Widmann (ed.), International Society for Rock Mechanics Commission on Rock Grouting, Jnternational Journal of Rock Mechanics and Mining Sciences and Geomechanics Abstracts, V. 33, No. 8, pp. 803-847, 1996.
50