injection grouts for ancient masonry
TRANSCRIPT

1
INJECTION GROUTS FOR ANCIENT MASONRY RHEOLOGICAL BEHAVIOR
Paulo Jorge Pestana Tonilhas e Reis
Civil Engineering Department. Instituto Superior Técnico. Universidade de Lisboa. Portugal.
1. Introduction
Grout injection has become, over the last few decades, one of the most widely used means to rehabilitate
masonry structures in ancient buildings. The cracks and voids that result from the deterioration of this
kind of structure may cause local damage or even total collapse. Grout injection may prevent this from
happening by filling these voids, thus consolidating these structures and helping restore their original
capacity to withstand soliciting forces. The knowledge of the fresh behavior of these materials is of
paramount importance, as they must be able to penetrate through cracks as small as 0.1 mm (Kalagri et
al. 2010). Because of this necessity, it is important to study grouts’ rheology, which is not only meant to
evaluate their viscosity, but also other rheological parameters, such as yield stress and other variables
that depend on their composition, through the application of adequate rheological models. In this thesis,
the viscometer Viskomat NT is used in order to evaluate, through said models, the evolution of the
rheological behavior of grouts produced by using 7 different binders – 3 produced using different types
of hydraulic lime without any admixtures and 4 using commercial pre-dosed grouts. The spread test and
the cone method are commonly used to indirectly evaluate grouts’ yield stress and viscosity, respectively.
Such tests were performed along with the viscometer measurements, in an attempt to define their
accuracy within the grouts tested.
2. Grout Injection
Grout Injection is an irreversible procedure, and for this reason it is important to ensure that the adequate
grouts are used in each intervention. Grouts must be compatible with the masonry in terms of mechanical,
chemical and physical properties in order to maximize the longevity of intervened structures. Grout
properties, namely their fluidity and injectabilty, depend not only on their composition but also on the
mixing process; mixing speed, mixing time and the order in which the components are added may change
a grout’s characteristics.
The absence of proper standardization for ancient masonry injection grouts led to standards applicable
to grout injection in pre-stressing cables being adopted, such as the portuguese standards NP EN 445:2008
and NP EN 447:2008, to serve as guidelines (Almeida et al. 2012). These standards define how the cone
method shall be applied to evaluate grouts’ fluidity and how the spread test shall be conducted to
evaluate grouts’ yield stress.
Hydraulic binders present optimal properties to produce grouts, not needing CO2 in their hardening
process. Hydraulic lime is particularly effective due to the similarities it presents with most of the mortars
present in ancient masonries. Usage of organic binders in this kind of grout is highly discouraged.

2
3. Grout rheology
In chemical terms, grouts are suspensions. The Bingham rheological model is generally adequate to study
the behavior of this type of material. This model is defined by:
𝜏 = 𝜏0 + 𝜂𝑝𝑙 ∙ γ̇, (1)
where 𝜏 is the shear stress applied (Pa), 𝜏0 the yield stress of the material (Pa), 𝜂𝑝𝑙 its coefficient of plastic
viscosity (Pa∙s), or, simply put, viscosity, and γ̇ is the shear rate (s-1). This type of behavior is depicted in
Figure 1.
Different types of probe can be used with the viscometer used in this work for the measurement of
rheological parameters of grouts. The usage of one particular probe could convert it into a regular
rotational cylinder rheometer, where the grout would be placed within the empty space between two
cylinders with the same axis. The outward cylinder would revolve around this axis at a set speed and the
inward one would allow, through a transducer place on its axis, the measurement of the torque that would
result from the drag the grout would exert over the cylinder’s surface. This would result in obtaining the
values of 𝜏0 and 𝜂𝑝𝑙 in conventional units, Pa and Pa∙s, respectively. Unfortunately, given the chemical
nature of grouts, segregation is bound to occur when they’re subjected to shear stress, resulting in
inaccurate measurements.
The solution was to use a different type of probe, one shaped as a mixer, which would keep segregation
from happening. The downside is that this probe, unlike the cylindrical one, does not have a well-defined
shape or dimensions, and because of this the rheological parameters cannot be obtained directly in
standard units. However, the torque measured still depends on the rotation speed of the cylindrical
containment vessel, allowing the relationship between these two values to be established. Upon testing
any grout using this probe, the results measured by the viscometer are very similar to those shown in
Figure 2. The similarity between Figures 1 and 2 is obvious, and the results obtained by using this method
can be used to describe the rheological behavior of grouts (Banfill 1991). These results can be represented
as the following:
𝑇 = 𝑔 + ℎ𝑁, (2)
where 𝑇 is the torque (N∙mm), 𝑔 is the y-intercept (N∙mm), ℎ is the slope (N∙mm∙min), and 𝑁 is the
rotation speed (rpm). According to Banfill (1991), 𝑔 and ℎ can be used to evaluate variations of yield stress
and viscosity, respectively. These values could be converted into conventional values of yield stress (Pa)
and viscosity (Pa∙s), if the concept of a Bingham calibration fluid had already been proven, but to date this
𝜏
𝜏0
𝜂𝑝𝑙
torq
ue
(N∙m
m)
rotation speed (rpm)
Figure 1 - Bingham behavior. Figure 2 - Measurements on a grout.
3
hasn’t happened and the evaluation of the rheological behavior of grout had to be made in terms of 𝑔
and ℎ.
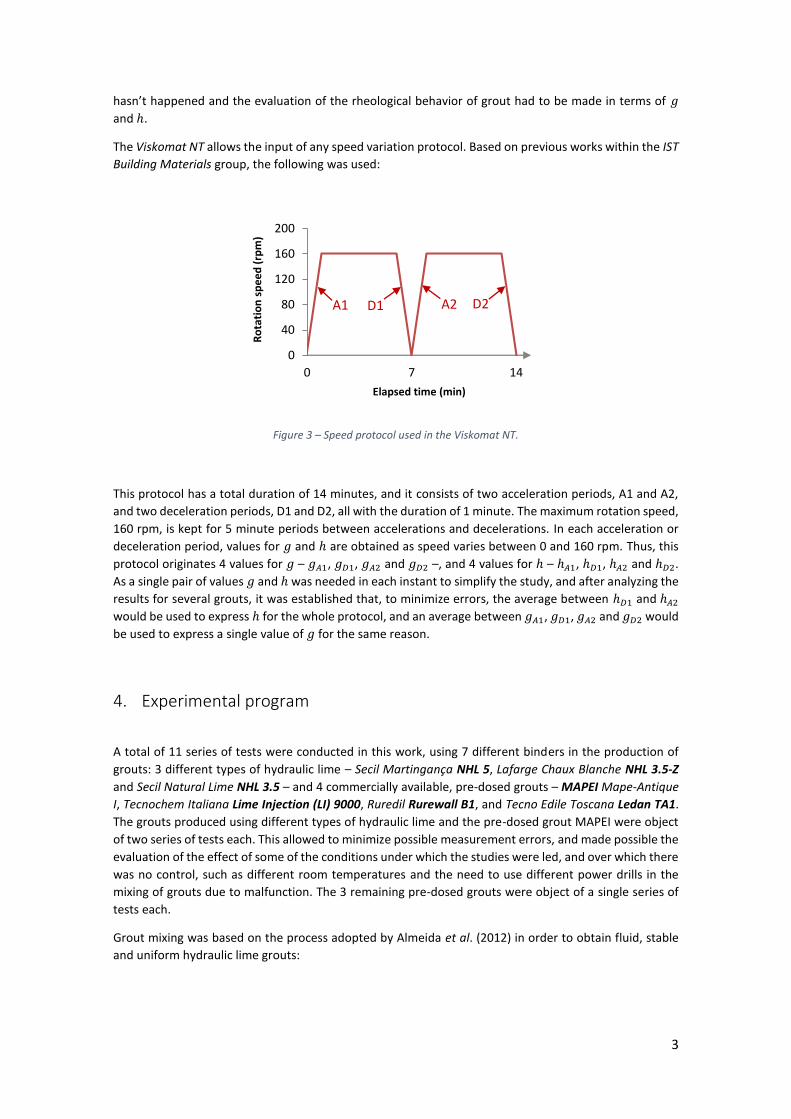
The Viskomat NT allows the input of any speed variation protocol. Based on previous works within the IST
Building Materials group, the following was used:
Figure 3 – Speed protocol used in the Viskomat NT.
This protocol has a total duration of 14 minutes, and it consists of two acceleration periods, A1 and A2,
and two deceleration periods, D1 and D2, all with the duration of 1 minute. The maximum rotation speed,
160 rpm, is kept for 5 minute periods between accelerations and decelerations. In each acceleration or
deceleration period, values for 𝑔 and ℎ are obtained as speed varies between 0 and 160 rpm. Thus, this
protocol originates 4 values for 𝑔 – 𝑔𝐴1, 𝑔𝐷1, 𝑔𝐴2 and 𝑔𝐷2 –, and 4 values for ℎ – ℎ𝐴1, ℎ𝐷1, ℎ𝐴2 and ℎ𝐷2.
As a single pair of values 𝑔 and ℎ was needed in each instant to simplify the study, and after analyzing the
results for several grouts, it was established that, to minimize errors, the average between ℎ𝐷1 and ℎ𝐴2
would be used to express ℎ for the whole protocol, and an average between 𝑔𝐴1, 𝑔𝐷1, 𝑔𝐴2 and 𝑔𝐷2 would
be used to express a single value of 𝑔 for the same reason.
4. Experimental program
A total of 11 series of tests were conducted in this work, using 7 different binders in the production of
grouts: 3 different types of hydraulic lime – Secil Martingança NHL 5, Lafarge Chaux Blanche NHL 3.5-Z
and Secil Natural Lime NHL 3.5 – and 4 commercially available, pre-dosed grouts – MAPEI Mape-Antique
I, Tecnochem Italiana Lime Injection (LI) 9000, Ruredil Rurewall B1, and Tecno Edile Toscana Ledan TA1.
The grouts produced using different types of hydraulic lime and the pre-dosed grout MAPEI were object
of two series of tests each. This allowed to minimize possible measurement errors, and made possible the
evaluation of the effect of some of the conditions under which the studies were led, and over which there
was no control, such as different room temperatures and the need to use different power drills in the
mixing of grouts due to malfunction. The 3 remaining pre-dosed grouts were object of a single series of
tests each.
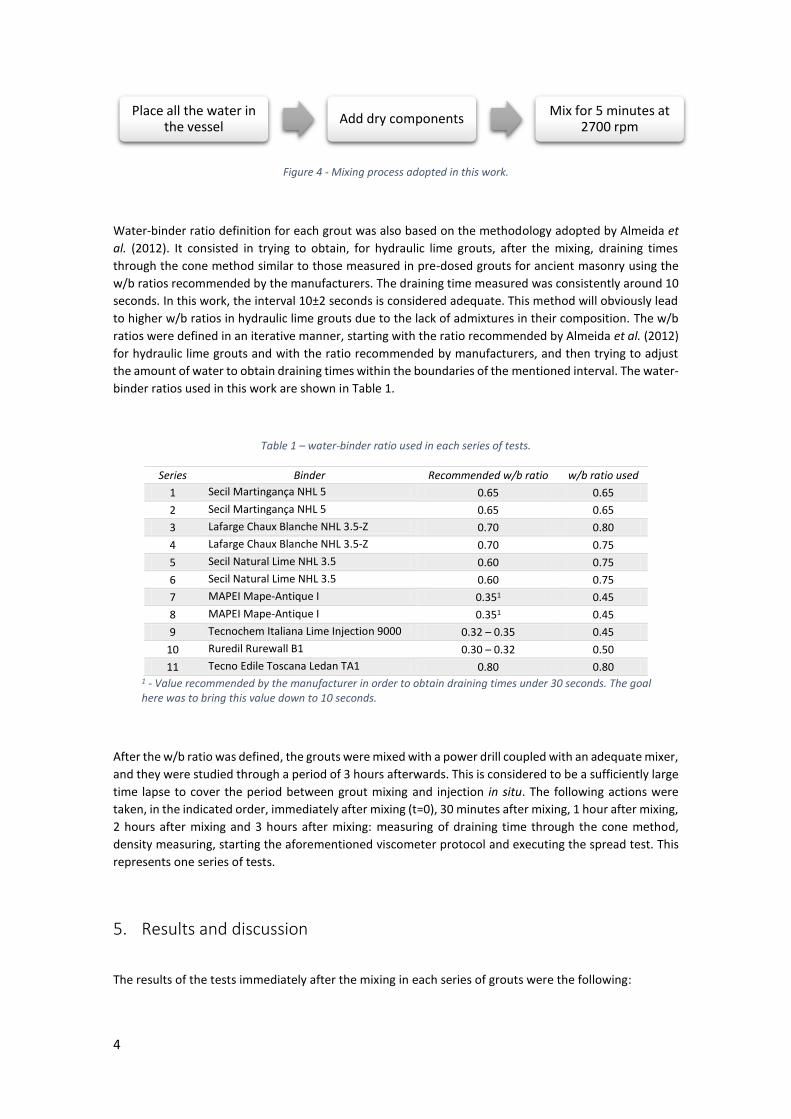
Grout mixing was based on the process adopted by Almeida et al. (2012) in order to obtain fluid, stable
and uniform hydraulic lime grouts:
0
40
80
120
160
200
0 7 14
Ro
tati
on
sp
ee
d (
rpm
)
Elapsed time (min)
A1 D1 A2 D2
4
Figure 4 - Mixing process adopted in this work.
Water-binder ratio definition for each grout was also based on the methodology adopted by Almeida et
al. (2012). It consisted in trying to obtain, for hydraulic lime grouts, after the mixing, draining times
through the cone method similar to those measured in pre-dosed grouts for ancient masonry using the
w/b ratios recommended by the manufacturers. The draining time measured was consistently around 10
seconds. In this work, the interval 10±2 seconds is considered adequate. This method will obviously lead
to higher w/b ratios in hydraulic lime grouts due to the lack of admixtures in their composition. The w/b
ratios were defined in an iterative manner, starting with the ratio recommended by Almeida et al. (2012)
for hydraulic lime grouts and with the ratio recommended by manufacturers, and then trying to adjust
the amount of water to obtain draining times within the boundaries of the mentioned interval. The water-
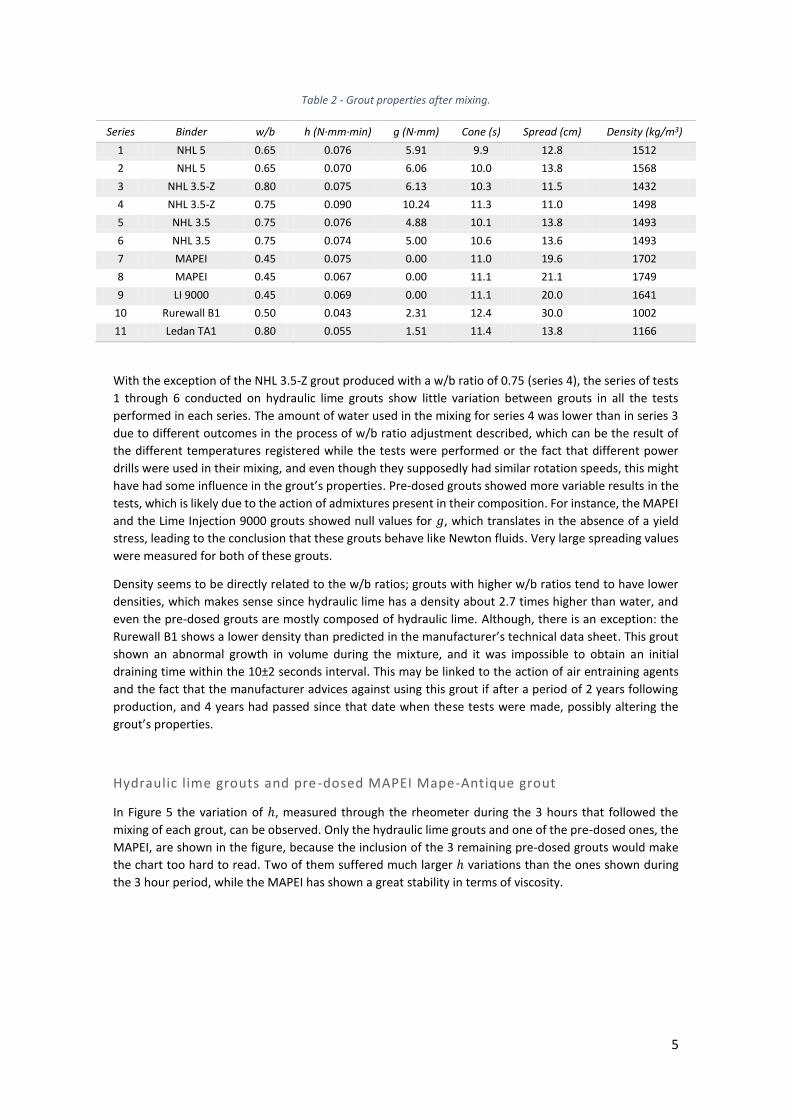
binder ratios used in this work are shown in Table 1.
Table 1 – water-binder ratio used in each series of tests.
Series Binder Recommended w/b ratio w/b ratio used
1 Secil Martingança NHL 5 0.65 0.65
2 Secil Martingança NHL 5 0.65 0.65
3 Lafarge Chaux Blanche NHL 3.5-Z 0.70 0.80
4 Lafarge Chaux Blanche NHL 3.5-Z 0.70 0.75
5 Secil Natural Lime NHL 3.5 0.60 0.75
6 Secil Natural Lime NHL 3.5 0.60 0.75
7 MAPEI Mape-Antique I 0.351 0.45
8 MAPEI Mape-Antique I 0.351 0.45
9 Tecnochem Italiana Lime Injection 9000 0.32 – 0.35 0.45
10 Ruredil Rurewall B1 0.30 – 0.32 0.50
11 Tecno Edile Toscana Ledan TA1 0.80 0.80 1 - Value recommended by the manufacturer in order to obtain draining times under 30 seconds. The goal here was to bring this value down to 10 seconds.
After the w/b ratio was defined, the grouts were mixed with a power drill coupled with an adequate mixer,
and they were studied through a period of 3 hours afterwards. This is considered to be a sufficiently large
time lapse to cover the period between grout mixing and injection in situ. The following actions were
taken, in the indicated order, immediately after mixing (t=0), 30 minutes after mixing, 1 hour after mixing,
2 hours after mixing and 3 hours after mixing: measuring of draining time through the cone method,
density measuring, starting the aforementioned viscometer protocol and executing the spread test. This
represents one series of tests.
5. Results and discussion
The results of the tests immediately after the mixing in each series of grouts were the following:
Place all the water in the vessel
Add dry componentsMix for 5 minutes at
2700 rpm
5
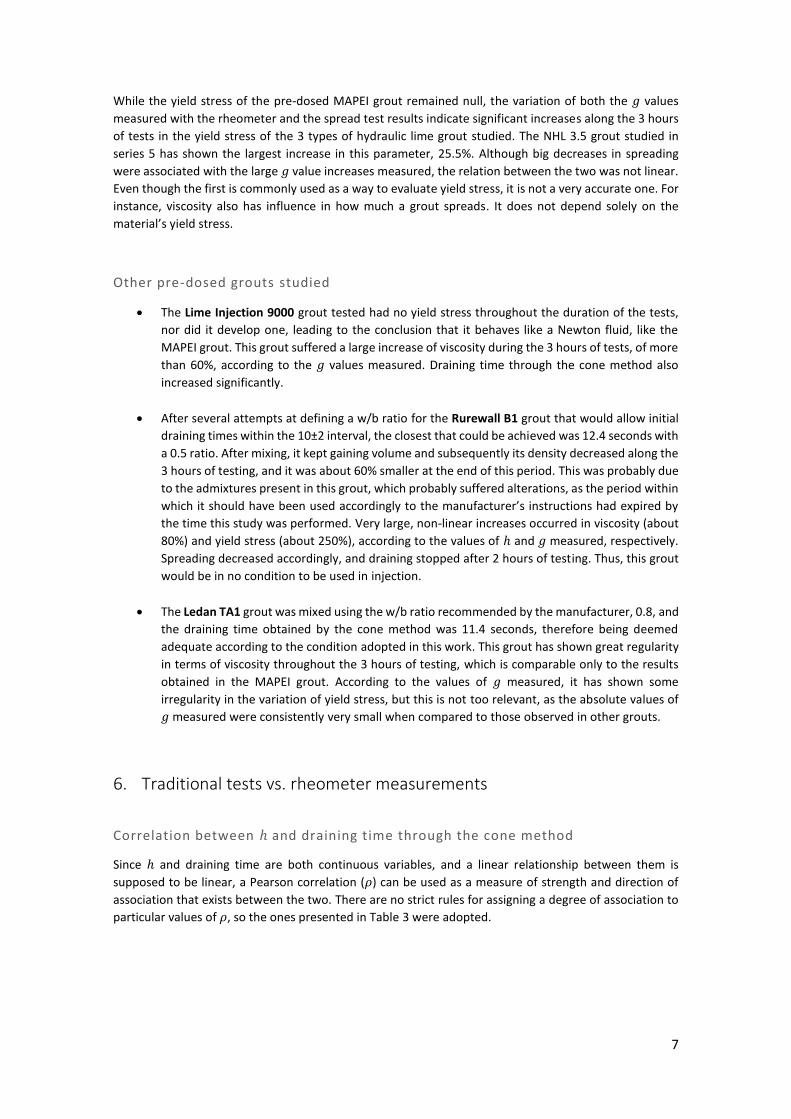
Table 2 - Grout properties after mixing.
Series Binder w/b h (N∙mm∙min) g (N∙mm) Cone (s) Spread (cm) Density (kg/m3)
1 NHL 5 0.65 0.076 5.91 9.9 12.8 1512
2 NHL 5 0.65 0.070 6.06 10.0 13.8 1568
3 NHL 3.5-Z 0.80 0.075 6.13 10.3 11.5 1432
4 NHL 3.5-Z 0.75 0.090 10.24 11.3 11.0 1498
5 NHL 3.5 0.75 0.076 4.88 10.1 13.8 1493
6 NHL 3.5 0.75 0.074 5.00 10.6 13.6 1493
7 MAPEI 0.45 0.075 0.00 11.0 19.6 1702
8 MAPEI 0.45 0.067 0.00 11.1 21.1 1749
9 LI 9000 0.45 0.069 0.00 11.1 20.0 1641
10 Rurewall B1 0.50 0.043 2.31 12.4 30.0 1002
11 Ledan TA1 0.80 0.055 1.51 11.4 13.8 1166
With the exception of the NHL 3.5-Z grout produced with a w/b ratio of 0.75 (series 4), the series of tests
1 through 6 conducted on hydraulic lime grouts show little variation between grouts in all the tests
performed in each series. The amount of water used in the mixing for series 4 was lower than in series 3
due to different outcomes in the process of w/b ratio adjustment described, which can be the result of
the different temperatures registered while the tests were performed or the fact that different power
drills were used in their mixing, and even though they supposedly had similar rotation speeds, this might
have had some influence in the grout’s properties. Pre-dosed grouts showed more variable results in the
tests, which is likely due to the action of admixtures present in their composition. For instance, the MAPEI
and the Lime Injection 9000 grouts showed null values for 𝑔, which translates in the absence of a yield
stress, leading to the conclusion that these grouts behave like Newton fluids. Very large spreading values
were measured for both of these grouts.
Density seems to be directly related to the w/b ratios; grouts with higher w/b ratios tend to have lower
densities, which makes sense since hydraulic lime has a density about 2.7 times higher than water, and
even the pre-dosed grouts are mostly composed of hydraulic lime. Although, there is an exception: the
Rurewall B1 shows a lower density than predicted in the manufacturer’s technical data sheet. This grout
shown an abnormal growth in volume during the mixture, and it was impossible to obtain an initial
draining time within the 10±2 seconds interval. This may be linked to the action of air entraining agents
and the fact that the manufacturer advices against using this grout if after a period of 2 years following
production, and 4 years had passed since that date when these tests were made, possibly altering the
grout’s properties.
Hydraulic lime grouts and pre-dosed MAPEI Mape-Antique grout
In Figure 5 the variation of ℎ, measured through the rheometer during the 3 hours that followed the
mixing of each grout, can be observed. Only the hydraulic lime grouts and one of the pre-dosed ones, the
MAPEI, are shown in the figure, because the inclusion of the 3 remaining pre-dosed grouts would make
the chart too hard to read. Two of them suffered much larger ℎ variations than the ones shown during
the 3 hour period, while the MAPEI has shown a great stability in terms of viscosity.

6
Figure 5 - ℎ variation during the 3 hours of tests.
None of the shown grouts suffered a great ℎ variation through the 3 hours of tests, the largest being an
approximate 15% increase in test series 6, which indicates that they would probably remain injectable
through this period of time.
The two series of tests performed over grouts produced with Secil Martingança NHL 5 with the same w/b
ratio show different results, and a greater increase in the value ℎ can be observed in series 2 when
compared with series 1. The two separate series of tests were conducted under different circumstances:
the first series was led under a higher average temperature (about 21.5oC), almost 5oC above the average
temperature measured during the second series (about 15.9oC), and the power drill used in the mixing
was not the same. A similar phenomenon has happened with the pre-dosed grout MAPEI Mape-Antique
I, studied in series 7 and 8, and a bigger increase of ℎ was observed in the latter. In series 7 the grout was
mixed with the power drill used in series 1, and in series 8 the power drill was the same used in series 2.
Temperature also dropped about 5oC from series 7 to series 8. However, this pre-dosed grout has shown
very little variation of ℎ in both instances.
The different evolution of ℎ in NHL 3.5 and NHL 3.5-Z grouts in series 3 through 6 is probably due to
different reasons: in series 3 and 4, the NHL 3.5-Z grouts were mixed using different w/b ratios, even
though these were defined following the same methodology; the NHL 3.5 grout studied in series 6 was
mixed using a much lower mixing speed than all the other grouts studied, 1050 rpm, well below the
minimum of 2400 rpm recommended by Toumbakari (2002). This low mixing speed was the result of an
unfamiliarity with the second power drill used, which was set to a lower rotation speed, but this allowed
an analysis of the influence of a large variation in mixing speed in the evolution of the grout’s properties.
The draining time measured through the cone method has only shown significant increases during the 3
hours in the series of tests conducted on the NHL 3.5 and NHL 3.5-Z grouts, and with the exception of the
NHL 3.5-Z grout studied in series 3, these variations correspond to large variations of ℎ. The draining time
of MAPEI pre-dosed grouts has shown slight increases, which is compatible with the low variations of ℎ
measured, but a more pronounced variation of this test on the NHL 5 grouts was expected.
Marginal increases in density were measured in the 3 hour period on all of these grouts, which are
probably the result of the loss of water. Water-binder ratios larger than those advised may have led to
excess water present in grouts’ composition, but such ratios were needed to obtain the desired fluidity,
evaluated through the cone method. The ageing of materials may have led to the need of using high
quantities of water.
90
95
100
105
110
115
Series 1NHL 5
w/b = 0.65
Series 2NHL 5
w/b = 0.65
Series 3NHL 3.5-Zw/b = 0.80
Series 4NHL 3.5-Zw/b = 0.75
Series 5NHL 3.5
w/b = 0.75
Series 6NHL 3.5
w/b = 0.75
Series 7MAPEI
w/b = 0.45
Series 8MAPEI
w/b = 0.45
h variation relative to t0 (%)
t=0
t=30min
t=1h
t=2h
t=3h
7
While the yield stress of the pre-dosed MAPEI grout remained null, the variation of both the 𝑔 values
measured with the rheometer and the spread test results indicate significant increases along the 3 hours
of tests in the yield stress of the 3 types of hydraulic lime grout studied. The NHL 3.5 grout studied in
series 5 has shown the largest increase in this parameter, 25.5%. Although big decreases in spreading
were associated with the large 𝑔 value increases measured, the relation between the two was not linear.
Even though the first is commonly used as a way to evaluate yield stress, it is not a very accurate one. For
instance, viscosity also has influence in how much a grout spreads. It does not depend solely on the
material’s yield stress.
Other pre-dosed grouts studied
The Lime Injection 9000 grout tested had no yield stress throughout the duration of the tests,
nor did it develop one, leading to the conclusion that it behaves like a Newton fluid, like the
MAPEI grout. This grout suffered a large increase of viscosity during the 3 hours of tests, of more
than 60%, according to the 𝑔 values measured. Draining time through the cone method also
increased significantly.
After several attempts at defining a w/b ratio for the Rurewall B1 grout that would allow initial
draining times within the 10±2 interval, the closest that could be achieved was 12.4 seconds with
a 0.5 ratio. After mixing, it kept gaining volume and subsequently its density decreased along the
3 hours of testing, and it was about 60% smaller at the end of this period. This was probably due
to the admixtures present in this grout, which probably suffered alterations, as the period within
which it should have been used accordingly to the manufacturer’s instructions had expired by
the time this study was performed. Very large, non-linear increases occurred in viscosity (about
80%) and yield stress (about 250%), according to the values of ℎ and 𝑔 measured, respectively.
Spreading decreased accordingly, and draining stopped after 2 hours of testing. Thus, this grout
would be in no condition to be used in injection.
The Ledan TA1 grout was mixed using the w/b ratio recommended by the manufacturer, 0.8, and
the draining time obtained by the cone method was 11.4 seconds, therefore being deemed
adequate according to the condition adopted in this work. This grout has shown great regularity
in terms of viscosity throughout the 3 hours of testing, which is comparable only to the results
obtained in the MAPEI grout. According to the values of 𝑔 measured, it has shown some
irregularity in the variation of yield stress, but this is not too relevant, as the absolute values of
𝑔 measured were consistently very small when compared to those observed in other grouts.
6. Traditional tests vs. rheometer measurements
Correlation between ℎ and draining time through the cone method
Since ℎ and draining time are both continuous variables, and a linear relationship between them is
supposed to be linear, a Pearson correlation (𝜌) can be used as a measure of strength and direction of
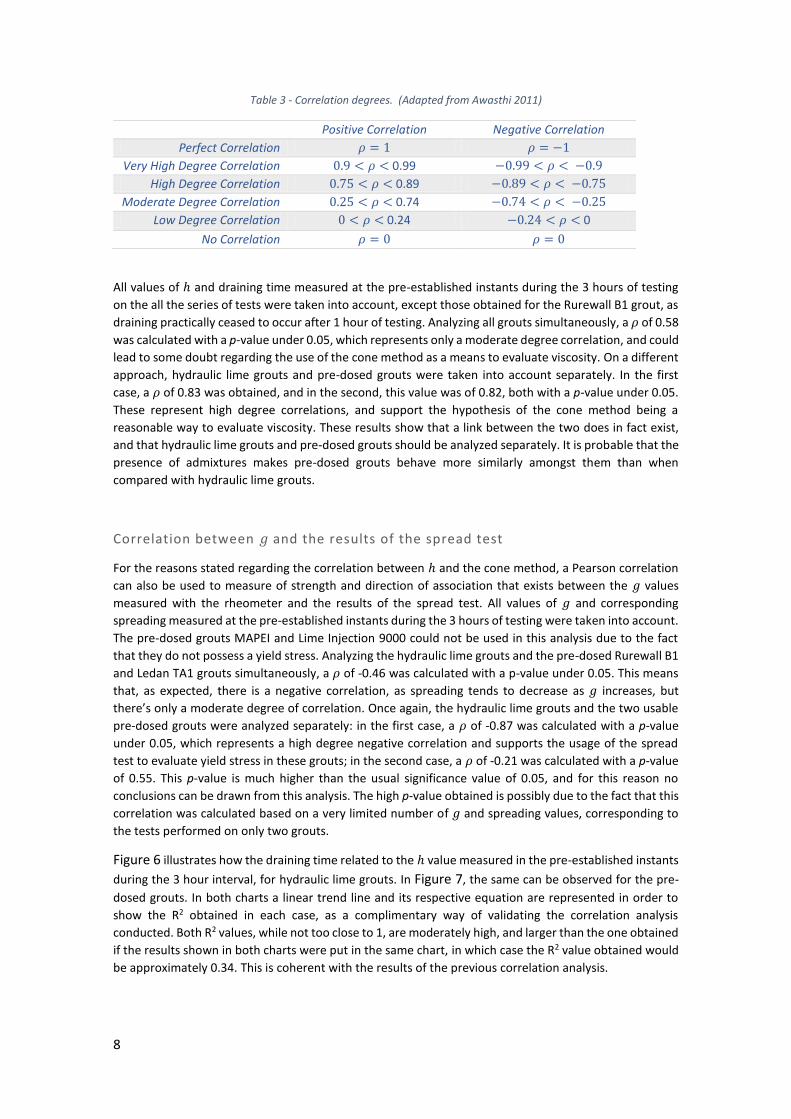
association that exists between the two. There are no strict rules for assigning a degree of association to
particular values of 𝜌, so the ones presented in Table 3 were adopted.
8
Table 3 - Correlation degrees. (Adapted from Awasthi 2011)
Positive Correlation Negative Correlation
Perfect Correlation 𝜌 = 1 𝜌 = −1
Very High Degree Correlation 0.9 < 𝜌 < 0.99 −0.99 < 𝜌 < −0.9
High Degree Correlation 0.75 < 𝜌 < 0.89 −0.89 < 𝜌 < −0.75
Moderate Degree Correlation 0.25 < 𝜌 < 0.74 −0.74 < 𝜌 < −0.25
Low Degree Correlation 0 < 𝜌 < 0.24 −0.24 < 𝜌 < 0
No Correlation 𝜌 = 0 𝜌 = 0
All values of ℎ and draining time measured at the pre-established instants during the 3 hours of testing
on the all the series of tests were taken into account, except those obtained for the Rurewall B1 grout, as
draining practically ceased to occur after 1 hour of testing. Analyzing all grouts simultaneously, a 𝜌 of 0.58
was calculated with a p-value under 0.05, which represents only a moderate degree correlation, and could
lead to some doubt regarding the use of the cone method as a means to evaluate viscosity. On a different
approach, hydraulic lime grouts and pre-dosed grouts were taken into account separately. In the first
case, a 𝜌 of 0.83 was obtained, and in the second, this value was of 0.82, both with a p-value under 0.05.
These represent high degree correlations, and support the hypothesis of the cone method being a
reasonable way to evaluate viscosity. These results show that a link between the two does in fact exist,
and that hydraulic lime grouts and pre-dosed grouts should be analyzed separately. It is probable that the
presence of admixtures makes pre-dosed grouts behave more similarly amongst them than when
compared with hydraulic lime grouts.
Correlation between 𝑔 and the results of the spread test
For the reasons stated regarding the correlation between ℎ and the cone method, a Pearson correlation
can also be used to measure of strength and direction of association that exists between the 𝑔 values
measured with the rheometer and the results of the spread test. All values of 𝑔 and corresponding
spreading measured at the pre-established instants during the 3 hours of testing were taken into account.
The pre-dosed grouts MAPEI and Lime Injection 9000 could not be used in this analysis due to the fact
that they do not possess a yield stress. Analyzing the hydraulic lime grouts and the pre-dosed Rurewall B1
and Ledan TA1 grouts simultaneously, a 𝜌 of -0.46 was calculated with a p-value under 0.05. This means
that, as expected, there is a negative correlation, as spreading tends to decrease as 𝑔 increases, but
there’s only a moderate degree of correlation. Once again, the hydraulic lime grouts and the two usable
pre-dosed grouts were analyzed separately: in the first case, a 𝜌 of -0.87 was calculated with a p-value
under 0.05, which represents a high degree negative correlation and supports the usage of the spread
test to evaluate yield stress in these grouts; in the second case, a 𝜌 of -0.21 was calculated with a p-value
of 0.55. This p-value is much higher than the usual significance value of 0.05, and for this reason no
conclusions can be drawn from this analysis. The high p-value obtained is possibly due to the fact that this
correlation was calculated based on a very limited number of 𝑔 and spreading values, corresponding to
the tests performed on only two grouts.
Figure 6 illustrates how the draining time related to the ℎ value measured in the pre-established instants
during the 3 hour interval, for hydraulic lime grouts. In Figure 7, the same can be observed for the pre-
dosed grouts. In both charts a linear trend line and its respective equation are represented in order to
show the R2 obtained in each case, as a complimentary way of validating the correlation analysis
conducted. Both R2 values, while not too close to 1, are moderately high, and larger than the one obtained
if the results shown in both charts were put in the same chart, in which case the R2 value obtained would
be approximately 0.34. This is coherent with the results of the previous correlation analysis.

9
Figure 6 – Relationship between the values of draining and ℎ during the 3 hours of tests in hydraulic lime grouts.
A similar analysis was made considering 𝑔 values and spread test results. Figure 8 shows how
these values related in hydraulic lime grouts and Figure 9 shows the same for pre-dosed grouts.
R2 obtained through the represented trend lines are compatible with the results of the
correlation analysis. The extremely low value of R2 obtained in Figure 9’s red trend line is highly
conditioned by the two signaled spreading values (30 cm). These values were measured during
the testing of the Rurewall B1 grout, which as mentioned had a very erratic behavior. If these
values were excluded from the sample used to build the trend line, a much higher R2 value would
be obtained (0.83, represented in green), which indicates that the calculated correlation
between 𝑔 and spreading would have been higher if these values had been excluded for its
evaluation.
7. Conclusions
The Bingham model was adequate to evaluate the rheological behavior of the grouts analyzed,
with regression lines of the torque - rotation speed charts having R-squared values consistently
y = 129.79x + 0.6053R² = 0.6816
8
10
12
14
16
0.04 0.06 0.08 0.10 0.12
Co
ne
(s)
h (N∙mm∙min)
y = 70.288x + 6.7201R² = 0.6711
8
10
12
14
16
0.04 0.06 0.08 0.10 0.12
Co
ne
(s)
h (N∙mm∙min)
Figure 7 - Relationship between the values of draining and ℎ during the 3 hours of tests in pre-dosed grouts.
y = -0.4215x + 15.577R² = 0.7654
8
12
16
20
24
28
32
0 5 10 15
Spre
adin
g (c
m)
g (N∙mm)
Figure 8 - Relationship between the results of the spread test and 𝑔 during the 3 hours of tests in hydraulic lime grouts.
Figure 9 - Relationship between the results of the spread test and 𝑔 during the 3 hours of tests in pre-dosed grouts with yield stress.
y = -1.107x + 17.498R² = 0.8335
y = -0.5777x + 19.089R² = 0.0459
8
12
16
20
24
28
32
0 5 10
Spre
adin
g (c
m)
g (N∙mm)

10
bigger than 0.98. The same happened with grouts that have shown behaviors equivalent to those
of Newtonian fluids.
High w/b ratios were needed to obtain the desired results in the cone method, which may have
led to some (minimal) loss of water during the testing of grouts. These ratios had to be bigger
than those recommended, probably due to the ageing of the materials.
The cone method and the spread test were confirmed to be valid ways to evaluate viscosity and
yield stress, respectively.
Some non-linear variations occurred on different tests during the 3 hours of each series, and
ideally more iterations of the tests, namely the spread test and the draining time through the
cone method, should have been made, but this wasn’t possible due to the time-dependent
nature of this work.
The mixing method adopted was adequate, and five minutes of mixing time were needed to
obtain stable, uniform grouts, despite some publications referring that 3 minutes are enough.
Admixtures present in pre-dosed grouts tend to lower their yield stress and in some cases (the
MAPEI and the Ledan TA1) they allow grouts to maintain their initial rheological properties for
periods of (at least) 3 hours. With the exception of the Ledan TA1, admixtures also made it
possible to obtain draining times in pre-dosed grouts within the 10±2 seconds interval using
lower w/b ratios than the ones needed in hydraulic lime grouts.
The mortar mixer used to prevent segregation should be set to the minimum possible rotation
speed, as higher speeds can result in changes in grout behavior.
In terms of stability throughout the 3 hours of testing, the grouts’ properties changed accordingly
to Figure 10.
Figure 10 - Variation of grouts' properties registered between the moment of mixing and 3 hours later.
The green bars represent hydraulic lime grouts, while the blue bars show the evolution of pre-
dosed grouts. The Rurewall B1 grout studied was excluded from this chart because of the
-30 -20 -10 0 10 20 30 40 50 60 70
h
Cone
g
Spread
Density
%
NHL 5 1st test
NHL 5 2nd test
NHL 3.5-Z 1st test
NHL 3.5-Z 2nd test
NHL 3.5 1st test
NHL 3.5 2nd test
MAPEI 1st test
MAPEI 2nd test
LI 9000
Ledan TA1
11
extreme variations it suffered in terms of several of the properties presented, which would
render the chart unreadable. Such changes are probably due to the fact that the grout used in
this evaluation had long passed its expiration date. Therefore, the usage of this particular grout
in any rehabilitation scenario would be highly discouraged.
Other conclusions that can be taken from the analysis of Figure 10:
Apart from the Lime Injection 9000 grout, which has suffered a very large increase in
viscosity (approximately 60%), and should only be used in an injection within about 30
minutes after mixing, none of the other grouts has shown enough evidence to discard their
applicability in an injection intervention within 3 hours after their mixing.
Hydraulic lime grouts have all shown increases in viscosity lower than 15%, which is unlikely
to compromise their injectability. Still, apart from the aforementioned Lime Injection 9000,
the pre-dosed grouts have shown even lower variations of this parameter after 3 hours,
despite some higher variations in between in the case of the Ledan TA1 grout, but it
wouldn’t be enough to discard the usability of this grout in an intervention. The cone
method results support these conclusions.
While the yield stress values in all the hydraulic lime grouts increased in the 8-25% range,
this parameter either kept constant or decreased in pre-dosed grouts during the 3 hours of
testing. This is probably due to the presence of admixtures and their retarded effects.
Nevertheless, both the hydraulic lime grouts and the pre-dosed grouts studied have shown
no signs that they would have had their injectability compromised in the mentioned time
frame. The results of the spread test are compatible with these conclusions. The increase in
the value of this test observed in the NHL 3.5-Z grout produced with a w/b ratio of 0.80 (1st
test) is misleading, as the values measured suffered a very large increase between t=0 and
30 minutes of testing, and after this instant it decreased continuously until the end of the 3
hours of testing, which leads to the conclusion that the spread test performed immediately
after the mixing may have been the result of some heterogeneity within the grout. Hence,
this increase should not be taken into account.
Most of the grouts studied have shown slight increases in density, which are likely to be the
result of the loss of water, which in turn may be due to the fact that high water-binder ratios
had to be used to produce grouts with the desired initial draining times, measured through
the cone test and serving as a guideline to obtain the desired viscosity.
8. References
Almeida, N. G., Pinto, A. P. F., Gomes, A. – Caldas de cal hidráulica para consolidação de alvenarias
antigas. Influência da relação a/l e do tipo de cura. 4º Congresso Português de Argamassas e ETICS.
Coimbra, Portugal. 2012.
Awasthi, A. – Engineering Mathematics. CreateSpace Independent Publishing Platform. 2009.
Banfill, P.F.G. – The rheology of fresh mortar. Magazine of Concrete Research, issue 43, pp 13-21. 1991.
Kalagri, A., Miltiadou-Fezans, A., Vintzileou, E. – Design and evaluation of hydraulic lime grouts for the
strengthening of stone masonry historic structures. Materials and Structures 43, pp. 1135-1146. 2010.
Toumbakari, E.E. – Lime-Pozzolan-Cement Grouts and their Structural Effects on Composite Masonry
Walls. PhD Thesis in Building Materials and Building Technology. KU Leuven, Leuven, Belgium. 2002.