the x-tree an index structure for high dimensional data stefan berchtold, daniel a keim, hans peter...
TRANSCRIPT

The X-TreeAn Index Structure for High Dimensional Data
Stefan Berchtold, Daniel A Keim, Hans Peter KriegelInstitute of Computer Science
Munich, Germany

Outline
Introduction Problems of R-tree based structures X-tree Structure X-tree Algorithms Overall-Minimal Split Performance Evaluation

Introduction Objective - To index point and spatial data in
high-dimensional space• Dimensions - few tens to hundreds• Hyper-rectangles• Fields - CAD, Molecular biology
Improves upon R*-tree Approach
‘Minimal Overlap Split’ Directory structure organization - ‘Supernodes’
Performance is better than R* tree and TV tree by 2 orders of magnitude

Previous work (on High Dimensional Data)
Reduce dimensionality - two basic approaches: Data is highly clustered and correlated
Occupy only some space Algorithms to transform to lower dimension Index using traditional multi-dimensional index
structures Eg: SS Tree
Small number of dimensions contain most of the information Eg: TV Tree
BUT…reduced dimensions may still be too high

Problem with R* tree Why R*-Trees ?
Handles both point and spatial data Spatial data is not transformed to point data
Performance deteriorates rapidly with dimension.
After detailed evaluations, found thatOverlap in directory increases rapidly with growing dimensionality.
Dimension=5, Overlap=90% Overlap Query Performance

Defining Overlap Intuitively - Percentage of volume covered by more than one
directory hyper-rectangle Overlap
R-tree node contains n hyper-rectangles {R1, R2, … Rn}
Overlap directly corresponds to query performance (only if query objects are uniformly distributed)
Query distribution estimated by data distribution• In high dimensional data queries and data are clustered

Defining Overlap (contd) Weighted Overlap
More accurate Percentage of data objects in overlapping space

Defining Overlap (contd)
Multi Overlap - How many Ri’s in the overlapping space ?

Overlap in R* Tree Dimensionality , Overlap
So multiple paths need to be searched for each query

X-Tree - eXtended node tree Goal - Efficient query processing of high
dimensional point and spatial data General Approach
Avoid overlaps when splitting Create supernode - extendible variable size directory
node Solution - Dynamically organize directory to be
hybrid Directory Structure Organizations
• Low dimension (no/low overlap) - Hierarchical• High dimension (high overlap) - LinearCheaper to linear scan than traverse multiple paths

X-Tree Structure
Three types of nodes Directory Supernode Data node
Split history Minimal Overlap Splits

X Tree Storing supernodes
Memory / Replace nodes using priority function
Storage utilization• (Uniformly dist. data)• Normal Directory nodes - 66%• Supernode - 88% (m=5)
Extreme Cases of X tree No supernode -> R-Tree
• Completely hierarchical• Low dimension, non-overlapping data
One large root supernode• Linear directory• High dimension, highly overlapping data

Algorithm

Insert Algorithm
Determines a combination of hierarchical and linear structure
Tries to find a topological (or) overlap-minimal split using R* Tree - heuristics
If no splits are obtained, current directory node is extended to become a super node of twice the standard block-size
If the current super node is full, additional block is added to the super node.

Insert Algorithm

X-Trees in different dimensions

Split Algorithm
Addition of an MBR to a node may result in an overflow and cause a split
Criteria to split a node: Find a split based on topological and
geometrical properties of the MBR If the above step results in a greater overlap,
try to use overlap-minimal split If the above step results in under-filled nodes,
do not perform a split, and return false
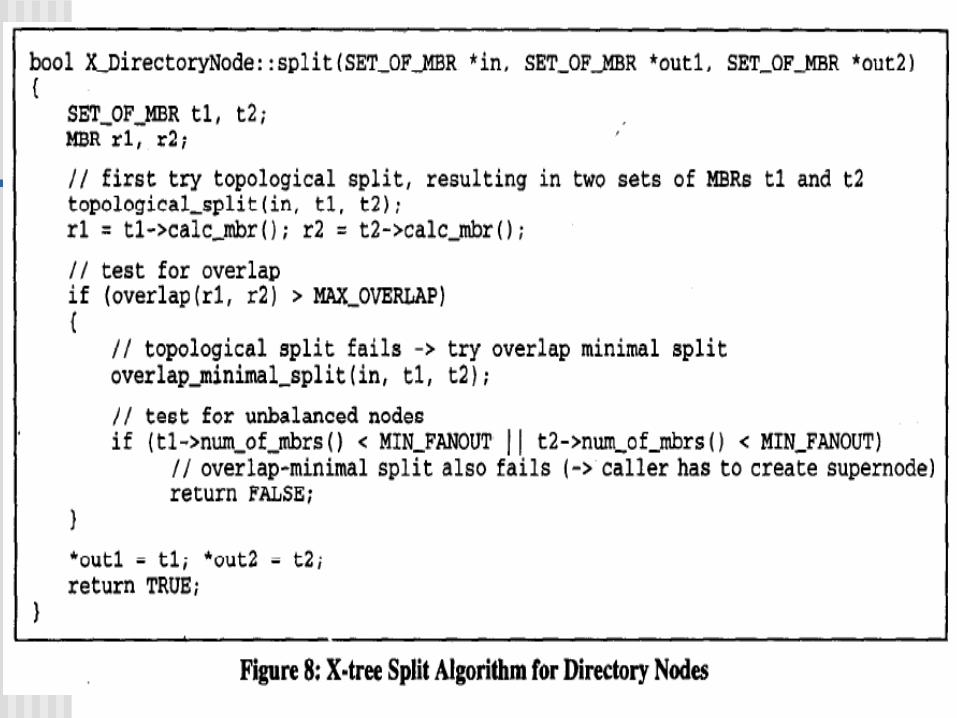

Parameters
MIN_FANOUT – Similar to value used in other index structures (35% - 45% Approx.)
MAX_OVERLAP – System constant Balance between reading a supernode of
twice block size and reading 2 blocks with a probability MaxO and one block with a probability (1-MaxO) (For T
IO = 2ms, T
Tr=4ms, T
CPU=1ms,
MaxO = 20%)

Delete and Update
Update operation is a combination of delete and insert
If there is an underflow in the supernodes due to deletion, they are merged to form a single directory node.
Hence, the structure is dynamic.

Overlap Minimal Split

Determining the Overlap Minimal Split
Partition MBRs (S) in directory node into two subsets (S1, S2) such that the MBRs of both subset overlap minimally
Point-data Overlap free is
possible Balanced cannot be
guaranteed

Lemma 1 For uniformly distributed point data, an
overlap free split is possible iff there is a dimension according to which all MBRs in the node have been previously split

Split History To determine dimension according to which all MBRs in S have been split
• Storage requirement is a few bits
Split produces 2 MBRs from 1 • Represent as a binary tree ‘Split tree’• Leaf node - corresponds to MBR in S• Internal Node - Old non-existent MBRs, labeled with
split axis used Characteristics
• Left subtree MBR has lower coordinates in the split dimension (Disjoint)
• Path - which dimensions has this MBR been split by?• Root node - split dimension common to all MBRs

Lemma 2 For point data, an overlap free split always exists Probability of second overlap free split axis Probability that a split algorithm chooses the right split axis coincidentally is very low. Eg: R* tree
Random choice Criteria different

Performance Evaluation

Performance Evaluation
X-Tree vs TV-Tree / R*-Tree Faster Insertion rates into the X-tree (10.45 times
faster than R*-Tree, about 170 insertions per sec for 150 MB index containing 16-Dimensional point data)
High speed up of search time for point queries increase with increase in dimension (attributed to the fact that due to high overlap in high dimensions R*-tree accesses most of the directory pages)
(* All results were carried out on HP735 workstation with 64MB main memory, 10GB index space on disk)
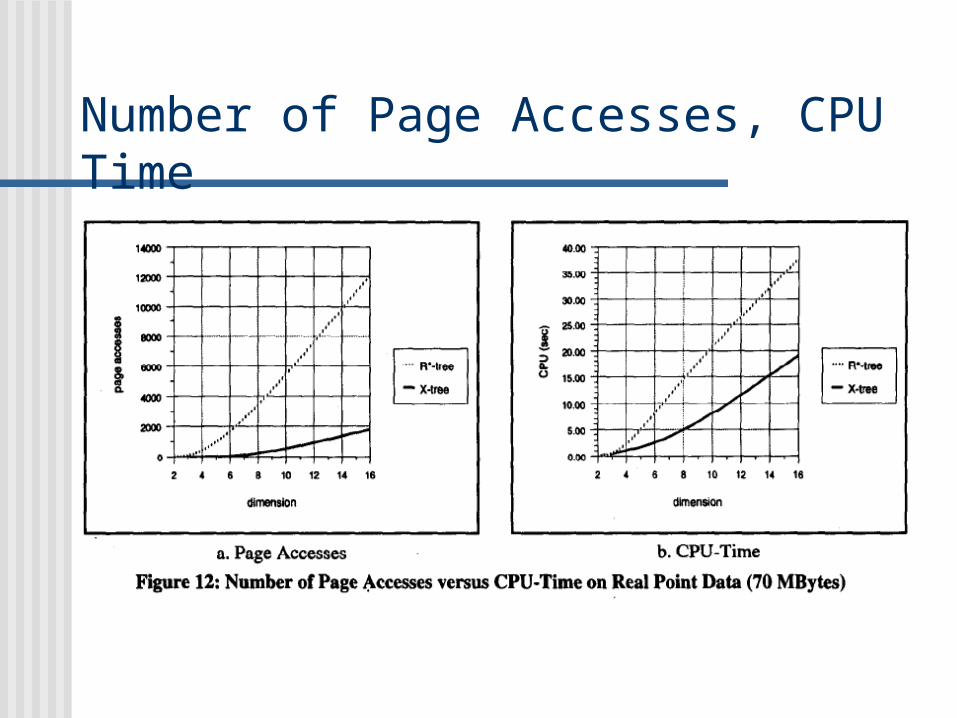
Number of Page Accesses, CPU Time

X-Tree outperforms the TV-Tree and R*-Tree up to orders of magnitude for point and nearest neighbor queries on both synthetic and real data.
Since, the nearest neighbor queries require sorting on the min-max distance, the CPU-time is much higher, but, better than that of an R-Tree.
Since, extended spatial objects, induce some overlap in the X-Tree as well, the speed-up for X-tree over the R*-Tree is lower than for point data (factor of about 8 for D=16)
Number of Page Accesses, CPU Time
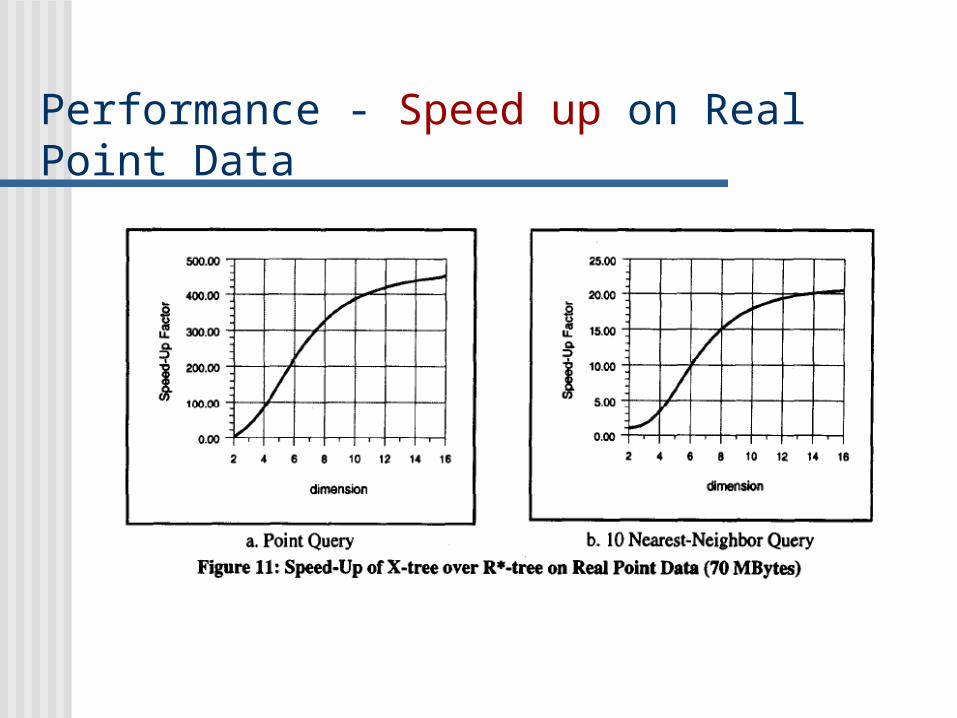
Performance - Speed up on Real Point Data

Performance - Speed up on Real Spatial Data

Conclusions R-Tree based index structures do not behave
well in high dimensional spaces. X-Tree, with the concept of supernodes and
overlap minimal split (Directory nodes extended over block size to avoid degeneration of the index) provides higher speed up for point and nearest neighbor queries.
As the total search time of X-Tree grows logarithmically with the database size, it scales well for very large database sizes.

Questions?