Sylvia A. Allegretto, PhD Institute for Research on Labor & Employment University of California, Berkeley
Presenter
Presentation Notes
Welcome! Post-great recession means more of the same for most workers…a struggle as the rick continue to get richer. There was an opportunity to revitalize the US economy…invest in our long eroding infrastructure, education and our workers. But the motive met opportunity as the rich and politically powerful seized the opportunity to roll back social programs and programs to help workers, poor and the unemployed. To shrink Gov’t and reduce already low taxes on corporations. A continuing shift of burdens onto the backs of workers, old folks, retirees and the sick/disable.
~Bruce Springsteen
Presenter
Presentation Notes
Springsteen’s ‘Wrecking Ball’ album metaphor is a good one. Bruce has offered social & economic commentary via music for 4 decades; I’m offering Economy reality based on data.
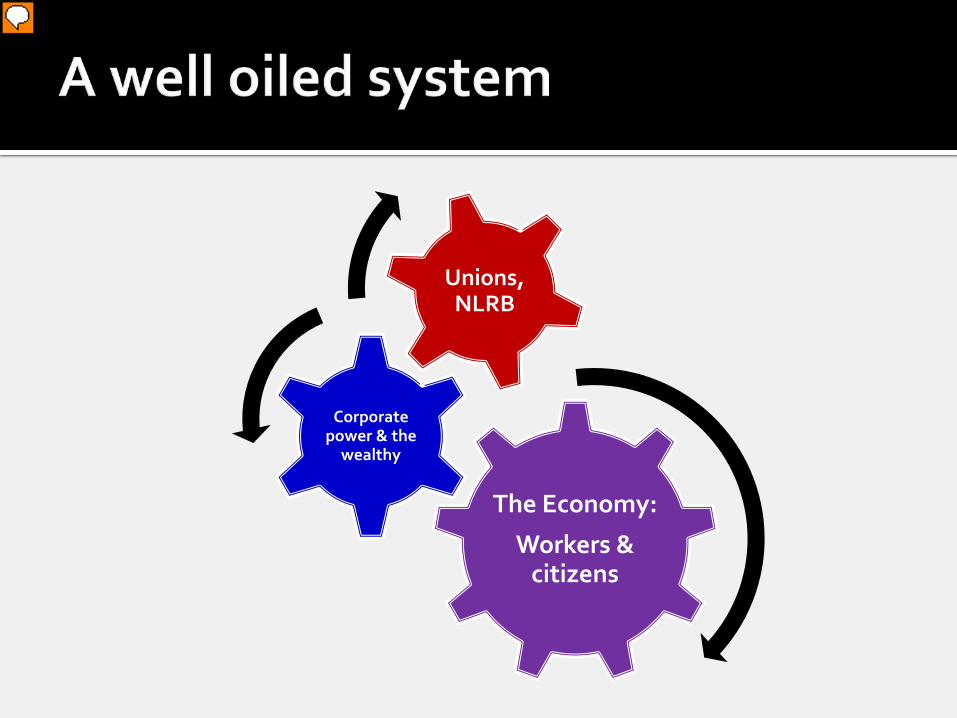
The Economy:
Workers & citizens
Corporate power & the
wealthy
Unions, NLRB
Presenter
Presentation Notes
Unions needed today as much as ever. Level the playing field. Next….What we really have is US corporations of America. Feds dual mandate…prices and FULL EMP!
0%
50%
100%
150%
200%
250%
300%
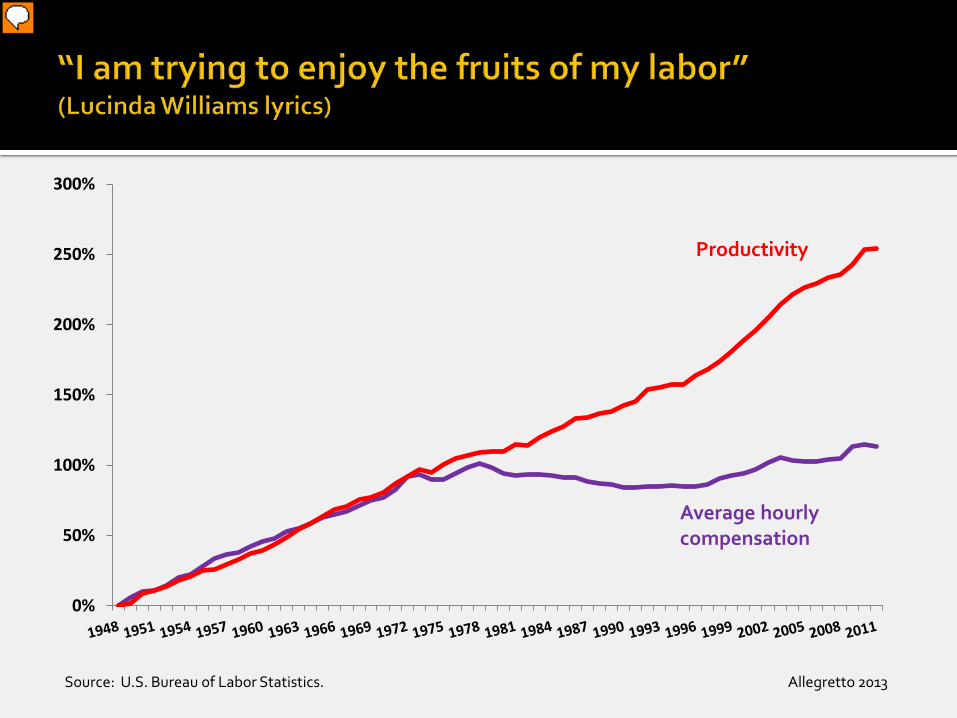
Average hourly compensation
Productivity
Source: U.S. Bureau of Labor Statistics. Allegretto 2013
Presenter
Presentation Notes
UPDATED 2-21-13 Productivity used to insure ‘real’ gains in our standard of living…no longer the case. Deregulation, decline in union density, pro-business gov’t Some of the most productive workers in the world not getting their fair share.
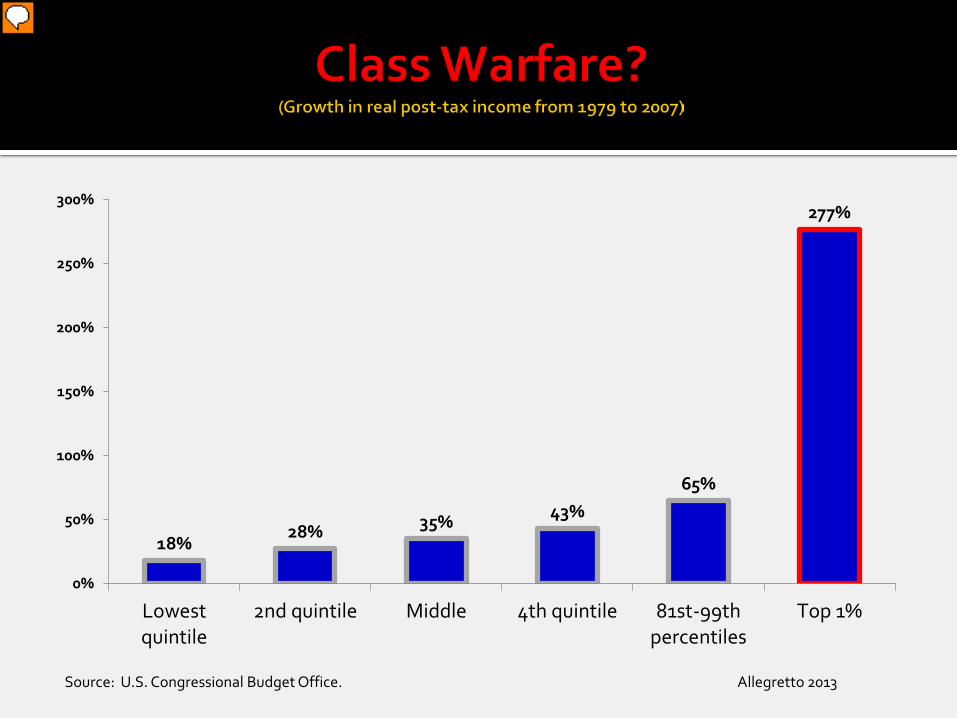
Source: U.S. Congressional Budget Office. Allegretto 2013
Presenter
Presentation Notes
#Occupy Wall Street—they were correct. Class warfare ushered in via supply-side or trickle down economics…completely discredited. Romney/Ryan policies would be *trickle up* economics on steroids. More and more the benefits of economic growth flow to those at the very top.
42%
44%
46%
48%
50%
52%
54%
0%
5%
10%
15%
20%
25%
30%
1973
1975
1977
1979
1981
1983
1985
1987
1989
1991
1993
1995
1997
1999
2001
2003
2005
2007
2009
2011
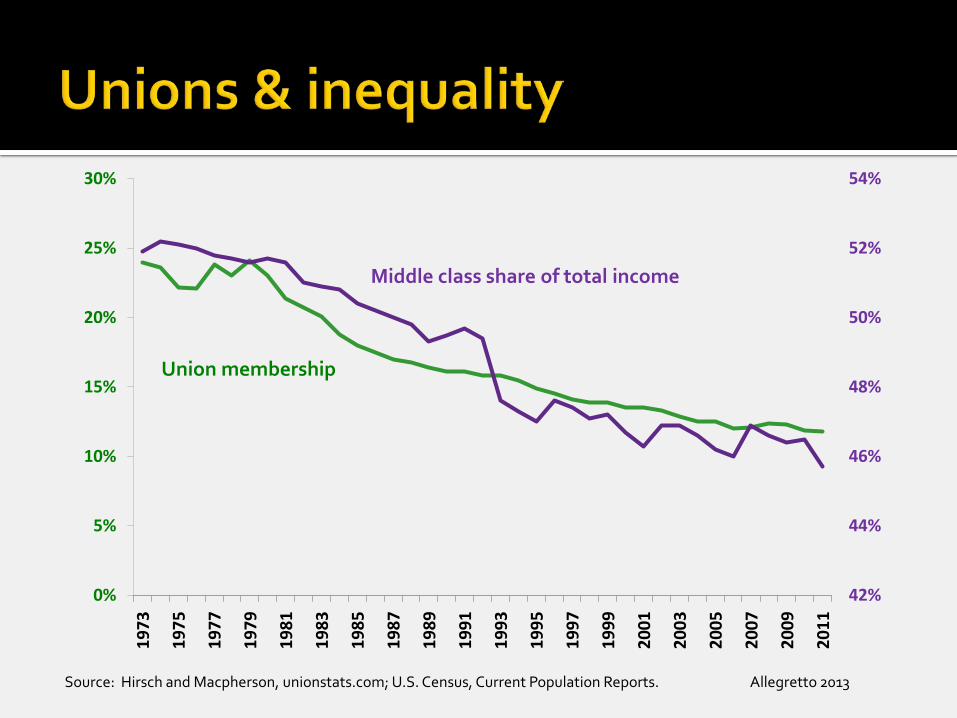
Middle class share of total income
Source: Hirsch and Macpherson, unionstats.com; U.S. Census, Current Population Reports. Allegretto 2013
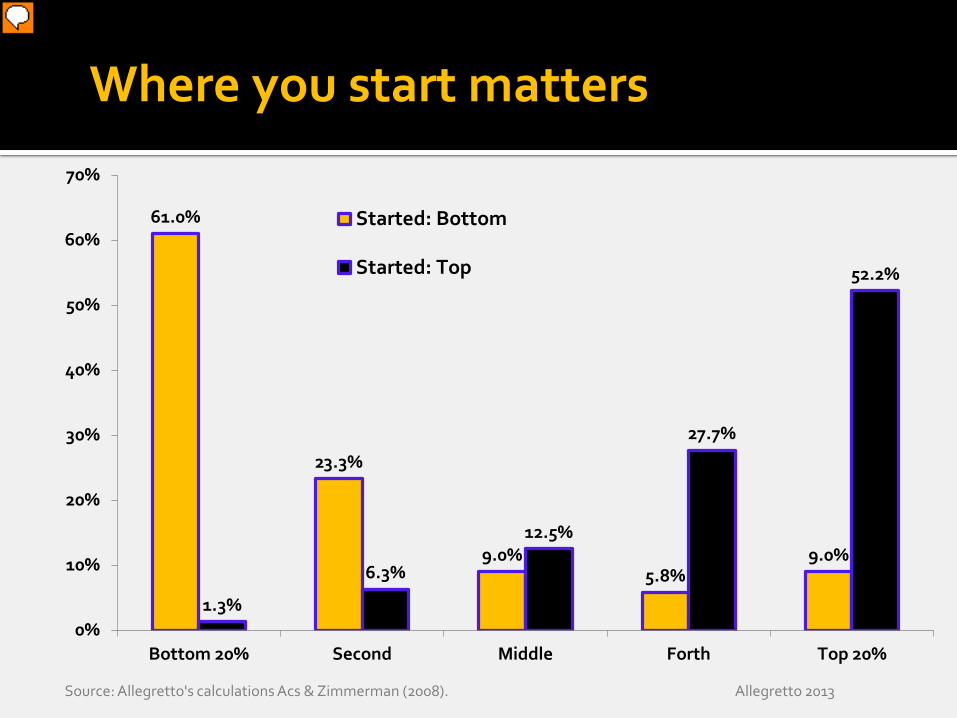
Decreased mobility in US. Same family over 10 years 1994-2004.
Presenter
Presentation Notes
Ladder of those who say such things… Mobility is not that great in the U.S. especially large leaps up the ladder. Over a generation, Children who started in the bottom quintile (1/5) 42% stayed there while Only 6% were able to reach the top quintile.
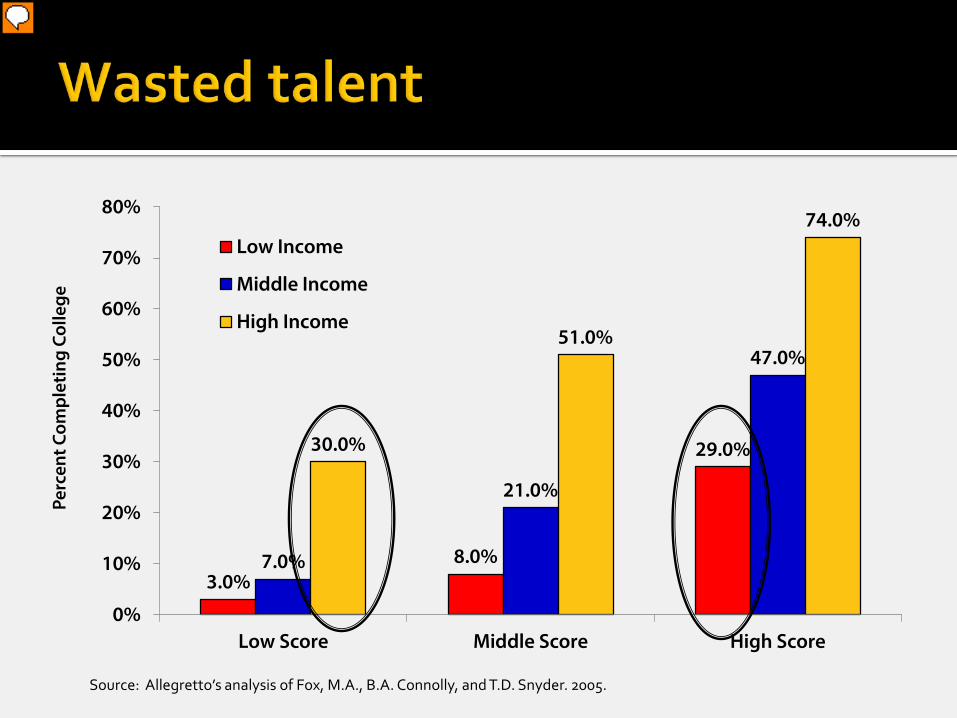
3.0% 8.0%
29.0%
7.0%
21.0%
47.0%
30.0%
51.0%
74.0%
0%
10%
20%
30%
40%
50%
60%
70%
80%
Low Score Middle Score High Score
Perc
ent C
ompl
etin
g Co
llege
Low Income
Middle Income
High Income
Source: Allegretto’s analysis of Fox, M.A., B.A. Connolly, and T.D. Snyder. 2005.
Presenter
Presentation Notes
The fact that college completion is higher for each successive income group among similar scoring students is evidence against a completely meritocratic system. 8th grade math scores. Only 19% of American think that wealth is important to getting ahead (Pew report). NEW REPORT: commissioned by US DOE inequities—in school funding, in early education, in teacher quality, in resources for teachers and students and –leave schools susceptible to economic cycles. --22% of children in poverty 2ce that other developed countries.
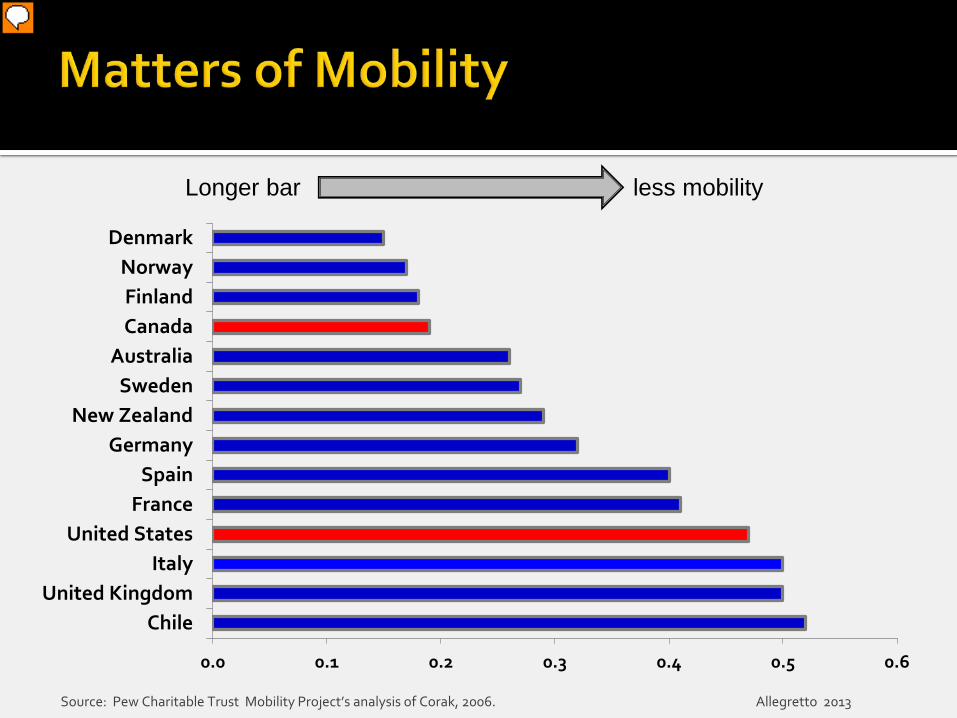
Intergenerational elasticity of earning Fathers & Sons US ladder has more rungs at the top; adding more and more to account for the absurdly rich. Less dangling at the bottom in Europe…better safety nets. Many families and workers thought they had secured firm footing on the middle class rung of our economic ladder. But, they are falling out of the middle class…those at the bottom worse off.
0%
2%
4%
6%
8%
10%
12%
14%
16%
18%
20%
1950
1952
1954
1956
1958
1960
1962
1964
1966
1968
1970
1972
1974
1976
1978
1980
1982
1984
1986
1988
1990
1992
1994
1996
1998
2000
2002
2004
2006
2008
2010
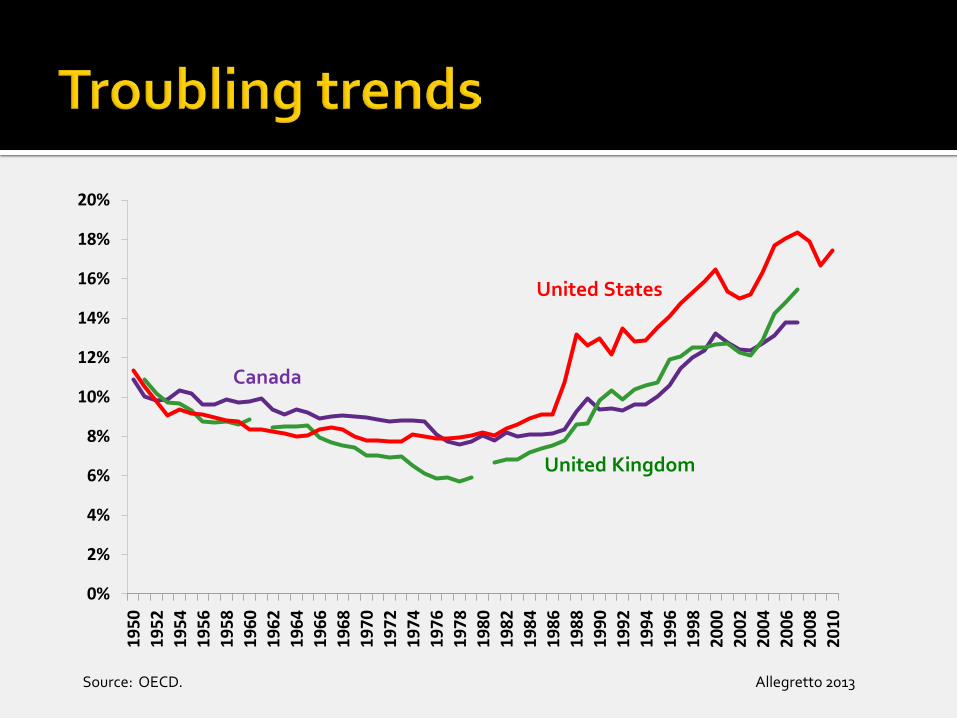
United States
Canada
Source: OECD. Allegretto 2013
United Kingdom
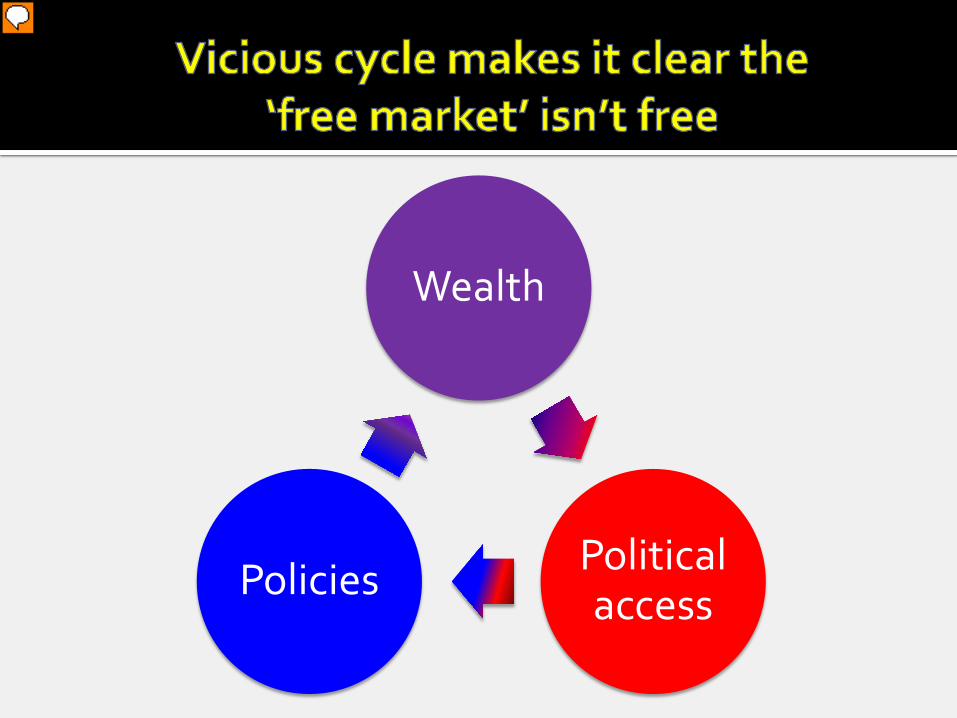
Wealth
Political access Policies
Presenter
Presentation Notes
Vicious self-perpetuating cycle of the rich buying politicians and/or political access via lobbyists, etc. & in turn get their pay back via policies that beget them even more wealth and power. Our system of inequality is stable—accepted and has gone unquestioned for the most part for 4 decades. Those who benefited have convinced the rest that this is fair, just, and the natural order of our free market system. Can’t have health economy or democracy with this degree of inequality. Policies that benefit rich were/are bought… the vicious/destructive cycle is no where near being broken.
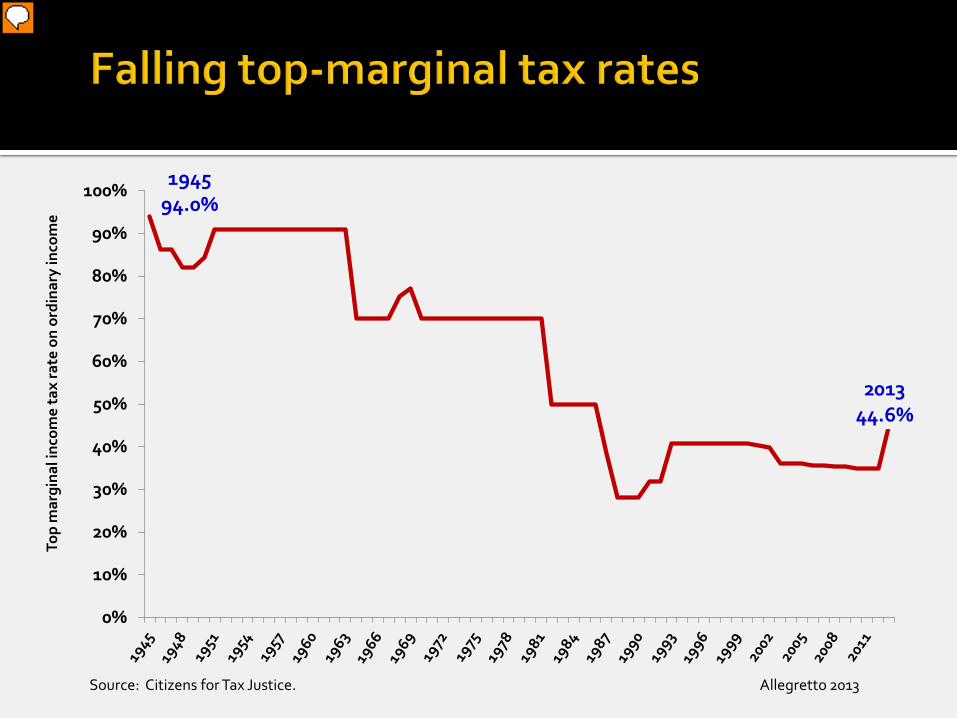
1945 94.0%
2013 44.6%
0%
10%
20%
30%
40%
50%
60%
70%
80%
90%
100%
Top
mar
gina
l inc
ome
tax
rate
on
ordi
nary
inco
me
Source: Citizens for Tax Justice. Allegretto 2013
Presenter
Presentation Notes
UPDATED 2-21-13 This declining trend is not a natural outcome of the free market or some such BS. This is directly from policy…policy by, for and to the benefit of the richest amongst us. We should be debating 50% or 70%! Of course the debate over marginal rates is not really where the big action is for the rich…while many argue about the Bush tax cuts 35% vs 39%...the action is really K-gains.
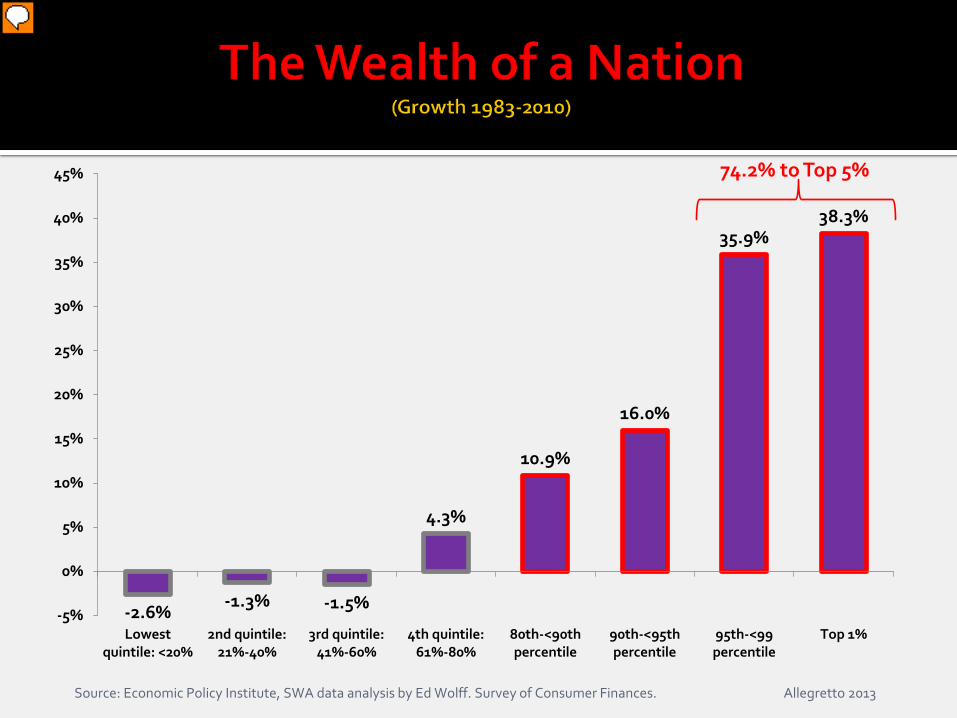
-2.6% -1.3% -1.5%
4.3%
10.9%
16.0%
35.9% 38.3%
-5%
0%
5%
10%
15%
20%
25%
30%
35%
40%
45%
Lowestquintile: <20%
2nd quintile:21%-40%
3rd quintile:41%-60%
4th quintile:61%-80%
80th-<90thpercentile
90th-<95thpercentile
95th-<99percentile
Top 1%
74.2% to Top 5%
Source: Economic Policy Institute, SWA data analysis by Ed Wolff. Survey of Consumer Finances. Allegretto 2013
Presenter
Presentation Notes
This is WEALTH (assets – liabilities). Housing bust really hurt average households. Wealth of the bottom 60% shrunk from 1983-2010! (inflation adjusted). The bars outlined in red represent combined the top 20%. But as illustrated, broken out it is the Top 5% who gained the most. This chart takes the gains in wealth from 1983-2010 and distributes it.
Presenter
Presentation Notes
Harder to hold on less safety nets Downward mobility as average Americans lost housing wealth 8T housing bubble Jobs and wages are going no where…at best stagnant…low end declines Did everything right…played by the rules…many workers though they had a firm footing on the middle class rung.
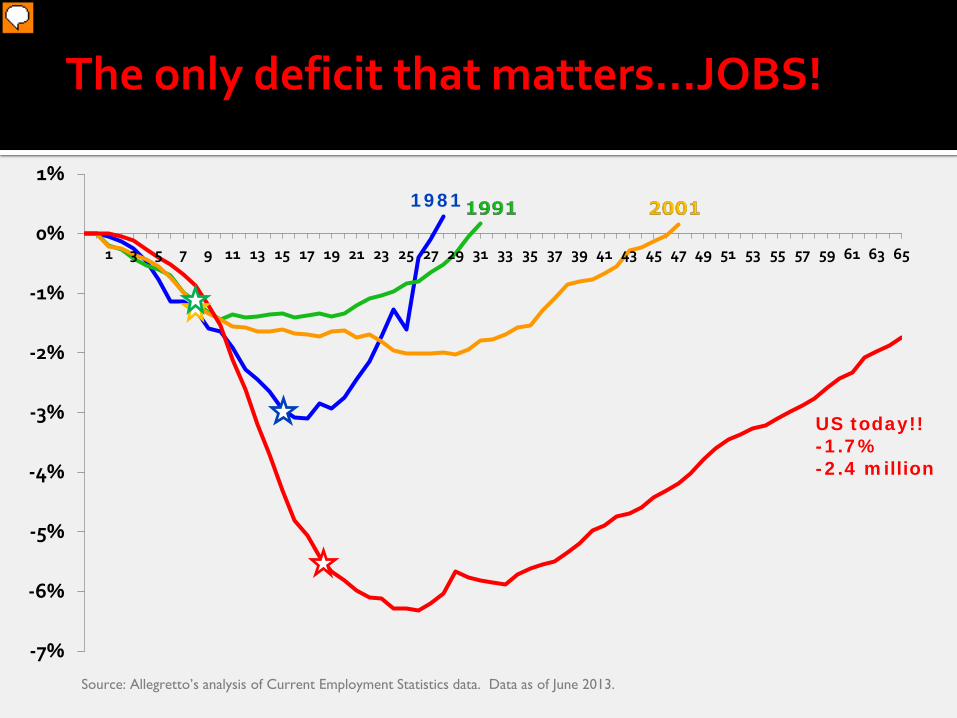
Source: Allegretto’s analysis of Current Employment Statistics data. Data as of June 2013.
US today!! -1.7% -2.4 million
The only deficit that matters…JOBS!
Presenter
Presentation Notes
We are about 9-10 million jobs short of a reasonable unemployment rate (<5%). Today economy still short 2.6 million jobs from December 2007 when the great recession began. But we need about 110,000 jobs per month just too keep up…thus we are 9-10 short in reality. Federal Reserve has DUAL MANDATEs!!! Inflation and FULL employment (which you will NEVER hear about). Deficit hawks hijacked the recovery for main street after Wall Street and Bankers were rescued. 10 MILLIION! to get the needle on unemployment down to an acceptable level. Now into 6th yrs since onset of recession June 2013 will mark 4 years of *recovery*
Presenter
Presentation Notes
Women in Unions and as CEOs and in Gov’t EX. Sheila Bair FDIC, Eliz Warren, Brooksley Born THE WARNING on frontline. Credit default swaps & OTC derivatives market.. …Greenspan, Summers
Sylvia A. Allegretto, PhD ([email protected]) 510-643-7080 Institute for Research on Labor & Employment University of California, Berkeley
Presenter
Presentation Notes
The ‘necessary’ fraying of the folklore…based in reality not dreams. The 30 year trend of growing inequality has been, and continues to be, profound. Degree is detrimental to a functioning and healthy economy as well as to our democracy. The Folklore that must be understood in terms of reality and perceptions…this talk will do just that.