the world part of weather · you read about some of the 1-wire devices and weather sensors,...
TRANSCRIPT

The Worldof Weather
This section of the book is an introduction to the world of weather and weather measurement. We’ll start off by looking at some of thecommon weather measurements, the units of measure, and how the
weather sensors work. You’ll also learn a little history about home and hobbyist weather stations.
Next, we’ll look at several types of weather stations you can build or buy.There are many weather stations on the market. Some are fully assembledand ready to go, while others are purchased as a kit. You’ll also begin tolearn about weather stations that are built from the ground up, the real focusof this book.
Finally, I’ll finish up this section with an introduction to 1-Wire. I’ll startoff by explaining what it is, how it works, how to hook it up, and tips formaking it work reliably. You read about some of the 1-Wire devices andweather sensors, preparing you to start building your station.
Some of this information you may already know, but at the conclusion ofthis section, we’ll both be using the same terms and you’ll understand somemy techno-speak. Don’t worry too much if you don’t understand everythingpresented in these first few chapters. Once you start building your weatherstation in Part II, most of these topics will begin to make sense.
Chapter 1Measuring the Weather
Chapter 2What Kind of WeatherStation Can I Build?
Chapter 31-Wire Exposed
part
in this part
40467c01.qxd:Document2 9/5/06 12:56 AM Page 1
COPYRIG
HTED M
ATERIAL

40467c01.qxd:Document2 9/5/06 12:56 AM Page 2
Measuringthe Weather
I’ve always been fascinated by measuring weather. I still remember back inthe 1960s when I was a kid. I would ride my bike several miles to thedowntown bank. Up on a pole was the coolest thing — a sign that dis-
played the temperature digitally. Keep in mind that computers hadn’t beeninvented yet. Heck, integrated circuits weren’t even invented yet. So howdid they do that? Measure temperature and light up incandescent lights todisplay the value. How high tech!
It wasn’t until about 15 years later that I built my first digital thermometer.It consisted of a simple temperature sensor connected to a digital voltagemeter. It cost me about $100 to build. It sat on my desk when I wasn’tshowing it off to my other nerd friends (the term “geek” wasn’t used yet). Iwould periodically look at it and think to myself, “Wow, the temperaturewent up 0.1 degrees!!”
Well, over the years things have changed considerably. First, digital inte-grated circuits became commonplace. Soon, lots of things became “digital”:clocks, radios, oven timers, and even thermometers. Then computers hit thescene. Soon “digital” was replaced by “intelligent.” Products could nowprocess the data they collected. Microwave ovens know when your food iscooked. Your car knows exactly how much gas to mix with air for the opti-mal fuel combustion. And, yep, weather data can be collected and processedto control heating, air conditioning, irrigation sprinklers, and thousands ofother possibilities.
Climate Is What You Expect,Weather Is What You GetWe’ve all heard the local weather forecasters on TV talking about theweather. They talk about yesterday’s highs and lows, current conditions, andtry to predict the weather for the next few days. They show colorful mapsthat show temperatures for the surrounding area and maybe a national map.If there are storms in the area, they may show a radar map highlightingconditions for the area. But what about the local weather conditions foryour area? What about the weather in your backyard?
� Weather Basics
� A Little Bit ofHistory
� Measuring theWeather
� Weather SensorsYou Can Buy
� Ideas for BuildingYour WeatherStation
chapter
in this chapter
40467c01.qxd:Document2 9/5/06 12:56 AM Page 3

4 Part I — The World of Weather
What is weather? Dictionary.com defines weather as “The state of the atmosphere at a giventime and place, with respect to variables such as temperature, moisture, wind velocity, and baro-metric pressure.” So to really know what the weather is, you’ll need some way to measure theweather conditions.
In recent years, home and hobbyist weather station equipment has become very popular. Iguess it might be part of the information age we live in. Many people want to know about theweather conditions in their immediate area. It could be for commercial reasons. They may havea farm or are raising livestock and need to know exactly what the local conditions are. Others,like me, may be simply fascinated by building and running their own weather station.
A Few Terms DefinedBefore I start discussing measurements, I’m going to define a few terms. First off, I’m going todefine what I mean by the terms analog and digital. I realize that most of the techno-geeks thatare reading this are rolling their eyes. But just for clarification, I’m going to cover it anyway.
Analog refers to a value that is continuously variable. Remember the old-style wall clocks thatyou had to plug in to an outlet? The second hand moved smoothly around the clock face with-out any steps or distinct values. This is an example of analog. Sure, there were markings on theface, but you had to interpret the value. This was a real analog clock. Almost all weather meas-urements are analog. Values change smoothly and continuously. Sure, your digital thermometerconverts it to digital, but as far as the sensor sees it, it is analog.
Digital, on the other hand, refers to a measurement that has discrete, distinct steps. Referringback to the clock analogy, a digital clock displays the minutes in 1-minute increments. It’s10:15 for a whole minute (unless your digital clock has a seconds display), and then it clicksover to 10:16.
Almost all modern weather stations convert their analog measurements to digital. The numberof steps between each digital value is defined as resolution. For example, even though winddirection can be any value between 0.0 and 359.9 degrees, my weather station converts it into 1of 16 possible directions. Its resolution is 360/16 or 22.5 degrees. The temperature sensor’s out-put is in 0.5-degree steps. So its resolution is 0.5 degrees even though the display goes down to0.1-degree steps.
In the next few pages, you will see the term linear. In this context, I’m referring to a sensorwhose output is a one-to-one straight line in response to an input. In contrast, some sensorsexhibit a non-linear or exponential response.
As long as I’m defining terms, there’s one more to cover. Accuracy is, yep you guessed it, howaccurate the measurements or sensor is. Why is this important? Some vendors advertise theirweather station as being accurate to within ½ degree at room temperature. Yet at higher tem-peratures, the accuracy is only 5 degrees. That’s a big error, especially if you live in the desert. Acommon mistake is to assume that because the display is digital, it must be right. Don’t fall intothis trap.
40467c01.qxd:Document2 9/5/06 12:56 AM Page 4
5Chapter 1 — Measuring the Weather
Some of the better weather stations provide calibration adjustments to allow you to adjust theaccuracy. But now you have to have a reference to compare to, so you’ll need to know howaccurate the reference is, and it can get pretty complicated. Some of the calibration techniquesare discussed in Part II.
Temperature MeasurementBy far the most common and important weather measurement is temperature. It affects youreveryday life: What clothes should you wear? Should you turn on the air conditioning or theheater? Do you need to run your sprinklers? Is there going to be ice on the road as you drive towork? Are your plants going to freeze tonight?
Scientific types define temperature as the amount of heat an object or the air contains, withabsolute zero (no heat) defined as the state where all molecular activity stops. Therefore, heatcan be viewed, in a sense, as the amount of molecular activity of an object. Although there areseveral measurement systems, the three most common are Celsius, Fahrenheit, and Kelvin.
In the 1700s, Swedish astronomer Anders Celsius developed a new temperature scale. Hebased it on two points. He defined his first point to be 0 degrees; the temperature at whichpure water froze at sea level. His second point was 100 degrees, and was defined as the temper-ature at which pure water boiled at sea level. The Celsius scale is the standard used todaythroughout most the world, except for the U.S.
Just a few years before, German physicist Gabriel Fahrenheit was working on his own temperaturescale, which was also based on two different points. He defined 0 degrees as the lowest tempera-ture he could generate in his lab using ice and ammonia salts. His other point was 100 degrees andwas based on what he believed to be the average body temperature (which he thought was con-stant). Over the years, the Fahrenheit scale has been revised slightly because the points he choseweren’t constant. The two points now used (not surprisingly) are the freezing point of water at sealevel (32 °F) and the boiling point of water at sea level (212 °F). On this new scale, body tempera-ture is now 98.6 degrees. The Fahrenheit scale is used only in the U.S. and a few of its territories.
The third and less commonly used scale for weather is Kelvin. Kelvin uses the same degree sizeas Celsius, but is adjusted so that 0 degrees is absolute zero. This helps with thermodynamiccalculations by eliminating negative numbers. You can convert degrees Kelvin to Celsius byadding 273.16. Guess what? You’ll be using the Kelvin scale later in this book to calculate dew-point from the temperature and humidity!
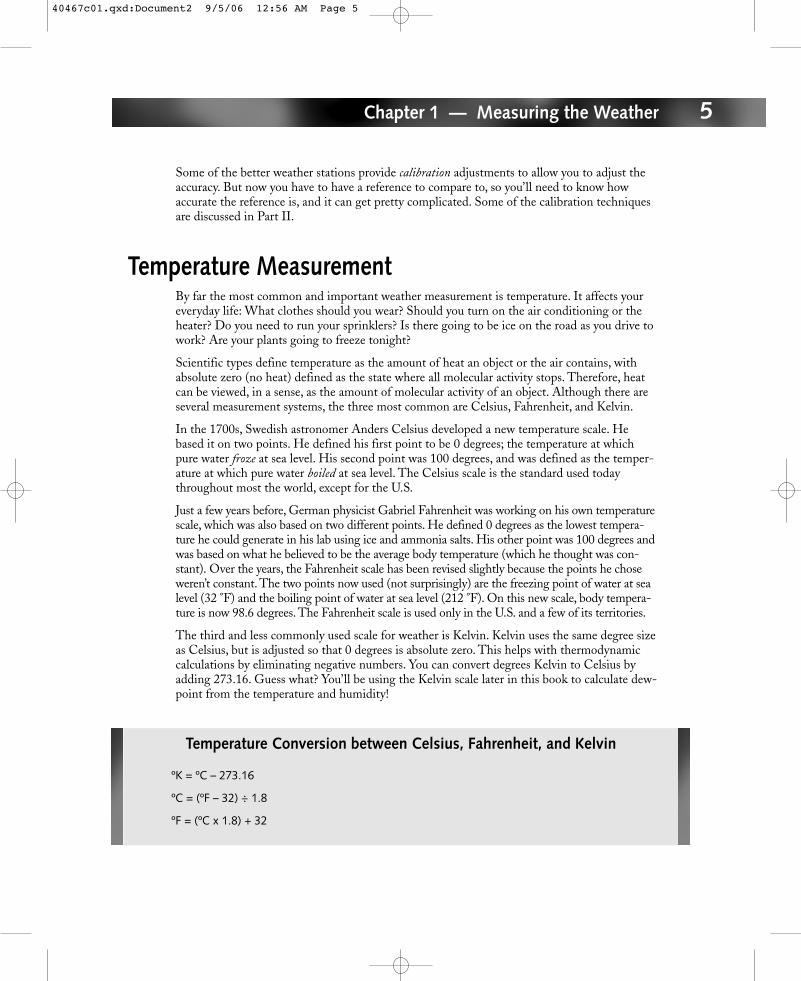
Temperature Conversion between Celsius, Fahrenheit, and Kelvin
ºK = ºC – 273.16
ºC = (ºF – 32) ÷ 1.8
ºF = (ºC x 1.8) + 32
40467c01.qxd:Document2 9/5/06 12:56 AM Page 5

6 Part I — The World of Weather
Table 1-1 compares the Kelvin, Celsius, and Fahrenheit scales.
Table 1-1 Comparison of Temperature Scales
Temperature °K °C °F
Absolute Zero 0 –273.16 –459.7
Liquid Helium 4 269.16 –452.5
Liquid Nitrogen 77 –196.16 –321.1
Freezing Point of Water 273.16 0 32
Room Temperature 294.2 21.1 70.0
Hot Day 313.16 40 104
Boiling Point of Water 373.16 100 212
Mechanical ThermometersChanges in temperature cause many different changes in materials. From high school physics,you learned that heat causes things to expand, whereas cold causes them to contract. Heat alsocauses an increase in molecular activity.
Most early thermometers used thermal expansion as the basis for temperature measurement.The two examples that come to mind are glass-bulb and dial-type thermometers. Figure 1-1shows several examples.
We’ve all seen glass-bulb thermometers. They’re used as fever thermometers, inexpensiveindoor and outdoor thermometers, and pool water thermometers. They consist of a graduatedglass tube with a reservoir of liquid at the bottom, usually mercury or red-dyed alcohol. As theliquid expands, it is forced up through the tube. The temperature is read by comparing theheight of the liquid to graduated markings. Most glass-bulb thermometers are evacuated andsealed at the top to prevent the liquid from being spilled or evaporating.
Dial-type thermometers use a coil of wire or metal connected to a pointer. Some of the coilsare made up of two different metals that have different coefficients of expansion. As the coilheats up, it expands, causing the pointer to rotate around a graduated dial. They are generallymore rugged and have higher temperature ranges than glass-bulb thermometers. Your outdoorbarbeque may have one in the cover for sensing the inside temperature. Most of the mechanicalhome thermostats have a coil thermometer. Instead of a pointer, a small switch is attached tothe coil. When the temperature reaches a certain temperature, it causes the switch to makecontact, turning on your heater or air conditioner.
40467c01.qxd:Document2 9/5/06 12:56 AM Page 6

7Chapter 1 — Measuring the Weather
FIGURE 1-1: Glass-bulb and dial-type thermometers.
Mechanical thermometers are great if you’re standing there looking at them. But what if youneed to log the value? What if you need remote temperature sensing? Ah! What you need is atemperature sensor.
Temperature SensorsTemperature sensors are devices that rely on the electrical changes that occur in the sensormaterial due to changes in temperature, rather than on mechanical changes. This causes a volt-age, resistance, or current change in the output of the device. This can then be measured anddisplayed, or recorded with a computer. The cool part is that the sensor can be located far fromthe display. Temperature sensors can be scattered all over a building, with one central monitor-ing station. This section takes a look at several of the common temperature sensors and howthey work.
ThermocouplesThermocouples are one of the oldest temperature sensors around and are voltage-producingdevices. They work on a principle that Thomas Seebeck discovered back in the 1800s. If twodissimilar metals are connected together and heated, they produce a small voltage. This voltageis proportional to temperature: the hotter the connection, the higher the voltage. Thermocouplesare classified by the metals they are constructed from. A common type, Type J, is constructed ofone wire made from iron and the other wire from a copper/nickel alloy. Table 1-2 lists some ofthe common thermocouple types.
40467c01.qxd:Document2 9/5/06 12:56 AM Page 7
8 Part I — The World of Weather
Thermocouples have a few advantages:
� They are very inexpensive, costing only a few cents to make.
� They are extremely rugged and reliable; they are just two connected wires!
� They have a high and very large temperature range. Because they are metal, they can beused from –100 to over 1000 degrees F!
� Because thermocouples are basically two wires shorted together, they have a very lowimpedance, which allows them to be placed hundreds of feet away from the measuringdevice.
� Variation from one thermocouple to another is small. Re-calibration is usually notrequired when replacing with a same-type thermocouple.
Now for the disadvantages:
� The output voltage is small, usually only tens of millivolts.
� The output voltage is not linear to temperature. Special conversion tables or equationsare used to convert the output voltage to actual temperature.
� A reference junction is required when connecting to the measurement system.
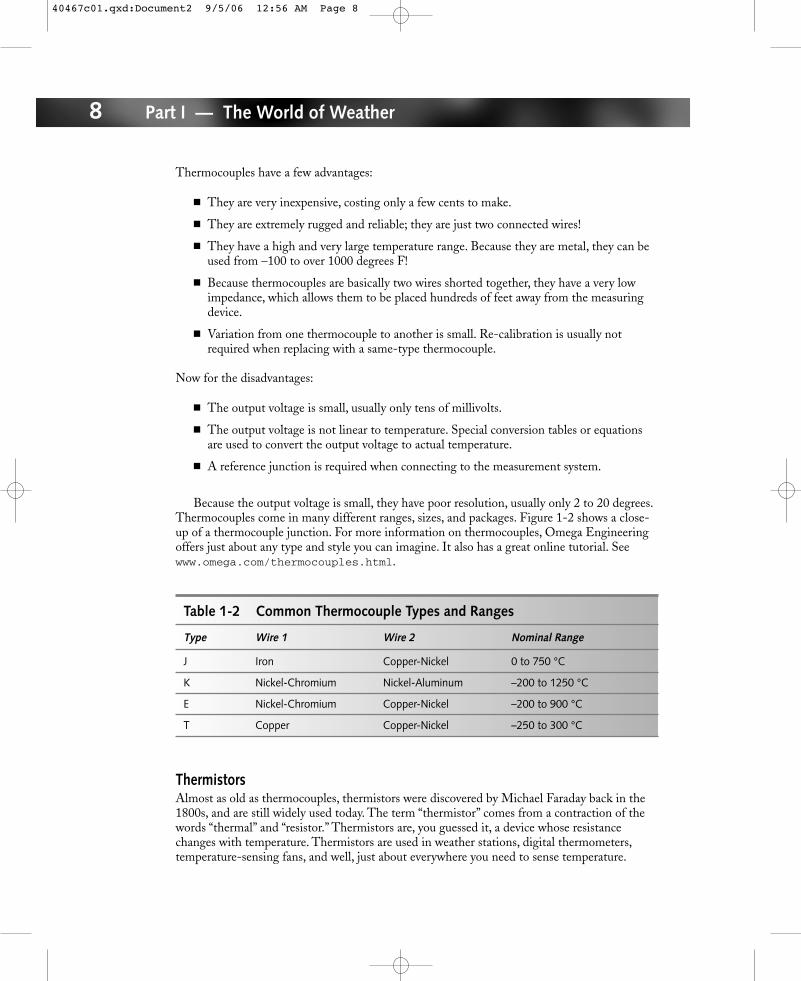
Because the output voltage is small, they have poor resolution, usually only 2 to 20 degrees.Thermocouples come in many different ranges, sizes, and packages. Figure 1-2 shows a close-up of a thermocouple junction. For more information on thermocouples, Omega Engineeringoffers just about any type and style you can imagine. It also has a great online tutorial. Seewww.omega.com/thermocouples.html.
Table 1-2 Common Thermocouple Types and Ranges
Type Wire 1 Wire 2 Nominal Range
J Iron Copper-Nickel 0 to 750 °C
K Nickel-Chromium Nickel-Aluminum –200 to 1250 °C
E Nickel-Chromium Copper-Nickel –200 to 900 °C
T Copper Copper-Nickel –250 to 300 °C
ThermistorsAlmost as old as thermocouples, thermistors were discovered by Michael Faraday back in the1800s, and are still widely used today. The term “thermistor” comes from a contraction of thewords “thermal” and “resistor.” Thermistors are, you guessed it, a device whose resistancechanges with temperature. Thermistors are used in weather stations, digital thermometers,temperature-sensing fans, and well, just about everywhere you need to sense temperature.
40467c01.qxd:Document2 9/5/06 12:56 AM Page 8
9Chapter 1 — Measuring the Weather
FIGURE 1-2: Close-up of a thermocouple junction.
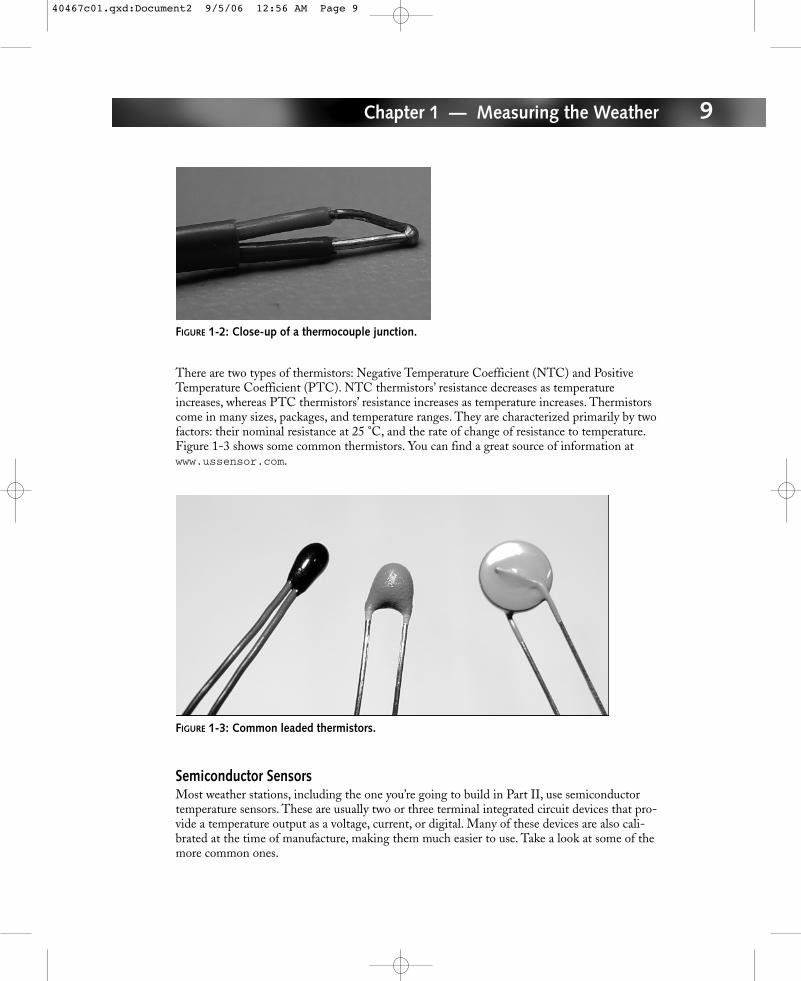
There are two types of thermistors: Negative Temperature Coefficient (NTC) and PositiveTemperature Coefficient (PTC). NTC thermistors’ resistance decreases as temperatureincreases, whereas PTC thermistors’ resistance increases as temperature increases. Thermistorscome in many sizes, packages, and temperature ranges. They are characterized primarily by twofactors: their nominal resistance at 25 °C, and the rate of change of resistance to temperature.Figure 1-3 shows some common thermistors. You can find a great source of information atwww.ussensor.com.
FIGURE 1-3: Common leaded thermistors.
Semiconductor SensorsMost weather stations, including the one you’re going to build in Part II, use semiconductortemperature sensors. These are usually two or three terminal integrated circuit devices that pro-vide a temperature output as a voltage, current, or digital. Many of these devices are also cali-brated at the time of manufacture, making them much easier to use. Take a look at some of themore common ones.
40467c01.qxd:Document2 9/5/06 12:56 AM Page 9

10 Part I — The World of Weather
Junction VoltageAlthough the name sounds high-tech, this is nothing more than a diode (for the real techno-savvy reader, it’s technically called a bandgap reference). If you flow a constant current througha diode (or a transistor configured as a diode), the voltage drop developed across it varies withtemperature. It turns out that this voltage is fairly linear in the temperature range needed for atypical weather station. Measuring this voltage and applying a simple gain and offset can con-vert the voltage directly to temperature. Using diodes as a temperature sensor is somewhat out-dated. There are devices that measure the junction voltage and scale it for you.
Temperature ICsThis type of sensor is the most common used by hobbyists constructing their own weather sta-tions. Semiconductor manufacturers have taken the junction voltage design and added signalconditioning electronics to provide a calibrated linear output proportional to temperature.There are many types on the market today. Some provide a voltage output, a current output,and some provide a digital output. Here are my current favorites from each category.
The LM34/LM35 are three-terminal voltage output devices. The LM34 provides an outputvoltage that is scaled to the Fahrenheit temperature, and the LM35’s output voltage is scaled toCelsius temperature. Both devices run on 5 to 30 volts. They provide linear +10 millivolts perdegree output. A typical circuit is shown in Figure 1-4.
The AD590 is a two-terminal current output device. By simply applying 4 to 30 volts, a cur-rent is developed across the device that is proportional to temperature. It is factory calibrated toprovide 1 microamp per degree Kelvin. Referring back to Table 1-1, at room temperature, thecurrent flow through the AD590 would be 294.2 microamps. Typically, the output is connectedto a resistor to convert the current to a voltage for measurement. Figure 1-5 shows a typical cir-cuit. The main advantage to using a current device is that the device can be located a consider-able distance from the measurement equipment with no loss of accuracy or noise problems.
FIGURE 1-4: LM34 / LM35 temp sensor circuit.
+5 to +20VDC
LM35: Vout = +10mV/°C
LM34/LM35
40467c01.qxd:Document2 9/5/06 12:56 AM Page 10

11Chapter 1 — Measuring the Weather
FIGURE 1-5: AD590 temp sensor circuit.
The DS18B20 is a direct-to-digital temperature sensor. This means that it measures the tem-perature and converts the output directly into a digital value. You’ll need to interface it to somesort of digital circuit to read the values. In this case, the output is the Dallas Semiconductor/Maxim IC’s 1-Wire interface. This device outputs its temperature in 0.5 °C increments from–55 °C to +125 °C (–67 °F to +257 °F). Its rated accuracy is +/– 0.5 °C. Hmmm… sounds like a great weather station sensor to me! If you’ve looked ahead in this book, you might havenoticed that the weather station you’re going to build uses the 1-Wire interface. There’s awhole chapter on 1-Wire coming up, so I’m not going to get into the details yet. But here’s a
– +
– –
+
5V +
AD590
100Ω
950ΩVT=1mV/K
Voltage, Resistance, and Current
Many of the sensors you’ll read about have a voltage, resistance, or current output. Mostweather station applications need a voltage output. To convert current and resistance tovoltage, use Ohm’s Law:
E = I * R
Where
E = Voltage
I = Current
R = Resistance
For example, suppose you have a device that outputs 5.0 milliamps at 50 ºC. If you flowthat current through, say, a 1000-ohm resistor, the voltage across the resistor would be E = 0.005 * 1000 or 5.0 volts.
40467c01.qxd:Document2 9/5/06 12:56 AM Page 11

12 Part I — The World of Weather
hint: you’re going to connect to this device and get the temperature digitally with only onewire. Maybe that’s how they got the name…
Many digital temperature sensors are on the market today. Most have temperature ranges andresolutions that meet our needs for a weather station. The issue is connecting it to the weatherstation computer. Most of the interfaces are limited to just a few feet, hardly enough to get thesensor outside. If you’re shopping for your own sensor, keep this in mind.
Analog-to-Digital Converters Explained
Suppose you have a sensor that outputs its value in a voltage. It could be temperature,maybe light levels, it doesn’t matter. How do you measure that voltage with your com-puter? You’ll need an analog-to-digital converter (called an A-to-D in techno-speak). Thereare many types of A-to-Ds. There are spec’d by the input voltage, conversion time, numberof bits in the output, and the output interface.
■ Input Voltage: The input range of the A-to-D must handle your expected voltagerange. Suppose your temperature device outputs –9 volts at its minimum temperatureand +8 volts at its maximum temperature. You will need an A-to-D that can handlethat range. A-to-Ds come in several different ranges. Common ranges are 0 to +5V, 0to +10V, and –10V to +10V.
■ Conversion Time: This is the time it takes to convert the analog voltage to a digitalvalue. It is usually expressed in microseconds to milliseconds, although some can takeseconds. Unless you have a lot of sensors to convert, this is not a big concern forweather measurement.
■ Number of Bits: This defines the resolution of the A-to-D. The higher the number ofbits, the better the resolution. For example, suppose you’re using an A-to-D that has aninput range of –10 to +10 volts, and your temperature sensor outputs –10 volts at –40degrees, and +10 volts at +180 degrees. That’s 220 degrees total range. If you have an8-bit converter, the resolution is 220/256 or 0.86 degrees. Not bad. However, if youuse a 12-bit converter, the resolution is 220/4096 or 0.05 degrees. That’s pretty good!Keep in mind that in practice, the sensor’s output won’t match your A-to-D’s input asnicely as this example.
■ Output Interface: There are many types of outputs from A-to-Ds. Most can be classi-fied as serial or parallel. Serial A-to-Ds output their data on a single line, bit-by-bit, sim-ilar to the serial port on your computer. There are also a few control lines to signalwhen the A-to-D is ready. Common serial interfaces include I2C, SPI/Microwire, and 1-Wire. Parallel A-to-Ds have a data line for each bit, so a 12-bit A-to-D would have12 lines plus a few control lines. These are generally used when connecting directly to aprocessor or processing electronics, and aren’t too useful for building a weather station.
40467c01.qxd:Document2 9/5/06 12:56 AM Page 12

13Chapter 1 — Measuring the Weather
Humidity and Dewpoint MeasurementHumidity is probably the second most common weather measurement. It affects our comfort,how much water we give our lawns, and how fast water evaporates. It determines how effectiveevaporate coolers will work. In factories that work with electronics, humidity is monitoredclosely, because low humidity levels cause an increase in static discharge (ESD), potentiallydamaging sensitive electronic parts.
Several types of humidity sensors are available on the market: bare sensors, sensor modules, andsensor ICs. Most of the bare sensors require some electronics to convert their output to ausable form. This can be either a circuit board module or a sensor integrated into an IC.Humidity sensors used in weather stations usually contain electronics to convert the sensor’soutput to a DC voltage so that it can be applied to an A-to-D converter.
Humidity measurement devices are also called hygrometers. I’ll use the term sensor when I’mtalking about the device that just converts humidity to an electrical signal, and hygrometerwhen I’m talking about a device that measures and displays humidity.
When weather folks talk about humidity, what they are really talking about is relative humidity.Relative humidity (RH) refers to how much water vapor is in the air and is expressed as % RH.Why is it “relative?” It turns out that the warmer the air, the more water it can hold. And viceversa; as it cools, it can’t hold as much water. Therefore, RH is relative to temperature.
An example of this is fog. Suppose you have an air mass that has high moisture content (80%or more), maybe it just rained, or this is moist air that blew in off of the coast. In the eveninghours, the temperature starts dropping. At some point, as the air cools, it can no longer hold allof the moisture it contains (100%), and so it will condense, forming fog. By the way, the tem-perature point were the water condenses is call the dewpoint, which you learn about in just asecond.
Humidity is measured in percent, with 100% RH representing air that is fully saturated withwater vapor, and 0% humidity representing completely dry air (no water vapor). We experience100% (or close) quite often; in fog, when it’s been raining for a while, and in the shower whenit’s all steamy. About the driest we experience is a little less 10%, and that’s on a dry day in thedesert.
Mechanical HygrometersSwiss physicist Horace Benedict de Saussure invented the first hygrometer in the late 1700s.He discovered that certain organic substances expanded when exposed to moisture, and con-tracted when dried out. Guess what he used in his first hygrometer? Human hair! He attachedone end of a hair to a fixed post, and the other end was attached to a lever arm and pulled gen-tly by a spring. As moisture increased, the hair stretched and moved the arm. Until the 1960s,the most common humidity sensing material was blonde Swedish women’s hair!
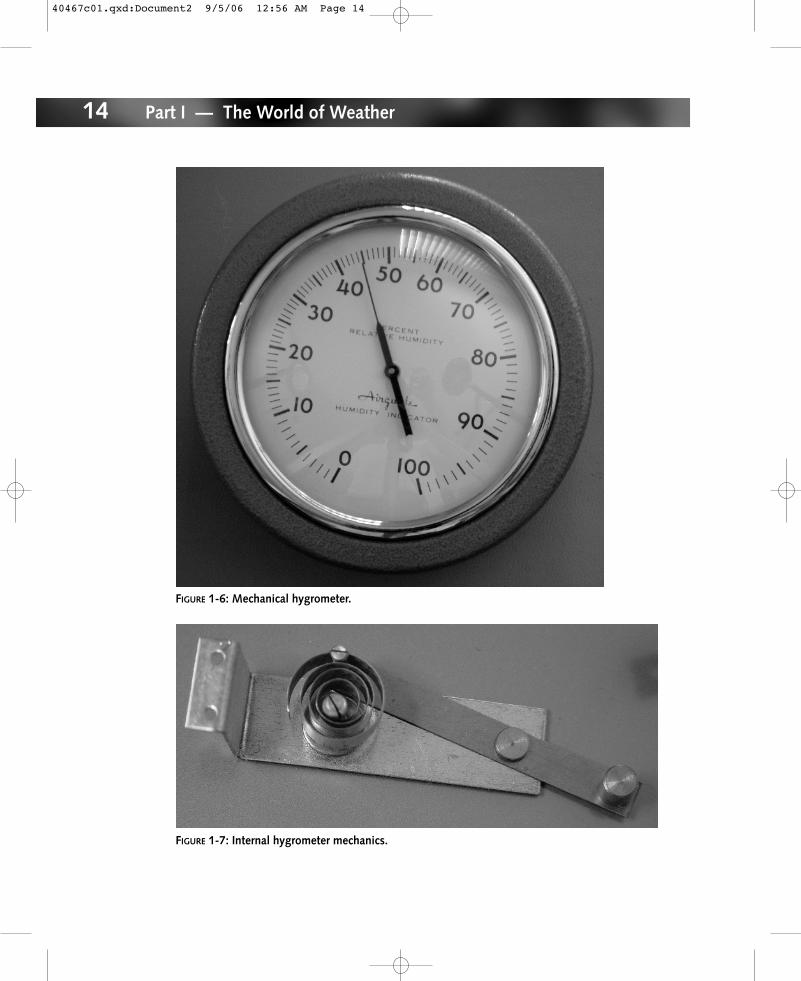
These days, using human hair is cost-prohibitive. Most mechanical hygrometers use a verylight coiled spring that has a coating of a special moisture-absorbing material on one side. Asthe material absorbs moisture it expands, causing the spring to rotate. Figure 1-6 shows a com-mon mechanical hygrometer with a close-up of the mechanism in Figure 1-7.
40467c01.qxd:Document2 9/5/06 12:56 AM Page 13
14 Part I — The World of Weather
FIGURE 1-6: Mechanical hygrometer.
FIGURE 1-7: Internal hygrometer mechanics.
40467c01.qxd:Document2 9/5/06 12:56 AM Page 14

15Chapter 1 — Measuring the Weather
The psychrometer is another instrument to measure the moisture in the air. It uses the princi-ple of evaporative cooling to measure humidity. As most of us know, when water evaporates, itproduces a cooling effect. The amount of cooling is related to how dry the air is. The drier theair, the more cooling takes place.
The psychrometer typically uses two glass-bulb thermometers. One of the thermometers has asmall cotton “sock” over the glass bulb, which is saturated with water (the “wet bulb”) and theother is left uncovered (the “dry bulb”). Air is forced across the two glass bulbs, either by a fanor by twirling the Psychrometer in the air (a “sling” psychrometer). The wet sock causes theevaporative cooling effect on the wet bulb. After a few minutes, the dry bulb and wet bulb tem-peratures are read and a table is used to look up the corresponding humidity level. Not veryhigh-tech, but reasonably accurate. I have a sling psychrometer that I use to check the calibra-tion of my weather station (see Figure 1-8) without having to disconnect it from operation.
FIGURE 1-8: Sling psychrometer. Note the cotton sock over one of the glass bulbs.
Humidity SensorsUp until about 10 years ago, there were just a couple of humidity sensors on the market. Now,like temperature sensors, there are many types of humidity sensors. A quick search on the webreturns hundreds of results. Most change resistance or capacitance with relative humidity.Because they can’t all be covered here, this section looks at some of the more popular ones.
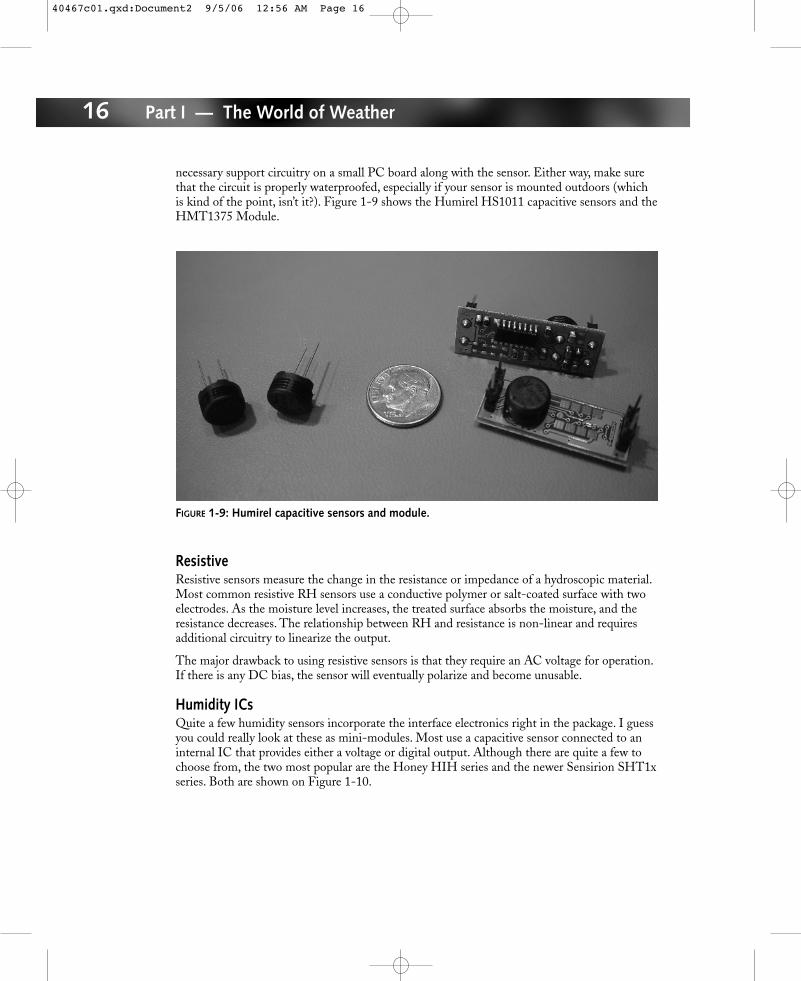
CapacitiveThe most common humidity sensors are capacitive and many use similar technology: A specialdielectric material is sandwiched between two plates, forming a capacitor. The dielectric mate-rial used absorbs moisture and changes capacitance as a function of the moisture it contains.Typical capacitance ranges from about 160 pF at 0% RH to about 200 pF at 100% RH. One of the leading suppliers of capacitive sensors is Humirel. You can view its products online atwww.humirel.com.
Capacitive humidity sensors are inexpensive, and reasonably reliable. The biggest drawback isthat capacitance can’t be measured directly. It has to be converted to a frequency or a voltage.This requires some support circuitry. You can build your own interface electronics, or manyvendors offer support electronics for their sensor. Humirel offers a module that includes the
40467c01.qxd:Document2 9/5/06 12:56 AM Page 15
16 Part I — The World of Weather
necessary support circuitry on a small PC board along with the sensor. Either way, make surethat the circuit is properly waterproofed, especially if your sensor is mounted outdoors (whichis kind of the point, isn’t it?). Figure 1-9 shows the Humirel HS1011 capacitive sensors and theHMT1375 Module.
FIGURE 1-9: Humirel capacitive sensors and module.
ResistiveResistive sensors measure the change in the resistance or impedance of a hydroscopic material.Most common resistive RH sensors use a conductive polymer or salt-coated surface with twoelectrodes. As the moisture level increases, the treated surface absorbs the moisture, and theresistance decreases. The relationship between RH and resistance is non-linear and requiresadditional circuitry to linearize the output.
The major drawback to using resistive sensors is that they require an AC voltage for operation.If there is any DC bias, the sensor will eventually polarize and become unusable.
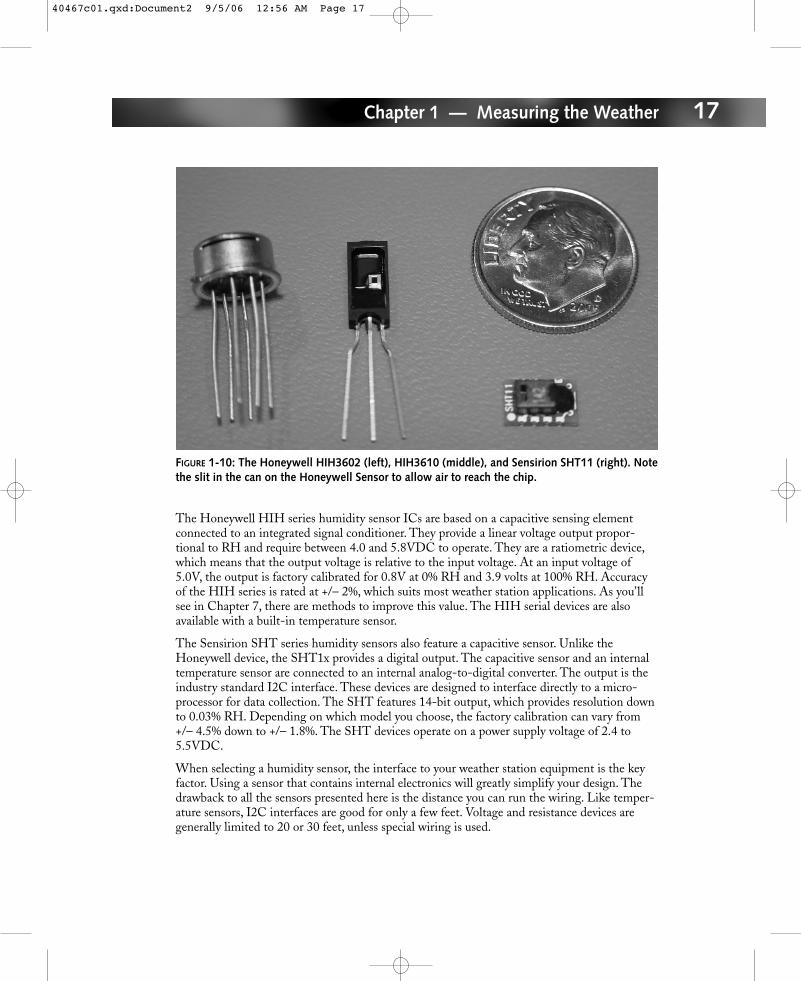
Humidity ICsQuite a few humidity sensors incorporate the interface electronics right in the package. I guessyou could really look at these as mini-modules. Most use a capacitive sensor connected to aninternal IC that provides either a voltage or digital output. Although there are quite a few tochoose from, the two most popular are the Honey HIH series and the newer Sensirion SHT1xseries. Both are shown on Figure 1-10.
40467c01.qxd:Document2 9/5/06 12:56 AM Page 16
17Chapter 1 — Measuring the Weather
FIGURE 1-10: The Honeywell HIH3602 (left), HIH3610 (middle), and Sensirion SHT11 (right). Notethe slit in the can on the Honeywell Sensor to allow air to reach the chip.
The Honeywell HIH series humidity sensor ICs are based on a capacitive sensing elementconnected to an integrated signal conditioner. They provide a linear voltage output propor-tional to RH and require between 4.0 and 5.8VDC to operate. They are a ratiometric device,which means that the output voltage is relative to the input voltage. At an input voltage of5.0V, the output is factory calibrated for 0.8V at 0% RH and 3.9 volts at 100% RH. Accuracyof the HIH series is rated at +/– 2%, which suits most weather station applications. As you’llsee in Chapter 7, there are methods to improve this value. The HIH serial devices are alsoavailable with a built-in temperature sensor.
The Sensirion SHT series humidity sensors also feature a capacitive sensor. Unlike theHoneywell device, the SHT1x provides a digital output. The capacitive sensor and an internaltemperature sensor are connected to an internal analog-to-digital converter. The output is theindustry standard I2C interface. These devices are designed to interface directly to a micro-processor for data collection. The SHT features 14-bit output, which provides resolution downto 0.03% RH. Depending on which model you choose, the factory calibration can vary from+/– 4.5% down to +/– 1.8%. The SHT devices operate on a power supply voltage of 2.4 to5.5VDC.
When selecting a humidity sensor, the interface to your weather station equipment is the keyfactor. Using a sensor that contains internal electronics will greatly simplify your design. Thedrawback to all the sensors presented here is the distance you can run the wiring. Like temper-ature sensors, I2C interfaces are good for only a few feet. Voltage and resistance devices aregenerally limited to 20 or 30 feet, unless special wiring is used.
40467c01.qxd:Document2 9/5/06 12:56 AM Page 17

18 Part I — The World of Weather
DewpointAnother important weather measurement is dewpoint. Like humidity, dewpoint is a measure ofhow much moisture is in the air. So why talk about dewpoint when we have humidity?
Relative humidity measurements have a significant drawback. For a given amount of moisturein the air, relative humidity changes with temperature. For example, suppose that the outsideair measures 40% RH at 60 °F. Is it dry or is it humid? Forty percent doesn’t seem dry. Take thesame air, and warm it up to, say, 105 °F (I live in the desert, remember?). The RH would nowmeasure only 9%. That’s pretty dry air! What happened? As you learned earlier, the warmer airgets, the more moisture it can hold, and so the relative humidity goes down. Dewpoint, on theother hand, is a measure of the absolute moisture in the air, so it doesn’t change with tempera-ture. In this example, the dewpoint was 35 °F in both cases.
Here’s another example. Suppose you live where it snows. Outside it measures 25 °F at about50% humidity. That doesn’t sound too dry, does it? So why is your skin chapped and yourhands dry? Take the same air, move it indoors, and warm it to 75 °F. The humidity would nowbe 6% RH. Wow, that’s dry! It turns out that dewpoint is a much better indicator of moisturein the air than relative humidity. It’s just that most people are used to using humidity and don’treally understand dewpoint. Keep in mind this is a simple example, and although the numbersare correct, the humidity in your house can be affected by other factors. Figure 1-11 gives you afeel for what dewpoint temperatures are considered dry, normal, or humid.
FIGURE 1-11: Dryness perception on the dewpoint scale.
Dewpoint is defined as the temperature at which water will condensate. I’m sure you’ve had aglass of iced tea or other cold drink collect water on the outside of the glass. That’s an exampleof condensation. The glass temperature is below the dewpoint, and water is condensing on your glass.
Direct dewpoint measurement is complicated. One method is called the “Chilled MirrorHygrometer.” Take small mirror and bounce light off of it. Then start chilling the mirror in
10°F
20°F
30°F
40°F
50°F
60°F
70°F
Dry Normal Humid
40467c01.qxd:Document2 9/5/06 12:56 AM Page 18

19Chapter 1 — Measuring the Weather
small steps. As some point when it gets cold enough, the mirror starts to get foggy (condensa-tion forms) and the reflected light level drops. A temperature sensor mounted directly on themirror is then checked to see the dewpoint temperature. Most modern dewpoint measuringdevices actually measure humidity and temperature, and then calculate the dewpoint. That’s the method you’ll use in the weather station project.
Wind Speed and DirectionIf you stop and think about it, wind is pretty amazing. Conditions in the atmosphere cause theair to move. Sometime it’s a gentle breeze, sometimes winds can be fierce. As I’m writing this,the U.S. just went through one of its worst hurricane seasons ever. Hurricane Katrina’s windspeeds reached more than 150 miles per hour. That’s a powerful force.
Wind has two properties we measure: wind speed and the direction it’s blowing from.Depending on your location, speed is measured in miles-per-hour (MPH), kilometers-per-hour (KPH), or nautical-miles-per-hour (knots or k). Wind direction is usually measured indegrees, with true north being the reference point of 0 degrees.
Wind SpeedTo measure wind speed, you need a device that converts moving air to some electrical outputyou can measure. This device is called an anemometer. There are several types of anemometers;the most common is mechanical, but a few are ultrasonic or thermo-differential.
MechanicalTypical mechanical anemometers consist of some type of blade that rotates as the wind blowsagainst it. There are two types: omni-directional and directional.
Omni-directional anemometers are designed so that regardless of the wind direction, theforce of the wind causes a rotational motion of the blades. Typically, these have three hori-zontal cupped blades. Wind blowing against the face of the cup imparts more force thanwind striking the backside of the other two cups, and causes motion. A typical omni-directional anemometer is shown in Figure 1-12.
Directional anemometers usually have blades that are vertical. The challenge is to keep theblades facing the moving air. If the blades are directed such that the air is blowing from theside, there is no force to rotate the blades. The mechanism used to point the anemometertoward the wind is often a large fin. This mechanism is also used to determine wind direction.An example of a directional anemometer is shown in Figure 1-13. Regardless of the type,mechanical anemometers need to convert the rotational speed to some electrical property wecan measure. Most often, this will be a voltage or frequency out.
40467c01.qxd:Document2 9/5/06 12:56 AM Page 19

20 Part I — The World of Weather
FIGURE 1-12: Omni-directional anemometer.
FIGURE 1-13: Directional anemometer.
40467c01.qxd:Document2 9/5/06 12:56 AM Page 20

21Chapter 1 — Measuring the Weather
VoltageVoltage anemometers connect the rotating blades to a small AC or DC generator inside thehousing. This can be as simple as a magnet mounted on the rotating shaft with a fixed coilmounted nearby. The voltage out of the DC generator or frequency out of the AC generator isproportional to how fast the generator is turning. The output can drive a small meter or can beconverted to a digital signal using an A-to-D converter.
FrequencyFrequency anemometers produce a series of pulses that increase in frequency as the rotationalspeed of the blades increases. This is commonly done in two ways: magnetically and optically.The magnetic method attaches a magnet to the rotating blades (usually on a separate rotor inthe housing) such that it passes over one or more magnetic reed switches every revolution.Figure 1-14 shows an internal view of a magnet and reed switch anemometer.
The optical method uses a light-emitting diode (LED) and photodiode positioned so the LEDis shining on the photodiode. As the rotating blade or disk passes in between the two, it blocksthe beam, turning off the photodiode, as shown in Figure 1-15. In either method, the numberof pulses are counted in a time period. The greater the number of pulses, the faster the wind isblowing.
FIGURE 1-14: Close-up of a magnet and reed switch.
40467c01.qxd:Document2 9/5/06 12:56 AM Page 21

22 Part I — The World of Weather
FIGURE 1-15: Optical anemometer. The photodiodes are on the circuit board in the foreground.Note the optical disk.
Wind speed measurements with mechanical anemometers are usually collected or averagedover several minutes. If you’ve been looking ahead, you may have discovered that the weatherstation you’re going to build uses the magnet and reed switch method.
40467c01.qxd:Document2 9/5/06 12:56 AM Page 22

23Chapter 1 — Measuring the Weather
UltrasonicUltrasonic anemometers work on the Doppler principle. Most of us have experienced theDoppler effect as a train blowing its horn has passed us. The horn takes a noticeable shift inpitch just as it goes by. Sound waves change pitch depending on whether the object produc-ing or reflecting them is moving. As the object approaches, the sound waves are compressed,raising the pitch. As the object moves away, sound waves are stretched, and the sound lowersin pitch.
Ultrasonic anemometers use this principle to measure wind speed. A small speaker is mountedin a tube and emits a high-frequency (ultrasonic) tone down the tube. A small microphonemounted at the other end of the tube listens to the speaker. If there is no wind, the sound pickedup by the microphone is the same frequency as sent. If there is some wind blowing down thetube toward the speaker, the sound waves are compressed as the microphone picks them up. Thesound increases in pitch proportional to the wind speed. Conversely, if the wind is blowing awayfrom the speaker toward the microphone, the sound is “stretched out” and is lower in pitch. Bymeasuring the difference in pitch between the speaker and the microphone, the wind speed canbe determined.
Ultrasonic anemometers can also be omni- or uni-directional. Just like its mechanical counter-part, the unidirectional version requires some sort of mechanical positioner to keep the ultra-sonic elements pointed toward the wind. Omni-directional units use an interesting method.They have two sensors positioned at 90 degrees from each other. Taking the ratio of the meas-ured wind speed from each sensor and applying a trigonometric calculation yields both thewind speed and direction.
The primary advantage to ultrasonic anemometers is that they can measure wind speed almostinstantaneously. The drawbacks are that they tend to be expensive, and don’t hold up well whenexposed to outdoor weather for extended periods. They also require power to operate, whichisn’t always available at the weather station site.
Thermo-differentialAs wind moves past an object, it “blows” some of the heat away. The faster the wind, the morecooling takes place. This principle can be used to measure wind speed. A few pages back, youread about thermistor temperature sensors. If you flow enough current through a thermistor, itwill start to get warm, or “self-heat.” Because a thermistor is a temperature-sensing device, youcan also measure how hot it is. If you let it heat up and stabilize, then blow some wind across it,it will cool. The drop in temperature is directly proportional to wind speed.
Several different materials are used as heat-sensing elements. For example, some cars use plat-inum resistance wire in this fashion to measure the amount of air flowing through the intakemanifold. Most thermo-differential sensors also use a second temperature sensor as a referenceto determine the ambient temperature. That’s where the term “differential” comes from.Thermo-differential sensors are generally very robust. However, they require considerablepower to operate.
40467c01.qxd:Document2 9/5/06 12:56 AM Page 23

24 Part I — The World of Weather
Wind DirectionWind direction is measured by a wind vane. Wind vanes date back to the 1400s when LeonBattista Alberti, an Italian architect, invented the first mechanical anemometer and wind vane.Robert Hooke later improved the design and is often incorrectly credited as the real inventor.Early wind vanes were nothing more a large flat surface or “fin” attached to a pointer. Theassembly was mounted on a pole and allowed to swivel. The fin seeks the position with theleast wind resistance, which causes the pointer to face into the wind.
Modern-day wind vanes haven’t changed much. Most still use a fin-and-pointer assembly asshown in Figure 1-16. The rotor is now attached to some sort of a sensor that converts theposition to electrical signals. The signal is decoded to determine direction. Most weather vanesconvert the rotational position to 1 of 16 possible compass points. Table 1-3 lists the 16 com-pass points and the corresponding degrees.
FIGURE 1-16: Weather station wind vane.
40467c01.qxd:Document2 9/5/06 12:56 AM Page 24

25Chapter 1 — Measuring the Weather
Table 1-3 Wind Direction Compass Points and Degrees
Compass Direction Degrees Compass Direction Degrees
North 0 South 180
North-North-East 22.5 South-South-West 202.5
North-East 45 South-West 225
East-North-East 67.5 West-South-West 247.5
East 90 West 270
East-South-East 112.5 West-North-West 292.5
South-East 135 North-West 315
South-South-East 157.5 North-North-West 337.5
Three common types of wind vane position-sensing are used: resistive, magnetic, and optical.Each type converts the position of the wind vane to an electrical signal that is sensed by theweather station computer.
ResistiveThis type of weather vane has the rotating shaft connected to a variable resistor (or potentio -meter as it’s called in the electronics world.) The variable resistor is connected to power, andproduces a variable voltage depending on the resistance. This voltage can be connected to ameter for direct display, or to an A-to-D converter. Resistive wind vanes work well for weatherstations. Because they contain only a single passive component, they require no power. A single2- or 3-wire cable is all that is necessary to connect to a remote computer.
MagneticMagnetic wind vanes work similarly to the magnet and reed switch anemometers. Instead ofthe rotating magnet causing a single reed switch to turn on and off, multiple reed switches areplaced in a circular pattern. Depending on the rotational position of the wind vane, the corre-sponding reed switch would be closed. The number of reed switches in the circular patterndetermines the resolution of the wind direction. Typical home/hobbyist weather stations haveresolution to 16 compass points or 22.5 degrees. Figure 1-17 shows a close-up view of the 1-Wire weather station circuit board. You can see eight reed switches. The unit is designed sothat if the magnet falls between two switches, both are activated. This provides 1 of 16 possibledirections.
40467c01.qxd:Document2 9/5/06 12:56 AM Page 25

26 Part I — The World of Weather
FIGURE 1-17: 1-Wire weather station circuit board. Note the eight reed switches in the center.
OpticalOptical wind vanes use the same principle as the optical anemometers. Instead of the rotatingdisk blocking and unblocking light to a single photodiode, four LEDs and photodiodes areused. A pattern is machined or painted on the disk so that the photodiodes produce a uniqueoutput for each of the 16 compass points.
40467c01.qxd:Document2 9/5/06 12:56 AM Page 26

27Chapter 1 — Measuring the Weather
Barometric PressureBack in the 1640s, the Italian physicist Evangelista Torricelli was experimenting with vacuums.He filled a long tube sealed at one end with mercury and inverted it, forming a vacuum in thesealed end. He noticed that from day to day, the level of the mercury in the tube changed. Hetheorized that the changes must be caused by variations in the atmosphere, inventing the firstbarometer.
What is barometric pressure you ask? It is the pressure of the weight of the air above us. It iscaused by the earth’s gravitational pull on the atmosphere. Without this gravitational pull, ouratmosphere would just float off into space. Weather causes minor variations in the pressure,which can be measured with a barometer.
Although we’re used to measuring pressure in pounds per square inch (PSI), barometric pres-sure is usually measured in Inches of Mercury (inHg) or millibars (mb). Table 1-4 shows therelationship between PSI, inHg and millibars.
When you think of measuring pressure, you most likely think of a tire gauge or maybe a pres-sure gauge on a tank. These types of gauges measure the pressure relative to the surroundingatmosphere. Because the surrounding air is what we want to measure, relative gauges won’twork. What we need is an absolute gauge.
Table 1-4 Relationship between PSI, inHg and mb
Condition PSI inHg mb
1 PSI 1.000 2.036 68.94
1 inHg 0.04912 1.000 33.86
1 mb 14.51 29.54 1000
Normal Pressure 14.69 29.92 1013
Very High Pressure 15.71 32.00 1084
Very Low Pressure 13.75 28.00 948.2
Mechanical BarometersMechanical barometers measure the absolute atmospheric pressure by comparing it to a vac-uum. A small metal can that is designed to expand and contract is evacuated. This is called thebellows. One side of the bellows is held fixed in place. The other side is connected to a leverarm to amplify the small movement of the bellows. The lever arm is then attached to a pointeron a dial. As the outside pressure decreases, the bellows expands, causing the pointer to rotate.Figure 1-18 shows a close-up of a barometer mechanism. The round can is the bellows. It is
40467c01.qxd:Document2 9/5/06 12:56 AM Page 27

28 Part I — The World of Weather
connected to the lever arm, which pushes on the platform in the foreground. The small hori-zontal wire is actually a small chain that is wrapped around the needle shaft and converts thelinear motion to rotational motion.
FIGURE 1-18: Mechanical barometer innards.
Barometric Pressure SensorsBarometric pressure sensors work on a similar principle as mechanical gauges. Instead of a bel-lows, a small diaphragm is mounted over an evacuated chamber. The diaphragm is manufac-tured of a special piezo-resistive material that changes resistance in relation to stress. Variationsin pressure cause variations in stress on the diaphragm, thereby causing a change in resistance.
There are two primary categories of pressure sensors: bare sensors and sensors that contain inte-gral signal processing electronics. Bare sensors are usually a resistive bridge. DC voltage is appliedto two input legs of the bridge, and a DC output is measured across the two output legs.
40467c01.qxd:Document2 9/5/06 12:56 AM Page 28

29Chapter 1 — Measuring the Weather
For weather station applications, having built-in electronics is critical. Because we are measur-ing extremely small changes in pressure, accuracy is critical in our design. Most pressure sen-sors are also sensitive to variations in temperature. To minimize this effect, devices withinternal electronics contain temperature compensation circuitry, which minimizes the effects.The two most popular pressure sensors used by hobbyists are the Motorola MPC4115A andthe Honeywell/SenSym SCX15AN. Both measure 0 to 15 PSI absolute pressure and areshown in Figure 1-19.
FIGURE 1-19: Motorola MPX4115A pressure sensors.
Station PressureWhile I’m discussing barometric pressure, there’s one more topic to cover: station pressure ver-sus absolute pressure. Say you’re on the beach with your handy barometer and the pressure isnormal at 29.92 inHg (or 1013 mb). You start driving inland a few miles and up in the hills.You look at your trusty barometer, and it reads 27.82 inHg (or 941.9 mb). What happened?Did the weather change?
Earlier, I stated that atmospheric pressure is caused by the weight of the air (at least that’s how I think of it). So it makes sense that as you rise in altitude, there’s less weight from the airabove you, and the pressure decreases, until you leave the atmosphere where there is no pressureat all. In this example, you drove up to 2000 feet and the pressure was lower. This is the absolutepressure. Table 1-5 shows the effects of altitude on barometric pressure. So how do you comparebarometric pressures at different locations? Weather meteorologists have devised a way. They’vedefined station pressure to be an altitude-compensated pressure measurement. When you cali-brate your barometer, you will adjust it so that normal pressure reads 29.92 inHg regardless ofyour altitude. That way, regardless of where you are, pressure readings are all the same and canbe compared.
40467c01.qxd:Document2 9/5/06 12:56 AM Page 29

30 Part I — The World of Weather
Table 1-5 Absolute Barometric Pressure at Various Altitudes
Altitude (feet) inHg Mb
0 29.92 1013
1000 28.86 977.4
2000 27.83 942.3
3000 26.82 908.3
4000 25.85 875.2
5000 24.90 842.2
10000 20.58 696.8
RainfallAs wind blows across lakes and oceans, it collects moisture. As the moisture rises in the atmos-phere, it tends to cool. As you learned earlier in this chapter, the cooler the air, the less mois-ture it can hold. At some point, the air becomes so cold that the moisture condensates in theatmosphere, forming rain clouds. In a process that scientists aren’t exactly sure about, the con-densation begins to collect. As enough moisture collects in a drop, it becomes heavy, and even-tually falls to earth as rain. Rain has to be at least 0.5 millimeters in size, otherwise it isconsidered drizzle.
Rumor has it that back in 1441, King Munjong of the Choson Dynasty invented the first“standardized” rain gauge. Because the amount of rain that fell in each village determined thepotential for each farmer’s harvest, he devised a standard rain fall collector and scale. Theamount of rainfall recorded with his rain gauge was used to determine how much tax to chargethe farmer.
Measuring rain is easy. Stick a bucket in your backyard, drop in a ruler, and then wait for it torain. Getting the rain data into your computer is another matter. There are several ways to dothis, but the most common are the tipping bucket and the drop counter.
Tipping BucketAbout 200 years after King Munjong designed his taxation device, Christopher Wren inventedthe tipping bucket rain gauge. A small calibrated “bucket” was positioned under a collectionfunnel. As it rained, the funnel collected the water and directed it into the bucket. When thebucket reached a certain level, it would become unbalanced and tip over, spilling the contents.As it tipped, it punched a hole in a paper tape, thereby recording the rainfall. After the con-tents emptied, the bucket would fall back into place, starting the collection over again.
40467c01.qxd:Document2 9/5/06 12:56 AM Page 30

31Chapter 1 — Measuring the Weather
Over the years, the design hasn’t changed much. Most modern designs use two “buckets” tocollect water, so while one of the buckets is emptying, the other is filling. Weather station“buckets” generally hold about one tablespoon of water, so they’re not really buckets, but that’swhat they’re called. A small magnet is attached to the tipping mechanism. As the bucket tips,the magnet sweeps past a sensing device. This device then triggers a circuit that counts the tips.By counting the tips, you can now determine total rainfall (since you last reset the count) andby tracking the number of counts in a time period, you can determine the rain rate. Figure 1-20shows a close-up of a tipping bucket rainfall counter.
FIGURE 1-20: Tipping bucket rainfall counter. Can you see the reed switch in the center?
The Standard Rain Gauge
The official rain gauge was invented more than 100 years ago. It has been used by officialforecasters and weather agencies worldwide. It consists of a glass cylinder with a funnelmounted on top directing the collected water into a smaller glass tube mounted inside theglass under the funnel. The cylinder is 50 cm tall, and the funnel is 20 cm across. The tubeunder the funnel has a cross-sectional area exactly 1⁄10 the cross-sectional area of the funnel(6.32 cm) to provide a factor of 10 increase measurement accuracy.
Rain enters the funnel and drips into the lower tube. A scale mounted next to the tube iscompared to the water level in the tube. The tube will measure up to 5 cm or 1.97 inches ofwater. If the water should overflow, the observer empties the inner tube and pours theoverflow out of the glass into the tube.
Most of the weather agencies now use computerized tipping-bucket design rain gauges.But now you know the standard!
40467c01.qxd:Document2 9/5/06 12:56 AM Page 31

32 Part I — The World of Weather
Drop CounterThe drop counter rain gauge also uses a funnel to collect rain. The funnel has a small hole atthe bottom that allows water to drip out drop-by-drop. As the drip falls, it briefly touches apair of wire contacts or electrodes. Because rain has a slight resistance to it, electronics in therain gauge can count each drop as it touches the electrodes.
Wrap UpThis chapter briefly touched upon many aspects of weather and weather measurement, includ-ing the following:
� Temperature
� Humidity and dewpoint
� Wind speed and wind direction
� Barometric pressure
� Rain
You also read about some of the sensors used to measure these parameters. Hopefully, youunderstand a bit more about the weather and how to measure it. Keep in mind I have only pre-sented just a few samples of many different ways to measure weather. New and better ways areconstantly being developed.
If you’re thinking about designing your own weather station, hopefully I’ve given you someinsight into what it takes. The biggest hurdle is how to get the data from the outside sensorsinto your computer. Do you incorporate some electronics in your weather station and run a sin-gle cable or do you use a separate line for each sensor? Or just maybe the 1-Wire devicespiqued your interest.
As you have guessed, using 1-Wire is a good solution. You’ve read about the 1-Wire temperaturesensor, but how do you convert the other parameters to 1-Wire? Well, you’ll see how as youprogress through this book. But before you start learning more about 1-Wire, the next chapterlooks at a couple of the popular commercial weather stations and shows how they work.
40467c01.qxd:Document2 9/5/06 12:56 AM Page 32