the world market wealth portfolio* - wordpress.com · the world market wealth portfolio* roger g....
TRANSCRIPT
The World Market Wealth Portfolio* Roger G. Ibbotson and Laurence B . Siege1
T hree years ago in this Journal, we presented returns and market values for the United States Mar- ket Wealth Portfolio.’ That hypothetical portfolio in- cluded the principal investable asset classes in the United States: equities, fixed income securities, cash, and real estate.
The wealth of the United States makes up onlya fraction of the world’s wealth, however. Indeed, this phenomenon is not purely a recent occurrence. Great Britain, for example, had the world’s largest capital markets in 1850. In the twentieth century, United States capital markets have been larger than those of any other single country, but they account for appre- ciably less than half of the world supply of equities, bonds, and real property.
The sheer size of the foreign capital markets motivates us to reexamine the concept of a market wealth portfolio from a world perspective. In addition, returns in foreign markets have proved attractive to United States investors. Therefore, we have con- structed a World Market Wealth Portfolio consisting of equities, bonds, cash, and monetary metals plus real estate in the United States (the returns on foreign real estate being difficult to measure). The analysis covers the capital markets of the United States, North- ern and Western Europe, Japan, Hong Kong, Singa- pore, Canada, and Australia. Our study runs from the beginning of 1960 through the end of 1980.
Our World Market Wealth Portfolio consists of a value-weighted combination of five major categories of assets: (1) equities (stocks), (2) bonds, (3) cash, (4) real estate, and (5) metals. Each category of assets in- cludes several components. United States equities are a value-weighted aggregate of the stocks listed on the New York and American stock exchanges and NAS-
* We are grateful to the First National Bank of Chicago for providing the principal financial support for this study. We wish especially to thank Gary Brinson, Jeffrey J. Diermeier, and L. Randolph Hood, Jr. of the First National Bank of Chicago for their continuing advice and consultation. We appreciate the help of Wendy Freyer and James R. Porter.
1. Footnotes appear at the end of the article.
DAQ over-the-counter stocks. Foreign stocks are a value-weighted aggregate of returns in seventeen countries. United States bonds include corporate is- sues (including preferred stocks) and government is- sues, while foreign bonds include both domestic cor- porate and government bonds traded within a coun- try’s national capital markets and crossborder bonds trqded outside the confines of any one country’s mar- kets. Cash includes United States issues and those of thirteen foreign countries. United States real estate, for which we measure returns and year-by-year mar- ket values, is composed of business, residential, and farm real estate. We estimate the value of world real estate only as of the end of 1980. Monetary metals in- clude the world supply of gold and the non- communist world supply of silver.
The aggregate market values of the categories serve as weights for the purpose of constructing value-weighted portfolios, including the World Mar- ket Wealth Portfolio and subsidiary portfolios. We measure returns and form cumulative wealth indices. We present these results in year-by-year form and as summary statistics. We include cross-correlations and regression results to measure the relationships among the series and between the series and inflation. Fi- nally, we provide detailed information on the sources of the market value and return data for each series.
WHAT IS THE WORLD MARKET PORTFOLIO?
The World Market Wealth Portfolio theoret- ically reflects the entire wealth of the world. Its return is the weighted sum of all the return components, where the weight for each component is its propor- tionate share of the world wealth.
Why should we want to construct such a portfolio? As we said in our earlier work, the primary reason is curiosity. We want to know what has hap- pened to the market values of aggregate wealth in the world. We want to know the dimensions of the world market in which we invest, and we want to be able to compare historical returns on a broad range of assets, both those that have been traditionally held by United
The
Jou
rnal
of
Port
folio
Man
agem
ent 1
983.
9.2:
5-17
. Dow
nloa
ded
from
ww
w.ii
jour
nals
.com
by
Lau
renc
e Si
egel
on
08/2
8/14
.It
is il
lega
l to
mak
e un
auth
oriz
ed c
opie
s of
this
art
icle
, for
war
d to
an
unau
thor
ized
use
r or
to p
ost e
lect
roni
cally
with
out P
ublis
her
perm
issi
on.

Figure 1 States investors and those that are non-traditional. In addition, we have some theoretical reasons
for studying the World Market Portfolio. According to what has come to be known as modern portfolio theory, the market portfolio - not just common stocks, and not just in the United States - is consid- ered to be perfectly diversified with a capital asset pric- ing model beta of 1.0. A literal interpretation of the theories as originally formulated would suggest that the ideal portfolio should represent each asset class in proportion to its prevalence in the world market - the ultimate index fund.
No individual or institutional investor, of course, would actually want to hold a world index fund. Each investor has his or her own risk prefer- ences, tax considerations, information costs, and time horizons. The most obvious example is that only a high-tax investor would want to hold municipal bonds (which, incidentally, we have excluded from this study because of the effect of their tax-exempt status on returns). Other clienteles will cluster in other ways. Suffice it to say that we wish to construct the World Market Portfolio, not for its eventual purchase, but for the insights it might reveal about the behavior of our capital markets.
Given that we want to construct the World Mar- ket Portfolio, what should be included in it? As stated earlier, we have included equities, bonds, cash, met- als, and U.S. real estate. The astute reader will have already noted that the sum of these securities does not represent the "market." We have left huge categories out of the portfolio, while at the same time we have included categories that are not wealth at all.
As in our earlier work, the most important omission is human capital, which is probably the largest single component of world wealth. We have also excluded the value of foreign real estate (except as a rough illustrative estimate in Figure 1). We have excluded the value and returns from proprietorships and partnerships as well as many small corporations. We have excluded (except in Figure 1) personal hold- ings such as automobiles, cash balances, and various consumer capital goods. We have not only omitted a large proportion of wealth, but we also have little idea as to how large the omitted proportion is.
Our inclusions may misrepresent the market even more than our omissions. We have included U.S. and foreign government debt that is almost certainly not backed dollar-for-dollar by government-owned assets such as parks and bridges. More likely, it is backed by claims on a future tax base. Other inclusions in our portfolio also misrepresent wealth. For exam- ple, some corporations own parts of other corpora- tions, causing double counting.
While this study does not really measure the wealth of the world then, it nevertheless presents
6
$ + ' gd
I TOTAL WORLD WEALTH 1980 = $21,486.7 Billion
I CROSSBORDER BONDS 0.9% $182.9 ~- I FOREIGN CASH 0.4% 590.7
I U S CASH 1 7% 5372 8
market values and returns for asset classes that make up a large part of that wealth. We measure the values and returns of the capital market securities that are most marketable and most readily identifiable. These are the securities that make up the opportunity set faced by most investors.
MARKET VALUES AND RETURNS
Later in the paper, we discuss the sources of the data. For now, let us discuss the results, which appear in detail in the tables at the end of the article.
Figure 1 shows the approximate asset class dis- tribution of a broadly defined World Wealth Portfolio as of the end of 1980. We estimate that this broadly defined portfolio had a value of $21,486.7 billion. Foreign real estate is the largest component of the market. Assets residing in foreign countries clearly make up a larger share of wealth than United States assets. Note that only seventeen of the most important foreign industrial countries were used to make these estimates; other countries also hold a substantial share of the world wealth. We see also that automobiles and other consumer durables, excluded in the main body of the study, comprise a substantial portion of world wealth.
In Figure 2, we show the distribution as of the end of 1980 of the asset classes included in the World Market Por'tfolio for which we measure returns. Here we exclude durables, foreign real estate, the municipal bond component of U.S. bonds, art, venture capital,
The
Jou
rnal
of
Port
folio
Man
agem
ent 1
983.
9.2:
5-17
. Dow
nloa
ded
from
ww
w.ii
jour
nals
.com
by
Lau
renc
e Si
egel
on
08/2
8/14
.It
is il
lega
l to
mak
e un
auth
oriz
ed c
opie
s of
this
art
icle
, for
war
d to
an
unau
thor
ized
use
r or
to p
ost e
lect
roni
cally
with
out P
ublis
her
perm
issi
on.

Figure 2 Figure 3
WORLD INVESTABLE WEALTH 1980 = $11,528.1 Billion
3.2% 5372.8 0.8% 590 7
and convertible bonds. Of the remaining asset classes, U.S. real estate is the largest. By our measure, the World Market Portfolio at the end of 1980 was $9,846.2 billion excluding monetary metals, and $11,528.1 bil- lion including these metals.
Table 1 shows aggregate market values of the various series and the total market on a year-by-year basis. Table 2 gives a direct measure of the propor- tions. A graphic representation of the proportions for major categories is displayed in Figure 3. Equities have been decreasing as a proportion of the total market, while metals have been increasing. Bonds have had a declining share of world wealth. The real estate pro- portion has fluctuated but ended the period at approx- imately its beginning level. From Table 2, we can also discern that the U.S. share has decreased over the period studied.
Table 3 presents the year-by-year total returns for the various components of the market portfolio. Each component is grouped into one of the five major categories. The return of each major category is the market-value-weighted sum of the return of its com- ponents. The world market return is the market- value-weighted sum of all of the component returns. We present returns for the world market both with and without monetary metals, since these metals have a large weight and unusual returns and, thus, alter the return on the world portfolio considerably. The re- turns then are linked or compounded into cumulative wealth indices, which are presented in Table 4. Each wealth index is initiated at 1.000 at year-end 1959 and
WORLD INVESTABLE WEALTH VALUE OF CAPITAL MARKET SECURITIES
AS A PERCENTAGE OF THE TOTAL
b L a 8 1 1 8 I I I I I I I 1 I I I I I I I 3
$ 1960 1965 1970 1975 1980
END OF YEAR
includes reinvestment of all income as well as reten- tion of all capital gains.
Figure 4 presents a graphic summary of the re- sults in Table 4. The most risky category, metals, had the highest return over the period. Real estate and equities had lower returns, but still had generally good performance. As measured by the standard deviation of annual returns, real estate was much less risky than equities. The risk of real estate, however, is probably underestimated here as a consequence of the lesser
g c,
0
a !$ LI.
Figure 4
CUMULATIVE WEALTH INDICES OF CAPITAL MARKET SECURITIES
(Year-end 1959 = 1 .OO) I J
7 I -
1960 1965 1970 1975 1980
END OF YEAR
The
Jou
rnal
of
Port
folio
Man
agem
ent 1
983.
9.2:
5-17
. Dow
nloa
ded
from
ww
w.ii
jour
nals
.com
by
Lau
renc
e Si
egel
on
08/2
8/14
.It
is il
lega
l to
mak
e un
auth
oriz
ed c
opie
s of
this
art
icle
, for
war
d to
an
unau
thor
ized
use
r or
to p
ost e
lect
roni
cally
with
out P
ublis
her
perm
issi
on.

marketability of real estate and the probable under- statement of the volatility of annual returns. Cash had returns that tracked the United States inflation rate. U.S. bonds were the worst performer, not keeping up with inflation over the 1960-1980 period, while foreign bonds had better results.
The results presented in Tables 3 and 4 are summarized statistically in Table 5. The biggest win- ners over the period were silver, with a 16.09% com- pound annual rate of return, Asian equities (15.93%), gold (14.39%), andU.S. farm real estate (13.22%). The high return on farms was apparently without the high level of risk or variation that characterized the other high-performing series. Other U.S. real estate also did well for its level of risk. The least desirable investment was U.S. corporate bonds. They earned a compound annual rate of return of only 3.37%; these bonds also were riskier than any class of cash or real estate (as measured) and were as risky as the much better per-
The World Market Wealth Portfolio, excluding metals, had a compound annual return of 8.36% over the study period. Year-by-year returns ranged from 17.48% in 1975 to -1.35% in 1974. The world market portfolio, including metals, had higher returns: a compound rate of 8.92%, ranging from 21.51% in 1980 to 0.99% in 1966. Thus, the inclusion of monetary metals produced a portfolio with positive total returns in every year from 1960 through 1980.
’ forming foreign bond portfolio. 2 ’ % +
E
THE RELATIONSHIPS AMONG THE SERIES
We can get a good idea of the interrelationships among the series by looking at the cross-correlation matrix presented in Table 6. The various equity, bond, cash, real estate, and metal series seem to exhibit high correlation within each category. World equities and world bonds have a correlation coefficient of approxi- mately 0.16. World cash and gold (sometimes consid- ered a form of cash) are highly correlated. Real estate is uncorrelated with most assets but highly correlated with cash, probably reflecting the impoundment of inflation rates into real estate returns.
These results collectively suggest that two fac- tors -economy or market risk and inflation risk- are important in determining security returns. We pro- ceed to investigate these influences by regression analysis.
Table 7 gives results for each of the excess re- turn series regressed upon the excess return series of the larger category in which the series appears. Each major category’s excess return is then regressed on the excess return of the world market, excluding metals. Finally, the excess return of the world market, exclud- ing metals, and the excess returns on metals are re- gressed on the excess return of the complete world market. The returns are all input as the excess of the
securityreturn over the riskless (U.S. Treasury bill) re- turn. Thus, in a market model context, the alpha is a measure of beta-adjusted performance, the beta is a measure of the economy risk of the asset, and the R-square is a measure of the percent of the variance that is explained by the world market.
The results show that world equities were a relatively poor performer, exhibiting a beta of 2.68 and an alpha of -3.17 relative to the total world market. Real estate and metals had positive alphas relative to the world market, while fixed-income securities ac- companied equities with a negative alpha. Real estate and metals also had very low betas; cash had both a low alpha and a low beta. Over the study period, short-term cash outperformed longer-term bonds as a result of generally rising inflation rates. On a beta- adjusted basis, the U.S. Market Wealth Portfolio out- performed the foreign market wealth portfolio.
Inflation appears to be the remaining factor that may describe the series. Table 8 presents the results of each of the return series regressed against U.S. inflation rates. We see that nearly all categories of equities and bonds were negatively related to inflation, while cash, real estate, and metals were pos- itively related to inflation.
SOURCES OF DATA
The following section describes the sources of both the market values and the yearly returns for each of the series. The publications cited are included in a reference listing following the text. Here we describe the manner in which we utilized the data from those sources, or, in some circumstances, calculated our own estimates. In each category, the reported return series is the value-weighted sum of the returns of the components of the category. For example, the return for U.S. equities is the value-weighted sum of NYSE, AMEX, and OTC returns. The reported value for U.S. equities is the sum of the values of these three catego- ries of stocks.
1. Equities
Yearly values and returns for NYSE stocks (1960-1980) and AMEX stocks (1963-1980) were ob- tained from the Center for Research in Security Prices (CRSP) at the University of Chicago. We constructed an equally-weighted index of AMEX stock returns for 1960-1962 using a 30-stock random sample. We ex- trapolated AMEX values for 1960-1962 from the 1963 value, using a given year’s return as the divisor of that year’s ending value to arrive at the previous year’s ending value (”extrapolation by returns”).
OTC stock values and returns for 1960-1978 were obtained from Ibbotson and Fall (1979). OTC val- ues for 1979-1980 were obtained from. the NASDAQ Factbook. To calculate OTC returns for those two years,
The
Jou
rnal
of
Port
folio
Man
agem
ent 1
983.
9.2:
5-17
. Dow
nloa
ded
from
ww
w.ii
jour
nals
.com
by
Lau
renc
e Si
egel
on
08/2
8/14
.It
is il
lega
l to
mak
e un
auth
oriz
ed c
opie
s of
this
art
icle
, for
war
d to
an
unau
thor
ized
use
r or
to p
ost e
lect
roni
cally
with
out P
ublis
her
perm
issi
on.

we used the NASDAQ index to measure capital ap- preciation; we obtained the dividend income data from Media General.
Yearly U.S. dollar-adjusted values and returns for foreign equities are taken from Ibbotson, Carr, and Robinson (1982) and represent 17 countries. The underlying source is Capital International Perspective.
2. Bonds
The U.S. fixed-income group consists of corpo- rate bonds, including preferred stock, and govern- ment and agency bonds. The returns and market val- ues for U.S. corporate bonds were obtained from the unpublished Ibbotson corporate bond study for 1960- 1972. Returns for 1973-1980 were obtained from the Lehman Brothers Kuhn Loeb (LBKL) intermediate- term (one to ten years) and long-term (ten years or more) corporate bond indexes. Values for U.S. corpo- rate bonds for 1973-1977 were also taken from the Ib- botson corporate bond study. We obtained values for 1978-1980 from the LBKL corporate bond index re- ports. The preferred stock return series was calculated from yields in Moody‘sPublic Utility Manual, using the assumption that preferred stocks are a perpetuity. We used High Grade public utility yields for 1959-1974 and “AA” quality for 1975-1980. Yearly preferred stock values were measured as the difference between the total value of all NYSE stocks and NYSE common stocks; these data were supplied by the NYSE research department.
The long-term U.S. Treasury bond return series was taken from Ibbotson and Sinquefield (1982). Re- turns for U.S. Treasury notes for 1960-1976 are taken from the two- to five-year maturity series in the un- published Ibbotson and Vaughan paper; for 1977- 1980, we formed an equally-weighted portfolio of every bond of two- to five-years maturity appearing in Lawrence Fisher’s CRSP U.S. Government Bond File. To obtain the return series for U.S. agency bonds, we constructed a one-bond portfolio using prices and coupons quoted in the Bank and Quotation Record. Our method was to “purchase” an agency bond with five years to maturity at the beginning of the year. The bond was then “sold” one year later. The return was measured as the change in price plus the coupon.
Yearly values for Treasury bonds and notes were obtained by summing the market values of the individual bonds and notes, respectively, in Fisher’s CRSP U.S. Government Bond File. Values for agen- cies were obtained from Flow of Funds Accounts.
Yearly U.S. dollar-adjusted values and returns for foreign domestic and crossborder bonds are as cal- culatedin Ibbotson, Carr, and Robinson (1982).
3. Cash
-
U.S. cash consists of U.S. Treasury bills, com-
mercial paper, and bankers’ acceptances. U.S. Trea- sury bill returns are taken from Ibbotson and Sin- quefield (1982). Values of U.S. Treasury bills were cal- culated as price times the amount -outstanding from Fisher’s CRSP U.S. Government Bond File, summed across all Treasury bills in the file.
We obtained commercial paper and bankers’ acceptances yields from the Federal Reserve Bulletin; re- turns are equal to yields lagged one year. For com- mercial paper, the yield utilized is the average quar- terly yield on four- to six-month paper for 1959-1972, and on 90- to 119-day paper for 1973-1980. For bank- ers’ acceptances, the yields are annual averages of issue yields on 90-day prime issues. Values of com- mercial paper and bankers’ acceptances are taken from Flow of Funds Accounts.
For the fourteen foreign countries studied, Treasury bill yields for 1960-1980 came from OECD Interest Rates 1960-1974 and Financial Statistics: Part I . (The yields for France and Switzerland in 1979-1980 were official discount rates, not bill yields.) The 1959 yield data were obtained from International Financial Statistics; for that year, we obtained bill yields for seven countries and official discount rates for seven coun- tries. Returns are equal to yields lagged one year, and are converted to U.S. dollars.
Market values for cash for these countries were taken from the Government Financial Statistics Yearbook, and converted to U.S. dollars. Values for missing years were interpolated or were extrapolated by re- turns (see above).
4. Real Estate
The year-end 1980 estimate of foreign real es- tate value was produced by summing the flows (change in stocks) from 1959 through 1980 after con- version to constant (1980) dollars. The raw data were provided by the First National Bank of Chicago. This method assumes that no stocks existed at the begin- ning of the reporting period (1959) and that no depre- ciation or demolition occurred thereafter. These two biases operate in opposite directions and, thus, tend to cancel each other.
U.S. real estate consists of business, residential, and farm real estate. Our index of business real estate for 1960-1974 is the sum of the annual changes in the Engineering News Record Building Cost Index, less 2.5 percentage points per year for depreciation, taken as the capital gain, and the assumed income return of 3.49% per year, which is the average annual income return reported by Sprinkel and Genetski (1977) for residential properties. For 1975-1980, we took total re- turns (change in appraised value plus net operating income) on a group of business properties and formed equally-weighted portfolios of the property returns: one for the Western states, one for thesouthern states,
- - - -
9
The
Jou
rnal
of
Port
folio
Man
agem
ent 1
983.
9.2:
5-17
. Dow
nloa
ded
from
ww
w.ii
jour
nals
.com
by
Lau
renc
e Si
egel
on
08/2
8/14
.It
is il
lega
l to
mak
e un
auth
oriz
ed c
opie
s of
this
art
icle
, for
war
d to
an
unau
thor
ized
use
r or
to p
ost e
lect
roni
cally
with
out P
ublis
her
perm
issi
on.
and one for the Northeastern and North Central states combined. (We followed U.S. Bureau of the Census allocation of states to regions.) The property return data were supplied by the First National Bank of Chicago. We then formed a population-weighted portfolio of the three regional return series, where the weights are the 1980 census populations of the regions as reported in the Statisticul Abstract of the United States. We took this population-weighted series as the return series for U.S. business real estate.
Values for business real estate were taken from Musgrave (1981). We used the series for current dollar net stocks of non-corporate non-residential struc- tures. We chose the non-corporate series to avoid double counting of real estate already counted as parts of corporations.
For residential real estate, the capital apprecia- tion returns are the changes in the home purchase index of the Consumer Price Index (CPI), published by the Bureau of Labor Statistics, U.S. Department of Labor. This index represents unlevered houses and thus excludes the influence of mortgage rates. The in- come returns as a percent of value, after management costs, were obtained year-by-year from Sprinkel and Genetski (1977) for 1960-1975, and from Robert Genetski by interview for 1976-1980.
Values for residential real estate were obtained from Musgrave (1981). The series used was current dollar net stock of owner-occupied residential struc- tures. We then multiplied the numbers in this series by 1.2 to account for the value of the land beneath the structures. This multiplier was derived by examining several studies of urban land value, all of the results of which cluster around a 1.2 multiplier.
We obtained the capital appreciation series for farm real estate in the form of a price per acre of farm- land, which we used directly. The U.S. Department of Agriculture supplied us with the series. Income re- turns as a percent of value after management costs were obtained from Economic lndicutors of the Farm Sec- tor 1980.
The market values of farms, including farm houses, were also obtained from Economic indicators of the Farm Sector 2980.
lo 5 2 .- ‘ z
5. Metals
Total returns for gold are the change in year- end price as reported in the Wall Street lournal. The world gold supply as of the end of 1980 was obtained fromBusiness Week (September 21,1981). The underly- ing source is J. Aron & Company. Preceding years’ supplies were estimated by subtracting year-by-year production. Production data were supplied by the U.S. Bureau of Mines. Gold supply and production are measured in ounces. Our market value series eauals the mice times the estimated SUDD~V.
Handy and Harman supplied the year-end prices with which we constructed the total return se- ries for silver. We calculated aggregate values for silver under the assumption that the silver stock equals five times the annual production. We obtained annual production rates from the Minerals Yearbook 2980 for 1960,1965,1970, and 1975, and fromMine Production of Silver in 1980 for 1980. The estimate excludes silver held in communist countries.
6. OtherData
The U.S. inflation rate is taken from Ibbotson and Sinquefield (1982). The underlying source is the CPI (see above). Exchange rates used to convert foreign returns and amounts to U.S. dollars were supplied by the First National Bank of Chicago.
In Figure 1, we present estimates of the end- of-1980 value of various assets not included in the main body of this study. The value of municipal bonds (included in U.S. fixed income securities in Figure 1) at the end of 1980 was taken from the Flow of Funds Ac- counts. The 1980 value of venture capital was supplied by Venture Capital, Inc. We calculated the 1980 value of convertible bonds by summing the amounts out- standing (adjusted for price) reported in Moody’s Bond Record. For the 1980 value of art, we summed the total net sales over the period 1976-1980 for Christie’s and Sotheby Parke Bernet, the two largest auction houses (thus assuming that the aggregate value equals the last five years’ volume of trade). The 1980 value of U.S. durable goods was provided by John C . Musgrave. The number includes automobiles, furniture, appliances, and other personal effects. We estimated the value of foreign durable goods by adding the 1980 value of foreign motor vehicles (at an assumed price of $3,000 per vehicle, with the number of vehicles supplied by the Motor Vehicles Manufacturers’ As- sociation) and the value of foreign personal goods (es- timated by assuming that foreign personal goods were held in the same proportion to foreign motor vehicles as the proportion, derived from the Musgrave data, of U.S. personal goods to U.S. motor vehicles).
‘ Roger G. Ibbotson, and Carol L. Fall, “The U.S. Market Wealth Portfolio,”Journal of Portfolio Management, Fall 1979.
BIBLIOGRAPHY
1. “Annual Reports.” London: Sotheby Parke Bernet Group Lim-
2. “A Return to the Gold Standard.”Business Week, September 21,
3. Bank and Quotation Record. Boston: National News Service,
4. Capital International Perspective. Geneva, Switzerland: Capital In- ternational, $. A., 1959- 1981.
5. CRSP Monthly Stock Returns File (MSRA and IMSRO. Machine- readable tape published by Center for Research in Security
ited, 1977-1981.
1981.
1959-1981.
The
Jou
rnal
of
Port
folio
Man
agem
ent 1
983.
9.2:
5-17
. Dow
nloa
ded
from
ww
w.ii
jour
nals
.com
by
Lau
renc
e Si
egel
on
08/2
8/14
.It
is il
lega
l to
mak
e un
auth
oriz
ed c
opie
s of
this
art
icle
, for
war
d to
an
unau
thor
ized
use
r or
to p
ost e
lect
roni
cally
with
out P
ublis
her
perm
issi
on.

Prices (CRSP), [sponsored by Menill, Lynch, Pierce, Fenner & Smith], Graduate School of Business, University of Chicago, annual 1982, 1981, etc.
6. "Building Cost Index." Engineering Nezus Record, selected issues. 7. Farm Real Estate Market Dmelopments. Washington, D.C.: Em-
nomics, Statistics, and Cooperatives Service, USDA, selected issues.
8. Federal Reserve Bulletin. Washington, D.C.: Board of Governors
9. Finuncial Statistics: Part 1. Pans: Organization for Economic
10. Fisher, Lawrence. "U.S. Government Bond File." Center for
continued on page 15
of the Federal Reserve System, January 1960-1981.
Cooperation and Development, 1970-1981.
TABLE 1
Aggregate Value of Capital Market Securities (Billions of Dollars)
E q u i t i e s F o r e i g n
Corp '
End of
Year -
1959
1960 1 9 6 1 1962 1963 1964
1965 1966 1967 1968 1969
1970 1971 1972 1973 1974
1975 1976 1977 1978 1979
1980
Equi- F o r e i g n t ies
U. S . Europe Asia O t h e r T o t a l T o t a l
346.1
345.0 436.2 383.5 452.4 523.5
594.3 534.5 686.9 789.4 710.7
700.9 827 .5 991.2 791.4 545.1
736.2 911.6 868.0 903.2
1062.7
1380.6
103.0 14.6
135 .1 17.7 168.4 20.5 146.6 1 7 . 1 153.9 23.1 149.9 20.3
1 4 5 . 1 18 .5 150.8 23.1 174.9 27.5 199.0 31.9 196.7 43.8
194.4 50.6 208.5 63.2 269.9 109 .2 322.9 171.9 227.2 126.0
242.1 143.7 233.5 176.9 247.3 195.9 300.5 267 .1 403.5 310.9
457.0 419.3
23.4
27.4 32.6 31.4 34.2 41.7
40.9 38.9 42.8 51.6 55.9
64.2 63.8 80.3 80.3 62.5
66.5 77.3 72 .3 85 .0
131.6
173.0
141.0 487.2
180.2 525.2 221.5 657.7 195.0 578.5 211.2 663.6 211.9 735.4
204.4 798.7 212.8 747.4 245.1 932.1 282.4 1071.8 296.4 1007.1
309.2 1010.2 335.5 1163.0 459.5 1450.6 575 .1 1366.5 415.8 960.9
452.3 1188.4 487.6 1399.3 515.4 1383.4 652.7 1555.8 846.0 1908.7
1049.3 2429.9
i n c l P r e f
S t o c k -
70.2
75.2 78.5 8 3 . 5 87.4 89.7
90.7 88.8 95 .7
110 .9 106.5
127.2 155.5 171.8 169.4 163.5
191.5 214.0 229.7 209.9 203.2
205.1
G o v ' t
145.4
155 .1 157.0 163 .2 163 .8 158.5
162.3 168 .1 164.7 175 .1 169 .1
195 .6 207.4 221.4 233.9 247.2
302.3 373.3 428.9 481.0 537.4
594.0
T o t a l
215.6
230.3 235.5 246.7 251.2 248.2
253.0 256.9 260.4 286.0 275.6
322.8 362.9 393.2 403.3 410.7
493.8 587.0 658.6 690.9 740.6
799 .1
Domestic Corp G o v ' t --
121.8 192.7
140.2 238.0 139.6 253.5 1 3 6 . 1 260.0 141.4 241.8 139.5 236.2
135.6 229.5 133.3 227.6 130.4 233.5 129 .0 232 .1 123.5 219.7
125.6 234.4 159 .2 293.4 181.2 314.0 201.5 340.4 212.8 376.3
240.8 413 .3 274.3 522.4 337.7 682.9 428.2 878.8 429.7 980.8
515.7 1207.9
Cross- b o r d e r T o t a l --
1 7 . 8 332.4
18.6 396.9 19.8 412.9 21.4 417.5 22.7 405.9 24 .0 399.8
24.5 389.6 24.6 385.5 25.5 389.4 27.1 388.2 27.1 370 .3
30.3 390.4 33.5 486.1 38.2 533.4 41.7 583.7 44.8 633.9
63.1 717.2 86 .6 883.2
109.4 1130.0 129.6 1436.6 147.3 1557.9
182.9 -1906.5
Bonds T o t a l - 548.0
627.2 648.4 664.2 657.1 648.0
642.6 642.4 649 .8 674.2 645 .9
713.2 849.0 926.6 987 .O 1044.6
1211.0 1470.2 1788.6 2127.5 2298.5
2705.6
End o f
Year
1959
1960 1961 1962 1963 1964
1965 1966 1967 1968 1969
1970 1971 1972 1973 1974
1975 1976 1977 1978 1979
1980
-
Cash E q u i v a l e n t s Real E s t a t e
u. s.
44.0
45.9 50.8 57.0 62 .1 6 8 . 3
70.4 82.2 89.8
100.4 111.9
128.0 136.9 145.5 157 .7 186.0
219.2 235.6 250.6 266.9 289.2
372.8
Cash F o r e i g n Total
13.6
13 .9 15.2 15 .5 16.2 16.9
17.7 18.7 18.0 1 7 . 7 19 .9
23.1 25.8 31.1 37.1 52 .8
53.2 55 .7 71 .8 85.0 80.0
90 .7
57.6
59.8 66.0 72.5 78.3 85.2
88.1 100.9 107.8 118.1 131.8
151 .1 162 .6 176.5 194.8 238.8
272.4 291.3 322.4 351.9 369.2
463.5
Bus iness
58 .8
61.9 66.6 71.4 76.8 82.5
90 .6 100.6 103.8 120.6 139.9
1 5 6 . 1 170.4 187.8 216.8 267.9
269.8 280.8 318.1 368.1 427.0
486.2
Rea 1 Resid- E s t a t e e n t i a l Far12 T o t a l ---
458.5 137 .2 654.5
476 .9 138.5 677 .3 494.0 144 .5 705 .1 514.7 150.2 736.3 527.2 158.6 762.6 562.4 167.5 812.4
589.8 179.2 859.6 635 .3 189 .1 925.0 667.7 199 .7 977.2 745.3 209.2 1075.1 813.0 215.8 1168.7
870.7 223.2 1250.0 960.2 239.6 1370.2
1082.6 267.3 1537.7 1262.3 327.7 1806.8 1422.1 359.8 2049.8
1534.7 418.2 2222.7 1727.9 496.4 2505.1 2000.3 554.6 2873.0 2390.6 655 .1 3413.8 2663.5 756.2 3846.7
2932.3 828.7 4247.2
Metals Market Wealth P o r t f o l i o s World
Gold
67.0
6 8 . 3 6 9 . 9 71.2 72.7 74.3
75 .9 77 .5 79 .1 90.6 97.6
87 .3 1 0 0 . 8 145 .9 247.8 411 .1
4 2 i . a 332.2 399.1 528.5 851 .5
1654.7
S i l v e r
1.1
1.1 1.2 1 . 4 1.6 1 . 6
1 . 7 1.7 2 .6 2.5 2 . 3
2.4 2 .1 3.0 4 .7 6.6
6 . 1 6 .5 7.0 8.8
32.5
27.1
Met a 1 s T o t a l U. S .
6 8 . 1 1260.2
69.4 1298.5 7 1 . 1 1427.6 72.6 1423.5 74.3 1528.3 75.8 1652.4
77.5 1777.3 7 9 . 1 1798.6 81.8 2014.3 93.1 2250.9 99.9 2266.9
89 .8 2401.7 102 .9 2697.5 148 .9 3067.6 252.6 3159.2 417.7 3191.6
427.9 3671.9 338.6 4239.3 406.1 4650.2 537.4 - 5 2 7 4 . 8 883 .9 5939.2
1681.9 6799.7
-- F o r e i g n
487.0
591.0 649.6 628.0 633.3 628.6
611.7 617.0 652.5 688.3 686.6
722.7 847.4
1024.0 1195.9 1102.5
1222.7 1426.5 1717.2 2174.3 2483.9
3046.5
World World Excl I n c l
Metals Metals -- 1747.2 1815.3
1889.5 1958.9 2077.2 2148.3 2051.5 2124.1 2161.6 2235.9 2281.0 2356.8
2389.0 2466.5 2415.6 2494.7 2666.8 2748.6 2939.2 3032.3 2953.5 3053.4
3124.4 3214.2 3544.9 3647.8 4091.6 4240.5 4355.1 4607.7 4294.1 4711.8
4894.6 5322.5 5665.8 6004.4 6367.4 6773.5 7449.1 7986.5 8423.1 9307.0
9846.2 11528.1
The
Jou
rnal
of
Port
folio
Man
agem
ent 1
983.
9.2:
5-17
. Dow
nloa
ded
from
ww
w.ii
jour
nals
.com
by
Lau
renc
e Si
egel
on
08/2
8/14
.It
is il
lega
l to
mak
e un
auth
oriz
ed c
opie
s of
this
art
icle
, for
war
d to
an
unau
thor
ized
use
r or
to p
ost e
lect
roni
cally
with
out P
ublis
her
perm
issi
on.
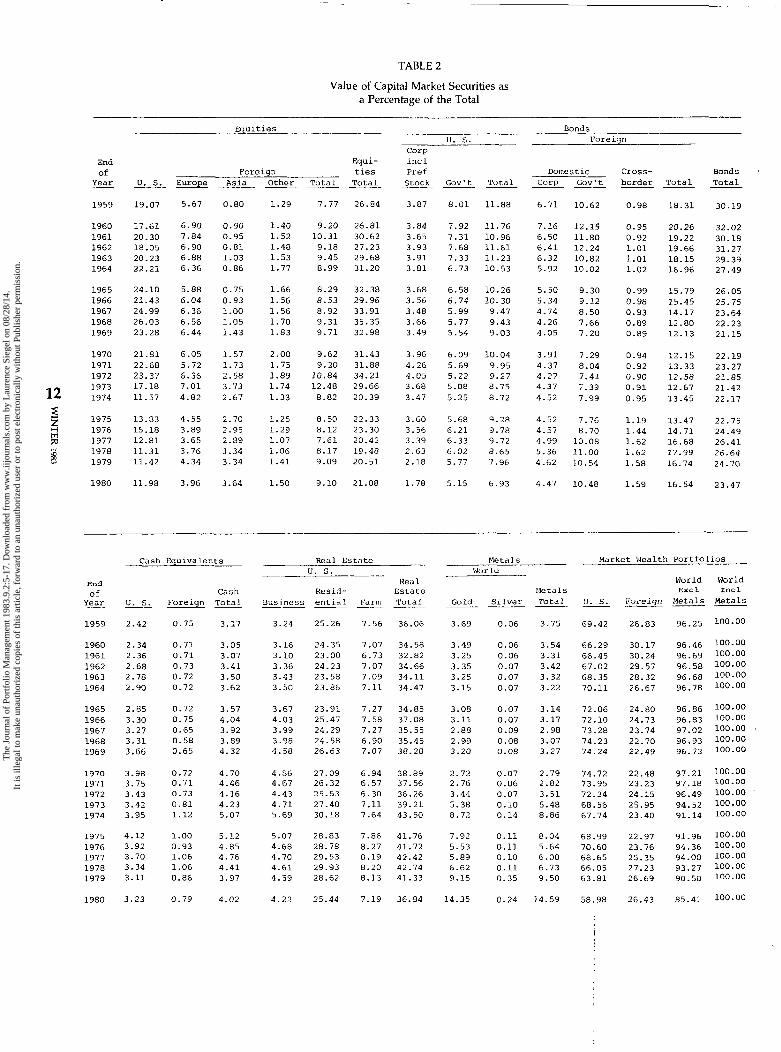
TABLE 2
Value of Capital Market Securities as a Percentage of the Total
End of
Year
1959
1960 1961 1962 1963 1964
1965 1966 1967 1968 1969
1970 1971 1972 1973
12 1974
-
4 1977
I \o 1978 8 1979
1980
Bonds ____-- E q u i t i e s u . s. Foreign
Corp
u. s.
19.07
17 .61 20.30 18.05 20.23 22.21
24.10 21.43 24.99 26.03 23.28
21 .81 22.68 23.37 17.18 11.57
13.03 15.18 1 2 . 8 1 11 .31 11 .42
11.98
Equi- i n c l Foreign t ies Pref Domestic cross- Bonds
T o t a l T o t a l Stock Gov' t Total Corp Gov' t bo rde r T o t a l To ta l - - - _ _ _ _ _ - - - Europe A s i a Other -
5.67
6 .90 7.84 6 .90 6.88 6 .36
5.88 6.04 6.36 6.56 6.44
6.05 5.72 6 .36 7 .01 4 .82
4 .55 3.89 3.65 3.76 4.34
3.96
0 .80
0 .90 0.35 0.81 1 .03 0.86
0.75 0 . 9 3 1.00 1 .05 1 . 4 3
1.57 1 .73 2 .58 3.73 2.67
2.70 2 .95 2.39 3.34 3.34
3.64
1 . 2 9
1 .40 1.52 1 .48 1.53 1 . 7 7
1.66 1.56 1 .56 1 .70 1 .83
2.00 1 . 7 5 1 .89 1 .74 1 .33
1 .25 1 .29 1.07 1 . 0 6 1 . 4 1
1.50
7.77
9.20 10 .31 9.18 9.45 8.99
8.29 8 .53 8.92 9 .31 9 .71
9.62 9 .20
10 .84 12.48
8.82
8.50 8 .12 7 . 6 1 8.17 9.09
9 .10
26.84
26.81 30.62 27.23 29.68 31.20
32.38 29.96 33.91 35.35 32.98
31.43 31.88 34.21 29.66 20.39
22.33 23.30 20.42 19.48 20 .51
21.08
3.87 8 . 0 1
3.84 7.92 3.65 7 .31 3.93 7 .68 3.91 7 .33 3 .81 6 . 7 3
3.68 6 . 5 8 3.56 6 .74 3 .48 5.99 3.66 5.77 3.49 5.54
3.96 6 . 0 9 4.26 5 .69 4.05 5.22 3.68 5.08 3.47 5.25
3.60 5 .68 3.56 6 .21 3.39 6 . 3 3 2 .63 6 .02 2.18 5.77
1 . 7 8 5 .15
11.88
11.76 10.96 11 .61 11.23 10 .53
10 .26 10.30
9 .47 9 .43 9 .03
10.04 9.95 9.27 8 . 7 5 3 .72
9.28 9 . 7 8 9 .72 8 . 6 5 '7.96
6 . 9 3
6 .71
7.16 6.50 6 . 4 1 6.32 5.92
5.50 5.34 4.74 4.26 4.05
3 . 9 1 4 .37 4 . 2 7 4 .37 4 .52
4.52 4 .57 4 .99 5.36 4.62
4.47
10.62
12.15 11.80 12.24 10 .82 10 .02
9.30 9.12 8 .50 7.66 7.20
7.29 8.04 7.41 7.39 7.99
7.76 8 . 7 0
1 0 . 0 8 11.00 10.54
10.48
0.98
0.95 0 .92 1 .01 1.01 1.02
0.99 0 .98 0 . 9 3 0.89 0.89
0.94 0.92 0.90 0 .91 0 . 9 5
1 .19 1.44 1.62 1 . 6 2 1 . 5 8
1 .59
18.31
20.26 19 .22 19.66 18.15 16.96
15.79 15 .45 14.17 12.80 12.13
12.15 13.33 12.58 12.67 13.45
13.47 14 .71 16 .68 1 7 . 9 9 16.74
16.54
30.19
32.02 30.18 31.27 29.39 27.49
26.05 25.75 23.64 22.23 21.15
22.19 23.27 21.85 21.42 22.17
22.75 24.49 26.41 26.64 24.70
23.47
End of
Year
1959
1960 1961 1962 1963 1964
1965 1966 1967 1968 1969
1970 1971 1972 1973 1974
1975 1976 1977 1978 1979
1980
_.
Cash Equiva len t s
u . s.
2.42
2.34 2.36 2 .68 2.78 2.90
2.85 3.30 3.27 3.31 3.66
3.98 3 .75 3.43 3.42 3 .95
4.12 3.92 3.70 3.34 3.11
3.23
- Foreign
0 . 7 5
0 .71 0 .71 0.73 0.72 0.72
0.72 0.75 0.65 0.58 0.65
0.72 0 .71 0.73 0 . 8 1 1 .12
1.00 0 . 9 3 1.06 1 . 0 6 0.86
0 . 7 9
Cash To ta l
3.17
3 .05 3.07 3.41 3.50 3.62
3.57 4.04 3.92 3.89 4.32
4 .70 4.46 4.16 4.23 5.07
5.12 4.85 4.76 4 .41 3.97
4 .02
-
Metals - Real E s t a t e Wurld _-- u . s .
Real Resid-
Business e n t i a l ~ ~-
3.24
3.16 3.10 3.36 3.43 3.50
3.67 4.03 3.99 3.98 4 .58
4.36 4.67 4 . 4 3 4 . 7 1 5 .69
5.07 4.68 4.70 4 . 6 1 4.59
4.22
25.26
24.35 23.00 24.23 23.58 23.86
23.91 25.47 24.29 24.58 26.63
27.09 26.32 25.53 27.40 30 .18
28.83 28.78 29.53 29.93 28.62
25.44
Farm
7.56
7.07 6 .73 7 .07 7.09 7 .11
7 .27 7.58 7 .27 6 .90 7.07
__
6.94 6 . 5 7 6 .30 7 .11 7.64
7 .86 8 . 2 7 8 .19 3.20 8 . 1 3
7.19
E s t a t e To ta l
36.06
34.58 32.82 34.66 34.11 34.47
34 .85 37.08 35.55 35.45 38.28
38.89 37.56 36.26 39.21 43.50
41.76 41.72 42.42 42.74 41.33
36.84
Gold
3.69
3.49 3 .25 3.35 3 .25 3.15
3 .08 3 . 1 1 2.88 2.99 3 .20
2.72 2.76 3.44 5.38 8.72
7.92 5 . 5 3 5.89 6.62 9 .15
1 4 . 3 5
Pletals To t a 1
0.06 3 .75
0.06 3.54 0.06 3.31 0.07 3.42 0 .07 3.32 0.07 3.22
0 .07 3.14 0 .07 3.17 0.09 2 .98 0 . 0 8 3.07 0 . 0 8 3 .27
0 .07 2.79 0.06 2.82 0.07 3 .51 0.10 5.48 0.14 8.86
0.11 8.04 0 . 1 1 5.64 0.10 6 .00 0 .11 6 . 7 3 0.35 9 .50
0 .24 14 .59
S i 1 v e r -~
Market Wealth PortfOliOS
World world
u . s. - 69.42
66.29 66.45 67.02 68 .35 70.11
72.06 72.10 73 .28 74.23 74.24
74.72 73 .95 72.34 68.56 67.74
68 .99 70.60 63 .65 66 .05 63.81
58.98
I
j
ro.- ' L e i y n
26.83
30.17 30.24 29.57 28.32 26.67
24.80 24.73 23.74 22.70 22.49
22.48 23.23 24.15 25.95 23.40
22.97 23.76 25.35 27.23 26.69
26.43
EXC 1 Metals
96.25
96.46 96.69 96 .58 96 .68 96.78
96.86 96.83 97.02 96.93 96.73
97 .21 97 .18 96.49 94.52 91.14
91.96 94.36 94.00 93.27 90.50
85 .41
1"c1
Metals
100.00
100.00 100.00 100.00 100.00 100.00
100.00 100.00 100.00 100.00 100.00
100.00 100.00 100.00 100 -00 100.00
100 .00 100.00 100.00 100.00 100.00
100.00
The
Jou
rnal
of
Port
folio
Man
agem
ent 1
983.
9.2:
5-17
. Dow
nloa
ded
from
ww
w.ii
jour
nals
.com
by
Lau
renc
e Si
egel
on
08/2
8/14
.It
is il
lega
l to
mak
e un
auth
oriz
ed c
opie
s of
this
art
icle
, for
war
d to
an
unau
thor
ized
use
r or
to p
ost e
lect
roni
cally
with
out P
ublis
her
perm
issi
on.
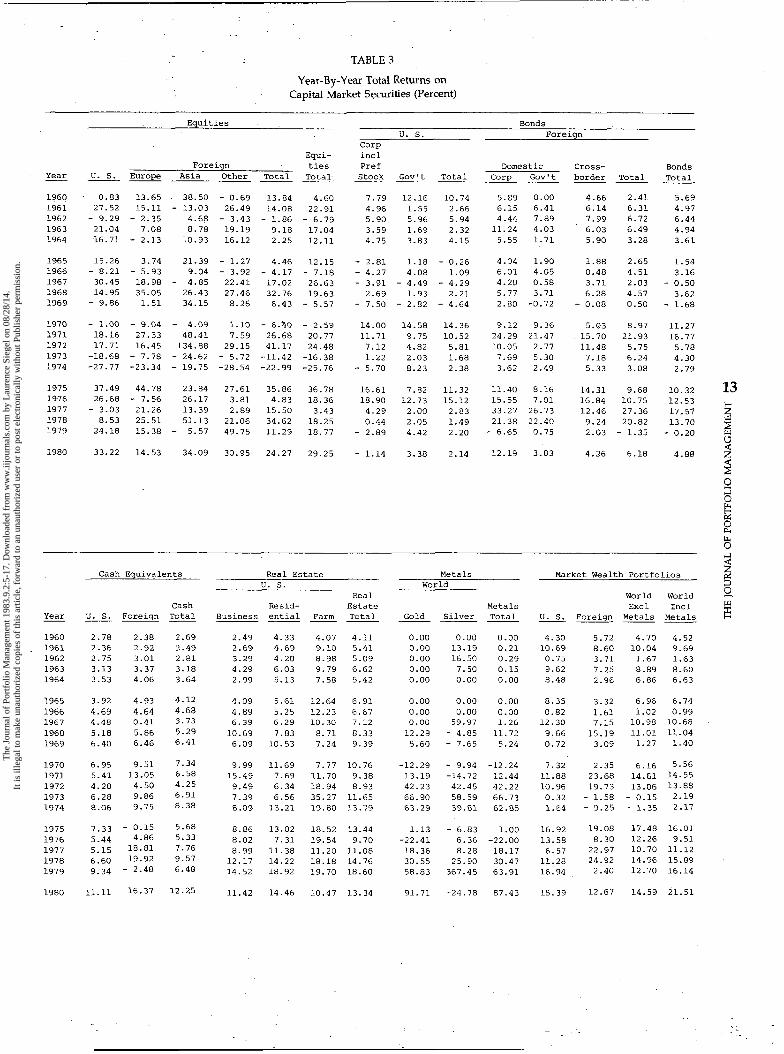
TABLE 3
Year-By-Year Total Returns on Capital Market Securities (Percent)
Year
1960 1961 1962 1963 1964
1965 1966 1967 1968 1969
1970 1971 1972 1973 1974
1975 1976 1977 1978 1979
1980
-
Equities .
Equi- Foreign ties
U. S. Europe Asia Other Total Total. - - - -__-
0.83 13.65 38.50 - 0.69 13.84 4.60 27.52 15.11 - 13.03 26.49 14.08 22.91
- 9.29 - 2.35 4.68 - 3.43 - 1.86 - 6.79 21.04 7.08 8.78 19.19 9.18 17.04 16.71 - 2.13 10.93 16.12 2.25 12.11
15.26 3.74 21.39 - 1.27 4.46 12.15 - 8.21 - 5.93 9.04 - 3.92 - 4.17 - 7.18 30.45 18.98 - 4.85 22.41 17.02 26.63 14.95 35.05 26.43 27.46 32.76 19.63
- 9.86 1.51 34.15 8.26 6.43 - 5.57 - 1.00 - 9.04 - 4.09 1.10 - 6.bO - 2.59 18.16 27.33 48.41 7.59 26.68 20.77 17.71 16.45 134.88 29.15 41.17 24.48 -18.68 - 7.78 - 24.62 - 5.72 -11.42 -16.38 -27.77 -23.34 - 19.75 -28.54 -22.99 -25.76
37.49 44.78 23.84 27.61 35.86 36.78 26.68 - 7.56 26.17 3.81 4.83 18.36
- 3.03 21.26 13.39 2.89 15.50 3.43 8.53 25.51 51.13 21.06 34.62 18.25 24.18 15.38 - 5.57 49.75 11.29 18.77
33.22 14.53 34.09 30.95 24.27 29.25
Bonds u . s. Foreign
Corp incl Pref Domestic Cross- Stock Gov't Total Corp Gov't border Total - - - _ _ - _ _ -
7.79 12.16 10.74 5.39 0.00 4.66 2.41 4.96 1.55 2.66 6.15 6.41 6.14 6.31 5.90 5.96 5.94 4.44 7.89 7.99 6.72 3.59 1.69 2.32 11.24 4.03 6.03 6.49 4.75 3.83 4.15 5.55 1.71 5.90 3.28
- 2.81 1.18 - 0.26 4.04 1.90 1.88 2.65 - 4.27 4.08 1.09 6.01 4.05 0.48 4.51
3.71 2.03 - 3.91 - 4.49 - 4.29 4.20 0.58 2.69 1.93 2.21 5.77 3.71 6.28 4.57
- 7.50 - 2.82 - 4.64 2.80 -0.72 - 0.08 0.50
14.00 14.58 14.36 9.12 9.36 5.03 8.97 11.71 9.75 10.52 24.29 21.47 15.70 21.93 7.12 4.82 5.81 10.05 2.77 11.48 5.75 1.22 2.03 1.68 7.69 5.30 7.18 6.24
- 5.70 8.23 2.38 3.62 2.49 5.33 3.08
16.61 7.82 11.32 11.40 8.16 14.31 9.68 18.90 12.73 15.12 15.55 7.01 16.84 10.75 4.29 2.00 2.83 33.27 26.73 12.46 27.36 0.44 2.05 1.49 21.38 22.40 9.24 20.82
- 2.89 4.42 2.20 - 6.65 0.75 2.03 - 1.35
- 1.14 3.38 2.14 12.19 3.83 4.26 6.18
Bonds Total
5.69 4.97 6.44 4.94 3.61
1.54 3.16
- 0.50 3.62
- 1.68
11.27 16.77 5.78 4.30 2.79
10.32 13 12.53 17- 57 13.70 5
- 0.20 2 4.88 2
U
Cash Equivalents Real Estate [J. S .
Year
1960 1961 1962 1963 1964
1965 1966 1967 1968 1969
1970 1971 1972 1973 1974
1975 1976 1977 1978 1979
1980
- U. S. Foreign
2.78 2.38 2.36 2.92 2.75 3.01 3.13 3.37 3.53 4.06
3.92 4.93 4.69 4.64 4.48 0.41 5.18 5.86 6.40 6.46
6.95 9.51 5.41 13.05 4.20 4.50 6.28 9.86 8.06 9.75
__-
7.33 - 0.15 5.44 4.86
9.34 - 2.48 11.11 16.37
5.15 6.60 19.g2
Cash e 2.69 2.49 2.81 3.18 3.64
4.12 4.68 3.73 5.29 6.41
7.34 6.58 4.25 6.91 8.38
5.68 5.33 7.76 9.57 6.48
12.25
Resid- Business ential ___-
2.49 4.33 2.69 4.69 3.29 4.20 4.29 6.03 2.99 5.13
4.09 5.61 4.89 5.25 6.39 6.29 10.69 7.83 6.09 10.53
9.99 11.69 15.49 7.69 9.49 6.34 7.39 6.56 8.09 13.21
8.86 13.02 8.02 7.31 8.99 11.38 12.17 14.22 14.52 18.92
11.42 14.46
Real Estate
Farm Total
4.07 4.11 9.10 5.41 8.98 5.09 9.79 6.62 7.58 5.42
12.64 6.91 12.23 6.67 10.30 7.12 8.71 8.33 7.24 9.39
7.77 10.76 11.70 9.38 18.94 8.93 35.27 11.65 19.80 13.79
18.52 13.44 19.54 9.70 11.20 11.08 18.18 14.76 19.70 18.60
10.47 13.34
--
Metals World
Gold Silver
0.00 0.00 0.00 13.19 0.00 16.50 0.00 7.50 0.00 0.00
0.00 0.00 0.00 0.00 0.00 59.97 12.29 - 4.85 5.60 - 7.65
~-
-12.29 - 9.94 13.19 -14.72 42.23 42.45 66.90 58.59 63.29 39.81
1.13 - 6.83 -22.41 6.36 18.36 8.28 30.55 25.90 58.83 367.45
91.71 -24.78
Metals Total
0.00 0.21 0.29 0.15 0.00
0.00 0.00 1.26 11.72 5.24
-12.24 12.44 42.22 66.73 62.85
1.00 -22.00 18.17 30.47 63.91
87.43
i 3
World World 2 Market Wealth Portfolios
Excl Incl U. S. Foreign Metals Metals
4.30 5.72 4.70 4.52 10.69 8.60 10.04 9.69 0.75 3.71 1.67 1.63 9.62 7.25 8.89 8.60 8.48 2.96 6.86 6.63
8.35 3.32 6.96 6.74 0.82 1.61 1.02 0.99 12.30 7.15 10.98 10.68 9.66 15.19 11.01 11.04 0.72 3.09 1.27 1.40
7.32 2.35 6.16 5.56 11.88 23.68 14.61 14.55 10.96 19.73 13.06 13.88 0.32 - 1.58 - 0.15 2-13 1.64 - 9.25 - 1.3'5 2.17
16.92 19.08 17.48 16.01 13.58 8.30 12.26 9.51 6.57 22.97 10.70 11.12 11.28 24.92 14.96 15.89 16.94 2.40 12.70 16.14
15.39 12.67 14.59 21.51
----
The
Jou
rnal
of
Port
folio
Man
agem
ent 1
983.
9.2:
5-17
. Dow
nloa
ded
from
ww
w.ii
jour
nals
.com
by
Lau
renc
e Si
egel
on
08/2
8/14
.It
is il
lega
l to
mak
e un
auth
oriz
ed c
opie
s of
this
art
icle
, for
war
d to
an
unau
thor
ized
use
r or
to p
ost e
lect
roni
cally
with
out P
ublis
her
perm
issi
on.

TABLE 4
Cumulative Wealth Indices of Capital Market Securities (Year-End 1959-=1.00)
End Of
Year
1959
1960 1961 1962 1963 1964
1965 1966 1967 1968 1969
1970 1971 1972 1973
-
14 1974
' 1975 ' 1976 2 1977 I 1978 E 1979
1980
u. s.
1.000
1.008 1.286 1.166 1.412 1.648
1.899 1.743 2.274 2.614 2.356
2.333 2.756 3.244 2.638 1.906
2.620 3.319 3.219 3.493 4.338
5.779
- 1.000 1.000 1.000
1.136 1.385 0.993 1.308 1.205 1.256 1.277 1.261 1.213 1.368 1.372 1.446 1.339 1.522 1.679
1.389 1.847 1.658 1.307 2.014 1.593 1.554 1.916 1.950 2.099 2.423 2.485 2.131 3.250 2.690
1.938 3.117 2.720 2.468 4.626 2.926 2.874 10.866 3.779 2.651 8.191 3.563 2.032 6.573 2.546
2.942 8.140 3.249 2.719 10.270 3.373 3.298 11.646 3.470 4.139 17.600 4.201 4.775 16.620 6.291
5.469 22.286 8.239
Total
1.000
1.138 1.299 1.275 1.392 1.423
1.486 1.424 1.667 2.213 2.355
2.204 2.792 3.342 3.492 2.689
3.653 3.830 4.424 5.955 6.627
8.236
Equi- t i e s
Total
1.000
1.046 1.286 1.198 1.403 1.572
1.763 1.637 2.073 2.480 2.341
2.281 2.755 3.429 2.867 2.129
2.912 3.446 3.564 4.215 5.006
6.470
i n c l Pref Stock
1.000
1.078 1.131 1.198 1.241 1.300
1.264 1.210 1.162 1.194 1.104
1.259 1.406 1.506 1.524 1.438
1.676 1.993 2.079 2.088 2.028
2.004
Gov't
1.000
1.122 1.139 1.207 1.227 1.274
1.289 1.342 1.282 1.306 1.270
1.455 1.596 1.673 1.707 1.848
1.992 2.246 2.291 2.338 2.441
2.524
Total
1.000
1.107 1.137 1.204 1.232 1.283
1.280 1.294 1.239 1.266 1.207
1.381 1.526 1.614 1.642 1.681
1.871 2.154 2.215 2.248 2.297
2.346
- cross- border
1.000
1.047 1.111 1.200 1.272 1.347
1.372 1.379 1.430 1.520 1.519
1.595 1.845 2.057 2.205 2.323
2.655 3.102 3.499 3.811 3.888
4.054
Total
1.000
1.024 1.089 1.162 1.237 1.278
1.312 1.371 1.399 1.463 1.470
1.602 1.953 2.065 2.194 2.262
2.481 2.747 3.499 4.228 4.171
4.428
Bonds Total
1.000
1.057 1.109 1.181 1.239 1.284
1.304 1.345 1.338 1.387 1.363
1.517 1.771 1.874 1.954 2.009
2.216 2.494 2.032 3.334 3.327
3.489
Domestic -- Corp Gov't
Equi t ies Bonds Foreign u. s.
Corp
Foreign Europe Asia Other
1.000 1.000
1.059 1.000 1.124 1.064 1.174 1.148 1.306 1.194 1.378 1.215
1.434 1.238 1.520 1.288 1.584 1.295 1.675 1.343 1.722 1.334
1.879 1.451)
2.571 1.021 2.768 1.917 2.869 1.965
3.196 2.126 3.693 2.275 4.921 2.883 5.973 3.528 5.576 3.555
6.256 3.691
2.336 1 . 7 ~
End of
Year
1959
1960 1961 1962 1963 1964
1965 1966 1967 1968 1969
1970 1971 1972 1973 1974
1975 1976 1977 1978 1979
1980
-
Cash Equivalents
u. s.
1.000
1.028 1.052 1.081 1.115 1.154
1.199 1.256 1.312 1.380 1.468
1.570 1.655 1.725 1.833 1.982
2.126 2.242 2.357 2.513 2.747
3.053
- Foreign
1.000
1.024 1.054 1.085 1.122 1.168
1.225 1.282 1.287 1.363 1.451
1.589 1.796 1.877 2.062 2.263
2.259 2.369 2.815 3.376 3.292
3.831
Cash Total
1.000
1.027 1.052 1.082 1.116 1.157
1.205 1.261 1.308 1.377 1.466
1.573 1.677 1.748 1.869 2.025
2.140 2.255 2.430 2.662 2.835
3.182
-
Real Es ta te Metals Market Wealth Por t fo l ios u. s. World
Rea 1 World World
Business
1.000
1.025 1.052 1.087 1.134 1.168
1.215 1.275 1.356 1.501 1.593
1.752 2.023 2.215 2.379 2.571
2.799 3.024 3.295 3.696 4.233
4.717
Resid- e n t i a l
1.000
1.043 1.092 1.138 1.207 1.269
1.340 1.410 1.499 1.616 1.786
1.995 2.149 2.285 2.435 2.756
3.115 3.343 3.723 4.253 5.058
5.789
Farm
1.000
1.041 1.135 1.237 1.359 1.461
1.646 1.848 2.038 2.215 2.376
2.560 2.860 3.402 4.601 5.512
6.533 7.810 8.684 10.263 12.285
13.571
- Estate Total
1.000
1.041 1.097 1.153 1.230 1.296
1.386 1.478 1.584 1.715 1.877
2.078 2.273 2.476 2.765 3.146
3.569 3.915 4.349 4.991 5.919
6.709
Gold
1.000
1.000 1.000 1.000 1.000 1.000
1.000 1.000 1.000 1.123 1.186
1.040 1.177 1.674 2.795 4.563
4.615 3.581 4.238 5.533 8.788
16.847
Si lver
1.000
1.000 1.132 1.319 1.418 1.418
1.418 1.418
2.158 1.993
1.795 1.530 2.180 3.457 4.834
4.504 4.790 5.187 6.530 30.524
22.960
2.263
Metals Total
1.000
1.000 1.002 1.005 1.007 1.007
1.007 1.007 1.019 1.139 1.198
1.052 1.182 1.682 2.804 4.566
4.612 3.597 4.251 5.546 9.091
17.038
u. s. 1. PO0
1.043 1.154 1.163 1.275 1.383
1.499 1.511 1.697 1.861 1.874
2.011 2.250 2.497 2.505 2.546
2.977 3.381 3.603 4.010 4.689
5.1410
I
Foreign
1.000
1.057 1.148 1.191 1.277 1.315
1.358 1.380 1.479 1.704 1.756
1.798 2.223 2.662 2.620 2.378
2.831 3.066 3.771. 4.710 4.823
5.434
Exc 1 Metals
1.000
1.047 1.152 1.171 1.275 1.363
1.458 1.473 1.634 1.814 1.837
1.951 2.236 2.528 2.524 2.490
2.925 3.283 3.635 4.179 4.709
5.396
Incl Metals
1.000
1.045 1.146 1.165 1.265 1.349
1.440 1.454 1.610 1.788 1.813
1.913 2.192 2.496 2.551 2.606
3.023 3.311 3.679 4.263 4.951
6.017
The
Jou
rnal
of
Port
folio
Man
agem
ent 1
983.
9.2:
5-17
. Dow
nloa
ded
from
ww
w.ii
jour
nals
.com
by
Lau
renc
e Si
egel
on
08/2
8/14
.It
is il
lega
l to
mak
e un
auth
oriz
ed c
opie
s of
this
art
icle
, for
war
d to
an
unau
thor
ized
use
r or
to p
ost e
lect
roni
cally
with
out P
ublis
her
perm
issi
on.

continued from page 11
Research in Security Prices, Graduate School of Business, Uni- versity of Chicago, 1976 (annual updates 1977-1981).
11. Flow of Funds Accounts. Washington, D.C.: Board of Governors of the Federal Reserve System, selected issues.
12.
13.
14.
15.
16.
17.
18.
19.
20.
21.
22.
Government Finance Statistics Yearbook. Washington, D.C.: Inter- national Monetary Fund, 1959-1981. Ibbotson, Roger G. “The Corporate Bond Market: Structure and Returns.” Unpublished paper, February 1979. Ibbotson, Roger G., Richard C. Carr, and Anthony W. Robin- son. “International Equity and Bond Returns.” Financial Ana- lysts Journal, JulylAugust 1982. Ibbotson, Roger G., and Carol L. Fall. ”The U.S. Market Wealth Portfolio.” The Journal of Portfolio Management, Fall 1979. Ibbotson, Roger G. and Rex A. Sinquefield. Stocks, Bonds, Bills, and Inflation: The Past and The Future. Charlottesville, Virginia: Financial Analysts Research Foundation, June 1982. Ibbotson, Roger G. and Richard K. Vaughan. “Estimates of U S . Government Bond Yield Curves and Returns.” Unpublished paper, revision in progress, 1981. “Income and Balance Sheet Statistics.” In Economic Indicators of the Farm Sector 1980. Washington, D.C.: United States Depart- ment of Agriculture, 1981. Interest Rates 1960-1974. Paris: Organization for Economic Cooperation and Development, 1975. International Financial Statistics. Washington, D.C.: International Monetary Fund, 1959-1981. The Lehmun Brothers Kuhn Loeb Bond Index. New York LBKL, Inc., 1981. Mine Production of Silver in 1980. Washington, D.C.: The Silver Institute, 1981.
23. Minerals Yearbook 1980. Washington, D.C.: U.S. Bureau of the Mines, 1981.
24. Moody‘s Bond Record: Corporates, Convertibles, Governments, Municipals and Commercial Paper Ratings, Preferred Stock Ratings. New York Moody’s Investors Service, selected issues.
25. Moody‘s Public Utility Manual. New York: Moody‘s Investors Service, 1977 and 1981.
26. Motor Vehicles Manufacturers’ Association Yearbook 1980. Detroit: Motor Vehicles Manufacturers’ Association, 1981.
27. Musgrave, John C. ”Durable Goods Owned By Consumers in the United States, 1925-1977.” In Survey of Current Business, Washington, D.C., March 1979. Updated version in Survey of Current Business, Washington, D.C., August 1979. Further up- dates by telephone interview, 1982.
28. Musgrave, John C. “Fixed Non-residential Business and Resi- dential Capital in the United States, 1925-1979.” In Survey of Current Business, Washington, D.C., February 1981. Updates by telephone interview, 1982.
29. NASDAQ-OTC Market Factbook. Washington, D.C.: National Association of Securities Dealers, selected issues.
30. New York Stock Exchange Factbook. New York New York Stock Exchange, selected issues.
31. “Reports & Accounts.” London: Christies International Lim- ited, 1977-1981.
32. Sprinkel, Beryl W. and Robert J. Genetski. Winning With Money. Homewood, Illinois: Dow Jones-Irwin, 1977. Update from
33. Statistical Abstract ofthe United States. Washington, D.C.: Bureau of the Census, U.S. Department of Commerce, 1977 and 1981.
34. Venture Capital Journal. Venture Capital, Inc., selected issues.
15
z, zi
Genetski by telephone interview, 1982.
3 3 0 35. The Wall Street Journal. New York, selected issues. 5 z I;! YI
4 d 0
s? TABLE 5 E
World Capital Market Total Annual Returns 1960-1980
Equities United States Foreign
Europe ASla Canada L Australia
Foreign Total
Equities Total
Bonds United States
Corporate* GOYernment
United States Total Foreign
Corporate Domestic Government Domestic Crossborder
Foreign Total
Bonds Total
Compound Return
8.71%
8.43 15.93 10.56 10.56
9.30
3.37 4.51 4.14
9.12 6.42 6.89 7.34
4.13
Arithmetic Mea”
10.23%
9.63 19.71 11.92 11.78
10.52
3.61 4.61 4.27
9.43 6.G6 6.99 7.57
6.26
Standard Deviation
17.68%
16.16 33.04 17.07 16.30
15.80
7.13 4.74 5.25
8.36 7.44 4.68 7.13
5.31
*Including preferred stock. **United States only.
Cash Equivalents United States Foreign
Cash Total
Real Estate** Business Residential Farms
Real Estate Total
Metals Gold Sliver
Metals Total
US Market Wealth Portfolio
Foreign Market Wealth Portfolio
World Market Wealth Portfolios Excluding metals Including metals
US Inflation Rate
Compound Return
5.46 G . 6 0
?.G7
7.67 8.72 13.22
9.49
14.39 16.09
14.46
8.37
8.40
8.36 8.92
5.26
Arithmetic Mea”
5.4R 6.76
5.49
7.73 8.79 13.42
9.55
17.59 27.49
17.61
8.50
8.76
8.50 9.07
5.33
Standard Deviation
2.20 5.91
2.42
3.73 4.04 6.79
3.65
29.21 79.26
28.96
5.25
8.91
5.44 5.70
3.81
The
Jou
rnal
of
Port
folio
Man
agem
ent 1
983.
9.2:
5-17
. Dow
nloa
ded
from
ww
w.ii
jour
nals
.com
by
Lau
renc
e Si
egel
on
08/2
8/14
.It
is il
lega
l to
mak
e un
auth
oriz
ed c
opie
s of
this
art
icle
, for
war
d to
an
unau
thor
ized
use
r or
to p
ost e
lect
roni
cally
with
out P
ublis
her
perm
issi
on.
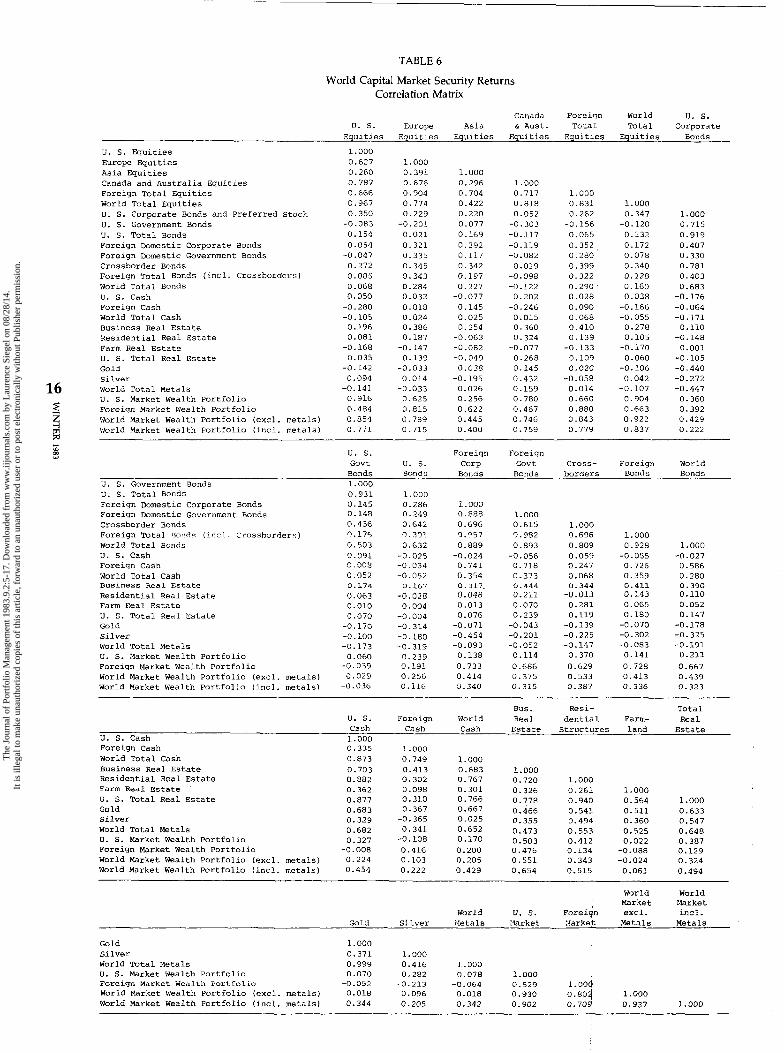
TABLE 6
World Capital Market Security Returns Correlation Matrix
Fore ign T o t a l
E q u i t i e s
World T o t a l
E q u i t i e s
Canada L Aust.
E q u i t i e s
u. s. Corpora te
Bonds Asia
E q u i t i e s U. S. Europe
E q u i t i e s E q u i t i e s
1.000 0.627 1.000 0.260 0.391 0.787 0.676 0.666 0.904 0.967 0.774 0.350 0.229
-0.083 -0.201 0.154 0.021 0.054 0.321
-0.047 0.335 0.272 0.345 0.005 0.343 0.068 0.284 0.050 0.032
-0.280 0.018 -0.105 0.024
0.196 0.386 0.081 0.187
-0.168 -0.147 0.035 0.139
-0.142 -0.033 0.094 0.014
-0.141 -0.033 0.916 0.625 0.484 0.815 0.854 0.789 0.771 0.715
U. S. E q u i t i e s Europe E q u i t i e s Asia E q u i t i e s Canada and A u s t r a l i a E q u i t i e s Fore ign T o t a l E q u i t i e s World T o t a l E q u i t i e s U. S. Corpora te Bonds and P r e f e r r e d S tock U. S. Government Bonds U. S. T o t a l Bonds Fore ign Domestic Corpora te Bonds Fore ign Domestic Government Bonds Crossborder Bonds Fore ign T o t a l Bonds ( i n c l . C r o s s b o r d e r s ) World T o t a l Bonds U. S. Cash Fore ign Cash World T o t a l Cash Bus iness R e a l E s t a t e R e s i d e n t i a l R e a l E s t a t e Farm Real E s t a t e U. S. T o t a l Real E s t a t e Gold S i l v e r World T o t a l Meta ls U. S. Market Wealth P o r t f o l i o Fore ign Market Wealth P o r t f o l i o World Market Wealth P o r t f o l i o ( e x c l . metals) World Market Wealth P o r t f o l i o ( i n c l . m e t a l s )
1.000 0.296 0.704 0.422 0.220 0.077 0.169 0.292 0.117 0.342 0.197 0.227
-0.077 0.145 0.025 0.254
-0.063 -0.082 -0.049 0.038
-0.195 0.026 0.256 0.622 0.445 0.400
1.000 0.717 0.818 0.052
-0.303 -0.117 -0.119 -0.082
0.019 -0.098 -0.122
0.202 -0.246
0.015 0.360 0.324
-0.077 0.268 0 .145 0.432 0.159 0.780 0.467 0.746 0.759
1.000 0.831 0.262
-0.156 0.065 0.352 0.280 0.399 0.322 0.290 0.028 0.090 0.068 0.410 0.139
-0.133 0.109 0.020
-0.058 0.014 0.660 0.880 0.843 0.779
1.000 0.347
-0.120 0.132 0.172 0.078 0.340 0.128 0.160 0.038
-0.166 -0.055
0.278 0.105
-0.170 0.060
-0.106 0.042
-0.107 0.904 0.663 0.922 0.837
1.000 0.715 0.919 0.407 0.330 0.781 0.403 0.683
-0.176 -0.064 -0.171
0.110 -0.148
0.001 -0.105 -0.440 -0.272 -0.447
0.360 0.392 0.429 0.222
I
w P u. s. Fore ign Fore ign Govt u. s. Corp Govt Cross- Fore ign World
Bonds Bonds Bonds Bonds b o r d e r s Bonds Bonds U. S . Government Bonds 1.000 U. S. T o t a l Bonds 0 .931 1.000 Fore ign Domestic Corpora te Bonds 0.145 0.286 1.000 Fore ign Domestic Government Bonds 0.148 0 .249 0.888 1.000 Crossborder Bonds 0.436 0.642 0.696 0.615 1.000 Fore ign T o t a l Qori*s (incl. C r o s s h o r d e r s ) 0.175 0 .301 0. Q57 3.382 0.696 1.000 world T o t a l Bonds 0.503 0.632 0.889 0.893 0.809 0.928 1.000 U. S. Cash 0.091 -0.025 -0.024 -0.056 0.059 -0.055 -0.027 Fore ign Cash 0.309 -0.034 0.741 0.718 0.247 0.726 0.586
Bus iness Real E s t a t e 0.174 0.167 0.317- 0.444 0.344 0 .411 0.390
Farm R e a l E s t a t e 0.010 0.004 0.013 0 .070 0.281 0.065 0.052 U. S . T o t a l Real E s t a t e 0.070 -0.004 0.076 0.239 0.119 0.180 0.147 Gold -0.170 -0.314 -0.071 -0.043 -0.139 -0.070 -0.178 S i l v e r -0.100 -0.180 -0.454 -0.201 -0.225 -0.302 -0.325 World T o t a l Meta ls -0.173 -0.319 -0.093 -0.052 -0.147 -0.083 -0.191
Fore ign Market Wealth P o r t f o l i o -0.039 0 .191 0.733 0.686 0.629 0.728 0.667 World Market Wealth P o r t f o l i o (excl. m e t a l s ) 0.029 0.256 0.414 0.375 0.533 0.413 0.439 World Market Wealth P o r t f o l i o ( i n c l . m e t a l s ) -0.036 0.116 0.340 0.315 0.387 0.336 0.323
World T o t a l Cash 0.052 -0.052 0.354 0.373 0.068 0.359 0.280
R e s i d e n t i a l Real E s t a t e 0.063 -0.028 0.048 0.211 -0,013 0.143 0.110
U. S. Market Wealth P o r t f o l i o 0.060 0.239 0.138 0.114 0.370 0.141 0 .211
R e s i - d e n t i a l
S t r u c t u r e s
BUS. Real
E s t a t e
T o t a l Rea l
E s t a t e u. s. Fore ign
Cash
1.000 0.749 0.413 0.302 0.098 0.310 0.367
-0.365 0 .341
-0.108 0.416 0.103 0.222
World Cash
Farm- l a n d Cash
1.000 U. S. Cash Fore ign Cash World T o t a l Cash Bus iness Real E s t a t e R e s i d e n t i a l Real E s t a t e Farm Real E s t a t e U. S . T o t a l R e a l E s t a t e Gold S i l v e r World T o t a l Meta ls U. S. Market Wealth P o r t f o l i o Fore ign Market Wealth P o r t f o l i o World Market Wealth P o r t f o l i o ( e x c l . metals) World Market Wealth P o r t f o l i o ( i n c l . m e t a l s )
0.335 0.873 0.703 0.882 0.362 0.877 0.683 0.329 0.682 0.327
-0.008 0.224 0.454
1.000 0.683 0.767 0 .301 0.766 0.667 0.025 0.652 0.170 0.200 0.205 0.429
1.000 0.720 0.326 0.77R 0.466 0.355 0.473 0.503 0.476 0 .551 0.654
1.000 0 .261 0.940 0.541 0.494 0.553 0.412 0.134 0.343 0.515
1.000 0.564 0.511 0.360 0.525 0.022
-0.088 -0.024 0.061
1.000 0.633 0.547 0.648 0.387 0.129 0.324 0.494
wor ld World Market Market
World U. S. Fore ign e x c l . i n c l . Gold S i l v e r X e t a l s ?market Xarke t Metals X e t a l s
Gold 1.000 S i l v e r 0 .371 1.000 World T o t a l Metals 0.999 0.416 1.000 U. S. Market Wealth P o r t f o l i o 0.070 0.282 0 .078 1.000
World Market Wealth P o r t f o l i o ( e x c l . m e t a l s ) 0.018 0.096 0.018 0.930 0.804 1.000 Fore ign Market Wealth P o r t f o l i o -0.052 -0.213 -0.064 0.529 1.000
World Market Wealth P o r t f o l i o ( i n c l . m e t a l s ) 0.344 0.205 0.342 0.902 0.709 0.937 1.000
The
Jou
rnal
of
Port
folio
Man
agem
ent 1
983.
9.2:
5-17
. Dow
nloa
ded
from
ww
w.ii
jour
nals
.com
by
Lau
renc
e Si
egel
on
08/2
8/14
.It
is il
lega
l to
mak
e un
auth
oriz
ed c
opie
s of
this
art
icle
, for
war
d to
an
unau
thor
ized
use
r or
to p
ost e
lect
roni
cally
with
out P
ublis
her
perm
issi
on.

~~ ~~ ~~ ~~
. . -
TABLE 7
Regression Results for World Capital Market Returns In Excess of U.S. Treasury Bill Rates
Standard 1st Order . Alpha Beta Deviation Autocorr
x Dependent Variable Independent Variable % Statistic Beta StatTstic - R2 Residuals Residuals Alpha T Of Of
- 1 Europe Equities 2 Asia Equities 3 Other Equities 4 Foreign Epuities 5 US Equities 6 World Equities
7 US Corporate Bonds 8 US Government Bonds 9 US Total Bonds
Foreign Equities Foreign Equities Foreign Equities World Equities World Equities World Wealth excl
US *Total Bonds US Total Bonds World Total Bonds
-1.52 5.11 1.91 1.97 -0.69
metals -3.17
-0.35 0.15 -1.75
-0.89 0.89 0.66 0.90 -0.63 -2.15
-0.59 0.40 -1.79
0.90 9.42 1.44 4.46 0.72 4.46 0.86 6.67 1.08 16.79 2.68 11.64
1.28 13.01 0.83 13.51 0.72 4.50
0.814 0.486 0.486 0.685 0.934 0.871
0.894 0.901 0.490
7.26 -0.52 24.56 -0.17 12.30 -0.01 9.53 0.00 4.73 -0.03 5.93 0.29
2.73 -0.28 1.71 -0.31 4.43 0.00
10 Foreign Corporate Bonds Foreign Total Bonds 1.60 2.79 1.12 15.52 0.923 2.53 -0.19 11 Foreign Government Bonds Foreign Total Bonds -0.92 -2.71 1.01 23.42 0.965 1.51 0.05
13 Foreign Total Bonds World Total Bonds 1.14 1.80 1.18 11.34 0.864 2.88 -0.05
14 World Total Bonds World Wealth excl. metals -0.87 -0.65 0.56 2.67 0.235 5.39 0.26
15 US Cash World Cash 0.04 0.35 0.14 1.60 0.072 0.51 0.28 16 Foreign Cash World Cash 0.14 0.31 4.16 12.24 0.882 1.96 0.27 17 World Cash World Wealth excl. metals 0.14 0.43 0.05 1.01 0.001 1.29 -0.19
18 US Business Real Estate US Real Estate -0.73 -0.56 0.74 2.61 0.225 2.53 0.30 19 US Residential Real Estate US Real Estate -0.49 -0.66 0.94 5.80 0.620 1.45
US Real Estate 1.73 0.58 1.52 2.35 0.184 5.80 0.33 1.99
' 20 US Farm Real Estate 21 US Real Estate
12 Crossborder Bonds Foreign Total Bonds 0.42 0.46 0.54 4.80 0.524 3.96 0.28
0.28 17
E!
2 3 s E
. .. 2
34 netals World Wealth incl. metals 11.38 1.49 0.23 0.19 0.000 2.86 0.54 a 5 P
Wqrld Wealth excl. metals 3.88 7.82 0.09 1.11 0.011 0.52 E-
22 US Equities US Market Wealth -5.37 -3.75 3.29 13.87 0.905 5.64 0.12 23 US US Market Wealth -2.37 -1.56 0.40 1.60 0.072 5.97 0.22 : 24 US Cash US Market Wealth -0.05. -0.43 0.04 2.13 0.150 0.49 0.42 25 US Real Estate US Market Wealth 3.88 7.62 0.09 1.04 0.005 2.00 0.55 26 US Market Wealth World Wealth excl. metals 0.43 0.89. 0.86 11.46 0.867 1.94 -0.10
27 Foreign Equities Foreign Market Wealth 1.20 0.62 1.54 7.96 0.757 8.36 0.10 28 Foreign Total Bonds Foreign Market Wealth 0.10 0.08 0.62 5.09 0.554 5.22 0.11
0 29 Foreign Cash Foreign Market Wealth 0.44 0.36 0.28 -2.31 0.1!8 5.17 -0.20 30 Foreign W k e t Wealth World Wealth excl. metals -1.09 -0.75 1.41 6.76 0.691 5.36 -0.09
31 World Wealth excl. metal? World Wealth incl. metals -0.58 -1.05 1.00 11.54 -0.869 2.09 0.39
L4 0 Metals -0.12 -0.32 1.01 80.65 0.997 1.56 -0.45 32 Gold
33 Silver Metals 8.43 0.47 1.12 1.84 0.107 7.58 -0.38
._
3 TABLE 8 - .
Capital Market Returns Regressed On U.S. Inflation
- Standard 1st Order --
Alpha Beta. Deviation Autocorr
- # Dependent Variable Independent Variable % - Statistic Beta StatTStic R2 Residuals Residuals Alpha T Of Of
-- U. S. Inflation 13.44 1.94 -0.60 - 0.57 0.000 18.44 -0.05 10.33 1.62 -0.13 - 0.14 0;OOO 16.98 -0.21 26.67 2.07 -1.31 - 0.66 0.000. 34.34 -0.06 9.09 1.36 0.53 0.52 0.000 17.82 0.02 13.10 2.04 -0.25 - 0.25 0.000 17.11 -0.06 13.22 2.14 -0.51 ~ - 0.54 0.000 16.49 -0.07
1 US Equities 2 ' Europe Equities
4 Other Equities 5 Foreign Equities 6 World Equities
- 3 Asia Equities
7 - 8
9
10 11 12 13
14
US Corporate Bonds US Governuent Bonds US Total Bonds
Foreign Conaratc mnds Foreiqn Govenumnt Dond; Crossborder Bonds Foreign Total Bonds
World Total Bonds
15 US Cash 16 Foreign Cash 17 World Cash
6.50 - 2.42 -0.54 - 1.32 4.48 2.40 0.03 0.09 5.22 2.55 -0.18 - 0.57 9.67 2.93 -0.04 - 0.09 5.77 1.97 0.17 0.37 7.33 4.01 -4.07 - 0.26 7.20 2.56 -0707 0.16
6.39 3.05 -0.02 - 0.07
0.036 . 7.17 0.000 4.98 o.')c)o 5.47
0.000 8.79 0.000 - 7.80 0.000 4.91 0.000 7.49
0.000 5.58
0.33 - 0.03 0.21
0.23 . 0.25 0.54 0.28
0.40
2.62 8.29 0.54 11.11 - 0.860 0.84 0.28 3.75 1.73 0.56 1.70 0.087 5.79 -0.13 2.85 5.47 0.53 6.72 0.688- 1.39 -0.21
- 4.32 3.88 0.64 3.77 0.398 2.97 0.36 3.76 5.22 0.95 8.60 0.785 1.92 0.20 8.48 3.71 0.93 2.66 0.232 6.10 0.30 - 4.79 9.15 0.89 11.18 0.861 1.40 0.00
- 18 US Business Real Estate 19 US Residential Feal Estate 20 US Farm Real Estate 21 US Real Estate
22 Gold 23 Silve? -- - 24 Metals -
-14.29 ~ -1.98- 5.98 5.44 0.589 19.20 0.4? --24.47 -0.89 9.75- 2.31-- 0.179 73.60 - - -0,32- -14.30 -2.03 5.99 5.58 . 0.601 18.75 0.47 - a' -
- - . 7.07 3.481'- 0.27 0.88 O . W O _ 5.41- ~0.03 - - - -~ -.~.. - - 9:55 -. 2.72- -0.15 = 0.28 . - o.oop 9,35 -.O-ll - . .
. . - - - 25 -US MarEet Weaith . . - -
7.69 . 3.61- 0;15 . 0.46 -: 0.000 -.-5.68 - -0.M . - . 6:24 ;2-.97 0:53 1.66 --0.080'- 5.60 q . ~ : , - - .- - .
~ 2 6 :.-TFore ign ' Market: Yea 1 th .. . - . - '-Vbrld We-ilth excl. metals 5 ~ . . -
. . ._ .World Wealth incl. metals . .-: . -.
.. . . . . . . . . .
. .
The
Jou
rnal
of
Port
folio
Man
agem
ent 1
983.
9.2:
5-17
. Dow
nloa
ded
from
ww
w.ii
jour
nals
.com
by
Lau
renc
e Si
egel
on
08/2
8/14
.It
is il
lega
l to
mak
e un
auth
oriz
ed c
opie
s of
this
art
icle
, for
war
d to
an
unau
thor
ized
use
r or
to p
ost e
lect
roni
cally
with
out P
ublis
her
perm
issi
on.