the walmart sustainability case project - sc.edu · for more information about the walmart...
TRANSCRIPT

The Walmart Sustainability Case Project
Date: 05/31/2013
© 2013 Board of Trustees of the University of Arkansas and the University of South Carolina. This case study,
designed to be read alone or as part of a series, was prepared by Michael Galbreth of the University of South
Carolina and Matthew A. Waller, Christopher Vincent, and David G. Hyatt of the University of Arkansas. The case
was developed solely as a basis for class discussion and is not designed to serve as a source of primary data or be
construed as a commentary on management techniques. Some of the numbers provided represent actual Walmart
point-of-sale data; others are disguised. The conversations among Walmart managers and other case specifics are
fictionalized. The authors thank all of the Walmart employees that assisted with the case for their help and insights.
For more information about the Walmart Sustainability Case Project, a joint venture of the University of South
Carolina and the University of Arkansas, please visit the project website,
http://sustainabilitycases.kenexcloud.org/about.
This work is licensed under the Creative Commons Attribution-NonCommercial-NoDerivs 3.0 Unported License.
To view a copy of this license, visit http://creativecommons.org/licenses/by-nc-nd/3.0/ or send a letter to Creative
Commons, 444 Castro Street, Suite 900, Mountain View, CA, 94041, USA.
Walmart’s Sustainability Journey:
Bottled Water Logistics and Forecasting
Eric Smith, regional supply chain manager for Walmart, walked down a concrete aisle between
towering shelves of products and pallets. It was a hot day in July 2010, and Smith had made the
trip to the backroom of a Conway, Arkansas, Walmart Supercenter to think about water—bottled
water, to be specific. The inventory levels had been piling up at an alarming rate at the regional
distribution center (DC) in Clarksville, Arkansas, apparently as a result of some overly optimistic
forecasting of demand over the July 4 holiday. Smith soon found what he was looking for: a vast
section of storage shelves densely packed with pallets of bottled water, ranging from single-
serve, 10-ounce bottles to 2.5-gallon jugs. For a moment, he contemplated the sheer volume, not
to mention weight, of the liquid before him. He recalled that a single cubic foot of water weighed
62 pounds. Could that be right? How much could these shelves hold?
Smith’s reflections were interrupted by unusual sounds coming from the aisle to his left.
Investigating, he found an associate disposing of 12-packs of small Sam’s Choice water bottles
that had been damaged while being unloaded and moved around the warehouse by forklift. She
worked methodically, first pouring the water into a drain and then feeding the cardboard and
plastic into a shredder for recycling. Smith’s brow furrowed. This stuff is not cheap to transport,
and apparently storage and handling present problems as well. As he watched costs literally pour
down the drain, his thoughts moved to waste: wasted production, wasted transportation, and
wasted resources. The scene in front of him seemed directly contradictory with Walmart’s
sustainability goals. And beyond the strategic implications, Smith had to wonder how the

Bottled Water
Page 2
perpetual inventory system even recorded this reduction in inventory. Was it recorded at all? It
appeared to be time to get smarter about water at Walmart.
Bottled Water
Water in a plastic bottle might not be the most exciting product category, but sales of bottled
water have registered nearly continuous growth for more than three decades. The idea of bottling
water began in Europe in the 1700s, when mineral spring water was bottled and sold for its
reputed healing properties. In the early twentieth century, bottled water in Europe offered a safe
alternative to unsanitary tap water in many areas. Bottled water entered the U.S. market much
later; sanitization of public water had been available there since early in the twentieth century.
But consumption of bottled water in the United States saw rapid increases in the 1990s and
2000s, rising from 9.8 gallons per person in 1992i to 27.6 gallons per person in 2009.
ii Overall,
consumption of bottled water grew a thousand-fold between 1984 and 2005.iii
The drivers of this
increase were numerous and varied: an aging municipal water infrastructure; a perception that
bottled water was safer and tasted better than tap water;iv
and greater mobility that required
convenient, portable water delivery methods. Another important growth driver was the increased
focus on healthy diet and lifestyle choices, in which proper hydration and avoidance of sugary
drinks both play important roles. People who consume bottled water regularly are twice as likely
to cite health concerns as a factor in their beverage choices than those who do not. Furthermore,
the increase in bottled water consumption was accompanied by a greater share of households
using water filters at home.
Overall, water made up 41% of the beverages Americans consume, and bottled water constituted
nearly one-third of total water consumption.v Studies showed that bottled water drinkers were
disproportionately from ethnic minorities and had higher-than-average levels of education.
Furthermore, though bottled water often was compared to tap water, only 30% of its consumers
said they would drink tap water if bottled water were not available; the others would choose
some other bottled beverage. Thus the market that featured bottled water also included
carbonated soft drinks, sports drinks, juices, coffee, milk, and beer. In this category, bottled
water had gained ground against all its competitors, especially soft drinks. Between 2000 and
2009, bottled water’s market share increased from 9% to 14.5%, while soft drinks fell from 30%
to 24%. During the economic downturn that began in 2008, sales of nearly all beverages
decreased, but bottled water sales decreased less than those of all other beverage categories.

Bottled Water
Page 3
Bottled water sold in many sizes and formats, bottled in both glass and various types of plastic
bottles, but 70% of water sold in the United States used a “single-serve” format and came in
polyethylene terephthalate (PET) plastic bottles. Bottled water also can be classified into several
subcategories, such as carbonated, mineral, artesian, spring, purified, and deionized. None of
these varieties include flavorings as such, though added minerals can enhance flavor. Water
comes from various sources or goes through several processes, depending on its labeling. The
most common label is pure or purified water. Purified water may be from any acceptable source,
including springs or municipal sources, but the dissolved solids must be removed from it using
distillation or reverse osmosis. Spring water comes from underground and rises to the surface
without active extraction. Mineral water may be from any source but contains a minimum level
of minerals. Regardless of the source, all bottled water must be sanitized and filtered.
Recent trends indicated consumers prefer packages of multiple, smaller bottles rather than single,
larger bottles, so the fastest growing product category is 12- and 24-packs of single-serve, 10
fluid ounce (237 ml) bottles. Walmart’s private label water brands, Sam’s Choice and Great
Value, sold in such packs, were bottled in five locations in North America (Quebec, Florida,
Texas, and two West Virginia sites), and competed primarily on price.
Walmart and Sustainability
“We didn’t get where we are today by being like everyone else and driving the middle of the
road,” said Lee Scott, CEO of Walmart, in 2005. “We became Walmart by being different,
radically different.”vi
The radical difference Scott proposed that day was sustainability
leadership, committing the company to be supplied by 100% renewable energy, to produce zero
waste, and to sell products that not only sustained communities but also protected the
environment. He gave no timelines for achieving those goals, and admitted he didn’t know
exactly how to achieve them. But the environment was being degraded by human activity, which
was hurting people—“Katrina in slow motion,” Scott called it, referring to the devastating 2005
hurricane—and people involved in business had an opportunity and the responsibility to
eliminate this negative impact.
In retrospect, the speech and emphasis on sustainability came to be regarded as a significant
change for Walmart, yet Scott couched it as a continuation of Walmart’s longstanding principle
of finding business opportunities in unlikely places. At Walmart’s founding in 1962, founder

Bottled Water
Page 4
Sam Walton chose to place stores in small towns in the Midwestern and southern United States,
even as most retail enterprises were focusing on large cities. Walmart challenged the
conventional wisdom by establishing a highly centralized system of store-level planning, and by
1987, it had completed the installation of the largest private satellite network in the world,
connecting every store with its home offices in Bentonville, Arkansas.vii
The company also
challenged a traditional model of outsourced transportation services, establishing its own
trucking fleet in the late 1970s in response to the high rates charged by trucking companies to
deliver to stores in small towns.viii
Walton’s innovative thinking resulted in explosive growth for his company. By 1996 Walmart
had a presence in all 50 U.S. states and five countries, including China. In 1999, with 1.1 million
employees, Walmart became the world’s largest private employer. Scott considered Walmart’s
size both a challenge and an opportunity: “We are in uncharted territory,” he noted. “If we were
a country, we would be the 20th
largest in world.… Due to our size and scope, we are uniquely
positioned to have great success and impact in the world, perhaps like no company before us.”
In other contexts, Scott made the case that sustainability was not just another task on a to-do list
but rather a lens through which to see the world and business.ix
This led the company to rethink
the role of consumers in achieving sustainability. For instance, Walmart actively influenced
customers’ light bulb purchasing decisions, directing them toward more expensive compact
fluorescent bulbs and away from cheaper, energy-intensive incandescent bulbs.x Sustainability
was not a philanthropic add-on but a new way of doing business that could also ensure additional
profits for the company. For example, waste is both an economic loss and an environmental
hazard, and thus Walmart would focus on waste reduction strategies. In particular, Scott
emphasized supply chain waste and pollution:
If there is waste or pollution, someone along the line pays for it. For example, if
our trucks are inefficient from a fuel standpoint, we’ll pay for that at the diesel
pump. If the dumpsters behind our stores fill up with trash, you can be assured
that we paid someone to send that trash to us, and we will pay someone to take it
away. xi
Sustainability and Bottled Water
When The Wall Street Journal asked Lee Scott where to draw a line—sell a product with a high
environmental cost or not offer it—he had a ready answer: “If the customer wants bottled water,

Bottled Water
Page 5
we are going to sell bottled water. But even if you're going to sell bottled water, you can sell it
and have less of a negative impact.” And indeed, the negative impact of bottled water on the
environment has long been the subject of active discussions among business leaders and
environmentalists. A 2007 Fast Company article brought the issue to the forefront, framing the
decision to drink bottled water as one with deep ethical implications. For instance, Fiji Water
produced more than a million bottles of water a day, yet more than half the people on the island
of Fiji did not have reliable, safe drinking water. xii
Water bottlers acted quickly to defend
themselves and establish their sustainability credentials. Still, consumers and watchdog groups
remained skeptical. One group, commenting on the controversial Fiji Water product (bottled on
the remote Pacific island and shipped to locations worldwide), asserted:
The fact that a product that comes packaged in plastic and is shipped thousands of
miles from its source of origin could claim the mantle of sustainability is dubious
at best…. While we appreciate Fiji Water’s attempt to mitigate the negative
environmental impacts of their water operation, the fact remains that the only
truly sustainable water is the kind that requires no fancy packaging or clever
marketing gimmicks: tap water.xiii
The quality of bottled water was also questioned, and sometimes even bottled water
representatives were unable to distinguish their products from competitors.xiv
A market-based
study conducted by an advocacy NGO, Environmental Working Group, indicated that bottled
water contained contaminants at levels no different than routinely found in tap water, noting,
Several Sam's Choice samples purchased in California exceeded legal limits for
bottled water contaminants in that state. Cancer-causing contaminants in bottled
water purchased in 5 states (North Carolina, California, Virginia, Delaware and
Maryland) and the District of Columbia substantially exceeded the voluntary
standards established by the bottled water industry.xv
In terms of packaging, though PET plastics are highly recyclable and can be converted into
products like carpeting, fleece clothing, and playground equipment, as well as new containers
and bottles, in 2008 only about 13% of plastic bottles ended up in the U.S. recycling stream.
Approximately 2 million tons of water bottles instead moved to landfills.xvi
Not only would these
plastic bottles take centuries to decompose, but they cannot be incinerated, because burning them
releases toxic chlorine gas into the atmosphere and produces ash containing heavy metals.
The NRDC also estimated greenhouse effects related to transportation: In 2006, the 18 million
gallons of bottled water shipped from Fiji to California produced about 2,500 tons of CO2.xvii
According to a 2007 resolution passed by the U.S. Conference of Mayors, plastic water bottles

Bottled Water
Page 6
produced for U.S. consumption require 1.5 million barrels of oil per year, which might otherwise
power 250,000 homes or fuel 100,000 cars for a year.xviii
Even as these debates raged, consumer demand for bottled water remained and, as Lee Scott
acknowledged, was unlikely to dissipate anytime soon. Rather, the consensus view suggested
that bottled water would continue to steal market share from other beverages. For Eric Smith,
this market status meant that improving Walmart’s bottled water inventories was critical. The
problem was clear in his mind: Forecasting bottled water demand was simply not good enough,
and an investment in improving its forecasting could pay huge dividends for Walmart, both
financially and environmentally.
Thus when Smith returned to his office later that day, he immediately called Shirley Thomas,
director of merchandise replenishment, to ask if they could form a team to assess and improve
Walmart’s bottled water forecasting process. Thomas agreed that the waste associated with
bottled water was out of line with the company’s sustainability goals, but she was skeptical that
improved forecasting was the solution. Considering Smith’s strong arguments though, she agreed
to help him with the project.
Forecasting Bottled Water Sales
The very next day, Smith got started by talking with store and DC managers about their
experiences with bottled water inventories. Because most sales involved single-serve containers
(or multi-packs of single-serve containers), he decided to focus on such products. As he had
anticipated, most of the conversations revolved around problems of excess inventories on the one
hand but stockouts on the other, especially around special events such as July 4 or major sporting
events. Year after year, demand during these special occasions got dramatically overestimated or
underestimated. The result was a quantity of bottles on hand that was either far in excess of what
was needed or not nearly enough. Although bottled water has a long shelf life and is unlikely to
expire, excess bottles tie up capital, occupy valuable storage space, and offer the potential for
damage as they wait to work through excess supply. The sound of water from damaged bottles
being poured down the drain still rang in Smith’s ears.
Of course, underestimating demand had significant consequences too. For many shoppers, the
appeal of Walmart is its offer of a one-stop shop, with a wide array of products: groceries,
Bottled Water
Page 7
general merchandise, apparel, pharmacy, and so on. Walmart shoppers thus expect products to be
on the shelves. Stockouts at the store level might be resolved through interstore transshipments
to address the shortfall, but this process is highly inefficient. Replacement products also might be
coming on the next truck headed for the store from the DC, but this delivery might not occur for
several days—or more, if the truck did not have any excess space to load the water. From a
sustainability standpoint, stockouts also waste customers’ fuel and time, because they must travel
to another store to complete their purchases. Inventory mistakes, whether they are excess stock
or shortages, thus are costly in various ways.
One of Smith’s bottled water conversations with Rudy Valendorf, the Director of Merchandise
Replenishment, was particularly insightful, so it is reproduced at length here:
VALENDORF: I’m concerned that we’re throwing ourselves at a brick wall. Bottled
water is very costly to move, in terms of money and energy use, not to mention
pollution from bottle production. Besides, it may not be any better for consumers
than plain tap water. Why are we trying to improve the sustainability of the
supply chain of a product if the product is fundamentally unsustainable? It seems
disingenuous.
SMITH: If the bottled water were being substituted for tap water at home, then I
would agree with you. However, much of it is being purchased as a substitute for
other drinks, including colas and even beer, in some cases. You could argue that
providing bottled water as an alternative is socially responsible. Instead of
purchasing a bottle of orange soda, some people are purchasing a bottle of water.
If our customers wanted tap water they would get it at home; hey, they could even
get it from the faucets in our bathrooms at no cost to them!
VALENDORF: But can we really say that one product is sustainable just because it
is not as bad as another? The transportation and demand challenges with water
exist in soft drinks, too. Besides, bottled water already costs the consumer less
than bottled soft drinks. As things lie, there is already an incentive for the
consumer to buy bottled water over other alternatives because it costs less and is
more healthful than are soft drinks, but the environmental costs in terms of energy
and resource consumption and the challenges related to waste are the same.
SMITH: My point exactly! Both are fast-moving consumer goods with similar
demand patterns and a similar supply chain, but one costs less and is better for the
consumer than the other. They both have an environmental cost, and that cost for
water is being exacerbated by our distribution. So we have an obligation to
improve the bottled water supply chain because it is the best alternative, and
because small improvements can make a big difference, in terms of our costs as
well as our environmental impact.
VALENDORF: Sure. But I still have my doubts. Besides, I’m sure that consumer
advocacy and environmental groups are going to start talking about

Bottled Water
Page 8
“greenwashing,” saying that we’re just painting a sustainability façade on an
unsustainable product.
SMITH: First of all, we’re not planning on changing the labeling or advertising, so
we’re not trying to convince people that drinking bottled water is an
environmentally friendly activity. We’re just trying to make this product friendlier
to the environment. The thing is that we aren’t going to stop people from buying
bottled water. If we stopped selling bottled water altogether, they would either
buy a less healthy alternative from us or they would go to a competitor to get it.
We’re a big company, and we can influence the market but we can’t fight it.
We’ve got to find a way to make what people are buying more sustainable. The
way I see it we can either try to convince people to buy something else, or we can
find ways to make the supply chain for what they are already buying more
sustainable. Convincing people to buy something else is tricky. We could end up
spending a lot of time, energy, and money and have it fail. On the other hand we
already know there are significant opportunities in the supply chain. I think that’s
where the best opportunity is.
VALENDORF: Alright. I’ll buy it. Where do you think we should start?
SMITH: I think there are two ways to approach this. One would be to fine-tune the
supply, to improve forecasting and distribution. The other would be to look at
how the supply chain could be restructured to make it more flexible or reduce
overall transportation costs.
VALENDORF: I think that to make real improvements in the sustainability of
bottled water, we have to design a better supply chain. There has to be a more
efficient form of storing and delivering all these bottles.
SMITH: It would be great if you were right! Personally, I prefer to scratch where it
itches. The excessive inventory starts when forecasts higher than actual demand.
Why don’t we split up and you can look into our possibilities in re-designing the
product supply chain and I’ll see what we can do about improving our
forecasting?
VALENDORF: Sounds like a plan!
Chasing the Bottle
Valendorf was serious, and so he set out to become an expert in the bottled water supply chain.
As he learned more, he began to note various inefficiencies that might yield opportunities for
improvement. In terms of consumer products, bottled water is simple to produce. It begins before
the bottle, with a “preform.” Preforms consist of the PET plastic for a bottle, condensed into a
small capsule. Single-serve preforms and bottles, which average about 9 grams each, get shipped
to bottling facilities, where they are “blown” or expanded using machines that blow hot air into
the perform, forcing it to take to the shape of a mold.

Bottled Water
Page 9
Sam’s Choice and Great Value water was purified, bottled, and packaged at five locations in the
eastern and south-central United States, then shipped by truck to DCs. As a product, bottled
water was a transportation challenge: Water is dense, so trucks reach their maximum payload
(“weigh out”) well before filling all the volume of space in the truck (“cube out”). After
expansion, a 10 fl. oz. bottle weighs approximately 246 grams (8.7 oz.), and a 12-pack weighs
3,450 grams (7.6 lbs.). Depending on its configuration, a pallet of 12-packs of 10 oz. water
bottles would weigh between 607.5 kg (1,338 lbs.) and 752.4 kg (1,657 lbs.), and they cannot be
stacked without crushing the plastic bottles. Thus, dry vans weigh out with 18 pallets, which
would leave room (but not weight capacity) for 12 more pallets. In other words, for every five
trucks transporting bottled water, Walmart was transporting the equivalent of two empty trucks.
Then, from the DCs, bottled water moved in mixed product trucks to stores. After consumption,
most bottles wound up in landfills.
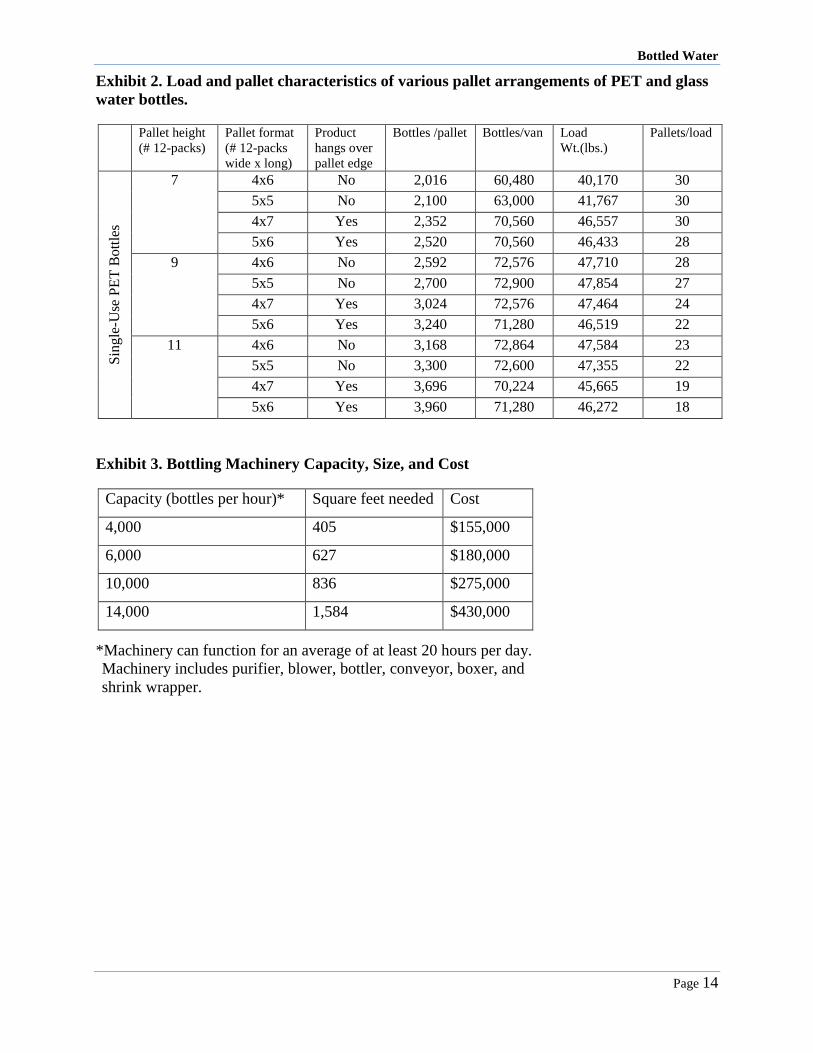
The simplest opportunity Valendorf noticed for improving the efficiency of the bottled water
distribution was readjusting the pallet configuration. He began to play around with various
configurations of 12-packs on the pallet (Exhibit 1). In some configurations, the bottles hung
over the edge, which would likely lead to waste through damage, though Valendorf was unsure
how much. As he developed different configurations, Valendorf also found ways to approach the
trucks’ weight capacity using configurations that did not require any products to hang over the
edge of the pallet. When he calculated the number of bottles per load though, he discovered that
the current configuration held 71,280 bottles, and his new idea would increase that number to
72,900—an improvement of only about 2.2%. Although any improvement was welcome, 2.2%
was not the earth-shattering change he hoped to achieve.
He considered some more. Perhaps the purified water could be bottled in the DC; it could come
from any source, including municipal tap water. He looked into the costs: If Walmart started
purifying and bottling tap water at each DC; it would need to purchase machinery to blow the
preforms, purify the water, and fill the bottles (Exhibit 2). His calculations led Valendorf to
conclude that this reorganization of the supply chain was the best choice—maybe not for all the
water categories perhaps, but certainly for simple purified water. Excited, he took his idea to
Smith: “This way we could limit the negative impacts of the forecasting variations, by taking a
step out of the supply chain. We would have a 36% reduction in transportation miles. This is a
much more environmentally friendly supply chain.”
Bottled Water
Page 10
But Smith was unsure. “Well,” he worried:
We would eliminate transportation to the DC for that SKU, but what about the
unintended consequences? If we take our highest volume product away from our
bottlers, how will they react? How will it affect the efficiency of the other
products? How will it affect our forecasting accuracy of those products? I think
it’s a good system for eliminating transportation waste, but I’m not sure that it
won’t hurt the bottom line overall. We should at least see what the breakeven
point would be on all that equipment investment that would be required. And
while I think that the new pallet configuration is good, remember that we
currently use CHEP pallets, which are standardized and recycled through the
supply chain. If we make customized pallets, the total system might be less
efficient.
“You raise some good points,” said Valendorf. “Sounds like we need to sit down and consider
the impact of these potential changes more carefully. What have you found on the forecasting
side?”
Forecasting
Smith knew that Walmart had a powerful tool to improve its forecasting: its wealth of point-of-
sale (POS) data. He could use these data to improve forecasting for bottled water, but where
should he begin? With so many forecasting methodologies out there, which would make the
most sense in this case? Should forecasting be done at the store level and then rolled up to the
DCs? Or should it be done at the DC and then somehow allocated to the stores? One thing was
clear though: If he could make even a small improvement in this area, the implications for
Walmart, both financial and environmental, would be dramatic.
Store and DC replenishment both require forecasts. Most replenishment systems use time-series
forecasting methods, which assume an underlying demand pattern. The goal of time-series
methods is to see through any noise (e.g., random fluctuations in sales) to determine the
underlying pattern, which should include trends and/or seasonality in demand. In discussions
with Shirley Thomas, Smith considered the various ways to approach forecasting models. For
example, should the model would be top-down or bottom-up? “A top-down model looks at the
total demand for all the stores or DCs in the account in consideration and uses that forecast to
develop an order, then breaks that demand up into its parts for shipping,” Thomas explained. “A
bottom-up model estimates demand for each destination and sums all those individual demands
to build a forecast for production.” “But, which one is best?” Smith asked.

Bottled Water
Page 11
THOMAS: It depends in part on bullwhip. The bullwhip effect describes how
fluctuations in demand are amplified as you move upstream in the supply chain.
Moderate ups and downs in consumer demand are slightly exaggerated in store
orders, which are further exaggerated in DC orders.
SMITH: Aha! Then our problem is that the bullwhip is cracking every holiday in
the stores, and that’s generating some serious waste in the supply chain.
THOMAS: Exactly. But remember not every aspect of the bullwhip effect is
random or even faulty. Orders are placed to maximize transportation efficiency or
in accordance with other constraints. So sometimes the variation is generated
intentionally at the store or DC level, which means that if you only pay attention
to POS data you could be missing meaningful variation. But the rules about POS
versus orders data and top-down and bottom-up forecasts are only general
guidelines, and specific products can act differently.
SMITH: How so?
THOMAS: For instance, products with a high rate of sale usually are appropriate
for POS-based forecasting. However, if a product has a high bullwhip effect,
POS-based forecasts decrease in accuracy. Also, if the product moves through a
lot of non-turn volume, such as through special displays or promotions, that
decreases the accuracy of POS-based forecasts. And if a product has seasonal
demand, it further confounds short-term forecasts based on POS data.
SMITH: But that just begs more questions! In water, we have a fast-moving
consumer good, so it should be right for bottom-up POS-data forecasting. But it
may have some bullwhip effect, I know it has a lot of non-turn volume, and I
know it’s seasonal, though I’m not sure to what extent.
THOMAS: Well, I never said forecasting was going to be easy. But I think we can
get a handle on this issue if we dive into the POS data we have. It will help us
define all those parameters. But we need to keep in mind that our problem is not
just mathematical. Psychology and human error are involved, and whatever
solutions we find, we’ll have to be able to sell them to the store and DC managers.
SMITH: Time-series methods are easy to automate and easy to understand, and that
is why they are used. Certainly bottled water has trend and seasonal components.
But we also know that there are other factors that cause changes in demand for
bottled water, such as weather conditions. Like you say, we’re going to have to
take a much closer look at the data.
Bottled Water
Page 12
Questions to Consider
1. Given its aggressive sustainability mission, does it make sense for Walmart to be in the
business of selling bottled water? Why or why not?
2. What are the business implications of overestimating demand? What about
underestimating demand? Which of the two is more problematic for a manager? Does
your answer change at different echelons of the supply chain (e.g., DC vs. store)? How?
3. Should Walmart start bottling its Sam’s Choice and Great Value water at the DCs? What
are the pros and cons of this decision?
4. Will the pallet redesign suggested by Valendorf have a positive environmental impact?
What factors need to be considered in this decision?
5. What causal factors explain the most variation in bottled water sales in the past?
6. What time-series methods seem to perform best for predicting bottled water sales?

Bottled Water
Page 13
Exhibit 1.
Bottled Water
Page 14
Exhibit 2. Load and pallet characteristics of various pallet arrangements of PET and glass
water bottles.
Pallet height
(# 12-packs)
Pallet format
(# 12-packs
wide x long)
Product
hangs over
pallet edge
Bottles /pallet Bottles/van Load
Wt.(lbs.)
Pallets/load
Sin
gle
-Use
PE
T B
ott
les
7 4x6 No 2,016 60,480 40,170 30
5x5 No 2,100 63,000 41,767 30
4x7 Yes 2,352 70,560 46,557 30
5x6 Yes 2,520 70,560 46,433 28
9 4x6 No 2,592 72,576 47,710 28
5x5 No 2,700 72,900 47,854 27
4x7 Yes 3,024 72,576 47,464 24
5x6 Yes 3,240 71,280 46,519 22
11 4x6 No 3,168 72,864 47,584 23
5x5 No 3,300 72,600 47,355 22
4x7 Yes 3,696 70,224 45,665 19
5x6 Yes 3,960 71,280 46,272 18
Exhibit 3. Bottling Machinery Capacity, Size, and Cost
Capacity (bottles per hour)* Square feet needed Cost
4,000 405 $155,000
6,000 627 $180,000
10,000 836 $275,000
14,000 1,584 $430,000
*Machinery can function for an average of at least 20 hours per day.
Machinery includes purifier, blower, bottler, conveyor, boxer, and
shrink wrapper.

Bottled Water
Page 15
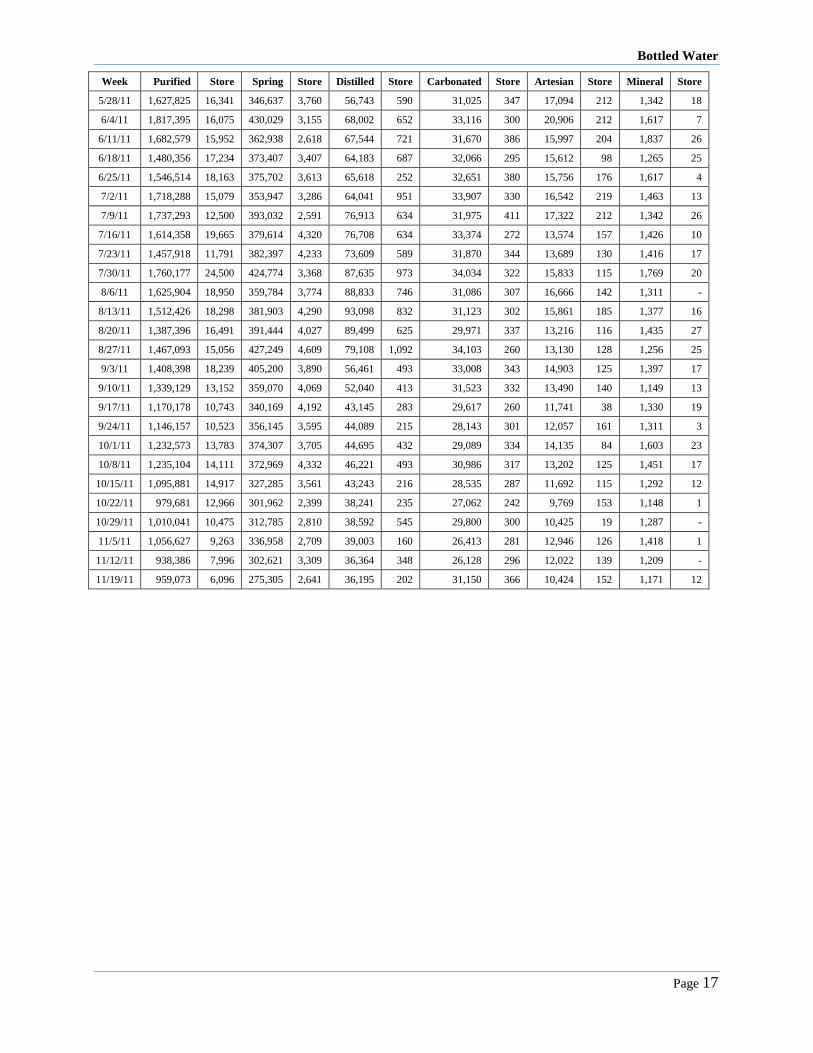
Exhibit 4. Water demand by week by product segment for all stores served by the
Clarksville, AR distribution center. (Note: The DC data is actual, but the store data is
simulated and represents an “average” store served by the distribution center.)
Week Purified Store Spring Store Distilled Store Carbonated Store Artesian Store Mineral Store
9/26/09 1,215,953 17,522 281,805 2,521 47,693 437 22,789 206 9,749 108 3,777 28
10/3/09 1,102,021 14,258 240,806 1,925 41,905 720 21,145 181 10,488 121 3,583 23
10/10/09 1,065,002 8,773 229,045 2,828 37,721 214 19,495 202 9,994 60 3,282 35
10/17/09 988,062 14,419 218,303 1,806 39,660 368 23,438 210 8,786 48 3,916 55
10/24/09 935,402 6,444 213,490 3,217 35,273 397 20,114 152 8,264 84 4,023 46
10/31/09 1,070,735 13,593 245,468 2,922 36,963 388 22,373 200 10,200 125 4,040 42
11/7/09 1,137,184 5,384 258,767 3,492 36,437 399 22,048 264 10,862 108 3,873 34
11/14/09 991,001 8,060 218,020 1,214 30,993 601 21,820 247 8,726 49 3,313 4
11/21/09 995,644 10,238 207,234 3,187 29,182 43 25,971 203 9,246 101 3,696 46
11/28/09 917,557 8,912 207,067 2,242 29,875 355 21,243 229 7,943 87 3,583 32
12/5/09 948,530 7,821 212,249 1,843 30,015 547 20,705 220 9,216 72 3,469 43
12/12/09 959,575 9,159 201,459 1,643 29,703 17 21,371 227 8,542 105 3,335 33
12/19/09 902,568 13,013 183,245 1,579 26,544 503 23,836 315 7,976 124 3,660 23
12/26/09 1,100,593 13,344 203,160 2,417 29,540 209 24,028 246 8,249 120 4,072 11
1/2/10 1,195,212 9,593 226,766 1,671 28,005 49 22,035 172 8,755 47 3,538 40
1/9/10 1,204,984 13,260 227,529 1,297 30,986 227 23,376 287 9,750 74 4,975 30
1/16/10 1,099,458 11,494 225,052 1,392 32,572 456 23,895 225 10,284 100 3,109 44
1/23/10 1,231,163 14,337 254,123 2,064 30,362 232 24,175 267 10,212 137 4,172 44
1/30/10 958,367 7,903 190,439 919 28,031 361 21,439 207 8,247 119 3,308 37
2/6/10 1,051,452 13,317 227,115 3,644 31,041 479 22,709 269 10,868 111 4,218 34
2/13/10 1,071,823 10,908 206,238 2,473 32,504 212 22,907 250 10,745 35 3,839 22
2/20/10 1,084,611 10,632 221,527 2,402 35,893 360 22,891 200 10,772 142 4,397 39
2/27/10 1,176,642 13,023 243,356 2,296 36,996 357 25,113 249 11,524 70 4,309 43
3/6/10 1,250,974 11,947 295,943 2,376 35,750 343 25,370 292 13,165 98 4,593 48
3/13/10 1,275,772 8,008 269,335 2,895 33,988 459 24,568 307 12,791 174 4,841 57
3/20/10 1,100,282 14,857 248,563 2,262 25,475 57 22,013 247 11,577 69 3,581 32
3/27/10 1,273,487 9,081 266,681 3,850 31,472 445 24,690 263 12,889 172 4,269 31
4/3/10 1,415,054 10,344 313,076 3,721 50,709 474 25,432 217 13,753 183 5,334 56
4/10/10 1,614,341 14,779 324,518 2,520 85,404 1,135 26,665 265 13,772 97 5,034 31
4/17/10 1,291,897 16,268 300,893 4,274 68,759 656 24,179 245 10,055 100 4,204 59
4/24/10 1,186,242 17,470 272,477 3,611 62,757 344 24,771 316 10,428 81 3,970 60
5/1/10 1,522,932 17,404 331,543 3,780 79,155 752 27,507 303 14,435 121 4,563 45
5/8/10 1,416,303 13,735 306,359 3,308 78,605 817 25,768 206 13,059 90 3,901 31
5/15/10 1,385,551 18,569 268,284 3,147 66,672 365 26,700 227 13,132 194 3,451 14
5/22/10 1,829,172 19,939 307,220 3,269 80,167 762 30,242 320 13,526 118 3,160 15
5/29/10 1,911,303 20,327 316,581 2,843 82,791 568 32,156 369 14,846 169 3,109 6
6/5/10 1,865,386 20,114 306,685 2,776 68,507 564 30,535 285 16,177 168 3,306 35
6/12/10 2,009,495 22,881 318,517 2,752 54,518 855 31,340 275 18,858 169 3,954 49
6/19/10 2,033,222 20,032 318,733 3,437 53,916 579 30,926 302 16,356 144 3,051 44
6/26/10 1,903,457 17,218 291,087 2,824 45,474 640 29,558 303 15,597 114 2,465 23
7/3/10 1,614,366 10,330 266,369 2,739 47,587 411 28,359 294 15,235 148 2,628 28
7/10/10 1,600,672 17,370 277,802 2,827 62,022 258 30,297 338 18,202 157 3,068 35

Bottled Water
Page 16
Week Purified Store Spring Store Distilled Store Carbonated Store Artesian Store Mineral Store
7/17/10 1,668,871 17,670 304,962 2,476 68,212 156 30,502 296 19,312 182 2,911 25
7/24/10 1,562,909 17,907 302,727 3,318 64,812 337 29,589 271 18,191 179 2,853 12
7/31/10 1,899,312 21,071 349,644 3,469 76,898 927 34,214 331 20,826 202 3,090 39
8/7/10 1,836,826 16,269 330,045 2,833 74,175 809 30,828 381 21,391 133 2,529 12
8/14/10 1,804,854 22,463 331,011 3,153 73,142 605 31,759 281 19,725 154 2,790 17
8/21/10 1,585,034 18,005 338,195 2,957 66,075 460 30,914 341 18,128 175 2,496 35
8/28/10 1,449,906 11,363 392,261 4,497 52,424 417 29,614 325 17,533 211 2,127 1
9/4/10 1,436,312 13,790 323,534 3,017 45,533 402 28,737 250 19,003 190 2,726 28
9/11/10 1,355,926 12,917 332,903 3,612 47,067 603 29,851 384 16,223 125 2,638 24
9/18/10 1,459,093 17,470 303,828 3,187 48,082 412 29,855 326 14,939 141 2,097 2
9/25/10 1,243,298 16,382 271,520 2,993 38,318 618 26,165 233 14,401 181 2,200 34
10/2/10 1,252,752 12,532 275,608 2,270 40,070 661 27,157 255 17,546 177 2,901 21
10/9/10 1,283,214 18,595 289,993 3,091 41,898 560 27,608 261 16,856 161 2,159 18
10/16/10 1,169,684 13,969 266,589 2,786 39,276 444 28,300 264 15,989 125 2,279 -
10/23/10 1,047,857 13,277 252,737 2,739 37,312 670 26,406 276 15,079 184 2,277 26
10/30/10 1,034,598 13,110 257,112 2,841 34,048 230 25,150 333 15,466 119 2,309 14
11/6/10 1,108,518 6,796 275,488 2,847 37,363 544 25,637 155 16,658 182 2,228 22
11/13/10 955,744 10,959 247,763 2,283 33,465 586 25,471 234 13,454 112 2,013 7
11/20/10 996,171 8,366 226,906 2,727 32,003 322 27,614 329 12,277 18 1,802 15
11/27/10 872,619 10,139 215,010 2,395 30,054 624 17,927 190 12,613 160 2,061 19
12/4/10 961,080 9,935 232,918 1,805 32,722 308 18,348 193 15,077 168 1,941 34
12/11/10 911,004 12,505 224,447 1,097 31,575 243 15,413 128 13,309 124 1,874 41
12/18/10 955,357 5,427 210,639 2,897 37,092 232 16,222 158 15,333 123 1,425 -
12/25/10 743,368 9,607 230,441 1,931 29,545 251 19,217 147 11,623 100 1,409 -
1/1/11 943,587 10,142 316,603 3,174 35,216 418 27,817 238 13,174 94 1,749 17
1/8/11 918,381 9,977 285,459 2,710 31,676 227 25,900 325 14,313 99 1,741 26
1/15/11 858,977 3,568 257,624 3,274 34,773 556 25,454 319 12,473 129 1,298 22
1/22/11 825,778 7,896 238,495 1,516 32,736 575 25,056 169 12,069 181 1,661 29
1/29/11 985,388 2,744 336,302 3,959 36,796 - 28,042 215 14,436 132 1,958 25
2/5/11 942,516 7,128 268,895 1,931 33,623 545 27,312 314 16,365 188 1,683 28
2/12/11 1,048,505 7,855 257,366 2,787 39,110 287 27,331 248 16,319 126 1,673 7
2/19/11 996,149 16,841 268,392 2,245 38,543 876 27,769 338 16,476 170 1,738 -
2/26/11 1,124,394 11,003 267,975 3,008 40,703 411 26,625 199 17,233 244 1,650 15
3/5/11 1,107,125 9,982 273,512 2,658 41,284 251 27,057 328 17,515 177 1,667 26
3/12/11 1,251,751 12,865 296,510 2,960 44,927 436 28,062 331 20,576 234 1,738 21
3/19/11 1,282,254 14,015 295,758 3,234 39,552 173 28,214 324 19,070 223 1,474 -
3/26/11 1,105,639 12,453 260,995 1,756 35,547 551 25,709 271 17,614 219 1,568 26
4/2/11 1,351,077 8,974 300,207 3,443 44,306 185 29,781 292 20,497 243 1,474 11
4/9/11 1,370,048 14,401 339,955 3,285 45,123 425 29,237 234 22,698 241 1,694 9
4/16/11 1,173,363 11,816 263,606 3,391 39,418 257 28,156 326 18,165 180 1,353 16
4/23/11 1,092,925 11,871 229,619 2,523 34,646 411 25,706 325 14,834 154 1,496 19
4/30/11 1,123,862 9,795 235,271 2,516 34,673 333 26,563 258 18,490 161 1,397 -
5/7/11 1,422,650 20,014 287,771 2,609 45,270 542 30,022 186 20,608 181 1,320 5
5/14/11 1,203,439 7,607 241,622 2,203 36,316 185 26,546 242 14,700 127 1,100 5
5/21/11 1,384,212 12,701 294,305 4,017 38,255 260 28,362 275 15,299 147 1,364 27
Bottled Water
Page 17
Week Purified Store Spring Store Distilled Store Carbonated Store Artesian Store Mineral Store
5/28/11 1,627,825 16,341 346,637 3,760 56,743 590 31,025 347 17,094 212 1,342 18
6/4/11 1,817,395 16,075 430,029 3,155 68,002 652 33,116 300 20,906 212 1,617 7
6/11/11 1,682,579 15,952 362,938 2,618 67,544 721 31,670 386 15,997 204 1,837 26
6/18/11 1,480,356 17,234 373,407 3,407 64,183 687 32,066 295 15,612 98 1,265 25
6/25/11 1,546,514 18,163 375,702 3,613 65,618 252 32,651 380 15,756 176 1,617 4
7/2/11 1,718,288 15,079 353,947 3,286 64,041 951 33,907 330 16,542 219 1,463 13
7/9/11 1,737,293 12,500 393,032 2,591 76,913 634 31,975 411 17,322 212 1,342 26
7/16/11 1,614,358 19,665 379,614 4,320 76,708 634 33,374 272 13,574 157 1,426 10
7/23/11 1,457,918 11,791 382,397 4,233 73,609 589 31,870 344 13,689 130 1,416 17
7/30/11 1,760,177 24,500 424,774 3,368 87,635 973 34,034 322 15,833 115 1,769 20
8/6/11 1,625,904 18,950 359,784 3,774 88,833 746 31,086 307 16,666 142 1,311 -
8/13/11 1,512,426 18,298 381,903 4,290 93,098 832 31,123 302 15,861 185 1,377 16
8/20/11 1,387,396 16,491 391,444 4,027 89,499 625 29,971 337 13,216 116 1,435 27
8/27/11 1,467,093 15,056 427,249 4,609 79,108 1,092 34,103 260 13,130 128 1,256 25
9/3/11 1,408,398 18,239 405,200 3,890 56,461 493 33,008 343 14,903 125 1,397 17
9/10/11 1,339,129 13,152 359,070 4,069 52,040 413 31,523 332 13,490 140 1,149 13
9/17/11 1,170,178 10,743 340,169 4,192 43,145 283 29,617 260 11,741 38 1,330 19
9/24/11 1,146,157 10,523 356,145 3,595 44,089 215 28,143 301 12,057 161 1,311 3
10/1/11 1,232,573 13,783 374,307 3,705 44,695 432 29,089 334 14,135 84 1,603 23
10/8/11 1,235,104 14,111 372,969 4,332 46,221 493 30,986 317 13,202 125 1,451 17
10/15/11 1,095,881 14,917 327,285 3,561 43,243 216 28,535 287 11,692 115 1,292 12
10/22/11 979,681 12,966 301,962 2,399 38,241 235 27,062 242 9,769 153 1,148 1
10/29/11 1,010,041 10,475 312,785 2,810 38,592 545 29,800 300 10,425 19 1,287 -
11/5/11 1,056,627 9,263 336,958 2,709 39,003 160 26,413 281 12,946 126 1,418 1
11/12/11 938,386 7,996 302,621 3,309 36,364 348 26,128 296 12,022 139 1,209 -
11/19/11 959,073 6,096 275,305 2,641 36,195 202 31,150 366 10,424 152 1,171 12

Bottled Water
Page 18
Exhibit 5. Weekly weather data for the Clarksville, Arkansas region.
Week Mean High Mean Mean Mean Low Total Precipitation
9/26/09 82.43 73.07 63.71 1.28
10/3/09 80.14 65.21 50.29 0.61
10/10/09 69.00 61.14 53.29 2.85
10/17/09 62.29 55.14 48.00 2.55
10/24/09 66.86 55.50 44.14 1.38
10/31/09 66.43 56.71 47.00 7.70
11/7/09 71.43 58.07 44.71 0.00
11/14/09 70.43 58.64 46.86 0.00
11/21/09 62.57 53.50 44.43 0.60
11/28/09 62.57 50.50 38.43 0.20
12/5/09 49.29 40.36 31.43 2.62
12/12/09 45.86 38.07 30.29 1.43
12/19/09 50.57 41.29 32.00 0.01
12/26/09 53.14 43.93 34.71 6.09
1/2/10 43.43 35.86 28.29 0.03
1/9/10 30.43 22.36 14.29 0.03
1/16/10 49.29 37.43 25.57 1.14
1/23/10 60.86 52.64 44.43 2.19
1/30/10 47.43 38.29 29.14 0.54
2/6/10 44.71 37.50 30.29 1.05
2/13/10 39.29 33.21 27.14 1.66
2/20/10 49.71 38.79 27.86 0.27
2/27/10 49.14 39.86 30.57 0.65
3/6/10 55.00 43.93 32.86 0.00
3/13/10 67.57 55.57 43.57 1.01
3/20/10 64.71 52.64 40.57 0.68
3/27/10 64.29 53.14 42.00 1.59
4/3/10 72.29 59.86 47.43 0.84
4/10/10 77.57 64.71 51.86 1.73
4/17/10 82.86 69.14 55.43 0.00
4/24/10 78.14 66.29 54.43 0.92
5/1/10 77.29 66.07 54.86 0.89
5/8/10 85.00 71.79 58.57 0.11
5/15/10 82.14 72.71 63.29 0.87
5/22/10 82.86 72.93 63.00 1.92
5/29/10 91.43 79.86 68.29 0.47
6/5/10 92.29 81.71 71.14 0.16
6/12/10 94.57 83.07 71.57 0.04
6/19/10 98.71 86.86 75.00 0.14
6/26/10 94.86 87.00 79.14 0.28
7/3/10 91.14 82.64 74.14 0.44
7/10/10 91.86 82.93 74.00 0.03
7/17/10 94.14 84.50 74.86 0.39
7/24/10 95.43 85.79 76.14 0.00

Bottled Water
Page 19
Week Mean High Mean Mean Mean Low Total Precipitation
7/31/10 93.29 84.71 76.14 0.88
8/7/10 97.43 87.64 77.86 2.29
8/14/10 97.00 88.07 79.14 0.00
8/21/10 95.29 85.71 76.14 0.83
8/28/10 91.14 79.29 67.43 0.00
9/4/10 87.29 77.64 68.00 0.06
9/11/10 89.14 79.36 69.57 0.63
9/18/10 93.43 78.79 64.14 0.20
9/25/10 93.71 80.50 67.29 0.00
10/2/10 81.29 66.57 51.86 0.00
10/9/10 79.57 64.50 49.43 0.00
10/16/10 81.86 66.64 51.43 0.00
10/23/10 80.71 67.79 54.86 0.14
10/30/10 77.00 63.57 50.14 0.53
11/6/10 64.71 54.71 44.71 2.18
11/13/10 71.14 58.14 45.14 0.00
11/20/10 55.86 48.43 41.00 1.24
11/27/10 65.71 56.71 47.71 0.26
12/4/10 52.86 42.86 32.86 3.12
12/11/10 45.86 36.43 27.00 0.00
12/18/10 42.86 35.14 27.43 0.25
12/25/10 57.75 46.00 34.25 0.00
1/1/11 59.00 46.75 34.50 1.02
1/8/11 45.57 38.07 30.57 0.16
1/15/11 35.14 29.71 24.29 0.82
1/22/11 46.00 39.07 32.14 0.48
1/29/11 53.43 44.00 34.57 0.67
2/5/11 48.57 39.21 29.86 2.11
2/12/11 39.14 29.57 20.00 0.29
2/19/11 69.43 59.29 49.14 0.00
2/26/11 68.29 54.93 41.57 0.95
3/5/11 68.29 52.93 37.57 1.73
3/12/11 61.00 50.86 40.71 0.49
3/19/11 64.29 54.29 44.29 0.43
3/26/11 71.00 58.29 45.57 0.00
4/2/11 58.29 50.29 42.29 0.50
4/9/11 80.14 67.43 54.71 0.82
4/16/11 77.29 66.21 55.14 1.85
4/23/11 77.00 66.79 56.57 2.54
4/30/11 78.14 68.43 58.71 6.22
5/7/11 70.43 61.29 52.14 2.60
5/14/11 83.29 72.29 61.29 1.04
5/21/11 78.00 67.71 57.43 0.00
5/28/11 82.00 74.29 66.57 0.91
6/4/11 93.71 82.71 71.71 0.00

Bottled Water
Page 20
Week Mean High Mean Mean Mean Low Total Precipitation
6/11/11 94.86 83.86 72.86 0.01
6/18/11 95.86 84.93 74.00 0.03
6/25/11 93.71 84.29 74.86 0.00
7/2/11 91.00 82.00 73.00 1.55
7/9/11 92.00 83.50 75.00 1.27
7/16/11 94.57 85.43 76.29 0.47
7/23/11 93.29 85.29 77.29 0.00
7/30/11 93.86 84.93 76.00 0.07
8/6/11 100.00 89.36 78.71 0.24
8/13/11 89.57 80.50 71.43 3.94
8/20/11 89.14 80.21 71.29 1.39
8/27/11 92.29 81.79 71.29 0.61
9/3/11 92.57 82.21 71.86 0.00
9/10/11 82.14 69.21 56.29 0.22
9/17/11 81.14 70.43 59.71 0.41
9/24/11 80.14 69.57 59.00 0.32
10/1/11 81.86 67.29 52.71 0.25
10/8/11 81.86 66.50 51.14 0.00
10/15/11 82.86 69.29 55.71 0.28
10/22/11 67.86 55.43 43.00 0.50
10/29/11 69.29 56.64 44.00 1.96
11/5/11 63.86 53.50 43.14 0.20
11/12/11 67.14 56.36 45.57 0.56
11/19/11 63.86 55.57 47.29 0.96

Bottled Water
Page 21
Exhibit 6. Segments, stock-keeping-units, and retail prices.
Segment Brand Size Per Unit Units Per Package Price Per Package
spring water evian 33.8 oz. 1 bottle $ 1.98
spring water evian 33.8 oz. 6 bottles $ 8.98
spring water Ozarka 16.9 oz. 28 bottles $ 3.98
spring water Ozarka 16.9 oz. 12 bottles $ 2.46
spring water Ozarka 8 oz. 12 bottles $ 2.00
spring water Ozarka 23.7 oz. 6 bottles $ 1.97
distilled water Glaceau smart water 20 oz. 6 bottles $ 5.48
distilled water Glaceau smart water 33.8 oz. 6 bottles $ 8.98
distilled water Glaceau smart water 33.8 oz. 1 bottle $ 1.58
Artesian water Fiji 11.15 oz. 6 bottles $ 4.98
Artesian water Fiji 16.9 oz. 6 bottles $ 5.98
Artesian water Fiji 33.8 oz. 6 bottles $ 10.48
Artesian water Fiji 33.8 oz. 1 bottle $ 1.83
mineral water Pellegrino 25.3 oz. 1 bottle $ 1.50
mineral water Pellegrino 8.45 oz. 6 bottles $ 4.28
mineral water Perrier 16.9 oz. 6 bottles $ 4.97
mineral water Perrier 25.3 oz. 1 bottle $ 1.50
mineral water Perrier 11.15 oz. 4 bottles $ 2.98
Carbonated Mixer 8.5 oz. 6 bottles $ 2.98
Carbonated Mixer 33.8 oz. 1 bottle $ 0.98
Carbonated Schweppes 33.8 oz. 1 bottle $ 1.00
Carbonated Mixer seltzer 33.8 oz. 1 bottle $ 0.98
Carbonated Mixer seltzer 8.5 oz. 6 bottles $ 2.98
Carbonated Vintage seltzer 33.8 oz. 1 bottle $ 0.64
purified drinking water Aquafina 16.9 oz. 24 bottles $ 4.98
purified drinking water Aquafina 24 oz. 6 bottles $ 2.98
purified drinking water Aquafina 16.9 oz. 12 bottles $ 3.48
purified drinking water Dasani 16.9 oz. 24 bottles $ 4.48
purified drinking water Dasani 12 oz. 8 bottles $ 2.98
purified drinking water Great Value 16.9 oz. 35 bottles $ 3.68
purified drinking water Nestlé 16.9 oz. 24 bottles $ 3.98
purified drinking water Nestlé 8 oz. 12 bottles $ 1.88
purified drinking water Nestlé 16.9 oz. 12 bottles $ 2.48
purified drinking water Sam's Choice 20 oz. 28 bottles $ 4.48
purified drinking water Sam's Choice 10 oz. 15 bottles $ 2.00

Bottled Water
Page 22
Endnotes
i Olson, E.D. “Bottled Water: Pure Drink or Pure Hype?” National Resources Defense Council. April, 1999.
ii Rodwan, John G., Jr. “Challenging Circumstances Persist: Future Growth Anticipated.” Bottled Water Reporter.
April/May 2010.
iii Fishman, Charles. “Message in a Bottle.” Fast Company, July 7, 2007. Accessed February 7, 2012, from
http://www.fastcompany.com/magazine/117/features-message-in-a-bottle.html.
iv The health advantages of bottled water compared with municipal water sources have been the subject of nearly
constant debate. Bottled water can come from either municipal water sources or springs. Regardless of the
source, the U.S. FDA requires bottled water producers to sanitize and purify their products prior to bottling.
But the FDA does not require bottle water producers to identify contaminants, whereas municipalities are
required to do so.
v Nestle Waters North America, “Environmental Life Cycle Assessment of Drinking Water Alternatives and
Consumer Beverage Consumption in North America,” 2010. Accessed September 24, 2011, from
http://beveragelcafootprint.com/.
vi Scott, Lee. “Twenty-First Century Leadership,” October 24, 2005. Bentonville, Arkansas.
vii Ranade, Sudhanshu. “Satellite Adds Speed to Wal-Mart,” The Hindu Business Line, July 17, 2005.
viii Terreri, April. “Shippers Are Adding Private Fleets to Their Transportation Mix,” World Trade, February 1,
2006, p. 100.
ixRand Waddoups. Personal interview. July 6, 2011. Bentonville, Arkansas.
x Barbaro, M. “The Energy Challenge: Wal-Mart Puts Some Muscle Behind Power-Sipping Bulbs,” The New York
Times, January 2, 2007. Available at http://www.nytimes.com/2007/01/02/business/02bulb.html.
xi Scott, op. cit.
xii Fishman, op. cit.
xiii See http://www.foodandwaterwatch.org/pressreleases/fiji-water-bottling-the-myth-of-sustainability/. Fiji Water
responded vigorously to these attacks on its sustainability. See for example
http://www.environmentalleader.com/2007/11/07/fiji-water-to-go-carbon-negative/.
xiv Fishman, op. cit.
xv Environmental Working Group, “Bottled Water Quality Investigation: 10 Major Brands, 38 Pollutants,” 2008.
Available at: http://www.ewg.org/book/export/html/27010.
xvi Natural Resources Defense Council, “Bottled Water: Pure Drink or Pure Hype?” 2008: Available at;
http://www.nrdc.org/water/drinking/qbw.asp..
xvii Ibid.
xviii Gashler, K., “Thirst for Bottled Water Unleashes Flood of Environmental Concerns” Ithaca Journal, June 7,
2007. Also available at: http://usatoday30.usatoday.com/news/nation/environment/2008-06-07-bottled-
water_N.htm.