the visitor experience in britain · 2 contents 1. introduction 2. summary 3. britain’s welcome...
TRANSCRIPT

1
The Visitor Experience in BritainWelcome, Expectations, Satisfaction & Recommendation
Foresight – issue 154
VisitBritain Research

2
Contents
1. Introduction
2. Summary
3. Britain’s Welcome (CAA Passenger Survey)
– Trend 2009-2016, Markets
4. Expectations (CAA Passenger Survey)
– Markets & by Welcome Score
5. Satisfaction with various aspects of trip to Britain (IPS)
– Attractions / Activities, Transport, Food & Drink, Value for money
– Markets, Age, Gender, Region, Journey Purpose
6. Recommendation of Britain as a destination (IPS)
– Markets, Age, Gender, Region, Journey Purpose

3
Introduction
This report is based on questions VisitBritain has sponsored on two surveys of departing
visitors to the UK.
The Civil Aviation Authority (CAA) conducts a passenger survey among leisure visitors
at UK airports each year. In 2016 the survey was conducted at the following 5 UK
airports, Gatwick, Heathrow, Luton, Stansted and Manchester. VisitBritain sponsors
some additional questions on the survey to gain a greater understanding of Britain’s
visitors. In 2015 we asked questions about how welcome visitors felt and how different
trip elements met their expectations. In 2016 we repeated the welcome question.
VisitBritain also sponsors a number of questions each year on the International
Passenger Survey to gain a greater understanding of Britain’s visitors. This survey is
conducted at dozens of ports of exit from the UK (air, sea and rail). In 2015 VisitBritain
asked a question about the likelihood of departing visitors to recommend a visit to
Britain to friends and family. Visitors were also asked about their satisfaction with four
main trip elements: attractions & activities, public transport, food & drink and value for
money.

4
Summary – Welcome & Expectations
Welcome
• Overall, visitors to the UK in 2016 felt a high level of welcome during their visit
– 88% said they felt extremely or very welcome
– The highest proportion who felt extremely welcome was amongst US visitors
Expectations
• Overall, 52% said that the overall enjoyment of their trip exceeded expectations and only 1% that
it was below expectations.
• Looking at individual aspects of visitors’ trips, the quality of tourist attractions were most likely to
exceed expectations with 58% pleasantly surprised
• At the other end of the scale, provision of sights and information in visitors native language fell
below expectations for 39% of those from non English speaking countries
– Finding signs and information in their own language was a particular issue for around half of
visitors from Finland, France, Japan, Netherlands, Spain and Sweden
• Ease of driving and finding food that appealed were two other areas for which visitors were less
likely to say their expectations were exceeded.
• Those who felt extremely or very welcome during their trip were more likely to say that their
overall enjoyment of their trip exceeded expectations.

5
Summary – Satisfaction & Recommendation
Satisfaction
• Attractions / activities and public transport are the trip elements in Britain that deliver the strongest
levels of satisfaction amongst visitors to the UK. 92% were satisfied and 63% very satisfied with
attractions/activities; 88% were satisfied and 58% very satisfied with public transport.
• Overall satisfaction of Britain’s food & drink was 78% although a lower 39% were very satisfied.
Value for money proved the most disappointing of these trip elements (41% were satisfied).
Recommendation
• Overall, 95% of visitors to the UK are likely to recommend Britain to friends and family
– 69% say they are ‘extremely likely’ to recommend a visit to Britain to their friends and family
– Women are more likely to recommend Britain over men and recommendation was also high
amongst older age groups
– In general, visitors from long-haul markets and those from primarily English speaking
markets are more likely to strongly recommend Britain vs short-haul and non-English
speaking countries.
– The highest level of recommendation scores come from those that visited Britain for VFR or
holiday purposes while those on business are less likely to recommend a visit to Britain.

6
Britain’s welcome
Footer

7
Britain’s welcome
Almost two fifths said they felt ‘extremely welcome’ in Britain in 2016, and a further 49%
said ‘very welcome’. Overall, visitors to Britain are experiencing high levels of welcome,
and this has risen during this decade.
Source: CAA Passenger Study 2016, Q: “How welcome did you feel in Britain?”
Base: leisure visitors. 2010=7,876, 2011=7,305, 2012=7,583, 2014=5,093, 2015=4,346, 2016=8,393
26% 28% 30%42% 35% 39%
55% 53% 54%47%
51% 49%
16% 16% 15% 10% 12% 12%
Level of ‘welcome’ felt in Britain
Not at allwelcome
Not verywelcome
Quitewelcome
Verywelcome
Extremelywelcome
81% 82% 84% 86%89%
2010 2011 2012 2014 2015 2016
% Extremely & Very Welcome =
88%

8
Britain’s WelcomeMarket breakdown
Among all markets there were very few who felt unwelcome during their trip to Britain. However, there
were a few nations where there are lower levels of welcome – such as China, UAE and South Africa.
In terms of nations who felt most welcome during their stay, USA, Spain, Brazil and Denmark have
the highest proportion who felt ‘extremely welcome’.
Source: CAA Passenger Study 2016, Q: “How welcome did you feel in Britain?”
Base: leisure visitors. Base=8,393.
Australia=486, Austria= 96, Brazil=68, Canada=474, China=77, Cyprus=50, Denmark=234, Finland=73, France=312, Germany=628, Greece=62,
Hungary=59, India=92, Ireland=331. Israel=115, Italy=511, Japan=66, Netherlands=205, New Zealand=108, Norway=222, Poland=226, Portugal=97,
Romania=92, South Africa=62, Spain=490, Sweden=270, Switzerland=184, Turkey=53, UAE=71, USA=1,595, Total=8,393
35% 32%45% 41% 32% 35%
45%35% 41% 35% 36% 43%
30% 30% 36% 42%25% 27% 35% 43% 35% 43%
31% 29%48% 43% 41% 37%
27%50%
39%
44% 53%45% 47%
43% 43%42% 61% 46% 56%
41%45%
60% 62% 45%46%
65% 62% 43%47%
51% 35% 56%47%
42% 51% 52% 56%
48%
41%49%
19% 11% 10% 11%25% 18%
13% 2% 13% 10%22%
9% 10% 7%19% 12% 9% 12%
20%10% 13% 21% 13%
24%10% 6% 8% 7%
24%8% 12%
“How welcome did you feel in Britain?”
Extremely welcome Very welcome Quite welcome Not very welcome Not at all welcome

9
Expectations of trip
elements
Footer Thursday, December 21,

10
Expectations of visit attributes
The UK’s quality of tourist
attractions exceeded expectations
for 58% of visitors. The friendliness
of British people and overall visit
enjoyment also exceeded
expectations for over half.
Some improvement could be given
to providing signs and information
in more languages, as this fell
below expectations for almost four
in ten from non English speaking
markets.
The attributes which were the
strongest drivers of visitors’ “overall
enjoyment of visit” exceeding
expectations were
signs/information in own language
and ease of driving (amongst those
for whom this applied).
Source: CAA Passenger Study 2015, Q: “Did the following exceed, meet or fall below your expectations?”
Base: Total = 4,346 leisure visitors. “Ease of driving” only relevant to 603 respondents. “Signs and information for visitors in your own language”
score is among visitors from non English speaking countries.
3%
2%
1%
7%
6%
9%
4%
9%
4%
7%
10%
39%
40%
44%
47%
48%
55%
53%
60%
57%
63%
61%
65%
44%
58%
54%
52%
45%
39%
38%
36%
34%
34%
33%
25%
17%
Below expectations
Met expectations
Exceeded expectations
Quality of tourist attractions
(e.g. museum)
Friendliness of British people
Overall enjoyment of your visit
Ease of travelling around
using public transport
Customer service at
accommodation
Weather
Signs and information for
visitors in English
Quality of hotel / paid for
accommodation
Customer service at
restaurants / cafes / pubs
Ease of finding the type of food
you wanted to eat
Ease of driving
Signs and information for
visitors in your language

11
Signs and info in own language
The provision of signs and information in different languages is an
area that falls short of expectations for many non-English speaking
markets.
Over half of visitors from China, Finland, France and Japan, and
close to half from Sweden, Spain and the Netherlands felt that their
expectations were not met. This is an area that could be improved
upon for future visitors.
Source: CAA Passenger Study 2015, Q: “Did the following exceed, meet or fall below your expectations?”
Base: Total = 2,720 leisure visitors
5%14%
6% 11%20%
13% 9%3%
13%19% 23% 27%
20%13%
21%
51%
52%
42% 38%
48%
42%40% 49%
47%48%
32%
52%
33%39%
45%
44%34%
52% 51%
32%45%
51% 49%40%
34%45%
21%
48% 49%34%
Bra
zil
Den
ma
rk
Fin
land
Fra
nce
Ge
rma
ny
Italy
Jap
an
Neth
erl
an
ds
Norw
ay
Po
lan
d
Po
rtug
al
Sa
ud
i A
rab
ia
Sp
ain
Sw
ed
en
Sw
itze
rlan
d
Exceeded expectations Met expectations Below expectations
…fell below
expectations
for 39%

12
Overall enjoyment of visitBy level of welcome
46%54%
1%
Felt very welcome
37%
61%
2%
Felt quite welcome
13%
69%
17%
Felt not very, or not at all welcome
Exceed expectations Meet expectations Fall below expectations
Whilst the proportion of visitors who felt unwelcome during their visit to the UK is very small, the
level of welcome felt does have a direct impact on the overall enjoyment of their visit.
Those who felt extremely or very welcome during their trip are more likely to say that the overall
enjoyment they felt exceed their expectations, compared to those who felt ‘quite welcome’. Two
thirds of those who did not feel welcome said that their overall enjoyment met expectations, but a
sixth said that it fell below what they had hoped.
Source: CAA Passenger Study 2015, Q: “Did the following exceed, meet or fall below your expectations?”
Base: leisure visitors. Felt extremely welcome=1,566, Felt very welcome=2165, Felt quite welcome=519, Felt not very, or not at all welcome=52
Did your overall enjoyment of your visit…?
68%
31%
Felt extremely
welcome

13
The friendliness of British exceeded
expectations for many in the USA (60%)
and Canada (45%). However, a higher
proportion (22%) than average of those in
Brazil felt this did not meet their
expectations.
Fewer than half of those from Brazil said
that their overall enjoyment exceeded
expectations, and the lack of signs or
information in Portuguese may have also
had an impact here.
Overall enjoyment of the trip was just above
the global average for visitors from the USA
and Canada, and just below for Brazilian
visitors.
USA
Overall enjoyment = 56% exceeded expectations
% Exceeded % Fell below
Friendliness of British 60%
Quality of tourist attractions 58%
Ease of driving 15%
Quality of accommodation 8%
ExpectationsAmericas market highlights
Canada
Overall enjoyment = 54% exceeded expectations
% Exceeded % Fell below
Quality of tourist attractions 62%
Friendliness of British 45%
Weather 11%
Quality of accommodation 8%
Ease of finding food you wanted 7%
Brazil
Overall enjoyment = 47% exceeded expectations
% Exceeded % Fell below
Ease of travel 57%
Quality of tourist attractions 44%
Signs/info in own language 44%
Friendliness of British 22%
Source: CAA Passenger Study 2015, Q “Did the following elements exceed, meet or fall below your expectations?”
Base: leisure visitors. Brazil=39, Canada=245, USA=719

14
Overall enjoyment of the trip exceeded
expectations for over half in Denmark and
Sweden. Enjoyment was below average
for Norway, although other areas did
exceed expectations for this market, such
as friendliness of British and English signs
and information.
The quality of tourist attractions was a key
driver of exceeding expectations for
travellers from Denmark and Sweden.
For Denmark and Sweden, signs and
information in native languages fell below
expectations for many, and the quality of
accommodation was not up to
expectations for some visitors from Norway
and Denmark.
Norway
Overall enjoyment = 43% exceeded expectations
% Exceeded % Fell below
Friendliness of British 56%
Signs and info in English 51%
Signs/info in own language 13%
Quality of accommodation 14%
ExpectationsNordic market highlights
Denmark
Overall enjoyment = 55% exceeded expectations
% Exceeded % Fell below
Quality of tourist attractions 68%
Friendliness of British 58%
Signs/info in own language 34%
Quality of accommodation 12%
Sweden
Overall enjoyment = 56% exceeded expectations
% Exceeded % Fell below
Quality of tourist attractions 51%
Friendliness of British 49%
Signs/info in own language 49%
Weather 13%
Source: CAA Passenger Study 2015, Q “Did the following elements exceed, meet or fall below your expectations?”
Base: leisure visitors. Denmark=117, Norway=114, Sweden=151

15
France
Overall enjoyment = 48% exceeded expectations
% Exceeded % Fell below
Quality of tourist attractions 56%
Friendliness of British 56%
Signs/info in own language 51%
Weather 22%
Ease of finding food 20%
Germany
Overall enjoyment = 52% exceeded expectations
% Exceeded % Fell below
Friendliness of British 60%
Quality of tourist attractions 59%
Signs/info in own language 32%
Quality of accommodation 19%
Ireland
Overall enjoyment = 66% exceeded expectations
% Exceeded % Fell below
Quality of tourist attractions 59%
Ease of travel 48%
Weather 10%
Customer service 5%
Italy
Overall enjoyment = 51% exceeded expectations
% Exceeded % Fell below
Quality of tourist attractions 39%
Ease of travel 37%
Signs/info in own language 45%
Weather 12%
Quality of accommodation 12%
Overall trip enjoyment exceeded
expectations for two thirds of visitors from
Ireland, more than any other European
nation surveyed. There was high positivity
from Ireland across many attributes; the
weather was the only area to fall below
expectations for as much as 10%.
Many from France felt that the food and
also the weather were issues and around
half said that signs/information provided in
French were below expectations.
For all non English-speaking European
markets the provision of information in
multiple languages often fell below
expectations, and for Italy and especially
Germany the quality of accommodation
was not up to standard for some.
ExpectationsEurope market highlights (1/2)
Source: CAA Passenger Study 2015, Q “Did the following elements exceed, meet or fall below your expectations?”
Base: leisure visitors. France=177, Germany=336, Ireland=165, Italy=243

16
Poland
Overall enjoyment = 59% exceeded expectations
% Exceeded % Fell below
Friendliness of British 68%
Quality of tourist attractions 68%
Signs/info in own language 34%
Weather 8%
Netherlands
Overall enjoyment = 48% exceeded expectations
% Exceeded % Fell below
Friendliness of British 53%
Signs and info in English 52%
Signs/info in own language 49%
Quality of accommodation 6%
Ease of travel 6%
Switzerland
Overall enjoyment = 51% exceeded expectations
% Exceeded % Fell below
Quality of tourist attractions 65%
Friendliness of British 59%
Signs/info in own language 34%Ease of travel 11%
Weather 11%
Spain
Overall enjoyment = 51% exceeded expectations
% Exceeded % Fell below
Quality of tourist attractions 67%
Friendliness of British 52%
Signs/info in own language 48%
Ease of travel 17%
Overall, the friendliness of the British, and
the quality of tourist attractions were most
likely to have exceeded expectations
amongst travellers from these markets.
Again, the provision of signs in visitors’
native languages is an issue for all non-
English speaking European markets.
Ease of travel, quality of accommodation
and weather are also cited by some as
areas that fall below expectations.
ExpectationsEurope market highlights (2/2)
Source: CAA Passenger Study 2015, Q “Did the following elements exceed, meet or fall below your expectations?”
Base: leisure visitors. Netherlands=103, Poland=126, Spain=202, Switzerland=82

17
India
Overall enjoyment = 42% exceeded expectations
% Exceeded % Fell below
Weather 44%
Quality of tourist attractions 42%
Signs/info in own language 20%
Ease of finding food 10%
Australia
Overall enjoyment = 52% exceeded expectations
% Exceeded % Fell below
Quality of tourist attractions 58%
Ease of travel 49%
Ease of driving 10%
Weather 8%
New Zealand
Overall enjoyment = 49% exceeded expectations
% Exceeded % Fell below
Friendliness of British 77%
Ease of travel 66%
Ease of finding food 20%
Customer service 5%
Ease of travelling throughout the UK
exceeded expectations for two thirds from
New Zealand and half from Australia. The
weather was a positive for many from
India, matching findings in other recent
VisitBritain research.
On the negative side, signs/info in own
language was an issue for a fifth from
India, and the ease of finding food they
wanted a negative for 10% - this was also
an issue for 20% from New Zealand.
Some Australian travellers found the ease
of driving below their expectations.
A majority of Saudi visitors rated tourist
attractions and customer service in
accommodation better than expectations.
ExpectationsRest of world market highlights
Source: CAA Passenger Study 2015, Q “Did the following elements exceed, meet or fall below your expectations?”
Base: leisure visitors. Australia=338, India=84, New Zealand=50, Saudi Arabia=43
Saudi Arabia
Overall enjoyment = 50% exceeded expectations
% Exceeded % Fell below
Quality of tourist attractions 61%
Customer service in accom 61%
Signs/info in own language 21%
Weather 8%

18
Satisfaction with different
aspects of a trip to Britain
Footer
19
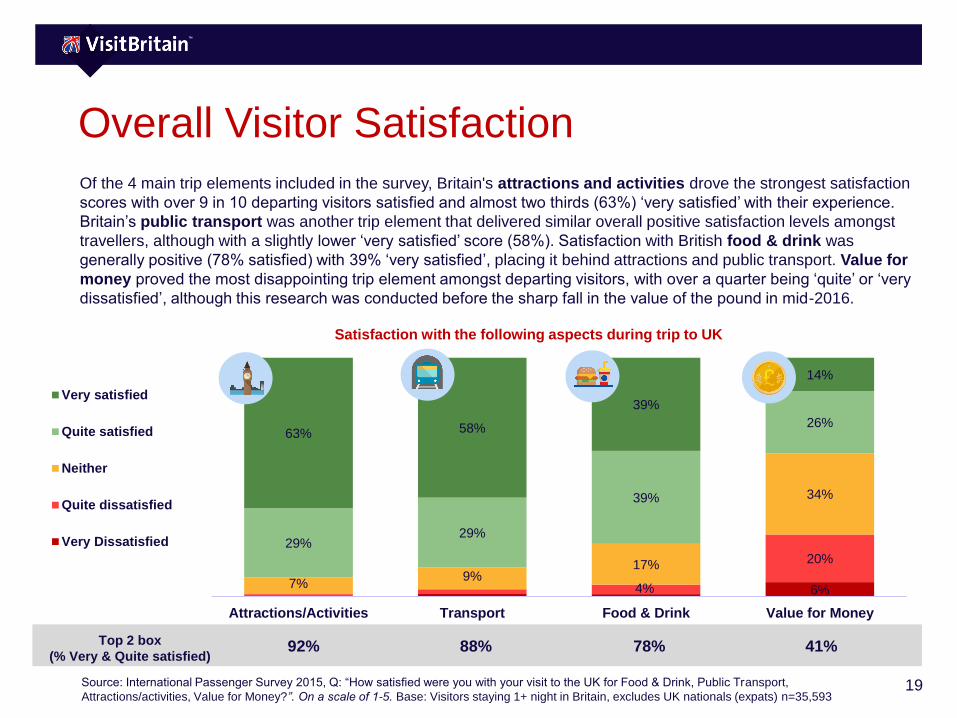
Overall Visitor Satisfaction
Of the 4 main trip elements included in the survey, Britain's attractions and activities drove the strongest satisfaction
scores with over 9 in 10 departing visitors satisfied and almost two thirds (63%) ‘very satisfied’ with their experience.
Britain’s public transport was another trip element that delivered similar overall positive satisfaction levels amongst
travellers, although with a slightly lower ‘very satisfied’ score (58%). Satisfaction with British food & drink was
generally positive (78% satisfied) with 39% ‘very satisfied’, placing it behind attractions and public transport. Value for
money proved the most disappointing trip element amongst departing visitors, with over a quarter being ‘quite’ or ‘very
dissatisfied’, although this research was conducted before the sharp fall in the value of the pound in mid-2016.
Source: International Passenger Survey 2015, Q: “How satisfied were you with your visit to the UK for Food & Drink, Public Transport,
Attractions/activities, Value for Money?”. On a scale of 1-5. Base: Visitors staying 1+ night in Britain, excludes UK nationals (expats) n=35,593
6%4%
20%
7%9%
17%
34%
29%29%
39%
26%63% 58%
39%
14%
Attractions/Activities Transport Food & Drink Value for Money
92% 88% 78% 41%
Very satisfied
Quite satisfied
Neither
Quite dissatisfied
Very Dissatisfied
Satisfaction with the following aspects during trip to UK
Top 2 box
(% Very & Quite satisfied)

20
Visitor satisfaction Trip Purpose
Visitors who have primarily visited Britain to visit friends and relatives (VFR) have a higher propensity to be very
satisfied with value for money and with food & drink – this score likely to be driven by local and personal
recommendations for good eating and drinking choices. Holiday visitors are particularly satisfied by Britain's
attractions and public transport. Business visitors have the lowest levels of satisfaction, significantly under-indexing
across all categories except for value for money.
Source: International Passenger Survey 2015, Q: “How satisfied were you with your visit to the UK for Food & Drink, Public Transport,
Attractions/activities, Value for Money?”. On a scale of 1-5. Base: Visitors staying 1+ night in Britain, excludes UK nationals (expats) n=35,593
10%17%
12%14%
28%
46%
33%39%
56%59%51%
62%56%
64%55%
66%
20%
26%29%25%
32%
36%
42%39%
28%29%
34%
28%35%27%
32%
29%
36%
33%36%34%
27%
14%18%17%
12%9%11%
8%8%8%11%5%
24%
19%18%21%
9%10%5%6%6%3%
V - StuV - VFR V - BusV - HolF - StuF - VFRF - BusF - HolT - StuT - VFRT - BusT - HolStudyVFRBusinessHoliday
Very satisfied Quite satisfied Quite dissatisfied Very Dissatisfied
Attractions Transport Food & drink Value for Money

21
66%
63%
62%
60%
66%
63%
26%
29%
30%
31%
27%
29%
55+
35 - 54
16 - 34
Female
Male
Average
61%
59%
57%
57%
60%
58%
28%
29%
30%
31%
28%
29%
55+
35 - 54
16 - 34
Female
Male
Average
45%
40%
37%
38%
41%
39%
37%
39%
39%
40%
38%
39%
55+
35 - 54
16 - 34
Female
Male
Average
17%
14%
13%
14%
15%
14%
26%
26%
26%
27%
25%
26%
55+
35 - 54
16 - 34
Female
Male
Average
Visitor satisfaction Gender and Age
Men are slightly more likely to be very satisfied generally with Britain’s trip elements, especially for attractions.
Satisfaction levels also tend to be linked to age, with the proportion of those reporting themselves very satisfied
increasing with visitor age across all four dimensions.
Source: International Passenger Survey 2015, Q: “How satisfied were you with your visit to the UK for Food & Drink, Public Transport,
Attractions/activities, Value for Money?”. On a scale of 1-5. Base: Visitors staying 1+ night in Britain, excludes UK nationals (expats) n=35,593
Attractions Transport Food & drink Value for Money

22
Visitor satisfactionMarkets
There are a few markets that generally exceed the global average of satisfaction levels for all listed trip elements in
Britain, including the Americas (USA, Brazil, Canada) and Saudi Arabia. Conversely, several European markets,
such as France, Germany, Spain, Netherlands and Belgium, report a lower than average level of satisfaction
across the board. Some other long-haul markets such as Japan and Hong Kong also give lower satisfaction scores.
While the Chinese give Britain above-average score for value for money, and their experience of attractions and
activities is favourable, their satisfaction levels of Britain’s public transport and food & drink are lower than average.
Italy’s scores are also mixed, reporting low satisfaction with Britain’s food & drink and value for money but above
average for public transport and attractions.
Source: International Passenger Survey 2015, Q: “How satisfied were you with your visit to the UK for Food & Drink, Public Transport,
Attractions/activities, Value for Money?”. On a scale of 1-5. Base: Visitors staying 1+ night in Britain, excludes UK nationals (expats) n=35,593
AU
S
BE
LG
BR
AZ
CA
N
CH
I
DE
N
FR
A
GE
R
HK
IND
IA
IRE
ITA
JA
P
NE
TH
NZ
NO
R
PO
L
PO
R
RU
S
SA
U
SIN
G
SA
F
S.K
.
SP
A
SW
E
SW
I
TU
R
UA
E
US
A
TO
T
Attractions 67% 51% 78%70% 64% 67% 52% 60%49%65%66% 68%59%51% 61% 67%68% 75% 80% 73% 55% 70% 71%61% 61% 57% 65% 67% 74% 63%
Transport 62% 50% 79%68% 51% 57% 47% 51%33%70%64% 71%38%47% 69% 55%63% 64% 65% 74% 48% 72% 63%52% 54% 46% 67% 67% 69% 58%
Food & Drink 43% 29% 55%52% 34% 44% 29% 34%30%50%50% 26%34%33% 49% 47%40% 31% 56% 60% 38% 55% 33%25% 36% 41% 41% 60% 53% 39%
Value for
Money15% 10% 15%15% 22% 25% 11% 7% 12%20%18% 9% 12%11% 16% 26%18% 10% 25% 28% 11% 14% 24% 8% 15% 17% 14% 25% 20% 14%
Level of Satisfaction (% very satisfied)

23
MarketAttraction/
Activities
Public
Transport
Food &
Drink
Value for
money
UK Average 65% 62% 39% 14%
LONDON 68% 64% 39% 13%
NORTH EAST 52% 58% 34% 20%
NORTH WEST 63% 54% 41% 22%
YORKSHIRE 62% 47% 35% 22%
WEST MIDLANDS 62% 50% 40% 13%
EAST MIDLANDS 62% 62% 33% 18%
EAST OF ENGLAND 56% 52% 36% 12%
SOUTH WEST 50% 43% 36% 11%
SOUTH EAST 53% 51% 31% 10%
SCOTLAND 66% 61% 48% 23%
WALES 54% 48% 35% 23%
Visitor satisfactionBy region
Here we look at how satisfaction with different
trip elements varies by which region of the UK
was visited, among those visiting for holidays
only. As some visitors stayed in multiple
regions, the data is based on the region each
visitor first stayed in.
Scotland is a clear winner when it comes to
satisfaction with food and drink and also
outperforms the UK average for value for
money.
London scores highest for attractions and
public transport amongst holiday visitors, while
value for money is below average.
The is a clear North-South divide on value for
money perceptions with the North East, North
West and Yorkshire, as well as Scotland and
Wales, above average.
Source: International Passenger Survey 2015, Q: “How satisfied were you with your visit to the UK for Food & Drink, Public Transport,
Attractions/activities, Value for Money?”. On a scale of 1-5. Base: Holiday visitors staying 1+ night in Britain, excludes UK nationals (expats).
Level of Satisfaction (% very satisfied)
Holiday Visits Only

24
Recommending Britain
Footer

25
The Influence of Recommendation
A survey commissioned by VisitBritain in 2016 found that globally, the strongest influence for
destination choice is word of mouth recommendation, with talking to friends, family or colleagues key
for 40% of considerers and visitors to Britain. The power of recommendation from those you trust is
the top influencer across all age groups and for both men and women.
The likelihood for visitors of Britain to recommend a visit to the UK to friends and family is therefore
an important metric to measure and understand.
Source: VisitBritain/Ipsos, 2016. Q: “(Visitors) Thinking about your holiday to Britain, which of the following information sources influenced your choice
of destination? (Considerers) Thinking about the last holiday you took to a foreign country, which of the following information sources influenced your
choice of destination? Base: 11,400 respondents in 20 markets.
33%
31%
30%
26%
26%
Search engines
Price comparison sites
Traveller review sites
Friend / family on socialnetworks
Accomodation / hotel website
Top 5 online influences
40%
25%
19%
18%
17%
Talking to friends / family
Travel guidebooks
Travel TV programs
Travel / tour operatorbrochure
Official tourist brochure
Top 5 offline influences

26
Recommending Britain
When asked on departure, over two thirds of visitors in 2015 said they were ‘extremely
likely’ to recommend a visit to Britain to their friends and family, while a further 26% said
they were ‘likely’ to recommend a visit. The combined positive intention to recommend
equates to 95%, a very favourable result overall.
Source: International Passenger Survey 2015, Q: “How likely are you to recommend a visit to the UK to friends and family?”
Base: Visitors staying 1+ night in Britain, excludes UK nationals (expats) and Don’t know/refused responses n=35,593
4% 26% 69%
Visitors’ Likelihood to Recommend Britain
Not likely at all Not likely Neutral Likely Extremely likely
% Extremely & Very Likely:
95%

27
Recommending BritainMarket highlights
Visitors from long-haul markets are more likely to strongly recommend Britain, with 3 in
4 saying they are likely to do so compared to an average score of 67% from short-haul
markets.
Similarly, visitors from markets which have English as its primary language have a
higher likelihood to strongly recommend Britain to their peers (74%), compared to non-
English speaking countries (67%).
Source: International Passenger Survey 2015, Q: “How likely are you to recommend a visit to the UK to friends and family?”
Base: Visitors staying 1+ night in Britain, excludes UK nationals (expats) n=35,593. Short Haul = All European markets, Long Haul = Rest of world,
English Speaking countries = AUS, NZ, SAF, USA, CAN and IRE
89% of
those
from
67% of those from
Short-haul markets
75% of those from
Long-haul markets
Extremely likely
to recommend:
89% of
those
from
67% of those from
non English-
speaking countries
74% of those from
English-speaking
countries
Extremely likely
to recommend:

28
Recommending BritainMarket highlights (holiday visitors only)
In terms of nations who were most likely to recommend a visit to the UK, long-haul markets Brazil,
South Africa and USA came out on top with the highest proportions saying they were extremely likely
to recommend, followed by Norway and Russia.
There were only a very small proportion of respondents that would not consider recommending
Britain at some level. Holiday visitors from Malaysia, Hong Kong, Belgium and France were less
likely to say they would be extremely likely to recommend a visit to the UK, but even here well over
half would do so.
Source: International Passenger Survey 2015, Q: “How likely are you to recommend a visit to the UK to friends and family?”
Base: Holiday visitors staying 1+ night in Britain, excludes UK nationals (expats) n=14,281.
AU
S
BE
L
BR
A
CA
N
CH
I
DE
N
FR
A
GE
R
HK
IND
IRE
ITA
JA
P
MA
L
NE
T
NZ
NO
R
PO
L
PO
R
RU
S
SA
U
SG
P
SA
F
KO
R
SP
A
SW
E
SW
I
TU
R
UA
E
US
A
TO
T
Extremely
Likely73% 61% 87% 72% 77% 75% 60% 65% 59% 76% 74% 74% 68% 54% 65% 68% 80% 64% 79% 80% 75% 70% 81% 75% 69% 72% 73% 67% 78% 81% 71%
Very likely 23% 36% 11% 26% 19% 23% 36% 30% 35% 21% 18% 23% 26% 36% 31% 22% 17% 32% 19% 11% 20% 21% 16% 18% 29% 24% 26% 33% 18% 17% 26%
Neutral 4% 3% 1% 1% 3% 2% 3% 4% 4% 3% 7% 2% 1% 6% 4% 9% 2% 3% 3% 9% 4% 6% 3% 2% 2% 3% 1% 0% 4% 1% 3%
Not likely 1% 0% 0% 1% 0% 0% 1% 1% 1% 0% 1% 0% 4% 0% 0% 0% 1% 0% 0% 0% 0% 2% 0% 2% 0% 1% 0% 0% 0% 0% 0%
Not likely at
all0% 0% 1% 0% 0% 0% 0% 0% 0% 0% 1% 1% 0% 3% 0% 1% 0% 1% 0% 0% 1% 2% 0% 3% 0% 0% 0% 0% 0% 0% 0%

29
Recommending BritainAge and gender
While over 90% of visitors to
Britain, across all gender and
age splits, are likely to
recommend a visit, some
interesting variations can be
seen amongst those who had
the strongest propensity to
recommend.
Women are significantly more
likely than men to strongly
recommend Britain to friends
and family (73% vs 66%). This is
true for women travelling for
either leisure or for business.
There is also a link between age
and recommendation. The older
the visitor, the more likely they
are to strongly recommend a
visit to their friends and family.
Source: International Passenger Survey 2015, Q: “How likely are you to recommend a visit to the UK to friends and family?”
Base: Visitors staying 1+ night in Britain, excludes UK nationals (expats) n=35,593
66%
73%
66%
68%
70%
70%
71%
74%
28%
23%
30%
27%
25%
25%
23%
21%
5%
3%
4%
4%
4%
4%
5%
5%
Male
Female
16 - 24
25 - 34
35 - 44
45 - 54
55 - 64
65+
Recommendation by age and gender
Extremely likely Likely Neutral Not likely Not likely at all
UK average:
69%

30
Recommending BritainTrip Purpose, Duration and Frequency of travel
Those who visited Britain for VFR
(72%) or holiday (71%) purposes
have a higher propensity to say
that they are extremely likely to
recommend Britain. Those visiting
Britain for business are less likely
to recommend Britain overall
(92% vs UK average of 95%) and
the extremely likely scores drops
significantly to 62% amongst this
group.
The longer visitors spend in
Britain (on both leisure and
business trips) the stronger the
likelihood they will recommend a
visit to friends and family (8+
nights: 73% vs <7 nights: 68%).
The same is true of for those that
have visited Britain on more than
one occasion in the last 10 years.
Source: International Passenger Survey 2015, Q: “How likely are you to recommend a visit to the UK to friends and family?”
Base: Visitors staying 1+ night in Britain, excludes UK nationals (expats) n=35,593
71%62%
72% 68% 68%73%
67% 70%
26%
30%
23% 27% 27%22%
28% 25%
Holiday Business VFR Study 7 nights andless
8 Nights + First-timer Repeater
Likelihood to recommend Britain
Extremely likely Likely Neutral Not likely Not likely at all
Trip Purpose Duration Frequency

31
Recommendation by Region
This map shows how
propensity to recommend
Britain varies by which region
of the UK was visited, among
those visiting for holidays only.
As some visitors stayed in
multiple regions, the data is
based on the region each
visitor first stayed in.
Visitors to Scotland (76%) and
London (72%) gave the
strongest recommendation
scores amongst holiday
visitors.
Source: International Passenger Survey 2015, Q: “How likely are you to recommend a visit to the UK to friends and family?”
Base: Visitors staying 1+ night in Britain, excludes UK nationals (expats). Holiday visits only.
72%
60%67%
60%
61%
69%67%
69%
64%
76%
70%
% who are extremely likely to recommend, by region visited
UK Average
71%
Holiday Visits Only
32
Foresight – issue 154
The Visitor Experience in
Britain
Footer Thursday, December 21,