the ventilation mechanism of the pacific hagfish
TRANSCRIPT
R EGU L A R PA P E R
The ventilation mechanism of the Pacific hagfish Eptatretusstoutii
Junho Eom1,2 | Chris M. Wood1,2
1Department of Zoology, University of British
Columbia, Vancouver, British Columbia,
Canada
2Bamfield Marine Sciences Centre, Bamfield,
British Columbia, Canada
Correspondence
Junho Eom, Department of Zoology,
University of British Columbia, Vancouver, BC
V6T 1Z4, Canada.
Email: [email protected]
Funding information
Funding was provided by a Discovery Grant
from the Natural Sciences and Engineering
Research Council of Canada to C.M. Wood
We made anatomical and physiological observations of the breathing mechanisms in Pacific hag-
fish Eptatretus stoutii, with measurements of nostril flow and pressure, mouth and pharyngo-
cutaneous duct (PCD) pressure and velum and heart impedance and observations of dye flow
patterns. Resting animals frequently exhibit spontaneous apnea. During normal breathing, water
flow is continuous at a high rate (~125 ml kg−1 min−1 at 12�C) powered by a two-phase unidi-
rectional pumping system with a fast suction pump (the velum, ~22 min−1) for inhalation
through the single nostril and a much slower force pump (gill pouches and PCD ~4.4 min−1) for
exhalation. The mouth joins the pharynx posterior to the velum and plays no role in ventilation
at rest or during swimming. Increases in flow up to >400 ml kg−1 min−1 can be achieved by
increases in both velum frequency and stroke volume and the ventilatory index (product of fre-
quency x nostril pressure amplitude) provides a useful proxy for ventilatory flow rate. Two types
of coughing (flow reversals) are described. During spontaneous swimming, ventilatory pressure
and flow pulsatility becomes synchronised with rhythmic body undulations.
KEYWORDS
coughing, pharyngo-cutaneous duct, swimming, two-phase ventilation, velum, ventilatory
stroke volume
1 | INTRODUCTION
The breathing mechanism of hagfishes (Class Myxini), which are argu-
ably the extant vertebrates of the most ancient lineage, is fundamen-
tally different from those in other fishes (Bartels, 1998; Johansen &
Strahan, 1963; Malte & Lomholt, 1998). To date, most studies have
been on the Family Myxinidae, with only two studies on the Family
Eptatretidae (Coxon & Davison, 2011; Perry et al., 2009b). For both
families, there is general agreement that the rhythmic up and down
movement of the scroll-like velum in the velum chamber of the ante-
rior pharynx serves as the major ventilatory pump, inhaling the ambi-
ent water via the single anterior nostril duct to the pharynx. This idea
that the velum is responsible for the ventilatory water current was
first suggested by Cole (1905) based on anatomical studies. Gustafson
(1935) and Strahan (1958) added a detailed description of the cartilag-
inous skeleton and muscles that constitute the velum chamber. Later,
Johansen and Hol (1960) applied x-ray analysis with water-soluble
contrast media and confirmed that the velum structure moved dorso-
ventrally as the major pump for the ventilatory water current as Cole
(1905) had originally suggested. The inhaled water is then expelled
through pairs of gill pouches (variable in number both within and
between species) and a pharyngo-cutaneous gill duct (PCD). The Epta-
tretidae differ from the Myxinidae in having separate gill pouch open-
ings to the outside on each side in addition to the exit of the common
PCD on the left side via an enlarged posterior gill slit.
There have been only two direct measurements of ventilatory
water flow in hagfishes, both using blood flow meters in novel config-
urations. Steffensen et al. (1984) measured a resting ventilatory flow
rate of about 45 ml kg−1 min−1 in Myxine glutinosa L. 1758 at 15�C by
mounting the flow-probe on a cone overlying the partially buried ani-
mal. Perry et al. (2009b) reported a much higher value of about 235 ml
kg−1 min−1 in Eptatretus stoutii (Lockington 1878) at 12�C fitted with
a flow-probe attached to a tube tied into the nostril of the non-buried
animal. It is unclear whether these very different values reflect differ-
ences between the species or the methods used. Furthermore Perry
et al. (2009b), using hypoxia and hypercapnia as experimental stimuli,
concluded that changes in ventilatory flow rate occurred only
via changes in velum frequency and that stroke volume did not vary.
Received: 5 June 2018 Accepted: 10 December 2018
DOI: 10.1111/jfb.13885
FISH
J Fish Biol. 2019;1–16. wileyonlinelibrary.com/journal/jfb © 2018 The Fisheries Society of the British Isles 1
This conclusion was supported by Coxon and Davison (2011) who
recorded the ventilatory frequency response to temperature in Epta-
tretus cirrhatus (Forster 1801) by electromyography of velum contrac-
tion, but no direct measurements of ventilatory flow rate were made.
Other elements of the hagfish breathing mechanism also remain
incompletely understood. For example, various researchers have ques-
tioned the role of gill pouches and their associated ducts as active
pumps vs. passive conduits and have even raised the possibility of
bidirectional water flow. For example, Goodrich (1930) suggested the
gill pouches served as an active water pump in series with the velum
chamber for unidirectional water flow and he believed that the gill
pouches could even generate a bidirectional water current (inhalation
and exhalation) when the nostril was occluded, as might for example
occur during feeding. Strahan (1958), however, did not observe the
active contraction of gill pouches in live M. glutinosa so he concluded
that the role of the gill pouches was entirely passive. Subsequently,
using x-ray analysis in the same species, Johansen and Hol (1960)
observed contraction of the gill pouches during normal unidirectional
ventilation. They concluded that water in the pharynx was expelled
actively through the gill pouches while valve-like muscular sphincters
located in the efferent and afferent gill ducts regulated the amount of
expelled water and this was later accepted by Strahan (in Johansen &
Strahan, 1963). Another uncertainty is the possible role of the mouth
as a conduit, or even a pump, for inhalation; i.e., additional to the well
accepted roles of the nostril and velum chamber for these functions.
This does not appear to have been directly investigated, though in
M. glutinosa, Johansen and Hol (1960) observed that x-ray contrast
media injected via a tube in the mouth subsequently appeared in the
gill pouches and gill ducts, suggesting a functional connection. Various
types of flow reversals (coughing and sneezing) either spontaneously,
or in response to waterborne particles, have been described in
M. glutinosa (Johansen & Hol, 1960; Johansen & Strahan, 1963; Stef-
fensen et al., 1984; Strahan, 1958). However, in the Eptatretidae, to
our knowledge, the potential roles of the gill pouches and the mouth
in ventilation have never been investigated and flow reversals have
not been described in members of this family (Coxon & Davison,
2011; Perry et al., 2009b).
With this background in mind, the goal of the present study was
to describe the basic breathing mechanisms in E. stoutii as a prelude to
subsequent studies on its ventilatory responses to temperature
(Giacomin et al., 2018) and ammonia (J. Eom, M. Giacomin, A. Clifford,
G. Goss and C. M. Wood, January 2019, unpublished data). We
started with the simple assumption that any organ connected to the
pharynx such as the nostril, the velum chamber, the mouth cavity and
the pairs of gill pouches including the PCD exiting through the left
posterior gill slit, could serve as ventilatory organs in E. stoutii. In order
to understand the system, we dissected the animal, we collected
water flow data from the nostril, pressure data from the nostril, mouth
and PCD, impedance data from the velum chamber and the heart for
velum and cardiac rates and we observed dye flow patterns. The focus
was on normal ventilatory physiology in resting animals and how this
changed during experimental disturbances, during ventilatory rever-
sals (here referred to as nostril coughing and mouth coughing) and
during spontaneous bouts of exercise.
2 | MATERIALS AND METHODS
2.1 | Experimental animals
Pacific hagfish E. stoutii, body mass 53.9 � 3.3 g, n = 149] were cap-
tured in August and September by 22 l sized Korean cone traps that
were baited with strips of Pacific hake (Merluccius productus (Ayres
1855) and anchored on the bottom at a depth of 100 m in Trevor chan-
nel (48� 50.8440 N, 125� 08.3210 W) located close to the Bamfield
Marine Science Centre (BMSC), off the southwest coast of Vancouver
Island, BC, Canada. The captured E. stoutii were housed at BMSC in
fibreglass tanks (20 m3) served with flow-through seawater and furn-
ished with PVC pipes for shelter. Although hake strips were provided,
the animals generally did not feed during the 2 month period of hold-
ing. The animals were collected under permits from the Department of
Fisheries and Oceans Canada (XR 202 2016 and 194 2017) and the
experiments were approved by the University of British Columbia
(UBC) (Animal Use Protocol A14-0251) and BMSC Animal Care Com-
mittees (AUP RS-17-20) and followed the guidelines of the Canadian
Council of Animal Care. Holding and experimental temperature was
11–13�C and salinity was 30–31. After experimentation, animals were
euthanised by an overdose of 5 g l−1 neutralised MS-222 followed by
evisceration to ensure death.
2.2 | Anatomical studies
In freshly euthanised E. stoutii, the head and gill pouch regions were dis-
sected and photographed in order to describe the anatomy of the venti-
latory system. In order to understand anatomical features of the mouth
cavity, 9 ml of silicone (Silicone I, GE Sealants and Adhesives, Hunters-
ville, NC, USA) dyed with red food colouring were injected into the ante-
rior opening of the nostril cavity of euthanised E. stoutii and 3 ml of
green or blue silicone into the anterior opening of the mouth cavity
respectively. A plastic syringe with attached plastic tube that fit snugly
into the respective openings was used for silicone injection. The fish
were then immediately dissected to ascertain the distribution of the
coloured silicone dyes. In order to further understand functional features
of the hagfish mouth cavity, the fish were anesthetised with MS-222
(see § 2.3), a #18-gauge needle was inserted at an angle of 45� through
the ventral side of head into the mouth cavity, a 30 cm length of poly-
ethylene tubing (PE160, OD 1.57 × ID 1.14 mm, Clay-Adams, Sparks,
MD, USA) was inserted through the hole and then heat-flared using a
butane lighter so it was properly secured inside the mouth cavity.
After the fish recovered from anaesthesia in flowing sea water, a
300 μl volume of red food dye was gently injected into the mouth
cavity via the PE160 cannula and the fish was monitored over the fol-
lowing 24 h with a surveillance camera system (Pro-Series HD 720P,
Swann Communications; www.swann.com). Food dye was also
injected into the water in front of the nostril, in front of the mouth
and in front of the gill pouch openings in order to visually observe the
direction of ventilatory flow in E. stoutii. In order to study the effect
of nostril blockage as might occur when the E. stoutii immerses its
head in its prey, we manually occluded the nostril in a few animals and
observed the fate of dye that had been injected into the pharynx via
the PCD cannula described in the following section.
2 EOM AND WOODFISH
2.3 | Physiological recording from various sites inthe cardio-respiratory system
Prior to operation for attachment of sensors, the fish were anesthe-
tised in 0.6 g l−1MS-222 (neutralised to pH 7.8 with 5 M NaOH) and
placed on an operating table. As E. stoutii are very hypoxia-tolerant, it
was not necessary to maintain gill irrigation. Simple silk sutures
(26 mm 1/2C taper, perma-hand silk, Ethicon; www.ethicon.com) fas-
tened to the skin were used to hold recording devices in place. The
following recording devices were implanted in various combinations
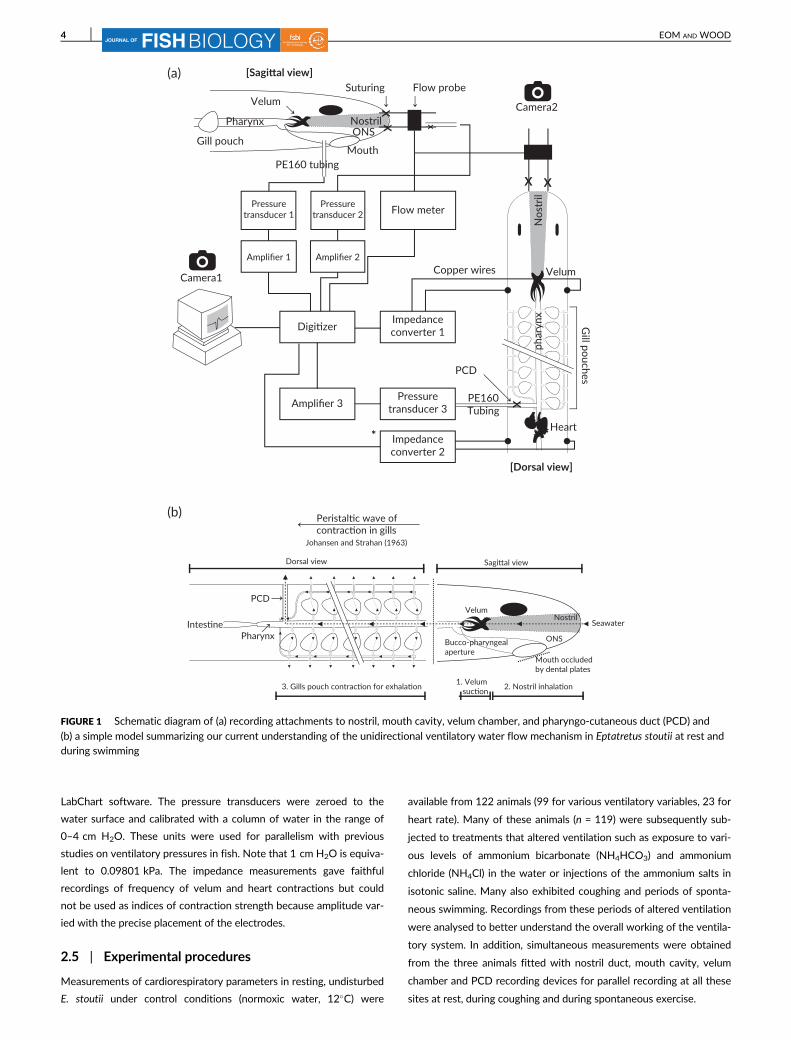
(Figure 1a), but not all devices were installed on all animals: (a) For
impedance recording of velum movements, a pair of ~15 cm lami-
nated copper wires (American Wire Gauge #32, Belden; www.belden.
com), with ~1 cm stripped off their insulation at the recording ends
were inserted under the skin as fish-hook electrodes, knotted exter-
nally and secured laterally to the skin around the velum chamber. The
entries were made with a #21 gauge needle ~2 cm posterior to the
simple eye spots. The other ends of the copper wires, also stripped of
insulation, could be connected to an impedance converter (2991,
Transmed Scientific, San Luis Obispo, CA, USA). (b) For impedance
recording of heart contractions, a similar pair of copper wire elec-
trodes were implanted ventrally under the skin around the heart
(~1 cm posterior to the PCD). The E. stoutii were very sensitive to
attachment of wires in the heart region, frequently showing anti-
predation knotting behaviour, so the attached wires as well as other
catheters etc. were easily tangled or displaced. Therefore, heart-rate
recordings were taken from a separate group of E. stoutii fitted only
with these heart electrodes. (c) In order to measure ventilatory flow, a
3 cm length of transparent silicone tubing (6.35 mm O.D. and 4.32 mm
I.D.) was inserted to fit snugly into the nostril cavity and two stitches
were made laterally to the skin to secure the tubing in the nostril cavity.
The probe of a flow meter was connected directly to the front of the sil-
icone tubing and used for measuring flow at the nostril associated with
ventilation, a technique adapted from that of Perry et al. (2009b). (d) In
order to measure ventilatory pressures at the nostril, a 3 cm length
(non-flared) of PE160 polyethylene tubing was inserted 1 cm deep into
the transparent silicone tubing of (c) and secured by two stitches to the
silicone tubing. The inserted PE 160 tubing occupied 21.4% of the
cross-sectional area of the silicone tubing. It could easily be removed
and re-inserted with minimal disturbance to the hagfish, unlike a T-
junction tubing tried earlier which was frequently tangled and displaced
by the anti-predation knotting behaviour. The secured PE160 tubing in
the silicone tubing could then be connected via a #18-gauge needle
shaft to another ~30 cm water-filled PE160 tubing that was attached to
a medical pressure transducer (DPT-100, Utah Medical Products; www.
utahmed.com). (e) In order to monitor pressure events in the mouth cav-
ity, a ~2-cm flared PE-160 catheter was fixed into the mouth, as
described in § 2.2. This could then be attached via a #18-gauge needle
shaft to a ~30 cm water-filled PE160 catheter connected to a pressure
transducer. (f ) In order to monitor pressure events in the PCD, a ~2 cm
non-flared PE-160 catheter was gently inserted 1 cm deep into the
PCD and secured in place by two stitches to the skin. As with the mouth
and nostril catheters, this could then be attached via a #18-gauge nee-
dle shaft to a ~30 cm water-filled PE160 catheter connected to a pres-
sure transducer.
The copper wire electrodes were connected to impedance con-
verters (Model 2991, Transmed Scientific) to collect the frequency of
the velum chamber or heart (beats min−1). The PE160 catheters were
connected to medical pressure transducers (DPT-100, Utah Medical
Products) to collect ventilatory pressures (cm H2O) and velum fre-
quencies (min−1) at the nostril, mouth and PCD. A microcirculation
ultrasonic flow probe (V-series, Transonic Systems Inc.; www.
transonic.com) was connected to a dual channel small animal blood
flowmeter (T106 series, Transonic Systems Inc.) to monitor nostril
water flow (ml kg−1 min−1) and velum frequency (min−1) as well as the
flow direction (inhalation or exhalation). Inhalation was recorded as
negative flow and exhalation as positive flow. Ventilatory stroke
volume (ml kg−1 velum stroke−1) was calculated as nostril water
inflow divided by velum frequency. The measured analogue signals
were amplified (Load Cell Amplifier signal conditional with
Removable Terminals Connectors, Transducer Techniques; www.
tranducertechniques.com), converted to digital signals in a PowerLab
data integrity system (ADInstruments; www.adinstruments.com)
and were visualised and analysed in LabChart 7.0 software
(ADInstruments). Two surveillance camera systems (Pro-Series HD
720P, Swann Communications) simultaneously recorded the E. stoutii
(for monitoring of behaviour) and the computer screen (for monitoring
physiological parameters) for later correlation of behaviour with inter-
pretation of the simultaneously collected physiological data
(Figure 1a).
Following implantation of recording devices, most of the E. stoutii
(n = 119) were allowed to recover overnight in flowing anaesthetic-
free seawater before measurements of nostril ventilatory variables. In
order to collect simultaneous ventilatory signals in the nostril duct,
mouth cavity, velum chamber and PCD at rest and during spontane-
ous swimming activity, another group of hagfish (n = 3) were allowed
to recover for only 30 min before physiological recordings com-
menced. By this time, the E. stoutii had resumed their normal coiled
posture and ventilatory flows and pressures were at normal resting
levels. This much shorter recovery period was necessary to minimise
tangling and extrusion of the multiple recording devices. The three
animals from which the simultaneous multiple recordings were made
successfully represent a small subset of the total number (> 10) that
were attempted. In general, E. stoutii showed higher activity levels at
night-time so the operations were performed in late afternoon and
the recordings were made mostly at night. The recording area was
screened from the general laboratory by black plastic sheeting but
was next to a window and thus exposed to natural photoperiod.
2.4 | Calibration of the recording systems
The flow probe detected both the magnitude and direction of flow, so
correct orientation was essential. In our recordings, negative values
(i.e., below zero flow) represent inhalation through the nostril and pos-
itive values represent exhalation, as occurs during coughing, for exam-
ple. As noted by Perry et al. (2009b), the intrinsic calibration of the
flow probe proved to be altered in seawater, so the probe was recali-
brated by flowing salinity 30 seawater at 12�C through the probe at
known rates (determined gravimetrically), using a peristaltic pump.
Voltage outputs were converted into flow units (ml min−1) by the
EOM AND WOOD 3FISH
LabChart software. The pressure transducers were zeroed to the
water surface and calibrated with a column of water in the range of
0–4 cm H2O. These units were used for parallelism with previous
studies on ventilatory pressures in fish. Note that 1 cm H2O is equiva-
lent to 0.09801 kPa. The impedance measurements gave faithful
recordings of frequency of velum and heart contractions but could
not be used as indices of contraction strength because amplitude var-
ied with the precise placement of the electrodes.
2.5 | Experimental procedures
Measurements of cardiorespiratory parameters in resting, undisturbed
E. stoutii under control conditions (normoxic water, 12�C) were
available from 122 animals (99 for various ventilatory variables, 23 for
heart rate). Many of these animals (n = 119) were subsequently sub-
jected to treatments that altered ventilation such as exposure to vari-
ous levels of ammonium bicarbonate (NH4HCO3) and ammonium
chloride (NH4Cl) in the water or injections of the ammonium salts in
isotonic saline. Many also exhibited coughing and periods of sponta-
neous swimming. Recordings from these periods of altered ventilation
were analysed to better understand the overall working of the ventila-
tory system. In addition, simultaneous measurements were obtained
from the three animals fitted with nostril duct, mouth cavity, velum
chamber and PCD recording devices for parallel recording at all these
sites at rest, during coughing and during spontaneous exercise.
XX
XX
Flow meter
X
Pressuretransducer 1
Amplifier 1
Digi�zer
Amplifier 3
Impedanceconverter 1
Pressuretransducer 3
PE160 tubing
PE160 Tubing
Nostril
VelumSuturing Flow probe
Copper wires
Gill pouchesPCD
Impedanceconverter 2
*Heart
Camera1
Camera2
Intes�ne
Johansen and Strahan (1963)
ONS
Peristal�c wave of contrac�on in gills
1. Velum suc�on 2. Nostril inhala�on3. Gills pouch contrac�on for exhala�on
Sagi�al viewDorsal view
Mouth occluded by dental plates
SeawaterNostril
MouthGill pouch
Velum
Nos
tril
ONS
Pharynx
phar
ynx
Pharynx
PCDVelum
Bucco-pharyngeal aperture
Pressuretransducer 2
Amplifier 2
[Sagi�al view]
[Dorsal view]
(a)
(b)
FIGURE 1 Schematic diagram of (a) recording attachments to nostril, mouth cavity, velum chamber, and pharyngo-cutaneous duct (PCD) and
(b) a simple model summarizing our current understanding of the unidirectional ventilatory water flow mechanism in Eptatretus stoutii at rest andduring swimming
4 EOM AND WOODFISH
2.6 | Statistical analyses
Data have been reported as mean � SE. Nostril and mouth coughing
were repeatedly generated in three animals by dye injection into the
respective cavities and these same three animals were used for
detailed analysis of the swimming responses. One-way repeated-
measures ANOVA followed by Dunnett’s test were applied to com-
pare the changed respiratory variables against respective control
values in GraphPad Prism 6.0 (www.graphpad.com). Relationships
(with 95% confidence intervals and 95% prediction intervals) among
various ventilatory variables were assessed by simple linear regres-
sion. The threshold for statistical significance was P < 0.05.
3 | RESULTS
3.1 | Anatomical observations
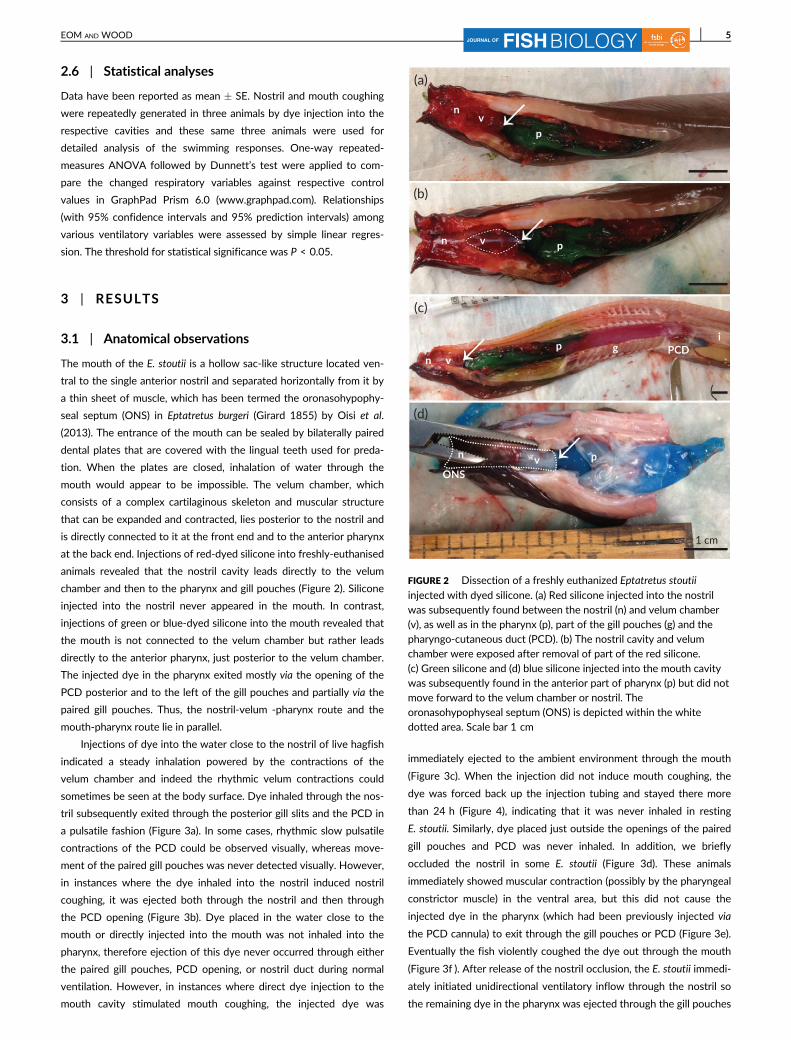
The mouth of the E. stoutii is a hollow sac-like structure located ven-
tral to the single anterior nostril and separated horizontally from it by
a thin sheet of muscle, which has been termed the oronasohypophy-
seal septum (ONS) in Eptatretus burgeri (Girard 1855) by Oisi et al.
(2013). The entrance of the mouth can be sealed by bilaterally paired
dental plates that are covered with the lingual teeth used for preda-
tion. When the plates are closed, inhalation of water through the
mouth would appear to be impossible. The velum chamber, which
consists of a complex cartilaginous skeleton and muscular structure
that can be expanded and contracted, lies posterior to the nostril and
is directly connected to it at the front end and to the anterior pharynx
at the back end. Injections of red-dyed silicone into freshly-euthanised
animals revealed that the nostril cavity leads directly to the velum
chamber and then to the pharynx and gill pouches (Figure 2). Silicone
injected into the nostril never appeared in the mouth. In contrast,
injections of green or blue-dyed silicone into the mouth revealed that
the mouth is not connected to the velum chamber but rather leads
directly to the anterior pharynx, just posterior to the velum chamber.
The injected dye in the pharynx exited mostly via the opening of the
PCD posterior and to the left of the gill pouches and partially via the
paired gill pouches. Thus, the nostril-velum -pharynx route and the
mouth-pharynx route lie in parallel.
Injections of dye into the water close to the nostril of live hagfish
indicated a steady inhalation powered by the contractions of the
velum chamber and indeed the rhythmic velum contractions could
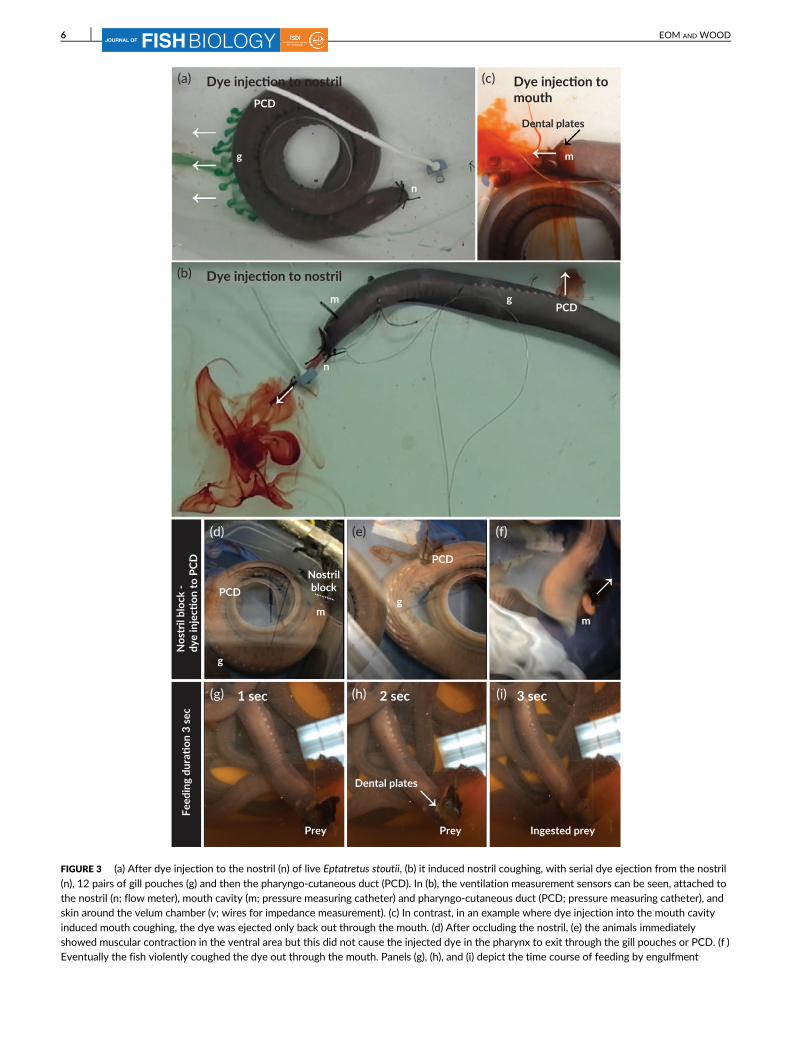
sometimes be seen at the body surface. Dye inhaled through the nos-
tril subsequently exited through the posterior gill slits and the PCD in
a pulsatile fashion (Figure 3a). In some cases, rhythmic slow pulsatile
contractions of the PCD could be observed visually, whereas move-
ment of the paired gill pouches was never detected visually. However,
in instances where the dye inhaled into the nostril induced nostril
coughing, it was ejected both through the nostril and then through
the PCD opening (Figure 3b). Dye placed in the water close to the
mouth or directly injected into the mouth was not inhaled into the
pharynx, therefore ejection of this dye never occurred through either
the paired gill pouches, PCD opening, or nostril duct during normal
ventilation. However, in instances where direct dye injection to the
mouth cavity stimulated mouth coughing, the injected dye was
immediately ejected to the ambient environment through the mouth
(Figure 3c). When the injection did not induce mouth coughing, the
dye was forced back up the injection tubing and stayed there more
than 24 h (Figure 4), indicating that it was never inhaled in resting
E. stoutii. Similarly, dye placed just outside the openings of the paired
gill pouches and PCD was never inhaled. In addition, we briefly
occluded the nostril in some E. stoutii (Figure 3d). These animals
immediately showed muscular contraction (possibly by the pharyngeal
constrictor muscle) in the ventral area, but this did not cause the
injected dye in the pharynx (which had been previously injected via
the PCD cannula) to exit through the gill pouches or PCD (Figure 3e).
Eventually the fish violently coughed the dye out through the mouth
(Figure 3f ). After release of the nostril occlusion, the E. stoutii immedi-
ately initiated unidirectional ventilatory inflow through the nostril so
the remaining dye in the pharynx was ejected through the gill pouches
(a)
nv
p
(b)
n v p
(d)
n
ONSv p
1 cm
(c)
n vp g PCD
i
FIGURE 2 Dissection of a freshly euthanized Eptatretus stoutii
injected with dyed silicone. (a) Red silicone injected into the nostrilwas subsequently found between the nostril (n) and velum chamber(v), as well as in the pharynx (p), part of the gill pouches (g) and thepharyngo-cutaneous duct (PCD). (b) The nostril cavity and velumchamber were exposed after removal of part of the red silicone.
(c) Green silicone and (d) blue silicone injected into the mouth cavitywas subsequently found in the anterior part of pharynx (p) but did notmove forward to the velum chamber or nostril. Theoronasohypophyseal septum (ONS) is depicted within the whitedotted area. Scale bar 1 cm
EOM AND WOOD 5FISH
(a) (c)Dye injec�on to nostril
(b)
(d) (e) (f)
(g) 1 sec 2 sec 3 sec(h) (i)
Dye injec�on to nostril
Dye injec�on tomouth
Dental plates
m
m
n
n
PCD
PCD
PCD
PCDNostrilblock
Prey Prey
Dental plates
Ingested prey
Nos
tril
bloc
k -
dye
inje
c�on
to P
CDFe
edin
g du
ra�o
n 3
sec
g
gm
m
g
g
FIGURE 3 (a) After dye injection to the nostril (n) of live Eptatretus stoutii, (b) it induced nostril coughing, with serial dye ejection from the nostril
(n), 12 pairs of gill pouches (g) and then the pharyngo-cutaneous duct (PCD). In (b), the ventilation measurement sensors can be seen, attached tothe nostril (n; flow meter), mouth cavity (m; pressure measuring catheter) and pharyngo-cutaneous duct (PCD; pressure measuring catheter), andskin around the velum chamber (v; wires for impedance measurement). (c) In contrast, in an example where dye injection into the mouth cavity
induced mouth coughing, the dye was ejected only back out through the mouth. (d) After occluding the nostril, (e) the animals immediatelyshowed muscular contraction in the ventral area but this did not cause the injected dye in the pharynx to exit through the gill pouches or PCD. (f )Eventually the fish violently coughed the dye out through the mouth. Panels (g), (h), and (i) depict the time course of feeding by engulfment
6 EOM AND WOODFISH

and PCD. Thus, there was no evidence of bi-directional flow in
E. stoutii gill pouches and the PCD.
Using chunks of anchovy, feeding behaviour was also observed in
a few animals. The E. stoutii first oriented its head towards the prey
item (Figure 3g), then exposed and opened its paired dental plates in
front of the prey item (Figure 3h) and engulfed the chunk of anchovy
immediately (Figure 3i). Overall, this sequence of feeding events was
completed within 3 s.
3.2 | Ventilation of E. stoutii under control restingconditions
Key parameters are summarised in Table 1. After operation, most hag-
fish (n = 99) were allowed to recover overnight in flowing seawater
and their ventilatory movements were recorded via the inserted
pressure-measuring tubing, flow probes and impedance wires at the
respective sites for 5 min, sometimes longer. These recordings are
defined as control resting ventilation in this study. Of the healthy
99 animals in which ventilatory measurements were made under con-
trol resting conditions, 35 E. stoutii (35.4%) exhibited no detectable
breathing during the observation period. As most of our recordings
were of short duration, the mean duration of apnea is not known, but
some animals did not breathe for several hours. In non-breathing ani-
mals, ventilation could usually be initiated by stressors such as
pinching or prodding. Some of these E. stoutii immediately stopped
breathing again while others continued to breathe. These 35 non-
breathing animals were not included in the averages of Table 1, but
this observation indicates that prolonged periods of ventilatory arrest
are common in E. stoutii.
During simultaneous recordings, the frequencies of the nostril
duct (pressure and flow), mouth cavity (pressure), velum region
(impedance) and PCD (pressure) showed similar values, reflecting the
pulsatile movement of the velum chamber. Therefore, averaged fre-
quencies from the nostril duct, mouth cavity and velum chamber have
been reported as velum frequency in Table 1, averaging about
22 min−1 (range 4.7–77.5 min−1). This rhythmic velum contraction
and relaxation resulted in a negative absolute pressure in the nostril
of about −0.6 cm H2O (range = −0.89 to −0.35 cm H2O) with a pres-
sure pulse amplitude of approximately 0.05 cm H2O
(range = 0.01–0.10 cm H2O). Ventilatory index (see below), the prod-
uct of pressure pulse amplitude times velar frequency, averaged about
1.3 cm H2O min−1 (range = 0.11–6.22 cm H2O min−1). The frequency
of spontaneous coughing events under control resting conditions was
about 0.65 min−1 (range = 0.48–0.82 min−1) and heart rate averaged
about 16 min−1 (range = 3.2–20.7 min−1) and was therefore similar to
mean velum frequency in E. stoutii.
As a result of the continuous but fluctuating negative pressure
created in the nostril by the velum chamber contraction cycle, water
was inhaled into the nostril cavity at a mean flow rate of about
−125 ml kg−1 min−1 (range = −267 to −22 ml kg−1 min−1) in resting
animals (Table 1). Water flow was continuous, fluctuating with the
velum cycle, but never dropping to zero between velum beats. The
mean ventilatory stroke volume for each velum contraction cycle was
about 7 ml kg−1 (range = 2.35–10.96 ml kg−1). In simultaneous
recordings, the trough (most negative point) in nostril pressure corre-
sponded to the greatest nostril inflow (Figure 5). Water was exhaled
through 12 pairs of branchial pouches and the PCD.
The three E. stoutii set up to characterise coughing and spontane-
ous swimming events were also employed to make detailed pressure
measurements in the mouth and PCD, together with recordings of
nostril flow (Table 2). The absolute mean pressure (about +0.005 cm
H2O, range = 0.002–0.008 cm H2O) in the PCD was very low and
variable but slightly above ambient pressure on average. Two types of
(a) 0 - h (b) 6 - h (c) 24 - h
FIGURE 4 Dye injection to the mouth cavity of a live Eptatretus stoutii: the location of the injected dye was monitored at (a) 0 h, (b) 2 h, and (c)
24 h. In this example, the fish immediately flushed the dye back up the tubing ( ) and it remained stored in the tubing over 24 h. There was noevidence that it was ever inhaled
TABLE 1 Ventilation variables (mean � SE) collected under resting
control conditions from 64 Eptatretus stoutii. During controlconditions, 35 out of 99 fish (35.4%) did not breathe spontaneously
and are not included here. Heart rates were recorded from anadditional 23 fish. Sample size (n) is given in parenthesis
Variable Value
Nostril flow (ml kg−1 min−1) −124.6 � 25.81 (16)
Stroke volume (ml kg−1) 7.11 � 1.15 (16)
Velum frequency (min−1) 21.84 � 1.86 (64)
Nostril absolute pressure (cm H2O) −0.62 � 0.27 (11)
Nostril pressure amplitude (cm H2O) 0.05 � 0.01 (64)
Ventilatory index (cm H2O min−1) 1.27 � 0.28 (64)
Coughing frequency (min−1) 0.65 � 0.17 (30)
Heart rate (min−1) 16.40 � 0.49 (23)
EOM AND WOOD 7FISH

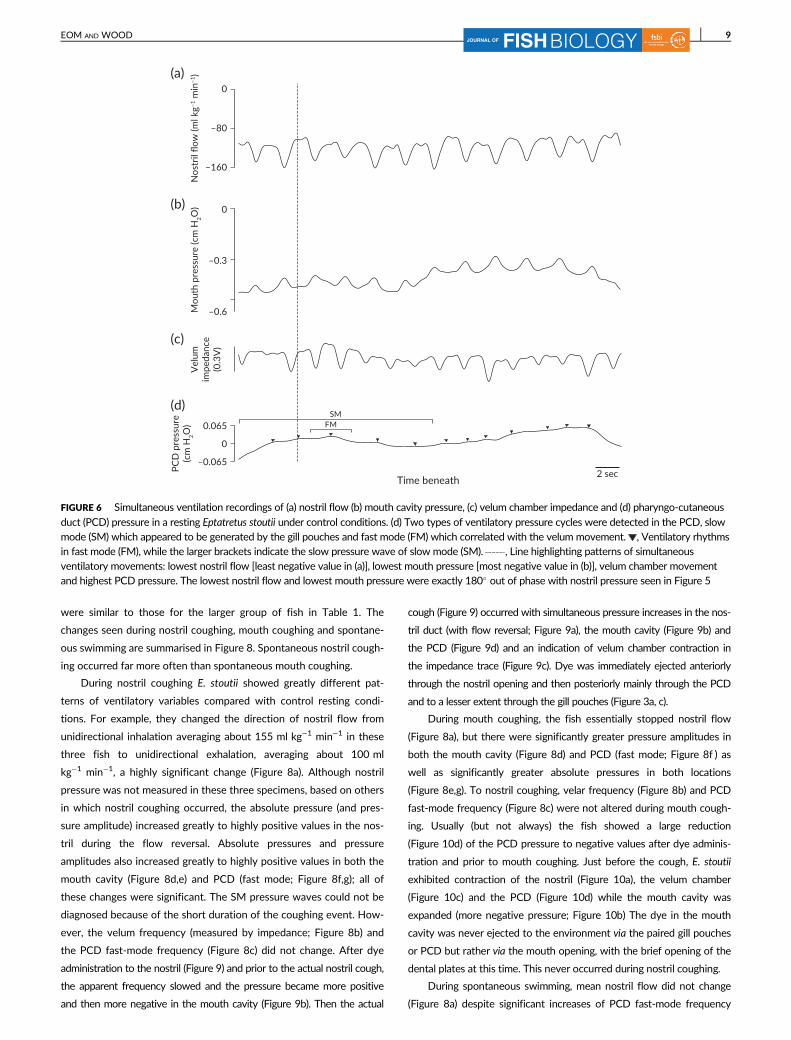
frequencies were detected in the PCD, one (fast mode; Figure 6d)
which was matched to the velum frequency with a mean pressure
amplitude of about 0.008 cm H2O (range = 0.007–0.009 cm H2O)
and the other [slow-mode (SM]; Figure 6d) with a frequency of about
4.4 min−1 (range = 4.13–4.73 min−1) and a mean pressure amplitude
of about 0.05 cm H2O (range = 0.045–0.055 cm H2O) which was
probably generated by the contraction–relaxation of the gill pouches.
The interpretation of this SM ventilation frequency is explored further
in § 4; note that this phenomenon was recorded not only in these
three fish, but also in an earlier group (n = 6; data not shown) where
recordings were made from the PCD catheter only. Note also that
contraction of the velum chamber (Figure 6c) also created a pulsatile
negative absolute pressure in the mouth cavity (Figure 6b; mean =
−0.44 cm H2O, range = −0.10 to −1.24 cm H2O) with a pressure
amplitude of about 0.2 cm H2O (range = 0.06–0.23 cm H2O). The
trough in mouth cavity pressure (i.e., least negative mouth pressure
value) corresponded to the peak in nostril inflow, exactly opposite the
pattern in nostril pressure.
3.3 | Analysis of ventilatory flow and pressurerelationships
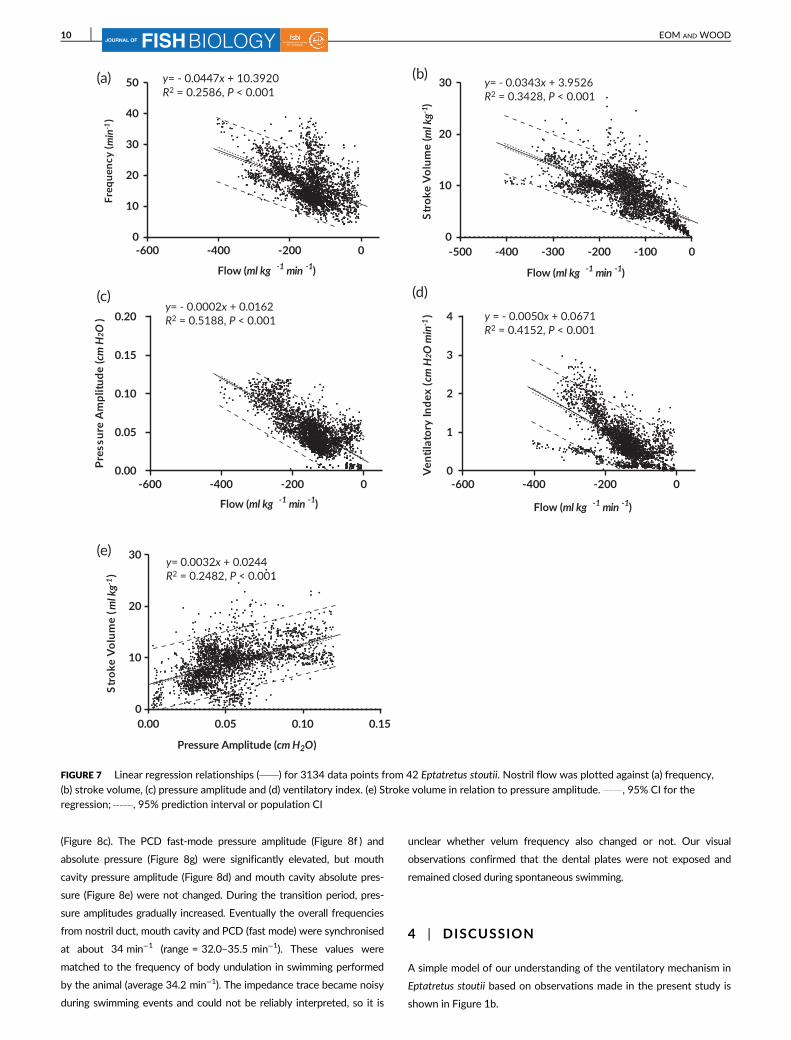
Over 3000 data points from 42 animals were available where nostril flow
and nostril pressures were recorded simultaneously under a variety of
conditions [rest, spontaneous activity, ammonia injections, exposure to
high environmental ammonia (HEA)] in which ventilatory flow varied
greatly, from close to 0 ml kg−1 min−1 to > 400 ml kg−1 min−1 (Figure 7).
Clearly, changes in both velum frequency (Figure 7a) and stroke volume
(Figure 7b) contributed to changes in flow, with the stroke volume explain-
ing a slightly greater percentage of the variance (34%, based on R2) than
did frequency (26%), though both relationships were highly significant
(P < 0.001). Flow was strongly related to pressure amplitude (P < 0.001)
which explained 52% of the variance in flow (Figure 7c). Stroke volume
was also significantly related to pressure amplitude (P < 0.001), which
accounted for about 25% of the variance (Figure 7e). Therefore, pressure
amplitude and stroke volume are not independent variables, explaining
why the contributions of frequency (Figure 7a), stroke volume (Figure 7b)
and pressure amplitude (Figure 7c) appear to explain more than 100% of
the variance in flow. The ventilatory index (Figure 7d) was strongly corre-
lated (r = 0.64, P < 0.001) with ventilatory flow and can be employed as a
useful proxy, accounting for 42% of the variance in the latter.
3.4 | Simultaneous recordings from nostril duct,mouth cavity, velum chamber, and pharyngo-cutaneous duct (PCD)
Ventilatory parameters from different respiratory organs were mea-
sured simultaneously in a subset of three fish to better understand
the relationships between them at rest, as well as during coughing and
spontaneous exercise (Figures 8–11). Nostril coughing is defined as
coughing stimulated by inhalation of dye into the nostril, while mouth
coughing is defined as coughing initiated by injection of dye into the
mouth. Under control resting conditions (Table 2), the absolute values
–0.6 2 secTime beneath
Nos
tril
pres
sure
(cm
H2O
)N
ostr
il flo
w (m
l kg–1
min
–1)
–0.3
–200
–100
0
0(b)
(a)
FIGURE 5 Simultaneous recording of (a) flow and (b) pressure in the nostril duct of Eptatretus stoutii. , Line highlighting patterns of greatest
flow [most negative value in (a)] and lowest pressure [most negative value in (b)] were well matched in the nostril duct, as indicated by the dottedvertical line
TABLE 2 Simultaneous recordings of ventilation variables
(mean � SE) from the nostril duct, velum chamber, mouth cavity, andPCD of three Eptatretus stoutii under control resting conditions.
Velum frequency represents averaged frequency among nostril duct,mouth cavity, velum chamber, and PCD fast mode
Variable Value
Velum frequency (min−1) 15.07 � 1.58
Nostril flow (ml kg−1 min−1) −154.70 � 17.83
Mouth Cavity absolute pressure (cm H2O) −0.44 � 0.20
Mouth Cavity pressure amplitude (cm H2O) 0.16 � 0.05
PCD absolute pressure (cm H2O) 0.005 � 0.003
PCD fast–mode pressure amplitude (cm H2O) 0.008 � 0.001
PCD slow–mode pressure amplitude (cm H2O) 0.050 � 0.005
PCD slow–mode frequency (min–1) 4.43 � 0.30
8 EOM AND WOODFISH
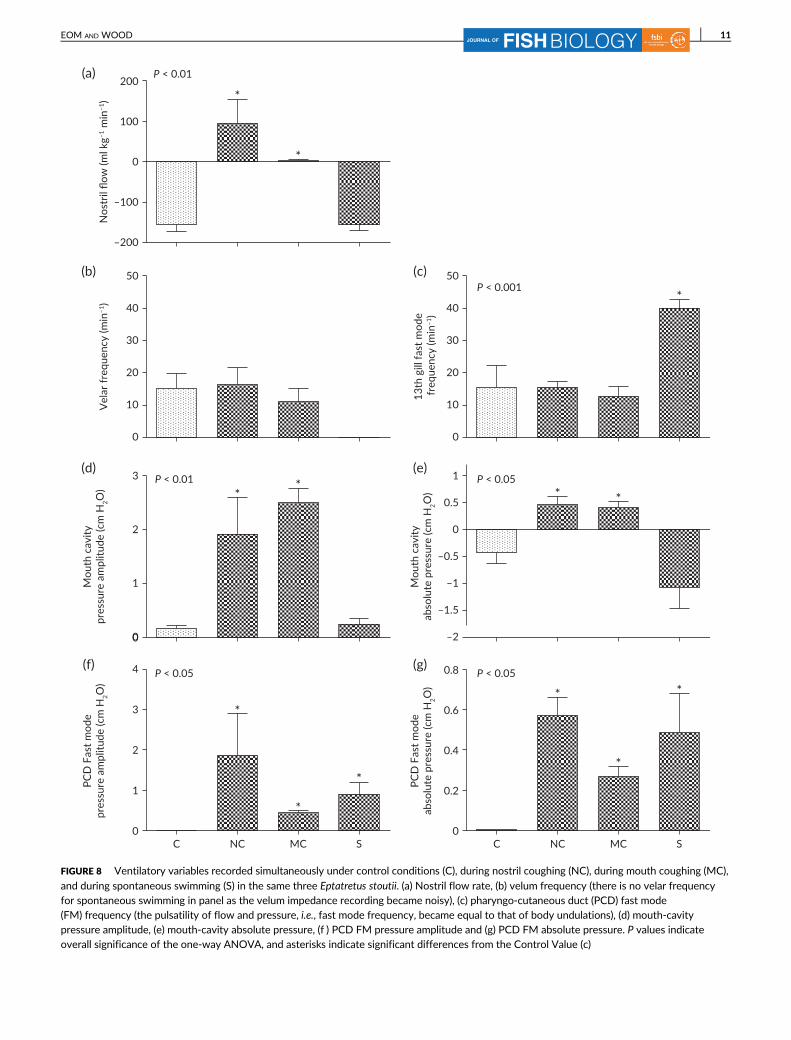
were similar to those for the larger group of fish in Table 1. The
changes seen during nostril coughing, mouth coughing and spontane-
ous swimming are summarised in Figure 8. Spontaneous nostril cough-
ing occurred far more often than spontaneous mouth coughing.
During nostril coughing E. stoutii showed greatly different pat-
terns of ventilatory variables compared with control resting condi-
tions. For example, they changed the direction of nostril flow from
unidirectional inhalation averaging about 155 ml kg−1 min−1 in these
three fish to unidirectional exhalation, averaging about 100 ml
kg−1 min−1, a highly significant change (Figure 8a). Although nostril
pressure was not measured in these three specimens, based on others
in which nostril coughing occurred, the absolute pressure (and pres-
sure amplitude) increased greatly to highly positive values in the nos-
tril during the flow reversal. Absolute pressures and pressure
amplitudes also increased greatly to highly positive values in both the
mouth cavity (Figure 8d,e) and PCD (fast mode; Figure 8f,g); all of
these changes were significant. The SM pressure waves could not be
diagnosed because of the short duration of the coughing event. How-
ever, the velum frequency (measured by impedance; Figure 8b) and
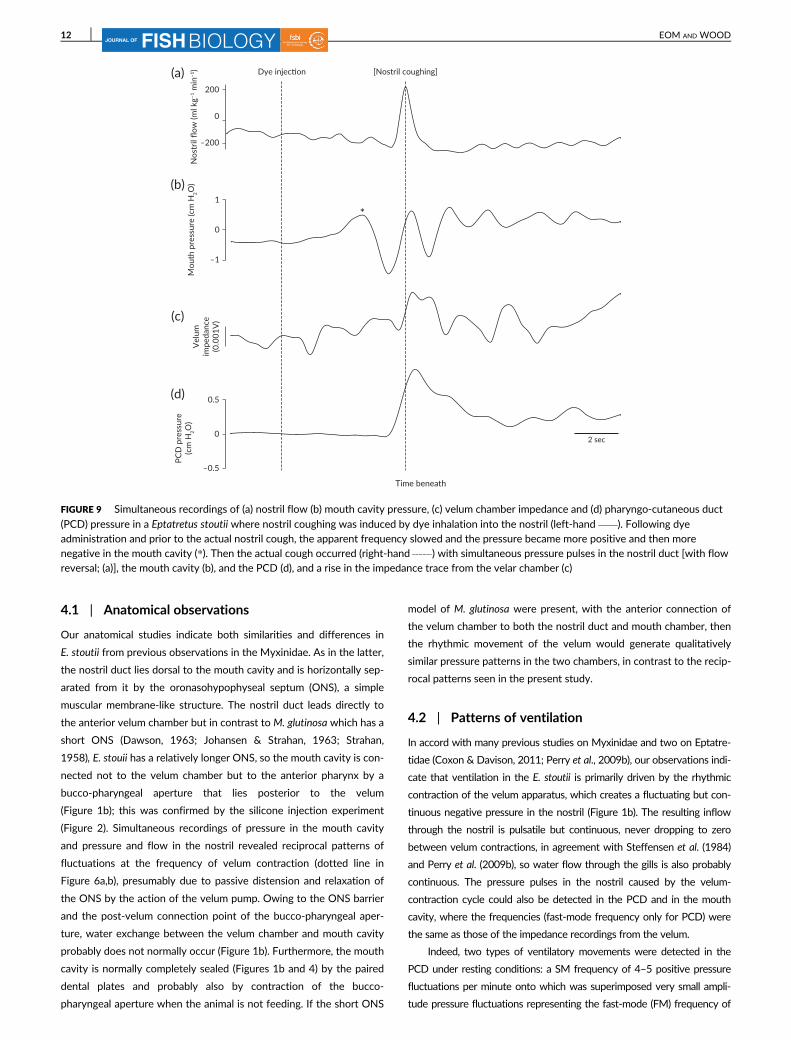
the PCD fast-mode frequency (Figure 8c) did not change. After dye
administration to the nostril (Figure 9) and prior to the actual nostril cough,
the apparent frequency slowed and the pressure became more positive
and then more negative in the mouth cavity (Figure 9b). Then the actual
cough (Figure 9) occurred with simultaneous pressure increases in the nos-
tril duct (with flow reversal; Figure 9a), the mouth cavity (Figure 9b) and
the PCD (Figure 9d) and an indication of velum chamber contraction in
the impedance trace (Figure 9c). Dye was immediately ejected anteriorly
through the nostril opening and then posteriorly mainly through the PCD
and to a lesser extent through the gill pouches (Figure 3a, c).
During mouth coughing, the fish essentially stopped nostril flow
(Figure 8a), but there were significantly greater pressure amplitudes in
both the mouth cavity (Figure 8d) and PCD (fast mode; Figure 8f ) as
well as significantly greater absolute pressures in both locations
(Figure 8e,g). To nostril coughing, velar frequency (Figure 8b) and PCD
fast-mode frequency (Figure 8c) were not altered during mouth cough-
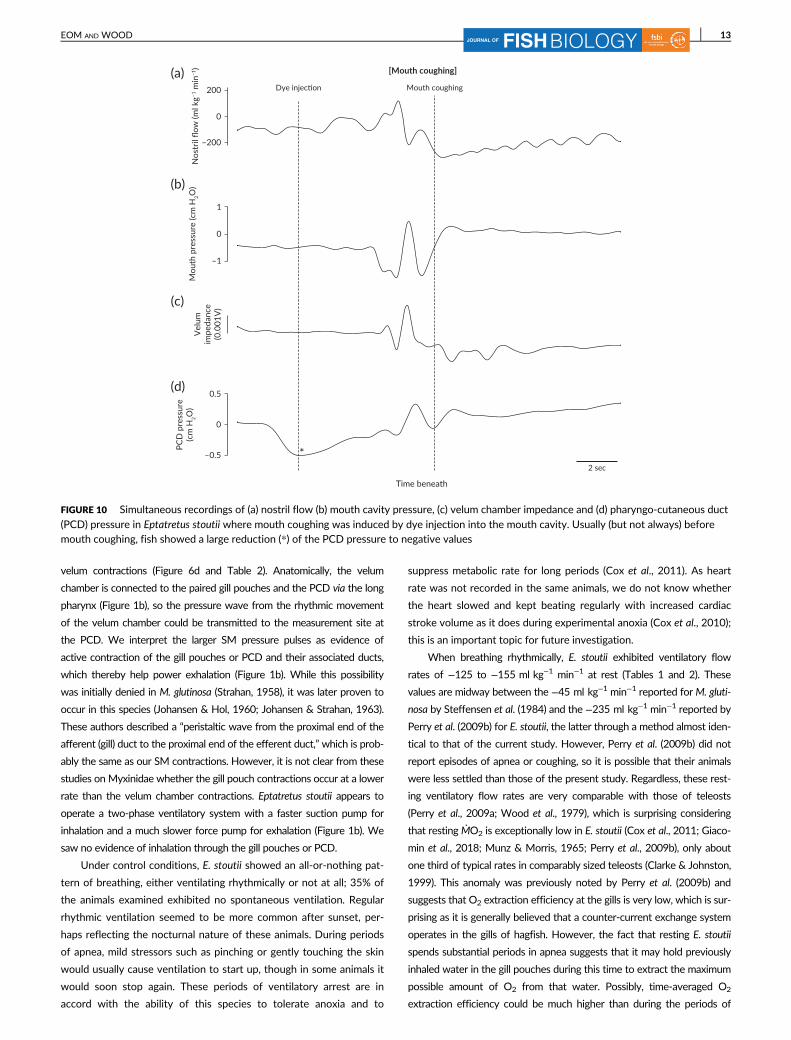
ing. Usually (but not always) the fish showed a large reduction
(Figure 10d) of the PCD pressure to negative values after dye adminis-
tration and prior to mouth coughing. Just before the cough, E. stoutii
exhibited contraction of the nostril (Figure 10a), the velum chamber
(Figure 10c) and the PCD (Figure 10d) while the mouth cavity was
expanded (more negative pressure; Figure 10b) The dye in the mouth
cavity was never ejected to the environment via the paired gill pouches
or PCD but rather via the mouth opening, with the brief opening of the
dental plates at this time. This never occurred during nostril coughing.
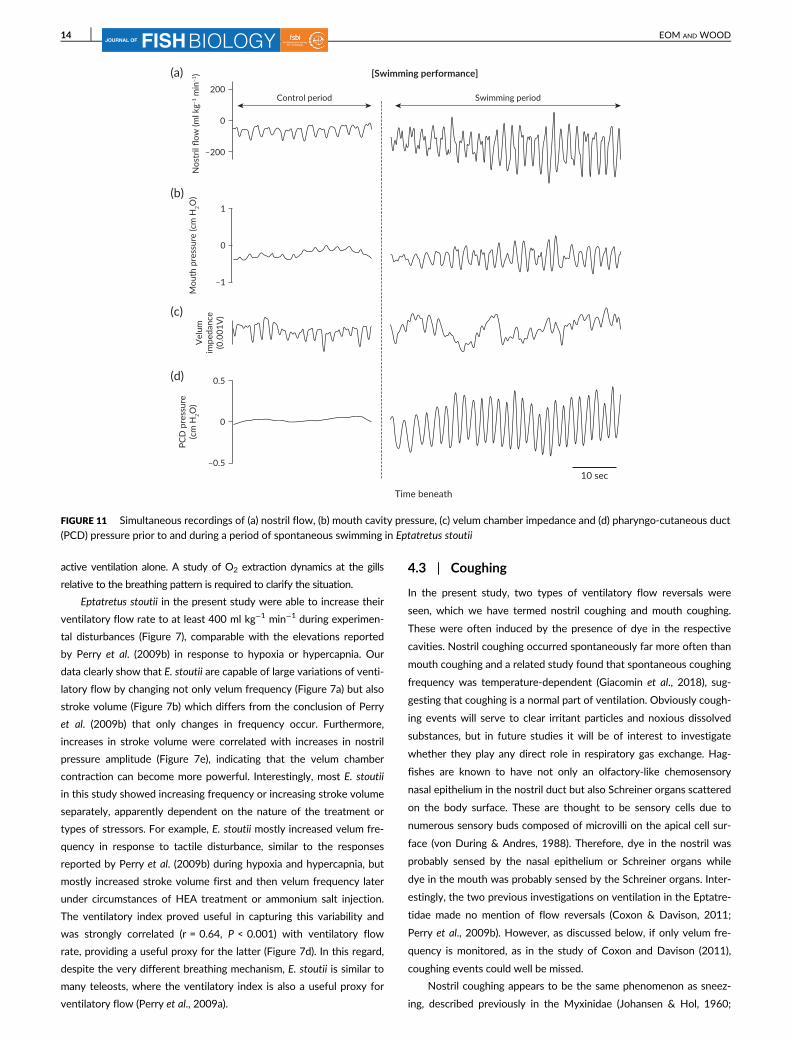
During spontaneous swimming, mean nostril flow did not change
(Figure 8a) despite significant increases of PCD fast-mode frequency
2 sec
Nos
tril
flow
(ml k
g–1 m
in–1
)
–160
–80
0
Mou
th p
ress
ure
(cm
H2O
)
–0.6
PCD
pre
ssur
e(c
m H
2O)
–0.065
0
0.065SM
FM
Vel
umim
peda
nce
(0.3
V)
–0.3
0
(d)
(a)
(b)
(c)
Time beneath
FIGURE 6 Simultaneous ventilation recordings of (a) nostril flow (b) mouth cavity pressure, (c) velum chamber impedance and (d) pharyngo-cutaneous
duct (PCD) pressure in a resting Eptatretus stoutii under control conditions. (d) Two types of ventilatory pressure cycles were detected in the PCD, slowmode (SM) which appeared to be generated by the gill pouches and fast mode (FM) which correlated with the velum movement. , Ventilatory rhythmsin fast mode (FM), while the larger brackets indicate the slow pressure wave of slow mode (SM). , Line highlighting patterns of simultaneousventilatory movements: lowest nostril flow [least negative value in (a)], lowest mouth pressure [most negative value in (b)], velum chamber movementand highest PCD pressure. The lowest nostril flow and lowest mouth pressure were exactly 180� out of phase with nostril pressure seen in Figure 5
EOM AND WOOD 9FISH
(Figure 8c). The PCD fast-mode pressure amplitude (Figure 8f ) and
absolute pressure (Figure 8g) were significantly elevated, but mouth
cavity pressure amplitude (Figure 8d) and mouth cavity absolute pres-
sure (Figure 8e) were not changed. During the transition period, pres-
sure amplitudes gradually increased. Eventually the overall frequencies
from nostril duct, mouth cavity and PCD (fast mode) were synchronised
at about 34 min−1 (range = 32.0–35.5 min−1). These values were
matched to the frequency of body undulation in swimming performed
by the animal (average 34.2 min−1). The impedance trace became noisy
during swimming events and could not be reliably interpreted, so it is
unclear whether velum frequency also changed or not. Our visual
observations confirmed that the dental plates were not exposed and
remained closed during spontaneous swimming.
4 | DISCUSSION
A simple model of our understanding of the ventilatory mechanism in
Eptatretus stoutii based on observations made in the present study is
shown in Figure 1b.
y= - 0.0343x + 3.9526 R2 = 0.3428, P < 0.001
y = - 0.0050x + 0.0671R2 = 0.4152, P < 0.001
y= - 0.0002x + 0.0162R2 = 0.5188, P < 0.001
y= - 0.0447x + 10.3920R2 = 0.2586, P < 0.001
(a) (b)
(d)(c)Flow (ml kg -1 min -1)
Stro
keVo
lum
e(
)
-500 -400 -300 -200 -100 00
10
20
30
Pressure Amplitude (cm H2O)
Stro
keVo
lum
e(
)
0.00 0.05 0.10 0.150
10
20
30
Vent
ilato
r yIn
d ex
()
-600 -400 -200 00
1
2
3
4
Pres
sure
Am
plitu
de(
)
-600 -400 -200 00.00
0.05
0.10
0.15
0.20
Freq
uenc
y(
)
-600 -400 -200 00
10
20
30
40
50
y= 0.0032x + 0.0244R2 = 0.2482, P < 0.001
(e)
min
-1cm
H2O
ml k
g-1
ml k
g-1cm
H2O
min
-1
Flow (ml kg -1 min -1)
Flow (ml kg -1 min -1) Flow (ml kg -1 min -1)
FIGURE 7 Linear regression relationships ( ) for 3134 data points from 42 Eptatretus stoutii. Nostril flow was plotted against (a) frequency,
(b) stroke volume, (c) pressure amplitude and (d) ventilatory index. (e) Stroke volume in relation to pressure amplitude. , 95% CI for theregression; , 95% prediction interval or population CI
10 EOM AND WOODFISH
200(a)
(b) (c)
(d) (e)
(f) (g)
P < 0.01
P < 0.001
P < 0.01 P < 0.05
P < 0.05 P < 0.05
100
0
–100
Nos
tril
flow
(ml k
g–1 m
in–1
)
–200
50
40
30
20
10Vel
ar fr
eque
ncy
(min
–1)
0
50
40
30
20
1013
th g
ill fa
st m
ode
freq
uenc
y (m
in–1
)0
3
2
1Mou
th c
avity
pres
sure
am
plitu
de (c
m H
2O)
0
1
0.5
–0.5
0
–1
–1.5
Mou
th c
avity
abso
lute
pre
ssur
e (c
m H
2O)
–20
4
2
3
1PCD
Fas
t mod
epr
essu
re a
mpl
itude
(cm
H2O
)
0C NC
*
*
*
*
*
*
*
*
*
*
***
MC S C NC MC S
0.8
0.6
0.4
0.2PCD
Fas
t mod
eab
solu
te p
ress
ure
(cm
H2O
)
0
FIGURE 8 Ventilatory variables recorded simultaneously under control conditions (C), during nostril coughing (NC), during mouth coughing (MC),
and during spontaneous swimming (S) in the same three Eptatretus stoutii. (a) Nostril flow rate, (b) velum frequency (there is no velar frequencyfor spontaneous swimming in panel as the velum impedance recording became noisy), (c) pharyngo-cutaneous duct (PCD) fast mode(FM) frequency (the pulsatility of flow and pressure, i.e., fast mode frequency, became equal to that of body undulations), (d) mouth-cavitypressure amplitude, (e) mouth-cavity absolute pressure, (f ) PCD FM pressure amplitude and (g) PCD FM absolute pressure. P values indicateoverall significance of the one-way ANOVA, and asterisks indicate significant differences from the Control Value (c)
EOM AND WOOD 11FISH
4.1 | Anatomical observations
Our anatomical studies indicate both similarities and differences in
E. stoutii from previous observations in the Myxinidae. As in the latter,
the nostril duct lies dorsal to the mouth cavity and is horizontally sep-
arated from it by the oronasohypophyseal septum (ONS), a simple
muscular membrane-like structure. The nostril duct leads directly to
the anterior velum chamber but in contrast to M. glutinosa which has a
short ONS (Dawson, 1963; Johansen & Strahan, 1963; Strahan,
1958), E. stouii has a relatively longer ONS, so the mouth cavity is con-
nected not to the velum chamber but to the anterior pharynx by a
bucco-pharyngeal aperture that lies posterior to the velum
(Figure 1b); this was confirmed by the silicone injection experiment
(Figure 2). Simultaneous recordings of pressure in the mouth cavity
and pressure and flow in the nostril revealed reciprocal patterns of
fluctuations at the frequency of velum contraction (dotted line in
Figure 6a,b), presumably due to passive distension and relaxation of
the ONS by the action of the velum pump. Owing to the ONS barrier
and the post-velum connection point of the bucco-pharyngeal aper-
ture, water exchange between the velum chamber and mouth cavity
probably does not normally occur (Figure 1b). Furthermore, the mouth
cavity is normally completely sealed (Figures 1b and 4) by the paired
dental plates and probably also by contraction of the bucco-
pharyngeal aperture when the animal is not feeding. If the short ONS
model of M. glutinosa were present, with the anterior connection of
the velum chamber to both the nostril duct and mouth chamber, then
the rhythmic movement of the velum would generate qualitatively
similar pressure patterns in the two chambers, in contrast to the recip-
rocal patterns seen in the present study.
4.2 | Patterns of ventilation
In accord with many previous studies on Myxinidae and two on Eptatre-
tidae (Coxon & Davison, 2011; Perry et al., 2009b), our observations indi-
cate that ventilation in the E. stoutii is primarily driven by the rhythmic
contraction of the velum apparatus, which creates a fluctuating but con-
tinuous negative pressure in the nostril (Figure 1b). The resulting inflow
through the nostril is pulsatile but continuous, never dropping to zero
between velum contractions, in agreement with Steffensen et al. (1984)
and Perry et al. (2009b), so water flow through the gills is also probably
continuous. The pressure pulses in the nostril caused by the velum-
contraction cycle could also be detected in the PCD and in the mouth
cavity, where the frequencies (fast-mode frequency only for PCD) were
the same as those of the impedance recordings from the velum.
Indeed, two types of ventilatory movements were detected in the
PCD under resting conditions: a SM frequency of 4–5 positive pressure
fluctuations per minute onto which was superimposed very small ampli-
tude pressure fluctuations representing the fast-mode (FM) frequency of
Nos
tril
flow
(ml k
g–1 m
in–1
)
–200
0
200
Mou
th p
ress
ure
(cm
H2O
)
–1
PCD
pre
ssur
e(c
m H
2O)
–0.5
0
0.5
Vel
umim
peda
nce
(0.0
01V
)
0
1
(d)
(a)
(b)
(c)
2 sec
Dye injec�on [Nostril coughing]
Time beneath
*
FIGURE 9 Simultaneous recordings of (a) nostril flow (b) mouth cavity pressure, (c) velum chamber impedance and (d) pharyngo-cutaneous duct
(PCD) pressure in a Eptatretus stoutii where nostril coughing was induced by dye inhalation into the nostril (left-hand ). Following dyeadministration and prior to the actual nostril cough, the apparent frequency slowed and the pressure became more positive and then morenegative in the mouth cavity (*). Then the actual cough occurred (right-hand ) with simultaneous pressure pulses in the nostril duct [with flowreversal; (a)], the mouth cavity (b), and the PCD (d), and a rise in the impedance trace from the velar chamber (c)
12 EOM AND WOODFISH
velum contractions (Figure 6d and Table 2). Anatomically, the velum
chamber is connected to the paired gill pouches and the PCD via the long
pharynx (Figure 1b), so the pressure wave from the rhythmic movement
of the velum chamber could be transmitted to the measurement site at
the PCD. We interpret the larger SM pressure pulses as evidence of
active contraction of the gill pouches or PCD and their associated ducts,
which thereby help power exhalation (Figure 1b). While this possibility
was initially denied in M. glutinosa (Strahan, 1958), it was later proven to
occur in this species (Johansen & Hol, 1960; Johansen & Strahan, 1963).
These authors described a “peristaltic wave from the proximal end of the
afferent (gill) duct to the proximal end of the efferent duct,”which is prob-
ably the same as our SM contractions. However, it is not clear from these
studies on Myxinidae whether the gill pouch contractions occur at a lower
rate than the velum chamber contractions. Eptatretus stoutii appears to
operate a two-phase ventilatory system with a faster suction pump for
inhalation and a much slower force pump for exhalation (Figure 1b). We
saw no evidence of inhalation through the gill pouches or PCD.
Under control conditions, E. stoutii showed an all-or-nothing pat-
tern of breathing, either ventilating rhythmically or not at all; 35% of
the animals examined exhibited no spontaneous ventilation. Regular
rhythmic ventilation seemed to be more common after sunset, per-
haps reflecting the nocturnal nature of these animals. During periods
of apnea, mild stressors such as pinching or gently touching the skin
would usually cause ventilation to start up, though in some animals it
would soon stop again. These periods of ventilatory arrest are in
accord with the ability of this species to tolerate anoxia and to
suppress metabolic rate for long periods (Cox et al., 2011). As heart
rate was not recorded in the same animals, we do not know whether
the heart slowed and kept beating regularly with increased cardiac
stroke volume as it does during experimental anoxia (Cox et al., 2010);
this is an important topic for future investigation.
When breathing rhythmically, E. stoutii exhibited ventilatory flow
rates of −125 to −155 ml kg−1 min−1 at rest (Tables 1 and 2). These
values are midway between the −45 ml kg−1 min−1 reported forM. gluti-
nosa by Steffensen et al. (1984) and the −235 ml kg−1 min−1 reported by
Perry et al. (2009b) for E. stoutii, the latter through a method almost iden-
tical to that of the current study. However, Perry et al. (2009b) did not
report episodes of apnea or coughing, so it is possible that their animals
were less settled than those of the present study. Regardless, these rest-
ing ventilatory flow rates are very comparable with those of teleosts
(Perry et al., 2009a; Wood et al., 1979), which is surprising considering
that restingṀO2 is exceptionally low in E. stoutii (Cox et al., 2011; Giaco-
min et al., 2018; Munz & Morris, 1965; Perry et al., 2009b), only about
one third of typical rates in comparably sized teleosts (Clarke & Johnston,
1999). This anomaly was previously noted by Perry et al. (2009b) and
suggests that O2 extraction efficiency at the gills is very low, which is sur-
prising as it is generally believed that a counter-current exchange system
operates in the gills of hagfish. However, the fact that resting E. stoutii
spends substantial periods in apnea suggests that it may hold previously
inhaled water in the gill pouches during this time to extract the maximum
possible amount of O2 from that water. Possibly, time-averaged O2
extraction efficiency could be much higher than during the periods of
Nos
tril
flow
(ml k
g–1 m
in–1
)
–200
0
200
Mou
th p
ress
ure
(cm
H2O
)
–1
PCD
pre
ssur
e(c
m H
2O)
–0.5
0
0.5
Vel
umim
peda
nce
(0.0
01V
)
0
1
(d)
(a)
(b)
(c)
[Mouth coughing]
Time beneath
Dye injec�on Mouth coughing
2 sec
*
FIGURE 10 Simultaneous recordings of (a) nostril flow (b) mouth cavity pressure, (c) velum chamber impedance and (d) pharyngo-cutaneous duct
(PCD) pressure in Eptatretus stoutii where mouth coughing was induced by dye injection into the mouth cavity. Usually (but not always) beforemouth coughing, fish showed a large reduction (*) of the PCD pressure to negative values
EOM AND WOOD 13FISH
active ventilation alone. A study of O2 extraction dynamics at the gills
relative to the breathing pattern is required to clarify the situation.
Eptatretus stoutii in the present study were able to increase their
ventilatory flow rate to at least 400 ml kg−1 min−1 during experimen-
tal disturbances (Figure 7), comparable with the elevations reported
by Perry et al. (2009b) in response to hypoxia or hypercapnia. Our
data clearly show that E. stoutii are capable of large variations of venti-
latory flow by changing not only velum frequency (Figure 7a) but also
stroke volume (Figure 7b) which differs from the conclusion of Perry
et al. (2009b) that only changes in frequency occur. Furthermore,
increases in stroke volume were correlated with increases in nostril
pressure amplitude (Figure 7e), indicating that the velum chamber
contraction can become more powerful. Interestingly, most E. stoutii
in this study showed increasing frequency or increasing stroke volume
separately, apparently dependent on the nature of the treatment or
types of stressors. For example, E. stoutii mostly increased velum fre-
quency in response to tactile disturbance, similar to the responses
reported by Perry et al. (2009b) during hypoxia and hypercapnia, but
mostly increased stroke volume first and then velum frequency later
under circumstances of HEA treatment or ammonium salt injection.
The ventilatory index proved useful in capturing this variability and
was strongly correlated (r = 0.64, P < 0.001) with ventilatory flow
rate, providing a useful proxy for the latter (Figure 7d). In this regard,
despite the very different breathing mechanism, E. stoutii is similar to
many teleosts, where the ventilatory index is also a useful proxy for
ventilatory flow (Perry et al., 2009a).
4.3 | Coughing
In the present study, two types of ventilatory flow reversals were
seen, which we have termed nostril coughing and mouth coughing.
These were often induced by the presence of dye in the respective
cavities. Nostril coughing occurred spontaneously far more often than
mouth coughing and a related study found that spontaneous coughing
frequency was temperature-dependent (Giacomin et al., 2018), sug-
gesting that coughing is a normal part of ventilation. Obviously cough-
ing events will serve to clear irritant particles and noxious dissolved
substances, but in future studies it will be of interest to investigate
whether they play any direct role in respiratory gas exchange. Hag-
fishes are known to have not only an olfactory-like chemosensory
nasal epithelium in the nostril duct but also Schreiner organs scattered
on the body surface. These are thought to be sensory cells due to
numerous sensory buds composed of microvilli on the apical cell sur-
face (von During & Andres, 1988). Therefore, dye in the nostril was
probably sensed by the nasal epithelium or Schreiner organs while
dye in the mouth was probably sensed by the Schreiner organs. Inter-
estingly, the two previous investigations on ventilation in the Eptatre-
tidae made no mention of flow reversals (Coxon & Davison, 2011;
Perry et al., 2009b). However, as discussed below, if only velum fre-
quency is monitored, as in the study of Coxon and Davison (2011),
coughing events could well be missed.
Nostril coughing appears to be the same phenomenon as sneez-
ing, described previously in the Myxinidae (Johansen & Hol, 1960;
Nos
tril
flow
(ml k
g–1 m
in–1
)
–200
0
200Control period Swimming period
Mou
th p
ress
ure
(cm
H2O
)
–1
PCD
pre
ssur
e(c
m H
2O)
–0.5
0
0.5
Vel
umim
peda
nce
(0.0
01V
)
0
1
(d)
(a)
(b)
(c)
Time beneath
[Swimming performance]
10 sec
FIGURE 11 Simultaneous recordings of (a) nostril flow, (b) mouth cavity pressure, (c) velum chamber impedance and (d) pharyngo-cutaneous duct
(PCD) pressure prior to and during a period of spontaneous swimming in Eptatretus stoutii
14 EOM AND WOODFISH
Johansen & Strahan, 1963; Steffensen et al., 1984; Strahan, 1958).
Strahan (1958) hypothesised that this was largely due to contraction
of the pharyngeal constrictor muscle that encircled the posterior part
of the velum chamber and this was confirmed by Johansen and Hol
(1960) by X-ray cinematography of radio-opaque contrast medium.
Their study also implicated contraction of the velum chamber itself.
In E. stoutii, after dye administration to the nostril and prior to the
actual nostril cough, pressure recordings in the mouth cavity indicated
that the apparent velum frequency in the mouth cavity slowed (even
though the true velum frequency did not change) and the mouth pres-
sure first increased then decreased greatly. During the cough itself
which ensued within 5 s, the fish increased absolute pressures and
pressure amplitudes in the nostril duct, mouth cavity and PCD simul-
taneously, reversal of flow in the nostril occurred to outflow values
comparable with normal inflow values and the impedance trace sug-
gested contraction of the velum chamber itself (Figures 8 and 9). This
resulted in ejection of the dye first through the nostril duct, then via
the PCD (major route) and paired gill pouches (minor route), after
which the fish immediately recovered the unidirectional ventilation.
The slowed frequency and the biphasic pressure cycle in the mouth
cavity (Figure 9b) appeared to be a key event and may have reflected
tight closure of the bucco-pharyngeal aperture, so that noxious mate-
rial did not enter the mouth during the nostril cough. The contractile
force for the overall event probably originated from contraction of the
pharyngeal constrictor muscle and the posterior part of the velum
chamber, as deduced by Strahan (1958) and Johansen and Hol (1960).
In mouth coughing, dye was ejected only through the mouth.
Johansen and Hol (1960) described an event in M. glutinosa that may
have been the same, where contrast media was ejected through the
mouth from the gill area, powered by contraction of the gill pouches
and associated ducts, as well as the musculature of the pharynx and
body wall. Eptatretus stoutii often (but not always) exhibited a large
relaxation of the PCD producing very negative pressures (Figure 10d)
before the surge of positive pressure in all compartments (Figure 8d–
g) that ejected dye anteriorly through the mouth. None exited posteri-
orly through the gill pouches, PCD, or nostril. The negative gill pres-
sure perhaps served to drain water from the pharynx into the gill
pouches, preparatory to generating back pressure and flow to eject
the dye out through the mouth. The bilaterally paired dental plates
were opened during ejection, probably by protractor muscles and
retractor muscles located ventral to the mouth cavity. The velum
chamber must have been shut off from the pharynx at this time, per-
haps by the pharyngeal constrictor muscle that encircles the posterior
margin of the velum chamber (Johansen & Hol, 1960; Strahan, 1958).
This would explain why there was no ejection through the nostril and
why nostril flow dropped to zero (Figure 8a) while velum frequency
continued unchanged (Figure 8b). As the mouth is not used in normal
breathing, it may be that mouth coughing is mainly used to clear irri-
tant particles ingested during feeding.
4.4 | Ventilation during swimming
To the best of our knowledge, the current observations are the first
data on hagfish ventilation during swimming. Hagfishes are known as
anguilliform locomotors; i.e., eel-like swimmers that use lateral
oscillations of the posterior 2/3 of the body while the head remains
oriented in a straight and forward direction (Long et al., 2002). In our
study, the relatively heavy flow-probe attached to the silicone tubing
in the nostril duct restricted movement of the fish’s head. During
spontaneous swimming, frequencies of nostril duct and mouth cavity
were synchronised with the frequency of the body undulations. The
absolute pressure and pressure amplitude increased in the PCD and
the SM frequency could no longer be seen; only the fast-mode fre-
quency could be detected at this site (Figure 11d), while there were
no changes in mouth pressures (Figure 11b). The velar impedance
trace usually became noisy and undecipherable during swimming
(Figure 11c), so it is unclear whether velar frequency increased or not
(Figure 8b). It seems likely that the increased fast-mode frequency
was generated by body undulation not by velum movement during
spontaneous swimming performance, as mean ventilatory flow did not
change (Figures 8a and 11a). Overall, these observations suggest that
E. stoutii may transfer some of the work of breathing to the swimming
muscles by using ram ventilation. This would occur only via the nostril
as the dental plates remained closed. Otherwise, the ventilatory
mechanism appeared to be basically the same as at rest (Figure 1b).
However, in future, measurements in truly free-swimming hagfishes
will be required to confirm these ideas.
Overall, our observations indicate that E. stoutii has a complex,
unique ventilatory system (Figure 1b) similar but not identical to that
of the Myxinidae. Key features include a two-phase unidirectional
pumping system with a fast suction pump (the velum) which inhales
water through the nostril and a much slower force pump (the gill
pouches, PCD and associated structures) for exhalation. Water flow is
continuous. Two types of coughing (flow reversals) occur: nostril
coughing (sneezing) where water and irritant materials are expelled
forcefully through both the nostril and gill pouches and mouth cough-
ing, where they are expelled only through the mouth. The mouth,
which joins the pharynx posterior to the velum chamber, plays no role
in ventilation of resting, swimming and nostril-coughing E. stoutii as
the dental plates remain closed, but is probably an important route for
inhalant water and food particles in feeding E. stoutii. Increases in ven-
tilatory flow can be achieved by both increases in velum frequency
and increases in stroke volume, the latter reflected in increases in nos-
tril pressure amplitude. Ventilatory index and is strongly correlated
with ventilatory flow and therefore provides a useful index for the lat-
ter. When the fish is actively breathing, ventilatory flow rates are rela-
tively high, in the range of teleosts, despite very low O2 consumption
rates, but long periods of spontaneous apnea are common. Ram venti-
lation powered by the swimming muscles may occur during anguilli-
form swimming, but this observation remains to be confirmed. In
future, it will be of great interest to understand how this complex sys-
tem is controlled and co-ordinated at a central (Central Nervous Sys-
tem) and peripheral level (chemoreceptors) and to study what
happens to breathing during feeding, when the hagfish opens its
mouth and engulfs or immerses its head its prey.
ACKNOWLEDGEMENTS
We wish to thank the research coordinator, E. Clelland and staff of
Bamfield Marine Science Centre for their assistance and hospitality.
EOM AND WOOD 15FISH
G. Dal Pont (Universidade Federal do Parana, Brazil), K. T. Stiller (UBC)
and M. Ferreira (INPA, Brazil) helped with the laboratory work at Bam-
field. A. Cremazy (UBC) and G. Monnet (UBC) kindly helped with sta-
tistics. We also thank A. P. Farrell (UBC) who kindly lent us the flow-
meter system.
Author contributions
J. E. generated data. C. M. W. and J. E. analyzed data and prepared
the manuscript together.
REFERENCES
Bartels H. The gills of hagfishes. In: Jorgensen JM, Weber RE, Malte H,eds. The biology of hagfishes. New York, NY: Chapman & Hall; 1998:205-222.
Clarke A, Johnston NM. Scaling of metabolic rate with body mass and tem-perature in teleost fish. Journal of Animal Ecology. 1999;68:893-905.
Cole FJ. A monograph on the general morphology of the Myxinoid fishesbased on a study of Myxine. Part I. The anatomy of the skeleton. Trans-actions of the Royal Society of Edinburgh. 1905;41:749-788.
Cox GK, Sandblom E, Farrell AP. Cardiac responses to anoxia in the Pacifichagfish, Eptatretus stoutii. The Journal of Experimental Biology. 2010;213:3692-3698.
Cox GK, Sandblom E, Richards JG, Farrell AP. Anoxic survival of the Pacifichagfish (Eptatretus stoutii). Journal of Comparative Physiology B. 2011;181:361-371.
Coxon SE, Davison W. Structure and function of the velar muscle in theNew Zealand hagfish Eptatretus cirrhatus: Response to temperaturechange and hypoxia. Journal of Fish Biology. 2011;79:280-289.
Dawson JA. The oral cavity, the ‘Jaws’ and the horny teeth of Myxine gluti-nosa. In: Brodal A, Fange R, eds. Biology of Myxine. Oslo, Ostlandet:Universitetsforlaget; 1963:231-255.
Giacomin M, Eom J, Schulte PM, Wood CM. Acute temperature effects onmetabolic rate, ventilation, diffusive water exchange, osmoregulationand acid-base status in the Pacific hagfish (Eptatretus stoutii). Journal ofComparative Physiology B. 2018. https://doi.org/10.1007/s00360-018-1191-0.
Goodrich ES. Studies on the structure and development of vertebrates.London, England: MacMillan and Co. Limited; 1930.
Gustafson G. On the biology of Myxine glutinosa. Arkiv for Zoologie. 1935;28:1-8.
Johansen K, Hol R. A cineradiographic study of respiration in Myxine gluti-nosa. The Journal of Experimental Biology. 1960;37:474-480.
Johansen K, Strahan R. The respiratory system of Myxine glutinosa L. In:Brodal FR, ed. Biology of Myxine. Oslo, Ostlandet: Universitetsforlaget;1963:352-371.
Long JH, Adcock B, Root RG. Force transmission via axial tendons in undu-lating fish: a dynamic analysis. Comparative Biochemistry and PhysiologyA. 2002;133:911-929.
Malte H, Lomholt JP. Ventilation and gas exchange. In: Jorgensen JM,Weber RE, Malte H, eds. The biology of hagfishes. New York, NY: Chap-man & Hall; 1998:223-234.
Munz FW, Morris R. Metabolic rate of the hagfish, Eptatretus stoutii(Lockington) 1878. Comparative Biochemistry and Physiology. 1965;16:1-6.
Oisi Y, Ota KG, Kuraku S, Fujimoto S, Kuratani S. Craniofacial developmentof hagfishes and the evolution of vertebrates. Nature. 2013;493:175-181.
Perry SF, Jonz M, Gilmour KM. Oxygen sensing and the hypoxic ventila-tory response. In: Farrell A, Richards JG, Brauner CJ, eds. Fish physiol-ogy. San Diego, CA: Academic Press; 2009a:193-253.
Perry SF, Vulesevic B, Braun M, Gilmour KM. Ventilation in Pacific hagfish(Eptatretus stoutii) during exposure to acute hypoxia or hypercapnia.Respiration Physiology & Neurobiology. 2009b;167:227-234.
Steffensen JF, Johansen K, Sindberg CD, Sorensen JH, Moller JL. Ventila-tion and oxygen consumption in the hagfish, Myxine glutinosa L. Journalof Experimental Marine Biology and Ecology. 1984;84:173-178.
Strahan R. The velum and the respiratory current of Myxine. Acta Zoolo-gica. 1958;39:227-240.
von During M, Andres K. Skin sensory organs in the Atlantic hagfish Myx-ine glutinosa. In: Jorgensen M, Weber RE, Malte H, eds. Biology of hag-fishes. London, England: Chapman and Hall of Thomson Science; 1988:499-511.
Wood CM, McDonald BR, McDonald DG. Respiratory, ventilatory and car-diovascular responses to experimental anaemia in the starry flounder,Platichthys stellatus. The Journal of Experimental Biology. 1979;82:139-162.
How to cite this article: Eom J, Wood CM. The ventilation
mechanism of the Pacific hagfish Eptatretus stoutii. J Fish Biol.
2019;1–16. https://doi.org/10.1111/jfb.13885
16 EOM AND WOODFISH