the value of cleaning - massco maintenance supply · the value of cleaning ... dirft: doing it...
TRANSCRIPT

2013 Media Kit and 2013 Sponsorship Opportunities
THE VALUE OF CLEAN HOW CLEANING IMPROVES YOUR BOTTOM LINE
Table of Contents
Executive Summary .................................................................................................................... 1
Industry Overview ...................................................................................................................... 2
Economic Impact ......................................................................................................................... 2
Service Providers ........................................................................................................................ 2
Quality Standards ...................................................................................................................... 2
The Value of Cleaning ................................................................................................................. 3
Work Ticket Resolution ............................................................................................................. 4
Service Provider Costs ................................................................................................................ 4
Customer Costs (Cost per Work Ticket) ..................................................................................... 4
Absenteeism ................................................................................................................................. 6
Hidden Costs of Absenteeism...................................................................................................... 7
Healthy Workplace Study ........................................................................................................... 8
Building Occupant Productivity - Presenteeism ................................................................. 12
Effects of Presenteeism .............................................................................................................. 12
Impact of Cleanliness on Presenteeism ..................................................................................... 12
Image Enhancement - Customer Satisfaction ...................................................................... 14
The Cleanliness - Satisfaction Connection ............................................................................... 14
Retail Store Image Enhancement .............................................................................................. 15
Restroom Cleanliness Survey ................................................................................................... 16
Asset Preservation ..................................................................................................................... 18
Asset Preservation: Carpeting .................................................................................................. 18
Asset Preservation: Hard Surface Floors .................................................................................. 20
Energy Savings: Daytime Cleaning ....................................................................................... 22
EPA Region 8 Headquarters ..................................................................................................... 22
Daytime Cleaning at University of Washington...................................................................... 22
Healthy High Performance Cleaning ....................................................................................... 23
How to Estimate Energy Savings ............................................................................................. 24
Healthcare-Associated Infections (HAI)............................................................................... 25
Importance of Cleaning ............................................................................................................. 26

Langone Medical Center Study ................................................................................................ 26
Mt. Sinai’s Medical Center Study ............................................................................................ 26
HAI Prevention Resource ......................................................................................................... 27
Next Steps ................................................................................................................................... 28
Acknowledgments .................................................................................................................... 29
About the Authors .................................................................................................................... 29
About ISSA ................................................................................................................................ 29
Bibliography .............................................................................................................................. 30

i
Disclaimer
This white paper is for informational purposes only and is provided “as is.” ISSA, the
American Institute for Cleaning Sciences, and the authors (hereinafter collectively
referred to as “ISSA”) hereby disclaim any and all warranties, express or implied,
including without limitation, any and all warranties concerning the accuracy or
completeness of the information contained herein, its fitness or appropriateness for a
particular purpose or use, its merchantability, its non-infringement of any intellectual
property rights, or any other matter. ISSA shall not be liable for any damages of any
nature whatsoever, whether direct or indirect, arising from or relating to the
publication, use of, or reliance on the information contained in this white paper,
including without limitation any and all special, indirect, incidental, compensatory,
consequential, punitive or other damages (including damages for personal injury
and/or bodily injury, property damage, loss of business, loss of profits, litigation or the
like), even if advised of the possibility of such damages.
Copyright 2012 by ISSA, Lincolnwood, Illinois. All rights reserved. No part of this
work may be reproduced, copied or distributed in any form or by any means without
express permission or consent of the publisher.

1
Executive Summary
The purpose of this ISSA white paper is to provide insights to facility decision makers
in a way that enables them to fully understand, evaluate, and justify their investments
in cleaning in ways they currently may not be considering.
Historically, cleaning has been viewed by facility managers and building owners as a
cost center. Consequently, decisions about cleaning expenditures have been one-
dimensional and focused on the amount spent to clean the facility. However, review of
the studies and empirical data reveals that cleaning activities impact a business’s
bottom line in numerous ways and that developing a deeper understanding of
cleaning’s economic benefits will produce greater savings.
Analysis of the data strongly supports the position that cleaning is economically
efficient and, thus, a relatively modest investment in cleaning produces substantial
returns. Using this information, facility mangers will be able to make better decisions
that leverage the money spent on cleaning to improve the bottom line.
Although there are many different ways to generate cost savings through cleaning
activities, this white paper focuses on the following categories:
1. Work ticket resolution costs
2. Occupant wellness: absenteeism
3. Occupant wellness: improved productivity
4. Image enhancement: customer satisfaction
5. Asset preservation
6. Energy savings
7. Reducing hospital associated infections (HAI)
ISSA selected the foregoing because they generate the greatest return on investment
(ROI) and most clearly demonstrate the value of cleaning.
ISSA reached out to and collaborated with industry stakeholders for documentation,
scientific studies, and research data. Additional studies and papers in the public
domain were also reviewed to determine the impact that cleaning would have on
overall cost of facility management and occupant wellness.
This white paper is accompanied by a software application and a PowerPoint
presentation that are free to ISSA members. The software application allows users to
input their data and calculate the ROI. In addition, ISSA offers members a video and
customizable customer leave-behind cards that are available at issa.com/value.
2
Industry Overview
Economic Impact
The janitorial service industry (SIC 7349/NAICS 561720) is part of the $33 billion facility
services industry (United States Economic Census, 2007). It is one of the largest and most
dynamic service industries in the world. There are more than 2.3 million service
workers (Bureau of Labor Statistics, U.S. Department of Labor, 2012) and in excess of
more than 53,000 building service contractors in the United States that provide cleaning
services to a variety of building types (United States Economic Census, 2007).
The U.S. Energy Information Administration Commercial Buildings Energy
Consumption Survey counted more than 4.9 million commercial buildings in the United
States with more than 71.6 billion square feet of floor space (Energy Information
Administration, 2003).
Service Providers
Cleaning firms have the opportunity to provide services to a wide range of clients. At
one end of the spectrum are commercial facilities such as office buildings, high-rise
office complexes, distribution facilities, food processing plants, hospitals, nursing
homes, airport and mass transit terminals, government offices, and industrial plants.
In addition to the contracted service sector, many universities, K-12 schools, healthcare,
hospitality, manufacturing, and other industries employ their own cleaning staffs.
The industry’s breadth and high degree of fragmentation are driven by relatively low
barriers to entry and only minimal differentiation. Consequently, janitorial services
have been largely cost driven. This cost-centered focus has led many contractors to cut
corners in order to remain competitive. The result is inconsistent service. Facility
decision makers have responded by using two approaches in tandem to deliver quality
services in a cost-effective manner: Quality Standards and The Value of Cleaning.
Quality Standards1
The ISSA Cleaning Industry Management Standard (CIMS) and CIMS-Green Building
1 In 2006, ISSA convened technical committees comprised of industry experts from different disciplines to
develop the framework for quality management principles for cleaning organizations. The result of their
efforts is the Cleaning Industry Management Standard (CIMS). CIMS applies to management,
operations, performance systems, and processes. A free copy of the standard, organizational checklist,
contract requirement wording, a list of certified firms and ISSA Certification Experts (I.C.E.) can be
downloaded at www.issa.com/cims (ISSA, 2009).

3
(CIMS-GB) criteria and certification program provide a powerful tool that can be used
to measure the quality of a cleaning organization's management structure, cleaning
operations and green cleaning services. The Standard sets forth the processes,
procedures, and supporting documentation proven to be characteristic of customer-
driven organizations. CIMS and CIMS-GB are divided into six areas of management
best practices:
1. Quality systems
2. Service delivery
3. Human resources
4. Health, safety, and environmental stewardship
5. Management commitment
6. Green Building (for CIMS-GB)
The Value of Cleaning
With the increased focus on sustainability and public health protection, progressive
firms are adopting a more holistic approach to cleaning. They have learned that
cleaning impacts a wide array of business functions and that relatively small
incremental investments in cleaning produce outsized gains for the organization. This
white paper identifies the business activities that cleaning impacts and quantifies the
returns that cleaning investments produce.

4
Work Ticket Resolution
In 1979, Phillip Crosby published his first business book, Quality Is Free (Crosby, 1979).
This quality management book would become popular at the time because of the crisis
in North American manufacturing quality. One of the key principles of his book was
DIRFT: “Doing It Right the First Time.” During the late 1970s and into the 1980s, North
American manufacturers were losing market share to Japanese products largely due to
the superior quality of the Japanese manufactured goods.
The premise of Crosby’s work was that every product or service has a requirement: a
description of what the customer needs. When a particular product or service meets
that requirement, it has, by definition, achieved quality. Crosby estimated that poor
quality can cost an organization 30 percent of revenue. He believed that quality
management should include the following: quality planning, quality assurance, quality
control, statistical gathering, and systems that place quality in its proper context.
Similarly, cleaning requires completing a series of tasks in multiple areas. As such,
even a relatively small facility requires successfully completing literally hundreds of
individual tasks. Thus, it is easy to see how errors can quickly mount up. Poor
cleaning manifests itself in numerous corrective service requests. These service failures
impose costs on both the customer and service provider.
It should also be noted that reductions in the scope of work typically produce
corresponding increases in the number of work tickets generated. Ironically, the
savings obtained by reducing the scope of work are often eclipsed by the costs of
resolving service issues.
Service Provider Costs
Service failures are costly for service providers because additional labor is required to
correct each deficiency. In addition, each failure involves not only a response, but also a
customer interaction that consumes management resources to resolve the cleaning
deficiency; the cost to correct the issue goes beyond the work ticket resolution cost. For
example, the cost of refinishing a floor may double if not performed correctly or if there
is damage to the substrate. Floor replacement costs can be in the thousands of dollars.
The true savings associated with quality cleaning operations is the investment in
reduced operating costs, asset preservation, and client satisfaction.
Customer Costs (Cost per Work Ticket)
Cost per Work Ticket (CPT) is a very effective metric to “monetize” the impact of an
investment in quality cleaning operations. Cost per Ticket is obtained by dividing the
total annual operating expense by the annual number of tickets handled. Operating

5
expense includes all employee salaries, overtime pay, benefits, incentive compensation,
time, and miscellaneous expenses required to address complaints about cleaning.
The cost of resolving an issue includes the cost to receive added work requests resulting
from insufficient cleaning, time/cost to create a ticket, time/cost to schedule rework or
remediate the situation, time/cost to complete the added task, time/cost to assess the
rework to ensure satisfaction, and time/cost to communicate completion to the occupant
originating the request.
While actual work ticket resolution costs vary from organization to organization, the
costs are analogous to those required to process an invoice. According to the Institute
for Supply Management (ISM, 2004), Aberdeen Group (Aberdeen, 2004) and Profit
Planning Group (Bates, 2010), invoice processing costs may range anywhere from $13-49
each. This includes the cost of labor and multiple steps in order processing, order
placement, management approval, and vendor interaction.
An average Cost per Ticket can be developed using the average of all work tickets over
a representative period of time. It also can be segmented into specific work ticket
activities for more detailed analysis of improvement when investing in a certain
cleaning function, increased frequency in a specific facility area type, or changes in
cleaning tactics.

6
Absenteeism
One of the many benefits of a clean facility is the reduction of harmful contaminants in
the indoor environment. A clean and hygienic facility gives building occupants a visual
comfort level and reduces potential risks that may be associated with buildings that are
not as clean. Although there are many studies that address improved indoor air quality
and the risks associated with dust and bacteria on surfaces, few have demonstrated
how health risks due to inadequate cleaning impact building occupant personnel costs
and, ultimately, a business’s bottom line.
The research that follows addresses the connection between cleaning and the spread of
illness, which manifests itself in employee lost work days (absenteeism). Absenteeism
is a substantial cost to businesses that can be reduced through proper cleaning practices.
An Absent Management Study was conducted in 2011 by Chartered Institute of
Personnel and Development (CIPD) (The Chartered Institute of Personnel and Development,
2011). CIPD is an internationally recognized company with more than 135,000
members across 120 countries. It is one of the world's largest human resource
organizations.
The CIPD study gathered data from 592 organizations across the UK, employing more
than 2 million employees. The study documented the average days of absenteeism per
employee in a variety of work settings, along with their estimated costs to employers.
The average sick days per employee per year were 7.7 days (Table 1). CIPD determined
the average cost of absences to be £673 ($869 USD) per employee per year. Illnesses
such as colds, flu, stomach upsets, and headaches were the most common cause of
short-term absences.
Table 1: Average Level of Employee Absence, All Employees2
Average working time lost per year
(%)
Average number of days lost
per employee per year
Mean
Standard
Deviation
5%
Trimmed
Mean
Mean Standard
Deviation
5%
Trimmed
Mean
2011: All Employees 3.8 3.5 3.4 8.7 8 7.7*
2010: All Employees 3.4 1.9 3.2 7.7* 4.3 7.4
Base: 403 (2011); 429 (2010)
2 A 5 percent trimmed mean was used because the large standard deviation shows there is high variation
across organizations, with some reporting extremely high levels of absence. In 2010 the arithmetic mean
was used because the standard deviation was within acceptable limits, showing less variation in the
absences reported by organizations. Table 1 includes the mean and 5 percent trimmed mean for reference.

7
A study published in the Journal of Occupational Environmental Medicine in 2003 reported
that, based on a random sample of 28,902 United States workers, health-related lost
productive time (LPT) costs employers $225.8 billion per year, or $1,685 per employee
per year (Stewart, 2003).
That study calculated absenteeism as the sum of hours per week absent from work for a
health-related reason. Cost impact is estimated by multiplying lost productive time
(absence hours plus hours lost from reduced performance) by the individual worker's
hourly labor cost. This is the recommended method of calculating the basic impact of
absenteeism and its cost to the organization.
Hidden Costs of Absenteeism
While some organizations may track worker absenteeism, thus providing preliminary
data useful in connecting cleaning impact on personnel costs, they may be missing all
the absenteeism costs involved.
A 2008 survey conducted by Mercer/Marsh (Kronos Consulting & Mercer, LLC., 2008)
identified the hidden costs of absenteeism. The survey found that, in addition to the
payroll cost of the absent employee, organizations must hire temporary labor or offer
overtime to cover the absent employee’s responsibilities and that the “hidden costs”
should be factored into absenteeism calculations. To do so, multiply the additional
hourly costs by the number of hours incurred and add this figure to the absent
employee’s direct costs.
The survey also revealed that many employers fail to account for the 36 percent in
administrative expenses that it takes to manage absence benefits. This includes tracking,
reviewing, and processing the absence by company staff. Once that cost is determined,
often as an annual percentage, it can be evenly divided by the total number of
employees to determine the average per employee. It then is added to the average
direct and indirect labor costs above, per employee.
Still more impact was revealed by the Mercer/Marsh survey: the disruption in the labor
supply affects productivity, even with replacement staff. This could lead to lost sales,
late delivery of goods/services, customer dissatisfaction and loss of revenue.
Respondents to the survey reported that unplanned absences caused a 54 percent
decrease in productivity/output and a 39 percent drop in sales/customer service. If an
organization can estimate these additional costs, the annual average cost of lost revenue
per employee then would be increased.
8
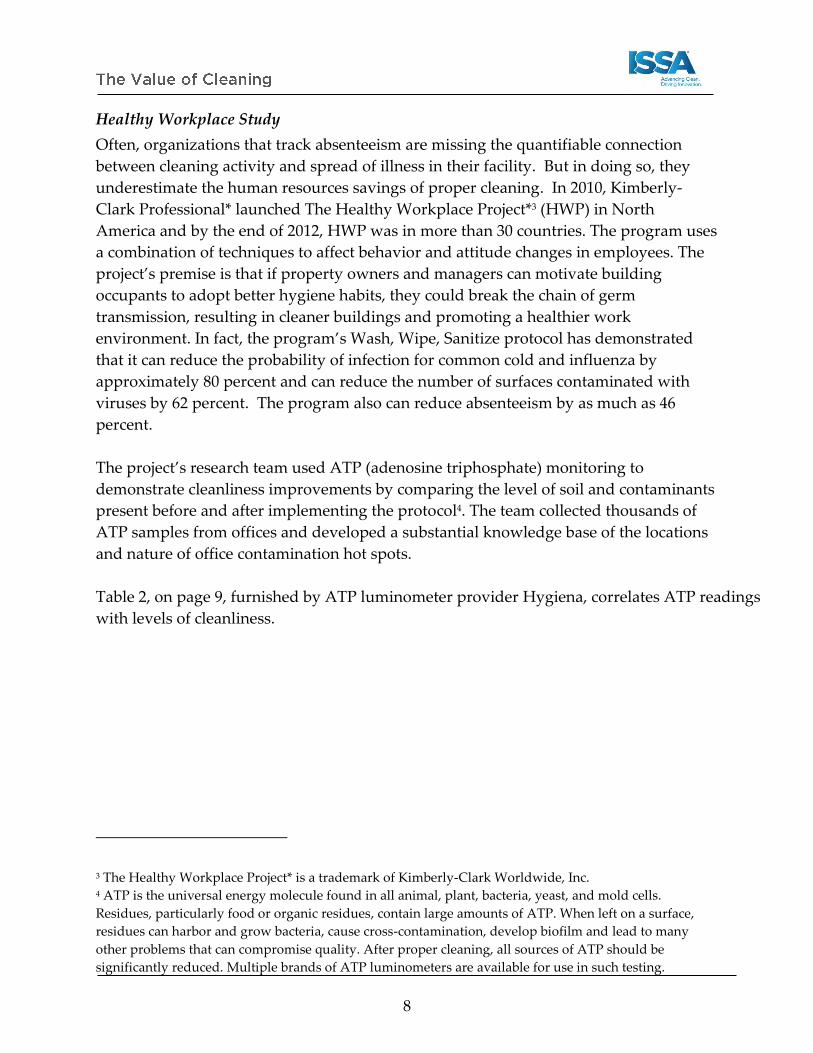
Healthy Workplace Study
Often, organizations that track absenteeism are missing the quantifiable connection
between cleaning activity and spread of illness in their facility. But in doing so, they
underestimate the human resources savings of proper cleaning. In 2010, Kimberly-
Clark Professional* launched The Healthy Workplace Project*3 (HWP) in North
America and by the end of 2012, HWP was in more than 30 countries. The program uses
a combination of techniques to affect behavior and attitude changes in employees. The
project’s premise is that if property owners and managers can motivate building
occupants to adopt better hygiene habits, they could break the chain of germ
transmission, resulting in cleaner buildings and promoting a healthier work
environment. In fact, the program’s Wash, Wipe, Sanitize protocol has demonstrated
that it can reduce the probability of infection for common cold and influenza by
approximately 80 percent and can reduce the number of surfaces contaminated with
viruses by 62 percent. The program also can reduce absenteeism by as much as 46
percent.
The project’s research team used ATP (adenosine triphosphate) monitoring to
demonstrate cleanliness improvements by comparing the level of soil and contaminants
present before and after implementing the protocol4. The team collected thousands of
ATP samples from offices and developed a substantial knowledge base of the locations
and nature of office contamination hot spots.
Table 2, on page 9, furnished by ATP luminometer provider Hygiena, correlates ATP readings
with levels of cleanliness.
3 The Healthy Workplace Project* is a trademark of Kimberly-Clark Worldwide, Inc. 4 ATP is the universal energy molecule found in all animal, plant, bacteria, yeast, and mold cells.
Residues, particularly food or organic residues, contain large amounts of ATP. When left on a surface,
residues can harbor and grow bacteria, cause cross-contamination, develop biofilm and lead to many
other problems that can compromise quality. After proper cleaning, all sources of ATP should be
significantly reduced. Multiple brands of ATP luminometers are available for use in such testing.

9
Table 2: Hygiena ATP Levels of Cleanliness5
Hygiena ATP Levels of Clean Relative Light Units (RLU)
Ultra Clean
Sterile surfaces and food preparation areas 0-10
Very Clean
Critical touch points 11-30
Good Clean
Floor requirement and typical microfiber performance 31-80
Somewhat Dirty
Caution: Surface should be cleaned and has some risk of
contamination from disease-causing bacteria
81-200
Dirty
Warning: Surface needs cleaning and has medium risk of
contamination from disease-causing bacteria
201-500
Very Dirty
Danger: Surface needs cleaning and has a medium to high risk
of contamination from disease-causing bacteria
501-1,000
Filthy
Danger: Surface needs cleaning and has a high risk of
contamination from disease-causing bacteria
>1,000
The research team found in their monitoring that the percentage of office surfaces tested
and found to have high levels of contamination (an ATP count of 300 or higher),
includes:
• 75 percent of break room sink faucet handles;
• 48 percent of microwave door handles;
• 27 percent of keyboards;
• 26 percent of refrigerator door handles;
• 23 percent of water fountain buttons; and
• 21 percent of vending machine buttons.
5 Kimberly-Clark used a Hygiena ATP luminometer to measure ATP. When ATP is brought into contact
with Hygiena’s luciferin reagent in the Ultrasnap surface-testing device, light is emitted in direct
proportion to the amount of ATP present. The system measures the amount of light generated in relative
light units (RLUs) and provides information on the level of contamination in just seconds. The higher the
RLU reading, the higher the level of contamination present. ATP hygiene monitoring provides accurate
and traceable verification of the hygienic status of a surface.

10
In addition, half of all computer mice and desk phones tested were found to have ATP
levels between 100 and 300. After implementation of the protocol, the levels decreased
an average of 62 percent, providing significant improvement in overall workplace
cleanliness.
To demonstrate the program could break the chain of transmission of germs, the
research team engaged Dr. Charles Gerba of the University of Arizona to carry out a
study to quantify the reduction of exposure of viruses after the introduction of a
hygiene intervention.
The study was conducted in a hundred-person office, where a person and a surface
were contaminated with a surrogate virus at the beginning of the day. After 4 hours,
numerous commonly touched surfaces and people's hands were tested for the virus,
and transmission was determined. The same test was conducted after introducing the
project’s educate and engage protocol, and targeted hand and surface hygiene products.
The results demonstrated that if these viruses were placed on either the hand of one
individual or on a common encountered surface like a door handle, up to half or more
of the hands or surfaces in the office were contaminated within four hours. This
illustrates how important a contaminated object or hand can be in the spread of a virus
in an office environment.
After the hygiene intervention, there was a statistically significant reduction in the
concentration of the virus on hands and surfaces, which in turn, greatly reduced the
spread of the virus in the office. Mathematical modeling indicated that the probability
of infection by the common cold, flu and other viruses among office employees was
reduced by 80 percent. This was achieved with only half (52 percent) of the office
employees participating in the intervention.
Additionally, ATP samples collected at sites adjacent to the virus sampling indicated
there was a significant correlation between ATP reduction and virus reduction on
surfaces. This suggests that reduction ATP readings can be used to monitor the success
of the protocol.
The program was designed to deliver measurable value to human resource
departments, facility managers and other influencers that are responsible for office
employees. The program can deliver the following outcomes:
Cleaner buildings with more satisfied tenants, giving property managers an
edge
Elevating the level of cleanliness in buildings without increasing annual

11
cleaning costs of the existing cleaning contractor or in-house staff
For Building Service Contractors, the ability to enhance client relationships by
promoting workplace wellness
Improved relations with employees who are concerned about cleanliness and
personal hygiene
A reduction in the probability of illness, which can positively impact the costs
associated with worker absenteeism and presenteeism

12
Building Occupant Productivity - Presenteeism
Many organizations track the financial impact of absenteeism, the sum of hours absent
from work for a health-related reason. But few businesses properly track the impact of
"presenteeism" on businesses’ bottom lines, another area impacted by cleanliness levels
and their health implications. Presenteeism occurs when a worker feels compelled to
come to work but is not fully functioning due to an illness. As a result, individual
productivity can be reduced by at least one-third (Hemp, 2004). Unlike absenteeism,
presenteeism appears to be a much costlier problem.
The Harvard Business Review documented this issue as one that companies face as they
struggle to rein in health care costs. “We’re talking about people hanging in there when
they get sick and trying to figure out ways to carry on despite their symptoms,” says
Debra Lerner, a professor at Tufts University School of Medicine in Boston, who notes
that presenteeism may be more common in tough economic times, when people are
afraid of losing their jobs (Hemp, 2004).
Effects of Presenteeism
Presenteeism can have many negative effects on the workforce, including:
Spending additional time on tasks
Decreased quality of work
Lack of initiative
Lowered ability to perform at peak levels
Decreased quantity of work completed
Inability to be social with coworkers
Lack of motivation
Transmission of viruses/illness to coworkers/building occupants/patrons
Impact of Cleanliness on Presenteeism
In a study of 400 managers and employees conducted by HLW International LLP
(Buildings, 1999), employees' productivity levels were determined to be heavily
influenced by the cleanliness of the office in which they worked. More importantly,
productivity of employees was not the only area impacted; employers who found it
difficult to recruit prospective employees also were affected.
The study found that cleaning has a very real and measurable value, specifically
reporting a 5 percent productivity gain ($125,000) in a 100-associate office with an
average salary of $25,000. The study provides a formula that can be used to calculate a
minimum cleaning-related productivity savings for an organization:

13
A Minnesota Department of Health (MDH) (Minnesota Department of Health, 2008) report
regarding the impact of cleanliness on student performance in educational facilities also
supports the theory that the average productivity impact of proper cleaning can range
from 2 percent to 8 percent.
The MHD report cites two separate office environment studies that found good
housekeeping protocols that thoroughly removed dust from surfaces were found to
have both health and comfort benefits. In the first study, building occupants who
experienced mild symptoms of distress or discomfort (dry eyes, itchy or watery eyes,
dry throat, lethargy, headaches, chest tightness) began to perceive a loss in performance
ranging from three percent to eight percent, depending on the number of symptoms. In
the second study, exposure to a reservoir of dust (an old carpet) affected subjects’
typing, arithmetic, logical, reasoning, memory, and creative thinking skills by two
percent to six percent.
According to a 10-month survey of more than 25,000 individuals conducted by Advance
PCS Center for Work and Health (Bureau of Labor Statistics, 2002), off-task workers cost
businesses an average of $250 billion a year, or approximately $2,000 per worker. The
estimates were derived from their salaries and estimates of time spent at work engaged
in reduced on-the-job performance because of illness. Cost impact was estimated by
multiplying lost productive time (absence hours plus hours lost from reduced
performance) by the individual worker's hourly labor cost.
Better management of employees’ health, including a proper cleaning for health
program, leads to improved productivity, which will create a competitive advantage in
a hyper-competitive global economy. Improved cleaning practices, a comprehensive
workplace hygiene program, high-performing cleaning products, and the deployment
of quality management principles will impact the health and wellness of workers, and
as data has correlated, improve the business’s bottom line.

14
Image Enhancement - Customer Satisfaction
According to multiple studies, customers value cleanliness more than many other
factors when deciding to do business with an establishment. The image that a clean
facility creates is a lasting one. Many managers perceive cleaning as an operational cost,
but a dirty facility with a poor image will cost businesses direct revenue. Dirty
buildings can also create risks such as slips and falls, leading to higher insurance and
legal costs. Consumers have many choices. When given the choice, consumers would
rather do business with companies that are dedicated to a positive image and a clean
facility.
The Cleanliness - Satisfaction Connection
In 2010 Procter & Gamble (P&G) conducted a cleanliness satisfaction study of the
leading fast-food or quick serve restaurant (QSR) chains in the United States. Survey
respondents identified cleanliness as the number one driver of customer satisfaction.
Cleanliness was ranked higher than value, speed, convenience, variety, and accuracy of
the order. When QSRs focus on cleanliness, they have a better chance to win market
share.
More than 1,000 respondents between the ages of 18-64 were invited to participate in an
online survey from a panel of more than 5 million Internet users. Age, gender, and
ethnicity of the respondents reflected the respective distribution within the national
population. P&G queried all respondents on their past 3-month usage of 28 QSR
chains, their overall cleanliness satisfaction for each chain and whether there were any
chains that they avoided due to cleanliness.
Out of twenty aspects of QSR cleanliness, respondents chose the four factors that most
annoyed them and the four they found dirty most often. They were then given an
opportunity to further define their most annoying cleanliness aspects. The top most
annoying factors were the most common across all QSR chains.
Restaurant cleanliness matters to QSR customers – it is the most important attribute
among the 15 customer satisfaction measurements. More than 6 in 10 QSR users agreed
that if a fast-food restaurant is really clean, they go there more often.
Some aspects of QSR cleanliness that are “most annoying” to QSR customers are
also found to be dirty most often: dining room tables & chairs, bathroom toilets,
litter on tables and floors, and floors in the dining room and bathroom.
In the dining room, sticky tables, chairs, and floors are the biggest obstacles to
cleanliness.
In the bathroom, unpleasant odors, clogged toilets, soiled floors, and sticky floors

15
are all issues for QSR users.
Other aspects are often found dirty but are less annoying (perhaps because QSR
customers have a lower expectation in these areas): condiment dispensers, garbage
receptacles, and bathroom sinks.
Figure 1: Most Annoying Cleanliness Aspects Found Most Often in QSRs
Retail Store Image Enhancement
Chain Store Age, a magazine for retail executives, examined “store atmospherics,” the
variety of elements retailers put into stores to make shopping more appealing. The
results of the Chain Store Age survey revealed that customers view cleanliness as the
most influential element of the shopping environment. Consumers rate cleanliness the
most important by far among 13 aspects of store atmosphere. The magazine set out to
answer a couple of key questions: What matters most to shoppers? How important are
such basics as cleanliness and store temperature? To find out, Chain Store Age
collaborated with Leo J. Shapiro and Associates to survey a national sample of 956
United States consumers age 16 or older. Respondents were divided equally between
men and women. Households with children represented 35 percent of the sample
(Chain Store Age, 2005).

16
Consumers segregate the elements of store atmospherics into three “tiers:”
1. The basic condition of the store, such as cleanliness;
2. Passive atmospherics, the essential but relatively static aspects of the store such as
lighting and temperature;
3. Active atmospherics, the more interactive elements such as music, product
demonstrations, and in-store TV.
Retailers who are able to orchestrate all three tiers in a deliberate, strategic way will
create significant competitive advantage. In the shopper’s mind, atmosphere translates
to well-being. “As retail becomes increasingly vanilla box-like, one of the most powerful
differentiators is the well-being of the consumer in the store,” says George Rosenbaum,
chairman of Leo J. Shapiro and Associates. His colleague, Ken Rice, adds, “Atmosphere
is what creates that sense of well-being. Properly managing all the elements in the
atmospherics repertoire has enormous competitive advantage, particularly in a self-
service environment where the shopper has to work the store on her own.”
Furthermore, the tiers build on one another and are interrelated. If the store is not
clean, it will receive little credit for passive characteristics. For example, better lighting
reveals more dirt, and flooring and fixtures become unsightly. If the store falls short on
passive criteria, it will receive little credit for active elements. Passive and active
atmospherics can work at cross-purposes if active elements divert shoppers from
making purchases.
The Chain Store Age survey found that store atmospherics as a whole (cleanliness,
passive and active elements) are most important in food stores, ahead of nine other
types of retailers in the study, including apparel stores, where cleaning ranks second in
importance of store atmosphere.
Restroom Cleanliness Survey
A Harris Interactive Survey independent study conducted for Cintas Corporation
further confirms the importance of cleanliness in customer choice selection from
hospitality to healthcare experiences (Cintas, 2011). It discovered that 94 percent of
1,000 adults surveyed would avoid a business in the future if they encountered dirty
restrooms. “Dirty restrooms cost businesses lost sales, customers, referrals, and repeat
business,” said Mike Thompson, Senior Vice President, Cintas Facility Services. “This
study reaffirms that if customers are not satisfied with the state of a restroom, they will
take their business elsewhere” (Cintas, 2011).
Respondents were asked what specific types of businesses they would avoid if they

17
encountered dirty restrooms. Their responses are shown in Table 3.
Table 3: Adults Avoiding Business Because of Dirty Restrooms
Business Type Percentage of Adults Avoiding
Business Due to Dirty Restrooms
Restaurants 79 percent
Hotels 79 percent
Healthcare Facilities 77 percent
Supermarkets 50 percent
Retail Stores 45 percent
Gas Stations 45 percent
Car Dealerships 39 percent
Studies illustrate that levels of cleanliness are not just important to building occupants
and their work productivity, but also factor into customer decision making, which can
impact a business’s ability to meet revenue expectations. It can be extrapolated that if a
business has a formula for indicating revenue projections on a per-customer basis, the
revenue impact of cleaning improvements can be calculated by factoring in a
percentage of customers turned away due to undesirable building image and
cleanliness. For example, if one in 20 customers is turned off by dirty restrooms, that is
worth an estimated X dollars of lost revenue, which can be reduced to a more favorable
ratio if cleaning improvements are implemented.

18
Asset Preservation
Asset Preservation: Carpeting
Buildings are financial assets that impact companies' balance sheets, making it
worthwhile to preserve their value and reduce added maintenance or refurbishment
costs. Cleaning plays a significant role in extending asset life cycles and increasing
return on investment. Reduced cleaning to meet short-term operational budgets can
actually result in a lower ROI as life cycles are shortened and more expensive
replacements are needed to maintain building image, facility functionality and
aforementioned customer satisfaction levels. Surfaces such as flooring, especially in
high impression or high traffic areas, play a large role in asset preservation strategies.
It is widely acknowledged by the leading carpet mills, the Institute of Inspection
Cleaning and Restoration Certification (IICRC) and the Carpet and Rug Institute (CRI)
that a planned maintenance program extends a carpet’s life. By increasing the annual
cost of cleaning a carpet by 10 percent, a facility manager can extend the carpet’s useful
life well beyond the manufacturer’s estimated life cycle, ultimately paying for itself in
deferred replacement costs.
The formula to calculate life cycle cost encompasses more than the initial capital
expenditure of the carpet (Equation 1).
Equation 1: Asset Life Cycle Cost Calculation Formula
The Asset Life Cycle Cost Calculation Formula includes the following inputs:
Initial cost of carpet: The price of carpet includes the cost of the carpet and installation.
Removal and disposal cost: In a renovation, removing existing carpet and disposal
cost should also be included along with additional costs such as work disruption
due to renovations or area shut-downs.
Cost of cleaning over the carpet’s life: Cleaning costs include an estimate for time,
labor, materials, and equipment repairs incurred by a facility while performing its
routine program.
Carpet life in years is determined by the number of years the carpet will be on the
floor.

19
Studies have proven that properly maintained commercial carpets have enhanced
appearance levels and extended durability. At many commercial sites with high foot
traffic, a planned carpet maintenance program may extend the life cycle of carpet by
two to three times over that of carpets that have unplanned or low frequencies of
cleaning.
The Carpet and Rug Institute’s (CRI) Carpet Maintenance Guidelines for Commercial
Applications (Carpet & Rug Institute, 2012) along with the carpet manufacturer’s
maintenance recommendations are the best tools for evaluating whether an existing
maintenance program is maximizing a carpet’s life.
CRI describes carpet as having five levels of appearance: new, good, fair, poor and
unacceptable (replacement needed). If a carpet's use-life is at least 10 years, having a
good maintenance plan can lead to a carpet's appearance level as still being "good" in
ten years. An unplanned maintenance program can result in a carpet's appearance level
dropping to fair in 3-4 years, poor in 4-5 years, and replacement in 6-7 years. With
neglected maintenance, new carpet can go from new to poor in as little as 1-3 years
before replacement is necessary.
According to CRI, a customized comprehensive carpet care program consists of five
elements:
1. Soil Containment – isolation of soil entering the building using mats at entrances
2. Vacuuming – scheduled frequency for removal of dry soil using a CRI-approved
vacuum
3. Spot and Spill Removal System - using professional spot removal techniques
4. Interim Cleaning – scheduled frequency appearance cleaning for all traffic areas
5. Restorative Cleaning – scheduled frequency deep cleaning to remove residues and
trapped soils.
CRI, IICRC and the leading carpet mills have established minimum cleaning frequency
guidelines. Carpet mills publish cleaning guidebooks with recommended cleaning
procedures and prescribed cleaning frequencies. These procedures and frequencies are
based on traffic conditions and variables that may cause excessive wear.
Many carpet warranties are based on a documented carpet cleaning program that
includes the four cornerstones of carpet maintenance: preventive, daily, interim, and
restorative procedures. Property owners and facility managers should refer to
warranty agreements and carpet mill recommendations to establish a cost-effective

20
carpet care program that will extend the life cycle of their investment.
One of the most important considerations when planning any cleaning program is its
financial impact. Most carpet care programs have a strong ROI, and precisely
determining the cost helps build a stronger business case. Calculating the annual cost
of a carpet care program is straightforward. The ISSA Smart Staffing guidebook details
the methodology of workloading, and InfoClean™6 provides easy-to-use software to
calculate the annual cost of carpet cleaning to meet budget requirements
(issa.com//workload).
Asset Preservation: Hard Surface Floors
Hard surface flooring presents a more complex calculation than carpet when evaluating
the life cycle cost because of the wide variety of substrate types and ongoing
innovations in flooring materials developed for commercial use. As part of the value
engineering process, innovative architects and building owners calculate the annual
cost of cleaning a surface and the impact that cleaning tasks may have on the floor’s life
cycle cost.
Commercial building installation trends in North America have favored ceramic and
porcelain tile for the last 10 years. The Tile Council of North America performed an
economic analysis of the life cycle costs of different floor surfaces by examining life
expectancy, installation cost, material costs, and cost per sq. ft. per year for a range of
flooring types (Tile Council of North America, 2011). The Tile Council concluded that
ceramic tile has the lowest life cycle cost per square foot as a result of longer product life
and lifetime maintenance costs.
They found the cost of cleaning ceramic tile can be significantly less than that of VCT
(vinyl composition tile), sheet vinyl, or terrazzo surfaces. The most accurate way to
determine the annual cleaning cost is to workload the floor care program. This can be
performed by using ISSA’s InfoClean™ software or other leading software programs on
the market (issa.com/workload).
A side-by-side analysis of annual labor and product consumption gives building
owners and managers the opportunity to select a flooring type that has the lowest
annual cost of cleaning and may reduce any negative impact caused by restoration
techniques. The cost of the cleaning program should always be factored into surface
selection because it plays such a large role in the floor’s life cycle savings. This is
6 InfoClean is a trademark of KnowledgeWorx, LLC.

21
especially important given the fact that many organizations select surfaces with
manufacturer recommended maintenance factored into their life cycle estimates but
don't coordinate with facility departments to ensure those estimates are feasible to carry
out or to determine if other factors should be considered.

22
Energy Savings: Daytime Cleaning
Even the timing of when cleaning is conducted can have profit generation impact. There
are numerous methodologies that can be used to schedule cleaning activities, and a
multitude of factors need to be considered when setting up the cleaning plan. Daytime
cleaning is one approach that has produced energy savings at some locations.
In 1997, General Motors Worldwide Facilities Group faced an increasingly competitive
landscape and the need to reduce costs while maintaining quality. They began
exploring the benefits and challenges of moving the night custodial crew to cleaning
during the day.
The team reviewed schedules, potential interruption, tasks, labor, and productivity.
They also considered occupant perspectives and disturbances to facility tenants.
Energy consumption also was a consideration as the project began to unfold. After
analyzing all of the data, they presented a case for daytime cleaning that included best
practices and a way to perform cleaning during the day.
Steve Spencer, Facilities Specialist at State Farm, reviewed GM’s work several years
later and built on their practical experience. During the decade since GM’s initial work,
energy costs had risen steadily. Steve quantified the substantial energy savings that
daytime cleaning could deliver. He found that daytime cleaning produced energy
savings of between 7 and 8 percent per year in the 30 State Farm buildings that were
transitioned to daytime cleaning.
EPA Region 8 Headquarters
The Environmental Protection Agency Region 8 Headquarters in Denver employs a
daytime custodial service that schedules service from 8:00 a.m. – 5:00 p.m. each
workday. As a result, the 292,000 sq. ft. facility is able to turn off lights and HVAC
requirements between 6:00 p.m. and 6:00 a.m. Energy costs have been reduced by 28
percent, saving the building owner nearly $250,000 annually.
Daytime Cleaning at University of Washington
Gene Woodward, Director of Facilities Services Custodial Division at University of
Washington, also researched daytime cleaning and deployed it using an in-house
cleaning operation on a large campus with more than 280 custodians (Zudonyi, 2012).
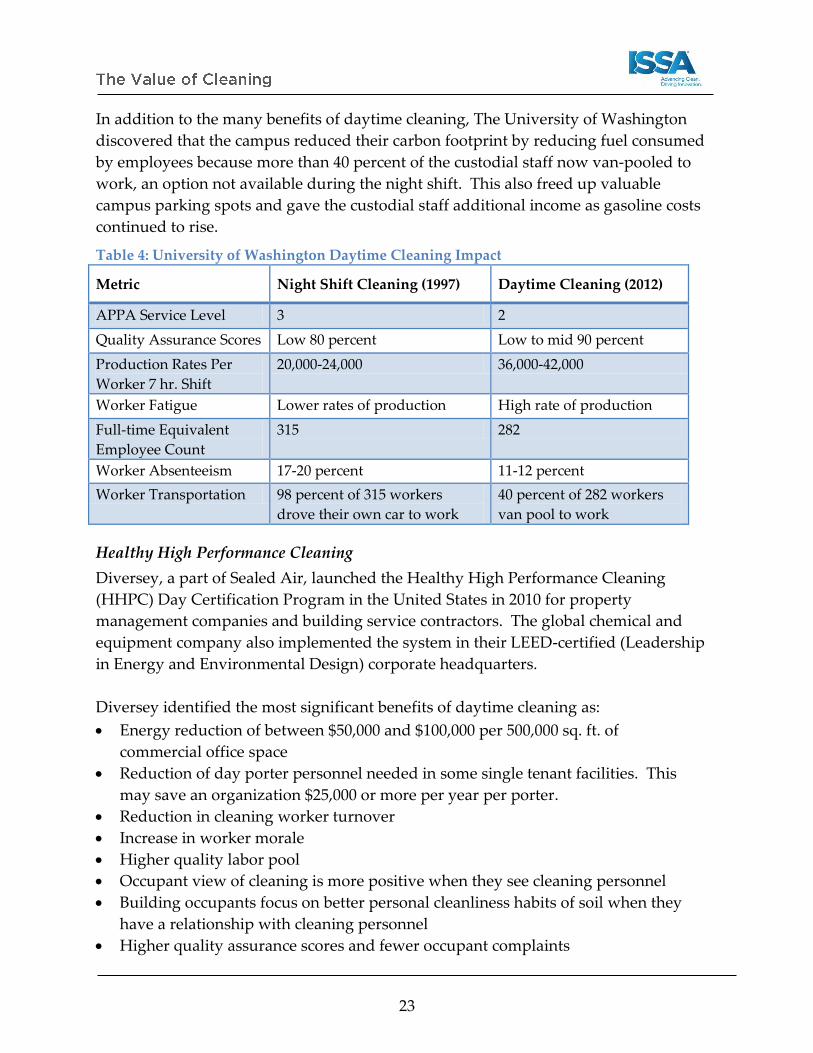
Table 4 summarizes the impact that moving to daytime cleaning produced. Service levels
improved as measured by APPA scores and assurance scores. The productivity rate per
hour increased with less worker fatigue, resulting in a reduction in staff from 315 full-
time equivalent employees (FTE) to 282 FTE. Cleaning worker absenteeism also fell.
23
In addition to the many benefits of daytime cleaning, The University of Washington
discovered that the campus reduced their carbon footprint by reducing fuel consumed
by employees because more than 40 percent of the custodial staff now van-pooled to
work, an option not available during the night shift. This also freed up valuable
campus parking spots and gave the custodial staff additional income as gasoline costs
continued to rise.
Table 4: University of Washington Daytime Cleaning Impact
Metric Night Shift Cleaning (1997) Daytime Cleaning (2012)
APPA Service Level 3 2
Quality Assurance Scores Low 80 percent Low to mid 90 percent
Production Rates Per
Worker 7 hr. Shift
20,000-24,000 36,000-42,000
Worker Fatigue Lower rates of production High rate of production
Full-time Equivalent
Employee Count
315 282
Worker Absenteeism 17-20 percent 11-12 percent
Worker Transportation 98 percent of 315 workers
drove their own car to work
40 percent of 282 workers
van pool to work
Healthy High Performance Cleaning
Diversey, a part of Sealed Air, launched the Healthy High Performance Cleaning
(HHPC) Day Certification Program in the United States in 2010 for property
management companies and building service contractors. The global chemical and
equipment company also implemented the system in their LEED-certified (Leadership
in Energy and Environmental Design) corporate headquarters.
Diversey identified the most significant benefits of daytime cleaning as:
Energy reduction of between $50,000 and $100,000 per 500,000 sq. ft. of
commercial office space
Reduction of day porter personnel needed in some single tenant facilities. This
may save an organization $25,000 or more per year per porter.
Reduction in cleaning worker turnover
Increase in worker morale
Higher quality labor pool
Occupant view of cleaning is more positive when they see cleaning personnel
Building occupants focus on better personal cleanliness habits of soil when they
have a relationship with cleaning personnel
Higher quality assurance scores and fewer occupant complaints
24
How to Estimate Energy Savings
In order to estimate the energy savings of daytime cleaning, customers should conduct
a basic analysis of energy costs. The following inputs are needed when using ISSA’s
Value of Cleaning software to calculate energy costs:
Type of Fixture: T8's are 1" in diameter; T12's are 1 1/2". T8's run on an electronic
ballast and will not run (efficiently) in a fixture with a regular ballast. A four-foot T8
is 32 watts, while the four-foot T12 is 40 watts. The commercial lighting industry is
rapidly shifting towards T8 bulbs because they are more energy efficient. The
driving force in the United States is the new United States Federal Minimum Energy
Standards for fluorescent lights.
Number of Fixtures: The typical commercial facility has a light fixture for every 50
sq. ft. of office space.
Occupancy Sensors: If an organization has installed occupancy sensors to further
manage lighting, the estimated percentage of savings derived from these sensors
should be included.
Hours per Night: Most night cleaning operations consume between 5 and 7 hours of
lighting per shift on at least 260 days a year. These numbers are then multiplied by
the kilowatt-hour (kWh) that a facility consumes.
Cost: Electricity is measured by the kilowatt-hour (kWh). When a customer uses
1000 watts for 1 hour that is a kilowatt-hour. The most recent utility bill provides an
organization’s cost per kWh. Alternatively, there are a number of websites that
provide cost ranges by geographic region. One such link is
www.eia.gov/electricity/monthly.
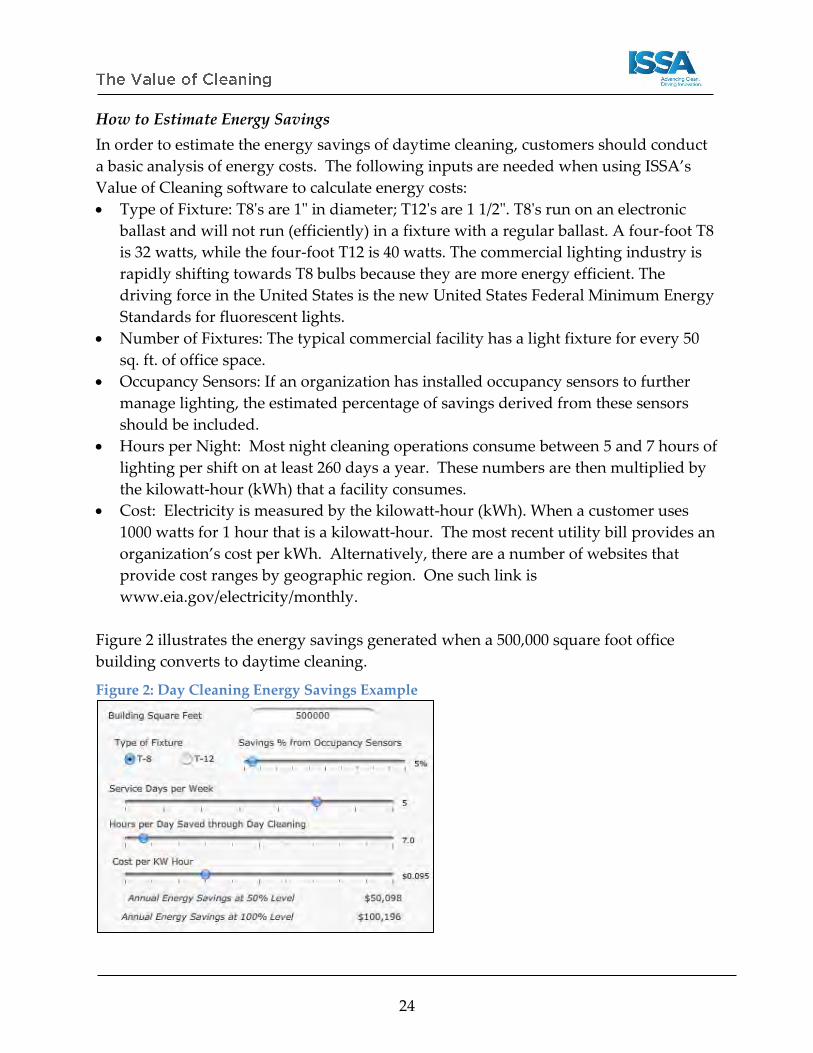
Figure 2 illustrates the energy savings generated when a 500,000 square foot office
building converts to daytime cleaning.
Figure 2: Day Cleaning Energy Savings Example

25
Healthcare-Associated Infections (HAI)
While healthcare specific, HAIs are valuable to note for all cleaning organizations as
they illustrate the fundamental correlation between clean environments and reduced
cross-contamination cases. The same principles apply in an office or public setting in
which cleaning activities can reduce the spread of illness, thus reducing health-related
personnel costs, including lower health insurance costs and lower absenteeism, all
leading to higher profits. The following data can be related to results such as the
aforementioned study of The Healthy Workplace Project*, showing significant impact
of improved cleaning for health.
There are innumerable studies in the healthcare arena related to cleaning, proper
sanitation, hand hygiene, and best practices to reduce healthcare-associated infections
(HAIs). Drawing on dozens of medical research papers and textbooks published by
leading associations as well as the United States Department of Health and global
health organizations that represent the interests of the healthcare market, this white
paper summarizes a fraction of the many medical and scientific studies performed over
the last twenty years to validate the financial ROI of improved sanitation and hygiene
practices.
HAIs are infections that people acquire in a healthcare setting while they are receiving
treatment for another condition. HAIs can be acquired anywhere healthcare is
delivered, including inpatient acute care hospitals, outpatient settings such as
ambulatory outpatient clinics, and long-term care facilities such as nursing homes and
rehabilitation centers. In hospitals, HAIs lead to extended hospital stays, contribute to
increased medical costs, and are a significant cause of morbidity and mortality
(Edwards, 2007).
HAIs may be caused by any infectious agent, including bacteria, fungi, and viruses, as
well as other less common types of pathogens. These infections are associated with a
variety of risk factors, including:
Contamination of the healthcare environment
Transmission of communicable diseases between patients and healthcare workers
Use of indwelling medical devices such as bloodstream, endotracheal, and urinary
catheters
Contaminated surgical procedures
Contaminated injections
Annually, approximately 2 million patients suffer with HAIs in the United States, and
nearly 90,000 are estimated to die. The overall direct cost of HAIs to hospitals in the

26
United States is estimated at $28-45 billion. While this range may appear to be wide, one
thing is certain: HAIs are expensive. In addition, most HAIs are thought to be
preventable. Important policy changes include a mandate that hospitals publicly report
HAI rates and a federal pay-for-performance measure that will no longer allow United
States Medicare to reimburse healthcare providers for costs incurred as a result of HAIs
(Stone, 2009).
Importance of Cleaning
Cleaning and proper sanitation is the removal of soil and contaminants from surfaces.
It is recognized as a vital component of a comprehensive intervention program needed
to reduce HAIs. Proper chemistry, cleaning friction, and the capillary effect of cleaning
textiles remove soil and pathogens from contaminated surfaces, touch points and
identifiable areas of transfer.
Effective cleaning and disinfection will decrease the number of environmental
pathogens and reduce the risk of transmission and potential infections. Professional
cleaning techniques and modern cleaning materials always play an integral part of a
hospital’s infection prevention and control plan.
Langone Medical Center Study
The increased incidence of hospital-acquired C. difficile (HA-CDI) has heightened the
need to define effective control measures. Dr. Michael Phillips of New York
University’s Langone Medical Center performed a controlled study to measure the
effect of enhanced environmental cleaning on HA-CDI using the 3M™ Clean-Trace™7
Hygiene Management System. This study was presented at the 2011 Society for
Healthcare Epidemiology of America (SHEA) Conference in Dallas, Texas.
The preliminary data points to a reduction in HA-CDI by using specially trained
cleaners in lieu of conventional housekeeping units. The adoption of best cleaning
practices averted approximately 85 cases of HA-CDI annually, resulting in an estimated
annual savings of $413,000 in direct hospital costs (Phillips, MD, 2011). The results of
the study are expected to be published in 2013.
Mt. Sinai’s Medical Center Study
In 2012, Crothall Healthcare published a white paper detailing their integrated Infection
Prevention Approach to reducing HAIs in healthcare facilities. Their study used the 3M™
Clean-Trace™ ATP monitoring device to document the cleaning performance of highly
7 3M and Clean-Trace are trademarks of 3M

27
touched objects (HTO) in Mount Sinai’s Medical Center in New York (Crothall
Healthcare, 2012). This 1,171-bed hospital deployed new cleaning technology, technical
training of cleaning personnel, and scientific measurement for quality assurance and
improved cleaning practices.
Mt. Sinai’s Medical Center findings:
57% reduction in C. difficile infection rates
HCAHPS cleaning scores increased 60%
50% reduction in OSHA incidents
HAI Prevention Resource
The Association for the Healthcare Environment of the American Hospital Association
(AHE) has published the second edition of its Practice Guidance for Healthcare
Environmental Cleaning. AHE is recognized as one of the premier resources on the
healthcare environment. This manual is an essential resource for environmental
cleaning and disinfection. AHE guidance is based on industry research, peer-reviewed
clinical evidence and best practices from other leading healthcare organizations,
including the Centers for Disease Control and Prevention (CDC), the Association for
Professionals in Infection Control and Epidemiology, the Society for Healthcare
Epidemiology of America and the Infectious Disease Society of America. This valuable
manual defines the transmission of infectious agents, healthcare-specific cleaning
procedures, standards, infection prevention techniques and the basics of microbiology
(Association for the Healthcare Environment, 2012).

28
Next Steps
Although cleaning has traditionally been viewed as a cost, a growing body of evidence
connects cleaning to an organization’s bottom line. It is clear that even relatively
modest investments in cleaning produce substantial financial returns in areas often
overlooked, as illustrated in this paper. The proffered information can be extremely
valuable in helping to make a better case for proper levels of cleaning and the budgets
they require.
If your organization has begun to review some of these areas, this paper can identify
new areas to pursue. If you have not tracked or calculated any of these areas, it is
recommended that you select the ones most relevant to your organization or your
customers and begin there. ISSA can help you understand how to get started in tracking
and correlating data.
The association offers the Value of Clean Calculator for member companies to help
customers calculate savings in the areas covered by this paper (North American and
International versions available at issa.com/value). A PowerPoint slide deck is available
for ISSA members to include in presentations to key decision makers and upper
management regarding the points covered in this paper. To gain access to these tools
and find out if your vendors are ISSA members, visit issa.com/directory.
It is ISSA’s position that even small measures of progress into making the connection
between cleaning and the improved profits it can generate will help evolve the facility
managers’ understanding of how cleaning contributes to their goals and those of their
entire organization.
ISSA encourages you to submit data or results your organization has found in the areas
covered by this paper, or in other areas where a connection can be made between
cleaning and financial gain. Through shared experiences, we can further educate the
industry at large.
To share your organization’s success story or relevant data, contact Dianna Steinbach,
ISSA Director of Industry Outreach at [email protected], or call 847-982-0800 or 800-225-
4772 (North America).

29
Acknowledgments
This project would not have been possible if not for the tremendous efforts of a number
of individuals. ISSA and the authors would like to thank those volunteers who agreed
to contribute to this white paper by sharing their work and resources to better our
industry.
3M
Bugajewski Facility Services
Cintas Corporation
Clean Care Seminars, Inc.
Crothall Healthcare
Deb Group Ltd
Diversey, Inc.
Falcon Crest Commercial
Contractors
Healthy Facilities Institute
Intercon Chemical
GOJO Industries
KBM Facility Solutions
Kaivac, Inc.
Kimberly-Clark Professional
Magnitude Marketing, LLC
Network Services Co.
Procter & Gamble
State Farm Insurance
Windsor Industries
About the Authors
David Frank and James Peduto of the American Institute for Cleaning Sciences (AICS)
authored this document. AICS is one of the leading authorities on the commercial
cleaning industry. AICS is a co-administrator of the comprehensive CIMS and CIMS-
GB Cleaning Management Standard and acts as the Registrar for the CIMS/CIMS-GB
certification program. AICS has authored numerous industry books, software
applications, sustainability programs and other resources designed to promote
professionalism in the industry. Learn more at www.aics.com.
About ISSA
The leading trade association for the cleaning industry worldwide, ISSA has a
membership that includes more than 6,100 distributor, manufacturer, manufacturer
representative, building service contractor, in-house service provider, and associated
service members. ISSA helps its members and their employees make valuable contacts
through the industry’s largest cleaning shows in conjunction with Amsterdam RAI,
under the brand name ISSA/INTERCLEAN®, as well as the popular global website
ISSA.com. It also helps increase professionalism and member success by offering
business tools, educational products, industry standards, publications, and legislative
and regulatory services that specifically focus on the professional cleaning industry.
The association is headquartered in Lincolnwood, IL, USA, with regional offices in
Amsterdam, Netherlands; Leicester, United Kingdom; Monterrey, Mexico; and
Shanghai, China. ISSA regularly works with more than 85 associations, alliances,
advocacy groups and government agencies around the world to promote the value of
commercial and institutional cleaning. For more information, visit www.issa.com.

30
Bibliography
Commercial Buildings Energy Consumption Survey (CBECS). (2012, November 1).
Retrieved November 1, 2012, from U.S. Energy Information Administration:
http://www.eia.gov/consumption/commercial/
3M. (2012, November 1). Infection Prevention. Retrieved November 1, 2012, from 3M:
http://solutions.3m.com/wps/portal/3M/en_US/IPD-
NA/?WT.mc_id=www.3M.com/infectionprevention
Aberdeen. (2004). Aberdeen Group. Retrieved October 8, 2012, from
http://www.aberdeen.com
Association for the Healthcare Environment. (2012). Practice Guidance for Healthcare
Environmental Cleaning. Chicago, IL: Association for the Healthcare Environment
(AHE).
Bates, A. (2010). Profit Planning Group. Retrieved 2010, from
http://www.profitplanninggroup.com
Buildings. (1999, November 1). (v93, No 11.).
Bureau of Labor Statistics. (2002, December 5). Presenteeism: Employees Working at
Diminished Capacity Cost Employers. 53(49).
Bureau of Labor Statistics, U.S. Department of Labor. (2012). Bureau of Labor Statistics,
U.S. Department of Labor, Occupational Outlook Handbook, 2012-13 Edition, Janitors
and Building Cleaners. Retrieved October 8, 2012, from
http://www.bls.gov/ooh/building-and-grounds-cleaning/janitors-and-building-
cleaners.htm
Carpet & Rug Institute. (2012). Carpet Maintenance Guidelines for Commercial Appliations.
Dalton, GA: CRI.
Chain Store Age. (2005, Sept). Store Atomospherics Study. Chicago: Leo J. Shapiro &
Associates.
Cintas. (2011, July 21). Dirty Restroom Leads to Lost Business. Retrieved October 8, 2012,
from www.cintas.com
Crosby, P. (1979). 25 Years - Quality is Free.
Crothall Healthcare. (2012, November 1). An Ounce of Prevention: Mount Sinai Case
Study. Retrieved November 1, 2012, from Crothall Healthcare:
http://media.crothall.com/global/casestudies/EVS_Mount_Sinai_casestudy.pdf
Edwards. (2007). Estimating Health Care-Associated Infections and Deaths in US
Hospitals. Public Health Report, 160-6.
Energy Information Administration. (2003). Overview of Commercial Buildings, 2003.
Retrieved 10 8, 2012, from ftp://ftp.eia.doe.gov/consumption/overview.pdf
Hemp, P. (2004). Presenteeism At Work - But Out of It.
Hygiena. (n.d.). Retrieved October 8, 2012, from http://www.hygiena.net
ISM. (2004, March). Retrieved 2012, from http://www.ism.ws
ISSA. (2009, October). ISSA. Retrieved November 8, 2012, from www.issa.com/standard

31
Kimberly-Clark Professional*. (2010). The Healthy Workplace Project*. Retrieved October
8, 2012, from http://www.healthyworkplaceproject.com
Kronos Consulting & Mercer, LLC. (2008). The Total Financial Impact of Employee
Absences. Survey.
Minnesota Department of Health. (2008, Aug). Cleaning, Indoor Environmental Quality
and Health. A Review of Scientific Literature.
Phillips, MD, M. (2011, April 1). SHEA 2011 Annual Scientific Meeting. Retrieved
November 1, 2012, from SHEA 2011 Annual Scientific Meeting:
http://shea.confex.com/shea/2011/webprogram/Paper5038.html
Scott II, R. D. (2012, November 1). The Direct Costs of Hospital Acquired Infections in United
States Hospitals and the Benefits of Prevention. Retrieved November 1, 2012, from
Centers for Disease Control and Prevention:
http://www.cdc.gov/HAI/pdfs/hai/Scott_CostPaper.pdf
Smith, A. C. (2008, November 6). The Case for Daytime Cleaning.
Stewart, W. R. (2003). Lost productive work time costs from health conditions in the United
States: results from the American Productivity Audit. Journal of Occupational
Environmental Medicine 45.12.
Stone, P. W. (2009). Economic Burden of Healthcare-Associated Infections: an American
Perspective. Pharmacoenonomics & Outcomes Research, 417-422.
The Chartered Institute of Personnel and Development. (2011, October 8). CPID.
Retrieved October 8, 2012, from http://www.cipd.co.uk/hr-resources/survey-
reports/absence-management-2011.aspx
Tile Council of North America. (2011). Environmental and Cost Evaluation.
United States Economic Census. (2007). United States Economic Census. Washington,
D.C.: United States Census Bureau.
US Department of Health and Human Services. (2012, November 1). HHS Action Plan to
Prevent Healthcare-Associated Infections: Introduction. Retrieved November 1, 2012,
from HHS.gov: http://www.hhs.gov/ash/initiatives/hai/introduction.html
Zudonyi, C. (2012, February 12). Retrieved from CleanLink - Leading by Example at
University of Washington: http://www.cleanlink.com