the use of polymeric and metallic geogrid on a full-scale ... · geotextile reinforced embankment...
TRANSCRIPT

The use of polymeric and metallic geogrid on a full‑scale MSE wall/embankment on hard foundation: a comparison of field data with simulationPankaj Baral1*, Dennes T. Bergado1 and Sowarapan Duangkhae2
BackgroundIn past years, many researchers studied the behaviour of several reinforced earth struc-tures (i.e., mechanically stabilised earth wall/embankment) on Bangkok soft soil. Most of them were constructed in the premises of AIT campus. The fully instrumented steel grid reinforced embankment was constructed in the campus of Asian Institute of Technology in March 1989. The backfill of this reinforced embankment were clayey sand, lateritic and weathered clay whereas the reinforcement used was steel grid. Shivashankar [32] observed the behaviour of a welded wire wall with poor quality, cohesive-friction back-fills on soft Bangkok clay.
Abstract
A full-scale reinforced earth embankment was designed and constructed by the Department of Highways of Thailand on a hard foundation in Phitsanulok Province, Thailand. Two types of reinforcement were used in the embankment. One side was reinforced with polymeric reinforcement consisting of polyester (PET), polypropylene (PP) and high-density polyethylene (HDPE) and referred to as a reinforced steep slope (RSS), with an angle of 70° from horizontal. On the other side, the embankment was reinforced with metallic reinforcement consisting of metallic strips (MS) and steel wire grids (SWG) combined with vertical segmental concrete facing and referred to as a mechanically stabilised earth wall (MSEW). The behaviour of the reinforced soil slope and the mechanically stabilised earth wall on a hard foundation were observed and compared with predictions from the PLAXIS 3D software. The lateral displacements and settlements were very small in the case of the MSEW with inextensible reinforce-ment. The corresponding lateral and vertical deformations in the RSS were much larger due to its extensible reinforcing materials. The stiffnesses of the reinforcing materials decrease in the following order: MS, SWG, PP, HDPE and PET. The results obtained from three-dimensional (3D) finite element method simulations (using PLAXIS 3D) were in good agreement with the field measurements in terms of vertical and lateral deforma-tions and strains in the reinforcement.
Keywords: Metallic reinforcement, Polymer reinforcement, Hard foundation, Test embankment
Open Access
© The Author(s) 2016. This article is distributed under the terms of the Creative Commons Attribution 4.0 International License (http://creativecommons.org/licenses/by/4.0/), which permits unrestricted use, distribution, and reproduction in any medium, provided you give appropriate credit to the original author(s) and the source, provide a link to the Creative Commons license, and indicate if changes were made.
ORIGINAL RESEARCH
Baral et al. Geo-Engineering (2016) 7:20 DOI 10.1186/s40703‑016‑0035‑6
*Correspondence: [email protected] 1 School of Engineering and Technology, Asian Institute of Technology, P.O. Box 4, Klong Luang, Pathumthani 10120, ThailandFull list of author information is available at the end of the article

Page 2 of 29Baral et al. Geo-Engineering (2016) 7:20
Later on, In May, 1993, another embankment was constructed in AIT campus with polymer grid reinforcement as a reinforcing material. The reinforcement used in this embankment was Tenax TT 201 geogrid SAMP, which is uniaxial oriented polymer grid reinforcement [4]. Furthermore, Long [24] studied about the behaviour of a geo-textile reinforced embankment on soft ground. This study was focussed on the inter-action parameter between soil and geotextile reinforcement, the localized mobilization of geotextile reinforcement force related with slip failure, the performance behaviour of geotextile reinforced embankment on soft ground and the closed-form solution for rota-tional stability analysis of reinforced embankment. Similarly, Voottipruex [40] studied the behaviour of full scale embankment built in AIT campus which was reinforced with hexagonal wire mesh up to 6 m with 10° inclined of gabion facing. The facing consisted of large rectangular wire baskets wired all together and was filled with rock and height of each basket was 1 m. Two types of reinforcements, galvanized coated and PVC coated with unequal aperture size, were used in the two different sections along the length of the wall. Furthermore, Lai et al. [23] performed the full scale MSE embankment laid on fully instrumented Deep Mixing Method (DMM) improved ground. The behaviour of the full scale test embankment showed that deep mixing improvement method reduced the settlement of reinforced soil test embankment by 70%, which was an effective find-ing. Tanchaisawat [37] performed the study about the interaction between geogrid and tire chips-sand mixture, performances of full scale geogrid reinforced test embankment and numerical simulation of this full scale test embankment. The results revealed that the aperture sizes of geogrid affected most for the direct shear resistance of geogrids. He concluded that larger aperture size may lead to higher direct shear resistance.
The behaviour of a mechanically stabilised earth wall was studied by numerical simula-tion, laboratory testing and full-scale physical modelling. Many researchers have studied the behaviour of reinforced embankments, and most of them assumed plane strain con-ditions in doing so [5, 9, 10, 13–16, 18, 21, 31, 43]. The behaviour of reinforced embank-ments has also been investigated using three-dimensional (3D) finite element analysis [7, 8, 12, 34]. Smith and Su [34] reported that 3D finite element analysis can be used to model a reinforced soil embankment under service loading and at collapse. Briaud and Lim [12] utilised three-dimensional nonlinear finite element analysis to study the factors that influence the behaviour of tieback walls. Auvinet and Gonzalez [7] recommended that 3D analysis be considered under the following conditions:
a. In the case of short slopes for which boundary conditions cannot be ignored.b. When the soil properties vary significantly along the longitudinal direction of the
slope or embankment.c. When the slope is subjected to concentrated loading.d. When the potential failure is irregular.
Bergado and Teerawattanasuk [8] compared the effect of embankment geometry with two-dimensional (2D) and 3D simulations and concluded that 3D analysis must be con-ducted for short embankments to obtain good agreement with measured field data. Moreo-ver, it was confirmed that geometric effects should be considered important factors that can affect the results of the numerical simulation. Huang et al. [19] has investigated different soil

Page 3 of 29Baral et al. Geo-Engineering (2016) 7:20
constitutive models and their influences on the results. The paper confirmed that the modi-fied Duncan–Chang model is a suitable constitutive model and that the parameters used in that model can be determined from conventional triaxial testing. However, the interface parameters used in their study were kept constant from the top to the base of the wall. Two- and three-dimensional numerical studies based on the finite element method (FEM) [3, 33] were used to analyse the deformation and influence of several parameters of reinforced soil walls of different types. Abdelouhab et al. [1] and Bourgeois et al. [11] investigated the influ-ence of different types of synthetic strip reinforcement on the behaviour of a mechanically stabilised earth wall and identified the synthetic strip parameters that led to high horizontal displacements of the facing wall in the numerical simulation.
Moreover, Cisneros [17], Abiera [2], Mir [25], Kabiling [20], Modmoltin [26], Wong-sawanon [41], Srikongsri [35], Visudmedanukul [39], Asanprakit [6], Kongkikul [22], Supawiwat [36], Youwai [42], Rittirong [30], Prempramote [29], Tin [38] and Nualkiang [27] studied and analysed the behaviour of various reinforced earth embankment and its components during their research in AIT.
A full-scale test embankment was constructed in Phitsanulok Province, Thailand on hard ground using five different types of reinforcing materials (polymeric on one side and metallic on the other side). The reinforced steep slope (RSS) was reinforced with polymeric material with soil bags as the facing material, and the mechanically stabilised earth (MSE) wall was reinforced with metallic reinforcement with precast concrete pan-els as the facing material. This embankment was fully instrumented with piezometers, settlement plates, inclinometers, total pressure cells and strain gauges and subjected to careful field monitoring to obtain high-quality data. The aim of this study was to com-pare the behaviour of polymeric- and metallic-reinforced embankments on hard founda-tion with 3D numerical simulations conducted using PLAXIS 3D. Particular attention was given to the lateral displacements, vertical settlements, total vertical pressures and tensile forces in the reinforcement.
Description of the embankmentA 6-m-high reinforced earth embankment was constructed and designed by the Depart-ment of Highways (DOHs) of Thailand near Highway No. 11 in Phitsanulok Province in central Thailand. The test embankment was 18 m long and 15 m wide at the top. On one side, the reinforced steep slope (RSS) was constructed with a face sloping 70° from the horizontal and consisting of soil bags. On the other side, the mechanically stabi-lised earth wall (MSEW) was installed with vertical concrete panels as the facing. Three types of polymeric geogrids reinforcement were installed in the reinforced steep slope (RSS) facing, and two types of metallic reinforcement were installed in the mechani-cally stabilised earth wall (MSEW) facing. The three types of polymeric geogrid rein-forcement were polyester (PET), high-density polyethylene (HDPE) and polypropylene (PP). The two types of metallic reinforcement were steel wire grids (SWG) and metal-lic strips (MS). The vertical spacing was 0.5 m and the length of the reinforcement was 5 m. The monitoring instruments installed to check the vertical and horizontal displace-ments, stresses, excess pore water pressures, depth to the groundwater table and strains in the reinforcing material included inclinometers, settlement plates, total pressure cells, standpipe piezometers, vibrating-wire strain gauges and fibre optic strain gauges. In

Page 4 of 29Baral et al. Geo-Engineering (2016) 7:20
addition, two observation wells were installed to measure the fluctuation in the depth to the groundwater table. The plan and cross section of the MSE wall/embankment with the location monitoring instruments are shown in Figs. 1 and 2, respectively.
Construction of full scale MSE wallFull scale MSE wall was constructed with full instrumentation program as outlined in “Description of the embankment” section. Preliminary design based on proposed wall geometry was carried out prior the execution of the construction work. Geogrid, steel
Fig. 1 Plan of MSE wall/embankment
Fig. 2 Cross section of MSE wall/embankment indicating the location of the monitoring instrument

Page 5 of 29Baral et al. Geo-Engineering (2016) 7:20
grid and steel strip as the reinforcement for the MSE wall was prepared in the desired length prior the installation work.
Preliminary design of MSE wall/embankment
Preliminary design of the MSE wall was carried out based on the external and internal stability analysis of the geometry of the wall. Limit equilibrium method of analysis was adopted for the preliminary design by assuming the interaction of the reinforcement with the backfill material based on the laboratory test data carried out in AIT. Silty sand mixed with lateritic soil (1:1 by volume) sourced from Phitsanulok is used as backfill material.
The wall height assumed for the preliminary design is 6 m with vertical facing. Verti-cal spacing of 5 (five) type of reinforcement adopted is 0.50 m and horizontal spacing for only steel strip is 0.50 m center to center of the 0.05 m wide strip of reinforcement. Precast concrete facing panel of 1.50 m height, 1.50 m width and 0.15 m thickness and with surface area of 2.25 sq m is used for the construction of the wall. Concrete strength of facing panel was 30 MPa.
The internal stability, tension in the reinforcement behind the failure surface was checked against the lateral internal earth pressures. The lateral earth pressure coefficient was assumed to be uniform throughout the height of the wall at the value corresponding to the at rest condition (Ko). The effects of compaction were ignored in this prelimi-nary design. The total pullout resistance inclusive of the friction over the reinforcement behind the failure surface was checked to be greater than the driving forces due to the internal lateral earth pressure. Also, the maximum tension force in each layer of rein-forcement at the peak pullout resistance was checked not to exceed its yield point.
The external stability was examined using the conventional Bishop’s method of slope stability analysis. A conservative estimate of minimum factor of safety is assessed to be around 1.5. The soil strength was assumed to be fully mobilized along the potential fail-ure surface. Factor of safety was defined as the maximum reinforcement force available divided by the force required for stability to give a factor of safety of unity.
Construction method
Site clearing and levelling works were carried out for the marking of the position of the pro-posed MSE wall/embankment. First course of pre-cast concrete facing panels were placed into position using lifting equipment. During the installation of the precast concrete fac-ing panel, vertical and horizontal alignment of each panel was inspected using a spirit level. Adjustment of the verticality of the facing panel was carried out with the help of securing wooden wedges in between the facing panel. Clamp made of timber and steel rod complete with fastener was used to secure the positioning of each facing panel from movement.
Geogrid reinforcement form delivered in roll form (approximately 100 m per roll) from the factory. It was cut by length of 7.0 m each and optical fiber with sensors was installed at designated locations of the selected geogrid reinforcement at the site.
Steel grid and steel strip with 5.0 m length was installed and connected to concrete panel facing. Vibrating wire strain gauges were fixed to steel reinforcement at designated locations at the site.
The first course of backfill material (silty sand) was spread at the rear of the precast concrete facing panel. Compaction of backfill material to 95% proctor density of the

Page 6 of 29Baral et al. Geo-Engineering (2016) 7:20
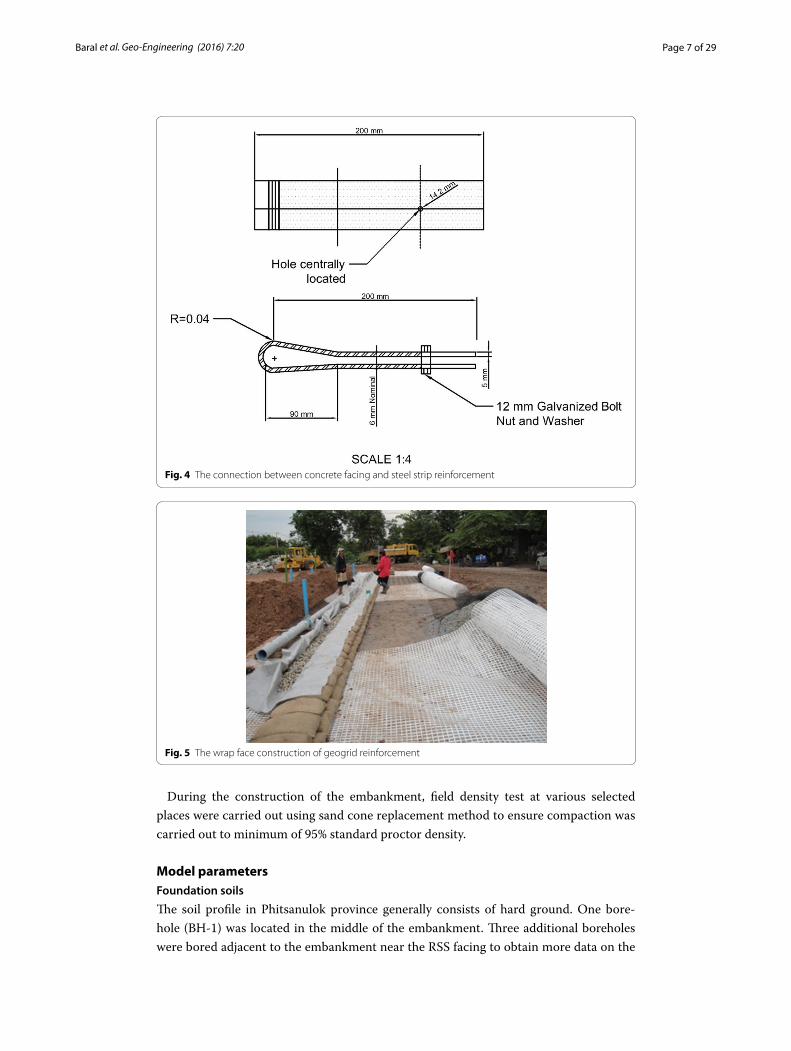
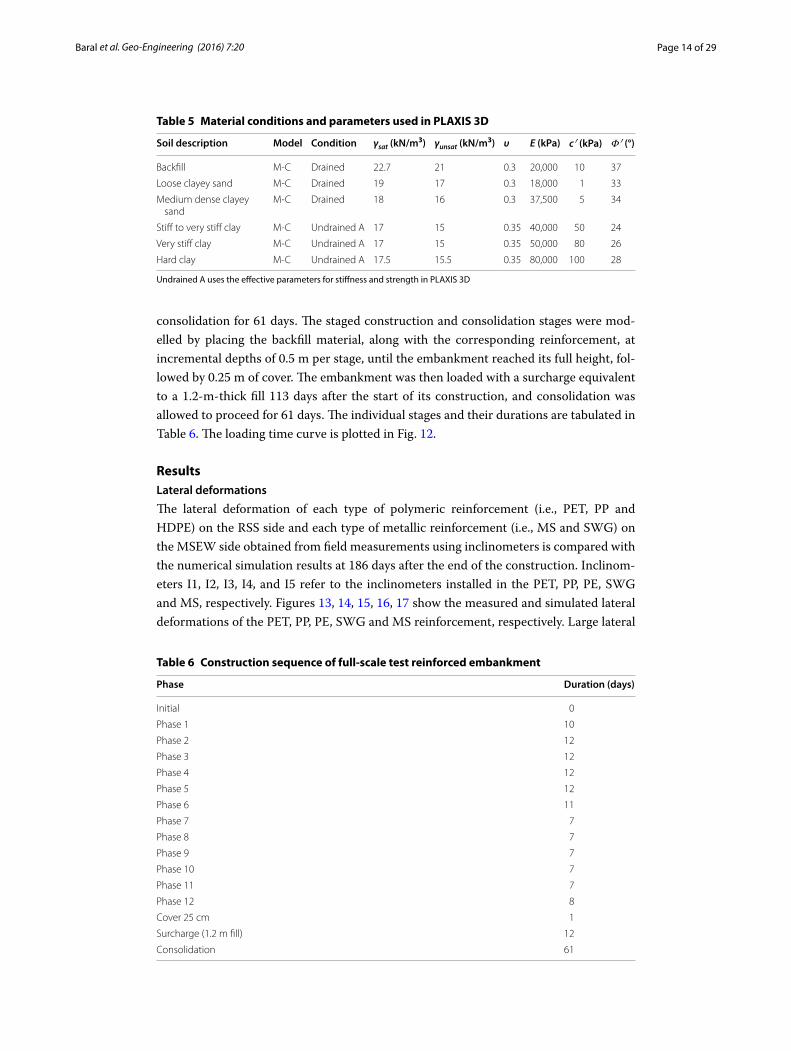
backfill material was carried out by a vibratory compactor. A small vibratory compactor was utilized to carry out the compaction work at narrow area with interference of the instruments installed. After the completion of the compaction work, (1) the first layer of steel grid reinforcement was installed into position and attached to the precast con-crete facing panel by lap joint mechanism (Fig. 3). The lap joint mechanism was secured by inserting a 10 mm diameter deformed steel bar across the lap fold mesh. Steel grid was installed horizontally along the wall. The effective length of the reinforcements was 5.0 m after deducting for the connection. (2) The first layer of steel strip reinforcement was installed into position and attached to the precast concrete facing panel by using a 12 mm diameter galvanized bolt (Fig. 4). (3) The first layer of geogrid reinforcement was installed into position and turns up geogrid reinforcement at the face of the slope and returns the reinforcement a minimum of 1 m into the embankment below the next rein-forcement layer (Fig. 5). This embankment was required soil bag with grass seed at the face to retain backfill materials (Fig. 6).
Subsequent course of backfill material measuring of 0.50 m thick were spread over the plan surface area covering the embankment. Similar compaction work was carried out before the next course of precast concrete facing panel was installed. The procedure as mentioned above was repeated until the full height of 6.0 m was achieved.
Fig. 3 The connection between concrete facing and steel grid reinforcement
Page 7 of 29Baral et al. Geo-Engineering (2016) 7:20
During the construction of the embankment, field density test at various selected places were carried out using sand cone replacement method to ensure compaction was carried out to minimum of 95% standard proctor density.
Model parametersFoundation soils
The soil profile in Phitsanulok province generally consists of hard ground. One bore-hole (BH-1) was located in the middle of the embankment. Three additional boreholes were bored adjacent to the embankment near the RSS facing to obtain more data on the
Fig. 4 The connection between concrete facing and steel strip reinforcement
Fig. 5 The wrap face construction of geogrid reinforcement

Page 8 of 29Baral et al. Geo-Engineering (2016) 7:20
soil profile for the 3D model of the embankment foundation. These additional boreholes were designated as BH-2, BH-3 and BH-4. The borehole locations are shown in Fig. 1. Figure 7 indicate the soil profiles corresponding to BH-1–4, respectively. The depth of the groundwater was 2 m below the ground surface. From Fig. 7, an abrupt change in soil profile was noticed which affects the settlement profile and deformation of the embankment too.
Backfill material
The backfill materials used in this embankment consisted of 50% lateritic soil mixed with 50% silty sand (by volume). The backfill material was classified as poorly graded sand (SP). It had an optimum moisture content of 7.8%, a maximum dry unit weight 19.62 kN/m3. A friction angle of 42° and cohesion of 80 kPa were measured in a direct shear test. Effective friction angles of 32.8° and 37° and effective cohesions of 0 and 20 kPa were measured in two different consolidated undrained (CU) triaxial tests. The properties of the backfill material are tabulated in Table 1.
Reinforcement
Two types of reinforcement, namely polymeric and metallic reinforcement, were used in the reinforced embankment. The polymeric reinforcement types used were high-density polyethylene (HDPE), polypropylene (PP) and polyester (PET). The metallic reinforce-ment consisted of metallic strips (MS) and steel wire grids (SWG). The properties of the reinforcement are tabulated in Table 2. The reinforcing materials used in the embank-ment are shown in Fig. 8. The MSEW facing with metallic reinforcement and the RSS facing with polymeric reinforcement are shown in Fig. 9.
Precast concrete panel
The vertical facing used in the MSEW portion of the embankment consisted of segmen-tal precast concrete blocks 1.5 m by 1.5 m in size. The model parameters used in the numerical analysis for the precast concrete panels are summarised in Table 3. Interface element was placed in between soil element and concrete panel during simulation.
Fig. 6 The soil bag facing to retain backfill material

Page 9 of 29Baral et al. Geo-Engineering (2016) 7:20
Interface shear strength and large scale direct shear test
The interaction between the backfill soil and the reinforcing materials, namely, the metallic strips (MS), steel wire grids (SWG), polyester (PET), polypropylene (PP) and high-density polyethylene (HDPE), was assessed by conducting large-scale direct shear tests. The interface coefficients, Rinter, of the different types of reinforcing materials and the backfill soil shear strength are tabulated in Table 4. The large-scale direct shear tests were conducted under different normal stresses (i.e., 30, 60 and 90 kPa) and revealed that the maximum interface shear stresses between the steel wire grids and soil were highest, followed by the interface shear stresses between soil and soil, between metallic strips and soil, and between the three types of geogrids and soil. The details regarding apparatus and procedure of large scale direct shear test are described as below:
Fig. 7 Soil profile SPT value (considering BH 1–4)

Page 10 of 29Baral et al. Geo-Engineering (2016) 7:20
Table 1 Properties of backfill material
Atterberg limit test LL = 20.8%, PL = 17.3%, PI = 3.5%
Sieve analysis test Sample no. 1Percent finer (#200 sieve) = 0.94%, Cu = 40, Cc = 0.34Sample no. 2Percent finer (#200 sieve) = 0.14%, Cu = 42.86, Cc = 0.55
Unified classification Poorly graded sand (SP)
AASHTO classification A-2-4(0)
Compaction test Maximum dry density (γd, max) = 19.62 kN/m3
Optimum water content (OMC) = 7.8%
California bearing ratio (CBR) test CBR = 50.5%
Direct shear test Friction angle = 42°Cohesion = 80 kPa
Triaxial test (CU test)
Test no. 1 Friction angle = 32.8°Cohesion = 0 kPa
Test no. 2 Friction angle = 37°Cohesion = 20 kPa
Table 2 Properties of reinforcing materials
Material name Tensile strength (kN/m)
Thickness (mm) Normal stiffness, EA (kN/m)
Model Type
Metallic strip (MS) 277.6 4.00 88,000 Geogrid –
Steel wire grid (SWG)
128.1 6.00 35,000 Geogrid –
Polyester (PET) 83.6 1.50 925 Geogrid Miragrid GX80/30
Polypropylene (PP) 91.9 1.45 1360 Geogrid Secugrid 80/80 Q1
High-density poly-ethylene (HDPE)
85.8 1.91 1320 Geogrid TT 090 SAMP
Fig. 8 Reinforcing materials

Page 11 of 29Baral et al. Geo-Engineering (2016) 7:20
Apparatus
The large-scale direct shear apparatus were adapted from the pullout machine which is shown in Fig. 10. The lower half of the shear box was adapted from the empty pullout box with two 1.24-m-long steel channels placed along the both sides of the shear box. The cross-sectional dimensions of the steel channels were 9.5 mm × 76.2 mm × 152 mm. For the upper half of the shear box was composed of 9.5-mm-thick steel plate with an inside dimensions of 0.93 m × 0.58 m × 0.56 m, having roller bearings resting on the two bottom steel channels. Four steel bars with a diameter of 12.7 mm were welded in front of the upper box slightly above the predetermined shear surface. This allowed the upper shear box to be pulled by the same hydraulic jack used in the pullout machine. The top cover comprised of two 6.3-mm-thick steel plates with a pressurized air bag installed between them. The air bag was used for applying the normal pressures. Two steel angle beams were connected to the upper shear box that could run along its
Fig. 9 Photograph showing vertical face and sloping face showing metallic and polymeric reinforcements respectively
Table 3 Properties of concrete panel facing
Parameter Name Value Unit
Type of behaviour Material type Elastic
Normal stiffness EA 42,000,000 kN/m
Flexural rigidity EI 78,500 kN/m2/m
Equivalent thickness d 0.15 m
Weight w 3.6 kN/m/m
Poisson’s ratio υ 0.15 –
Model Plate
Table 4 Interface coefficient (Rinter) and soil shear strength used in PLAXIS 3D
Soil to Friction angle Cohesion (kPa) Rinter
Soil 40 23 1.00
Steel strip 36 23 0.87
Steel wire grid 40 28 1.00
Miragrid GX80/30 PET 33 21 0.79
Secugrid 80/80 Q1 PP 35 25 0.83
TT 090 SAMP HDPE 33 24 0.77

Page 12 of 29Baral et al. Geo-Engineering (2016) 7:20
horizontal direction by means of roller bearings. H-sectioned steel is also installed and connected to the top of the machine in order to form the reaction frame of the applied normal pressures.
Procedure
The predetermined amount of distilled water was added to the lateritic soil and silty sand 50:50 by volume. The water content was the same as the optimum moisture content obtained from the Modified Proctor compaction tests with the modified mold. The soil mixture put into the lower half of shear box and compacted until its surface was lev-eled to the height of box. This surface was the shear plane of the large-scale direct shear apparatus. The upper shear box with its roller bearings was next placed immediately above the lower sample, resting on the steel channels. The position of the upper shear box was fixed by using four C-shaped clamps. These clamps, with two steel angles placed across the top of the upper shear box, fastened the upper shear box to the sides of the lower shear box. This could prevent the rising of the upper shear box during compaction of another two succeeding layers of fill material, which was put into the box. The method
Fig. 10 Large-scale direct shear test apparatus a Longitudinal section and, b Cross section

Page 13 of 29Baral et al. Geo-Engineering (2016) 7:20
is used for controlling the density and the optimum moisture content. The flexible steel plate is laid on the top of compacted fill material, and then followed by the air bag and the top cover installation in order.
Numerical simulationsPLAXIS 3D Version [28] was utilised for the 3D FEM numerical simulations of the embankment. To minimise the effects of test embankment boundaries, the PLAXIS 3D discretisation was formulated and the boundary conditions were specified at distances of two times the length and width of the reinforced embankment in the x and y directions, respectively, as well as at a distance of four times the height of the reinforced embank-ment in the z direction. To carry out the finite element analysis of the embankment using PLAXIS 3D, a finite element mesh was created (Fig. 11), and the material proper-ties of the embankment components were established (Table 5). The generation of an appropriate finite element mesh and the generation of properties and boundary condi-tions on an element level were automatically performed by the PLAXIS mesh generator based on the input of the geometry model. The 10 noded tetrahedron elements model in PLAXIS 3D consisted 101,325 elements and 148,547 nodes. In addition, the average size of the element was found to be 1.646 m. Soil properties as determined from tests on samples from four boreholes were used as the main inputs for the foundation soils in the FEM model. The water level was specified at 2 m below the ground surface. The polymeric and metallic reinforcements were characterised as geogrids, with their cor-responding properties, whereas the precast concrete panels were characterised as plate elements. A surcharge equivalent to 1.2-m-thick fill was added at the top of the embank-ment 113 days after the start of construction. The simulation modelling was allowed to run for 186 days (125 days for construction and 61 days for consolidation analysis).
Staged construction
The staged construction for modelling the mechanically stabilised earth wall was divided into 16 stages with an equivalent period of 186 days. The embankment construc-tion period with layers of compacted backfill lasted for 125 days and was followed by
Fig. 11 3D discretisation model of MSE wall/embankment
Page 14 of 29Baral et al. Geo-Engineering (2016) 7:20
consolidation for 61 days. The staged construction and consolidation stages were mod-elled by placing the backfill material, along with the corresponding reinforcement, at incremental depths of 0.5 m per stage, until the embankment reached its full height, fol-lowed by 0.25 m of cover. The embankment was then loaded with a surcharge equivalent to a 1.2-m-thick fill 113 days after the start of its construction, and consolidation was allowed to proceed for 61 days. The individual stages and their durations are tabulated in Table 6. The loading time curve is plotted in Fig. 12.
ResultsLateral deformations
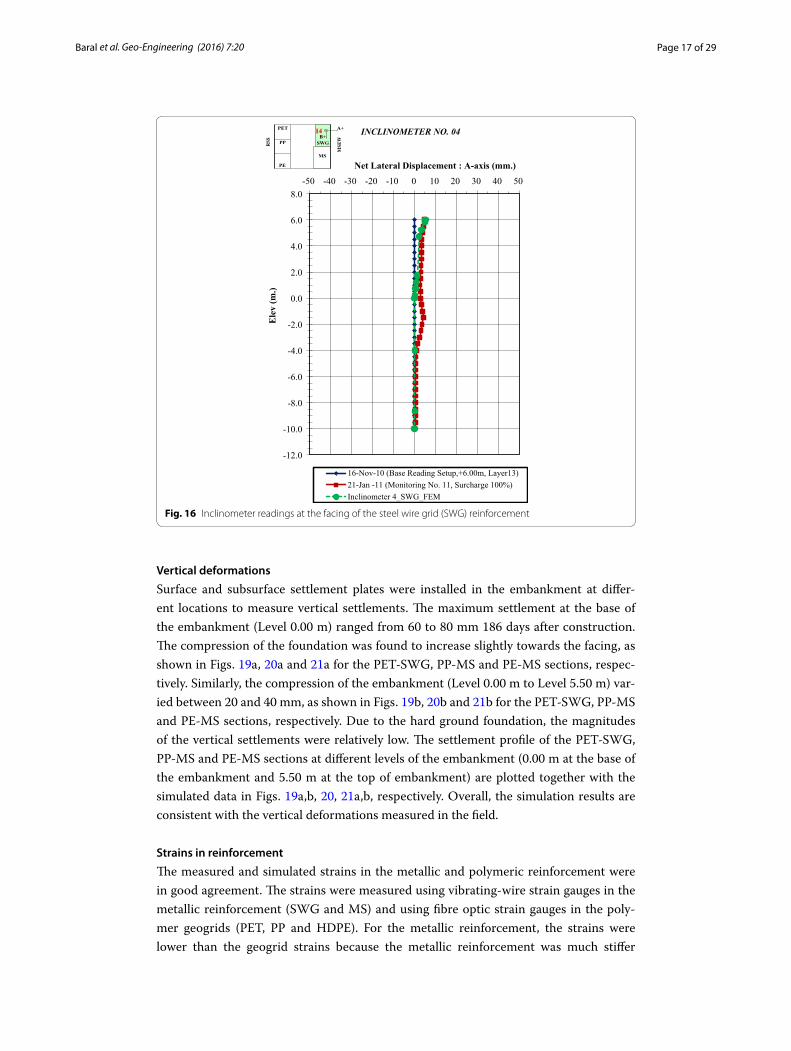
The lateral deformation of each type of polymeric reinforcement (i.e., PET, PP and HDPE) on the RSS side and each type of metallic reinforcement (i.e., MS and SWG) on the MSEW side obtained from field measurements using inclinometers is compared with the numerical simulation results at 186 days after the end of the construction. Inclinom-eters I1, I2, I3, I4, and I5 refer to the inclinometers installed in the PET, PP, PE, SWG and MS, respectively. Figures 13, 14, 15, 16, 17 show the measured and simulated lateral deformations of the PET, PP, PE, SWG and MS reinforcement, respectively. Large lateral
Table 5 Material conditions and parameters used in PLAXIS 3D
Undrained A uses the effective parameters for stiffness and strength in PLAXIS 3D
Soil description Model Condition γsat (kN/m3) γunsat (kN/m3) υ E (kPa) c′ (kPa) Ф′ (°)
Backfill M-C Drained 22.7 21 0.3 20,000 10 37
Loose clayey sand M-C Drained 19 17 0.3 18,000 1 33
Medium dense clayey sand
M-C Drained 18 16 0.3 37,500 5 34
Stiff to very stiff clay M-C Undrained A 17 15 0.35 40,000 50 24
Very stiff clay M-C Undrained A 17 15 0.35 50,000 80 26
Hard clay M-C Undrained A 17.5 15.5 0.35 80,000 100 28
Table 6 Construction sequence of full-scale test reinforced embankment
Phase Duration (days)
Initial 0
Phase 1 10
Phase 2 12
Phase 3 12
Phase 4 12
Phase 5 12
Phase 6 11
Phase 7 7
Phase 8 7
Phase 9 7
Phase 10 7
Phase 11 7
Phase 12 8
Cover 25 cm 1
Surcharge (1.2 m fill) 12
Consolidation 61

Page 15 of 29Baral et al. Geo-Engineering (2016) 7:20
displacements at the top of the PP, PET, and HDPE geogrid reinforcement at 186 days were noted after the 1.2-m-thick surcharge was added, which can be observed in the field too, as a tilt of the inclinometer on the top of the RSS facing (see Fig. 18). The larg-est displacement occurred in the middle of the RSS facing with the PP geogrid reinforce-ment. In the MSEW facing, the lateral displacement for SWG was slightly larger than for MS because its stiffness is lower than MS. In general, the simulation results agreed well with the field observations and polymeric reinforcements were successfully simulated than metallic reinforcements in terms of lateral deformation.
Fig. 12 Construction details of MSE wall/embankment
-12.0
-10.0
-8.0
-6.0
-4.0
-2.0
0.0
2.0
4.0
6.0
8.0-50-40-30-20-1001020304050
Ele
v (m
.)
Net Lateral Displacement : A-axis (mm.)
16-Nov-10 (Base Reading Setup, +6.000 m Layer 13)21-Jan-2011 (Monitoring no. 11, Surcharge 100%)Inclinometer1_PET_FEM
INCLINOMETER NO. 01 PETPP
PE
SWG
MS
A+B+I1
RSS
MSEW
Fig. 13 Inclinometer readings at the facing of the polyester (PET) geogrid reinforcement

Page 16 of 29Baral et al. Geo-Engineering (2016) 7:20
-12.0
-10.0
-8.0
-6.0
-4.0
-2.0
0.0
2.0
4.0
6.0
8.0-50-40-30-20-1001020304050
Ele
v (m
.)
Net Lateral Displacement : A-axis (mm.)
16-Nov-10 (Base Reading Setup, +6.000 m Layer 13)
21-Jan-11 (Monitoring no.11, Surcharge 100%)
Inclinometer2_PP_FEM
INCLINOMETER NO. 02 PET
PPPE
SWG
MS
A+B+I2
RSS
MSEW
Fig. 14 Inclinometer readings at the facing of the polypropylene (PP) geogrid reinforcement
-12.0
-10.0
-8.0
-6.0
-4.0
-2.0
0.0
2.0
4.0
6.0
8.0-50-40-30-20-1001020304050
Ele
v (m
.)
Net Lateral Displacement : A-axis (mm.)
16-Nov-10 (Base Reading Setup, +6.000 m Layer 13)
21-Jan-11 (Monitoring no.11, Surcharge 100%)
Inclinometer I3_HDPE_FEM
INCLINOMETER NO. 03 PET
PP
PE
SWG
MSA+B+I3
RSS
MSEW
Fig. 15 Inclinometer readings at the facing of the high-density polyethylene (HDPE) geogrid reinforcement
Page 17 of 29Baral et al. Geo-Engineering (2016) 7:20
Vertical deformations
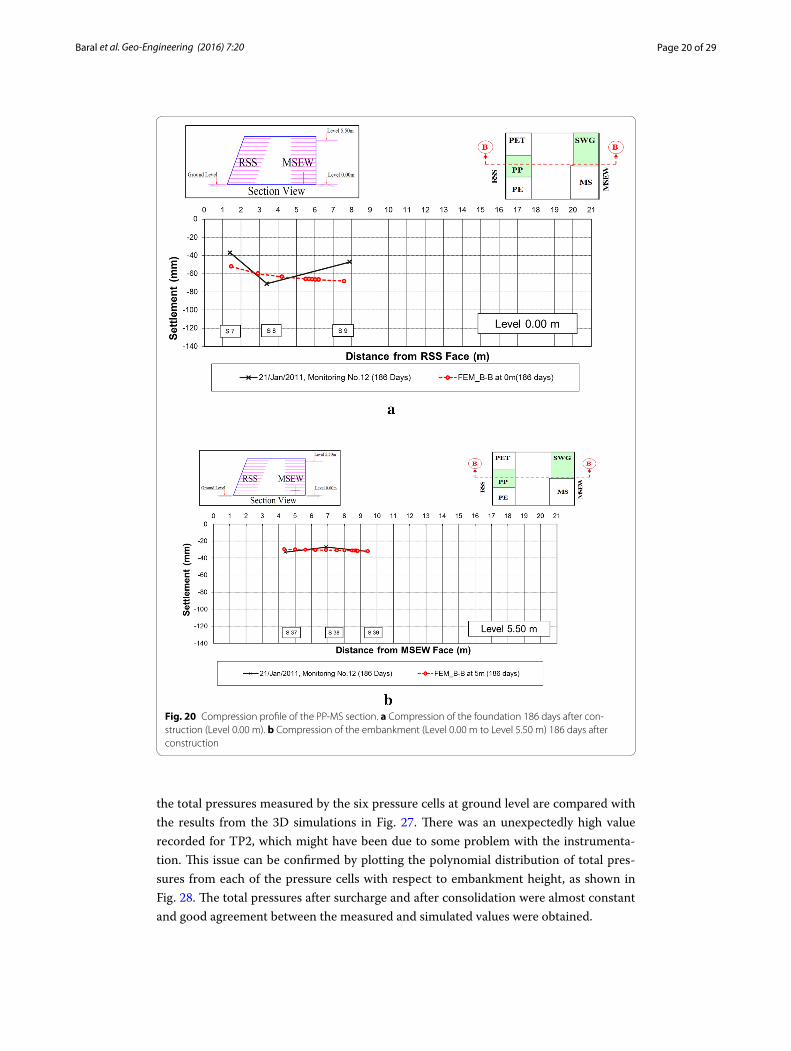
Surface and subsurface settlement plates were installed in the embankment at differ-ent locations to measure vertical settlements. The maximum settlement at the base of the embankment (Level 0.00 m) ranged from 60 to 80 mm 186 days after construction. The compression of the foundation was found to increase slightly towards the facing, as shown in Figs. 19a, 20a and 21a for the PET-SWG, PP-MS and PE-MS sections, respec-tively. Similarly, the compression of the embankment (Level 0.00 m to Level 5.50 m) var-ied between 20 and 40 mm, as shown in Figs. 19b, 20b and 21b for the PET-SWG, PP-MS and PE-MS sections, respectively. Due to the hard ground foundation, the magnitudes of the vertical settlements were relatively low. The settlement profile of the PET-SWG, PP-MS and PE-MS sections at different levels of the embankment (0.00 m at the base of the embankment and 5.50 m at the top of embankment) are plotted together with the simulated data in Figs. 19a,b, 20, 21a,b, respectively. Overall, the simulation results are consistent with the vertical deformations measured in the field.
Strains in reinforcement
The measured and simulated strains in the metallic and polymeric reinforcement were in good agreement. The strains were measured using vibrating-wire strain gauges in the metallic reinforcement (SWG and MS) and using fibre optic strain gauges in the poly-mer geogrids (PET, PP and HDPE). For the metallic reinforcement, the strains were lower than the geogrid strains because the metallic reinforcement was much stiffer
-12.0
-10.0
-8.0
-6.0
-4.0
-2.0
0.0
2.0
4.0
6.0
8.0-50 -40 -30 -20 -10 0 10 20 30 40 50
Ele
v (m
.)
Net Lateral Displacement : A-axis (mm.)
16-Nov-10 (Base Reading Setup,+6.00m, Layer13)21-Jan -11 (Monitoring No. 11, Surcharge 100%)Inclinometer 4_SWG_FEM
INCLINOMETER NO. 04 PET
PP
PE
SWGMS
A+B+I4
RSS
MSEW
Fig. 16 Inclinometer readings at the facing of the steel wire grid (SWG) reinforcement

Page 18 of 29Baral et al. Geo-Engineering (2016) 7:20
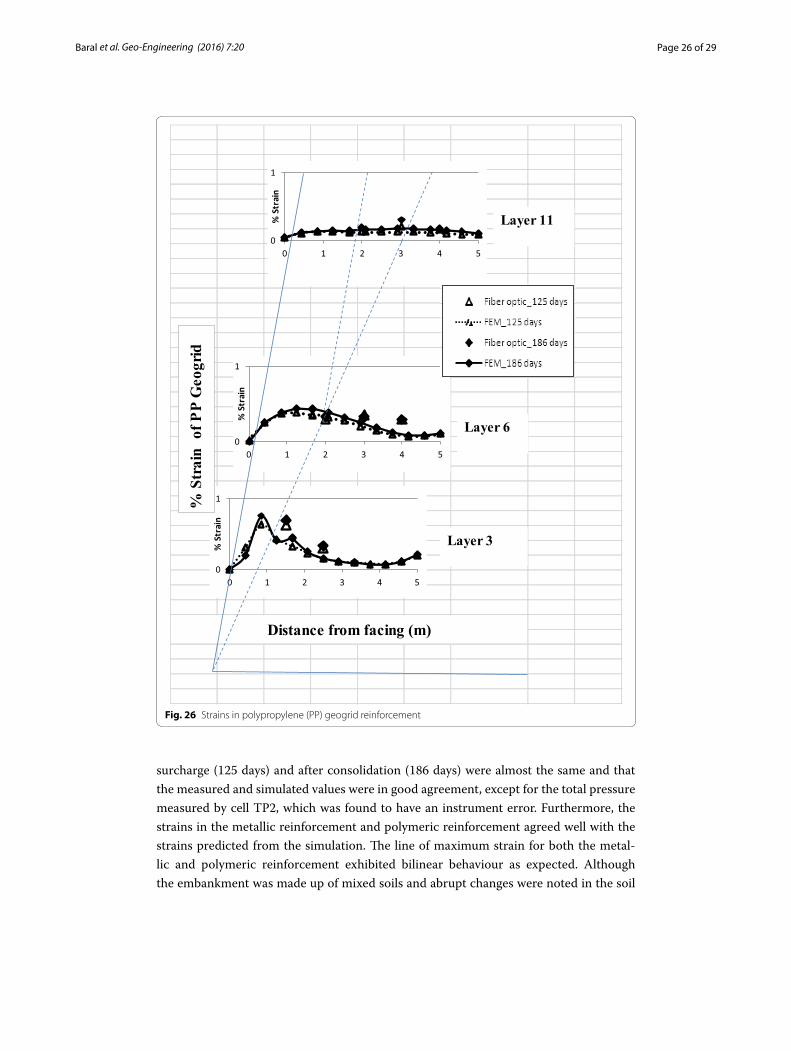
than the polymer geogrids. The measured and simulated strains in the metallic strips (MS) and steel wire grids (SWG) are plotted in Figs. 22 and 23, respectively, after 125 and 186 days. The corresponding strains in the polymer geogrids (PET, HDPE and PP) are plotted in Figs. 24, 25, 26, respectively. In general, good agreement was observed
-12.0
-10.0
-8.0
-6.0
-4.0
-2.0
0.0
2.0
4.0
6.0
8.0-50 -40 -30 -20 -10 0 10 20 30 40 50
Ele
v (m
.)
Net Lateral Displacement : A-axis (mm.)
16-Nov-10 (Base Reading Setup, +6.000 m Layer 13)21-Jan-11 (Monitoring no.11, Surcharge 100%)Inclinometer5_MS_FEM
INCLINOMETER NO. 05 PET
PP
PE
SWGMS
A+B+I5
MSEW
Fig. 17 Inclinometer readings at the facing of the metallic strip (MS) reinforcement
Fig. 18 Figure showing tilt of inclinometer at the top of RSS facing

Page 19 of 29Baral et al. Geo-Engineering (2016) 7:20
between the measured and simulated strains. The line of maximum strain corresponded to bilinear rather than linear behaviour.
Total pressure cells
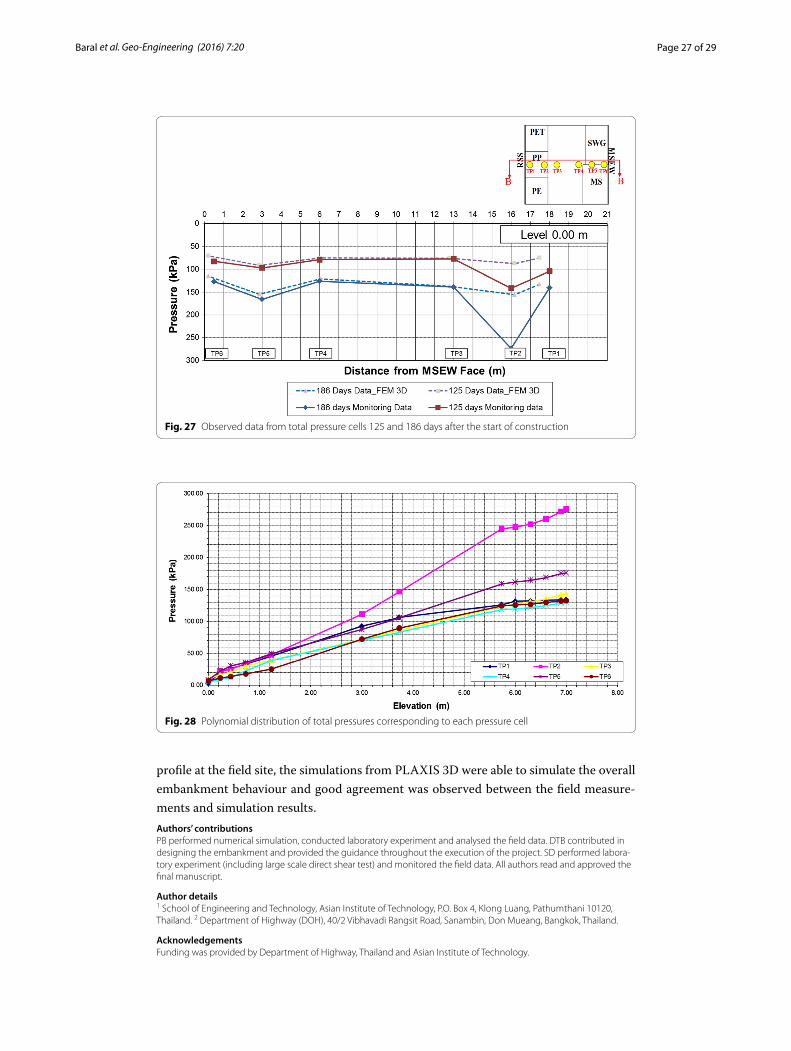
Total pressure cells were installed at various locations at the base of the embankment at level 0.00 m (see Fig. 27). The total pressure cell TP2 indicated that the highest total pressure measured was 275 kPa after 186 days, while the maximum total pressure recorded by TP5 was 175 kPa. These values are abnormally higher than the weight of the embankment. The pressures measured by TP1, TP3, TP4 and TP6 ranged from 130 to 150 kPa, which are consistent with the weight of the embankment. The variation in
Fig. 19 Compression profile of the PET-SWG section. a Compression of the foundation 186 days after construction (Level 0.00 m). b Compression of the embankment (Level 0.00 m to Level 5.50 m) 186 days after construction
Page 20 of 29Baral et al. Geo-Engineering (2016) 7:20
the total pressures measured by the six pressure cells at ground level are compared with the results from the 3D simulations in Fig. 27. There was an unexpectedly high value recorded for TP2, which might have been due to some problem with the instrumenta-tion. This issue can be confirmed by plotting the polynomial distribution of total pres-sures from each of the pressure cells with respect to embankment height, as shown in Fig. 28. The total pressures after surcharge and after consolidation were almost constant and good agreement between the measured and simulated values were obtained.
Fig. 20 Compression profile of the PP-MS section. a Compression of the foundation 186 days after con-struction (Level 0.00 m). b Compression of the embankment (Level 0.00 m to Level 5.50 m) 186 days after construction

Page 21 of 29Baral et al. Geo-Engineering (2016) 7:20
Discussions of the resultsThe field data obtained from full-scale reinforced embankment are compared with the results obtained from FEM 3D simulation of embankment. PLAXIS 3D (ver. 2011) was used as a tool for FEM Simulation. Comparisons were mainly made on lateral and verti-cal displacement, strains in the reinforcements and total pressures. The horizontal field deformation indicated by inclinometers for all polymeric and metallic reinforcements agreed well with simulation data and larger deformation were noticed for successfully simulated polymeric reinforcements in comparison with metallic reinforcements due to higher stiffness of the metallic reinforcements. In addition, larger deformation was
Fig. 21 Compression profile of the PE-MS section. a Compression of the foundation 186 days after con-struction (Level 0.00 m). b Compression of the embankment (Level 0.00 m to Level 5.50 m) 186 days after construction

Page 22 of 29Baral et al. Geo-Engineering (2016) 7:20
observed on the top of the embankment after the 1.2-m-thick surcharge has been added, which was confirmed by tilting of embankment on topmost part in field too as shown in Fig. 18. Similarly, the measured vertical compression data for each section are compared with simulated data and it was found that vertical settlement was found to be varied from 60 to 80 mm. Furthermore, the vertical compression of the embankment (Level 0.00 m to Level 5.50 m) was found to be varied between 20 and 40 mm (see Figs. 19, 20, 21). The value of settlement is found to be low as the embankment was constructed on hard ground.
0.00
0.06
0 1 2 3 4 5
0.00
0.06
0 1 2 3 4 5
0.00
0.06
0 1 2 3 4 5 6
Layer 3
Layer 6
Layer 11
Distance from facing (m)
% S
trai
n of
Ste
el S
trip
Fig. 22 Strains in metallic strip (MS) reinforcement

Page 23 of 29Baral et al. Geo-Engineering (2016) 7:20
Vibrating wire strain gauges for metallic reinforcements and fibre optic strain gauges for polymeric reinforcements are installed on the embankment and results from field measurement were compared with the simulation results. Theoretically, the strains should be zero at the end of embankment (at a distance of 5 m from the facing) but due to the difficulties and inaccuracies associated with sensitive strain gauges, there is cer-tain value of strain at the end of reinforcements (see Figs. 22, 23, 24, 25, 26). In general, good agreement was observed between simulated and measured strains and the line of maximum strain for both the metallic and polymeric reinforcements exhibited bilinear behaviour as expected.
0
0.06
0 1 2 3 4 5
0
0.06
0 1 2 3 4 5
0
0.06
0 1 2 3 4 5Layer 11
Layer 6
Layer 3
Distance from facing (m)
% S
trai
n of
Ste
el W
ire
Gri
d
Fig. 23 Strains in steel wire grid (SWG) reinforcement

Page 24 of 29Baral et al. Geo-Engineering (2016) 7:20
Six total pressure cells are installed at the base of embankment in order to measure total pressure at 125 and 186 days after construction and compared with the simulated data. It was found that the pressures varied from 130 to 150 kPa (see Fig. 27). Unex-pected high value (i.e., 275 kPa) was noted by TP2 and might have been due to some instrumentation problem which was confirmed by plotting polynomial distribution of total pressures with height (see Fig. 28). Overall, the simulation results are consistent with measured field data.
ConclusionsA full-scale reinforced embankment was designed and constructed on a hard founda-tion in Phitsanulok, Thailand, with polymeric reinforcement on one side and metallic reinforcement on the other side. The metallic reinforcement in the mechanically stabi-lised earth wall (MSEW) facing consisted of metallic strips (MS) and steel wire grids (SWG). The polymer reinforcement in the reinforced steep slope (RSS) facing consisted
Distance from facing (m)
0
1
2
0 1 2 3 4 5
% S
trai
n
0
1
2
0 1 2 3 4 5
% S
trai
n
0
1
2
0 1 2 3 4 5
% S
trai
n
Layer 3
Layer 6
Layer 11
% S
trai
n of
PE
T G
eogr
id
Fig. 24 Strains in polyester (PET) geogrid reinforcement

Page 25 of 29Baral et al. Geo-Engineering (2016) 7:20
of polypropylene (PP), high-density polyethylene (HDPE) and polyester (PET) geogrids. The behaviour of both the metallic and polymeric reinforcement was monitored and observed. The lateral and vertical embankment deformations in the MSEW facing were very small, according to the field monitoring results. The deformations of the RSS facing were much greater than those in the MSEW facing because the polymeric reinforcement was not as stiff as the metallic reinforcement. The reinforcing materials can be listed in the following descending order in terms of stiffness: metallic strips (MS), steel wire grids (SWG), polypropylene (PP), high-density polyethylene (HDPE) and polyester (PET). The measured lateral and vertical deformations for both facings, with the different types of reinforcement, agreed well with those predicted from the numerical simulation using PLAXIS 3D. The data from the total pressure cells showed that the total pressures after
Distance from facing (m)
0
1
0 1 2 3 4 5
% S
trai
n
0
1
0 1 2 3 4 5
% S
trai
n
0
1
0 1 2 3 4 5
% S
trai
n
Layer 3
Layer 6
Layer 11%
Str
ain
of H
DPE
Geo
grid
Fig. 25 Strains in high-density polyethylene (HDPE) geogrid reinforcement
Page 26 of 29Baral et al. Geo-Engineering (2016) 7:20
surcharge (125 days) and after consolidation (186 days) were almost the same and that the measured and simulated values were in good agreement, except for the total pressure measured by cell TP2, which was found to have an instrument error. Furthermore, the strains in the metallic reinforcement and polymeric reinforcement agreed well with the strains predicted from the simulation. The line of maximum strain for both the metal-lic and polymeric reinforcement exhibited bilinear behaviour as expected. Although the embankment was made up of mixed soils and abrupt changes were noted in the soil
Distance from facing (m)
0
1
0 1 2 3 4 5
% S
trai
n
0
1
0 1 2 3 4 5
% S
trai
n0
1
0 1 2 3 4 5
% S
trai
n
Layer 3
Layer 6
Layer 11
% S
trai
n of
PP
Geo
grid
Fig. 26 Strains in polypropylene (PP) geogrid reinforcement
Page 27 of 29Baral et al. Geo-Engineering (2016) 7:20
profile at the field site, the simulations from PLAXIS 3D were able to simulate the overall embankment behaviour and good agreement was observed between the field measure-ments and simulation results.Authors’ contributionsPB performed numerical simulation, conducted laboratory experiment and analysed the field data. DTB contributed in designing the embankment and provided the guidance throughout the execution of the project. SD performed labora-tory experiment (including large scale direct shear test) and monitored the field data. All authors read and approved the final manuscript.
Author details1 School of Engineering and Technology, Asian Institute of Technology, P.O. Box 4, Klong Luang, Pathumthani 10120, Thailand. 2 Department of Highway (DOH), 40/2 Vibhavadi Rangsit Road, Sanambin, Don Mueang, Bangkok, Thailand.
AcknowledgementsFunding was provided by Department of Highway, Thailand and Asian Institute of Technology.
Fig. 27 Observed data from total pressure cells 125 and 186 days after the start of construction
Fig. 28 Polynomial distribution of total pressures corresponding to each pressure cell

Page 28 of 29Baral et al. Geo-Engineering (2016) 7:20
Competing interestsThe authors declare that they have no competing interests.
Received: 16 November 2015 Accepted: 10 November 2016
References 1. Abdelouhab A, Dias D, Freitag N (2011) Numerical analysis of the behavior of mechanically stabilized earth walls
reinforced with different types of strips. Geotext Geomembr 29(2):116–129 2. Abiera HO (1991) Mechanically stabilized earth using TENSAR, bamboo and steel grid reinforcements with lateritic
soil as backfill. M. Eng. Thesis GT-90-21, Asian Institute of Technology, Bangkok 3. Al Hattamleh O, Muhunthan B (2006) Numerical procedures for deformation calculations in the reinforced soil walls.
Geotext Geomembr 24(1):52–57 4. Alfaro MC (1996) Reinforced soil wall-embankment system on soft foundation using inextensible and extensible
grid reinforcements. PhD Thesis, Saga University, Saga 5. Alfaro MC, Hayashi S, Miura N, Bergado DT (1997) Deformation of reinforced soil wall-embankment system on soft
clay foundation. Soils Found 37(4):33–46 6. Asanprakit A (2000) Analytical model on the distributions of frictional and bearing resistance as well as deforma-
tions of hexagonal wire mesh reinforcement with weathered Bangkok clay backfill. M. Eng. Thesis No. GE-99-13, Asian Institute of Technology, Bangkok
7. Auvinet G, Gonzalez JL (2000) Three-dimensional reliability analysis of earth slopes. Comput Geotech 26:247–261 8. Bergado DT, Teerawattanasuk C (2008) 2D and 3D numerical simulations of reinforced embankments on soft
ground. Geotext Geomembr 26:39–55 9. Bergado DT, Chai JC, Miura N (1995) FE analysis of grid reinforced embankment system on soft Bangkok clay. Com-
put Geotech 17:447–471 10. Bergado DT, Youwai S, Teerawattanasuk P, Visudmedanukul P (2003) The interaction mechanism and behavior of
hexagonal wire mesh reinforced embankment with silty sand backfill on soft clay. Comput Geotech 30:517–534 11. Bourgeois E, Lekouby A, Soyez L (2012) Influence of the strip-backfill interaction model in the analysis of the behav-
ior of a mechanically stabilized earth wall. Soils Found 52(3):550–561 12. Briaud J, Lim Y (1999) Tieback walls in sand: numerical simulation and design implications. J Geotech Geoenviron
Eng ASCE 125(2):101–111 13. Chai JC (1992) Interaction behavior between grid reinforcement and cohesive frictional soils and performance
of reinforced wall/embankment on soft ground. Doctoral Dissertation No. GT-91-1, Asian Institute of Technology, Bangkok
14. Chai JC, Bergado DT (1993) Performance of reinforced embankment on Muar clay deposit. Soils Found 33(4):1–17 15. Chai JC, Bergado DT (1993) Some techniques for FE analysis of embankment on soft ground. Can Geotech J
30:710–719 16. Chai JC, Miura N, Bergado DT, Long PV (1997) Finite element analysis of geotextile reinforced embankment failure
on soft subsoil. Geotech Eng J 28(2):249–276 17. Cisneros CB (1989) Pullout resistance of steel grids with weathered clay as backfill material. M. Eng. Thesis No. GT-88-
7, Asian Institute of Technology, Bangkok 18. Hinchberger SD, Rowe RK (2003) Geosynthetic reinforced embankments on soft clay foundations: predicting rein-
forcement strains at failure. Geotext Geomembr 21:151–175 19. Huang B, Bathurst RJ, Hatami K (2009) Numerical study of reinforced soil segmental walls using three different
constitutive soil models. J Geotech Geoenviron Eng ASCE 135(10):1486–1498 20. Kabiling MB (1997) Pullout capacity of different hexagonal link wire sizes and configurations on sandy and volcanic
ash (Lahar) backfills. M. Eng. Thesis No. GE-96-4, Asian Institute of Technology, Thailand 21. Karpurapu R, Bathurst RJ (1995) Behavior of geosynthetic reinforced soil retaining walls using the finite element
method. Comput Geotech 17:279–299 22. Kongkikul W (2001) Numerical and analytical modeling on pullout capacity and interaction of in-soil pullout tests
between hexagonal wire mesh reinforcement and silty sand. M. Eng Thesis, Asian Institute of Technology, Thailand 23. Lai YP, Bergado DT, Lorenzo GA, Duangchan T (2006) Full-scale reinforced embankment on deep jet mixing
improved ground. Gr Improv 10(4):153–164 24. Long, P.V., 1996. Behavior of geotextile reinforced embankment on soft ground. PhD Thesis GE-96-1, Asian Institute
of Technology, Thailand 25. Mir EN (1996) Pullout and direct shear test of hexagonal wire mesh reinforcements in various fill materials including
lahar from mt. Pinatubo, Philippines. M. Eng. Thesis No. GE-95-18, Asian Institute of Technology, Thailand 26. Modmoltin C (1998) Behavior of hexagonal wire mesh reinforcement in full scale embankment load during pullout
test. M. Eng. Thesis No. GE-97-6, Asian Institute of Technology, Bangkok 27. Nualkliang M (2011) Behavior of MSE wall/embankment with geogrid and metallic reinforcements on hard founda-
tion. M. Eng. Thesis No. GE-10-5, Asian Institute of Technology, Bangkok 28. PLAXIS BV (2011) PLAXIS manual—PLAXIS 3D-version. PLAXIS, Delft 29. Prempramote S (2005) Interaction between geogrid reinforcement and tire chip-sand mixture. M. Eng Thesis No.
GE-04-12, Asian Institute of Technology, Bangkok 30. Rittirong A (2003) Large triaxial test of shredded rubber tire with and without sand mixture and the constitutive
model verification. M. Eng. Thesis No. GE-02-13, Asian Institute of Technology, Bangkok 31. Rowe RK, Ho SK (1998) Horizontal deformation in reinforced soil wall. Can Geotech J 35:312–327

Page 29 of 29Baral et al. Geo-Engineering (2016) 7:20
32. Shivashankar R (1991) Behavior of mechanically stabilized earth (MSE) embankment with poor quality backfills on soft clay deposits, including a study of the pullout resistances. PhD Thesis, Asian Institute of Technology, Bangkok
33. Skinner GD, Rowe RK (2005) Design and behavior of a geosynthetic reinforced retaining wall and bridge abutment on a yielding foundation. Geotext Geomembr 23(3):235–260
34. Smith IM, Su N (1997) Three-dimensional FE analysis of a nailed soil wall curved in plan. Int J Numer Anal Meth Geomech 21:583–599
35. Srikongsri A (1999) Analytical model for interaction between hexagonal wire mesh and silty sand backfill. M. Eng. Thesis No. GE-98-14, Asian Institute of Technology, Bangkok
36. Supawiwat N (2002) Behavior of shredded rubber tires with and without sand, its interaction with hexagonal wire reinforcement and their numerical simulation. M. Eng. Thesis GE-01-14, Asian Institute of Technology, Bangkok
37. Tanchaisawat T (2008) Interactions and performances of geogrid reinforced tire chips-sand lightweight embank-ment on soft ground. PhD Thesis No.GE-07-01, AIT, Bangkok
38. Tin N (2009) Factors affecting the kinked steel grid reinforcement and modification of K-stiffness method in MSE structures on soft ground. M. Eng. Thesis No.GE-08-03, AIT, Bangkok
39. Visudmedanukul P (2000) FEM analysis on the interaction mechanism between hexagonal wire mesh reinforcement and silty sand backfill. M. Eng. Thesis No. GE-99-6, Asian Institute of Technology, Bangkok
40. Voottipruex P (2000) Interaction of hexagonal wire reinforcement with silty sand backfill soil and behavior of full scale embankment reinforced with hexagonal wire mesh. PhD Thesis No. GE-99-01, Asian Institute of Technology, Bangkok
41. Wongsawanon T (1998) Interaction between hexagonal wire mesh reinforcement and silty sand backfill. M. Eng. Thesis No. GE-97-14, Asian Institute of Technology, Bangkok
42. Youwai S (2003) Strength and deformation characteristics of reinforced rubber tire chip with and without sand mixtures and its application on reinforced wall simulation. PhD Thesis No. GE-03-2, Asian Institute of Technology, Bangkok
43. Zdravkovic L, Potts DM, Hight DW (2002) The effect of strength anisotropy on the behavior of embankments on soft ground. Geotechnique 52(6):447–457