the united states national income accounts, 1947-1977
TRANSCRIPT

This PDF is a selection from an out-of-print volume from the National Bureauof Economic Research
Volume Title: The U.S. National Income and Product Accounts: SelectedTopics
Volume Author/Editor: Murray F. Foss, Ed.
Volume Publisher: University of Chicago Press
Volume ISBN: 0-226-25728-2
Volume URL: http://www.nber.org/books/foss82-1
Publication Date: 1982
Chapter Title: The United States National Income Accounts, 1947-1977: TheirConceptual Basis and Evolution
Chapter Author: Richard Ruggles
Chapter URL: http://www.nber.org/chapters/c7783
Chapter pages in book: (p. 15 - 106)

The United States National Income Accounts, 1947-1977 Their Conceptual Basis and Evolution Richard Ruggles
1.1 Introduction
The national income accounts for the United States and their statistical implementation represent one of the major achievements in economics in the twentieth century. The design of the national income accounting system has been a cumulative development, which has been responsive both to the concepts embodied in modern economic theory and to the poUcy needs for information about the operation of the economic system. The implementation of the national income accounts in the form of a reUable and consistent set of statistical estimates represents an outstand-ing accompUshment on the part of those who have been engaged in this work over the last half century.
The purpose of this paper is to examine the national income accounting system of the United States and to show how the system has evolved since it was first put in place in 1947. It is hoped that this examination will lead to a better understanding of how the present system came into being and why it has the characteristics it does. The examination will focus on the major conceptual issues that have arisen in connection with the establish-ment of the national income accounting system and its subsequent revi-sions, and it is in this context that questions will be raised about the problem areas that remain to be solved and the directions future develop-ments may take.
The U.S. national income accounting system has been characterized by relative stabiUty and continuity. The process of change has been gradual and evolutionary, and, when changes were made that seriously affected the comparability of data over time, the Bureau of Economic Analysis (BEA) has taken care to provide complete revisions which in all cases
Richard Ruggles is Stanley R. Resor Professor of Economics at Yale University.
15

16 Richard Ruggles
have covered the period since 1947 and usually have provided data back to 1929. Nevertheless, it is not feasible in a short paper to discuss chronologically all of the specific conceptual, methodological, classifica-tion, and statistical changes that have been made, as they are far too numerous. Instead, the approach taken by this paper will be to review the accounts at the points when major revisions were made by BE A or its predecessor organizations. This will provide cross-sectional views of what the national income accounting system was like in certain benchmark periods.
Similarly, it is neither possible nor desirable to attempt to cover the whole body of national income accounting literature written in the last 30 years. Instead, this paper will focus only on work that is directly related to the U.S. national income accounts and so can provide the basis for analyzing the central conceptual issues involved. Specifically, the docu-ments that will be covered are (1) the 1951 and 1954 supplements to the Survey of Current Business, which presented in the fullest detail the sources and methods employed in preparing the U.S. national income accounts; (2) the proceedings of the 1955 Conference on Income and Wealth, published as A Critique of the United States Income and Product Accounts (Studies in Income and Wealth, 1958, vol. 22); (3) the Report of the National Accounts Review Committee, pubhshed in Hearings before the Joint Economic Committee in 1957; (4) the proceedings of the 1969 Conference on Income and Wealth, pubhshed as The Measurement of Economic and Social Performance (Studies in Income and Wealth, 1973, vol. 38); and (5) the fiftieth anniversary issue of the Survey of Current Business, titled The Economic Accounts of the United States^ Retrospect and Prospect (July 1971, vol. 51, no. 7, pt. II).
In addition to examining the U.S. national income accounts and discus-sions directly relating to them, it will also be useful to compare and contrast the U.S. accounts with the United Nations System of National Accounts (SNA). The SNA currently serves as the basis for national income accounting in a considerable number of countries, and the differ-ences between the U.N. system and that of the United States can illumi-nate some of the major conceptual issues involved in national income accounting.
Finally, it will be useful to examine the U.S. national income accounts in the light of related statistical work currently under way in the BEA and other statistical agencies. This, together with the earlier discussions of conceptual issues, will lead to some conclusions as to the possible direc-tions future developments might take.

17 The United States National Income Accounts, 1947-1977
1.2 The Major Conceptual Issues and the Evolution of the U.S. National Income Accounts
1.2.1 The Pre-1947 Period
Although the first national income accounting system for the United States was pubHshed by the Department of Commerce in 1947, official estimates of the national income and its components had been made by the Department of Commerce since the mid-1930s. The process by which the national income estimates developed into a national income account-ing system has been well described by Carol Carson (1975). When the Department of Commerce with the assistance of Simon Kuznets first produced national income estimates in 1934, attention was focused on national income produced and national income paid out. National in-come produced referred to the net product of the national economy, and national income paid out referred to the compensation in money or kind paid for efforts in producing the net product. There was no sectoring of the economy, and emphasis was placed on the estimation of total national income, which was primarily used as an indicator or barometer of eco-nomic activity. What was also missing in these early measurements was the expenditure breakdown of national product. As Carson has noted, however, the origin of the expenditure breakdown in the United States predates the Keynesian model of income determination (i.e., F = C + / ) . As early as 1932 Clark Warburton was working on the estimation of consumption and capital formation, and in 1934 he published a table on the composition and value of gross national product in which consumer goods and capital goods were shown. This was the first use of the concept of gross national product. Kuznets in 1933 was also working on estimates of gross capital formation and consumers' outlay through a commodity flow approach. Finally, Lauchlin Currie at the Federal Reserve Board (FRB) was in 1934 working on the concept of pump-priming deficit and using this to analyze the net contribution of government to national buying power. At this time, however, there was still no consideration of sectors of the economy, and it is undoubtedly true that the subsequent development of the Keynesian framework had a considerable impact on the direction of the work during the latter part of the 1930s.
But, as Carson pointed out, it was the mobilization for World War II and the consequent demand for data relating to the economy as a whole that was primarily responsible for shaping the accounts. The central questions posed by the war were how much defense output could be produced and what impact defense production would have upon the economy as a whole. Answering such questions required analysis of total resource availabiUties and of the income generated by the increasing production in relation to the availability of consumer goods. For exam-

18 Richard Ruggles
pie, the inflationary gap analysis of the Tax Research Division of the Treasury Department required information on how much income would be generated and how much of this income consumers could be expected to spend on available consumer goods. The emphasis thus shifted away from the earUer focus on national income aggregates to the estimation of how income was generated, received, and spent by various sectors of the economy.
At the same time, during World War II, similar developments were taking place in England. Richard Stone was developing a national income accounting system for the United Kingdom, and the White Papers in which this work was reported were available in the United States. During 1944, meetings between U.S., British, and Canadian experts were held to compare conceptual and statistical problems in national income estima-tion. In 1945, a group of experts on national income was convened by the League of Nations, and for this meeting Richard Stone drafted a national income accounting system which served as the basis for future interna-tional developments. By the end of the war, the stage was thus set for the emergence of a full-fledged set of U.S. national accounts.
1.2.2 The 1947 National Income Accounts
The first U.S. national income accounting system was published in the July 1947 supplement to the Survey of Current Business. The presentation was designed to accompHsh three objectives: ''(1) to complete the setting up of the whole body of national income statistics as an interrelated and consistent system of national economic accounts, (2) to improve the statistical procedures used in estimating all the series and to base them on the latest source data, and (3) to incorporate a number of changes in the basic aggregates so as to achieve more generally useful and clear-cut definitions of national income and national product." The system of accounts consisted of an overall account for the national economy, together with accounts for major sectors which would permit the tracing of various flows from one account to another. These accounts are shown below in Exhibit 1, tables I-VI.
Table I is the summary income and product account for the nation. It is a summary account in that it brings together in a single account the current transactions recorded in the sector accounts of businesses, con-sumers, and government. In drawing up the national income and product account, some difficult and controversial decisions had to be made re-garding the activities that were to be considered economic production or income. Government interest, the services of housewives, and income from illegal activities were all excluded from national income and pro-duct. On the other hand, certain imputed items of income in kind were included, such as the rental value of owner-occupied housing and banking services rendered to persons without explicit payment.

19 The United States National Income Accounts, 1947-1977
Table II shows the income and product account for the business sector of the economy. In essence this table is a consolidated profit and loss statement for current business operations. The business sector covers all firms, organizations, and institutions that produce goods and services for sale at a price intended at least to approximate the cost of production. Mutual financial institutions, cooperatives, nonprofit organizations serv-ing business, owner-occupied houses, and government enterprises were all included in the business sector.
Table III is a receipts and expenditures account for the government sector. It covers the consolidated general government operations of federal, state, and local governments, including social insurance funds and the purchases of government enterprises on capital account, together with their net interest payments and operating surplus or deficit.
Table IV presents the foreign account, which shows the transactions of the rest of the world with domestic businesses, persons, and government, on a net basis.
Table V, the personal income and expenditure account, includes not only individuals in their capacity as income receivers but also the income and expenditures of nonprofit institutions serving households, and of private trust funds and private pension and welfare funds. It should be noted that transfers among these different groups, for example, between households and nonprofit institutions, pension funds, etc., all consoUdate out.
Finally, table VI is a consohdated gross saving and investment account. It was pointed out that this account was presented on a consolidated basis because the data necessary for a complete accounting structure had not yet been developed. A logical and useful extension of the national accounting system, it was agreed, would be the construction of corre-sponding asset and HabiUty accounts for each sector.
This system of six basic accounts not only showed how the different sectors were interrelated and fitted into the total economy, but it also provided a framework for the extensive and detailed data generated by the Department of Commerce. By making relationships among the trans-action flows exphcit, and by providing control totals, the accounting system reduced the voluminous detail of the national income statistics to intelligible proportions. The 1947 supplement contained 37 tables of annual data for the years 1929-46. Tables were given for each side of the six accounts, and often more detail was provided than was shown in the accounts themselves. For example, the tables relating to the rest of the world grossed up the net purchases from the United States to show both exports and imports. Some of the tables gave breakdowns of individual items in the accounts. Personal consumption expenditures were shown by type of product for 12 categories. Detail was provided on construction activity and producers' durable equipment by type. Information on the
20 Richard Ruggles
performance of different industries and their contribution to national output was provided through industrial breakdowns of specific compo-nents of national income originating and of employment, for major industry groups and for subindustries at the two-digit level.
Supplementary tables were also developed on a variety of topics. Among these were reconciliation accounts, which showed the rela-tionship between the saving figures in the national accounts and the Securities and Exchange Commission data on liquid saving, and the relationship between corporate profits derived from corporate tax re-turns and the corporate profits concept in the national income accounts. Data were provided for monetary and imputed interest, showing the derivation of the net interest concept in the national accounts. A table was provided giving the major items of personal income and consumptive expenditures in kind.
In addition to the annual data, a set of eight tables gave quarterly data for the major national income aggregates and their components, includ-ing national income, gross national product, and personal income, together with a table showing the relation among these concepts. Finally, monthly data were given for personal income by type of payment.
1.2.3 The 1951 and 1954 National Income Supplements to the Survey of Current Business
In both 1951 and 1954, the Survey of Current Business published National Income supplements that contained (1) a fuller explanation of the national income accounting system, (2) a description of the sources and methods used in constructing the estimates, and (3) a full set of revised statistical data for all 48 tables contained in the 1947 accounts. There were no substantive revisions of the national accounting system in either 1951 or 1954, but in 1951 supplementary tables on gross national product in constant dollars together with the impUcit price deflators for the years 1929-50 were added. This type of information was formally integrated into the standard tables of national income statistics in the 1954 edition.
Both the 1951 and 1954 supplements were extremely important in providing the user public with a better understanding of the concepts involved in national income accounting and the methods of statistical estimation employed. In large part the widespread acceptance which the national income accounts achieved during the 1950s can be attributed to the comprehensive and detailed work that went into these supplements.
In explaining the accounts, major emphasis was placed on what at the time was considered to be the fundamental concept of national income accounting, namely, the concept of factor cost. The concept of factor cost was considered basic to the definition of national income and product, since the output of the nation (national product) was the result of the

21 The United States National Income Accounts, 1947-1977
services rendered by the agents of production (labor, capital, entre-preneurial ability, and natural resources used in the production process) that cooperated in the creation of that output. At the same time these services, valued in the market by their earnings, constituted national income. Furthermore, such a measure of the services rendered by pro-ductive agents was viewed as of central importance for studies of resource allocation. Thus it would be important to know the incomes of various factors of production used in each industry in order to be able to compare the relative importance of different industries, or to provide information about the relative amounts of factors of production available for alloca-tion to various uses, or to assess the relative importance of labor and property factors in the outputs of various industries.
It was recognized that the factors of production were not precisely defined in economic theory but to some extent had to be formulated with reference to the problem at hand. It was agreed, for example, that factor cost would not serve the intended purposes when factor returns were distorted by a temporary or permanent nontransferabihty of factors to other uses, or when they were affected by monopoly or by imperfect competition. It was further admitted that property income was only tenuously related to the measure of the contribution of property and enterprise needed for problems involving resource allocation, because it included a residual share (profits) which fluctuated widely over the busi-ness cycle. In spite of these difficulties and limitations, however, it was concluded that the idea of factor cost was of fundamental importance in economic analysis, and national income defined as the aggregate of factor earnings was the only general measure by which the idea could be quantified.
The factor cost concept had direct implications for the measurement of one of the central elements of property income, namely, interest, in the national accounts. Since interest could be both received and paid out by business, the Department of Commerce showed net interest paid as an element of factor cost. But this raised several problems. In the case of financial institutions, the amount of interest received generally exceeded the amount of interest paid out, so that net interest paid out by financial institutions was negative. In order to avoid showing negative output for financial institutions, it was considered that an imputation should be made to quantify the banking services that financial institutions were providing free to their depositors in exchange for the use of their funds. On the product side, the imputation would be recorded as a sale of banking services, and on the factor cost side it would be reported as imputed interest paid. It was recognized that the treatment of interest and the banking imputation might be criticized as "unduly complex and more specifically as based on certain assumptions of doubtful vaHdity." In particular, the appropriate allocation of banking services was difficult,
22 Richard Ruggles
but it was thought that, all things considered, it was the most satisfactory procedure devised so far.
There were, also, other difficulties connected with the net interest component. Interest paid by the government, it was argued, should be excluded from the measure of output, since it was not considered to arise from current production. This meant that government interest payments, unlike wage payments to government employees, were not considered to be factor costs but rather were classed as transfers.
The treatment of life insurance and pensions also involved special considerations. In the case of life insurance, it was argued that the standard national income and product classifications broke down owing to its combined saving and insurance functions, and imputations were therefore required. In the treatment adopted, claims and premiums were disregarded, and the property income of life insurance companies that was withheld from policy holders was treated as if it had been actually disbursed in the current period. This item of property income became imputed interest in the net interest component of income. Finally, life insurance companies were regarded as implicitly charging policy holders for their services, and an imputation equal to their operating expenses was entered to make this charge explicit: in the business account, under sales to persons and in the personal income account, as a consumption expenditure. As a result of all these actions, life insurance companies were in effect treated as individuals rather than businesses. Claims and premiums were canceled out as though they were transfers among indi-viduals, and the increase in life insurance reserves and retained income was treated as part of personal saving.
Private pensions were also integrated into the personal income account. Employers' contributions to private pension funds were in-cluded in the "other labor income" of employees as if they had actually been received. Employee contributions to private pension funds were ignored, and neither the benefits paid out by private pension funds nor the reserves and income retained by such funds were explicitly shown in the accounts. Changes in private pension reserves and retained income would thus be reflected automatically as part of personal saving. The procedures followed for social security contributions were different, of course, since these were consoHdated with the government sector. Any difference between social security contributions and benefits paid out was reflected in the government surplus or deficit rather than in personal saving.
1.2.4 The 1955 Critique of the U.S. Income and Product Accounts
The 1955 Conference on Income and Wealth was devoted to an exten-sive and detailed examination of the U.S. national income accounting system estabUshed in 1947. The participants in the conference had avail-

23 The United States National Income Accounts, 1947-1977
able to them not only the excellent statements on concepts, sources, and methods in the National Income supplements to the Survey of Current Business but also a major paper by George Jaszi, 'The Conceptual Basis of the Accounts.''
In his paper, Jaszi not only laid out the rationale of the U.S. national income accounting concepts but he also raised questions that he felt had not been satisfactorily resolved. His discussion of accounting design in terms of sectoring and types of account was particularly illuminating. He pointed out that the principle of sectoring had not been clearly estab-lished and contained ambiguities. Although sectors are usually thought to reflect institutional groupings, functional considerations are generally also involved. Thus although businesses, households, and governments are different kinds of institutions, they also involve different functions, and there is a tendency to define institutions in terms of the functions in which they engage. The conflict between institutional and functional sectoring is particularly apparent in the case of unincorporated enter-prises, The U.S. national income accounts split the owner of an unin-corporated enterprise into a business transactor with respect to his production, and a household transactor with respect to his income, expenditures, and saving. This has suggested to some national accoun-tants that it would be desirable to set up different types of accounts to show production, appropriation, and saving and investment for each sector. Although Jaszi considered this possibiHty, he rejected it, since he concluded that introducing additional accounts and transferring subtotals from one account to another served only to make the accounting struc-ture more complicated without increasing its information content.
Instead of increasing the complexity of the accounting structure, Jaszi proposed a revision of the 1947 six-account system into a simpler five-account system in which the business sector account would be consoli-dated with the national income and product account. The simpler ver-sion, he thought, would lose no useful information, and a number of inconsequential flows required to articulate the business sector with other sectors would be ehminated. Jaszi also thought it would be desirable to deconsoUdate the saving and investment account to show separate accounts for nonfinancial corporations, financial intermediaries, persons, government, and international transactors. He recognized the desirabil-ity of measuring government and consumer capital formation, estimating the stock of government and consumer durables, providing better esti-mates of replacement cost depreciation, and obtaining information on capital gains and losses. Thus it is apparent that in 1955 Jaszi viewed the national income accounting system as the core of an extended and inte-grated system of economic accounts.
It was, however, the more traditional issues of national income accounting that occupied most of the attention of the conference and

24 Richard Ruggles
generated the most heated discussions. The issues that attracted the most attention were factor cost measurement, the controversy about in-termediate output of government, and the treatment of interest, all of which centered about the correct measurement of output. Most of the participants were supportive of the concepts and procedures used by the Department of Commerce, but many were disturbed by the lack of symmetry between the treatment of consumer interest and government interest. No clear conclusions emerged on these topics, except the reaffir-mation that the correct measurement of national income at factor cost was still considered to be of central importance.
1.2.5 The Report of the National Accounts Review Committee (1957)
In 1956, the Office of Statistical Standards of the Bureau of the Budget requested that the National Bureau of Economic Research form a National Accounts Review Committee to (1) provide a review and evalu-ation of the national income and related accounts, and (2) devise a program for improving the accounts. To a major extent, this committee based its work on Jaszi's paper for the 1955 Conference on Income and Wealth, and expanded on his view of the national income accounts as the central core of a more general national economic accounting system. They endorsed Jaszi's proposal for the five-account system, and urged the development of a more comprehensive system of economic accounts in which input-output, flow of funds, balance of payments accounts, and national balance sheets would be fully integrated with the national in-come accounts.
The committee also urged substantial expansion of the information on the government sector in the national income accounts. At the time the accounts contained only one account for general government. Although this account contained separate information for federal and state and local governments, it did not link the federal receipts and expenditures with the federal budget or show federal expenditures by function and program. The committee urged that such information be provided. With respect to government interest payments, the report considered that the treatment of government interest as a transfer payment could be justified for interest on the war debt. Once the war was over, payments to holders of war bonds, like payments to war veterans, were made for a service in a period of the past, and there was no counterpart in the production during the years when the payments were actually made. But for debt used to finance tangible assets which contribute their services to production during the period when interest is paid, the committee thought that the case was different. Since most state and local debt is of this type, state and local government interest should be included in total output.
In connection with its report the committee sent out questionnaires to business, labor, and academic economists (but not to economists in the

25 The United States National Income Accounts, 1947-1977
federal government) inquiring what they wanted in the national accounts. The responses to this questionnaire were very interesting. Highest prior-ity was given to the development of quarterly estimates of GNP at constant prices. Additional items listed in order of frequency of citation were (a) addition of information on the stock of consumer durables; (b) reconciliation of consolidated government receipts and expenditures of the federal government as shown in the national income and product accounts with the conventional and cash budget figures; (c) classification of government purchases of goods and services into current and capital expenditures, a distinction essential for the estimation of government saving and investment; (d) separation of nonprofit institutions and a few other groups now lumped together with households into the personal sector; (e) quarterly estimates of personal saving on a balance sheet basis, that is, as the result of independently estimated changes in the different types of assets and Uabilities of households; (/) estimates of personal income in constant dollars; and (g) estimation of gross national product and its principal components on a monthly basis. These results suggest that what users wanted were more frequent reporting of figures useful for monitoring and analyzing the state of the business cycle, and more detailed information on the government sector and consumer durables.
Between the 1955 Conference on Income and Wealth and the 1957 Report of the National Accounts Review Committee, there was thus a shift in emphasis in the discussions on national income. The 1955 confer-ence concentrated on the question of the proper measurement of national income. The discussion in the National Accounts Review Committee was centered around questions of how the existing national income account-ing system should be expanded and integrated with other kinds of eco-nomic data and how it could better serve the needs of users. The concern, in other words, was no longer with the definition of the aggregates but with the data system as a whole.
1.2.6 The 1958 and 1965 Revisions of the National Income Accounts
In 1958 the Department of Commerce pubUshed U.S. Income and Output, a supplement to the Survey of Current Business, which for the first time since 1947 made significant changes in the national income accounting system and added very substantially to the information con-tained in the system. A new five-account system of summary accounts was adopted, which eliminated the business sector account in its entirety and dropped the subtotals showing income originating from the current accounts for government and households. The objective of removing this detail from the summary accounts was to display the broad measures and their interrelationships that had been found to be analytically most useful. The institutional structure of productive activity stressed in the 1947 accounts was no longer shown in the summary accounts, but it was

26 Richard Ruggles
felt that the gain in simplicity and in aptness for other principal uses more than outweighed this reduction in detail. The 1958 accounting system is shown in Exhibit 2, tables I-V.
Although the form of the summary accounts was altered, the basic accounting structure that lay behind the accounts remained essentially the same as before. But the new accounting system constituted a some-what better framework for fleshing out the accounts in greater detail and for presenting new kinds of information in a way that was fitted into the framework of the five-account system. A number of new kinds of in-formation were introduced.
In the national income and product account, increased emphasis was placed on constant-dollar measurements. As had been suggested by the National Accounts Review Committee, quarterly estimates were pro-vided of gross national product in constant dollars. The loss of informa-tion resulting from the omission of the business sector from the summary accounts was more than made up by increased information in the detailed tables on the legal forms of organization of producing entities.
The government sector provided a completely new breakdown of government expenditures by type and function for the federal and state and local governments. Furthermore, federal government receipts and expenditures were reconciled with the federal budget, so that the user of national accounts could trace the exact differences between the budget figures and the national accounts.
The foreign sector transactions were expanded in detail and directly tied in with the balance of payments. A new table on U.S. government net foreign assistance and balance of payments capital account were also provided.
With respect to personal income, data were provided on the distribu-tion of income by size and by region. The size distribution, furthermore, was broken down in terms of nonfarm families, farm famihes, and un-attached individuals. Monthly data on personal income by type of pay-ment was also added. Finally, substantially more detail was given for consumer expenditures in constant dollars.
The savings and investment information was also expanded. A table showing expenditures on new plant and equipment by industry was provided, and the net stocks of structures and equipment and inventories for manufacturing, developed by the perpetual inventory method, were introduced. Finally depreciation was given for corporate and noncorpo-rate business by industry.
In brief, the 1958 revision represented a substantial increase in the amount of information contained in the national accounts, and this was accompHshed in a systematic and orderly manner by fitting it into a simpler and more general framework. While to some degree this revision may have reflected the recommendations of the National Accounts Re-view Committee, in view of the timing of the publication in relation to the

27 The United States National Income Accounts, 1947-1977
committee's report it is apparent that many of the changes contained in the 1958 revision must have been well under way before the committee finished its work.
Perhaps one of the more revealing sections in the report on the 1958 revision was that on directions of future research, which laid out in some detail the future plan of work of the National Income Division. It was stated that future development would be in the direction of deconsolidat-ing the consolidated saving and investment account into sets of saving and investment accounts, or sources and uses of funds, for major economic groups. These proposed accounts would show transactions in financial assets and liabiHties among domestic groups in relation to real changes in saving and investment. They would be drawn up for individuals, govern-ment, nonfinancial corporations, and financial institutions. In discussing future plans, the specific problems involved in classification of both financial and tangible assets and the need to develop measures of capital consumption were recognized.
With respect to the personal sector of the economy, which still included nonprofit institutions and private pension and welfare funds, it was recognized that separate information on each of these entities would be desirable. In addition, it was suggested that it would be useful to split up the personal saving and investment account by major types of families, for example, farm proprietors, nonfarm entrepreneurs, and wage and salary earners.
For the government sector, more work was planned on extending the functional breakdown of government expenditures, introducing more object-class details of expenditure and developing new information on the changes in financial assets and habihties associated with the govern-ment surplus and deficit, this last bringing together information on inven-tories, public construction, realty holdings, and purchases and stocks of durable equipment. Finally, more information was planned on the inter-relationships among different governmental units.
Although some increase in regional work was planned, it was to be limited to states and standard metropolitan statistical areas (SMSAs). It was argued that disaggregation to the county level was beyond the resources of the Office of Business Economics (OBE).
One of the more interesting proposed extensions was the work planned in the field of income distribution. Here it was proposed that better information on the distribution of income could be obtained by the integration of data from federal individual income tax returns with data from census and other sample field surveys, with the results adjusted to control totals based on OBE measures of personal income. Although it is apparent that at that time this was conceived of primarily as bringing together various tabulations, it was pointed out that effective use of tax return data would require matching studies to relate the income of sample consumer units to the tax returns they filed, so that distributions

28 Richard Ruggles
of tax return income could be converted to a family income basis. It was also suggested that the Internal Revenue Service (IRS) audit studies could be used to correct underreporting of income to tax authorities. Further suggestions included using field surveys of consumer expendi-tures to provide information on taxes, consumption, and saving by in-come group.
Finally, a program was laid out in the area of analyzing industry sales and purchases to determine direct industry sales in final markets and their interrelation with the network of other industry sales and purchases. In effect, what was being proposed was an approach to input-output.
After the 1958 revision, the next major revision occurred in 1965. The main purpose of this revision was statistical, and constituted comprehen-sive benchmark revisions centering around the incorporation of the 1958 economic censuses into the national income and product estimates. Since the 1958 revision, the OBE had taken over the work on input-output, and had produced for the year 1958 an input-output table that was integrated with the national income accounts. Aside from this major accomplish-ment, however, the 1965 revision indicated only modest progress on the ambitious program that had been laid out in 1958. Improved information was made available on the reconcihation of the government national income and product accounts to the consoUdated budget. Better informa-tion was also provided on the nonmarket imputations contained in the accounts. Tables were added on gross corporate product and gross auto-mobile product. Additional detail was provided on personal consumption expenditures in constant dollars. On the other hand, some of the tables that had previously been published were omitted, on the ground that new work in the areas concerned was in progress; these included the tables on expenditures on new plant and equipment, on sources and uses of corpo-rate funds, on the size distribution of income, and on investment, depre-ciation, and capital stocks in manufacturing estabUshments.
In terms of conceptual changes, the 1965 revision was not very signifi-cant. The major change was the exclusion of interest paid by consumers from production. This was done in order to treat interest paid by consum-ers in the same way as interest paid by the government, and it was justified on the same grounds. It was noted that the treatment of both of these items was somewhat controversial, but on balance considerations seemed to favor the change that was made. The new procedure was one that was recommended by the United Nations and used by most coun-tries, and reflected that U.N. view that payments of interest were not payments for services but distribution of income.
1.2.7 The United Nations System of National Accounts
After the 1947 League of Nations work by Richard Stone mentioned above, the Organization for European Economic Cooperation and later the United Nations both developed similar systems of national accounts

29 The United States National Income Accounts, 1947-1977
which they proposed for international use. In July 1953 the United Nations published A System of National Accounts and Supporting Tables (series F, no. 2, referred to hereafter as SNA). This first version of SNA bore a strong resemblance to the five-account system adopted by the United States in 1958. The most obvious difference was that in the SNA, instead of a single national income and product account, there were two accounts, one of which derived gross domestic product and the second national income. The U.S. national income and product account was merely a consolidation of these two accounts. As with the U.S. system, current income accounts were provided for households including non-profit institutions and for general government. A rest-of-the-world account was also provided in both systems. One other difference between the U.S. and U.N. systems was that the SNA made provision for rudimentary capital reconciUation accounts for each sector, whereas the U.S. accounts employed only a consoHdated gross saving and investment account for all sectors,
In the mid-1960s, however, a major revision of SNA was undertaken, and in 1968 a new System of National Accounts (series F, no 2, rev. 3) was pubhshed. The new system was substantially and radically different from both the earher United Nations system and the system being used by the United States. It was viewed by its originators as providing a comprehen-sive framework for all of economic accounting, and it stressed the in-tegration of the national income accounts with input-output, financial transactions, capital stocks, and balance sheets.
The revised SNA cast the accounting system into the form of a matrix, in which each row and column pair represented the two sides of an account. The theoretical scheme is shown in Exhibit 3, together with a list of entries. It should be noted that the entries shown in Exhibit 3 do not represent single aggregate transaction flows; rather they represent sub-matrices of transactions cross-classified by the categories indicated for the individual rows and columns. The matrix classifies entries into (1) open-ing assets, (2) production, (3) consumption, (4) accumulation, (5) rest-of-the-world transactions (current and capital), (6) revaluations, and (7) closing assets.
In addition to the matrix, the SNA also contained a proposed standard accounting structure and a large number of supporting and sup-plementary tables. The theoretical matrix was intended to be a quite general, flexible instrument from which many different specific applica-tions could be drawn. The accounts shown in the 1968 SNA book repre-sented one such specific application, but it was recognized that others were equally possible. The accounts were not, and were not intended to be, an isomorphic transformation of the matrix. The accounts were viewed as mainly of pedagogical use; the supporting and supplementary tables were meant to carry the burden of statistical presentation of data.
The basic structure of the new SNA introduced a number of new

30 Richard Ruggles
features. Some of the accounts were considered to be transaction accounts, since they brought together transactions of a given kind even when engaged in by different transactors. Other accounts were transactor accounts, since they brought together the transactions of specific eco-nomic units. In dealing with transactors, a further distinction was made. It was recognized that economic units could be grouped according to either the nature of their activities or their institutional form. For the activity (or industry) classification of transactors, which could be im-plemented most easily by using economic units defined on an estabhsh-ment basis (plants, stores, and the Uke), only production and capital formation accounts were provided. In contrast, the institutional clas-sification required economic units classified by their legal form of orga-nization and could be implemented most easily with enterprise-based data. For institutional transactors, only income and outlay, capital finance, and balance sheet accounts were provided.
To establish links among the different principles of classification and sectoring employed, dummy transformation accounts were used exten-sively. Thus, for example, the fink between commodities and industry activities for input-output purposes was accompUshed through "make-and-use" matrices, showing, respectively, commodities originating in different industries and commodities used by different industries. Similar dummy accounts were used to link the establishment-based production data (classified by industry) and the enterprise-based income and outlay data (classified by institutional form). The dummy transformation account technique was intended to avoid the necessity for certain cross-tabulations that were regarded as statistically difficult and conceptually questionable. But, by the same token, it resulted in the loss of some important kinds of information. Thus, no information was given on the sources and uses of funds of industrial sectors, and conversely for institu-tional sectors no information was given on production activity. Capital formation by institutional sector was considered only in its financial aspects and was not given by type of asset.
Thus, although the matrix approach was quite general and did achieve the integration of all of the different forms of economic accounting into a single system, it did so at the cost of considerable complexity. The simple overview of the operation of the system was lost, and certain types of information, such as corporate profits by industry, or wages by legal form of organization, were eliminated from the system. The multiplicity of accounts, and the many minor flows given prominence in them, resulted in a system of gothic elaboration, in which the relation between the U.N. National Accounts Questionnaire and the basic SNA structure was not readily apparent to the user.
Since its introduction the new SNA has been adopted in part by a great many countries but in its entirety by almost none. The main summary

31 The United States National Income Accounts, 1947-1977
accounts on gross domestic product and national disposable income and the income and outlay accounts for government and households, which closely resemble both the old SNA and the U.S. system, are widely implemented. For input-output analysis, make-and-use matrices are in-creasingly being adopted. Also, there is increasing interest among de-veloped countries in the capital finance accounts, which show changes in financial assets and liabilities. On the other hand, the principle of dual sectoring with its accompanying dummy transformation accounts has not been widely followed. In general, countries seem to prefer a combination of institutional and industrial sectoring for both production and income and outlay information—not because the difficulties SNA sought to avoid are not recognized but because the information is useful and needed. For example, the European Community has developed the European System of Accounts, an adaptation of SNA that in essence provides full sets of accounts for both institutional sectors and industry branches.
Athough the United States was initially represented on the Expert Group charged with drawing up the revised SNA, as the system de-veloped it became evident that the direction in which it was going was quite different from that considered to be appropriate for the future development of the U.S. system. In terms of the actual design of the U.S. accounts, the revised SNA has to date had httle impact. Like most countries, however, the U.S. does provide information in SNA form in response to the U.N. National Accounts Questionnaire. The U.N. work has, furthermore, had more impact on concepts and definitions, as was noted above in connection with consumer interest.
1.2.8 The 1971 Conference on Income and Wealth
The 1971 Conference on Income and Wealth was concerned with the adequacy of the national income accounts for measuring economic and social performance. A number of participants at this conference ex-pressed the view that the conference was in fact a continuation of the controversies and issues discussed at the 1955 conference. In some degree this was correct. The problem of distinguishing between intermediate and final product, for example, the question as to whether certain govern-ment expenditures were final product or merely intermediate goods, was raised and discussed at both conferences. There were, however, very marked differences even in the discussion of this topic. The 1955 confer-ence had viewed national income almost entirely from the point of view of factor cost. But in the 1971 conference factor cost was not even mentioned, and the discussion focused on the product side of the accounts.
More importantly, however, the major thrust of the 1971 conference was that a number of kinds of important and useful information were missing from the accounts and that these should be taken into account in

32 Richard Ruggles
the measurement of economic and social performance. It was argued that many nonmarket activities such as housewives' services, other household activity, and even leisure were extremely important for the evaluation of social performance and should be reflected in the national accounts. The need to estabUsh capital accounts for consumers and government, and to impute the services of these assets, was pointed out. Intangible capital relating to research and development and to human capital provided by education, child rearing, and to skills obtained on the job was also emphasized. Direct consumption provided by business, such as televi-sion, expense account living, and other amenities provided by employers to their employees or to the general public, needed to be considered. One of the problems leading to the most discussion was that of the environ-ment. It was generally agreed that such environmental considerations as the quaUty of the air and water were important and that expenditures on improving the environment or preventing its further deterioration should not be ignored in the national accounts. There was no general agreement on whether these expenditures constituted intermediate or final prod-ucts, but there was consensus that both environmental costs and environ-mental benefits should be reflected in the accounts.
There was also considerable discussion on the question of whether present methods of valuing goods at either market price or cost of production were appropriate in all uses. This question was raised particu-larly in connection with measuring government output, where those receiving the service might attach a value that is either more or less than cost. It was emphasized that the valuation in such cases might depend upon the distribution of the good or service, some recipients valuing it differently from others. Finally, the problem of quality change was recognized, and the value of hedonic measures in this connection was discussed.
What emerged very clearly from this conference was that many users considered that the present emphasis of the national income and product accounts on market transactions led to a perspective that was too narrow for the measurement of economic and social performance. It was co-gently argued that additional information was required on nonmarket activity, on the services of consumer and government durables and intangible investment, and on environmental costs and benefits. It was also clear, however, that such extensions to the national income account-ing framework involved imputations, the valuation of which was highly controversial and in many cases could only yield an order of magnitude. Those who used the national accounts for the analysis of economic activity in the short run, with a focus on inflation, the business cycle, and fiscal policy felt that the inclusion of such imputations would lessen the usefulness of the accounts. No satisfactory resolution of these conflicting objectives emerged.

33 The United States National Income Accounts, 1947-1977
1.2.9 The Economic Accounts of the United States: Retrospect and Prospect (1971)
At about the same time as the 1971 Conference on Income and Wealth, the Department of Commerce published a commemorative issue of the Survey of Current Business on its fiftieth anniversary, in which 43 contrib-utors wrote individual articles about the national income accounts and offered suggestions for changes and additions.
In general, the contributors expressed their satisfaction with the pres-ent form of the national income accounts and the basic conceptual treatment of the flows. Although there was some reflection of the views expressed in the 1971 Conference on Income and Wealth, these were in general muted and more than balanced by those contributors who thought that the major function of the national income accounts should be to provide information for short-run analysis of the economy. In particular, some contributors did urge better information in the area of pollution costs and the environment, but many more were concerned with more timely and frequent publication of series that would be useful in forecasting or understanding current economic conditions. The view was expressed by some that the present accounts should not be tampered with, since they were currently performing a useful and important func-tion. Aside from imputations, however, there were some concrete sug-gestions in specific areas. For example, a number of contributors were interested in seeing an expansion of the information on international transactions, citing the need for more detailed information on multina-tional corporations and on the bilateral dealings between the United States and specific countries and regions. In the area of input-output, it was suggested that it would be useful to adopt the SNA treatment, including make-and-use matrices. Probably the most frequent request for new information was for the extension of the national income accounting system into balance sheets containing information on capital stocks, not only for business but also for households and government.
As in the case of the 1955 Conference on Income and Wealth, George Jaszi closed the fiftieth anniversary volume with a review of all of the contributions. Although he noted resource constraints in a number of areas, he agreed that it would be desirable to construct balance sheets and to provide information on consumer and government durables. With respect to imputations, he noted that some were included in the accounts even in their present form and considered that some hmited additions might be useful, but he warned that extensive imputation could destroy the value of the system and that restraint should be used in adding further imputations to the accounts. He specifically rejected the notion that welfare criteria should be allowed to alter the measure of gross national product. With respect to the design of the accounting structure and

34 Richard Ruggles
sectoring, Jaszi indicated general support for a system based upon record-ing the transactions of individual transactors in the accounts, with the objective of obtaining a meaningful summary picture of the economic process, and emphasized the importance of providing such an overview of the economy. He specifically rejected building the accounts on a dual sectoring principle (industries and institutions), and questioned the use-fulness of elaborate matrix presentations of the accounts.
1.2.10 The 1975 Revision
The 1975 revision again was primarily statistical. The unusual size of the revisions was due in part to the length of the period—encompassing two economic censuses instead of one—which had elapsed since the last benchmark revision in 1965, and in part to the severe inflation and other economic changes which had made the task of estimating the national income accounts more difficult,
The only major conceptual change introduced in the 1975 revision was the shift of capital consumption measurement to an economic rather than a book value basis. The new measure of capital consumption involved two changes. First, the service lives of assets were changed from those permitted in the tax regulations to lives which more accurately reflect actual practice. Second, depreciation was valued at market rather than at historical cost. The difference between the book value of depreciation charged by enterprises and the replacement cost depreciation shown in the national accounts was shown as a capital consumption valuation adjustment which, like the inventory valuation adjustment, became an adjustment to the book value of enterprise profits. There were also other minor conceptual changes, among them the treatment of mobile homes and the purchase of consumer durables by landlords. Some new tables and series were provided. Greater detail was introduced in the constant-dollar data, and for a number of series constant-dollar figures were shown for the first time on a quarterly as well as on an annual basis.
1.2.11 Current Activities Related to National Income Accounting
There are several activities now under way that are not yet reflected in the most recent pubhshed form of the U.S. national income accounts but are directly related and can be expected at some future time to be integrated with them. These are (1) the development of capital stock estimates for structures and durables of business, government, and households; (2) the estimation of the size distribution of income for famiHes; and (3) the development of measures of nonmarket activity within the framework of the accounts.
For more than a decade BEA has been in the process of developing estimates of capital stock based on the perpetual inventory technique. The first report on such estimates was published in the December 1966

35 The United States National Income Accounts, 1947-1977
issue of the Survey of Current Business, and since then at irregular intervals articles providing an increasing amount of information on the stocks of structures and durables in both current and constant prices have appeared. These estimates are directly related to the national income accounts, since they are based upon the data in the accounts relating to purchases of structures and durables and to capital consumption. But because the national income accounts have not been extended to compre-hend balance sheets, the capital stock data do not formally constitute a part of the national income accounting system. The Federal Reserve Board more recently has used the BEA estimates of capital stocks of structures and durables in conjunction with their own financial asset and Uability data to produce balance sheets for enterprises and households.
With respect to the size distribution of income, the present methodol-ogy follows the lines suggested in the 1958 U.S. Income and Output supplement, using data from IRS individual tax returns in conjunction with sample surveys collected by the Bureau of the Census. However, the current work involves matching and merging of computer files of micro-data, using techniques of both exact and statistical matching of records that were not foreseen in 1958. An article on the size distribution of income for the years 1964,1970, and 1971 was pubhshed in the Survey of Current Business in October 1974, and at present work is continuing on more recent size distribution estimates. Although the size distribution estimates are closely tied to and aligned with the national income esti-mates of personal income, major conceptual differences remain which prevent the size distribution work from fitting neatly within the national income accounts.
Finally, BEA has established a new program to develop measures of nonmarket activity within the framework of GNP accounts. In part this work is a response to the emphasis put on this topic at the 1971 Confer-ence on Income and Wealth, but it also reflects the strong interest in environmental studies within the Department of Commerce. The federal government's concern with the measurement of the costs of pollution control and environmental damage has stimulated work in this area. BEA's current program, however, includes not only environmental ques-tions but also (1) time spent in nonmarket work and leisure, (2) the services of consumer durables, and (3) the services of government capi-tal. The close relationship to the national income accounting system in this work is stressed, but as yet it has not been formally integrated.
1.3 Directions for Future Development
National income estimation in the United States had its roots in the neoclassical concept of the factors of production, and initially it focused primarily on the measurement of net income and resource allocation. The
36 Richard Ruggles
policy needs arising from the depression of the 1930s and World War II changed the focus to short-run macroeconomic analysis and resulted in a national income accounting system emphasizing the interrelationships among the sectors of the economy. It was in this contpxt that the concept of gross national product came to dominate the earHer concept of na-tional income, and the concern shifted from accurate measurement of specific aggregates to the analysis of market transactions and transfers among businesses, government, and households.
Although more than 30 years have passed since the U.S. national income accounting system was estabhshed, its basic structure has re-mained essentially unchanged. What has occurred instead is a continual improvement in the quantity and quality of the information provided. By and large, most users of the national income accounts are well satisfied with what the present system offers, and there are few who would wish to see radical changes made. This does not mean, however, that there is no room for further development in the U.S. national income accounts. Rather, it suggests that desired changes can probably be accommodated within the existing framework.
In the review of the discussions of conceptual issues over the past 30 years, four general topics stand out as areas where further work is called for. These are (1) the sectoring, subsectoring, and the structure of the accounts; (2) the treatment of nonmarket activities and imputations; (3) the basic accounting principles underlying the recording of transactions in the accounts; and (4) the integration of financial transactions and balance sheets with the national income accounts. Each of these topics will be examined briefly in the following sections of this paper.
1.3.1 Sectoring and the Structure of the Accounts
Although this topic is central to national income accounting and has important impHcations for its future development, it has not engendered very much explicit discussion. The original 1947 six-account system rec-ognized business, government, households, and the rest of the world as the four primary sectors. In 1958 the system was reduced to five accounts, the business sector being consolidated with the national income and product account and not shown explicitly as a separate sector. This was done to reduce the number of minor and inconsequential flows in the accounts and to display the major flows in the economy more promi-nently and simply. The five-account system has continued unchanged to the present day and has served very well as the framework for the ever-expanding national income accounting statistics. It has successfully provided the kind of overview that was intended.
The dual sectoring of production accounts by industry, on the one hand, and income and outlay accounts by institutional sectors, on the other, employed in the United Nations SNA has been rejected by BEA
37 The United States National Income Accounts, 1947-1977
on the grounds that it does not provide for certain kinds of information now included in the U.S. accounts, such as corporate profits by industry and compensation of employees by legal form of organization. Further-more, the U.S. statistics also provide a useful breakdown of industries within legal form of organization, a type of information that is automati-cally ruled out of the SNA.
However, some difficulties are encountered with the present system of sectoring. One set of problems concerns the personal income sector and raises specific questions as to the criteria on which sectoring should be based. As was noted in discussing the work on the size distribution of income, there is a lack of correspondence between the definition of the personal income sector, which includes nonprofit institutions, and the size distribution income concepts, which refer only to families and indi-viduals. This problem has been recognized by BE A from time to time, when they have recommended subsectoring the personal income account so as to separate nonprofit institutions from households. The original argument for including nonprofit institutions in the personal sector rested on the fact that these institutions are final consumers, as well as on the pragmatic ground of ease of statistical estimation. While it is true, as Jaszi pointed out, that institutional groupings often are based upon such functional characteristics, it does not seem in this case that it is appropri-ate to combine nonprofit institutions and households in the same sectoral grouping. Behaviorally, the difference between an individual household and a nonprofit organization, such as a university or hospital employing a large staff, is very substantial indeed. For many purposes it would be much more appropriate to group together nonprofit organizations and profit-making organizations in such fields as education and health.
Sectors should be drawn up on the basis of two criteria: (1) the behavioral and decision-making processes underlying a sector's activity, and (2) the types and sources of information that are available relating to the transactors included in a sector. The accounts for a sector should be thought of as a consolidation or combination of the accounts of reporting units within the sector. For each sector, it should be possible to conceive of a microdata set of homogeneous units which, when aggregated, would yield the sector account. Thus, it should be conceptually and statistically possible to relate sample surveys of households to the aggregate data shown in the household sector account.
In terms of these criteria it is evident that the personal income sector should be recast as a household sector, including all the families and individuals in the nation but excluding enterprise-like organizations such as nonprofit institutions. This not only would permit better analysis of household behavior, it also would make it possible to use microdata for subsectoring the household sector into various social and demographic groupings. The benefits of the integration of microdata with national

38 Richard Ruggles
accounts do not, of course, all accrue to the national accounts. Micro-data, based as they often are upon surveys, often contain substantial reporting biases which can only be discovered when they are matched against control totals obtained from other sources, such as are found in the national accounts.
In this connection, it is also necessary to consider the classifications of transactions employed in the accounts. It is unfortunate that at present the national accounts do not reflect in the detail of personal consumption expenditures the same classifications employed in the consumer expendi-ture surveys. If the national accounts and the consumer expenditure surveys were integrated around the same classification system, it would become possible to relate the expenditure pattern of different subsectors of the household sector to the total changes shown in the national accounts.
Shifting to a household sectoring, besides improving the integration of data, would also make possible a better integration of micro- and mac-roanalysis. In recent years there has been more and more interest in analyzing problems that require closely related micro- and macrodata. Thus, for example, the analysis of such questions as health delivery systems, social security, and welfare reform requires examination of transactions information in the context of other nontransactions data in the household, such as household composition and the age, sex, race, and employment status of its members. These problems are being analyzed increasingly through microanalytic simulation techniques using large microdata sets aligned with the national accounts. It is important that future efforts to construct important microdata sets, such as the Survey of Income and Program Participation currently in process, be conceptually and statistically integrated with the national income accounts; and, con-versely, the national income accounts in the future will have to take these bodies of data into account, both in the sectoring of the economy and in the classification of transactions within sectors.
A second set of sectoring problems centers around the business or enterprise sector. Such a sector is of course still implicit in the U.S. accounts even though it is not shown exphcitly. In order to provide a more disaggregated view of output, prices, employment, and productiv-ity it would be useful to formalize the sectoring and subsectoring of enterprises. The precise subsectoring chosen should depend on behav-ioral homogeneity, the kinds of data available, and analytic interest.
The same principles of sectoring noted above in connection with the household sector are apphcable to the enterprise sector and its main subsectors. It should be possible to conceive of a microdata set of rela-tively homogeneous reporting units that would add up to the total for the sector or subsector. In many cases, microdata sets may be available from administrative, tax, or regulatory records. For example, it may be possi-

39 The United States National Income Accounts, 1947-1977
ble to identify a utihty subsector for which appropriate current accounts and balance sheets can be obtained for the individual reporting units. Although in some cases privacy restrictions may Hmit the use of indi-vidual records, in other cases much of the data is either of a public nature or can be provided in a form that would not involve disclosure.
In addition to accounts based on systematic and comprehensive sector-ing and subsectoring of transactors, it may also be useful to develop special key sector or satellite accounts of either transactors or special groupings of transactions. For example, at the present time the U.S. national income accounts contain an account for the gross output and income from housing, and it may be desirable to develop special accounts deaUng with energy. Such supplementary or satellite accounts need not necessarily be fully articulated with other sector or subsector accounts, but they should, of course, be consistent with and logically fit into the national accounting system.
With respect to the structure of accounts for sectors and subsectors, U.S. practice departs significantly, as was indicated above, from interna-tional recommendations, and it is appropriate to consider whether the international recommendations have merit. For the most part, the data do exist to construct the production accounts, appropriation accounts, capital accumulation accounts, capital finance accounts, reconcihation accounts, and balance sheets that SNA calls for. But such an approach seems to have Httle to recommend it. The multiplicity of accounts seems designed only to derive subtotals, and it results in much duplication and loss of the comprehensive overview of the accounting system in a maze of detail. It seems more appropriate to move in the reverse direction, dividing the accounts for sectors into just two categories, current and capital. If this were done, the current accounts would show current receipts and outlays, and the capital accounts would show balance sheets and the related capital transactions and revaluations. As Jaszi has sug-gested, there is no need to enforce the same format on the accounts for different sectors. It is appropriate to organize the current account for business enterprises around the concept of gross product (or value added), whereas the current account for government can appropriately be centered around government revenue and that for households around household income.
1.3.2 Nonmarket Activity and Imputations
The topic of nonmarket activity and imputation is, of course, as old as the history of national income measurement. The paradox of the man who marries his housekeeper is an old, old problem. The 1947 U.S. national accounts explicitly excluded such imputations as the services of housewives and illegal activities from the measure of national income, but a limited number of imputations considered to constitute a part of

40 Richard Ruggles
output were recognized. These were the imputed rental income of owner-occupied housing, the value of food and fuel consumed on farms, the value of food and clothing provided to the military, and banking services rendered without payment to depositors. In total, these imputations accounted, in 1947, for about 5% of GNP.
In the years since 1947, the topic of imputations has repeatedly been discussed. The 1955 Conference on Income and Wealth considered it in the context of the derivation of the national income aggregates. Much attention was given to the banking imputation, and general support was expressed for imputations relating to income in kind and owner-occupied housing. There were even some proposals that imputations should be made for the services of both consumer and government durables. But the possibility of imputations beyond the established production bound-aries was not seriously considered. In contrast, the 1971 conference took a broader view of nonmarket activity and imputations in the context of measuring economic well-being and economic and social performance. Participants were no longer concerned only with imputations falling within the production boundary; they focused instead on the welfare of individuals. Questions discussed included human and other intangible capital and the flow of services it generated, the measurement of dis-amenities, and environmental costs and benefits. Contributors to the fiftieth anniversary volume were generally more conventional in approach, but some support was expressed for extending imputations into such areas as pollution, the environment, and nonmarket activity in the household. Despite this long discussion, however, the imputations in the national accounts still remain essentially as they were in 1947. At the present time they constitute approximately 8% of GNP, the rise since 1946 being attributable mainly to the increased importance of the imputa-tion for owner-occupied housing.
Furthermore, despite all the discussion about imputations, it has never clearly been established just what the term is meant to cover. Owner-occupied housing, payments in kind, and the services of financial inter-mediaries are fairly self-evident—or, at any rate, users of the accounts are accustomed to them. But in the process of constructing national income accounts there are many instances of estimates which do not reflect market transactions and so involve some element of imputation. One of the most obvious of these arises in estimating capital consumption allowances. To the extent that capital consumption allowances are re-corded as accounting entries in the books of enterprises, it can be argued that they do represent market transactions. But a number of adjustments are made to the recorded book values in order to convert them to economic depreciation and to include such elements as accidental dam-age to fixed capital. In a similar manner, an inventory valuation adjust-ment is introduced in order to exclude the effect of changes in the price of
41 The United States National Income Accounts, 1947-1977
inventories from the current value of output. Most of these adjustments can be excluded from the category of imputations on the ground that they result from employing standard accounting rules to correct the accounts of enterprises, even when they involve introducing entries into the accounts where no such entries exist or are contemplated by the indi-vidual economic units. Thus capital consumption allowances are esti-mated for small businesses which may not actually charge any deprecia-tion at all. Capital consumption allowances for owner-occupied housing depart further from recorded transactions. Such adjustments and correc-tions are useful and in some cases necessary. But care should be exercised to preserve to the fullest extent possible the information on the market realities as they exist in the records of the transactors, separately from the adjustments. BE A to date has by and large followed this principle, explicitly showing the capital consumption and inventory valuation adjustments in the accounts.
But it is not such imputations to correct and adjust accounting flows that generally result in controversy. Rather, it is the imputations that range beyond the traditional limit of what is considered to be output that give rise to problems. The 1971 conference considered nonmarket exten-sions of the accounts (1) for the study of long-term growth or changes, (2) for the analysis of the structure of the economy at a given point in time, and (3) for policy purposes relating to important social and economic questions. For the study of economic growth over long periods of time, information was needed on the change in the amount of leisure, the change in nonmarket activities, the services of consumer and government durables, the incidence of regrettable necessities in the system, and the amount of environmental disamenities. Quantitative estimates of the impact of all of these had been made and used by some researchers to adjust GNP. In order to analyze the structure of the economy at a given point in time, imputations taking into account the time-use patterns of households, the services of intangible capital, and the benefits provided by employers to employees were considered important. For the formula-tion and evaluation of economic and social policy, another set of imputa-tions was relevant, including imputations relating to pollution abatement costs and benefits, and imputations reflecting the distribution of health and welfare benefits and their relation to the distribution of income and tax payments. Such imputations, however, go far beyond the aggregate imputations contemplated for adjusting national income and gross national product. They involve attribution of the imputations to income groups or to specific individuals. Where the imputations involve public goods, the attribution would be both conceptually and statistically dif-ficult, if not impossible.
This discussion served mainly to emphasize that, unUke transactions data, there is no well-defined universe of nonmarket activities and im-

42 Richard Ruggles
putations to be covered. The set of all possible imputations is unbounded. The only criterion that can be employed is whether the imputations are considered to be useful and necessary for the particular purpose at hand. In the fiftieth anniversary volume, Jaszi compared imputations to addi-tions made to a house to adapt it to the needs of a particular family. He suggested that the additions may lack architectural unity, because they are shaped to the needs of the time and the resources available. This is indeed an apt comparison, especially when one reflects that in the case of the U.S. accounts no additions have been made since the original build-ing was set up in 1947. Jaszi foresaw, however, that some limited addi-tional imputation might prove to be useful in the future.
Whatever decision is made with regard to extending the imputations in the national accounts, it is important that the imputations that are made be shown clearly and expHcitly. BE A now provides a supplementary table showing all the imputations that are made in the national accounts, but in the main accounts the imputations are combined with market transactions. As long as imputations have been relatively minor, this has not been a matter of central concern. However, if imputations are ex-tended into such areas as nonmarket household activity or even to the services of consumer and government durables, their magnitude could swamp the market transactions data in the accounts, and for many of these kinds of imputations, estimates for monthly, quarterly, or in some cases even annual periods are not feasible or required.
Furthermore, for many of the imputations the problem of valuation is so serious that combining them with market transactions would introduce a factor of extreme arbitrariness. There are some cases where the valua-tion problem is relatively simple, as in the use of the rental value of equivalent space for owner-occupied housing. But in cases such as the value of leisure, the problem is not only difficult but essentially insoluble: one must decide whether the leisure of the wealthy is worth more than the leisure of the poor. For pubUc goods, it is not at all clear whether the imputation should be based on the cost of providing the good or on the benefits to the recipient. For example, if the audience for pubhc televi-sion doubles without any increase in the cost of providing the television service, has the output of public television services to households in-creased? Similarly, should food stamps be valued at their cost to the government, or at the value attached to them by the recipients? It is unfortunately true that no clear-cut principles have been estabUshed that will solve the valuation problems for all imputations.
For all of these reasons, an expHcit separation of market transactions from imputations in the national accounts would seem highly desirable. One way of doing this would be to show market transactions separately from the imputations made in each sector account. It should be recog-nized, however, that imputations alone cannot meet the information needs for measuring economic and social performance. As some of the
43 The United States National Income Accounts, 1947-1977
contributors to the fiftieth anniversary volume pointed out, no amount of imputation can convert a one-dimensional summary measure such as the GNP into an adequate or appropriate measure of social welfare. The problem is rather one of achieving an integration of macro- and micro-analysis using economic accounting data in conjunction with social and demographic nontransactions data. As has already been emphasized, a rapidly emerging tool for accompUshing such integration is the construc-tion of microdata sets, containing social, demographic, and geographic data as well as economic data, to underlie the sector and subsector accounts.
1.3.3 The Recording of Transactions in the National Accounts
In the section of this paper on sectoring and the structure of the accounts, it was proposed that sectors and subsectors should be so de-fined that their accounts could be conceived of as the combination or consolidation of the accounts of a relatively homogeneous set of report-ing units. This means that transactions recorded in the accounts for a sector or subsector should directly correspond to the transactions re-corded for individual transactors. This principle was put forward (1) to make the sector and subsector accounts more faithfully reflect the eco-nomic behavior and decision making of the transactors; (2) to ensure a direct correspondence between the aggregated data in the sector and subsector accounts and the data in the microdata sets of transactors; and (3) to permit a better integration of macro- and microanalysis, making use of social, demographic, and other nontransactions data relating to transactor units in conjunction with transactions data.
Most users of the U.S. national income accounts view the flows shown in the accounts as reflecting actual transactions. In many instances this is correct, but in a substantial number of cases there are significant differ-ences between the treatment in the national accounts and that which would appear in the accounts of transactors. This is especially true with respect to transactions deahng with insurance, pensions, and interest. It is not appropriate at this juncture to discuss in detail precisely how a ''transactor" approach to the recording of these transactions would differ from conventional national income accounting practices, but for those interested in this topic such a discussion is provided in Appendix A. For the present purpose, however, it is important to recognize that the aggregate view of transaction flows in the national income accounts should bear a direct and recognizable relation to the transactions as they are recorded in the accounts of individual transactors.
1.3.4 A Current Account for the Household Sector
The appHcation of these principles for sectoring and recording transac-tions would result in a major reconfiguration of the national income accounts. Before going on to the discussion of the fourth topic listed

44 Richard Ruggles
above, therefore, it will be useful to summarize the impact of the princi-ples discussed so far on the current transaction accounts.
An example of the current receipts and outlay account for a redefined household sector and its relation to the Personal Income Account of BEA is given in Exhibit 4, Current accounts for the household sector for the years 1947-80 are given in table l.A.l of Appendix B. Exhibit 4 shows explicitly the relation between the major income and expenditure flows as they now appear in the BEA Personal Income Account and similar flows in the redefined Household Current Income and Expendi-ture Account. A discussion of the differences between these flows will indicate the general nature of the changes that have been made.
The removal of nonprofit institutions from the personal income sector in order to restrict the sector to households will of course affect most of the income and expenditure flows. In the Personal Income Account, nonprofit institutions receive property income from enterprises and transfer payments from the government, and their expenditures are included in consumption expenditures. Furthermore, in the Personal Income Account the inclusion of nonprofit institutions with households means that the transfers between households and nonprofit institutions are consoHdated out of the account. When nonprofit institutions are excluded from the household sector, it is necessary to show expHcitly the contributions households make to charitable and religious organizations.
In the Personal Income Account, employees receive wages and salaries and other income paid by employers. Part of this income is paid in kind (food and clothing provided by the military) and part is withheld by employers for health and welfare contributions. Although the withheld health and welfare contributions are costs to employers, they do not represent actual receipts by households. Although imputing pay in kind is reasonable, imputing the value of health and welfare contributions or benefits to employees poses difficult conceptual and statistical problems. Even individual recipients themselves may be quite unaware of the actual magnitudes involved. While individuals may receive the benefits, the actual payments go to doctors and hospitals, and the specific individual may not know what the costs are.
Furthermore, what is being provided to employees by their employers is really the health insurance, which assures them of health care when and if they need it. To impute actual medical costs to individual patients would distort the distribution of income in a quite unrealistic way, since the very high cost of medical care of those who are seriously ill would immediately put them into a very high income bracket: the poor would never get sick. Health insurance and health care should represent final consumption output, but its direct allocation to specific individual house-holds does not seem to be any more justified than the imputation to individual households of other pubUc goods such as education, the use of
45 The United States National Income Accounts, 1947-1977
highways, and public libraries. For this reason it seems appropriate to treat employee health benefits as part of consumption provided by enter-prises which, hke government consumption, increases the welfare of households in general but cannot be allocated to specific individuals.
A different treatment is given to pension benefits, which are direct cash payments to individuals. Unhke the current practice in the Personal Income Account, these payments should not be netted with pension contributions but rather should be recorded as actual transfer payments by businesses or pension funds to individuals. It would also be appropri-ate, if information were available, to impute to individuals any change in the cash surrender value of pensions or life insurance resulting from employers' contributions. Other changes in hfe insurance and pension reserves, however, should not be treated as part of household income, on the grounds that households do not have access to this income and are in fact not even aware of its magnitude. Therefore, unlike the treatment in the Personal Income Account, these reserves would be excluded from the saving of households.
Rental income in the Personal Income Account, of course, includes an imputation for the rental income of owner-occupied housing. In the Household Sector Account, however, since market transactions are sepa-rated from imputations, rental income is reduced by this amount, and the rental income of owner-occupied housing appears as a nonmarket trans-action.
Interest income in the Personal Income Account includes an imputa-tion for the services of financial intermediaries. Since this is a nonmarket transaction, it has been excluded from interest income in the Household Sector Account, but it has not been included in imputed income received by households on the grounds that the allocation of banking services to individual households is both conceptually and statistically weak. To base the imputation solely on the size of bank deposits and to neglect banking services provided to borrowers is not readily defensible in a period when banks charge for their services, on the one hand, and pay interest on their depositors' accounts, on the other. Thus, Hke other unallocable items, the services of financial intermediaries are considered to be part of consumption provided by enterprises.
With respect to transfers, it has already been noted that private pen-sions paid to households are included as part of household income, whereas in the Personal Income Account they are netted against pension contributions. In addition, the transfers recorded in the Personal Income Account as government transfers for hospital and supplementary medical insurance (medicare) have been removed, on the same grounds that private health benefits were removed. Such government programs do not result in increases in market income to individual households; rather they provide health services to the population just as education expenditures

46 Richard Ruggles
provide education services. Their allocation to individual households is no more justifiable than allocation of education or other services that are also provided to individuals.
In order to restrict the outlay side of the Household Sector Account to current transactions, it will be necessary to exclude expenditures on consumer durables and the change in household stocks of nondurables. Furthermore, the exclusion of the transactions of nonprofit institutions and of imputations from consumer expenditures means that in-kind consumption, expenditures of nonprofit institutions, imputed banking services, imputed housing services, and other benefits in kind must also be excluded. On the other hand, adopting a ''transactor" approach means that the actual payments of mortgage interest and property taxes by owner occupiers should be included. Finally, since nonprofit institu-tions are no longer consolidated with households, it is necessary to show explicitly the gifts which households make to these institutions.
In summary, what this redefined Household Sector Account is de-signed to do is trace transaction flows as they occur in the economy, carrying out only those imputations which can be directly allocated to individual households. Where goods and services are consumed by households as a group but the allocation to individual households is conceptually or statistically difficult, these items are treated in the accounts as public goods, whether made available by enterprises or government. The recognition of enterprise consumption as analogous to government consumption reflects the increase in the extent to which people's lives depend upon the fringe benefits provided by the society. One of the major characteristics of fringe benefits is that they are pro-vided to specific groups as a matter of right, and the benefits accruing to any individual do not necessarily correspond to the contributions which are deducted from his earnings. Inasmuch as the individual has relatively little control over either the contribution which is deducted, on the one hand, or the nature and availability of the fringe benefits themselves, on the other, it seems reasonable to treat them in a way that is directly analogous to the treatment of taxes and government expenditures.
This does not mean that individual analysts should not study the distribution of the benefits of different kinds of public goods among different types of individuals or groups. Such research is needed, but it raises major theoretical problems of tracing incidence, and from the point of view of the national accountant it should be considered to be in the realm of analysis rather than statistical compilation.
1.3.5 The Integration of Financial Transactions and Balance Sheets with the National Income Accounts
When the U.S. national income accounting system was first developed in 1947, it was noted that a gross saving and investment account was provided on a consohdated basis for the economy as a whole because the
47 The United States National Income Accounts, 1947-1977
information necessary for a complete structure of saving and investment accounts had not as yet been developed. In Jaszi's discussion at the 1955 Conference on Income and Wealth, he proposed developing component saving and investment accounts for nonfinancial corporations, financial intermediaries, persons including unincorporated enterprises, govern-ment, and international transactions. In the Report of the National Accounts Review Committee in 1957, the integration of the flow of funds financial transactions and sector balance sheets with the national income accounts was identified as being of highest priority. In 1958 OBE re-peated its plans to implement a deconsolidation of the saving and invest-ment accounts to show transactions in financial assets and liabilities for different sectors of the economy and to integrate information on tangible investment and durable goods stocks including those of government and consumers. Again in 1971, both the Conference on Income and Wealth and the contributors to the fiftieth anniversary volume of the Survey of Current Business urged the integration of financial transactions and bal-ance sheets with the national income accounts.
To some degree, work in this area has gone forward. BE A has been developing extensive information on the stocks of tangibles derived directly from the national income accounts by the perpetual inventory method. But no formal integration of this information with financial transactions or the national income accounts has emerged. Recently the Federal Reserve Board has produced balance sheets that include both BEA tangible stock estimates and FRB financial asset and UabiUty esti-mates, integrated with the financial transactions in the flow of funds data. However, FRB does not provide balance sheets for the government sector, and since its major focus is on financial institutions the presenta-tion does not provide for the nonfinancial sectors of the economy the kind of deconsoHdated sector saving and investment accounts that were con-templated by BEA.
Certainly the idea of integrating financial transactions and balance sheets with the national income accounts is not just an idea whose time has come; history indicates that it came 30 years ago. What has prevented this development that is universally recognized as desirable from taking place? Primarily, as the original 1947 statement indicated, the problem has been one of obtaining the appropriate data. For most of the period under discussion, sufficient information was not available for either finan-cial transactions or tangible investment. Over time, however, these data deficiencies have been remedied, and now it would be a practical under-taking to develop fully integrated capital transaction accounts and bal-ance sheets through a marriage of the capital stock data produced by BEA and the financial transactions data produced by FRB.
In developing such integrated accounts, it is necessary to recognize that changes in balance sheet values occur not only as a result of actual transactions but also because of changes in the valuation of existing

48 Richard Ruggles
stocks. Thus, in using the perpetual inventory method for estimating the current value of the stock of a given tangible asset, account must be taken not only of the net purchases (i.e., purchases less sales) and capital consumption of the asset but also of the net revaluations of the existing stock due to price changes, capital losses, and retirements. For financial assets, capital consumption does not enter as an element of change, and for many financial assets and habihties revaluation is not required in order to obtain current market values. While sector balance sheets, like sector income accounts, reflect current market values, it is of course also possible to show at least the tangible portion of the balance sheet in terms of constant dollars, or if desired to present the whole of the balance sheet in terms of the purchasing power of some base period.
1.3.6 Balance Sheets for the Household Sector
An example of the household sector balance sheet, in terms of the stock of assets and liabilities, capital transactions, and revaluations, is given in Exhibit 5, and household sector balance sheets for the years 1947-80 are given in Appendix B, table l.A.2.
In Exhibit 5 the sector balance sheets appear both as opening balances at the beginning of the year and closing balances at the end of the year. This general approach is quite similar to that employed in the United Nations SNA. However, in this table the net current value of each tangible asset is explicitly derived from (1) original book value, (2) revaluations, and (3) capital consumption.
The first column shows the opening balance sheet. The gross stock at book value is obtained by adding up all net purchases for past periods, at the prices actually paid. To this gross stock at book value is added the cumulative revaluation needed to bring the past outlays to current market value. The book value of capital consumption as recorded in the account-ing records, the capital consumption adjustment, and the revaluations that are introduced to convert this book value to current value economic depreciation are all shown explicitly. The net current market value for any tangible asset is obtained by subtracting the cumulative current value of capital consumption from the current value of gross stock. For finan-cial assets, the cumulative book value of purchases plus the cumulative revaluation equals current market value.
The second column shows current year capital transactions: the net acquisitions (purchases less sales) of assets during the period and the capital consumption chargeable against the asset during the period. Both capital consumption at book value and its adjustment to the concept of economic depreciation are given. The difference between the net acquisi-tions of a given type of asset and its economic depreciation during the period is equal to net capital formation. For financial assets and liabili-ties, the capital transactions reflect the amount of the asset or liability acquired during the current period.

49 The United States National Income Accounts, 1947-1977
The column showing revaluations during the current period reflects primarily the effect of price changes during the period upon existing capital stock. However, the value of the capital stock also must be adjusted downward (negative revaluation) to reflect retirements as well as any loss in value due to accidents, fire, or unforeseen deterioration.
The closing balance shown in the final column can be obtained by adding each of the rows across the table, producing new values for each element. The origin of the net worth of a sector can be traced to revalua-tions and net savings, and the disposition of net saving can be broken down between net acquisitions of tangible and financial assets.
This presentation thus does provide a deconsolidation of the saving and investment account such as Jaszi recommended as early as 1955. It is directly Hnked with the current accounts through expenditures on struc-tures and durable goods by households together with their gross saving, and it is derivable entirely from existing data. This same general framework could be used to present balance sheets and financial transac-tions for other sectors of the economy.

Exhibit 1. The 1947 U.S. National Income Accounting System Table I National Income and Product Account, 1939 ($Millions) ~ ~ ~~
Compensation of cmployees: Wages and salaries 45,745
valuation adjustment 11,282 Rental income of persons 3,465
Supplements 2,075 Incomc of unincorporated enterprises and inventory
Corporate profits and inventory valuation adjustment: Corporate profits before tax:
Corporate profits tax iiability 1,462 Corporate profits after tax:
Dividends 3,796 Undistributed profits 1,2w
Inventory valuation adjustmcnt - 713 Net interest 4,212
National income 72,532
Indirect business tax and nontax liability 9,365 Business transfer payments 45 1
Less: Subsidies minus current surplus of government
Charges against net national product
Statistical discrepancy 462
enterprises 485
82,325
Capital consurnptiun allowances 8,101
Charges against gross national product 90,426
Pcrsonal consumption cxpcnditurcs 67,466 Gross private domestic invcstmcnt 9,004 Net foreign investment 885 Govcrnrnent purchases of goods and services 13,068
Gross national product 90,426
(A 0

Table II Consolidated Business Income and Product Account, 1939 ($Millions)
Compensation of employees: Wages and salaries:
Disburscmcnts 36,250 Excess uf accruals over disbursements 0
Employer contributions for social insurance 1,330 Other labor income 431
Income of unincorporated enterprises and inventory valuation adjustment 11,282
Rental income of persons 3,465 Corporate profits before tax and inventory valuation
Supplements:
VI w
Consolidated net sales: To cnnsurncrs To govcrnmcnt Tu business on capital account To abroad
Change in inventories
63,816 5,375 8,563 1,123 441
adjustment: Corporate profits heforc tax:
Corporate profits tax liability Corparate profits after tax:
Dividends Undistributed profits
Inventory valuation adjustment Net interest
Income originating
Indirect business tax and nontax liability Business transfer payments Statistical discrepancy Less: Subsidies minus current surplus of governmer
Charges against net product
Capital consumption allowance&
Charges against business gross product
cntcrpriscs
1.462
3,659 1,162 - 714 3,284
61,611
9,365 45 1 462
485
71,404
7.914
79,318 Buqiness gross product 79,318

Table In Consolidated Government Receipts and Expenditures Account, 1939 ($Millions)
Purchases of goods and services: Purchases of direct services:
Wages and salaries Compensation of employees:
7,343 Supplements:
Employer contributions for social insurance 199 Other labor income 87
7,629 Income originating and net and gross product
Net purchases from business 5,375 Net purchases from abroad 64
Transfer payments 2:512 Net interest paid 1,205
485
Government expenditures 17.270
Subsidies minus current surplus of government enterprises
Personal tax and nontax receipts Corporate profits tax accruals Indirect business tax and nontax accruals Contributions for social insurance:
Employee contributions Employer contributions:
Business Government Households and institutions
Deficit (+) or surplus ( -) on income and product transactions
2,440 1,462 9,365
596
1,330 199 11
1,867
Government receipts and deficit 17,270

Table IV Rest of the World Account, 1939 ($Millions)
From government -64 From persons - 484
Net current payments to the United States 888
Net payments of factor income to the United States: Wages and salaries 2
Branch profits 47
Interest 127 Dividends 137
Income originating and net and gross product 313 1
Net disinvestment in the United States 888
Net purchases from the United States: From business 1,123
Net disinvestment in the United States 888
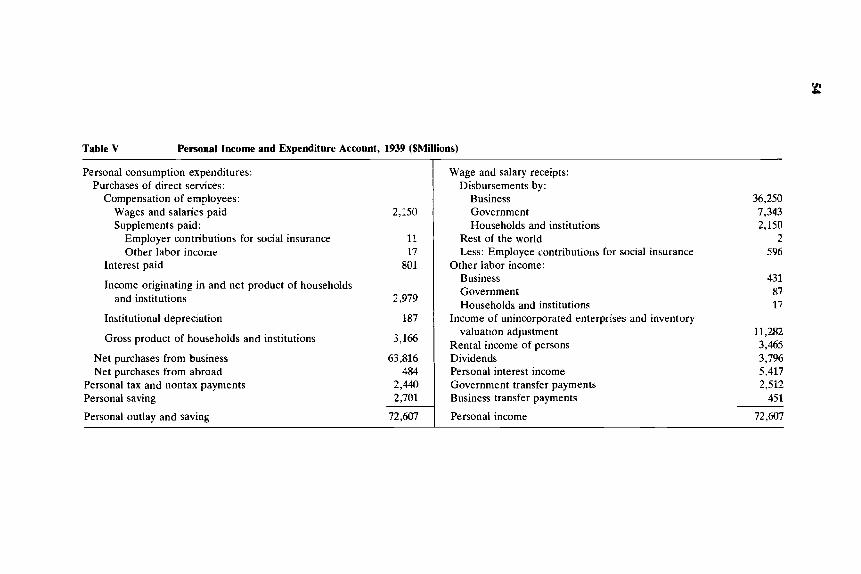
Table V Personal h o m e and Expenditure Account, 1939 ($Millions)
Personal consumption expenditures: Purchases of direct services:
Compensation of employees: Wages and salaries paid Supplements paid:
Employer contributions for social insurance Other labor incume
Interest paid
Income originating in and net product of househc-1s and institutions
Institutional depreciation
Gross product of households and institutions
Net purchases from business Net purchases from abroad
Personal tax and nontax payments Personal saving
Personal outlay and saving
2,150
11 17
801
2,979
157
3,166
63,816 484
2,340 2,701
72,607
Wage and salary receipts: Disbursements by:
Business Government Households and institutions
Rest of the world Lrss: Employer contributions for social insurance
Other labor income: Business Government Households and institutions
Income of unincorporated enterprises and inventory valuation adjustment
Rental income of persons Dividends Personal interest income Government transfer payments Business transfer payments
Personal income
36,250 7,343 2,150
2 596
43 1 87 17
11,282 3,465 3,796 5,417 2,512 451
72,607

ul ul
Gross investment and government deficit 11,759
Table VI Gross Savings and Investment Account, 1939 ($Millions) I
Gross private saving 11,759
Business purchases on capital account Excess of wage accruals over disbursements
Corporate inventory valuation adjustment Undistributed corporate profits (domestic) Change in business inventories
Net disinvestment in the United States by rest of world
0 1,162 - 714
Government deficit (+) or surplus ( - ) on income and I Statistical discrepancy 462 product transactions Capital consumption allowances by private business 7,914
Institutional depreciation 187 Personal saving 2,701
Foreign branch profits (net) 47

Exhibit 2. The 1958 U.S. National Income Accounting System Table I National Income aod Product Account, 1957a ($Billions)
Item
1 Compensation of employees 2 Wages and salaries 3 Dishursements (11-7) 4 5 Supplements 6
7 Other labor income (11-11) 8 Proprietors’ income (11-12) 9 Rental income of persons (Lt-15)
10 Corporate profits and inventory valuation adjustment 11 Profits before tax 12 Tax liability (111-15) 13 Profits after tax 14 Dividends (11-16) 15 Undistributed (V-12) 16 Inventory valuation adjustment (V-13) 17 Nei interest (11-13)
18 National income
19 Business transfer payments (11-21) 20 Indirect business tax and nontax liability (111-16) 21 Current surplus of government enterprises less subsidies
22 Capital consumption allowances (V-14) 23 Statistical discrepancy (V-16)
Gross national product
Excess of aocruals over disbursements (V-1 I)
Employer contributions for social insurance (111- 18)
(111-10)
254.6 238. I 2Z8.1
.o 16.5
7.6 8.9
43.0 11.8 41.9 43.4 21.6
12.4 9.4
- 1.5 12.6
364.0
1.6 37.6
- 1.3 37.7
.7
440.3
21.8
.. . .
Item
24 Personal consumption expenditures (11-2) 284.4
26 Net exports of goods and services 4.9 27 Exports (rv-1) 26.0 28 Imports (IV-2) 21.0 29 Government purchases of goods and services (In-1) 85.7
25 Gross private domestic investment (V-1) 65.3
Gross national product 440.3
“Numbers in parentheses indicate accounts and items of counterentry in the accounts.

Table II Personal Income and Outlay Account, 1957" ($Billions)
Item
1 Personal tax and nontax payments (111-12) 42.7 2 Personal consumption expenditures (1-24) 284.4
4 Nondurable goods 138.0 5 Services 106.5
3 Durable goods 39.9
6 Personal saving (V-10) 20.7
Personal outlay and saving 347.9
Item
7 Wage and salary disbursements (1-3) 238.1
9 Other private 117.4 10 Government 40.1
12 Proprietors' income (1-8) 43.0 13 Business and professional 31.4 14 Farm 11.6
16 Dividends (1-14) 12.4 17 Personal interest income 18.8 18 Net interest (1-17) 12.6 19 Net interest paid by government (111-9) 6.2 20 Transfer payments 21.5 21 Business (1-19) 1.6 22 Government (111-7) 19.9 23 Personal contributions for social insurance (111-19) - 6.6
Personal income 347,9
8 Manufacturing 80.6
11 Other labor income (1-7) 8.9
15 Rental income of persons (1-9) 11.8
"Numbers in parentheses indicate accounts and items of counterentry in the accounts.

Table III Government Receipts and Expenditures Account, 1957" ($Billions)
Item I Item
1 2 3 4 5 6 7 8 9
10
11
Purchases of goods and services (I-2Y) Federal
National defense (less sales) Other
State and local Transfer payments
To persons (11-22) Foreign (IV-3)
Net intercst paid (11-19) Subsidies less current surplus of government enterprises
Surplus or deficit ( - ) on income and product account
Government expenditures and surplus
(1-21)
(V-15)
8.5.7
43.9 5.5
36.3
1.7
116.2
12 13 14 15 16 17 18 19
Personal tax and nontax receipts (11-1) Federal State and local
Corporate profits tax accruals (1-12) Indirect business tax and nontax accruals (J-20) Contributions for social insurance
Employer (1-6) Personal (11-23)
42.1 37.4
5.4 21.6 37.6 14.2 7.6 6.6
Government reccipts 116.2
"Numbers in parentheses indicate accounts and items of countcrentry in the accounts

Item
1 Exports of goods and services (1-27) 26.0
Receipts from abroad 26.0
Table V Gross Saving and Investment Account, 1957” ($Billions)
Item
2 Imports of goods and services (1-28) 21 .0
4 Net foreign investment (V-9) 3.5 3 Transfer payments from U. S. Government (111-8) 1.5
Payments to abroad 26.0
Item I Item
I Gross private domestic investment (1-25) 2 New construction 3 Residential nonfarm 4 Other 5 Producers’ durable equipment 6 Change in business inventories 7 Nonfarm 8 Farm 9 Net foreign investment (IV-4)
Gross investment
65.3 36.5 17.0 19.5 27.9 1.0
.2
.s 3.5
68.8
10 Personal saving (11-6) 11 Excess of wage accruals over disbursements (1-4) 12 Undistributed corporate profits (I-i5) 13 Corporate inventory valuation adjustment (1-16) 14 Capital consumption allowances (1-22) 15 Government surplus or deficit ( - ) on income and
16 Statistical discrepancy (7-23) product account (111-11)
20.7 .o
9.4 - 1.5 37.7
1.7 .7
Gross saving and statistical discrepancy 68.8
“Numbers in parentheses indicate accounts and items of counterentry in the accounts.

Ts.2
n, Ts.4
T35
T,5
^3.6
T,.6
T^.i
T,.i
Ty
T4
Tf,
60
Exhibit 3. The United Nations SNA Matrix A Symbolic Table
1 2 3 4 5 6 7 8 9 10
Opening assets 1 Financial assets 2 Net tangible assets
Production Commodities 3 Commodities, basic value 4 Commodity taxes, net
Activities 5 Industries 6 Producers of government services 7 Private services: domestic service
and producers of private n-p services 7^3 7^8 2̂ 10 Consumption
Expenditure 8 Household goods and services 9 Government purposes
10 Purposes of private n-p bodies Income and outlay 11 Value added 7^ 3 r^ 4 r „ 5 Tn,t T^.i 12 Institutional sector of origin 13 Form of income 14 Institutional sector of receipt
Accumulation Increase in stocks 15 Industries 16 Producers of government services Fixed capital formation 17 Industries 18 Producers of government services 19 Producers of private nonprofit
services to households Capital finance 20 Industrial capital formation, land, etc. 21 Capital transfers 22 Financial assets 23 Institutional sectors ^31 7̂ 3 2
Rest of the world 24 Current and capital transactions 3^41 7̂ 4 2 7̂ 4.3 7̂ 4 5 ^43
Revaluation 25 Financial assets 26 Net tangible assets
Closing assets 27 Financial assets 28 Net tangible assets
NOTE: The contents of the submatrices can be summarized as follows: Ti 23 The holdings of financial assets by the institutional sectors at the beginning of the period of account. 7J 24 The holdings of financial assets, issued by the country under study, by the rest of the world at the beginning of
the period of account. ^23 The holdings of net tangible assets by the institutional sectors at the beginning of the period of account. The
resident economic agents from which the institutional sectors are built up hold between them all the tangible
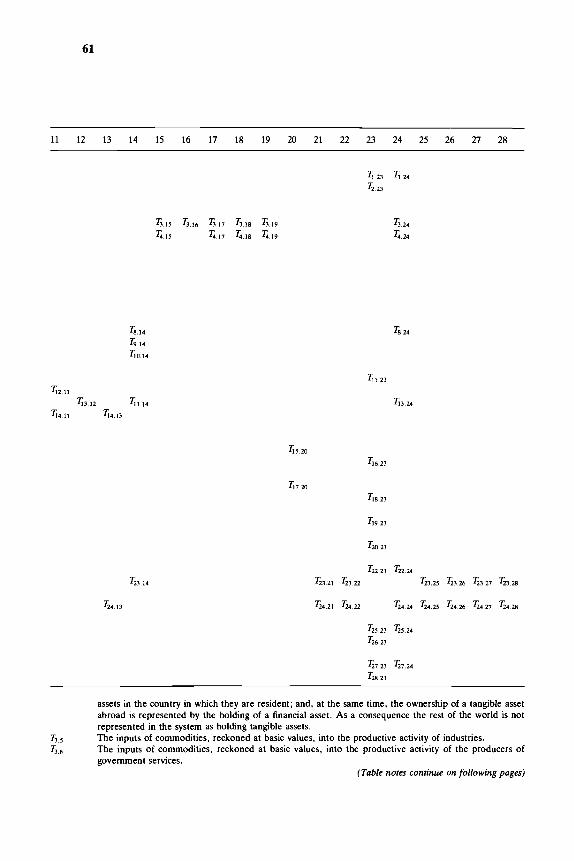
61
11 12 13 14 15 16 17 18 19 20 21 22 23 24 25 26 27 28
^ .23
^ .23
^ . 1 5 ^ . 1 6 ^ . 1 7 ^ . 1 8 ^ . 1 9 ^ . 2 4
Ti.lS ^ . 1 7 ^ . 1 8 ^ . 1 9 ^ . 2 4
' S H ^8.24
^ .14
^ 0 . 1 4
Til.23
^12.11
^13.12 ^3 .14 ^13.24
^14.11 7i4, i3
M5.20
^7.20
^16.23
^ 8 . 2 3
^19.23
^ 0 . 2 3
^ 3 . 1 4
^ 4 . 1 3
^ 2 . 2 3 ^2 .24
^3 .21 ^ 3 . 2 2 ^3 .25 ^ 3 . 2 6 ^ 3 . 2 7 ^ 3 . 2 8
^4 .21 ^ 4 . 2 2 ^4 .24 ^ 4 . 2 5 ^ 4 . 2 6 ^4 .27 ^ 4 . 2 8
^ 5 . 2 3 ^5 .24
^ 6 . 2 3
^ 7 . 2 3 ^7 .24
^ 8 . 2 3
assets in the country in which they are resident; and, at the same time, the ownership of a tangible asset abroad is represented by the holding of a financial asset. As a consequence the rest of the world is not represented in the system as holding tangible assets.
7̂ 5 The inputs of commodities, reckoned at basic values, into the productive activity of industries. T^^ The inputs of commodities, reckoned at basic values, into the productive activity of the producers of
government services. (Table notes continue on following pages)
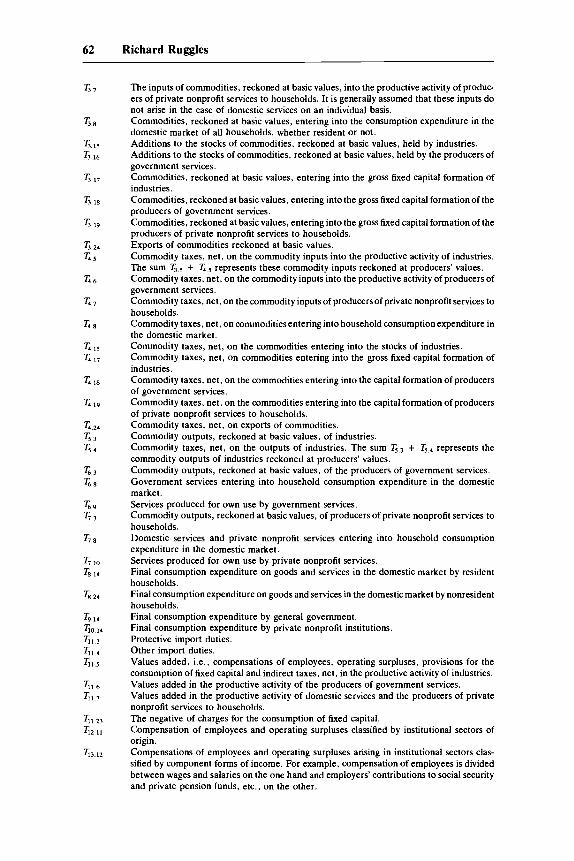
62 Richard Ruggles
7̂ 7 The inputs of commodit ies , reckoned at basic values, into the productive activity of produc-ers of private nonprofit services to households. It is generally assumed that these inputs do not arise in the case of domestic services on an individual basis.
23 8 Commodit ies , reckoned at basic values, entering into the consumption expenditure in the domestic market of all households, whether resident or not.
T215 Additions to the stocks of commodities, reckoned at basic values, held by industries. ^ 1 6 Additions to the stocks of commodities , reckoned at basic values, held by the producers of
government services. 7̂ .17 Commodit ies , reckoned at basic values, entering into the gross fixed capital formation of
industries. T^ 18 Commodit ies , reckoned at basic values, entering into the gross fixed capital formation of the
producers of government services. 7̂ 19 Commodit ies , reckoned at basic values, entering into the gross fixed capital formation of the
producers of private nonprofit services to households. 7̂ 24 Exports of commodities reckoned at basic values. 7i 5 Commodity taxes, net, on the commodity inputs into the productive activity of industries.
The sum ^ 5 + Ti.s represents these commodity inputs reckoned at producers' values. 7i 6 Commodity taxes, net, on the commodity inputs into the productive activity of producers of
government services. 7i 7 Commodity taxes, net, on the commodity inputs of producers of private nonprofit services to
households. 7i 8 Commodity taxes, net, on commodities entering into household consumption expenditure in
the domestic market. 7i 15 Commodity taxes, net, on the commodities entering into the stocks of industries. 7i 17 Commodity taxes, net, on commodities entering into the gross fixed capital formation of
industries. 7i 18 Commodity taxes, net, on the commodities entering into the capital formation of producers
of government services. 7i 19 Commodity taxes, net, on the commodities entering into the capital formation of producers
of private nonprofit services to households. 7i 24 Commodity taxes, net, on exports of commodities. 7̂ 3 Commodity outputs, reckoned at basic values, of industries. 7̂ 4 Commodity taxes, net, on the outputs of industries. The sum 7̂ 3 + 7̂ 4 represents the
commodity outputs of industries reckoned at producers' values. 7̂ 3 Commodity outputs, reckoned at basic values, of the producers of government services. 7̂ 8 Government services entering into household consumption expenditure in the domestic
market. 7̂ 9 Services produced for own use by government services. 7̂ 3 Commodity outputs, reckoned at basic values, of producers of private nonprofit services to
households. 7̂ 8 Domest ic services and private nonprofit services entering into household consumption
expenditure in the domestic market. 7̂ 10 Services produced for own use by private nonprofit services. 7̂ 14 Final consumption expenditure on goods and services in the domestic market by resident
households. 7̂ 24 Final consumption expenditure on goods and services in the domestic market by nonresident
households. 7̂ 14 Final consumption expenditure by general government. Tio 14 Final consumption expenditure by private nonprofit institutions. 7ii 3 Protective import duties. Til 4 Other import duties. 7Ji 5 Values added, i .e . , compensations of employees , operating surpluses, provisions for the
consumption of fixed capital and indirect taxes, net, in the productive activity of industries. Til 6 Values added in the productive activity of the producers of government services. 7ii 7 Values added in the productive activity of domestic services and the producers of private
nonprofit services to households. Til 23 The negative of charges for the consumption of fixed capital. 7^211 Compensation of employees and operating surpluses classified by institutional sectors of
origin. ^13.12 Compensations of employees and operating surpluses arising in institutional sectors clas-
sified by component forms of income. For example, compensation of employees is divided between wages and salaries on the one hand and employers' contributions to social security and private pension funds, etc . , on the other.

63 The United States National Income Accounts, 1947-1977
1̂3.14 Current income transfers, including transfers to property income, paid out by the institu-tional sectors (as sectors of receipt).
1̂3.24 Current income transfers, including transfers of property income, paid out by the rest of the world.
7̂ 4 n Indirect taxes, net, paid to general government. 1̂4.13 Gross receipts of income by the institutional sectors (as sectors of receipt).
7̂ 5 20 Increases in stocks of industries. T\6.23 The finance, provided by the capital finance account of general government, of the increase
in stocks of producers of government services. 7i7.2o Total gross fixed capital formation of industries. 7]g 23 The finance, provided by the capital finance account of general government, of gross fixed
capital formation undertaken by producers of government services. Ti9.23 The finance, provided by the capital finance account of private nonprofit institutions, of gross
fixed capital formation undertaken by the producers of private nonprofit services to house-holds.
^0.23 The finance, provided by the capital finance accounts of the institutional sectors, of gross industrial capital formation (in stocks, and fixed assets) and the net purchases, by these sectors of land and intangible assets other than financial assets.
T22.23 Net acquisitions of financial assets by the institutional sectors. 7̂ 2.24 Net acquisitions of financial assets, issued by the country under study, by the rest of the
world, T23,i The holdings of financial liabihties by the institutional sectors at the beginning of the period
of account. !̂ 3 2 The net worths of the institutional sectors at the beginning of the period account. ^3.14 The saving of the institutional sectors. 7̂ 3 21 Net receipts of capital transfers by the institutional sectors. ^3.22 Net issues of financial Uabihties by the institutional sectors. ^3.25 Revaluations of financial liabilities held by the institutional sectors. T23.26 Revaluations of the net worths of the institutional sectors. ^ 2 7 The holdings of financial liabihties by the institutional sectors at the end of the period of
account. ^3.28 The net worths of the institutional sectors at the end of the period of account. 7J4 1 Financial habihties issued by the rest of the world and held by the institutional sectors at the
beginning of the period of account. 7̂ 4 2 The net worth of the rest of the world at the beginning of the period of account arising from
its relationships with the country under study; that is to say, the negative of the rest of the world's net indebtedness to that country.
7̂ 4 3 Imports of commodities reckoned at c.i.f. values. !̂ 4 6 Direct expenditure abroad on goods and services by the producers of government services. !]̂ 4 g Final consumption expenditure abroad by resident households. ^4 13 Gross receipts of income (whether distributed factor income or other current transfers) by
the rest of the world from the country under study. ^4.21 Net receipts of capital transfers by the rest of the world. ^4.22 Net issues of financial habihties, taken up by the country under study, by the rest of the
world. !̂ 4 24 The rest of the world's balance of payments on current account with the country under study. !̂ 4 25 Revaluations of financial liabilities issued by the rest of the world and held by the country
under study. 7̂ 4 26 Revaluation of the net worth of the rest of the world arising from its relationships with the
country under study. !^4 27 Financial habihties issued by the rest of the world and held by the institutional sectors at the
end of the period of account. ^4.28 The net worth of the rest of the world at the end of the period arising from its relationships
with the country under study. ^5 23 Revaluations of financial assets held by the institutional sectors. ^5.24 Revaluations of financial assets issued by the country under study and held by the rest of the
world. 7̂ 6.23 Revaluations of net tangible assets held by the institutional sectors. !̂ 7 23 The holdings of financial assets by the institutional sectors at the end of the period of account. 7̂ 7 24 The holdings of financial assets, issued by the country under study, by the rest of the world at
the end of the period of account. !^ 23 The holdings of net tangible assets by the institutional sectors at the end of the period of
account.

Exhibit 4
Comparison of the BEA Personal Income Account with the Household Sector Current Account lor the Year 1969 (SBitllons Current)
BEA House hold Personal Current Outlays and Outlays and Saving Saving
Expenditures on durables 85.7 Expenditures on nondurables 247.8 238.5
Expenditures 244.8 244.8
In kind consumption 3.0 Less: Increase in stocks - 6.3
Expenditures on services 248.2 147.8 Household expenditures 147.8 147.8 Nonprofit expenditures 15.5 Imputed banking services 9.8 Imputed hwusing services 52.0 Other benefits in kind 23.1
Interest payments 15.6 31.0 Consumer debt interest 15.6 15.6 Mortgage interest 15.4
BEA Household Personal Current Income Income
Wages and salaries Payments Pay in kind
515.7 513.0 513.0 513.0
2.7
Other labor income 28.5
Other benefits 27.9 Fees and other pay .5
Proprietor income Money income Imputed income
67.0 65.4 65.4 65.4
1.6
Rental income 19.6 Paid to households 8.5 Imputed rent 11.1
8.5 8.5

Tax payments 115.7 128.5 Income taxes 101.5 101.5 Property taxes .8 13.6 Other taxes and nontaxes 13.4 13.4 Personal contributions
for social insurance 26.2
Transfers paid .9 14.2 Gifts to nonprofits 13.3 Transfers to abroad .9 .9
Imputed outlays 149.0 Except owner-occupied housing 97.0 Owner-occupied housing 52.0
Gross household saving 129.5
Consumer durables 59.4 Owner-occupied housing 11.9
Net household saving 58.2
Capital consumption allowances
Personal saving (BEA) 40.6
Total current outlays and saving Personal outlays and saving 754.7 864.9
Interest income 61.1 Paid to households 38.5 Paid to nonprofits 1.2 Imputed interest 21.4
s 38.5 38.5
Dividends 22.4 21.4 Paid to househoids 21.4 21.4 Paid to nonprofits 1.0
Business transfers 2.8 2.8 Private pension payments 11.9
Government transfers 63.8 54.4 Paid to households 54.4 54.4 Paid to nonprofits 2.9 Benefits in kind 6.5
Current market income 715.8
Imputed gross income 149.0 Except owner-occupied 97.0 Owner-occupied gross income 52.0
Less: Employee SOC. sec. 26.2
Personal income (BEA) 754.7 Total current receipts 864.9

66
Exhibit 5 Household Sector Balance Sheets ($BiUions Current)
Reproducible assets (net current value) Residential structures (net current value)
Gross stock (book value) Plus: Revaluation Equals: Gross stock (current value) Less: Capital consump. (book value) Less: Cap. consump. revaluation
Consumer durables (net current value) Gross stock (book value) Plus: Revaluation Equals: Gross stock (current value) Less: Capital consump. (book value) Less: Capital consump. revaluation
Inventories Land Fixed claim assets Currency and deposits
Currency and demand deposits Time and savings accounts
Government securities U.S. Treasury issues Agency issues State + local obligations
Other fixed claim assets Corporate + foreign bonds Mortgages Open market paper Other financial assets
Equities Corporate stock Farm business equity Noncorp. nonfarm equity Pension & ins. (cash value) Estates and trusts
Total assets LiabiUties
Mortgages Consumer credit Bank loans, n.e.c. Other liabilities
Net worth (balance sheet) Net saving (current acct.) Capital gains + stat. discrep.
Total liabilities + net worth
Closing/ Opening Balance (1968/69)
874.4 482.9 450.5 253.0 703.5 96.5
124.1 310.5 540.3 24.5
564.8 241.9
12.4 81.0
133.6 671.5 480.9 109.7 371.2 105.8 73.1 8.9
23.8 84.8 3.5
44.6 10.1 26.6
1491.4 731.3 195.9 317.6 108.4 138.2
3170.9 424.6 257.7 126.9
4.7 35.2
2746.4
3170.9
Capital Trans-actions (1969)
49.1 16.5 28.4
28.4 8.0 3.9
26.3 85.7
85.7 56.9 2.5 6.3
44.2 5.3
-4.5 9.8
28.1 10.8 5.6
11.7 10.7 3.2 2.1 5.3
.1 -6.6
-11.5 -1.5
1.5 4.9
86.7 30.3 18.6 10.8 1.0 0.0
56.3 58.2
-1.9
86.7
Revalu-ations (1969)
33.6 26.9
-1.9 37.3 35.4
-1.1 9.7 3.3
-46.9 11.4
-35.4 -42.1
3.4 3.5 8.8
-70.8 -92.9
8.8 19.1
-0.3 -5.5
-28.4
-28.4
-28.4
Closing/ Opening Balance (1969/70)
957.2 526.3 477.0 290.3 767.3 103.4 137.6 340.1 579.1 36.0
615.1 256.7
18.3 90.7
142.3 715.7 486.2 105.2 381.0 133.9 83.9 14.5 35.5 95.5 6.7
46.7 15.4 26.7
1414.1 626.9 203.2 338.2 113.0 132.8
3229.2 454.9 276.3 137.7
5.7 35.2
2774.3
3229.2

67 The United States National Income Accounts, 1947-1977
Appendix A
Financial Intermediaries in the National Accounts
The treatment of financial intermediaries is one of the most controversial issues in national income accounting. Generally, the measurement of output of financial intermediaries has been based on the concept of factor cost, viewed as the contribution of the factors of production; it has also been influenced by a concept of material output derived from the classical view of production in Smith, Ricardo, and Marx. The approach has generally been of an aggregative nature, which either consolidates out of the system the financial transactions of the individual transactors or in some cases completely ignores them. In many cases, to the extent that the sales of financial intermediaries' services do not reflect factor costs, the market value of sales is not considered to be a correct measure of ' 'output." The reconcihation of the receipts side of the account of finan-cial intermediaries with the factor cost side is achieved by consolidating the receipts with claims or the transfers which financial intermediaries pay, and which in national income accounting terms are not considered to be part of output.
This national income accounting view is not fully consistent with the way transaction flows are viewed by individual transactors. If the mac-roeconomic accounting system is to correspond to the microeconomic accounting of individual transactor, it will be necessary, in a number of cases, to alter the treatment of financial transactions. This appendix examines, in some detail, the transactions relating to insurance, pen-sions, and interest, comparing their present treatment in the national income accounts with the way they would be recorded in individual transactor accounts.
Fire and Casualty Insurance
Fire and casualty insurance is purchased by businesses and households as protection against the possibility of loss. Premiums are paid to insur-ance companies, which in turn use these funds to pay the claims of the insured suffering casualty losses and to cover the costs and profits of the insurance business.
Purchases by Business
In the national accounts, the purchase of fire and casualty insurance by business is treated on a net basis (i.e., the claims paid to business are subtracted from the premiums paid by business). This net premium payment is, of course, by definition also equal to the costs and profits of the insurance companies. The fire and casualty losses are recorded in the national accounts as "accidental damage to fixed capital," and this is added to capital consumption allowances. Thus by understating the insur-

68 Richard Ruggles
ance premiums which business pays and equally overstating capital con-sumption, two wrongs come out with the correct profits.
In the actual accounts of businesses, these transactions would be recorded differently: (1) insurance premiums paid by business would be considered to be an intermediate cost of goods and services purchased from other enterprises and would not be netted against claims; (2) the claims received by business would be considered capital transactions offsetting the casualty losses, also considered capital in nature; and (3) no addition would be made to capital consumption allowances for accidental damage to fixed capital.
It is apparent that the present national income accounting treatment of insurance transactions would be quite inappropriate for the accounts of the individual transactor. If this treatment were used, businesses suffer-ing no loss would record the cost of insurance as the premiums actually paid, but for those having a loss the cost in insurance would equal ''net premiums," that is, premiums paid less claims received, and could be a sizable negative flow; at the same time the fire or casualty loss would appear as a large increase in capital consumption allowances. These distortions are due in part to the failure of the national income accounts to achieve a proper separation of current transactions from capital trans-actions, and in part to a willingness to deal with consolidated accounts for all businesses as a group.
If the transactor's approach to the recording of fire and casualty insur-ance transactions of business were adopted for the national income accounts, it would not alter the measurement of total GNP. However, it would result in a decline in the product originating in enterprises buying insurance, since the cost of insurance would be considered to be total premiums rather than net premiums. This decline would be exactly offset by an increase in product originating in the insurance sector. Claims paid out would reflect that portion of the insurance sector's output that is paid over to claimants much in the same way that dividends represent payment of profits to stockholders. The transactor approach has the advantage of recognizing at the microlevel that total premiums paid by a firm are a current cost of operation and that casualty losses and reimbursements are adjustments to the capital account and not to current accounts.
Purchases by Households
Household purchases of fire and casualty insurance are treated in the national accounts in a manner parallel to the treatment used for business. Households are considered to pay "net premiums" (i.e., total premiums paid minus claims received), which are by definition equal to the costs and profits of the insurance companies. However, from the transactor's point of view, it is the total premium that represents a consumer pur-chase, and again claims received are a capital transaction. The national

69 The United States National Income Accounts, 1947-1977
income accounting approach, by combining a major capital receipt (claims received) with a relatively minor current outlay (premium paid), does violence to an individual household's account. It should be noted, however, that for the case of insurance purchased by households the adoption of the transactor approach would result in an increase in GNP, since now consumer purchases of goods and services will reflect total premiums rather than net premiums paid, and this increase will corre-spond to an increase in the measure of the output of the fire and casualty insurance companies serving households. From the point of view of opportunity cost and utility theory, such an increase is quite appropriate. What households are purchasing is protection against loss, and the cost of such protection for the individual transactor consists of the full premium payment and not the net premium.
Health Insurance
Health insurance premiums may be paid by employers as fringe bene-fits for their employees, or they may be paid by households directly. The benefits paid by health insurance companies may consist of either third-party payments to doctors and hospitals for the provision of health care to the beneficiaries, or they may be ''sick-pay" benefits paid directly to beneficiaries.
Purchases by Business
In the case of health insurance provided by employers as a fringe benefit to their employees, the premiums paid by employers are consid-ered to be ''other labor income" received by employees in the national income accounts. On the outlay side of the personal income account, employees are then considered to purchase (1) the services of health insurance companies as measured by their costs and profits, and (2) medical care services as measured by the payments health insurance companies make to doctors and hospitals.
From the employee's point of view, this fringe benefit (health insur-ance) is not an actual payment of money income. It does not appear on the statement of income and withholding his employer gives him for tax purposes. In most cases employees are quite unaware of the amount of the premium the employer actually pays. Although this fringe benefit could be considered to be imputed income, for any specific employee its valuation poses serious problems; the proper value might bear Uttle or no relation to the premiums paid by the employer. For example, families with more than one wage earner might have unnecessary double cover-age. Presumably its value to a single person might be less than to a family. Young employees might value it less than older employees. There does not in fact seem to be more justification for making this imputation than for imputing a value for other fringe benefits, such as subsidized meals,

70 Richard Ruggles
parking, expense accounts, recreational facilities, and even pleasant working conditions.
With respect to the administrative costs of health insurance and the costs of medical care provided by doctors and hospitals, the treatment in the national income accounts, if used as a basis for allocation to individual households, would involve gross distortions of income and expenditures. For individuals who were not sick, the cost would reflect only the operat-ing costs of the health insurance companies, and it would appear, con-trary to fact, that these individuals receive more ''other labor income" than they pay out in health insurance costs. For individuals who do receive medical care, it would appear that they spend on medical care more than they receive in other labor income.
If transactor recording were adopted, employers would be recorded as purchasing health insurance for their employees. This would be reported as health services that enterprises provide their employees as a fringe benefit but would not appear in the employees' account as money in-come. The health insurance industry in turn would be considered as purchasing health services from doctors and hospitals. From the point of view of GNP and product originating by industry, this treatment would be identical to the current national income accounting treatment. From an aggregative point of view, the difference between the two treatments Hes solely in whether employers' health insurance contributions are re-corded as other labor income received by individuals, and whether the cost of health insurance and medical care is recorded as actual expendi-tures paid by individuals.
Sick'Pay Benefits
Payments of sick pay by health insurance and workmen's compensa-tion is handled in the national income accounts by considering employers' contributions to be other labor income, and considering the costs of health insurance companies and the costs of medical care to be consumer expenditures. The difference between the health contributions included in other labor income and the costs included in consumer expenditures is equal to (1) sick pay paid to individuals, and (2) the change in reserves of health insurers and workmen's compensation funds.
The national income accounting treatment contrasts with the trans-actor's recording, which would treat sick pay as an actual payment of income to individuals and would exclude from household income and saving the changes in the reserves of health insurance and workmen's compensation funds. Again the transactor approach to the recording of these transactions would not alter GNP but would alter household in-come, household saving, and changes in reserves held by business enter-prises.

71 The United States National Income Accounts, 1947-1977
Purchases by Households
When health insurance is purchased by individuals, the total premium individuals actually pay are not recorded in the national accounts as consumer expenditures. Instead the consumer expenditure for health insurance is considered to consist of the costs and profits of the health insurers; the cost of the medical care individuals receive is entered as a separate consumer expenditure. The difference between the premiums actually paid and these two categories of costs represents, as indicated above, the sick pay which is returned to individuals and the change in the reserves of the health insurers.
A transactor recording would require considering the full premium payment as a consumer expenditure of those paying it, and the receipt of sick pay as income of those receiving it. On this basis of recording, the change in the reserves of health insurance companies would be recorded as a change in "income retained" by them rather than as saving by households.
As in the case of household purchases of fire and casualty insurance, this shift to a transactor basis of recording would result in an increase in GNP. The increase would be equal to the difference between the pre-miums paid by households and the costs and profits of health insurers and the costs of medical care; looked at in another way it will also be equal to sick pay and the change in the reserves of health insurers. Such an increase is justifiable, since the premiums paid by households represent a bona fide purchase of increased health security, which guarantees medi-cal care and sick pay if and when required.
Life Insurance and Pensions
The treatment of life insurance and pensions in the national accounts follows the general approach described above for health insurance. If life insurance and pension contributions are made by an employer, these contributions are considered part of other labor income and are reflected in personal income. The costs and profits of life insurance companies are considered to measure the amount spent for life insurance and pensions, and the difference between the contributions included in other labor income and the costs of insurance included in consumer expenditures is equal to the Ufe insurance benefits and pensions paid plus the change in the reserves of life insurance companies and pension funds.
Where an individual himself buys life insurance or contributes to pension funds, the premium he pays is not entered in the national accounts as an expenditure—only the costs and profits of the Ufe insur-ance companies and pension funds are considered to be consumer ex-penditure. Thus in this case also the difference between the premiums

72 Richard Ruggles
actually paid and the costs charged as consumer expenditure equal the life insurance benefits and pensions paid and the change in the reserves of life insurance and pension funds.
In applying transactor criteria to the recording of life insurance and pension transactions, first it must be determined whether the transactions affect the balance sheet of the individual. In the case of term insurance or pension plans that are not vested, no cash surrender value or equity is built up for the individual. If an employer makes life insurance and pension contributions as part of other labor income, this is a fringe benefit. Those who do directly benefit in the current period are those who receive life insurance or pension payments. Life insurance benefits paid in a lump sum to heirs should be recorded in the capital accounts, together with other estate transfers. Life insurance annuities or pensions should be recorded as current income received by households. Individual purchases of term life insurance should be treated in the accounts like household purchases of other casualty insurance.
If life insurance and pension contributions result in an increase in the equity of individuals, this increase should be reflected in the balance sheets and current accounts of individual transactors. An increase in an individual's equity should be reflected in his balance sheet by an increase in the cash surrender value of his insurance and pension policies, but not by some pro rata share of the total reserves of life insurance and pension funds. Similarly, a portion of the premiums paid by individuals represents saving in the current income account of the individual, so that in fact the premium must be split into two elements, current insurance and saving. Aside from these considerations, the premiums paid for life insurance and pension funds and the benefits received should be recorded in trans-actor accounts as described for term life insurance.
In discussing pensions funds, the United Nations SNA proposes treat-ing unfunded pension funds as if they were funded. This would involve imputing pension contributions for business and deducting them from profits. In effect, a dummy account for nonfunded pension funds would be set up showing the net cumulative imputed pension contributions and the unfunded pension liabilities and reserves. Although information on the liabilities of unfunded pensions is interesting and useful, it does not seem to be appropriate or realistic to treat such imputations as actual transactions.
Interest
There has been extensive and intensive discussion of the treatment of interest in the literature of national accounting, but at the present time there is surprisingly widespread consensus on how interest transactions should be handled in the measurement of the national income aggregates.

73 The United States National Income Accounts, 1947-1977
The ''Net Interest'' Approach
In the U.S. national income accounts the concept of net interest was developed to handle interest transactions. Interest received by business is netted against the interest payments which business makes, yielding their ''net interest" payments. It is apparent that, if a business receives more interest than it pays out, this net interest flow will be negative.
Several different rationales can be offered in support of this approach. It can be argued that interest is a payment for a factor of production, and net interest represents the net amount of this factor used by business. It can also be argued, however, that interest payments are not factor payments but, Uke dividend payments, represent a transfer of the income earned by a business to those having a claim on it. According to this view, interest received by an enterprise is Hke dividends received by an enter-prise; both types of receipts represent income derived from the produc-tive activity of other enterprises. On this basis, the interest any given enterprise receives should be excluded from the measurement of its output (income originating), and this can best be accompHshed by omit-ting the interest received from the product side of the account and subtracting it on the income side from interest paid.
For financial institutions where interest receipts exceed interest pay-ments by substantial amounts, the BE A procedure results in negative product. As a consequence, it has been found useful to recognize that financial institutions provide their depositors with banking services in-stead of paying interest, and these services, in effect, constitute imputed interest payments. Such imputed interest payments are valued at the cost of providing banking services to depositors. Once such imputations are introduced as part of interest paid by financial institutions, the net in-terest approach results in an income-originating measurement for finan-cial institutions, which is equal to their costs and profits.
The United Nations Approach
The United Nations SNA does not formally adopt a net interest approach, but because it separates production accounts from appropria-tion accounts the effect is the same. The production account for an enterprise shows on the product side the receipts from the sale of goods and services, and on the cost side the purchases of intermediate goods and services, capital consumption allowances, indirect taxes, compensa-tion of employees, and operating surplus. The operating surplus is, of course, a residual reflecting the difference between sales receipts and the costs of sales. It represents that part of factor income which is carried over to the appropriation account and is available for further distribution as income payments.

74 Richard Ruggles
In the appropriation account of the SNA, other property income received, such as dividends and interest, is added to the operating surplus to show the total amount of income available. The disbursements side of the appropriation account shows the actual payments made. In the measurement of output, these procedures have the same effect as the net interest approach used in the U.S. national income accounts, that is, interest received is excluded from the measurement of output.
Consumer Interest Payments
Despite the general consensus about the treatment of interest in the national accounts, present practices are at considerable variance with a transactor's approach to the recording of interest transactions in the accounts of households, enterprises, and government. For the household account, the present net interest treatment excludes consumer interest as an element of consumer expenditure, and treats it as a transfer. From the point of view of the individual doing the borrowing, however, it is apparent that a useful service is being purchased. In many consumer expenditures, interest charges are implicit in the higher prices merchants charge where easy credit or charge privileges are granted. But, paradox-ically, if a consumer discovers that he can buy at a lower price and borrows to finance the purchase, the exphcit interest charge is, in the national accounts, excluded from consumer expenditures. The exclusion of consumer interest payments from the purchase of goods and services is usually based on one or more of the following reasons. First, it may be argued that no productive resources are involved in the loaning of money, and interest payments are merely a transfer paid by the borrower to the lender. This argument rests in large part on the proposition that income should be measured in terms of the costs of the factors of produc-tion, and interest represents only a redistribution of income and is not in itself a factor of production. Second, it may be argued, from a similar but slightly different point of view that no real production has taken place and as a consequence there is no operating surplus out of which interest can be paid. Furthermore, since interest payments are considered transfers, payment of interest by consumers does not represent a purchase of goods and services. Finally, it is sometimes argued that the payment of con-sumer interest is "unproductive," much in the same sense that Adam Smith argued that the services of domestic servants were unproductive. This view is unquestionably related to the medieval view that moneylend-ers are engaged in a form of usury that exploits the misery of debtors.
From the point of view of the individual consumers, however, the ability to borrow money, thus making it possible to acquire goods and services, does represent an increase in utihty. If market valuations and opportunity cost are to be used to represent the value of goods and
75 The United States National Income Accounts, 1947-1977
services, there is no logical reason from the individual transactor's point of view to exclude consumer interest as a legitimate purchase.
Enterprise Interest Payments
In the transactor accounts for enterprises, it is of course not customary to subtract interest received from interest paid. In computing operating surplus an enterprise might exclude interest received, but this would be done to separate the normal business activity of the enterprise from its financial activities. For financial enterprises, where normal business ac-tivities are financial, it would be unreasonable to make such a separation.
From a transactor point of view, it would be most logical for enterprises to treat their interest transactions as they treat rental receipts and pay-ments. On the receipts side of the account, receipts from rentals are treated as the sale of goods and services; and on the outlay side, payments for rentals are an intermediate cost of goods and services purchased from other enterprises. As a consequence of this treatment of rental receipts and payments, it has been necessary to introduce into the national income accounts a supplementary ''rental income" industry to contain the rental payments made by enterprises to individuals or to enterprises not already classified in other industries. This rental industry does not, of course, include all rental payments, since many rent payments are made to enterprises in other industries. Nor does it reflect the actual use of buildings and equipment, since enterprises owning their own buildings and equipment do not make rental payments. For the rental industry, however, the gross rental payments received represent the value of their sales; after appropriate deductions are made for costs (including interest and taxes), the residual return appears in the national accounts as part of ''rental income of persons."
This same treatment can also be appHed to interest transactions. In-terest received by enterprises would be considered to be a sale of goods and services, and, like rental payments, all interest paid by enterprises would be considered an intermediate purchase from other enterprises. Under such a treatment it would be necessary to introduce a sup-plementary "interest" industry which would be the recipient of interest payments made by enterprises to individuals or companies not already classified in other industries. The gross receipts or sales of this industry would be the interest payments they received, and any costs incurred in connection with the lending of such funds would be deducted before the payment of "interest income to persons."
It has been argued that one of the major reasons why interest should not be treated as a cost was that it would misrepresent the "true" measure of value added or income originating in an industry. This same reasoning has also been applied to the treatment of rental payments—that these
76 Richard Ruggles
also represent part of the income generated within the enterprise. While from a production function point of view it may often be useful to take into account ''rented capital goods'' as well as owned capital goods for analyzing capital coefficients, it does not follow that the national income accounts should be constructed solely with this criterion in mind. First, in operational terms it would be extremely difficult to reconstruct enterprise accounts so as to eliminate all rentals and/or purchases which represent the use of capital assets. If this were attempted, furthermore, it would of course be necessary to impute to the enterprises the cost of ownership, including such things as management, taxes, etc. In the case of rentals, such as communications or computer services which include highly so-phisticated equipment together with software or other costs, the statisti-cal estimation problems become unmanageable.
Furthermore, from the point of view of the enterprise as a profit-making institution, it is more reasonable to treat both interest and rental payments as intermediate costs of production rather than as part of income originating and/or profits. What gross product originating in an enterprise is supposed to represent is the value which is added to the contributions provided by other enterprises, and to deny that the provi-sion of capital is a contribution is something that only a very conventional national accountant or a Marxist would dare to suggest.
The transactor approach to interest would alter the pattern of income originating in the national income accounts. It would reduce the gross product of the enterprises that borrow, and it would correspondingly increase the gross product of enterprises that lend. One of the major consequences of this change would be that the gross product of financial institutions, without any imputation for imputed interest, would be ex-actly equal to what is now computed using imputed interest. The reason for this is, of course, that this approach considers the interest received by financial intermediaries to be a sale of goods and services, and, on the cost side, interest paid is included as an intermediate cost. Such a treat-ment leaves compensation of employees, taxes, capital consumption, and profits in gross product originating. This does not necessarily mean that the imputation for banking services should be abandoned; it does mean, however, that it is not required for measuring the gross product in financial institutions and should be justified on grounds similar to imputa-tions for such things as television, radio, and other media that are currently paid for largely by advertising expenditures but that do repre-sent a useful product to consumers.
Government Interest Payments
The final problem with respect to interest transactions hes in the handling of government interest payments. The exclusion of government

77 The United States National Income Accounts, 1947-1977
interest as payment for a productive service is an old and universal tradition in national income accounting. The original justifications were put forth in connection with the government war debt arising from World War I. It was felt that government debt incurred for a past war should not be considered output in later periods. The National Accounts Review Committee reviewed these arguments and generally supported them, but raised a question about the debts of state and local governments that have often been incurred for schools, sanitation systems, parks, roads, and public buildings. With respect to the U.S. national income accounts, it has also been argued that government durables are not considered to produce income, and, therefore, since there are no real capital services that provide income it would be inappropriate to count government interest.
Nevertheless, in a market economy it is appropriate to consider that services actually purchased represent output, even if they are in some sense wasted. Thus, one does not ask whether a government employee is really worth what he is paid; the fact that he is paid for a service is taken as an indication that the service exists. The difference between a transfer payment and the purchase of services rests on whether some service is performed, not whether the service is used. Thus, a pension paid to a soldier differs from current pay to a soldier in that no services are provided in the current period by the soldier receiving the pension whereas the current pay of the soldier represents services made available. Whether the services are in fact used is considered irrelevant.
From this point of view the holders of government bonds are providing services fully as much as if they had purchased corporate bonds, and government interest payments should be recorded as the purchase of such services. Since government debt is fungible, furthermore, it is not appropriate to distinguish between debt incurred for war purposes, for fiscal policy purposes, or the purchase of government durables. Those interested in measuring ''real production" or ''economic welfare" can impute any deduction they wish for what they consider to be the nonpro-ductive use of government interest—or for that matter any other nonpro-ductive use of resources.

Appendix B
Household Current Accounts and Balance Sheets, 1947-1980'
Wble l .A. l Household Current Income and Outlay Account ($Billions)
1947 1948 1949 l9.W 1951 1952 1953 1954 1955 1956 1957 1958 1959 1960 1%1 1962 1963
Wages and Salaries Received 121.5 133.8 133.1 145.1 168.8 182.7 1%.2 194.7 209.8 226.4 237.4 238.5 257.0 270.1 277.5 296.0 311.4 Enternrises 107.3 118.6 116.2 126.8 1448 155.1 167.5 165.2 li8.6 193.2 202.1 200.6 217.4 227.7 232.1 247.2 259.4 Governmen1 14.1 15.2 16.8 18.2 23.9 27.5 28.7 29.3 31.0 33.1 35.1 37.7 39.5 42.3 45.2 4R.7 51.8 k s ~ ol the Wurld 0.1 0.1 0.1 0.1 0.1 0.1 0.1 0.1 0.1 0.1 0.1 0.1 0.2 0.2 0,2 0.2 0.2
Interest Income 4.6 5.0 5.5 6.1 fi6 6.9 7.6 8.3 9.0 10.0 11.4 12.4 13.S 14.8 15.7 17.6 19.Y Proprjcmrs' Income 33.8 38.5 34.3 36.6 41.1 41.3 39.8 39.4 41.3 42.3 43.7 46.1 46.1 45.8 47.0 48.4 48.9 Rental Income 3.9 4.2 4.1 4.6 4.8 5.0 5.2 5.2 5.3 5.5 5.8 6.2 6.2 6.3 6.4 6.6 6.8 Dividends Received 6.2 6.9 7.1 8.6 8.3 8.3 8.6 8.9 10.0 10.7 1 1 . 1 10.8 11.7 12.4 12.8 13.8 15.0
Transfers Received 11.5 11.1 12.3 15.9 13.5 14.3 15.4 17.8 19.2 M.8 24.0 28.8 30.0 32.3 36.7 38.0 40.5 Enterprises 0.7 0.8 0.9 1.9 2.2 2.4 2.7 2.9 3.2 3.7 4.2 4.6 5.1 5.7 6.2 6.8 7.5
Pensions & welfare payments 0.3 0.4 0.4 1.4 1.6 1.8 2.0 2.2 2.4 2.7 3.1 3.5 3.8 4.2 4.7 5.3 5.8 Bad debt adjustment 0.3 0.5 0.5 0.5 0.6 0.6 0.7 0.8 0.8 0.9 1 . 1 1.2 1.3 1.5 1.5 1.5 1.7
Government 10.8 10.2 11.3 14.0 11.3 11.9 12.7 14.9 16.0 17.1 19.9 24.1 24.9 26.7 30.4 31.2 32.9 Social insuranoe payments 0.5 0.6 0.7 1.0 1.9 2.2 3.0 3.6 4.9 5.7 7.3 8.5 10.2 11.1 12.6 14.3 15.2 Other payments 10.3 9.7 10.7 13.1 9.5 9.7 9.7 11.2 11.1 11.5 12.5 15.6 14.7 15.5 17.8 16.9 17.7
HOUSEHOLD CURRENT INCOME (Marker 'I'ransactionsl 181.4 1W.S 196.4 116.Y 243.2 258.4 272.8 274.3 ZW.5 315.8 333.4 342.7 3h4.6 381.8 39h.l 420.7 442.J
Irnpulcd Gross Income 25.9 29.4 32.8 38.6 46.1 51.3 55.7 62.0 & , I 72.4 77.0 83.1 87.4 90.2 93.8 95.9 101.4 Owner-Occupied Gross Income 6.9 7.8 8.9 10.1 11.6 13.3 15.2 17.0 18.6 20.2 2 1 . Y 23.R 25.R 27.9 3ll.U 32.3 34.3
Capilsl cunsumptiun 2.6 3.0 3.1 3.5 4.0 4.3 4.5 4.8 5 .2 5.5 6.0 6.4 6.6 6.8 7.1 7.4 7.6 Net imputed rervices 4.3 4.8 5.8 6.6 7.6 9.0 10.7 12.2 13.4 14.7 15.9 17.4 19.2 21.1 22.9 24.9 26.7
Margins. Owner Built Houses 0.0 0.1 0.2 0.3 0.2 0.2 0.2 0.3 0.2 0.2 0.2 0.2 0.2 0.2 0.3 0.3 0.4 Durables Gross Income 17.3 19.7 22.3 26.9 32.9 36.5 39.1 43.7 46.4 51.1 54.1 58.3 60.7 61.5 62.9 62.8 66.2
Capital consumplion 11.5 13.1 14.4 16.0 18.6 20.5 22.4 24.7 26.4 29.4 31.6 33.3 35.1 36.1 37.3 38.2 39.6 Net imputed services 5.9 6.6 7.9 10.9 14.3 16.0 16.7 19.0 20.0 21.7 22.5 25.0 25.6 25.5 25.6 24.6 26.6
Farm Income in Kind 1.7 1.8 1.4 1.3 1.4 1.3 1.2 1.0 0.9 0.9 0.8 0.8 0.7 0.6 0.6 0.5 0.5
HousEnom GROSS CURRENT INCOME (Market and Non-Market) 207.4 228.9 229.2 255.5 289.3 N19.7 328.4 336.4 360.6 388.1 410.4 425.8 452.0 472.0 489.9 516.6 543.9

Current Consumption Expenditures Non-Durable Goods
Enterprises Rest of the world
Enterprises Rest oi the world
Services
Interest Payments
Tax Payments Income Taxcs Estate and Gift Taxes Property Taxes Other Tares and Non-Taxes
Personal Cunirib. for Sucial Ins.
'Transfers R i d Contributions to Non-Prfits Transfers to R.O.W. (net)
Capital Consumption Allowances Gross Saving
Owneruccupcd huuscs Durahle g d p .
Net Saviw
AND GROSS SAVING (Market Transactions)
Owner-Occupied Housing Margins. Owner Built Houses Durables Consumed Farm Income in Kind
HOUSEHOLD CURRENT OUTLAYS
Imputed Gross Outlays
120.1 84.7 84.5 0.2
35.4 34.8 0.6
2.2
22.7 19.3
1 .o 1.5 1 .o 2.1
3.1 3.1 0.7
30.6 14.1 2.6
1 1 . 5 16.6
181.4
25.9 6.9
17.3 1.7
0.0
129.6 90.6 90.3 0.3
39.0 38.3 0.7
2.8
22.4 18.6
1 .1 1.6 1 .1
2.2
4.0 3.4 0.7
38.5 16.1 3.0
13.1 22.4
199.5
29.4 7.8 0. I
19.7 1.8
132.4 91.7 91.3 0.4
40.7 39.9 0.8
3.3
20. I 16.1 0.9 I .8 1.3
2.2
4.0 3.5 0.5
34.4 17.5 3.1
14.4 16.8
1%.4
32.8 8.9 0.2
22.3 1.4
138.3 94.6 94.2 0.3
43.7 42.8 0.9
4.0
22.4 18.2 0.8 2.0 1.3
2.9
4.2 3.8 0.4
45. I 19.5 3.5
25.6 1h.n
216.9
38.6 10.1 0.3
26.9 1.3
149.7 102.9 102.3
0.6 46.8 45.8 0.9
4.6
30.9 26.3 0.9 2.2 1.5
3.4
4.7 4.3 0.4
49.8 22.6 4.0
18-35 27.3
243.2
46. I 11.6 0.2
32.9 I .4
157.8 108.3 107.5
0.8 49.5 48.4
I .o 5.3
36.2 31.1
1.1 2.5 I .6
3.8
5.2 4.8 0.4
50.1 24.8 4.3
211.5 25.3
258.4
51.3 13.3 0.2
36.5 1.3
165.2 112.3 111.2
1.1 52.8 51.7
I .2
6.3
38.0 32.3
1.1 2.8 1.7
4.0
5.7 5.2 0.5
53.7 26.9 4.5
22.4 26.8
272.8
55.7 15.2
39.1 1.2
0.2
170. I 114.8 113.7
1 . 1 55.3 54.0
1.3
7.0
35.2 29.2
I.? 3.0 1.9
4.6
5.8 5.3 0.s
51.6 29.5 4.8
24.7 22.1
274.3
62.0 17.0 0.3
43.7 I .0
179.5 119.0 117.9
1.1 60.5 59.0
1.5
8. I
38.5 31.8
1.3 3.4 2.0
5 , 2
6.2 5.8 0.4
57.0 31.6
5 .2 2h.4 25.4
294.5
66.1 18.6 0.:
46.4 0.9
187.5 124.3 123.2
1.1 63.2 61.6
I .6
9.4
43.3 35.4
1.6 3.9 2.3
5 . 8
6.8 il.3 0.5
62.9 34.9
3.5 29.4 28.1
315.8
72.4 20.2 0.2
51.1 0.9
1 9 . 6 131.3 130.2
1.1 68.3 66.6
1.7
10.4
46.4 37.7
1.8 4.3 2.7
6.7
7.1 6.7 0.5
63.2 37.6 6.0
31.6 25.5
333.4
77.0 21.9 0.2
54. I 0.8
203.4 136.3 135.2
1 .1 67. I 65.2
1.9
11.2
46.6 37.2 I .7 4.8 2.9
6.9
7.6 7.2 0.4
67.0 39.7 6.4
33.3 27.3
342.7
83.1 23.8 0.2
58.3 0.8
219.7 142.1 141.0
1 . 1 77.6 75.5 2. I
12.5
50.8 40.7
1.8 5.3 3.0
7.9
7.8 7.3 0.4
65.9 41.7 6.6
35.1 24.2
364.6
87.4 3 . 8
60.7 0.2
0.7
229. I 147. I 146.1
1.1 82.0 79.7
2.3
14.1
55.7 44.4
2.2 5.9 3.2
9.3
8.3 7.9 0.4
65.3 42.9 6.8
36. I 22.4
381.8
90.2 27.9 0.2
61.5 0.6
236.5 I5I.2 150.2
I .o 85.3 82.9
2.3
15.1
57.9 45.5 2.5 6.4 3.5
9.7
8.6 8.1 0.4
68.4 44.4 7.1
37.3 24.0
3%. 1
93.8
0.3 62.9 0.6
30.0
249.5 156.9 155.9
1 .o 92.6
2.6
16.4
63.2 49.7 2.6 7.0 3.9
10.3
9. I 8.b 0.5
72.1 45.6 7.4
3R.2 26.5
90.0
420.7
95.9 32.3 0.3
62.8 0.5
261.3 4 ~
162.5 161.5
I .o 98.9 %.O
2.8
18.1
67.3 52.6
2.9 7.7 4.2
11.8
9.5 8.9 0-h
74.4 47.2
7.6 39.6 27.2
442.5
101.4 34.3 0.4
66.2 0.5
HOUSEHOLD GROSS CURRENT OUTLAYS AND GROSS SAVlNG (Market and Non-Market) 207.4 228.9 229.2 255.5 289.3 309.7 328.4 336.4 360.6 388.1 410.4 425.8 452.0 472.0 489.9 516.6 543.9
'Appendix B reflects data that became available with the BEA benchmark revision of December 1980. Data from 1977 forward do not reflect July 1982 revisions.
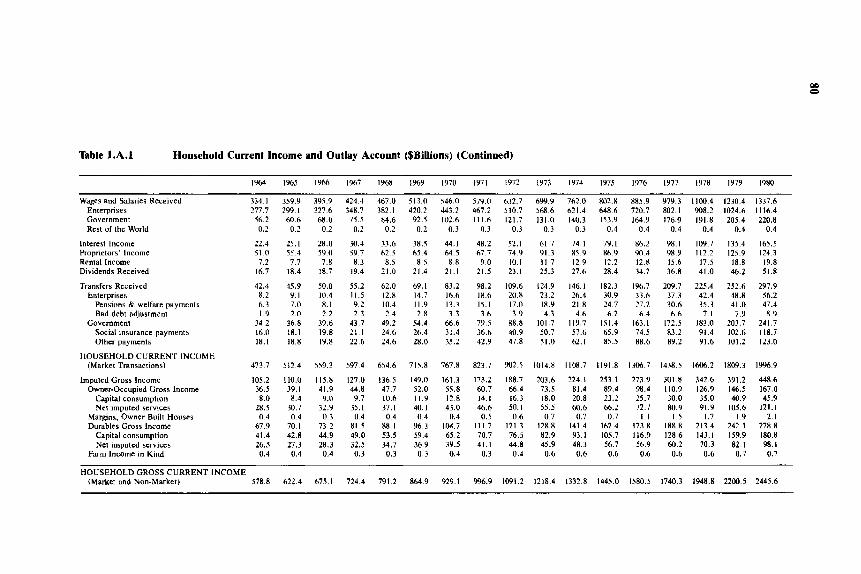
OD 0
Table 1.A.l Household Current income and Outlay Account ($Billions) (Continued)
1967
424.4 348.7 75.5 0.2
-
30.4 59.7 8.3
19.4
55.2 11.5
lY68
467.0 382.1
~
1Y71
57Y.O 467.2 1ll.h
0.3
48.2 h7.7 9.0
21.5
98.2
15.1 3.h
79,5 3b.h 42.9
-
18.6
I972
h32.7 510.7 121.7
0.3
52. I 74.9 10. I 23. I
109.6 20.8
3.9 8K.K
47.8
-
17.0
40.9
I978
1100.4 908.2 191.8
~
0.4
109.7 112.2 17.5 41 .n
225.4 42.4 35.3 7. I
91.4 91.6
183.0
1979 ~
1230.4
205.4 1024.h
0.4
135.4 125.9
18.8 4 . 2
252.6 48.8
IYW iY73 1Y74
6YY.Y 7h2.0 568.6 621.4
IW 1Y65 1Y66
Wwer and Salaries Keceived 734.1 359.9 39S.Y Enterprises 277.7 299.1 327.6 Government 56.2 M).h 68.0 Rcsl of Ihc Wurid 0.2 0.2 0.2
lnteresl Income 22.4 25.1 28.0 Proprietors' income 51 .O 55.4 59.0 Rental Income 7.2 7.7 7.8 Dividends Received 16.7 18.4 IR.7
Transfcrs Rcccivcd 42.4 45.9 50.0 Enterprises R.2 Y.1 10.4
Rnsiuns & wclfarc paymcnta 6.3 7.0 8.1 Bad debt adjustment 1.9 2.0 2.2
Govcrnmeni 34.2 36.8 39.6 Social insurance payments 16.0 I R . 1 19.8 Vlhcr paymcnls 18.1 18.8 19.8
HOUSEHOLD CURRENT INCVML (Market Transactions) 473.7 512.4 559.3
lmpulcd tirues lncumc 105.2 i10.0 115.8 Owner-Occupied Gross Income 36.5 39.1 41.9
Capital consumption 8.0 R.4 Y.U Nct impulcd scrviccs 28.5 30.7 32.9
Margins, Owner Ruilt Houses 0.4 0.4 0.3 Durables tiross Income 67.9 70.1 73.2
Capital consurnpiion 41.4 42.8 44.9 Net impulcd scrviccs 26.5 27.3 28.3
Farm Income in Kind 0.4 0.4 0.4
HOUSEHOLD GROSS CURRENT INCOME (Marker and Non-Market) 578.8 h22.4 h75.l
IY6Y
513.1)
92.5 420.2
0.2
38.5 h5.4 8.5
21.4
69.1 14.7
1Y70
546.0 443.2
IY75
R02.X 648.6 153.Y
0.4
79.1 8h.Y 12.2 2R.4
182.3 30.9
1'176 1977
885.9 979.3
1649 176.9 720.7 802.1
0.4 0.4
86.2 98.1 w1.4 w.9 12.8 15.6 34.7 3h.R
19fr.7 209.7 33.6 37.3 27.2 30.6 h.4 h.h
163.1 172.5 74.5 83.2 88.6 8Y.2
1337.6 1 116.4 220.8
0.4
165.5 124.3 19.8 51.8
297.9 56.2 47.4 8.Y
241.7 118.7 123.0
84.6 0.2
102.h 0.3
131.(1 140.3 0.3 0.3
33.6 h2.5 8.5
21.0
62.0 12.n
44.1 M.5 8.8
21.1
83.2 1h.h
61.7 74.1 91.3 85.9 11.7 12.9 25.3 27.h
124.9 146.1 23.2 26.4 18.9 21.8 4.3 4.h
101.7 11Y.7
51.0 62.1 50.7 57.6
9.2 2.3
43.7 21.1 22.6
10.4 11.9 2.4 2.R
49.2 54.4 24.6 26.4 24.6 28.0
13.3 3.3
24,7 h.2
41.0 7.9
66.6 31.4 3S.2
ISl.4 65.9 8S.S
597.4
127.0 44.8 9.7
35.1 0.4
81.5 49.0 32.5 0.3
654.6 715.8
136.5 14Y.I)
10.6 11.9 37.1 40.1 0.4 0.4
$8.1 Y6.3 53.5 59.4 34.7 36.Y 0.3 0.3
47.7 52.0
767.8
161.3 55.8 12.8 43.0
IW.7 65.2 3Y.5
0.4
0.4
823.7
173.2 60.7 14. I 46.6
111.7
41.1
0.5
70.7
0.3
w2.3 188.7 66.4 16.3 50. 1 0.6
121.3 76.5 44.8 0.4
1014.8 1108.7
203.6 224.1 7 3 3 81.4 18.0 20.8 SS.5 0 . 6
I2R.R 141.4
45.9 48.3 0.6 0.6
n 7 0.7
82.9 y3.1
1191.8
253.1 89.4 23.2 66.2
0.7 lh2.4 105.7 56.7 0.6
1306.7 1438.5
273.Y 301 .I 98.4 110.9 25.7 30.0 72.7 R0 .Y
1 .1 1.5 173.8 188.8 116.9 128.6 5h.Y MI.2 0.6 0.6
IM16.2
342.6
1809.3
3Y 1.2 146.5 40.9
105.6 1.9
242.1 159.9 R2. I 0.7
I%.Y
448.h 167.0 45.9
l 2 l . l 2. I
278.8 180.8 98. I 0.7
126.9 3S.O 91.9
I .7 213.4 143.1 70.3 0.6
1218.4 1332.8 1445.0 1580.5 1740.3 1948.8 2200.5 2445.6 724.4 791.2 RM.9 929.1 996.9 1091.2

Current Consumption Expenditures Non-Durable Goods
Enterpriser Rest of the world
Entcrpriwr Kert of the wuild
Services
Interest Payments
Tax Paymcnir Income Taxes Esraie and Gift Taxcs Property Taxes Other Taxes and Non-Taxes
Personal Contrib. for Social Ins.
Transfer.; Paid Contributions to Non-Profitc Transfers to R . 0 W. (net)
Gross Saving Capital Consumpiion Allowances
Owner-occupied houses Durable goods
Net Saving
HOUSEHOLD CURRENT OUTLAYS AND G m o s s SAVING (Market Transactions1
Owner-Occupied Housing Margins. Ouner Built House\ Durablec Consumed Farm Income in kind
lmpuied Gross Outlays
5? 276.2 293.1 316.2 124.4 349.9 186.3 418.0 443.6 473.5 521.4 n 6 . 2 628.5 688.4 749.2 829.4 935.3 1052.7 170.8 182.3 196.8 203.5 221.8 238,s 258.3 270.7 2x9 8 319.5 W.3 194 3 43.8 462.1 508.8 579.1 654.1 169.7 181.0 195.4 203.9 220 0 236.7 256.2 268.6 287 9 317.8 358.7 392 8 425.4 460.6 507.1 577.4 652.3
1.1 1.2 1.5 1.6 1.7 1.9 2.U 2.1 1.9 1.7 1 6 1 5 1 4 I.? 1.7 1.6 1.7 105.4 110.8 119.4 118.9 I:# 2 147.8 159.7 I72 9 187.6 201.9 215.9 234.2 261.6 287.1 320.6 3S6.? 398.6 102.4 107.5 115.8 114.7 124.0 143.1 154 3 t67.11 IX0.K IW.7 N7.7 225.4 252.2 276.8 W.2 343.6 384.5
3 . 0 3 , 3 3 h 4.2 4 .2 3.7 5.4 5.Y 6.8 7.3 t C . 1 8.8 9.4 10.3 11.4 12.6 14.2
20.2 2 . 3 24.1 15.4 27.7 31.0 33.4 36.6 41.3 47.6 53.4 56.8 63.6 75.0 90.4 107.9 125.6
66.2 73 2 83.6 92.2 lU8.6 1283 130? 1?2.6 1.58.l t69 I IP9 7 190.2 220.0 2 5 1 R 285.0 328 6 365.1 50.0 55.5 M.0 311.6 84.6 I01 5 lM.0 M.3 I20 2 128.6 147.0 143.6 168.3 193.6 225.0 2W.S 2M.O 3.3 3 6 3.9 4.0 4.1 4,h l.K 5 . R A S h h h T 6 4 7.2 9 3 7.2 7 6 8.8 8.3 9.0 9.8 10.8 12.2 13.6 1 . 3 16.8 18.0 19.3 20.4 22.2 24.1 26.2 27.2 27.7 27.8 4.6 5.1 5.9 6.7 7.6 8.8 10.2 11.7 1 3 2 14.6 16.1 17.9 20.4 22.7 25.6 28.8 32.6
12.6 13.3 17.8 20.6 12.9 26.2 17.9 30.7 34.4 42.6 47.9 50.4 55.5 61.1 69.6 80.6 87.9
10.2 10.7 1 1 . 1 12.2 If 3 11.2 I 3 , l 16.1 18.0 21.6 23.3 25 .1 27. M.2 33.6 37.3 41.1 9.5 10.0 10.6 11.3 12.5 13.3 14.0 15.0 16.9 20.4 22.3 24.2 26.6 29.3 32.8 36.5 39.9 0.6 0.7 0.7 0.9 0.6 0.9 1.1 1.1 I I 1.3 1.0 0.9 0.9 0.9 0.8 1.0 1.2
88.3 99.9 106.3 122.6 1 3 2 2 129? 143.2 164.1 133.1 212.5 218.2 240.8 31.6 271.2 38 .1 319.4 324.5 49.4 51.2 53.9 58.7 M.I 71.3 78.0 84.8 92.8 100.9 113.9 128.9 142.6 158.6 178.1 200.8 226.7
8.0 8.4 9.0 9.7 10.6 11.9 12.8 14.1 16.3 18.0 20.8 23.2 25.7 30.0 35.0 40.9 45.9 41.4 42.8 44.9 49.0 53.5 59.4 6 ? 2 70.7 76.5 82.9 93.1 105.7 116.9 128.6 143.1 159.9 180.8 38.8 48.6 5 2 . 5 63.9 68.1 58.2 65.1 79.? 80.3 111.6 104.3 111.9 109.0 11?.6 120.1 118.6 97.9
473.7 512.4 (59.3 597.4 654.6 71?.8 767 Y 323.7 902.: 1014.8 1108.7 11’3.8 1306.7 1438.5 1606.2 1809.3 1996.9
lo?.? 110.0 I 1 5 8 127.0 136.5 149.0 161 3 173.2 188 3 203.6 224.1 253 I 273.9 301.8 342.6 391.2 448.6 36 5 3Y I 41 Y 44.8 47.7 52.0 ?5.8 60.7 66.4 71 5 81.4 89.4 p8.4 110.9 126.9 146.5 167.0
67.9 70.1 73.1 81.5 88.1 %.3 I N 7 111.7 121 3 128.8 341.4 1624 173.8 188.8 213.4 242.1 278.8 0.4 0.4 0.4 0.3 0.3 0.3 0 4 0.3 0 4 0.6 0.6 0.6 0 6 0.6 0.6 0.7 0.7
0.4 0.4 0.3 0.4 0.4 0.4 0.4 0.5 0 6 n.7 0.7 0.7 1 . 1 1.5 1.7 1.9 2.1
HOUSEHOLD GROSS CURRENT OUTLAYS A N D GROSS SAVING [Markel and Non-Market) (78.8 622.4 675 I 724.4 791.2 xM.9 929.1 996.9 1091.2 1218 4 1332.8 1445 0 1580.5 1740.3 1948.8 2200.5 1445.6

Table L4.2 Household Sector Capital Accounts
Endof Cap. Reral- End of Cap. Reval- Endof Cap Reval- End of Cap. Reval- End of Cap. Reval- End of Year Tran5. iialion Year Trans. uation Year Trans. itation Year Trans. uation Year Trans. uation Year W u c Acct. A m Valuc A w l , Accl. h l u c A d . Accl. VdhC A c F ~ . AKI. Value Acct. Acct. Value
1% (IY4ii 1947 (1948) I91K (IY4Y) I Y4U ( 1 9 m 1950 (1951) 1951
REPRODUCIl3I.E ASSETS (net ciirrenf value) Residential Structures
Gruss Stock (book value) Plus: Revaluation Equals: Gross Stock (current) k s s : Capital Consump. (book)
Cap. Consumption Reval. Consumer Durables
Gross Stock (book value) Plus: Revaluation Equals: Gross Stock (current) L e s s : Capital Cullsump. (book)
Cap. Consumption Rcval. lnvenlories
LAND
FIXED CLAIM .‘rSSETS Depusiis
Currency & checkahle dep. Small liine & svgs. deposits Lnrge time deposits Money market fund shares
U .S. government securities Credit Market instrument^
Treasury issues Savings bonds Other treasury
Agency issues Stale and local obligations Corporate and foreign bonds Mortgages Open-markel paper
Sccunty Crcdil Other Fined Claims
180.7 19.2 16.2 W.0 7.2 15.0 66.1 9.8 -0.5 9 4 2 25.6 160.3 9.8 25.0 ;,.4 1 . 1 -0.3 47.9 1.5 10.4 55.0 9.0 1.8 83.3 20.4 - 6 . 4 J0.S 4.7 123.8 20.4 - 1.7 Jo.8 8.3 4.9
35.7 3.0 -0.6
12.2 2.3
11
2 8 . 0 3.1 1 .3
189.2 F,? 114.5 ?.O 5K.7 - 1.4 55.6 3.4 I1.I -tl.ll 0.0 0.0 67.5 3.3 50.6 1.8 50.5 1.8 45.2 2.1 6.4 -0.3 0.0 0.1 3.0 0.2 1.2 -0.1 12.6 1.3 0.1 0.0 I).? -11. I 6.5 0.4
216.1) 21,Y 5.9 112.2 9.5 7.7 75.4 12.5 -0.2 119.7 11.5 195.1 12.5 11.3 23.2 1.3 -0.3 59.8 1.7 3.9 65.7 9.8 0.9 97.3 22.9 -6.9 45.2 3.3 142.5 22.9 -3.6 44.3 9.8 - . I
38.2 2.6 -2.6
14.5 1.3
3 2 . 5 3.3 0.8
194.9 2.8 116.4 -0.5 57.3 - 2.7 59.0 2.2 i1.1 0.0 0.0 0.0 70.8 3.0 52.4 1.3 52.3 1.2 46.2 1.6 6.1 -0.4 0.1 0.1 3.2 0.5 1 . 1 0.0 14.0 1.0 0. I 0.1 11.7 -0.0 7.0 0.4
243.X 1‘1.3 129.3 8.4 87.7 11.5 L31.2 218.9 11.5 24.1 1.5 65.5 1.6 76.3 10.6 113.2 25.0 18.5 161.7 25.0 18.8 11.5 36.6 2.9 38.1 0.3
15,s
197.7 1.3
54.6 - 1.9 61.2 2.5 (1.1 0. I
73.8 2.2 53.7 1.3 53.5 1.3 K . 8 1.5 5.7 -0.1 0.2 -0.1 3.8 0.4
I 15.9 0.7
0.0 0.0
1 . 1 -0.2 15 .o 0.7
0 .7 0.0 0.1 0.0
7.4 0.4
5.4 -3.9 -0.4 - 7.6 -8.0 0.3
- 3.8 -0.5 -7.3 - 2.8 - 10. I -6.0 - 3.6 - 1.0
0.6
257.7 2X.2 I5.Y 133.8 12.9 11.4 98.8 16.4 -0.4 123.6 17.4 222.4 16.4 17.0 25.3 1.7 -0.4 63.4 1.8 5.9 86.5 14.8 ? ~ j
45.7 0.3 176.6 30.8 -9.4 54.3 13.5 -8 .2 3S.8 2.5 3.5 37.4 U.6 2.2
16.5 3.7
130.9 30.8 -9.7
m.1 6.n 116.6 4.7 52.7 2.4 63.7 2.3
0.2 0.11 0.0 0.0 76.0 0.7 55.0 -0.0 54.8 0.0 49.3 0.3 5.5 -0.3 0.2 -0.0 4.1 0.1 0.9 0.0
0.2 0.1 0.7 0.3 7.7 0.3
15.7 0.5
3 o . x 24.2 12.7 158.1 10.9 8.4 114.9 14.9 -0.3 140.9 11.9 255.8 14.9 11.5 26.6 1.9 -0.4 71.1 2.1 3.5 103.6 11.3 4.6 152.0 29.8 -9.6 44.0 4. I 198.0 29.8 -5.6 59.6 15.6 -8.4 34.9 3.0 . 1.8 40.2 2.0 -0.3
20.3 I .7
207.0 9.6 121.3 8.8 33.1 4.1 66.0 4.6 0.2 11.1
76.7 0.3 55.0 -0.7 54.8 -0.9 49.6 -0.5 5.3 -0.4 0.2 0.2 4.3 0.1 0.9 -0.0 16.2 0.9
t.0 -0.1 8.1 (1.6
0.0 0.0
0.3 0.1
338.7 177.5 129.4 152.8 282.3 28.2 76.6 119.4 172.2 50 I 222.3 649 36.0 41 9
22.0
216.7 130.1 59.2 70.6
0.0 77.0 54.2 53.9 49.1 4.8 0.3 4.4
17.1 0.4 0.9 8.h
0.3
0.9

EQUITIES HELD 357.8 3.9 21.1 382.7 7.0 4.3 394.0 3.1 S . 5 402.6 5.9 47.6 456.2 6.2 36.9 499.3 Corporate Siock 84.9 0.9 -2 .7 83.1 0.8 -1.7 82.2 0.6 7.1 89.9 0.5 19.3 109.8 1.6 17.1 128.4 Non-Cup. Nan-Farm Equity 125.6 0.6 15.6 141.8 1.3 7.9 151.0 0.2 -0 .6 150.6 2.0 11.5 IM.1 t.2 8.0 173.4 Farm Business Equity 79.8 -0.1 8.7 88.5 2.5 -1.8 89.1 -0.2 -2.0 86.9 0.9 13.8 101.5 1.0 8.5 1 1 1 . 1 Pension & Insur. (cash value) 35.1 2 . 3 0.0 37.4 2.4 -0.0 39.8 2.5 -0.0 42.3 2.5 0.0 44.8 2.4 -0.0 47.2
3.2 39.1 Estates and Trusts 32.5 -0.6 31.9 -0.1 31.8 1 . 1 32.9 3.0 35.9
TOIAI. MSETS 739 Y 28.7 19 h 808 2 31 7 11.4
FIXED CLAIM LIABILITIES Credit Market Instruments
Humc murlgagcs Consumer credit
Installment Other
Bank loans. n.e.c. Other loans
U.S. g&t. loans Policy loans
Securiiy Debt Other Fixed Claims
NET WORTH TangIbles Equities Net Financial Assets
37.4 8.0 34.5 8.3 21.6 4.7 10.8 3.7 4.4 2.7 6.3 1.0 0.2 -0.1 2.0 0.0 0.0 0.0 2.0 0.0 2.2 -0.4 0.7 0.1
702.5 20.7 192.9 19.2
151.8 -2.3 357.8 3.9
45.4 7.7 42.X 8.0 26.3 4.6 14.5 3.2 7.1 2.4 7.4 0.8 0.1 0.0 2.0 0.1 0.0 0.0 2.0 0. I 1.8 -0.3 0.8 0.1
39.6 762.7 23.9 11.1 18.5 230.5 21.9 7.1 21.1 382.7 7.0 4.3
149.4 -4.9
851.2 25.8 0.9
53.2 8.2 50.8 7.9 30.9 4.1 17.7 3.2 9.5 2.7 8.2 0.5 0.1 0.0 2.2 0.2 0.0 0.0 2.2 0.2 1.5 0 ~ 3 0.8 0.1
798.0 17.6 0.9 259.5 19.3 -4.6 394.0 3.1 5.5 144.5 -4.8
- 877.9 -
(i1.4 58.7 35.3 20.9 12.2 8.6 0.1 2.4 0.0 2.4 I .8 0.9
816.5 274.2 402.6 139.7
40.1
12.1 11.9 6.7 4.8 3.3 I .5 0.2 0.2 0.0 0.2 0.7 0. I
27.4 28.2 5.9
-6.7
67.3 w5.3
74.1 70.6 42.0 25.6 15.5 10. I 0.4
2 .6 0.0 2.6 2.5 1 .O
67.3 911.2 19.7 322.1 47.6 456.2
132.9
40,O 51.3
8.4 8.5 6 . h 1.6 0.7 0.9 0.0 0.2 0.0 0.:
-0. I 0.1
31.6 51.3 24.2 14 .4 6.2 36.9 I .2
1076.6
R2.5 79. I 48.6 27.3 16.2 11.0 0.4 2.8 0.0 2.8 2.4 1.1
994. I 360.7 499.3 134.1
-
TOTAL LIABILITIES & NET WORTH 739.9 28.7 39.6 808.2 31.7 11.4 851.2 2 S . S 0.9 877.9 40.1 6 i . 3 985.3 40.0 51.3 1076.6
Adden&: Net Snving [he!ance sheet1 20.7 27.Y 17.h 27.4 31.6
Net Saving ( c u m n t account) I(Xh 22.4 16.8 25.6 27.3
--
Capital Ciains Vividellria 0.0 0.0 1l.U (I. 1 0. I Residual Discrepancy 4.1 I .5 0.7 1.7 4.2

e Table 1.A.2 Household Sector Capital Accounts (Continued)
End of Cap. Reval- End of Cap. Reval- End of Cap Reval- End of Cap. Reval- End of Cap. Rev& End of Year Trans. uation Year Trans. uation Year Trans. uation Year Trans. uation Year Trans. uation Year Value Acct. Acct. Value Acct. hcct. Value Acct. Acct. Value Acct. Acct. Value Acct. Aut . Value 1951 (1952) 1952 (19S3) 1953 (1954) 1954 (1955) 1955 (1956) 1956
REPRODUCIBLE ASSETS (net current value1 Residential Structures
Gross Stock (book value) Plus: Rcualuation Equals: Gross Stock (current) Less: Capital Consump. (book)
Cap. Cunsumpliun Rcval. Consumer Vurables
tiross S t a k (buuk ualuc) Plus: Revaluation Equals: Gross Stwk 1currenll Less: Capital Consump. (book)
Cap. Consumption Reval. Inventories
LAND
FIXED CLAIM ASSETS Deposits
Currency & checkable dep. Small time & svgs. deposits Large time deposits Money market hrd shares
U S . government securities Crcdit Markcl Instmrncnts
Treasury issues Savings bonds Other treasury
Agency issues Stalc and local ubligdlions Corporate and Coreign bonds Murlgagcs Own-market papcr
Security Credit Other Fixed Claims
338.7 177.5 12Y .4 152.8 282.3 28.2 76.6
I IY.4 172.2 so. I
222.3 66.9 36.0 41.9
22.0
216.7 130.1 59.2 70.6 0.3 0.0
77.0 54.2 53.9 49.1 4.8 0.3 4.4 0.9
17. I 0.4 0.9 8.6
21.1 10.7 15.0
15.0 2.2 2.1 8.6
29. I
29. I 17.7 2.9 1 .7
14.6 9.8 2.0 7.7 0. I 0.0 4.3 2.1 2.1 0. I 2.0
- 0.1 1.3 0.3 0.6 0.0
-0.2 0.7
2.3 362.1 2.6 1W.8
-0.7 143.7 3.0 155.8 2.3 ZW.6
-0.4 M.0 0.1 78.8 0.8 E8.8
--.9.1 192.2 -3 .Y 46.2 13.1 238.3
-8.1 76.4 -5.7 33.1 - 1 . 1 42 -5
2.7 24.7
231.3 139.9 61.2 78.4 0.4 0 -0
81.3 Sh.3 56.0 49.2 6.9 0.3 5.6 1.2
17.7 0.' 0 . i 9.4
21.9 -0.9 383.0 I0.Y 0.2 201.Y 15.4 -U.5 158.h
- 1 0 154.8 15.4 - 1.5 313.4 2.4 -0.4 32.0 2 , l . . 1.4 79.5
10.1 -1.0 137.9 32.5 - 10.5 214.2
-12.5 33.7 32.5 - 23.0 247.9 19.8 -9.9 86.3 2.6 -12.1 23.6 0.8 -0.1 43.2
2.8 27.4
13.7 245.0 9.4 149.3 1.2 62.5 8.2 86.5
-0.0 0.3 0.0 0.0 3.8 85.1 I .6 57.9 I .8 57.8 0.2 49.4 1.6 8.4
-0.2 0. I 1.7 7.3
-0.7 (1.5 0.8 18.5 0 4 0.8
-0.0 0.7 0.5 9.9
19.7 0.3 403.0 12.4 2.8 117.1 17.2 -0.9 174.9
3.4 158.2 17.2 2.4 333.1 2.7 -0.4 34.3 2.1 0.1 81.7 7.1 -2.3 142.7
31.8 -11.0 23r.0 -9.9 23.8
31.8 - 20.8 2*b.Y 22.6 - 11.4 97.5 2.1 -7.1 18.7 0.2 -0.2 43.2
3.3 30.7
10.6 255.5 11.1 160.4
I .9 64.4 9. I 95.6 0.0 0.4 0.0 0.0 1.2 83.8
- 1.h 56.3 - 1.6 M.2
0.6 SO.0 2.2 6.2 0.0 0.1 I .7 Y.0
-2.3 - 1 . 8 0.9 19.4 0.0 0.9 0.3 I .0 0.4 10.3
28.7 2.8 434.4 15.2 5.4 237.7
7.1 165.3 20.4 6.2 359.7 3.0 -0.5 36.8 2.2 1.2 85.2
12.2 -3.0 151.9 38.6 - 16.0 257.7
-8.3 15.5 3R.h -24.3 273.2 25.1 -14.8 107.8
1.3 -6.5 13.4 1.3 0.3 44.8
20.4 -0.9 194.4
6.7 37.4
14.9 270.5 8.8 169.2 0.1 64.5 8.6 104.3
- 0.0 0.4 0.0 0.0 5.8 89.6 2. I 58.4 1 .s 51.7 0.3 50.2 I .3 7.5
2.8 11.8 -0.3 -2.1
I .o 20.5 0.2 1.1
-0.1 0.9 0.5 10.7
0.5 0.6
23.8 9.8 13.4 4.2 18.9 -0.8
5.2 18.9 4.4 3.3 -0.5 2.2 0.7 8.5 5.3
37.9 - 17.6 7.6
37.9 - lo .u 27.9 -16.8
1.5 1.4 1.9 0.3
6.6
18.9 11.4 2.0 9.4
-0.0 0.0 7.3 3.2 2.7
-0.1 2.8 0.5 I .4 1 .o I .6 0.0
- 0.0 0.3
468. I 25.5.3 212.5 170.5 383.0
39.6 88.0
165.8 277.9 23.1
101.1 118.9 16.3 46.9
44.0
289.4 180.5 66.5
113.7 0.3 0.0 96.9 61.6 w.5 50. I 10.3
1 . 1 13.2
- 1 . 1 22.0
1.2 0.9
11.0

EQUII'IP:S HI?I.I) 494.3 5.1 12.3 51h.h 4.S -7.3 513.R 5.1 73.1) 5Y2.6 3.4 59.7 hS5.R 4.Y 34.2 694.9 w Corpurnlc Slock 128.4 1.4 10.3 140.1 0.3 7.4 133.0 4.1 58.8 195.8 1.1 41.Y 238.8 1.2 14.0 254.0 vI Nun-Cow. Nun-Farm hquity 173.4 0.1 4.5 178.0 0.9 3.3 lS2.2 - 1 . 1 4.2 lR5.3 0.1 8.X 194.2 2.3 9.9 206.4 Farm tlusineis Equity I I1.I 0.8 -3.0 108.9 0.6 -2 .6 1Of.9 -0.0 1.3 108.2 -0.8 1.8 109.2 -1.6 8.8 116.4 Pension & Insur. (cash value) 47.2 2.7 0.0 49.9 2.8 0.0 52.7 2.9 0.0 55.5 2.9 0.1 58.6 3.0 0.0 61.6 Estates and Trusts 39. I 0.5 39.7 -0.6 39.1 8.7 47.8 7.2 55.0 1.5 56.5
TOTAL ASSETS 1076.6 40.8 17 2 1134.6 40.1 -5.4 1169.3 36.0 76.6 1281.9 47.0 69.2 1398.1 47.6 50.6 14%.4
FIXED CLAIM LIABILITIES Credit Market Instruments
Home mortgages Cvnrumcr credit
Installment Other
Bank loans. n.e.c. Other luans
L.S. goy-I. IOilllS
Pulicy luans Sccurily Dcht iithcr I;ixcd Claims
NEI' WOHIW Tangibles Equiiies Net Financial Assets
TOT.4L LIABILITIES & NET WOKTH
81.5 79.1 48.6 27.3 16.2 11.0 0.4 2.8 U.(I 2.8 2.4 1 . 1
w. 1 360.7 499.3 134. I
1076.6
12.0 11.7 6.2 5.3 4.3 I .o 0 1 0. I 0.0 0. I 0.2 0. I
28.8 17.2
5.1 12.3 2.7
21.1 5.0
40.8 17.2
94.5 90.8 54.8 32.6 20.5 12.1
2.9 11.0 2.Y 2.6 I . 2
IOJO. I 386.7 516.6 136.8
1134.6
0.5
12.6 1 2 . 1 7.6 4.2 3.8 0.4 0.0 0.1 0.0 0.2 0.5 0. I
27.4 - ? , 4 21.9 1.9 4.5 -7.3 I .o
40.1 -5.4
107.1 11.6 101.8 10.4 62.5 8.7 36.7 1.5 24.3 0.6 1 2 . 5 0.8 0.5 0.0 3.1 0.2 (1.0 0.0 3.1 0.2 1.1) 1.1 1.3 0.1
IOh2.2 24.4 76.6 410.5 19.7 3 . 6 513.8 5.7 73.0 137.8 1.0
1169.3 36.0 76.6
118.7 20.: 113.2 19.4 71.1 I?.? 38.2 7.2 24.9 5.4 13.3 1.8 O.? -0.: 3.4 0.2
3.4 0.2 4.1 0 . 7 1.3 0.1
(1.0 0.0
1163.2 2h.R w.2 433.7 18.7 9.' 592.6 3.4 59.7 136.8 - I . ?
131.9 47.0 h9.2
138 .9 132.6 83.3 45.3
15.1 0.3 3.6 0 . I 3.r 4.8 I 5
I ? ? Y . 2 471.9 655.8 131.6
1398.1
30.3
15.7 154.6 15.5 148.1 I I .2 94.5 3.9 49.3 2.9 33.2 I .o 16.1 0. I 0.4 0.3 3.9 0.0 0. 1 0.3 3.x
- 0.0 4.8 0.2 I .7
32.0 T(l.6 1341.X 23.8 16.4 512.1 4.9 34.2 694.9 3.2 134.8
47.6 50.5 149h.4
Addenda: Nel Saving (balance sheet) 28.8 27.4 24.4 26.8 3 2 . 0
Net Saving (current account) 25.3 26.8 22. I 25.4 28. I Capital Gains Dividends 0. I 0. I 0. I 0.2 0.3 Residual Discrepancy 3.4 0.5 2 . 2 1.2 3.6

m h Table l.A.2 Household Sector Capilal Accounts (Continued)
End of Cap. Reval- End of Cap. Reval- End of Cap Reval- End of Cap. Reval- End of Cap. R e d - Endof Year Trans. uation Year Trans. uation Year Trans. uation Year Trans. uation Year Trans. uation Year Value Acct. .4cct. Value Acct. Acct. Value Acct. r2cct. Value Acct. Acct. Value Acct. Acct. Value 1956 (19571 1957 (1958) 1958 (19591 1959 (19cX) I960 11961) 1961
REPRODUCIBLE ASSETS (net current value) Residential Structures
Gross Stock (book value) Plus: Revaluation Equals: Gross Stock (current) Lcss: Capital Consump. (book)
Cop. rnnsumption Keval. Consumer Durables
Gross Stock [book value) Plus: Rcvalunliun Equals: Gross Stock (current) Less: Capital Consump. (book)
Cap. Consumption Reval. Inventories
LAND
FIXED CLAlM ASSETS Deposits
Currency C checkable dep. Small Lime & svps. deposits Large time deposits Money marker fund shares
U.S. government securities Credit Market Instruments
Trcarury issues Savings bonds Olhm Ircasury
Agency i%<ues Slnlc and l w d ubligstions Corpwatc and foreign bonds
Open-market paper Mot7-5
Security Credit Other Fixed Claims
468.1 255.3 212.5 170.5 383.0 39.6 RR.0
165.8 277.9 23. I
301.1 1 I M . Y 16.3 46.9
44.0
289.4 180.5 66.5
113.7 0.3 0.0
96.9 61.6 60.5 50.1 10.3
1.1 13.2
-1.1 22.0
I .2 0.9
11.0
20.2 1.1 489.4 1 1 . 3 0.0 266.6 17.3 -0.6 229.2
-1.9 168.6 17.3 -? .5 397.8 3.6 -0.5 42.8 2.4 -2.0 KK .4 7.7 1.2 174.7
3Y.3 -19.3 2Y8.U 1.6 24.7
39.3 -17.7 3227 29.5 - 17.7 130.7
2.1 -1.2 17.2 I.? -0.1 48.1
4.6 58.6
17.3 306.7 11.1 191.7
-0 .8 65.8 11.9 125.6
-0.0 0.3 0.0 0.0 5.9 102.8 2.2 63.8 1.5 62.0
-1.9 48 2 3.4 13.8 0.7 1.8 1.0 14.2 0.6 - 0.4 2.0 24.0 0.1 1.3 0 .0 0.9 0.3 11.3
15.4 3.7 1 1 . 1 0.7 17.5 -0.6
- 1.2 17.5 -1.8 3.9 -0.5 2,s - 1.9 3.6 3.1
36.8 - 19.8 4.8
36.8 -14.9 31.0 - 18.2 2.3 0.2 0.7 -0 .2
6. I
17.1 15.9 2. I
13.8 0.0 0.0 0.7
-2.9 -2.3 - 0.5
~ 1.8 -0.6
0.7 0.6 2.4
-0. I 0.3 0.3
508.5 278.4 246.2 167.4 413.6 46.2
181.4 315.0 29.6
344.6 143.5 19.7
n9.o
48.7
54.7
323 .8 207.6 67.9
139.4 0.3 0.0
103.5 60.9 59.7 47.7 12.0
1.2 14.8 0.2
26.4 1 .1 I .2
11.6
24.4 I?.? 21.8
21.8 4.3 ?.? 7.3
42.4
42.4 32.5 2.6 I .9
23.2 14.0 2.8
11.3 - 0.0
0.0 9.0 5.0 3.3
- 1.u 5.0 1.7 2.7 0. I 2.0
-0 .8 -0.2
0.4
-0.5 0.3
-1.2 -0.8 -2.0 -0.6 -1.7 -0.9
-23 7
- I .? -25.4 -21.4 -3.2
0.1
9.8
532.4 293.9 266.8 166.6 433.4 49.8 89.7
187.9 333.7 27.9
361.6 154.7 19.1 50.7
64.5
347.0 221.6
70.6 150.7
0.3 0.0
112.4 65.9 62.9 45.Y 17.0 2 .Y 17.6 0.3
28.4 0.3 I I .o
12.0
21.5 12.8 19.6
19.6 4.6 2.2 7.0
43.1
43. I 34.0 2.1 I .7
20.3 13.6
I .6 11.6 0.4 0.0 6.1
-0.5 0.2
-0.3 0.4
-0.6 2.5
-0.2 2.6
7 2.0 0. I 0.5
-2.3 0. I
-1.3 -0.7 - 2.0
- 1.5 -2.5
4.9 - 30.6 -23.6 -4.5
0. I
2.6
-0.6
-2s.n
551.7 17.6 306.8 11.8 285.1 18.9 165.9 451.0 18.9 53.8 4.9 w.4 2.?
192.4 4.3 3.51.1 41.6 23.0
374.1 41.6 165.0 35.5 16.6 1.8 52.5 1.6
67.0
367.3 19.9 235.2 16.8 72.2 -1.4
162.3 17.8 0.7 0.4 0.0 0.0
118.5 2.6 65.4 0.7 63.1 0.9 45.6 0.8 17.4 0 , l 2.3 -0.2
20.1 0.3 0.1 -1.4
31.0 2.9 0.2 2.2 1.1 0.1
12.4 0.4
-2.3 -0.3 - 1 . 3 -1.6 -2.8 - 0.7 -1.9 - 1.7 - 27.6
-3 .1 -30.7 -25.7 -3.3 -0.3
5.4
567.0 318.3 302.7 164.3 467.0
58.1 W.6
195.0 365.1
19.9 384.9 174.8
15.1 53.7
72.4
387.2 251.9 70.8
180.1 1.1 0.0
121.2 66.1 64.0 46.4 17.6 2.1
20.3 - 1.4 34.0
1.2 12.9

EQUlTlES HELD 694.9 3.1 -28.7 669.3 12.0 113.8 797.1 1.0 42.1 840.2 1.1 5.6 846.9 7.7 110.9 %5.5 Corporate Stock 254.0 -0.7 -32.7 220.6 7.3 86.1 314.0 -1.3 23.7 336.1 -2.1 -5.0 329.3 3.4 87.5 420.2 Non-Corp. Non-Farm Equity 206.4 2 .0 0.7 209.1 2.0 6.2 217.2 1.4 6.0 224.7 1.3 6.6 232.6 2.4 3.9 238.8 Farm Business Equity 116.4 -0.9 8.2 123.8 -0.1 11.9 135.4 -2.4 5.3 138.3 -1.2 2.3 139.3 -1.3 5.7 143.7 Pension C Insur. (cash value) 61.6 2.6 -0.0 M.2 2.9 0.1 67.3 3.3 0.1 70.6 ?. I 0.0 73.7 3.3 0.1 7 . 2
13.6 85.5 Estates and Tmsts 56.5 -4.9 51.6 11.5 63.1 7.1 70.2 1.7 71.9
TOTAL ASSETS 14%.4 40.6 -23.0 1514.0 446 125.5 1684.1 48.6 51.3 1784.1 42.9 5,9 1832.8 45.3 114.0 1992.1
FIXED CLAlM LIABILITIES Credit Market Instruments
Home mortgages Consumer credit
Installment Other
Bank loans. n.e.c. Other loans
U.S. gov’t. loans Policy loans
Security Debt Other Fixed Claims
NET WORTH Tangibles Equities Net Financial Assets
TOTAL LlABILlTlES & NET WORTH
154.6 11.8
943 8.9 49.3 2.4 33.2 2,3 16.i 0.7 0.4 -0.2 3.9 0.5 0.1 0.1 3.8 0.4 4.8 -0.4 1.7 0.2
1341.8 28.8 512.1 20.2 694.9 3.1 134.8 5.5
14%.4 40.6
148.1 12.1 166.4 160.2 103.4 52.2 35.4 16.7 0.2 4.4 0.2 4.2 4.4 1.8
-23.0 1347.6 5.7 538.0
-28.7 669.3 140.3
-23.0 1514.0
12.2 10.9 9.5 0.5
-0.1 0.6 0.4 0.5 0.1 0.4 1.2 0.1
32.4 15.4 12.0 5.0
44.6
178.6 2 2 2 171.1 21.9 112.9 12.8 52.7 8.0 35.3 5.8 17.4 2.3 0.7 0.5 4.8 0.6 0.3 0.1 4.5 0.5 5. 0.0 2.0 0.2
125.5 1505.6 26.5 51.3 9.8 563.2 24.4 9.2
112.8 797.1 1.0 42.1 145.3 1.0
125.5 1684.1 48.6 51.3
200.7 193.D 1 3 . 7 60.7 41.1 19.6 1 .2 5.4 0.4 5.0 5.5 2.2
1583.3 5%.9 840.2 146.3
1784.1
16.9 16.9 11.7 4.4 3.9 0.4 0.0 0.8 0.2 0.7
-0.1 0.2
26.0 5.9 21.5 0.3
1.1 5.6 3.3
42.9 5.9
~
217.7 109.9 137.4 65.1 45.1 20.1
1.2 6.3 0.6 5.7 5.4 2.4
1615.2 618.7 846.9 149.6
I 832.8
~~ ~
17.2 15.7 12.2
2 .5 1.0 1.6 0.3 0.7 0.2 0.6 1.3 0.1
28. I 17.6 7.7 2.7
4s.3
234.9 225.6 149.6 67.6 46 .o 21.6
1.4 7.0 0.7 6.2 6.7 2.5
114.0 1757.2 3.1 639.4
110.9 %5.5 152.3
114.0 1992.1
Addenda: Net Saving M a n c e sheet) 28.8 32.4 26 .5 26.0 28. I
Net Saving (current account) 25.5 27.3 24.2 22.4 24.0 Capital Gains Dividends 0.3 0.3 0.4 0.4 0s Res idd Discrepancy 3.0 4.8 1.8 3.1 3.5
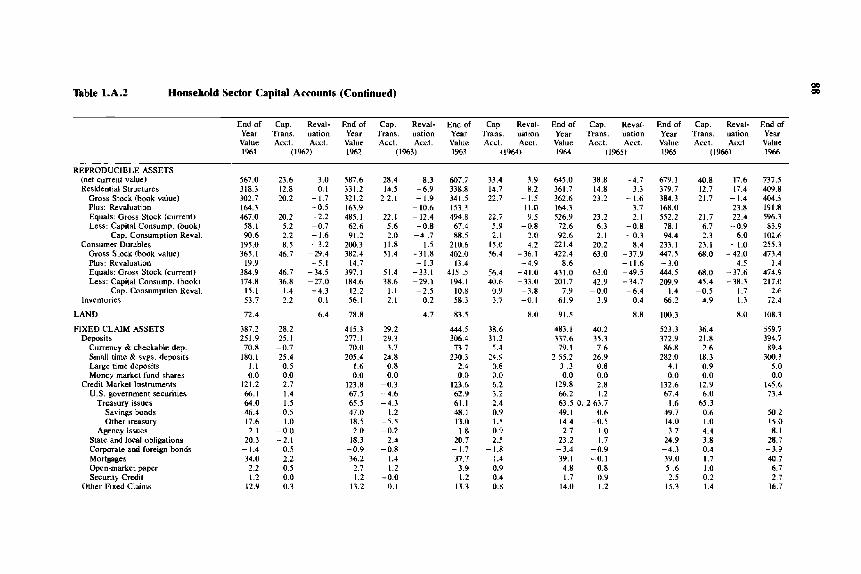
W Table l.A.2 Hwsehold Sector Capital Accounts (Continued) 0
Endof Cap. Reval- End of Cap. Reval- End of Cap Reual- End of Cap. Reval- End of Cap. ReVal- E d of Year Trans. uation Year Trans. uation Year Trans. ualion Year Trans. uation Year Trans. uation Year Valuc Accl. Accl. Valuc AccI. AccI. Value Accl. ACCL. Valuc Acct. Acct. Value Accl. AccI. Valuc 1961 (1962) 1962 (19633 1y63 {1964) 19M (196.5) 1965 11966) 1%
REPRODUCIBLE ASSETS (net current value) Residential Structures
Gross Stock (book value) Plus: Revaluation Equals: Gross Stock (current) Less: Capital Consump. (book)
Cap. Consumption R e d . Consumer Durabler
Gross Stock (book value) Plus: Revaluation Equds: Gross Stock (current) Less: Capital Consump. (book)
Cap Consumption Reval. Inventories
LAND
FIXED CLAM ASSETS Deposits
Currency & chcckablc dcp. Small time & sugs. deposits Largc time deposits Money market fund shares
US. government securities Credit Market Instruments
Treasury issues Savings bends Othtr ireasury
Agency issues Slate and local obligations Corp0r;lle a d Coreipn hond:. Mortgages Open-market paper Security Credit
Other Fixed Clainia
567.0 318.3 302.7 164.3 467.0 58.1 90.6
195.0 365.1
19.9 384.9 174.8 15.1 53.7
72.4
387.2 251.9 70.8 IK0.I
1.1 0.0
121.2 66. I 64.0 4 . 4 17.6 2.1
20.3 - 1.4 34.0 2.2 1.2
12.9
23.6 -3.0 12.8 0.1 20.2 - 1.7
-0.5 20.2 -2.2 5.2 -0.7 2.2 -1.6 8.5 -3.2
46.7 -29.4 -5.1
46.7 -34.5 36.8 -27.0
1.4 -4.3 2.2 0.1
6.4
28.2 25.1 -0.7 25.4 0.5 0.0 2.7 1.4 I .5 0.S 1.0
- 0.0 .-2.1
0.5 2.2 0.5 0.0 0.3
587.6 331.2 321.2 163.9 485.1 62.6 91.2
200.3 382.4
14.7 397.1 184.6
12.2 56.1
78.8
415.3 277.1 70.0
205.4 I .6 0.0
123.8 67.5 65.5 47.0 18.5
18.3 -0.9 36.2 2.7 1.2
13.2
2.0
28.4 -8.3 607.7 14.5 -6.9 338.8
22.1 -1.9 341.5 - 10.6 153.3
22.1 -12.4 494.8 5.6 -0.8 67.4 2.0 -4 .7 1 . 5
11.8 -1.5 210.6 51.4 -31.8 402.0
-1.3 13.4 51.4 -33.1 415 .5 38.6 -29.1 194.1
1.1 -2.5 10.8 2.1 0.2 58.3
4.7 83.5
29.2 444.5 29.3 306.4
3.7 73 7 24.8 2M.3 0.8 2.4 0.0 0.0
-0.3 123.6 -4.6 62.9 -4.3 61.1
1.2 48.1 -5.5 13.0 -0.2 1.8
2.4 20.7 -0.8 -1 7
1.4 37.7 I .2 3.9
-0.0 I .? 0.1 13.3
33.4 3.9 11.7 8.2 22.7 -1.'
11.0 22.7 4.5 5.9 -0.8 2.1 2.0
lS.0 -4.2 56.4 -36.1
-4.9 56.4 -41.0 40.6 -33.0 0.9 -3.8 3.7 -0.1
8.0
38.6 31.2
5.4 24.9 0.8 0.0 6.2 3.2 2.4
1.5 0.9 2.3
- 1.8 I .I 0.9 0.4 0.8
n.9
645.0 38.8 -4.7 361.7 14.8 3.3 362.6 23.2 -1.6 164.3 3.7 526.9 23.2 2.1 72.6 6.3 -0.8 92.6 2.1 -0.3
221.4 20.2 -8.4 422.4 63.0 -37.9
8.6 -11.6 431.0 63.0 -49.5 201.7 42.9 -34.7
7.9 -0.0 -6.4 61.9 3.9 0.4
91.5 8.8
483.1 40.2 337.6 35.3 79.1 7.6
2 SS.2 26.9 3 .3 0.8 0.0 0.0
129.8 2.8 66.2 1.2 63.5 0. 2 63.7 49.1 0.6 14.4 -0.5 2.7 1.0
23.2 1.7
39.1 -0 .1 4.8 0.8 1.7 0.9
14.0 1.2
-3.4 -0.9
679.1 379.7 384.3 168.0 552.2 78.1 94.4
233.1 447.5 -3.0 444.5 209.9
1.4 66.2
100.3
523.3 372.9 86.8
282.0 4.1 0.0
132.6 67.4
I .6 49.7 14.0 3.7
24.9 -4.3 39.0 5 .6 2.5
15.3
40.8 17.6 737.5 12.7 17.4 409.8 21.7 -1.4 404.5
23.8 191.8 21.7 22.4 5%.3
2.3 6.0 102.6 23.1 -1.0 255.3 68.0 -42.0 473.4
4.5 1.4 68.0 -37.6 474.9 45.4 -38.3 217.0
-0.5 1.7 2.6 4.9 1.3 72.4
8.9 108.3
36.4 559.7 21.8 394.7 2.6 89.4
18.3 w.3 0.9 5.0 0.0 0.0
12.9 145.6 6.0 73.4
65.3 0.6 50.2 1 .o l 5 , O 4.4 8. 1 3.8 28.7 0.4 -3.9 1.7 40.7 I .o 6.7 0.2 2.7 1.4 16.7
6.7 -0.9 83.9

EQUITIES HELD 965.5 -3 .3 -40.3 922.0 3 .1 90.4 1015.5 6.8 61.3 1083.7 7.2 91.4 1182.3 0.9 -30.0 1153.2 Corporate Stock 420.2 -7.8 -51.4 361.0 -2.4 65.2 423.8 2.2 42.0 468.1 V.8 €4.5 529.4 -5.5 -4Y.4 414.6 Non-Corp. Non-Farm Equity 238.8 2.1 5.6 246.5 3.4 1.5 251.4 2.6 7.3 261.3 3.4 7.5 272.3 4.2 12.3 288.8 Farm Business Equity 143.7 -1.1 6.0 148.6 -1.8 ?.S 154.3 -2.2 7.5 159.6 -1 .6 13.6 171.7 -2.4 9 .2 178.5 Rnsiun B Insur. (cash value) 17.2 3.6 -0.2 80.6 4.0 0.2 84.8 4.3 0.2 89.2 4.6 0.2 94.0 4.6 -0.2 9B.4 Estates and Trusts 85.5 -0.3 85.2 14.0 101.2 4.2 105.4 Y.5 115.0 -2.0 113.u
TQTAL ASSETS 1992.1 48.5 -36.9 2003.7 60.7 86.9 2151.2 78.8 73.2 2303.3 86.3 95.4 2485.0 78.0 -4.4 ZS58.6
FIXED CLAIM LIABILITIES 234.9 21.1 256.0 28.0 284.0 28.5 312.5 29.9 342.4 23.0 365.4 Credit Market Instruments 225.6 21.1 246.7 25.9 272.6 28.5 301.1 28.9 330.0 22.7 352.7
Home mortgages 149.6 14.1 163.7 16.2 179.9 17.5 197.4 17.0 214.4 14.2 228.5 Consumer credit 67.6 6.3 73.9 8.9 82.8 9.8 92.6 10.6 103.2 6.5 109.7
Installment 46.0 5.0 51.0 6.8 57.8 7.7 65.6 8.3 73.9 5.5 79.3 Other 21.6 1.3 22.9 2.1 25.0 2.0 27.0 2.3 29.3 1.1 30.4
Bank loans, n.e.c. 1.4 -0.1 1.3 0.1 1.4 0.5 2.0 0.5 2.5 0.0 2.5 Other loans 7.0 0.8 7.7 0.7 8.4 0.7 9.2 0.8 10.0 2.0 $1.9
1J.S. gov't. loans 0.7 0.2 1.0 0.2 1.2 0.2 1.4 0.2 1.6 0.5 2.1 Poky loans 6.2 0.5 6.8 O.? 7.2 0.5 7.8 0.6 8.3 1.5 9.8
Security Lkht 6.7 -,0.1 6.6 ?.D 8.6 -0.2 8.4 0.7 9.1 -0.1 9.0 Other Fixed Claims 2.5 0.2 2.7 0.2 2.9 0.2 3.0 0.3 3.3 0.4 3.7
NET womq 1757.2 27.4 -36.9 1747.7 32.6 R6.9 i8h7.2 S0.3 73.2 l'YJfl8 36.3 15.4 2142.6 35.0 --4.4 2193.2 Tangibles 639.4 23.6 3.4 666.4 3 . 4 -3.6 691.2 33.4 11.9 736.5 38.8 4.0 779.4 40.8 25.6 M5.7 Equities %5.5 -3.3 -40.3 922.0 3 .1 93.4 1015.5 6.8 61.3 1083.7 7.2 91.4 1182.3 0.9 -30.0 1153.2 ?lei Financial Assets 152.3 7.1 159.4 1.1 IM1.5 10.1 170.6 10.3 180.9 13.4 144.3
TOTAL I.IABII.ITIES & NET WORTH 19r2.1 d8.5 -.36.9 2003.7 W.7 M . 9 2151.2 78.8 73.2 2303.3 86.3 95.4 2415.0 71.0 -4.4 2S58.6
Addenda: Net Saving (balance sheet) 27.4 32.6 50.3 56.3 55.0 Net Saving (current account) 26.5 27.2 38.8 48.6 52.5 Capital Gains Dividends 0.5 0.5 0.6 0.9 1.3 Residual Discrepancy 0.4 5.0 10.9 6.8 1 .2

z Table 1.A.2 Household Sector Capital Accounts (Continued)
Endof Cap. Reval- End of Cap. Rcvd- F.ndol Cap Rcval End if Cap. Reval- Endot Cap. Keval- Endnf Year Trans. uation Year Yranr. uation Year 'Trans. uation Year 'Trans. uation Year Trans. uation Year Value Acct. Acct. Value Acct. Acct. Value Acct. Acct. Value Acct. Accl. Value Acct. Acct. Value I%fJ (1967) 1%7 I. 1968) 1968 ( 1969) 1969 t 1970) 1970 (1971) 1971
REPRODUCIBLE ASSETS (net current value) Residential Structures
Gross Stock (book value) Plus: Revaluation Equals: Gross Stock (current) Less: Capital Consump. (book)
Cap. Consumption Reval. Consumer Durables
Gross Stock (book value) Plus: Revaluation Equals: Gross Stock (current) Less: Capital Consump. (bouk)
Cap. Consumption Reval. Inventories
I.ANII
FIXED CLAIM ASSETS Deposits
Currency & checkable dep. Small time & svgs. deposits Large time deposits Money market fund shares
U.S. government securities Credit Market Instruments
Treasury issues Savings bonds Other treasury
Agency issues State and local obligations Corporate and foreign bonds Mortgages Opcn-market paper
Security Credit Other Fixed Claims
737.5 409.8 404.5 191.8 596.3
83.9 102.6 255.3 473.4
1.4 474.9 217.0
2.6 72.4
1m.3 559.7 394.7
300.3 5.0 0.0
145.6 73.4 65.3 50.2 15.0 8.1
28.7 -3.9 40.7 6.7 2.7
16.7
89.4
37.7 12.4 22. I
22. I 7. I 2.6
' 1 . 1 70. I
70.1 48.8 0.2 4.2
52.8 44.6 9.6
33.9 I .o 0.0 4.6 2.5 2.5 1.0 1.6
- 0.0 -2.5
2.1 1.5 0.9 2.2 1.4
13.6 788.7 9.6 431.8
-1.2 425.4 12.0 203.8 10.7 629.2 - 1.0 90.0
2.1 107.4 3.2 279.6
-41.4 502.1 10.8 12.2
-30.6 514.3 -37.9 227.9
4.1 6.9 0.7 77.3
8.0 Ilh.3
612.5 439.2
99.0 334.3
5.9 0.0
150.2 75.9 67.8 51.2 16.6 8.1
26.3 - 1.8 42.2 7.6 4.9
ix.1
49,l 36.6 16.2 34.9 26.8 - I . ?
49.2 26.8 47.6 7.5 -1.0 3.1 13.7
27.0 4.0 80.5 -42.3
12.3 80.5 -30.0 52.1 - 3 R . I
1 , 4 4.1 h.1) -2.3
17.3
59.1 41.7 10.7 26.8 4.2 0.0
13.8 6.1 5.3 0.6 4.6 0.8
- 2.5 5.3 2.4 2.5 2.1 1.5
874.4 1 2 . 9
4 50.5 3 3 .o 703.5 96.5
124.1 310.5 540.3 24.5
SM.8 241 9
12.4 81.1)
133.h
671.5 480.9 109.7 361 .O
10.2 0.0
161.0 82.0 73.1 51.9 21.3 8.9
3.5 4 4 6 10.1 7.0
I Y . 6
23.8
49.1 33.6 16.5 26.9 28.4 - 1.9
37.3 28.4 35.4 8.0 - 1 . 1 3.9 9.7
26.3 3.3 85.7 -46.9
11.4 85.7 -35 .4 56.9 -42.1 2.5 3.4 6.3 3.s
8.8
44.2 5.3
-4.5 15.6
-5.8 0.0
38.8 16.4 10.8
-0.1 10.9 5.6
11.7 3.2 2. I 5.3
.. 1.8 I .9
957.: 526.3 477.0 290.3 767.3 103.4 137.6 340.1 579.1 36.0
615.1 256.7
18.3 90.7
142.3
715.7 486.2 105.2 376.6
4.4 0.0
202.8 98.4 83.9 51.8 32.2 14.5 35.5 6.7
46.7 15.4 5.2
21.5
39.7 29.4 15.3 21.8 28.1 -2.3
30.4 28.1 28.1 8.6 - 1 . 1 4.2 7.4
20.0 8.2 85.2 -48.0
19.8 85.2 -28.2 61.4 -43.3
3 . 8 h 8 4.4 - 0 6
9.2
5 3.5 52.4 9.2
28.8 14.4 0.0
- 0.3 -5.2
-11.6 0.3
-11.9 6.4
- 1.6 9.1 1.4
-3.6 -0.9
2.3
1026.2 563.4 502.8 320.7
110.8 149.3 368.3 616.3
55.8 672.1 274.8
94.5
151.6
?69.2 538.6 114.4 405.4
18.8 0.0
202.5 93.3
72 .4 52. I 20.3 20.9 33.6 15.8 48.1 11.7 4.4
23.8
823.5
29.0
57.5 27.1 25.7 32.9 39.8 -3.1
47.4 39.8 44.3 9.2 - 1 . 1 4.9 12.5
26.6 -4.9 97.2 -51.5
-2.5 97.2 -54.0 65 3 45.0 s.4 -4.2 5.2 -0.9
6.2
71.1 78.9 12.2 65.4
1.3 0.0
- 10.2 -11.5 - 7.6
2.3 -9.9 - 3.9 -2.0
6.3 1 .0 3.8 0.5 L9
1110.9 622.0 5399. 368.1 907.6 118.9 166.7 390.0 662.1 53.2
715.3 291.2 30.2 I . B
15f.R
840.3 617.4 126.6 470.7 M. I 0.0
192.3 81.7 64.8 54.4 10.3 17.0 31.6 22.1 49.0 1.9 4.9
25.7

EQUlT1E.S HELD 1153.2 13.2 154.3 mn .6 9.3 161.6 1491.4 -6.6 Corporate Stock 474.6 7.9 123.3 605.7 3.7 121.9 731.3 - 11.5 NonCorp. Nan-Farm Equity 288.8 1 . 1 8.3 298.1 1.5 18.0 317.6 1.3 Farm Business Equity 178.5 -0.7 9.3 187.0 -0.5 9.4 195.9 - 1.5 Pension 8: Insur. [cash value) 98.4 4.9 0.2 103.5 4.6 0.3 108.4 4.9 Estates and Trusts 113.0 13.2 126.2 12.0 138.2
TOTAI. ASSETS mn.6 103.6 175.9 2838.1 117.4 215.4 3170.9 86.7
-70.8 1414.1
8.8 203.2 -0.3 113.n
-92.9 626.9 19.1 338.2
- 5 . 5 132.8
-28.4 3229.1
-0.9 13.0 1426.2 -6.7 150.9 1570 .5 \o
-0.4 18.1 35 .8 - 1 . 0 16.5 371.4 -0.5 5 . 5 208.2 -2 .1 17.9 224.1
-5.3 -13.3 608.3 -9.8 91.6 690.0
5.3 0.1 118.4 6.2 0.7 125.3 24.2 159.7 2.7 135.4
92.3 51.6 3373.2 122.0 184.3 3 m . 4
FIXED CL.(UM l , l ~ ~ R l t , l l ' I ~ S C r d l hhrkcl lnstrurncnts Home mortgages Consumer credit
Installment Other
Rank loans, n.e.c. Olhcr loans
U.S. gov't. loans Policy loans
Security Debt Other Fixed Claims
NET WORTH Tangibles Equities Net Financial Assets
TOTAL LlABILITlES 8r NET WORTH
165.4 352.7 228.5 109.7 79.3
2.5 11.9 2. I 9.8 9.0 3.7
2193.2 8 45.7
1153 .2 194.3
2558.6
30.4
24.1
12.4 5.7 3.8 1.9
1.3
20.1
0.7
0.3 1 .n
0.3 3.7
79.6 37.7 13.2 28.7
10 3.6
3~9.7
240 .~ 372.8
115.4 83.1 32.3
3.2 13.3 2.4
10.8 12.7 3.9
175.9 2448.6 21.6 905.0
223.0
175.9 2838.1
154.3 1320.6
35. I 31.8 l6.K 11.5 8.5 3 . 0 1.4 2.1
1.3 2.9
0.8
0.4
82.3 49. I 9.3
24.0
117.4
424.6 404.6 257.7 126.9 91.7 35.3 4.7
15.3 3.2
12.1 15.6 4.3
215.4 2146.4 53.9 1008.0
161.6 1491.4 247.0
w.3 33.4 11.6
9.5 1.3 1.0 3.0 0.4 2.6
- 3 . 4 0.4
56.3 49.1 -6.6 13.8
10.8
- 86.7
434.9
276.3 137.7 101.2 36.6 5.7
18.3 3.6
14.7
438.0
12.2 4.7
-28.4 2774.3 42.4 1099.5
260.8
-28.4 3229.2
-70.8 1414.1
22.6 23.9 14.1 5.4 4.4
1.8 2.h
I .n
0.3 2.3
- 1.8 0.4
69.7 39.7
-0.9 30.9
92.3
477.5 461.9 290.4 143. I
37.6 7.
2U.9 3.9
17.0 10.4 5.1
51.6 2895.7 38.6 1177.8
291.7
51.6 3373.2
105.5
13.0 1426.2
47.0 u.0 26.2 14.7 12.7 2.U 1.0 1.4 0.4 1 .o 2.7 0.3
75.0 57.5
-6.7 24. I
122.0
524.5
316.7 157.8 118.3 39.5 9.2
22.3 4.2
13.1 5.4
184.3 3154.9 33.3 1268.6
315.8
184.3 3679.4
506.0
18.0
150.9 1570.5
Addenda: Nci Saving (balancc rheei) 79.6 R2.3 56 3 69.7 iS.0 Ner Saving (current Account) 63.9 68. I 58.2 65.1 79.3 Capital Gains Dividends 1.7 2.5 2 s 0.9 0.8 Residual Discrepancy 14.0 11.8 - 4 . 4 3.7 -5 .1

s Table 1.A.2 Household Sector Capital Accounts (Continued)
~~ - ~ ~~~
End of Cap. Reval- E d of Cap. Reval- End of Cap Reval- End of Cap. Reval- Endof Cap. Reval- End of Year Trans. uation Year Trans. uation Year Trans. uation Year Trans. uation Year Trans. uation Year Value Acct. Acct. Value Acct. Acct. Value Acct . Acct. Value Acct. Acct. Value Acct. Acct. Valuc 1971 (1972) 1972 (1973) 1973 11474) 1974 (1975) 1975 ( 1976) 1976
REPRODUCIBLE ASSETS (net current value) Rcsidcntid Structures
Gross Stock (book value) Plus: Rcvalualioo Equals: Gross Stock (current) Less: Capital Consump. (hook)
Cap. Consumption Rcval. Consumer Durdbles Gross Stock (book value! Plus: Revaluation Equals: Gross SLock (current) Less: Capital Consump. Wok)
Cap. Consumption Reval. Inventories
LAND
FIXED CLAIM ASSETS Deposits
Currency & checkable dep. Small time & svgs deposits Large time deposits Money market fund shares
U.S. government wcurities Credit Msrkcl Inrlrurncnls
Trcasury issues Savings bonds Other treasury
Agency issues State and local obligations Corporate and foreign bonds Mortgages Open-market paper
Security Credit Other Fixed Claims
11 10.9 622.0 539.5 368. I 907.6 118.9 166.7 390.0 662.1
53.2 715.3 295.2 30.2 98.8
157.8
840,3 617.4 126.6 470.7 20.1 0.0
192.3 R1.7 64.8 54.4 10.3 17.0 31.6 22. I 49.0 7.9 4.9
25.7
75.4 43.1 1229.3 32.9 46.4 701 3 49 2 -3.9 583.8
66.9 435.0 49.2 63.0 1019.8
6,3 17.6 190.7 34.6 -3.3 421.3
111.1 -57.0 716.2 1.5 54.7
111.1 -55.5 770.9
I U . U - 1 . 1 m a
71.3 -49.6 316.9 5.2 -2.6 32.8 7.9 -0.0 106.7
26.0 183.8
99.6 939.9 85 9 703.3 12.4 138.9 67.3 538.0
6.2 26.3 0.0 0.0
1 1 . 1 203.4
3.6 M.4 3.3 17.7 0.4 l0,7
-2.7 14.3 1 . 1 32.7 4.4 26.5 6.3 55.3
- 1.7 6.2 0. I 5.0 2.5 28.2
I .o 81.7
84.8 33.8 51.8
51.8 10.9 7. I
40.4 123.3
123.3 77.4 5.6
10.6
114.0 77.9 14.5 37.7 25.8 0.0
33.Y 17.3 15.5 2.7
12.8 1.8 4.3
-0.2 3.3 9. I
-0.2 2.3
87.5 82.0 4.4
119.3 114.8 - 1.2 34.0 3.7
-59.9 14.6
-45.3 -51.9
2.9 1.8
34.8
1401.6 63.1 817.2 25.4 632.2 46.2 554.2
1186.4 46.2 137.5 11.8 231.7 9.0 465.4 28.4 779.7 121.5
849.0 121.5 342.3 83.2 41.3 9.9
119.1 9.3
218.5
69.3
103.9 10h.6 781.3 65.7 153.4 8.1 575.7 34.0 52.1 21.3 0.0 2.4
231.2 39.7 100.0 19.1 R3.9 14.8 w.4 3.0 23.5 11.8 16.1 4.6 37.0 9.3 26.3 3.1 58.6 3.7 15.3 4.2 4.9 - 1.0
30.6 2.1
127.0 R1.h 4.7
11R.C 113.3 - I 3 33.0 41.6
-61.4 81.9 20s
- 53.0 31.8 3.8
34.6
1591.7 57.4 924.1 22.1 673.7 45.3 672.?
134!.9 45.3 14.0 12.5
2 73.8 10.7 535 .4 26.5 839.8 132.2 151.2 990.9 13 2.2 372.5 89.5 83.0 16.2
132.1 8.8
253.1
1160.6 122.6 847.0 Y2.I 161.5 7.4 609.8 %.5 73,4 -13.0
2.4 1.3 277.0 26.1 119.4 15.9 98.7 16.9 63.3 4.0 35.4 12.9 20.7 - 1 . 1 46.3 4.7 29.4 6.2 62.4 3.8 19.5 -4 .4 3.9 0.6
32.7 3.8
74.8 54.9
-5.5 79.5 74.1 - 1.9 21 .o 23.1
-65.5 45.0
- 20.6 -55.9
12.2 -3.3
19.6
1723.8 1001.1 713.6 751.7
1465.3 158.7 305.5 585.0 906.4 1%. 1
1102.5 406.1 111.5 137.7
272.7
12 83.1 939.1 168.9 706.2 60.4
3.7 303.1 135.3 115.6 67.4 48.3 19.7 51.0 35.5 66.2 15.1 4.5
36.5
85.0 34.8 60.5
M.S 13.4 12.3 40.0
156.8
156.8 9 7 4 19.5 10.3
146.2 122.2 15.8
117.5 -1 1.0 - 0.0 17.0 8.8 4.5 4.7
-0. I 4.2
-1.5 5.7 7.1
-3.1 1.8 5.1
109.8 98.1 - 6.6 143.9 137.2 - 2.0 41.1 11.5
-75.4 25.3
-50.1 -62.7
1 .1 0.2
44.0
1918.7 1134.1 767.5 895.6
170.1 358.9 636.5 987.9 221.4
1209.2 440.7 132.0 148.2
316.7
1429.3 1w61.3 184.6 823.7 49.3 3.7
320. I 144.1 120.2 72.0
23.9 49.5 41.3 73.3 12.0 6.3
41.6
iM3.o
4n.2

EQUITIES HELD 1570.5 - 13.6 167.8 1724.7 -12.2 -42.0 1670.5 -2.2 -75.9 1592.4 10.6 237.8 1840.8 -9.5 235.0 2066.4 YI Corporate Stock 690.0 -14.9 70.8 745.9 -18.6 -159.0 568.3 -1.6 -164.5 402.3 6.1 126.0 534.4 -6.1 94.2 622.6 Non-Corp. Non-Farm Equity 371.4 -0.6 37.7 408.4 3.4 58.1 470.0 -0.4 78.3 547.8 -2.4 42.5 587.9 -3.2 M).I 644.7 Farm Business Equily 224.1 -4.6 34.8 254.3 -4.3 72.9 322.8 -6.9 39.9 355.8 1.8 45.9 399.9 -8 .8 52.1 443.2 Pension & Insur. (cash value) 125.3 6.6 1.0 132.9 7.4 -1.6 138.7 6.8 - 1.6 143.9 8.7 1.1 153.7 8.7 0.8 163.2 Estates and Trusts 159.7 23.4 183.1 -12.5 170.6 -28.0 142.6 22.2 164.9 27.9 192.8
TOTAL ASSETS 3679.4 161.4 236.9 4077.7 186.6 80.2 4344.5 167.6 85.7 4597.8 190.5 332.2 5120.5 221.7 388.9 5731.2
862.3 Credit Market Inslruments 506.0 63.4 569.4 79.2 648.7 50.0 698.7 48.3 747.0 89.7 836.7
Home mortgages 316.7 41.4 358.0 47.3 405.3 35.2 440.5 38.0 478.6 61.5 540.1 Consumer credit 157.8 19.8 177.6 26.0 203.7 9.9 213.6 9.6 223.2 25.4 248.6
193.8 Installment 118.3 14.9 133.2 21.9 155.1 9.5 164.6 7.7 Other 39.5 4.9 44.5 4.1 48.6 0.4 49.0 1.9 50.9 3.9 54.8
Bank loans, n.e.c. 9.2 0.9 10.1 3.4 13.5 1.6 15.1 -1.5 13.7 1.0 14.6 Other loans 22.3 1.3 23.6 2.6 26.2 3.2 29.4 2.2 31.5 1.8 33.4
U.S. gov't. loans 4.2 0.4 4.6 0.3 5.0 0.5 5.5 0.5 6.0 0.5 6.5 26.9 Policy loans 18.0 0.9 19.0 2.2 21.2 2.7 23.9 1.6
11.4 0.7 12.1 5.1 17.2 7.7 0.6 8.4
Security Debt 13.1 4.4 17.5 -4.3 13.2 - 1.8 Other Fixed Claims 5.4 0.5 6.0 0.4 6.4 0.7 7.1 0.7
NET WORTH 3154.9 93.0 236.9 3484.8 111.3 80.2 3676.3 118.7 8 5 . i 3880.7 140.8 332.2 4353.7 126.3 388.9 4868.9 Tangibles 1268.6 75.4 69.1 1413.1 84.8 122.3 1620.1 63.1 161.6 18448 57.4 94.4 1996.6 85.0 153.9 2235.5 Equities 1570.5 -13.6 167 .8 1724.7 -12.2 -42.0 1670.5 -2.2 -75.9 1592.4 10.6 237.8 1840.8 -9.5 235.0 2066.4 Net Financial Assets 315.8 31.2 347.0 38.7 385.7 57.7 443.4 72.9 516.3 50.7 567.0
TOTAL LIABILITZES 8: NET WORTH 3679.4 161.4 236.9 40 77.7 186.6 80.2 4344.5 167.6 83.7 J597.8 lW.5 332.2 5120.5 221.7 388.9 5731.2
Addenda: Net Saving (balance sheet) 93.0 111.3 118.1 140.8 126.3
Capital Gains Dividends I .4 0.9 0.5 0.2 0.5 Residual Discrepancy 11.3 - 1.2 13.9 28.7 16.8
766.8 95.5 FIXED CLAIM LIABILITIES 524.5 68.4 592.9 75.3 668.2 48.9 711.1 49.7
172.3 21.5
25.5 1.4
Net Saving (current account) 80.3 111.6 104.3 I 11.9 109.0

P Table 1.A.2 Household Sector Capital Accounts (Continued)
End of Cap. Reval- Endof Cap. Reval- Endof Cap Reval- End of Cap. Reval- Endof Year Trans. uation Year Trans. uation Year Trans. uation Year Trans. uation Year Value Acct. Acct. Value Accr. Acct. Value Acct. Acct. Value Acct. Acct. Value 1976 (1977) 1977 ( 1978) 1978 (1979) 1979 (1980) 1980
REPRODUCIBLE ASSETS (net current value) Residential Structures
Gross Stock (buok vdluc) Plus: Revaluation Equals: Gross Stock (current) Less: Capital Consump. (book)
Cap. Consumption Reval Consumer Durabks Gross Stock (book valuc) Plus: Kevuluution Equals: Gross Stock (currcnt) Less: Capital Consump. (book)
Cap. Consumption Reval. Inventories
LAND
FIXED CLAIM ASSETS Deposits
Currency & checkable dep. Small time & w g s . deposits Large time deposits Money market fund shares
US. government securities Credit Market Instruments
Treasury issues Savings bonds Other treasury
Agcncy issues State and local obligations Corpomte and foreign honds Mortgages Open-market paper
Security Credit Other Fixed Claims
1918.7 1134.1 767.5 845.6
1663.0 170. I 3S8.9 636.5 987.9 221.4
1209.2 440.7 132.0 148.2
316.7
1429.3 1061.3 184.6 823.7 49.3 3.7
320. I 144.1 120.2 72.0 48.2 23.9 49.5 41.3 73.3 12.0 6.3
41.6
112.6 151.2 2182.5 50.6 136.0 13M.6 80.6 -8.5 839.
2W.3 1095.8 80.6 191.8 1935.4 14.6 -2.2 182.5 15.4 58.0 432.2 50.2 15.6 702.3
178.8 -M.4 1M2.3 32.8 254.2
178.8 -51.6 1336.5 107.1 -69.8 478.U 21.5 2.7 156.3 11.8 -0.4 159.6
42.0 358.8
158.7 1588.1 127.6 I189.0 20.6 205.2 94.4 918.0 12.5 61.9 0.2 3.9
25.6 345.7 14.1 158.1 9.2 129.4
4.4 52.6 4.9 28.11
-3.6 45.9 -5.0 36.3 10.4 03.6 9.7 21.7
- 1.0 5.3 6.4 48.0
4.7 76.8
129.7 237.8 2550.0 S8.0 207.1 lS85.7 93.0 -10.6 921.9
1M.O 1401.8 93.0 295.4 2323.8 16.0 -2.4 19h.l 19.0 W.7 541.9 56.3 28.8 787.4
199.3 -89.8 1191.8 53.5 307.7
199.3 -36.4 1499.4 117.5 -73.6 521.9 25.6 8.4 190.2 15.4 1.8 176.9
79.9 438.7
189.4 1777.5 128.9 1317.9 22.3 227.5 63.2 981.3 36.4 98.3 6.9 10.8
51 8 397.0 25.3 183.4 17.7 147.0 3.9 80.7
13.8 66.4 7.6 36.4 1.7 47.6
-2.5 33.9 11 .1 94.7 lb.3 38.0 2.6 7.9 6. I 54. I
125.2 161.1 2836 .3 55.9 129.5 1771.1 9h.8 - 12.4 IWtr.4
192.? I F % , ? %.8 180.3 2600.8 17.5 -2.7 211.0 23.4 53.5 618.8 52.4 34.6 874.4
212.3 -W.7 lf07.4 M.0 371.7
212.3 -32.7 1679.V
31.2 10.4 231.8 16.9 -2.9 190.8
51.8 490.5
210.8 1988.3 133.7 1451.6 22.8 250.3 60.9 1042.2 15.6 113.9 34.4 45.2 69.9 4 7 . 4 44.0 227.4 22.8 169.8
-0.8 79.9
21.2 57.6 1.9 49.5 4.8 38.7
11.6 1M.4 7.5 45.4 0.6 8.5 6.6 60.7
128.7 -77.7 5 x . a
23.6 89.9
83.1 256.8 3176.3 37.2 1S8.S 1966.8 83.1 -10.9 1078.6
232.2 1826.7 83.1 221.3 2905.3 19.0 -2.9 227.1 26.9 658 711.5 31.1 89.7 995.1
211.9 -103.7 1415.5 162.7 534.3
211.9 59.0 I9 49.9 140.2 -84.4 628 .6 40.6 53.7 326.1 14.9 8.7 214.4
92.8 583.3
205.4 2193.6 175.0 1626.6
15.3 265.6 80.4 1122.7 50.0 163.9 29.2 74.4 19.2 486.6 15.s 242.9 5.8 175.6
-7.3 72.5 13.1 103.1 9.7 67.3 1.8 51.3 1.7 40.4 7,s 113.9
-7.3 38. I 4.1 12.6 7. I 67.8

EQUlTlES HRLU 2066.4 3.9 W.2 2160.5 4.5 2349 23y9.9 -10.0 376.2 2766.0 - 5 . 1 520.1 3281.1 Corporate Stock 622.6 -0.1 -31.7 590.8 1.1 26.4 618.3 -13.7 141.3 745.9 -1.5 250.6 995.1 Non-Corp. Non-Farm Equity 644.7 -0.2 87.3 731.8 2.7 122.9 857.4 3.7 112.4 973.5 -1.7 147.7 1119.6 Farm Business Equity 443.2 -7.6 38.4 474.0 -11.5 80.5 543.1 -12.5 86.4 616.9 -14.4 68.8 671.4 Pension & Insur. (cash value) 163.2 11.7 -0.7 174.3 12.2 0.2 186.7 12.5 0.7 199.9 12.4 2.5 214.8 Estates and Trusts 192.8 -3.2 189.6 4.8 194.4 35.4 229.8 50.5 280.3
TOTAL ASSETS 5731.2 275.3 283.4 6289.8 323.6 552.6 7166.0 326.0 589.1 8081.1 283.4 869.7 9234.2
FIXED CLAIM LIABILITIES 862.3 Credit Market Instruments 836 .7
Home mortgages 540. I Consumer credit 248.6
lnstallment 193.8 Other 54.8 3.
Bank loans, n.e.c. 14.6 Other loans 33.4
U S gov't. loans 6.5 Policy loans 26.9
Security Debt 17.2 Olhcr Fixed Claims 8.4
NET WORTH 4868.9 Tangibles 2235.5 Equities 2066.4 Net Financial Assets 567.0
5731.2 TOTAL LlABlLlTlES & NET WORTH
140.5 138.3 93.0 40.2
3 6.4 7 58.6
2.8 2.3 0.6 I .7 1.3 0.9
134.8 112.6
3.9 18.2
275.3
283
1002.8 975.0 633.1 288.8 230.2
5.7 17.4 35.7 7. I
28.6 18.5 9.3
.4 5287.0 193.2 2541.3 90.2 2160.5
585.3
163.9 161.5 107.6 47.6 41.9 M.3 2.5
1.2 2.b 1.3 1.1
159.8 129.1
4.5 25.6
3.8
323.6
1166.6 1136.5 740.6 336.4 272.1
7.1 19.9 39.5 8.3
31.2 19.8 10.3
552.6 5999.3 317.7 2988.6 234.9 2399.9
610.8
5 52.6 7166.0
169.6 169.5 115.9 46.3 39.2 71.3 0.9 6.4 1.7 4.7
- 1.2 1.3
156.4 125.2 - 10.0
41.2
326.0
1336.3 1305.9 856.5 382.7 311.4
0.9 20.8 45.9 10.0 35.9 18.6 11.7
589.1 6744.9 213.0 3326.8 316.2 2766.0
652.0
589.1 W81.L
104.3 103.1 83.8
2.3 1.4
72.2 8.0 8.9 2.2 6.7 5.0 I .?
174.1 83.1
-5.1 %.O
283.4
1445.6 1409.0 940.4 385.0 312.8
28.8 54.8 12.2 42.6 23.7 12.9
869.7 77~8 .6 349.6 3759.5 520.1 3281.1
748.0
869.7 9234.2
Addenda: Net Saving (balance sheet) 134.8 159.8 156.4 174.1
Capital Gains Dividends 0.6 0.7 0.9 1.7 Net Saving (current account) 112.6 120.1 118.6 97.9
Residual Discrepancy 21.5 39.0 3 6.9 74.5

96 Richard Ruggles
Reference Carson, Carol S. 1975. "The History of the United States National
Income and Product Accounts." Review of Income and Wealth, ser. 21, no. 2 (June).
Comment Helen Stone Tice
Richard Ruggles's paper consists of three major parts. The first is a history of the United States national income and product accounts (NIPAs) including the various reviews of them since 1947. The second is a discussion of certain avenues of future development of the accounts now being explored at the Bureau of Economic Analysis (BEA) and else-where. The last, placed in an Appendix, is a discussion of Ruggles's '^transactor approach" to the recording of entries in the accounts as it appHes to the treatment of interest and of financial institutions. I shall discuss the paper's treatment of each of these and then mention a few topics to which I wish more attention had been devoted.
Since their introduction in 1947, in what is essentially their present form, the national income and product accounts have undergone four major revisions (1954, 1958, 1965, and 1976); they have produced one major methodological study in 1954 and several minor ones accompany-ing the various benchmark revisions; and they have been subjected to formal critical reviews on five occasions (National Accounts Review Committee in 1957, the Conference on Research in Income and Wealth in 1955 and 1971, the Creamer Committee in 1977, and the views sohcited on the occasion of the fiftieth anniversary of the Survey of Current Business in 1971). Ruggles covers all of these with the exception of the Creamer Report; perhaps the latter is too empirical for the sort of systems approach that is clearly the author's intent, and in any case there will be more on this elsewhere in this volume. In addition, there is a brief discussion of the "new" United Nations System of National Accounts (SNA) about which the United States has had reservations since its inception, or at least since its last revision. These developments are discussed fairly and adequately. The author's intent in this section seems to have been to demonstrate, first, that the accounts have changed Httle since 1947 in any fundamental way; second, that other forms of national economic accounts have been integrated with the NIPA as time has passed; and third, that BEA and its predecessor agencies have acted
Helen Stone Tice is an economist with the Bureau of Economic Analysis. The views expressed are those of the author and do not necessarily reflect the opinions of
the Bureau of Economic Analysis or of any other members of its staff.
97 The United States National Income Accounts, 1947-1977
responsibly to take account of the suggestions for improvement in the estimates and in their presentation which have been made over the years. By and large it is a more compact treatment of this piece of history than are others covering the same events and, as such, should be useful to those wishing an overview of the accounts and their development.
The subheads under the section ''Directions for Future Development" reflect many of the themes which have characterized Ruggles's work in the national accounts over the last two decades. One is a concern with presenting a tidy summary system of accounts as an organizing device for the supporting tables; the summary accounts should highlight important aggregates, be few in number, and be fully articulated. A second is an interest in integrated systems of accounts with easy interfaces between the NIPA and other accounting presentations with which no formal integration has taken place. A third is a concern with the use of microdata sets and their integration into the accounting framework. A final consid-eration is the usefulness of the accounting system and its way of organiz-ing data for policy analysis and decision making. Most of these themes have recurred since the days of Ruggles and Ruggles's National Income Accounts and Income Analysis which introduced a generation of students to the accounts and what could be done with them. They appeared in The Design of Economic Accounts and in the paper given at the 1971 Prince-ton Conference of this organization. Ruggles's formal proposals in the current paper are four in number, but the amplification of the last of these in an Appendix is so extensive as almost to constitute a fifth topic.
The first proposal which Ruggles makes has to do with sectoring. He enunciates two bases for sectoring, namely, the behavioral and decision-making processes underlying the sector's activity, and the types and sources of information available about the transactors to be included there. Hence he purifies the household sector by removing the nonprofit institutions, thereby making the sector conceptually at least a consolida-tion of the microdata set underlying the work on the income-size distribu-tion. Abandoning his position of 25 years ago when he successfully urged the elimination of the enterprise sector, he reintroduces it and puts the orphaned nonprofit institutions into it. He also recognizes that the enter-prise sector will need some further subsectoring if it is to be really usable, Once again, all the data necessary for this redefinition were taken from the existing NIPA.
The second modification which Ruggles proposes has to do with the accommodation of estimates of the value of nonmarket activity and imputations. Ruggles proposes separating the market flows from the imputed ones, again illustrating the proposal with the household sector and again using existing BE A estimates.
The third section of the paper is a discussion of what he calls the transactor approach to the recording of transactions. By this he means

98 Richard Ruggles
that the income flows should appear in NIP A as they would appear in the accounts, of, or be viewed by, the parties actually involved in the transac-tion. The specific modifications occasioned by the adoption of the trans-actor approach consist of the transfer of employer contributions for health and welfare from other labor income to business consumption, the transfer of government health benefits from personal to public consump-tion, the inclusion of mortgage interest and property tax payments by owner occupiers, and the grossing up of insurance and pension pre-miums, with benefits entering as current or capital transfers. It has been the case for many financial institutions that output is low in the current system because of the netting involved in its measurement. In order to achieve the present BE A definition of income, insurance benefits are netted against premiums, and employer contributions to uninsured pen-sion funds become a component of other labor income, while the benefits paid current retirees go unrecorded. In the business sector of the Ruggles system, value added would be shifted from the nonfinancial to the finan-cial sector, and, in addition, the fact that households no longer offset benefits against their purchases from the finance and insurance sector would increase personal consumption expenditures (PCE) and hence output. In the case of interest, Ruggles proposes that the present group of enterprises treat interest paid as an intermediate purchase and interest received as income; the treatment parallels the current treatment of rent. Continuing this analogy, he creates an interest industry to collect and distribute the interest paid outside the enterprise sector. Interest paid on both consumer and government debt are, I believe, to be considered current purchases of goods and services in Ruggles's system.
The redefined household current account shown in Exhibit 4 differs from the present personal account as a result of the principles already discussed. It now includes the owner occupancy of dwelUngs, which is no longer an enterprise; it capitalizes consumer durables expenditures; it has nonprofit institutions deconsohdated and removed; it has the distinction between market and imputed transactions made more explicitly; and it embodies the transactor approach with respect to interest, pensions, and insurance. Ruggles's final proposal is the integration of financial transac-tion accounts and balance sheets with the NIP A. Here he demonstrates, using the household sector as an example, that by judicious recombina-tion of data from the NIPA and the Federal Reserve Board's (FRB) flow-of-funds accounts one can produce a balance sheet with current account net saving being matched, apart from a statistical discrepancy, by that portion of the change in net worth due to transactions. The remain-der of the change in net worth is, of course, due to revaluations. Rather than the proliferation of accounts for each sector recommended by international standards, he has only two accounts: a modified current account and the capital account. As I said, an example is given of these accounts for the household sector.

99 The United States National Income Accounts, 1947-1977
Several comments are in order here. First, I generally agree with the thrust of Ruggles's directions for the development of the accounts. How-ever, it would be nice to see the whole scheme worked out in detail, as I trust we shall in due course, before deciding that it represents an un-alloyed blessing. It is entirely possible that the modifications which work so nicely for the household sector will create difficulties elsewhere in the accounts. I am thinking particularly of the new enterprise account with its nonprofit sector, but the proposed treatment of pension funds and other intermediaries may present problems as well. Aside from these doubts, the household sector and the enterprise subsectors I find to be tremendously appeahng. The existing personal sector is a repository for all manner of income and private final consumption items, with many internal transactions among the transactors which it contains consoU-dated out; it is often used, however, as though it did contain only households. The Ruggles households are true households, and this pre-sentation will be much more useful, I think. On the other hand, there is to be a price in terms of the reintroduced enterprise sector whose usefulness is diluted because it now has nonprofit institutions. The accounts, Hke the nation, need an attic; perhaps we should bite the bullet and create a ''junque" sector for things that must be in but do not quite fit anywhere else and do not have as complete a data base to support them. The flow of funds has long had such a transactions category, and it may be time for the NIP A to resort to such a device. To some extent, this will be taken care of by subsectoring, but if the enterprise sector is worth having at all it should be cleaner than it appears it will be in this system.
Second, I thoroughly applaud the emphasis on balance sheets and capital accounts. It has long seemed to me that our thinking about a number of issues—housing, energy, other natural resources, and other aspects of the environment, to name a few—would be much improved if the official statistics on the performance of the economy focused on other concepts in addition to the measure of current production that has served us so long and so well. If the household accounts presented are any indication of what is planned for the rest of the sectors, then, while the Ruggles system may not suffice for the sorts of financial analyses that one may be accustomed to carrying out using the flow of funds, this presenta-tion could indeed make accessible to the NIPA user with Httle or no experience with financial flows and their analysis a set of information which he might otherwise ignore. The table shown in Exhibit 5 is a bit hard to follow, however, since it is not really self-explanatory, and the text does not offer much guidance here.
Third, while the simpHcity of the two accounts per sector system is certainly appealing, it is not, as I have observed, a real substitute for the more detailed flow of funds presentation; the adjustments to the tangibles and the reconciliation between saving from the current account and the change in net worth seem murkier than they perhaps need to be.̂ The

100 Richard Ruggles
presentation, while useful pedagogically, is not terribly compact in rela-tion to the amount of information which must be presented in the busi-ness of being a statistical office, and it does not really highlight either outside the context of the movement between balance sheets.
Fourth, the separation of the accounts into market and imputed trans-actions has much to recommend it. Although, as Ruggles points out, his examples involve only items presently included in BEA's published esti-mates, this regrouping allows for the inclusion of such other imputations as time and professional ingenuity permit. In addition, it offers the benefit of highlighting the market economy, which has a much better underlying data base, whose estimates generally require fewer assump-tions, and which can be observed at greater than annual frequency for the most part. This would seem to be a much more useful indicator of current economic activity for business and other economic forecasters to track than GNP as presently defined, with its load of baggage, statistically weak and of indeterminate size, riding the ups and downs of the business cycle. At present the only imputations of any size are those involved in the purchase and use of owner-occupied housing, but the interest imputa-tions are by no means trivial. Imputations have several characteristics which distinguish them from most other classes of estimates. For one thing, they are often based on assumptions whose validity is difficult if not impossible to verify; for another, they typically are based on data which are not reported with the same frequency as is much of the remaining data base; and finally, there are few if any cross-checks available in other reports of the same transactions. Thus, I again find Ruggles's proposal to differentiate between market and nonmarket activity quite congenial. He carries out this proposal with data already in the NIPA, but the framework could serve as well were housepersons' services and other new imputations to be brought into the accounts.
Fifth, as it affects the household account, the transactor approach has the unfortunate effect of fragmenting flows that once were shown all in one place, and there may be some loss in analytical usefulness as a result.^ Without the rest of the accounts, however, it is not easy to say how severe this loss will be, since the effect of the distribution of former PCE health outlays among household, pubUc, and business consumption cannot really be assessed without seeing the full system of accounts.
Sixth, with respect to the proposed treatment of intermediaries, I am generally sympathetic since I have long felt uncomfortable with the view of the financial sector implied by the traditional approach. I have some reservations, however, about the treatment which is proposed here. Insurance companies do look at underwriting income, and this focus is preserved in the present NIPA system by the net premium definition of output. I wonder, therefore, whether gross premiums are really the preferred measure in this case. Furthermore, while the text speaks of

101 The United States National Income Accounts, 1947-1977
considering the casualty payments as capital transfers, I look in vain for such an entry or even a space for such an entry in the capital account presented. While it would be nice to incorporate the payments to current retirees into the accounts as current income, the proposed treatment would appear to have no means for accommodating the equities in future benefits represented by the assets of pension funds. I am sure that the valuation placed on future pension benefits by the recipients of employer contributions to these funds is unknown, but I do not believe that people make no allowance for such income streams in their current financial planning.
Finally, grossing up the interest flows has much to recommend it, so long as interest payments and receipts do not disappear from the accounts in some identifiable form. But are not dividends susceptible to the same treatment? In particular, the dividend income of pension funds presently contributes a large negative amount to both aggregate profits and the profits of financial institutions. The treatment of enterprise interest pay-ments does not seem unreasonable at first sight, though the saving in the complexity of the system from the ehmination of the banking imputation is offset by the need to create the interest sector; and the new treatment has some implications for the measurement of output in nonfinancial enterprises which many would consider unfortunate, to say the least. The treatment of consumer and government interest which he proposes—I think—bothers me because of the indeterminacy of income outside the business sector. However, the capitalization of automobiles and other consumer durables which he proposes would suggest a treatment not unHke that given owner-occupied housing. One might also invoke capital account considerations in the case of interest on the pubUc debt, since the securities on which this interest is paid are freely substitutable for busi-ness issues in investors' portfolios. I think that these questions cannot be adequately resolved except in the context of the complete system, and I urge the author to develop his proposal more fully.
These are my major comments on what the paper contains. There are, however, a number of areas which could have been explored on this occasion but which the author chose to treat only in passing or not at all. I bring them up only to invite discussion. One of these is the matter of the relation between the underlying information system and the design of the accounts. This theme runs implicitly throughout the discussion of sectors as aggregations of the underlying microdata set, the discussion of the transactor approach to the recording of transactions, the interest in defining a pure household sector and some homogeneous subsectors of the business sector, etc. We have traditionally modified observed trans-actor records to fit a national accounting system constructed around the definitions of national income and national product. Ruggles's system goes more than a little way toward viewing the accounts as an organizing

102 Richard Ruggles
device for the data base. In particular, the "transactor" approach if carried to its logical conclusion could lead to a set of aggregates whose definitions, built up from below so to speak, are rather different from those now commonly in use. To cite one example, the view of interest as a payment for a service rather than a portion of the return to capital cannot help but affect the production account. The transactor approach would appear to imply a rather different concept of output from what we are used to since the interest treatment implies a business income which includes investment gains as well as operating income, and underwriting is no longer the sole focus of insurance companies in the accounts. I wish that Ruggles had treated these implications more expHcitly.
I also wish that more attention had been devoted to some of the issues from the past which still remain unresolved. BEA's performance with respect to meeting the requests of users and critics for improved con-cepts, data, and procedures has been good, though there are those who may have thought it glacial at times. There are still, however, many areas on which there was never a clear victory for one side or the other but merely an agreement to table further discussion. One obvious example is the question of whether the primary or at least a primary aggregate should be a welfare measure. Another is the extent to which capital gains are a part of income which should be recognized in the accounts. A third might be the location of the boundary of production beyond the market. One can understand the author's reluctance to disturb old bones, but it is entirely possible that one would give a different answer today if asked to decide on certain matters than the answers given several decades ago. The establishment of BEA's new Environmental and Nonmarket Eco-nomics Division occurred when we recognized the need to supplement GNP for welfare purposes.
There is one Pandora's box which Ruggles with great wisdom chose not to open. I refer to the issue of the proper focus of the accounts. There has long been a recognition that the GNP is not the only measure which should be considered by the architects of domestic economic policy and their critics. The Princeton conference in 1971 considered extensions of the accounts in the field of welfare measurement; Eisner would wish to extend the accounts in addition to cover capital gains and losses; and he, Kendrick, and Juster would wish to add many more imputations to conventional measures of income and production.
Ruggles recognizes this need, as both his emphasis on the capital accounts and his restructuring of the current account to make room for more imputations indicate. He does not go so far as to suggest that perhaps a new primary aggregate is required, or that any grand restruc-turing of the accounting system is called for. This is probably wise, and, indeed, this whole paper is a model of tact and diplomacy in an area where there is still substantial disagreement. But while I commend Rug-

103 The United States National Income Accounts, 1947-1977
gles's diplomacy and low profile, it is an unfortunate fact of life that the way in which data are organized and presented determine the way in which they will be used by others. The creator of a table has some particular analytical cast of mind which he naturally hopes will be shared by others, and all too often users oblige him if only through inertia. However, in one area at least, BE A is being called upon to make some redefinitions; I refer to some recent criticisms that our interest and profits numbers are incorrectly measured in part because of our failure to take account of the effect of inflation on the real cost of principal repayment. If the critics are correct and our flows of returns to capital are misstated, then perhaps the accounts need more than just a tire patch at this juncture.
What Ruggles's scheme would suggest that we do is point analysts in the direction of the capital account as well as the current account; what a more ambitious prescription would have called for is a reopening of the whole question of the proper definition of income as it was left 30 years ago. The Ruggles system would allow a lot of experimentation, however, while preserving our famiUar NIP A aggregates; indeed, had we had the revaluation accounts he proposes, the whole interest and profit con-troversy might never have arisen. The Ruggles system also has room to allow for a similar exploratory process in welfare measurement.
In closing, I would hke to add that, although the author chose to hide some of the more radical notions in a deceptively smooth concoction, there is a lot to be thought about in this paper. I hope that Ruggles will forgive me for pointing out the extent to which he has inserted the camel's nose into the tent with these seemingly modest proposals.
Notes 1. This was much more of a problem in the eariier version of the paper; the present table
is considerably cleaner. 2. Again, this was much more of a problem in the original version of the paper which
distinguished between market and imputed taxes as well.
References Juster, F. Thomas. 1973. A framework for the measurement of economic
and social performance. In Milton Moss, ed.. The measurement of economic and social performance, pp. 25-84. New York: Columbia University Press for the National Bureau of Economic Research.
Ruggles, Nancy D., and Ruggles, Richard. 1970. The design of economic accounts. New York: Columbia University Press for the National Bureau of Economic Research.
Ruggles, Richard, and Ruggles, Nancy D. 1956. National income accounts and national income analysis. 2d ed. New York: McGraw-Hill, 1956.

104 Richard Ruggles
Ruggles, Richard, and Ruggles, Nancy D. 1973. A proposal for a system of economic and social accounts. In Milton Moss, ed., The measure-ment of economic and social performance, pp. 111-53. New York: Columbia University Press for the National Bureau of Economic Research.
Comment John A . Gorman
Ruggles proposes to replace the treatment of business interest as a factor cost by treatment as a purchased service. In addition to transferring output from the nonfinancial industries to the financial industries, this proposal would remove the "Hd" rule from the definition of output. The fid rule is that profits form a lid on business interest payments, so that payment of interest does not necessarily result in output. Thus, if interest paid by business changes without a similar change in the value of business production, there will be an offsetting change in profits, which will ensure that the sum of interest, profits, and other incomes originating in business correctly measures the contribution to production originating in the business sector.
We have appUed the lid rule to exclude the public utility "allowance for funds used during construction" from our measures of investment, out-put, and profits for communication and electric and gas utiHties. I think Ruggles should deal with the question of whether removing the Ud rule for interest has implications for our measurement of investment, output, and profits in these industries. The amounts involved are not trivial; had the allowance for funds used during construction been included in the accounts for 1977; electric and gas utility investment would have been raised 10%, and gross product originating would have been increased 5%. Inclusion of the allowance for funds used during construction would have increased profits plus capital consumption allowances in the indus-try by 13%.
A second consequence of shifting from a factor cost treatment to a purchased service treatment of interest is that interest would be treated Hke rent: the amount of output represented by interest would be shown as originating in the lending industry rather than the borrowing industry. It should be noted that this treatment gives opposite results from the treatment of capital leases promulgated by the Financial Accounting Standards Board (FASB) which, if implemented in the national income and product accounts, would shift output from the industry owning the
John A. Gorman is assistant chief, National Income and Wealth Division, Bureau of Economic Analysis.

105 The United States National Income Accounts, 1947-1977
asset to the industry renting the asset. I am not recommending the adoption of the FASB proposal but am suggesting Ruggles might want to review his proposed treatment of interest in the light of the FASB proposal for rent.

This Page Intentionally Left Blank