the unintended consequences of the zero lower …
TRANSCRIPT
NBER WORKING PAPER SERIES
THE UNINTENDED CONSEQUENCES OF THE ZERO LOWER BOUND POLICY
Marco Di MaggioMarcin Kacperczyk
Working Paper 22351http://www.nber.org/papers/w22351
NATIONAL BUREAU OF ECONOMIC RESEARCH1050 Massachusetts Avenue
Cambridge, MA 02138June 2016
We acknowledge financial support from Inquire Europe. The views expressed herein are those of the authors and do not necessarily reflect the views of the National Bureau of Economic Research.
NBER working papers are circulated for discussion and comment purposes. They have not been peer-reviewed or been subject to the review by the NBER Board of Directors that accompanies official NBER publications.
© 2016 by Marco Di Maggio and Marcin Kacperczyk. All rights reserved. Short sections of text, not to exceed two paragraphs, may be quoted without explicit permission provided that full credit, including © notice, is given to the source.
The Unintended Consequences of the Zero Lower Bound PolicyMarco Di Maggio and Marcin KacperczykNBER Working Paper No. 22351June 2016JEL No. E52,G23,G28
ABSTRACT
We study the impact of the zero lower bound interest rate policy on the industrial organization of the U.S. money fund industry. We find that in response to policies that maintain low interest rates, money funds: change their product offerings by investing in riskier asset classes; are more likely to exit the market; and reduce the fees they charge their investors. The consequence of fund closures resulting from interest rate policy is the relocation of resources in affected fund families and in the asset management industry in general, as well as decline in capital of issuers borrowing from money funds.
Marco Di MaggioGraduate School of BusinessColumbia University3022 Broadway, uris Hall 819New York, NY 10027and [email protected]
Marcin KacperczykImperial College Business SchoolTanaka BuildingSouth Kensington CampusLondon SW7 2AZUnited [email protected]
An online appendix is available at http://www.nber.org/data-appendix/w22351

1
1. Introduction
In the aftermath of the financial crisis of 2007-2008, the Federal Reserve took an unprecedented
decision to lower short-term nominal interest rates to zero, a policy commonly known as zero lower
bound policy. This initial action was followed by a sequence of announcements providing guidance
that the short-term rate would stay near zero for a longer period. While several economists have
argued that the Fed’s policy exerted a positive impact on the U.S. economy by stimulating a sluggish
economic growth and boosting employment, some critics pointed out that the policy might have
also produced undesired consequences, for example, inflation in asset prices, or ill-suited incentives
to chase higher yields. In this paper, we show that the policy created a shock to an important part of
the shadow banking system, money funds, which resulted in significant dislocations in terms of their
market participation and product offerings.
By regulation, money market funds (henceforth MMFs) are obliged to invest in safe short-
term assets with rates of return that are typically close to the Fed funds rate. The monetary policy
shock has thus driven the funds’ gross profit margins nearly to zero and has seen many fund
investors face investment opportunities with negative (net of fees) expected returns. The
deteriorating investment environment, in turn, has triggered significant responses of MMFs and
broader asset management industry in terms of their product offerings, pricing policy, and
organizational structure. We study empirically these adjustments using detailed micro-level data.
Traditionally, MMFs used to offer relatively low returns for the provision of safety. While
this idea has been somewhat shattered with the collapse of the Reserve Primary Fund and the run on
MMFs in September 2008 [e.g., Kacperczyk and Schnabl (2013), Chernenko and Sunderam (2014),
Strahan and Tanyeri (2015)], until then, MMFs provided investors positive returns, even after paying
fees. The consequence of the unprecedented change in interest rates to levels close to zero has been

2
that returns on traditional money market instruments, such as Treasuries, repos, or deposits declined
to similarly low levels. Therefore, any fund investing in these assets was likely to produce negative
net-of-fees nominal returns to their investors. It has thus become obvious that such business model
cannot be sustained for too long, as money would flow out of funds with negative returns.1
Such a dire situation has posed a dilemma for money funds. On the one hand, they could
accept the situation and keep their risk profiles unchanged. This, however, would force them to first
reduce or even waive their fees, and in the end, if the low rates persisted, to exit the market. On the
other hand, funds could change their product offerings by shifting their risk into securities with
higher interest rates, thus accepting higher risk in their portfolios, an idea coined as reaching for
yield. Increasing fund risk would boost returns and investor flows [e.g., Christoffersen (2001)], and
would likely prevent funds from exiting the market. The cost of increasing risk would be a higher
chance of being run on in the event of distress in the money market industry. The consequence of
such runs would be distress of individual funds themselves, which could generate high costs either in
terms of the necessity to bail out the fund or through a significant loss of reputation for the fund
organization and other related business of a fund sponsor.
In this paper, we assess empirically the equilibrium response of MMFs to the low interest
rate environment using weekly data on the universe of U.S. prime funds. We exploit both a time-
series and cross-sectional variation in the data to identify the causal effect of the unconventional
monetary policy on MMFs' strategies. Our main empirical identification comes from an event study
analysis of five FOMC announcements, which signaled that interest rates would be kept near zero
into the future. These decisions were plausibly exogenous with respect to the funds’ behavior; hence,
1A standard portfolio theory suggests that investors should look at fund spread, returns net of Treasury bill, rather than fund returns as a way of assessing their decisions. But in times of zero interest rates both returns and spreads are virtually the same. In addition, our regression estimates account for any business-cycle variation in the data.

3
they constitute a useful shock. The access to high-frequency fund data allows us to measure
empirical effects within short event windows. Specifically, we compare MMFs' choices of risky
product offerings, exit, and expense policy in the fund data.
In the time series, we document an increase in the probability of exit from the MMF
industry, higher risk taking, lower expenses charged by MMFs, and higher fund subsidies in the
period of three to six months after the announcements. Our results are economically and statistically
significant. Notably, while we do not find any variation in expenses incurred by these funds over time,
the fees charged are significantly reduced during a zero interest rate period, which suggests that MMFs
were actively maintaining their fees as a way of keeping their business alive and did not simply go
through a period of lower operating costs.
In the cross section, we find that reaching for yield is particularly strong for independent
funds, that is, funds whose sponsors are not affiliated with insurance company, commercial, or
investment bank. In contrast, rather than taking more risk, affiliated funds exit the market. We do
not find significant differences across fund types in terms of their expense policies. We further
enhance these findings by exploiting a variation in family-level percentage of assets managed by
MMFs within a group of independent sponsors. We find that funds whose families invest a greater
percentage of their assets in MMFs are less likely to exit and more likely to take more risk. The
results are consistent with a hypothesis that reputational concerns shape MMFs’ strategic decisions.
In sum, to the extent that any macroeconomic (time-series) shock would likely affect all types of
funds in a similar way, the results suggest that ours is a leading mechanism explaining the data.
We conduct a number of tests to improve our identification and alleviate any empirical
concerns. Our first concern is identification of the results on risk taking. To the extent that safer
funds are more likely to exit, our risk results could be driven by survival of the more risky funds.
4
The question is whether strategic behavior of individual funds also contributes to risk changes over
and above the negative selection channel. To address this concern we redo all our tests by removing
funds that exit the sample after the shock. Our results remain qualitatively similar, which suggests
that the negative selection and strategic fund behavior are both responsible for changes in risk.
Our second concern is that our results are not specifically about the role of zero-rate policy
but rather are a generic response to changes in interest rates, independent of their levels. We
address this concern by estimating our basic models separately for two sub-periods: a period with
rates higher than 1% (control group) and a period with rates of at most 1% (treatment group).
We find a strong discontinuity in the way MMFs respond to changes in Fed funds rate. While we
observe no visible effect on exit, risk, and fees when the rate is above 1%, we observe a similar
quality of results as our main findings in periods when interest rates equal at most 1%.
Third, we include monetary policy surprises rather than the Fed funds rates changes in our
regressions and confirm our results on fund exit and risk taking, which alleviates any concern that
our results are driven by changes in economic conditions proxied by the Fed funds rate, rather than
changes in monetary policy. Fourth, we posit a stronger reaction of MMFs as they expect low
interest rates to last longer. We back out the date the market expects the Fed Fund rate to increase
from the Fed funds futures data and find that funds reach for yield more the longer the market
expects interest rates to remain below 1%. Finally, we use evidence from detailed portfolio holdings
for a shorter sample of 2010-2013 and show that, as a result of a shock, MMFs tend to acquire assets
whose yields are distinctly higher than those of the assets that were acquired a month before.
A similar analysis for a placebo sample (periods without a policy change) gives opposite results.
In sum, our results suggest that the zero-bound policy may drive changes in MMFs’ strategies.

5
Next, we show that the disruptions in the MMF industry have real effects. On the one hand,
in the absence of search frictions we would not expect any effect on the availability of credit to firms
as they could easily substitute one fund with another. On the other hand, firms might find it difficult
to borrow from different institutions with which they do not have prior relationship. To test this
hypothesis, we collect information on the leverage of nonfinancial firms borrowing from MMFs.
We show that within a six-month period after the closure of a given fund, leverage of firms
borrowing from the fund is significantly reduced compared to that of firms borrowing from funds
that remain active. This effect, however, is short lived, as it disappears a year after the fund closure.
In our final set of results, we show that the strategic adjustment in the MMF industry has
broader industry organization implications for the entire mutual fund sector. We investigate whether
the fund families that decide to close their MMFs in response to monetary shock open new funds in
a different asset class, possibly less stressed by low interest rates. Empirically, we compare fund
closures and fund creations of fund families that have closed their MMFs with those that did not.
We find that the former ones are significantly more likely to open new bond funds, but not equity or
balanced funds. We also show active reallocation of managerial talent either to other MMFs or to
bond funds. The above results suggest that the prolonged period of low interest rates leads to the
reallocation of resources across largely similar asset classes.
Overall, our results highlight an important channel for transmission of monetary policy that
has been completely overlooked by the academic literature, but one that is extremely relevant for
practitioners and policy makers. This message resonates well with the August 2009 Fitch report
about U.S. MMFs that states: "Over the longer term, more conservative portfolio composition,
6
combined with the current low interest rate environment, may result in fund closures, fund
consolidation, and/or a resurgent appetite for credit and liquidity risk.”2
The rest of the paper proceeds as follows. In Section 2, we discuss the related literature.
Section 3 provides further details about the institutional setting of money funds. Empirical design,
the data, and empirical results are discussed in Section 4 and Section 5. In Section 6, we discuss
broad implications for the industry organization of the mutual fund sector. Section 7 concludes. In
the Online Appendix, we report few additional results showing the robustness of our main findings.
2. Related Literature
Various papers have studied the role of money funds.3 To the best of our knowledge our paper is
the first to examine the impact of monetary policy on industrial organization of money funds—the
change in product offerings (risk taking) and in market structure (exit)—and its implications for
capital supply to fund borrowers and the allocation of resources within the industry. In this regard,
the closest studies to ours are Kacperczyk and Schnabl (2013), Strahan and Tanyeri (2015), and Di
Maggio (2013), which analyze risk taking of MMFs before and after the collapse of Lehman
Brothers, and during the European debt crisis, respectively. The key novelty of our paper is a new
mechanism that explains risk taking. While in Kacperczyk and Schnabl (2013) the key friction is the
increase in yields dispersion of the different investable asset classes; the friction we emphasize here
is the zero lower bound policy. Moreover, we focus on funds’ strategic decisions to alter their
expense policy and moderate their entry and exit, and quantify the value of subsidies provided by
2"U.S. Prime Money Market Funds: Managing Portfolio Composition to Address Credit & Liquidity Risks" is available on Fitch's web site at www.fitchratings.com. 3 Notable examples of recent contributions on money funds include Christoffersen (2001), Christoffersen and Musto (2002), Baba et al. (2009), McCabe (2010), Di Maggio (2013), Duygan-Bump et al. (2013), Kacperczyk and Schnabl (2013), Chernenko and Sunderam (2014), and Strahan and Tanyeri (2015).

7
sponsors to their funds. The last result allows us to assess the costs of the monetary policy from the
perspective of these intermediaries.
Several papers studied the importance of conducting monetary policy at the zero bound.
These papers primarily focus on aggregate macro quantities.4 Our paper, in turn, is one of the first
to provide micro-level evidence on the reaction of financial institutions to low interest rates.5 The
benefit of using micro-level data is better identification of the underlying economic mechanism. In
this vein, Maddaloni and Peydró (2011) find that low short-term rates soften lending standards for
retail and corporate loans. Jimenez et al. (2014) show that lowering overnight interest rate induces
less-capitalized banks to lend to riskier firms. These studies, however, do not explicitly study the role
of the zero bound policy and their response variables and contexts are different than ours.
Also related is a study by Chodorow-Reich (2014) who considers high-frequency event
studies to analyze the effects of the unconventional monetary policy on banks and life insurance
companies. He shows that such institutions benefit from low interest rates. Incidentally, though
not his main focus, he also examines a time-series variation in risk taking of MMFs. He documents
evidence of a significant reaching-for-yield behavior, especially in the period 2008-2012. While he
analyzes annual trends in funds’ risk taking, we consider narrow monetary policy event windows to
isolate a specific effect of interest rate policy changes on industrial organization of the entire money
fund sector. Further, a large and novel portion of our paper discusses: (i) a cross-sectional variation
in fund strategies, (ii) the tradeoff between risk taking and exit, (iii) evidence on sponsors’ subsidies,
(iv) real effects in the corporate sector, and (v) broader asset management implications on the labor
4 Related literature on conducting the zero interest rate monetary policy at the macro level includes Woodford (2003) and Bernanke et al. (2004). 5 One exception is Di Maggio, Kermani, and Palmer (2015) who consider the effects of quantitative easing on the allocation of credit in the mortgage market.

8
and assets fronts. Finally, we show a distinct asymmetry in fund strategies conditional on the level
of Fed funds rate.
More broadly, our paper sheds new light on the incentives of asset managers to reach for
yield—one of the core factors contributing to the buildup of credit that preceded the financial crisis
[Rajan (2010), Yellen (2011), and Stein (2013)]. Popular explanations include competition among
fund managers, different preferences for risk, or desire to offset constraints imposed by regulation.
We provide a setting in which the incentives to reach for yield on one hand are limited by strict
regulation, on the other hand they are significantly affected by changes in interest rates and
expectations about their future changes.
3. The Institutional Setting: Money Market Funds
Money funds are important intermediaries between investors who want low-risk liquid investments
and banks and corporations that have short-term borrowing needs. The funds are key buyers of
short-term debt issued by banks and corporations: commercial paper, bank certificates, and
repurchase agreements, with an aggregate volume of $1.8 trillion. Given the importance of short-
term credit markets to both investors and businesses, any disruption in this sector would represent a
potential threat to financial stability.
In the United States, MMFs' holdings are regulated by Rule 2a-7 of the Investment
Company Act of 1940. The funds are prohibited from purchasing long-term assets such as
mortgage-backed securities, corporate bonds, or equity and can only hold short-term assets; and
even these must be of high quality. As an additional requirement, to enhance diversification, the
funds cannot hold more than 5% of their assets in the securities of any individual issuer with the
highest rating and not more than 1% in the securities of any other issuer.

9
In January 2009, after a tumultuous year for MMFs, the SEC voted to amend the 2a-7 rules
to strengthen MMFs. The new rules seek to limit the risk and improve on fund disclosure. For
instance, funds are now required to have enhanced reserves of cash and readily liquidated securities
to meet redemption requests and they can invest only 3 percent (down from 5 percent) of total
assets in tier-2 securities, the term on which is limited to a maximum maturity of 45 days. Under the
new rules, starting in November 2010 MMFs have to make monthly disclosure of detailed data,
including each fund's holdings and shadow net asset value (NAV). This information becomes
available to the public after 60 days. The new N-MFP form on which it is filed constitutes one of
the sources of data for the present study.
4. Research Design and Data
4.1. Empirical Design
In our empirical tests, we want to identify the impact of interest rate policy on MMFs’ behavior.
Our main focus is on the effects due the zero lower bound policy, introduced in December 2008.
Since the policy set the short-term rate to zero, any identification due to interest rate changes would
be difficult. To this end, we explore the importance of additional communication from the Federal
Reserve regarding the duration of the zero-rate policy—forward guidance policy. In our context,
the duration of the zero-rate policy is crucial as it directly determines how long the MMF business is
subject to profit stress. In particular, one could imagine that short-lasting policy would have
different equilibrium implications as MMFs could withstand temporary headwinds by taking short-
term losses. The situation, in turn, would differ if the pressure were maintained for longer time.
In our analysis, we focus on the MMFs’ behavior around events related to FOMC meetings
during which at least one of the following outcomes occurred: (1) a change in the interest rates, (2)
forward guidance announcement. Table 1 provides a short description of the events in chronological

10
order. The first event date is December 16, 2008, which is the date of the meeting at which the Fed
funds rate was cut to 0-0.25%, and the other four event dates capture the meetings at which the Fed
outlined its forward guidance regarding the duration of the zero-rate regime. Specifically, on March
18, 2009, the Fed announced that it would keep rates at zero for “an extended period of time”, while
on August 9, 2011, January 25, 2012, and September 13, 2012 the Fed stated that the rates would
remain at zero until 2013, 2014, and 2015, respectively.
Notably, during our period of analysis there have been other policy-related events that might
have affected financial markets, an important one being the quantitative easing (QE) interventions.
We do not consider QE events for two reasons. First, the QE interventions mainly targeted the
long-term part of the yield curve, but the opportunity set of MMFs only spans short-term assets.
Second, QE primarily entails the purchase of mortgage-backed securities, and these securities cannot
be held by MMFs due to regulatory constraints.
Our event-study analysis requires constructing reasonable windows around the event dates.
Given that various MMFs’ strategies can be adopted with different speed we consider two horizons:
a short horizon of three months, and a long horizon of six months after the event. In both cases,
the pre-event window is set at one month to ensure that no pre-event trends drive the patterns in
the data. Our empirical strategy is to compare the average fund behavior around the event dates.
In our empirical tests, we also exploit cross-sectional differences across MMFs. In particular,
we distinguish between funds whose sponsors are affiliated with a large financial institution, such as
commercial bank, investment bank, or insurance company, and funds whose sponsors are affiliated
with an independent asset manager. We believe the two groups exhibit distinct responses to the
events of interest rate changes. For example, the bank-affiliated funds exhibit weaker incentives to
reach for yield than independent funds so as to limit the probability of the bad outcome in which
11
the bank would be forced to invest resources to save the fund. Independent funds, in turn, have
stronger incentives to reach for yield in order to provide investors with higher returns, compensating
investors for giving up the implicit insurance of the bank. Moreover, bank-affiliated funds might
have reputation at stake in which case they might prefer to exit the less risky yet unprofitable fund
industry rather than improve its profitability by ramping up risk.
4.2. Data
Our sample of funds includes the universe of U.S. taxable prime funds. We collect data for our tests
from several sources. First, the data on MMFs come from iMoneyNet and cover the period from
January 2005 to December 2013 including weekly fund-level data on yields, expense ratios (charged
and incurred), average maturity, holdings by instrument type, and fund sponsor. Second, we
complement the data with information from CRSP Mutual Fund Database, especially assets under
management and entry/exit of other funds. Third, we use COMPUSTAT and companies' websites
for information on sponsor characteristics. Fourth, we collect data on fund managers from Investor
Observer, LinkedIn, Morningstar, Zabasearch, and Zoominfo. Finally, information about Fed funds
rate changes and the forward guidance policy comes from the Federal Reserve Board website.
We conduct most of our analyses at the fund portfolio level. We aggregate all share classes
by fund and investor type. We compute fund characteristics (e.g., expense ratio) as weighted
averages using share class assets as weights. Some funds offer both retail and institutional share
classes. Institutional shares are generally larger; hence, we classify a fund as institutional if it offers at
least one institutional class, and as retail if it does not offer institutional share classes.6
Table A.1 in the Online Appendix provides summary statistics of the data. Our sample
includes 349 different fund portfolios. The average fund size in our sample equals approximately
6 Following earlier studies, we also analyzed the data with institutional funds only. The results are qualitatively similar.

12
$8.3 billion. The average portfolio maturity is 40 days and the average fund age equals 15.8 years.
The average Fed funds rate in our sample equals 183 basis points while the average gross fund
return equals 231 basis points. Hence, out of the abnormal profit of 47 basis points 38 basis points
account for expenses, which leaves about 10 basis points accruing to fund investors. Our sample is
fairly balanced with respect to sponsor type as 59% of funds have bank-affiliated sponsors and 41%
have independent asset management companies as sponsors.
We compare our sample properties in the high and low interest-rate regimes. This sample
split is based on the interest rate level of 1% and reflects our view of what we consider a period of
profit stress. A number of interesting patterns emerge. First, the spread during the low-rate period
is 25% lower than that in the high-rate period; also, the nominal gross return is almost ten times
larger in the high-rate period. This suggests that MMFs face greater challenges in obtaining high
returns in a low interest rate environment. Second, if we look at expenses charged they are
significantly lower in the low-rate period, with a drop from 50 to 28 basis points, while expenses
incurred remain almost the same. This suggests that while the costs are not affected by the
monetary policy, the stress imposed on the profit margin reduces the possibility for a fund to charge
fees to investors. In other words, funds are more likely to offer subsidies to their fund investors.
Third, while fund flows are positive during the earlier period, they become negative in the low
interest rate environment. This is consistent with the idea that investors have become less willing to
make investments in MMFs as their returns became less attractive. Finally, we observe a significant
decline of more than 50 in the number of funds over the two periods: from 326 to 274 funds in the
second period, which constitutes a significant exit from the sector.
Finally, we focus on the period of low interest rates and report separate summary statistics
for two major groups of funds: bank affiliated and independent. Bank-affiliated funds are on average

13
smaller with the difference of about $3 billion. They are also less risky as their spreads are lower;
they invest in shorter-maturity assets and in safer assets such as repos or Treasuries. They charge
slightly lower fees and face higher outflows, consistent with the flow-performance relationship
observed in other studies (Chevalier and Ellison (1997), and Kacperczyk and Schnabl (2013)).
5. Empirical Results
In this section, we present our main results. First, we show the importance of interest rates in
generating fund returns and establish the link between fund returns and subsequent fund flows.
Next, we look at the effects of the forward guidance policy on risk product offerings, fund exit, and
expenses in the time series and in the cross section. Finally, we provide a series of robustness tests
that are meant to strengthen the identification of our mechanism.
5.1. Asset Returns and Fund Flows
The basic premise of our mechanism is that yields on assets in which money funds can invest, and
consequently their portfolio returns, depend on the level of Fed funds rate. We begin our analysis
by identifying such link in the data. To this end, we estimate the regression model of fund gross
returns (Fund Return) on the Fed funds rate (Fed Rate) over our sample period.7
Fund Returnit = a0 + a1 Fed Ratet + bXit-1 + εit (1)
In the regression, we control for other determinants of fund returns possibly correlated with
the level of interest rates (subsumed by vector X), such as the natural logarithm of fund size
(Log(Fund Size)), the natural logarithm of fund family size (Log(Family Size)), the level of expenses
charged by funds (Expenses), fund age (Age), the percentage change in fund assets accounted for
7 Alternatively, we could consider returns net of inflation, as in this period inflation is very low. This dimension of variation in the data is captured by time-fixed effects.

14
capital appreciation (Fund Flow), the standard deviation of fund flows (Fund Flow Volatility), and an
indicator variable for the fund that is marketed to institutional investors (Institutional). Further, we
account for any time-invariant fund and sponsor characteristics by introducing fund and sponsor-
fixed effects. To address a potential concern that interest rates might proxy for general macro trends
in the data we include year-fixed effects. We cluster standard errors at the year/week dimension to
account for any cross-sectional dependence of residuals due to the commonality of interest rates
across fund observations. We report the results in Table 2.
Our results show that fund performance improves in periods of high interest rates. The
effect is statistically and economically highly significant. Consistent with our hypothesis that assets
held by MMFs are highly correlated with the level of short-term rates, we find that fund returns
respond almost one to one to changes in interest rates, as can be observed in columns (1) and (2). In
sum, the results underscore the importance of interest rates for generating fund performance. More
important, they highlight why the MMF industry is a great setting to study the consequences of the
prolonged period of low interest rates. In fact, there is no other large industry whose performance
would depend so heavily on the Fed funds rate. This is one of the reasons why we think our paper
can provide novel insights regarding the consequences of the zero interest rate policy.
In the next test, we show that fund returns matter in that generating superior performance
has important implications for fund flows and thus for managers’ compensation. To show this
formally, we first use aggregate evidence. In Figure 1, we plot the value of assets under management
for the universe of prime funds for the period 2005-2013. The figure shows a significant decline in
assets from more than $2 trillion in 2007 to less than $1.5 trillion in 2013. This sharp decline
coincides with the period of declining interest rates and hence the declining aggregate fund
performance. Moreover, it seems that at least the first two forward guidance policy announcements

15
on March 18, 2009 and August 9, 2011 preceded a significant drop in assets invested in funds. This
result is consistent with the hypothesis that given the expectation of an extended period of low
interest rates, fund investors might have pulled out of these funds to find more profitable
investment opportunities and/or the fund companies decided to close down their operations.
Next, we provide micro-level evidence of this effect and estimate the flow-performance
relationship at the individual fund level. Investors’ portfolio choice problem is quite straightforward:
They might respond to a significant decrease in MMFs’ profitability by migrating from MMF
accounts to bank deposits, if they look to park their money and save on fees, or by investing in other
low-risk investment opportunities, such as blue chips or high-rated corporate bonds, which pay
higher returns than MMFs. In all these cases, MMFs should experience outflows as interest rates
decrease. Formally, we estimate the following regression model:
Fund Flowit = a0 + a1Fund Returnit-1 + bXit-1 + εit (2)
Table 3 reports the results, where our set of controls mimics that from Table 2. In all
regressions, we include sponsor-fixed effects and cluster standard errors at the sponsor level. In
column (1), we report the results for the full sample of MMFs without time-fixed effects. We
confirm the findings from earlier studies that investors exhibit strong sensitivity to fund past returns.
The coefficient of Fund Return is positive and highly statistically significant. It is also economically
significant: A one-standard-deviation increase in Fund Return results in a fund flow of about 2.08%
per week, which is approximately 40% of the standard deviation of fund flows in the data. In terms
of fund size, it means that, in one year, a fund with a one-standard-deviation higher return than the
average would almost double its size relative to the average fund. In column (2), we additionally
account for the fine week-level variation by introducing week-fixed effects and find that the effect
remains statistically and economically strong.
16
In the next set of results, we aim to understand if there is any nonlinearity in the flow-
performance relationship as the Fed funds rate approaches the zero lower bound. In particular, we
define an indicator variable Low Rate that is equal to one in times when Fed funds rate is at most 1%,
and zero otherwise. Subsequently, we estimate the regression model in (2) with an additional
interaction effect Fund Return×Low Rate. The results are presented in columns (3) and (4) for the
models without and with week-fixed effects.
The flow-performance relationship is stronger in periods of low interest rates as the
coefficient of the interaction term is positive and highly significant. We conclude that the changes in
interest rates towards zero bound alter considerably the payoff per unit of extra performance:
Investors are about twice as sensitive to changes in fund performance as they are in normal times.
This further underscores the need for funds to adjust their operating strategies along various
dimensions, such as exit, risk taking, and cost policy. We turn to these results in the next section.
5.2. Fund Strategies around the Zero Interest Rate Policy Events
In this section, we evaluate MMFs’ behavior around the forward-guidance policy announcements
using an event-study methodology. We first analyze changes in fund behavior in the time series—
before and after FOMC events. Subsequently, we explore the cross-section of MMFs with respect
to their sponsor types.
5.2.1. Time-Series Evidence
In our analysis, we consider two post-event windows: a short one of three months and a
long one of six months. We analyze these two types of windows because there are strategies that
funds can immediately alter, such as the riskiness of their portfolios or expense policy, but also other
strategies for which we might not observe any effect for an extended period of time, such as the exit

17
from the market. In both cases, the pre-event window is short one month to avoid any
contamination with other events. Formally, we estimate the following regression model:
Fund Strategyit = a0 + a1Eventt + bXi2006 + εit (3)
We use a generic dependent variable, Fund Strategy, to measure three dimensions of fund
adjustments: exit, risk taking, and expense policy. Our independent variable of interest in all tests is
Event, an indicator variable equal to one for the period after the event date (short or long), and zero
beforehand. We also include a set of controls from models (1) and (2). These are measured as of
January 2006 to account for any endogenous movement in observables due to monetary shocks.8
We begin with the analysis of the exit strategy. We provide more evidence on the industry’s
evolution, investigating the changes in the number of active funds, and more micro evidence on the
fund’s probability of exiting the market. Our dependent variables are # Funds, defined as the number
of MMFs available in week t, and Exit, defined as an indicator variable equal to one if the fund
sponsor closes its fund in week t, and zero otherwise. For the first specification, we aggregate all
controls at time t by taking the value-weighted average across funds, with the weight proportional to
each fund’s assets under management. Panel A of Table 4 reports the results. In columns (1) and (2),
we present the results for the 3-month window, and in columns (3) and (4) for the 6-month window.
We find that, on average, five and nine funds drop after the policy event within the shorter
and longer horizons, respectively. This is an economically large effect that, if cumulated over five
events, brings the total to more than 25 and 45 of lost funds. The funds leaving the market are
often large funds, which corroborates our findings in Figure 1 of declining aggregated assets under
management. Similarly, we find that the probability of exiting the fund industry increases
significantly in both horizons following the event. Though we report our results jointly for all the
8 We also entertained the models with simple one-week or one-month lags and the results are very similar.

18
events, we also find consistent results when looking at each event separately. We also find that later
events are more important than early ones, perhaps because extending the forward guidance policy
into a longer future imposed more stress on the fund industry.
In our next test, we turn to measuring funds’ incentives to take risk. We use four different
risk measures. Spread is the difference between Fund Return and the T-bill rate; Holdings Risk is a
difference in fund weights in the riskiest asset class (bank obligations) and the safest asset class
(Repos and U.S. Treasuries and Agency assets); Maturity Risk is the weighted average maturity of the
fund; Concentration is a Herfindahl index of the portfolio holdings in risky assets, such as commercial
paper, asset-backed commercial paper, floating-rate notes, and bank obligations. Higher values of
each measure indicate a greater degree of risk taking. The results are reported in Panel B of Table 4.
We find that as a result of the policy announcements, three out of four measures of fund risk
increase for both investment horizons. The only risk measure that goes down is Maturity Risk. This
difference is likely driven by the provision in the Dodd-Frank Act, which implemented a
significantly higher lower bound for the fraction of assets maturing within the next seven days that
MMFs need to hold. Comparing the results in columns (1)-(4) to those in (5)-(8) suggests that the
risk profile of MMF industry depends on the policy announcements, and much of the risk
adjustment happens quickly.
The last dimension of adjustment we consider is the expense policy. It is apparent that in
the wake of low interest rates and low fund returns fund companies would want to maintain their
client relationship by reducing the fees they charge, thus effectively increasing these investors’ net of
fees returns. At the same time, there is no reason to believe that expenses truly incurred by funds
would change. Consequently, by lowering their fees to investors, fund companies would offer

19
subsidies to their investors. In the paper, we measure the degree of such subsidies by taking the
difference between incurred and charged expenses.
We evaluate this strategic behavior by estimating the regression model in (3) with Charged
Expenses, Incurred Expenses, and Subsidy (defined as the difference between incurred and charged
expenses) as our dependent variables and Event as our main independent variable. All other controls
are the same as before. In contrast to previous regressions, we cluster standard errors at the sponsor
level since fund expenses are persistent over time and thus this dimension of dependence produces
more conservative standard errors. Panel C of Table 4 reports the results from the estimation,
separately for the 3-month and 6-month post-event window.
We find a significant reduction (increase) in expenses charged (fund subsidies) in response to
FOMC announcements. These effects are particularly strong for the longer, six-month window,
which might reflect some sluggishness with which fund companies respond in terms of their pricing
policies. We find no differences in incurred fund expenses in response to the announced policies.
5.2.2. Cross-Sectional Evidence
In this section, we shed more light on our economic mechanism by exploiting a sponsor-
level variation in incentives to respond to profit margin squeeze. We hypothesize that fund sponsors
with greater reputation concerns might want to internalize the negative spillovers by either offering
funds with less risk or leaving the fund industry altogether. They might also entertain different
pricing strategies. We argue that one way to measure reputation concerns is whether a fund is
sponsored by a financial institution (large reputation concerns) or is sponsored by an independent
asset management company (less reputation concerns). Formally, we estimate the following
regression model:
Fund Strategyit = a0 + a1Eventt + a2Independent Sponsori + a3Eventt×Independent Sponsori + bXi2006 + εit (4)
20
In this model, Independent Sponsor is an indicator variable equal to one if the sponsor is an
independent management company and zero if it is an affiliated company. Fund Strategy and X are
defined as in model (3). The incremental effect of change with respect to sponsor type is measured
by the coefficient of the interaction term Event×Independent Sponsor. We present the results in Table 5.
In Panel A, we report the results for # Funds and Exit for three-month (columns (1) and (2))
and six-month event window. We find that funds sponsored by independent companies are more
likely to stay following the policy announcement. This result is particularly strong for the six-month
window, which could be due to the fact that adjustments, such as exit take longer to materialize.
In Panel B, we consider various measures of fund risk. The results generally paint a picture
that funds sponsored by independent asset management companies take on more risk following the
change in the interest rate policy. This result holds for three out of four measures or risk. The risk
adjustment already takes place within the shorter three-month period.
The results on exit and risk taking are consistent with our hypothesis that reputation
concerns are driving strategic adjustments of MMFs. Moreover, a combination of the two results
implies an additional industry effect. Given that safer, affiliated funds are more likely to leave and
more risky, independent funds are more likely to stay, this mechanism leads to a negative selection
of funds that stay after the policy events. This, in turn, makes the entire MMF industry less stable.
Finally, we investigate changes in the expense policy. The results are reported in Panel C.
We find no differences across fund types in terms of the policies, perhaps because this simple way
of adjustment could be used by all funds independent of their reputation concerns.
In our cross-sectional tests, we assume that reputational concerns can be measured by a fund
sponsor’s affiliation with a financial conglomerate. However, it is possible that this cross-sectional
21
variation might capture features other than reputational concerns. For example, affiliated sponsors
might have different financial capacity to bail out their funds. To isolate the pure reputation effect,
we turn to an alternative specification in which we solely focus on funds that are not affiliated with
financial conglomerates, that is, funds whose sponsors have no bailout capacity. We argue that
sponsors with significant non-money fund components might be more concerned with their
reputation loss in the event of the run on MMFs, due to potential spillovers to their much larger
business. We measure the degree of such concern using Business Risk, the fraction of family assets
that is held in non-money fund business. Formally, we estimate the following regression model:
Fund Strategyit = a0 + a1Eventt + a2Business Riski2006 + a3Eventt×Business Riski2006 + bXi2006 + εit (5)
Our empirical design follows that in model (4). Our coefficient of interest is a3. We present
the results in Table 6. In Panel A, we show the results for all adjustments for a three-month event
window, while in Panel B we focus on a six-month window. Our results are qualitatively similar to
our earlier findings: Funds with greater reputation concerns, indicated by higher Business Risk, are
less likely to take more risk, for both event horizons. In turn, they are more likely to subsidize their
MMFs. We find no strong evidence for the decision to exit the market.
5.3. Robustness Checks
In this section, we provide additional evidence on the validity of our identification strategy. First, we
examine the robustness of our results for a sample of funds that survive the effect of monetary
policy. Second, we compare the results of interest rate changes conditional on the level of short-
term rates. Third, we evaluate our results using the continuous measure of distress, defined as a
distance in time to the expected increase of rates above the threshold of 1%. Fourth, we consider
monetary policy surprises. Finally, we provide empirical evidence from the security-level data.

22
5.3.1. Survivorship
Our results in Table 4 suggest that fund risk goes up as a result of policy announcements.
To understand these findings, it is important to isolate their driving forces. In particular, the average
yields in the MMF sample can increase for two reasons: (1) Average fund yields go up because of
negative selection that retains more risky funds in the data; (2) MMFs strategically adjust their risk in
response to policies. Our results so far, suggest the first channel is partially operating given that
riskier funds are more likely to stay. In this section, we check to what extent the second channel
also contributes to our average results.
We address this issue using a subset of funds that are present in both periods of the event
study. Conditioning on surviving funds makes the selection issue obsolete. Formally, we estimate
the regression models in (3) and (4). In the Online Appendix, we report the results from the two
models. They are qualitatively similar to those reported in Tables 4 and 5. Hence, both economic
mechanisms might be jointly responsible for the average risk effects in the data.
5.3.2. Interest Rate Regimes
So far, we interpreted our empirical results as being explained by unconventional monetary
policy. An alternative explanation could be that any change in interest rates might cause similar
effects in the data. While we have no reason to believe that such unconditional result holds, largely
because the argument about negative investors’ returns only applies to periods with very low interest
rates, we check whether the data indeed show the expected asymmetry.
In our first test, we examine general consequences of changes in the Fed funds rate over the
longer period 2005-2013. The period of January 2005–December 2013 is an attractive testing ground
because it includes two distinct interest rate regimes: A regime in which the rate is higher than zero
percent (2005-2008) and a regime with zero interest rates (2009-2013). As Figure 2 indicates, in the
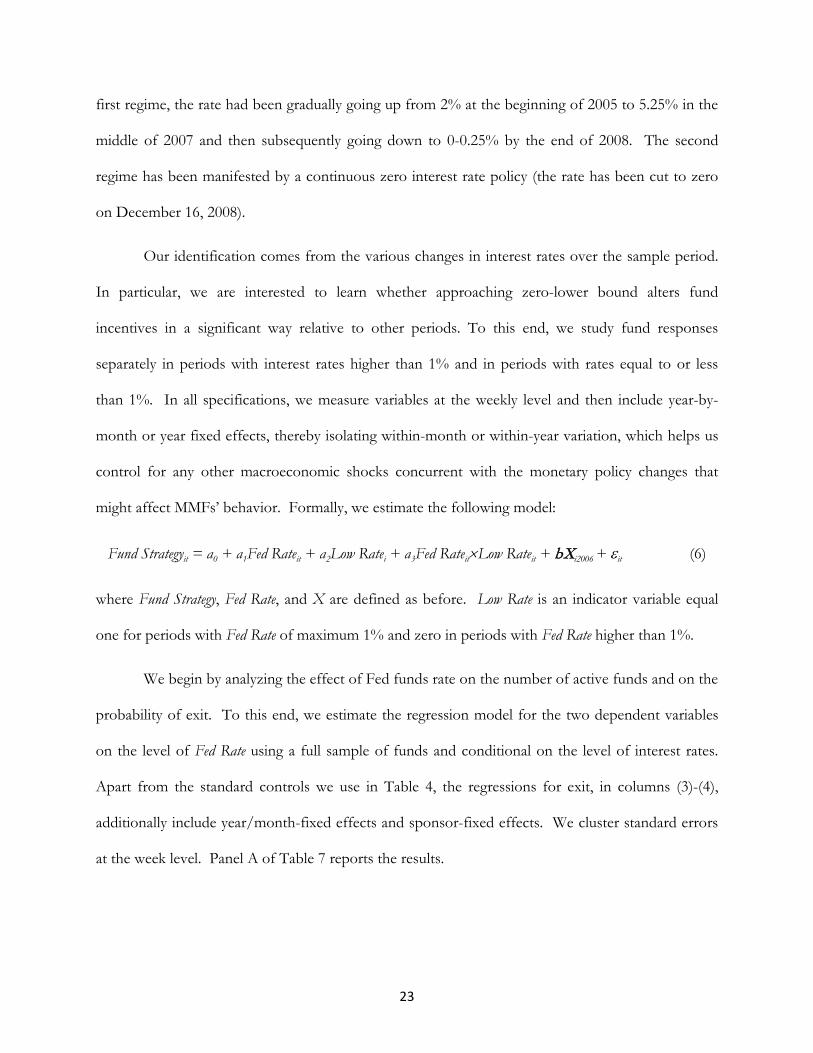
23
first regime, the rate had been gradually going up from 2% at the beginning of 2005 to 5.25% in the
middle of 2007 and then subsequently going down to 0-0.25% by the end of 2008. The second
regime has been manifested by a continuous zero interest rate policy (the rate has been cut to zero
on December 16, 2008).
Our identification comes from the various changes in interest rates over the sample period.
In particular, we are interested to learn whether approaching zero-lower bound alters fund
incentives in a significant way relative to other periods. To this end, we study fund responses
separately in periods with interest rates higher than 1% and in periods with rates equal to or less
than 1%. In all specifications, we measure variables at the weekly level and then include year-by-
month or year fixed effects, thereby isolating within-month or within-year variation, which helps us
control for any other macroeconomic shocks concurrent with the monetary policy changes that
might affect MMFs’ behavior. Formally, we estimate the following model:
Fund Strategyit = a0 + a1Fed Rateit + a2Low Ratei + a3Fed Rateit×Low Rateit + bXi2006 + εit (6)
where Fund Strategy, Fed Rate, and X are defined as before. Low Rate is an indicator variable equal
one for periods with Fed Rate of maximum 1% and zero in periods with Fed Rate higher than 1%.
We begin by analyzing the effect of Fed funds rate on the number of active funds and on the
probability of exit. To this end, we estimate the regression model for the two dependent variables
on the level of Fed Rate using a full sample of funds and conditional on the level of interest rates.
Apart from the standard controls we use in Table 4, the regressions for exit, in columns (3)-(4),
additionally include year/month-fixed effects and sponsor-fixed effects. We cluster standard errors
at the week level. Panel A of Table 7 reports the results.

24
Column (1) shows the relation between Fed Rate and the number of active funds. We
observe a generally negative relationship between the two. The effect, though statistically significant,
is economically quite small. However, once we distinguish between the high and the low interest
rate period in column (2), we find that a lower interest rate during a low interest rate environment
significantly reduces the number of active funds, with a loss of about 17 funds in total. In a similar
spirit, we analyze the probability of exiting the market, controlling for funds’ characteristics,
sponsor-fixed effects as well as month-fixed effects. While we again find little effect of interest rate
changes on exit strategies in the high-rate regime (column 3), we find that changes in interest rates
from 1% towards zero have important implications for the number of funds and fund exit, as
demonstrated in column (4). In particular, following the reduction in Fed funds rate from 1% to
0%, the probability of an exit from the fund industry increases by 7.2 percentage points. These
effects are highly significant both statistically and economically.
We next turn to results on risk taking. We estimate the regression model in which the
dependent variables are various risk measures and the main independent variable is Fed Rate. All
regressions include year/month-fixed effects and sponsor-fixed effects, and standard errors are
clustered at the week level. We report the results in Panel B. We find a statistically significant effect
of reducing Fed Rate on the increase in risk for all risk measures during period of low rates. In terms
of economic values, a reduction in the Fed Rate from 1% to 0% increases Spread by almost 57 basis
points, Holdings Risk by 5.9 percentage points, Maturity Risk by 1.7 days, and Concentration by 2.8
percentage points. These are sizable effects, especially for MMFs with returns close to zero. Such
effects are absent in periods of high interest rates.
Finally, we evaluate the conditional effect of interest rates on fund expense policy. Charged
Expenses, Incurred Expenses, and Subsidy are our dependent variables. All other controls are the same

25
as before. In contrast to previous regressions, we cluster standard errors at the sponsor level since
fund expenses are persistent over time and thus this dimension of dependence produces more
conservative standard errors. Panel C reports the results.
The results, in columns (1), (3), and (5) indicate an overall negative effect of interest rates on
fund expenses, both charged and incurred, and a positive effect on fund subsidies. The opposite is
true when interest rates approach zero bound: Lower rates coincide with a reduction of expenses
charged by funds. As Fed Rate goes down from 1% to 0% funds charge 8 basis points less for their
service, as presented in column (2). This reduction occurs despite the fact that incurred expenses
are generally unaffected by the interest rate change, as demonstrated in column (4). The implication
of these two facts is an increase in fund subsidies. As presented in column (6), a decrease in Fed Rate
from 1% to 0% increases fund subsidy by an economically large 7.9 basis points. This effect is
statistically and economically highly significant. Overall, the asymmetric response of expenses
suggests a strategic fund behavior in terms of their pricing policy.
We also analyze the asymmetric behavior in the cross-section of funds. In particular, we
compare exit, risk-taking, and pricing strategies for funds with different sponsor type across
different interest rate regimes. The results from these tests confirm our prior findings in Table 6 on
the differential response of funds with different sponsors.
5.3.3. Longevity Risk
In this section, we show that MMFs’ reaction to the low interest regime becomes even more
significant as the funds expect this regime to last longer. Intuitively, the longer the funds expect the
low interest rate regime to last, the greater incentives the funds should have to pursue other
strategies that would keep them afloat. We define the threshold level for low interest rates as 1%.
Subsequently, we back out the date the market expects the Fed funds rate to exceed 1% from the

26
Fed funds rates futures data. Specifically, we define a new variable, Longevity, as the natural
logarithm of 1 + the number of days that would take for the 30-day interest rates to exceed 1%.
The values are interpolated off the futures yield curve.
We estimate this regression model using both the unconditional sample (in the Online
Appendix) and the sample for which the interest rate is below 1% (Table 8). Whereas we do not
find a significant effect for the fund exit, we do find that higher values of Longevity predict a
significantly higher Spread, Holdings Risk, Concentration, and Subsidy. Thus, when fund managers
expect a longer time for the interest rate to increase, they are more likely to increase the riskiness of
their portfolios. They are also more likely to receive subsidies from their fund families. Our results
are broadly consistent across unconditional and conditional samples, but we find a stronger
economic significance for the sample from the low interest rate regime.
5.3.4. Monetary Policy Surprises
In the previous sections, we utilized changes in short-term interest rates near the zero-lower
bound and the forward guidance announcements as proxies for monetary policy shocks. The
concern might be that such changes in monetary policy might be anticipated by financial markets as
they reflect a systematic response to macro-economic environment. So far we have addressed this
issue by including time-fixed effects at high frequencies. Here, we consider an alternative approach
of using the unanticipated component of policy announcements to predict MMFs’ behavior. The
use of announcements is potentially valuable because it allows us to identify shocks to the
information set of agents and understand the transmission mechanism of the monetary policy.
A classic study that attempts to disentangle the expected and unexpected components of monetary

27
policy from Fed funds futures and studies if the latter can account for the daily variation of bond
yields around FOMC announcements is Kuttner (2001).9
However, there are two problems with this approach. First, the data constructed by Kuttner
(2001) show that in the last few years the unanticipated component is extremely small, at the order
of two basis points. This means that most of the information about changes in interest rates is
anticipated by financial markets. Second, data on short-term target changes are likely to
underestimate the extent of exogenous variation in monetary policy, because even when market
participants fully foresee target rate changes, statements of the policy committee members can still
provide valuable information about the path of future policy.
In our study, we employ the methodology of Buraschi et al. (2014) in which they employ
individual agents forecasts of Fed funds rate, GDP, and inflation to construct an empirical proxy for
policy shocks from the residuals of Taylor rule regressions, and show that path shocks account for a
significant fraction of the variance of one-year expected excess returns on 2-5 years bonds and are
also priced in the cross-section of equity returns. Following a similar approach, we construct the
monetary shocks by collecting data on all FOMC meetings. For each FOMC meeting, we compute
the change in yield for Treasury bonds with maturities 1, 3, 5, 7, and 10 years from the closing price
the day before the meeting until the morning after the meeting. If there is a two-day meeting, we
use the difference over two days. From these shocks, we extract the first principal component and
observe that the loadings on eigenvectors are similar across all maturities, which suggests that the
first principal component explains the maximum amount of variance of the series.
9 Other papers that construct a factor which proxies for news about the future path of policy are Gurkaynak, Sack, and Swanson (2005) for the U.S. and Andersson (2010) for the Euro-zone area.

28
In the Online Appendix, we report the relationship between the measure of monetary policy
shocks and the MMFs’ exit, risk-taking, and price-setting behavior. We show that an unexpected
decrease in interest rates increases the likelihood for these funds to exit the market. This result is
significant only in the low interest rate regime. Further, we provide evidence corroborating our
previous findings about the higher risk-taking incentives for the funds during periods of low interest
rates. Both the weekly annualized spread and the fraction of assets held in risky assets significantly
increase when the funds witness an unexpected decrease in interest rates. These results mirror the
ones presented in Table 7. Finally, we analyze the effect on expenses for the universe of MMFs and
the relationship with changes in monetary policy. In this case, the unexpected component of these
changes has no significant effect on their expenses, both charged and incurred, and on the subsidy
paid by the sponsors. For all the previous results, the magnitude is lower than previously shown, but
this is expected as these monetary policy shocks only capture the unforeseen portion of the rate
change.
5.3.5. Evidence from Portfolio Holdings
In this section, we use data on fund holdings to argue that our results are driven by active
portfolio decisions rather than by ex ante matching of funds and their holdings. We also show that
the policy effects have nontrivial role in issuers’ borrowing and capital structure decisions.
Composition Effects
We provide further evidence on the “reaching-for-yield” behavior using detailed information on
their holdings. We collect the data on the yields of the individual securities held by the funds from
the N-MFP form. These data became available in November 2010 as a consequence of the Dodd-
Frank Act and contain all the information related to the portfolio holdings of U.S. MMFs, such as
the issuer name, the security yields, the transaction date as well as a description of the security type

29
at a monthly frequency. We examine if the new securities added to a fund’s portfolio after the ZIRP
shocks feature a higher yield than the ones added before the shocks. Given the sample period, we
are able to analyze only three of the events in Table 1. Figure 3 presents the results, with each panel
considering two empirical distributions: one for the month before, and another one for three
months after each policy event. The results indicate a rightward shift in the distribution of yields
after the monetary policy announcements, that is, fund portfolios on average hold assets with higher
yields. The results from the Kolmogorov-Smirnov tests confirm that the differences between the
respective two distributions are statistically significant.
In an additional test, we examine whether the increase in yields is a function of new
additions made by funds to their portfolios after the policy announcement or is a legacy effect of the
portfolios formed before the announcement. To this end, we compare the average yields of the
securities added to the portfolio right before with those added right after the events. Formally, we
estimate the following regression model.
Mean Yieldit = a0 + a1Eventit + bXi2006 + εit (7)
where Mean Yield is the average yield of all securities of a given fund at time t, and Event is an
indicator variable equal to one for the period after the ZIRP shocks and zero for the period before
the ZIRP shocks. All other controls mimic those in model (3). The coefficient of our main interest
is a1. Table 9 presents the results.
Columns (1)-(3) present estimates for the three different events, controlling for year-month
and fund-fixed effects. The coefficient of Event is positive and statistically significant for all three
events, which means that the new securities feature significantly higher yields in the post period
relative to the pre period. We further assess whether these results are due to monetary policy effects
or are a reflection of general macro trends in the data. To this end, we design a placebo test in

30
which we estimate a similar regression model for two random event windows, one (January 2011)
picked for the period before the first event and one (March 2013) picked for the period after the last
event. The results, in columns (4) and (5), indicate that the average yields on the new securities, if
anything, decrease over time when considering these different dates. Hence, it is unlikely that our
results are a consequence of a general macro trend.
Leverage Effects
To further show that changes in MMF industry actually affect the firms that raise capital from
MMFs, we collect information on the outstanding debt that is provided by MMFs for each issuer in
our sample. We then estimate the following regression model:
Outstanding Debti,t = α + βPost Fund Closurei,,t + δi + γt +εi,t, (8)
where Post Fund Closure is an indicator variable equal to one after the fund has been closed; issuer
and month-fixed effects capture persistent differences across issuers and common shocks. Panel B
of Table 9 shows that the firms borrowing from MMFs that close see their outstanding debt decline
by at least 15%. Together with the previous evidence this result suggests that the closure of MMFs
make borrowing firms delever.
A potential concern with this analysis is that some combination of regulation and
quantitative easing could make it attractive for banks to term out their funding or make it more
attractive for risky firms to increase their demand for funding. If MMFs with less reputational
capital were already lending to riskier firms, it would be natural for them to increase their lending to
the same firms even after the various policy announcements.
To address this concern, we show that the composition of issuers that are borrowing from a
given MMF is actually changing around the policy event. To this end, we compute the number of
31
issuers that borrow from each MMF at a given time. Panel C of Table 9 shows that this number
decreases significantly after the events, thus suggesting that MMFs are not merely lending to the
same firms. Moreover, we argue that the affected funds are not simply responding to changes in
their existing issuers’ credit demand but also actively change the holdings of their portfolios. First,
we show that after the monetary policy event the distribution of yields of fund holdings shifts to the
right, which suggests that the borrowing firms become riskier. Second, we show that the average
riskiness of the newly added securities, measured by their yields, increases as well. Third, we show
that the outstanding debt of the issuers that were borrowing from a MMF that closed after the event
significantly decreases relative to the outstanding debt of issuers borrowing from other MMFs. If
this were an increasing credit demand story, it would be hard to argue that this should apply only to
the issuers that were connected to MMFs that closed.
Finally, we provide evidence on the link between reduction in available capital coming from
our monetary shock and the capital structure decisions for nonfinancial firms. Specifically, we match
the information about nonfinancial issuers from the MMF portfolio holdings data to their leverage
data from Compustat. This allows us to test whether leverage of the corporations that borrow from
MMFs that close down due to low interest rates is significantly different than leverage of the
unaffected borrowers. We uniquely identify about 80 firms in the data for which we can match
information from Compustat. We estimate the following regression model:
Leveragei,t = α + β1Post ×Closurei,,t + β2Closurei,,t+ β3Posti,,t+δi + γt +εi,t (9)
where we restrict our attention to the two quarters before and after a fund’s closure. This narrow
window is important to ensure that changes in leverage are not driven by other confounding effects.
Leverage is book leverage, defined as the ratio of total debt outstanding and the book value of assets.
Fund Closure identifies the treatment group, that is, the corporations that borrow from MMFs that
32
close during our sample period. Post is an indicator variable equal to one for the quarters after the
funds’ closure. The results are presented in Panel D of Table 9.
In column (1), we include time-fixed effects, while in column (2) we add issuer-fixed effects
to capture any time-invariant heterogeneity across issuers that might influence their leverage choices,
e.g., differences in their growth rates. Column (3) reports the results for the average leverage in the
pre and post periods. This specification has the advantage of being less susceptible to the criticism
that leverage is a very persistent variable, which might bias our results due to autocorrelated
residuals. In the most restrictive specification, we find that corporations reduce their leverage on
average by 1 percentage point. Next, we investigate the persistence of this effect. Column (4)
reports the results for the one-year window around the fund closure. While the sign of the
coefficient is the same, the results are not statistically significant. This finding suggests that the
repercussion of closing down a MMF for the firms might be significant but temporary, because
firms might be able to borrow from other MMFs or other institutions in the longer term. At the
same time, the real effects of such temporary liquidity constraints might be more significant,
especially if issuers rely on MMFs to roll over their existing debt. Overall, our results indicate that
shocks hitting the MMFs industry might have important consequences for firms’ credit availability.10
6. Industry Effects
Our results so far indicate three margins of adjustment for money funds: risk taking, exit, and fee
waivers. In this section, we examine the consequences of the exit from the MMF industry for 10 We also perform another test in which we investigate whether companies borrowing from riskier funds increase their leverage following the monetary shock. Specifically, we divide funds into two categories: risky and safe. The former are the ones for which risk measures (spread, concentration, and holdings risk) are above the median value in the data or those affiliated with an independent sponsor. We focus our attention on three policy events that occurred after 2010. We then analyze the leverage of corporations that increased their borrowing from risky MMFs, relative to companies that did not increase such borrowing, to see if this led to an increase in their total leverage right after the policy events compared to the quarter before the policy event. We do not find support for such an effect in the data. This suggests that companies increasing their borrowing from riskier MMFs might do so as a substitute to other forms of credit.

33
resource reallocation in the entire mutual fund industry. To the extent that exiting money fund
business frees up management resources and investor clientele, fund families might want to
accommodate such space by opening new funds specializing in different asset classes. A suggestive
evidence of this fact is Figure 4, in which we report a time-series evolution of assets under
management for MMFs and bond funds. It is clear from the graph that the correlation between the
two series is negative. This section explores this effect in more details.
To this end, we collect detailed information from CRSP on mutual fund families’ closures
and creations of new funds. We expect the fund families that decide to close their MMFs to be
more likely to open a new fund as a way to redistribute their unused resources. We further sharpen
our hypothesis by differentiating across fund strategies. For example, fund managers might be easier
to employ in fixed income rather than equity funds. Similarly, investors in MMFs might find bond
funds to be closer investment substitutes. Formally, we estimate the following regression:
Number of Fundsit = a0 + a1Aftert + a2Treatedit + a3Aftert×Treatedit + bXi2006 + εit, (10)
where the dependent variable Number of Funds is the number of funds of a given style (money, bond,
balance, and equity) at month t within a fund family i. After is an indicator variable equal to one for
the month following the closure of the money fund, and zero for the month before the closure.
Treated is an indicator variable equal to one for the families experiencing MMF closures in month t
(treated group), and zero for the families that do not close their money funds in month t (control
group). Our coefficient of interest is a3. To capture any other variation that might drive both the
closure and the opening of funds, we include several family controls (X), such as the log(Family
TNA) and the Fund Family Return, as well as, family-fixed effects. We further distinguish between
the periods of low interest rate regime (odd columns) and high interest rate regime (even columns)
to see if the response to shocks is symmetric or not. Table 10 presents the results.

34
Columns (1) and (2) of Panel A report the results for MMFs. We observe a negative and
statistically significant coefficient a3. The effect is particularly strong for the low interest rate regime.
Specifically, in that period, we find that treated families experience a reduction of more than three
funds compared to the control group. This result is not purely mechanical, because fund families
might decide to close one money fund to substitute it with another one. Finding the negative effect
validates our empirical strategy.
The subsequent six columns report the results for three different asset classes. In columns
(3) and (4), we show that fund families that close their MMFs, tend to open more than six bond
funds. This effect is only present in the low-interest rate period underscoring the importance of the
monetary shock. In columns (5)-(8), we report results from estimating similar specifications for
equity and balanced funds. We find no significant differences between treatment and control groups
in the creation of these types of funds. One identification concern is that the creation of bond funds
might be driven by movement in interest rates, or by a general trend in the industry, and not merely
by the closure of MMFs in the same fund family. However, we can reject this possibility on two
grounds. First, we find a significant effect only in the low-interest regime, and there is no general
trend in the creation of bond funds, as captured by the insignificant coefficient of the After variable.
Second, using the difference-in-differences specification ensures that the general effects of changes
in interest rate or market conditions on the profitability of bond funds should not differentially
impact the fund families that closed a money fund and the ones that did not.
In Panel B, we further explore these industry spillovers. Here, we collect data on the
different types of bond funds: short, medium and long-term. We analyze what are the types of bond
funds that are the most affected by this reallocation. We find that the most significant impact is on
the short-term bond funds: families that close their MMFs after the reduction in the interest rates

35
are more likely to open a new short-term bond fund. We do not find an effect for medium-term
funds, and we find a marginally significant effect for the long-term funds. We can interpret these
results as evidence that there might be a reallocation towards funds that have maturity similar to that
of MMFs and to funds that might exhibit a higher risk profile such as long-term bond funds, a result
that is consistent with our reaching for yield hypothesis.
In sum, our results provide suggestive evidence that bond funds are the closest substitute to
MMFs in terms of resource allocation, either because the managerial skills can be easiest deployed in
bond funds, or because investors in MMFs are most likely to migrate to bond funds because they
match most closely the risk profile of MMFs.
To shed more light on these competing mechanisms, we examine the managerial reallocation
across asset classes and fund families. To this end, we collect information about all the managers
that exit the MMFs industry. We track the managers’ subsequent career outcomes using data from
Morningstar, CRSP, iMoneyNet, and additional Internet searches, such as Investor Observer,
LinkedIn, Zabasearch, Zoominfo, and individual fund prospectuses.
We distinguish among five possible career outcomes: (1) staying in the same family and
running another MMF, (2) staying in the same family and running a non-money market fund, (3)
going to a different family and running a MMF, (4) going to a different family and running a non-
money market fund, (5) leaving the fund industry (moving to private business, government
institutions, setting up own company, etc.). We condition on a single manager departure in a given
date (there are instances in which managers were running multiple funds at the same time, so we
count them as one single departure). We report the results in Table 11.

36
There is a 50% probability that the manager will not work in another MMF in the same or
other families (i.e., 1 minus the sum of columns (1) and (3)). This seems to suggest that the exit from
the money fund industry is quite important perhaps because opportunities in the industry deplete or
managers voluntarily decide to pursue different career paths. Further, we compare the fraction of
managers that stay in the same family with those that decide to leave. We find that there is only a
48.4% chance that the manager stays in the same family, whereas 21.3% of managers that left after
the money fund closed pursue different careers in the financial industry. This result suggests that the
creation of new bond funds is likely a response to investors’ demand for a comparable product and
not catering to individual managers’ career concerns.
7. Concluding Remarks
With a rapid decline in economic output and a surge in unemployment rates, monetary authorities
worldwide launched an unprecedented policy of keeping short-term interest rates at record low
levels. Some critics have voiced concerns that the policy might have led to undesired dislocations in
various parts of financial markets. This paper empirically investigates such consequences in the
context of money funds. Given that money funds primarily invest in assets whose returns are linked
to the Fed funds rate, monetary policy plays an important role in their operations.
Our novel evidence suggests that in the times of unusually low interest rates fund managers
increased, on average, their portfolios’ risk. In an attempt to deliver nonnegative net returns to their
investors almost all funds significantly reduced their expenses charged to investors, even though the
incurred expenses did not vary much over time. The observed subsidies amounted to an economically
large value of $27 million per average fund and about $7.3 billion for all funds. We also show that
funds that were not successful in retaining their investors’ base, or were worried about negative

37
reputation spillovers, were more likely to exit. Our results further suggest that the zero lower bound
policy triggered a reduction in capital supply to financial and large corporate sector and increased the
financial markets’ exposure to costly runs and defaults.11 While our results hint that some of the
adjustments are economically adverse, a full welfare analysis is needed to establish such conclusions.
More broadly, although our empirical results speak mostly to one part of financial markets,
we want to emphasize that the effects we document are not necessarily limited to money fund
industry only. The reaching-for yield phenomenon has been observed in other markets: for example,
an average insurance company has shifted its assets towards riskier equity holdings, reaching the
level of equity exposure of almost 20% in 2014. Similarly, pension funds, expanded their holdings
into more than 60% in equity, away from typically held bonds. More work is needed to better
understand the transmission mechanisms underlying the effects of the zero lower bound monetary
policy on the stability of financial markets.
References
Andersson, M. 2010. Using intraday data to gauge financial market responses to federal reserve and ECB monetary policy decisions. International Journal of Central Banking 6.2: 117-146.
Baba, N., McCauley, R., and Ramaswamy, S. 2009. U.S. Dollar money market funds and non-US banks. BIS Quarterly Review, March.
Bernanke, B., Reinhart, V., and Sack, B. 2004. Monetary policy alternatives at the zero bound: an empirical assessment. Brookings Papers on Economic Activity 2004, 1-100.
Buraschi, A., Carnelli, A., and Whelan, P. 2014. Monetary policy and treasury risk premia. Unpublished working paper. Imperial College of London.
Chernenko, S., and Sunderam, A. 2014. Frictions in shadow banking: Evidence from the lending behavior of money market funds. Review of Financial Studies 27, 1717-1750.
Chevalier, J. and Ellison, G. 1997. Career concerns of mutual fund managers. Quarterly Journal of Economics 114, 389-432.
Chodorow-Reich, G. 2014. Effects of unconventional monetary policy on financial institutions. Brookings Papers on Economic Activity (Spring), 155-204.
11 We find that during the low interest rate regime many funds have submitted letters of support to the regulator, which is a good proxy for the increase in expected default.

38
Christoffersen, S. K. 2001. Why do money fund managers voluntarily waive their fees?. Journal of Finance 56, 1117-1140.
Christoffersen, S. K. and Musto, D. K. 2002. Demand curves and the pricing of money management. Review of Financial Studies 15, 1499-1524.
Di Maggio, M. 2013. Market turmoil and destabilizing speculation. Unpublished working paper. Columbia Business School.
Di Maggio, M., Kermani, A., Palmer, C., 2015. Unconventional monetary policy and the allocation of credit. Unpublished working paper. Columbia Business School.
Duygan‐Bump, B., Parkinson, P., Rosengren, E., Suarez, G. A., & Willen, P. 2013. How effective were the federal reserve emergency liquidity facilities? Evidence from the asset‐backed commercial paper money market mutual fund liquidity facility. Journal of Finance 68(2), 715-737.
Gürkaynak, R., Sack, B., and Swanson, E. 2005. Do actions speak louder than words? The response of asset prices to monetary policy actions and statements. International Journal of Central Banking 1.1.
Jimenez, G., S. Ongena, J.-L. Peydro, and J. Saurina 2014. Hazardous times for monetary policy: what do twenty-three million bank loans say about the effects of monetary policy on credit risk-taking?. Econometrica 82, 463-505.
Kacperczyk, M., and Schnabl, P. 2013. How safe are money market funds?. Quarterly Journal of Economics 128, 1073-1122.
Kuttner, K. N. 2001. Monetary policy surprises and interest rates: evidence from the fed funds futures market. Journal of Monetary Economics 47, 523–544.
Maddaloni, A. and J.-L. Peydró 2011. Bank risk-taking, securitization, supervision, and low interest rates: evidence from the Euro-area and the U.S. lending standards. Review of Financial Studies 24, 2121-2165.
McCabe, P. 2010. The cross section of money market fund risks and financial crises. Unpublished working paper. Federal Reserve Bank of New York.
Rajan, R. 2010. Fault lines. Princeton University Press.
Stein, J. C. 2013. Overheating in credit markets: origins, measurement, and policy responses. Delivered at restoring household financial stability after the great recession: why household balance sheets matter, a symposium sponsored by the Federal Reserve Bank of St. Louis, St. Louis.
Strahan, P., and Tanyeri, B. 2015. Once burned, twice shy: money market fund responses to a systemic liquidity shock. Journal of Financial and Quantitative Analysis 50, 119-144.
Woodford, M. 2003. Interest rates and prices: foundations of a theory of monetary policy. Princeton, NJ: Princeton University Press.
Yellen, J. 2011. Remarks at the international conference: real and financial linkage and monetary policy. Bank of Japan, http://www.federalreserve.gov/newsevents/speech/yellen20110601a.htm.

39
Figure 1: Assets Under Management of Prime Money Funds: 2005-2014
Note: The figure presents the evolution of weekly total net assets under management for the universe of prime money market funds over the period 2005-2014.
Figure 2: Fed Funds Rate: 2005-2014

40
Figure 3: Yields Distribution and ZIRP Shocks
Note: Empirical distributions of the fund portfolio yields before and after the three ZIRP shocks.

41
Figure 4: Money Funds vs. Bond Funds AUM: 2005-2014
The figure presents the evolution of weekly total net assets for the universe of prime money market funds and bond funds over the period 2005-2014.
Table 1: Zero Interest Rate Policy Events (ZIRP) We report the dates of FOMC meetings in which the Fed decided to change the Fed funds rate or provided policy guidance about the prevailing zero interest rate policy.
Date Event December 16, 2008 Fed funds rate reduced to 0-0.25% March 18, 2009 Zero rates for “an extended period of time” August 9, 2011 Zero rates at least until 2013 January 25, 2012 Zero rates at least until 2014 September 13, 2012 Zero rates at least until 2015

42
Table 2: Fund Gross Returns and Fed Funds Rate The sample is all U.S. prime money market funds over the period January 2005-December 2013. The dependent variable is Fund Gross Return computed as the annualized return. Fed Rate is the annualized Fed funds rate. Control variables include the natural logarithm of fund assets, the natural logarithm of family assets, the expense ratio (charged), fund age, fund flow computed as a percentage change in total net assets from time t to time t+1 adjusted for market appreciation, standard deviation of fund flow growth, and an indicator variable equal to one if the fund is offered to institutional investors and zero otherwise. All regressions are at the weekly level. Column (1) includes year-fixed effects, column (2) includes fund-fixed effects, column (3) includes sponsor-fixed effects, and column (4) includes year-fixed and sponsor-fixed effects. Standard errors are clustered at the week level. ***, **, * represent 1%, 5%, and 10% significance, respectively.
(1) (2) (3) (4)
Fed Rate 93.025*** 94.370*** 62.291*** 62.086***
(1.012) (0.963) (5.087) (5.083)
Controls Yes Yes Yes Yes Year-Fixed Effects No No Yes Yes Fund-Fixed Effects Yes No No No Sponsor-Fixed Effects No Yes No Yes Observations 98,496 98,496 98,496 98,496
Table 3: The Flow-Performance Relationship
The sample is all U.S. prime money funds over the period January 2005-December 2013. The dependent variable is Fund Flow, computed as the percentage change in total net assets from time t to time t+1, adjusted for market appreciation. Fed Rate is the annualized Fed funds rate. Fund Return is the annualized fund return. Control variables include the natural logarithm of fund assets, the natural logarithm of family assets, expense ratio (charged), fund age, fund flow computed as a percentage change in total net assets from time t to time t+1 adjusted for market appreciation, standard deviation of fund flow, and an indicator variable equal to one if the fund is offered to institutional investors and zero otherwise. All regressions are at the weekly level and include sponsor-fixed effects. High Rate restricts the sample to the period of high interest rates (Fed funds rate greater than 1%). Low Rate restricts the sample to the period of low interest rates (Fed funds rate between 0 and 1%). Columns (1), (4), and (5) additionally include week-fixed effects. Standard errors are clustered at the fund sponsor level. ***, **, * represent 1%, 5%, and 10% significance, respectively.
(1) (2) (3) (4)
VARIABLES\MODEL Flow Flow Fund Return 0.001*** 0.009*** 0.002*** 0.006***
(0.000) (0.001) (0.000) (0.002)
Fund Return×Low Rate
0.002** 0.006***
(0.001) (0.002)
Controls Yes Yes Yes Yes Sponsor-Fixed Effects Yes Yes Yes Yes Week-Fixed Effects No Yes No Yes
Observations 98,948 98,948 98,948 98,948

43
Table 4: Fund Strategies and ZIRP Shocks
The sample is all U.S. prime MMFs. The estimation window includes one month before and three months or six months after the event dates defined in Table 1. Event is an indicator variable equal to one for the period after the event date and zero for the period before the event date. In Panel A, the dependent variables are Number of Funds, defined as the number of funds in a given period, and Exit, defined as an indicator variable equal to one if the fund exits the fund industry in week t. In Panel B, the dependent variables are: the weekly annualized spread (Spread), the fraction of assets held in risky assets, net of the riskless assets (Holdings Risk), average portfolio maturity (Maturity Risk), and portfolio concentration, defined as a Herfindahl Index of asset classes (Concentration). In Panel C, the dependent variables are Charged Expenses, defined as percentage expense rate charged by a fund, Incurred Expenses, defined as percentage expense rate incurred by a fund, Subsidy, defined as the difference between incurred and charged expenses. Control variables include the annualized fund return, the natural logarithm of fund assets, the natural logarithm of family assets, expense ratio (charged), fund age, fund flow computed as a percentage change in total net assets from time t to time t+1 adjusted for market appreciation, standard deviation of fund flow, and an indicator variable equal to one if the fund is offered to institutional investors and zero otherwise. All regressions are at the weekly level and include year-fixed and sponsor-fixed effects. Standard errors are clustered at the week level. ***, **, * represent 1%, 5%, and 10% significance.
Panel A: Fund Exit
(1) (2) (3) (4)
VARIABLES # Funds Exit # Funds Exit
3 Months Ahead 6 Months Ahead
Event -5.400*** 0.002** -9.000*** 0.002**
(0.543) (0.001) (1.152) (0.001)
Controls No Yes No Yes Year-Fixed Effects No Yes No Yes Sponsor-Fixed Effects No Yes No Yes Observations 10 18,568 10 25,914
Panel B: Fund Risk
(1) (2) (3) (4) (5) (6) (7) (8)
VARBLES Spread Holding Risk Maturity Concentration Spread Holding Risk Maturity Concentration
3 Months Ahead 6 Months Ahead
Event 34.329*** 0.954*** -1.216** 0.005*** 21.341** 0.879*** -1.347*** 0.005***
(12.113) (0.323) (0.503) (0.002) (10.471) (0.271) (0.386) (0.001)
Controls Yes Yes Yes Yes Yes Yes Yes Yes Year-Month-Fixed Effects Yes Yes Yes Yes Yes Yes Yes Yes Sponsor-Fixed Effects Yes Yes Yes Yes Yes Yes Yes Yes Observations 16,830 16,882 16,879 16,882 23,462 23,527 23,524 23,527

44
Panel C: Fund Expenses
(1) (2) (3) (4) (5) (6)
VARIABLES Charged Incurred Subsidy Charged Incurred Subsidy
3 months ahead 6 months ahead
Event -0.001 -0.002** -0.002 -0.014** -0.003*** 0.010**
(0.002) (0.001) (0.002) (0.006) (0.001) (0.005)
Controls Yes Yes Yes Yes Yes Yes Sponsor-Fixed Effects Yes Yes Yes Yes Yes Yes Year-Fixed Effects Yes Yes Yes Yes Yes Yes Observations 18,568 18,506 18,506 25,914 25,829 25,829
Table 5: Fund Strategies and ZIRP Shocks: Conditioning on Sponsor Type
The design follows Table 5. Independent Sponsor is an indicator variable equal one if the fund sponsor is an independent asset management company, and zero otherwise.
Panel A: Fund Exit
(1) (2) (3) (4)
VARIABLES # Funds Exit # Funds Exit
3 Months Ahead 6 Months Ahead
Event -3.280*** 0.002*** -2.862*** 0.002***
(0.803) (0.001) (0.767) (0.001)
Independent Sponsor×Event 0.077 -0.002 0.178** -0.003**
(0.067) (0.002) (0.081) (0.001)
Controls Yes Yes Yes Yes Year-Fixed Effects No Yes No Yes Sponsor-Fixed Effects No Yes No Yes Observations 20 18,568 20 25,914
Panel B: Fund Risk
(1) (2) (3) (4) (5) (6) (7) (8)
VARIABLES Spread Holding Risk Maturity Concentration Spread Holding Risk Maturity Concentration
3 Months Ahead 6 Months Ahead
Independent Sponsor -3.837 6.642** 4.768*** 0 -0.776 5.681 5.107*** -0.011
(2.878) (3.309) (1.366) (0.020) (2.940) (3.492) (1.484) (0.021)
Independent 9.215*** 1.821*** -1.010** 0.008** 4.646*** 3.405** -1.897*** 0.026*** Sponsor×Event (1.239) (0.634) (0.460) (0.004) (1.668) (1.533) (0.709) (0.007) Controls Yes Yes Yes Yes Yes Yes Yes Yes Y/M-F.E. Yes Yes Yes Yes Yes Yes Yes Yes Observations 16,830 16,882 16,879 16,882 23,462 23,527 23,524 23,527

45
Panel C: Fund Expenses
(1) (2) (3) (4) (5) (6)
VARIABLES Charged Incurred Subsidy Charged Incurred Subsidy
3 months ahead 6 months ahead
Independent Sponsor -0.003 0.030 0.032 -0.006 0.029 0.034
(0.020) (0.039) (0.027) (0.022) (0.039) (0.027)
Independent Sponsor×Event 0.005 0.008 0.003 0.011 0.011 0
(0.006) (0.005) (0.007) (0.012) (0.010) (0.013)
Controls Yes Yes Yes Yes Yes Yes Week-Fixed Effects Yes Yes Yes Yes Yes Yes Observations 18,568 18,506 18,506 25,914 25,829 25,829
Table 6: Variation in Reputation within Independent Fund Sponsors
The design follows Table 5. Business Risk is the ratio of assets under management held by a fund family in non-money funds and total assets under management. Panel A presents the results for the 3-month announcement horizon and Panel B for the 6-month horizon.
Panel A: 3-Month Horizon Variable Exit Spread Holdings Risk Maturity Concentration Subsidy Event 0.001 25.207** 4.368* -0.120 0.018* -0.050***
(0.002) (12.275) (2.439) (0.936) (0.010) (0.015) Event× -0.001 -11.003* -3.661* -1.774* -0.016 0.062***
Business Risk (0.003) (6.241) (2.349) (1.002) (0.012) (0.019) Controls Yes Yes Yes Yes Yes Yes
Sponsor F.E. Yes Yes Yes Yes Yes Yes Year F.E. Yes Yes Yes Yes Yes Yes
Observations 7635 7030 7036 7036 7036 7619 Panel B: 6-Month Horizon
Variable Exit Spread Holdings Risk Maturity Concentration Subsidy Event -0.001 22.596** 7.848*** 2.395** 0.036*** -0.052***
(0.004) (10.835) (2.016) (0.958) (0.008) (0.011) Event× -0.001 -11.003** -8.226*** -4.705*** -0.039*** 0.079***
Business Risk (0.005) (4.826) (2.367) (1.113) (0.009) (0.015) Controls Yes Yes Yes Yes Yes Yes
Sponsor F.E. Yes Yes Yes Yes Yes Yes Year F.E. Yes Yes Yes Yes Yes Yes
Observations 10,659 9789 9802 9802 9802 10,633

46
Table 7: Comparisons across Interest Rate Regimes The sample is all U.S. prime money market funds over the period January 2005-December 2013. The definitions of all dependent and control variables follow those in Table 5. All regressions are at the weekly level and include year/month-fixed and sponsor-fixed effects. Low Rate is an indicator variable equal to one if Fed funds rate is below 1%, and zero otherwise. Standard errors are clustered at the week level. ***, **, * represent 1%, 5%, and 10% significance, respectively.
Panel A: Fund Exit
(1) (2) (3) (4)
VARIABLES # Funds Exit
RF>1 RF<=1
Fed Rate -1.555*** -2.348*** 0.003 -0.072***
(0.475) (0.258) (0.002) (0.016)
Low Rate
-132.783***
(12.459)
Fed Rate×Low Rate
16.861***
(3.171)
Controls Yes Yes Yes Yes Year/Month-F. E. No No Yes Yes Sponsor F. E. No No Yes Yes Observations 442 442 50,334 48,458
Panel B: Fund Risk
(1) (2) (3) (4)
VARIABLES Spread Holdings Risk Maturity Risk Concentration Fed Rate 2.713 -0.048 -0.893 0.001
(26.732) (0.28) (0.649) (0.001)
Fed Rate×Low Rate -56.611*** -5.941*** -1.673* -0.028***
(13.628) (0.723) (1.032) (0.006)
Controls Yes Yes Yes Yes Sponsor-Fixed Effects Yes Yes Yes Yes Year/Month-Fixed Effects Yes Yes Yes Yes Observations 94,521 95,264 95,253 94,264
Panel C: Fund Expenses
(1) (2) (3) (4) (5) (6)
VARIABLES\MODEL Charged Expenses Incurred Expenses Subsidy Fed Rate -0.006*** -0.005*** -0.002 0.004*** 0.004*** 0.008***
(0.001) (0.001) (0.002) (0.001) (0.001) (0.001)
Fed Rate×Low Rate
0.080***
-0.001
-0.079***
(0.027)
(0.011)
(0.022)
Controls Yes Yes Yes Yes Yes Yes Sponsor-Fixed Effects Yes Yes Yes Yes Yes Yes Year-Fixed Effects Yes Yes Yes Yes Yes Yes Observations 98,484 98,484 98,484 98,484 98,484 98,484

47
Table 8: The Effect of Longevity Risk The sample is all U.S. prime MMFs over the period January 2005-December 2013. The definitions of all dependent variables follow those in Table 5. Longevity is defined as the natural logarithm of 1 + the number of days that would take for the interest rates (30-day) to exceed 1%. The values are interpolated off the future yield curve. All regressions are at the weekly level and include year/month-fixed and sponsor-fixed effects. We focus on the case in which the Fed funds rate is below 1%. Standard errors are clustered at the week level. ***, **, * represent 1%, 5%, and 10% significance, respectively.
Variable Exit Spread Holdings Risk Maturity Concentration Subsidy Longevity 0.0012 29.937*** 0.0090*** -0.193 0.00300*** 0.030*** (0.0008) (7.046) (0.0017) (0.193) (0.00120) (0.006) Controls Yes Yes Yes Yes Yes Yes Sponsor F.E. Yes Yes Yes Yes Yes Yes Year F.E. Yes Yes Yes Yes Yes Yes Observations 48458 45322 46286 46054 46065 48298
Table 9: Evidence from Portfolio Holdings
The sample is all U.S. prime MMFs. The dependent variable is the mean of the yields of the new securities added to the fund portfolio. The estimation window includes one month before and three months after the last three event dates defined in Table 1. Event is an indicator variable equal to one for the period after the event date and zero for the period before the event date. Columns (4) and (5) repeat the analysis by considering a randomly drawn date that does not coincide with any of the ZIRP shocks dates. All regressions are at the monthly level and include year/month-fixed and fund-fixed effects. Standard errors are clustered at the monthly level. ***, **, * represent 1%, 5%, and 10% significance, respectively.
Panel A (1) (2) (3) (4) (5)
Mean Yield
Event: August 2011 Event: January 2012 Event: September 2012 Placebos
March 2011 January 2013 Event 0.0388*** 0.0439*** 0.0420*** -0.0302*** -0.0107***
(0.000701) (0.000971) (0.000371) (0.000438) (0.000287)
Controls Yes Yes Yes Yes Yes Year/Month-Fixed Effects Yes Yes Yes Yes Yes Fund-Fixed Effects Yes Yes Yes Yes Yes Observations 49,242 39,690 59,716 31,988 24,129
Panel B Number of Borrowers per fund (1) (2) Event -0.423** -0.378**
(0.209) (0.182)
Fund-Fixed Effects Yes Yes Time Trend No Yes Observations 1,288 1,288 R-squared 0.902 0.902

48
Panel C (1) (2) Outstanding Debt Post Fund Closure -0.419*** -0.153**
(0.0686) (0.0665)
Issuer-Fixed Effects Yes Yes Month-Fixed Effects No Yes Observations 52,682 52,682 R-squared 0.492 0.524
Panel D (1) (2) (3) (4)
Leverage 6-Month Window Leverage 6-Month Window Avg. Leverage 6-Month Window Leverage 1-Year Window
Post × Closure -0.006** -0.006* -0.020* -0.004
(0.003) (0.003) (0.011) (0.008)
Post 0.001 -0.000 0.007 0.002
(0.002) (0.001) (0.004) (0.007)
Closure 0.004 0.013** 0.016* 0.003
(0.012) (0.005) (0.008) (0.004)
Time-Fixed Effects Yes Yes Yes Yes Issuer-Fixed Effects No Yes Yes Yes Observations 895 895 448 1,784 R-squared 0.005 0.918 0.929 0.909
Table 10: Industry Response The sample includes all mutual funds families in U.S. over the period January 2005-December 2013. The dependent variable is the number of funds (at share class level) in a given period for a given type of fund within a fund family. Panel A groups funds into money, bond, equity, and balanced. Panel B divides bond funds into short-term, medium-term, and long-term. LR denotes low interest rate regime and HR denotes high interest rate regime. Treated is an indicator variable equal to one if the fund family closed one of its MMFs and zero for all other funds. After is an indicator variable equal to one six months after the closure of the MMF and zero six months before the fund closure. Control variables are family return and natural logarithm of family size. All regressions include fund family-fixed effects. Standard errors are clustered at the year-month level. ***, **, * represent 1%, 5%, and 10% significance, respectively.
Panel A: Asset Allocations
(1) (2) (3) (4) (5) (6) (7) (8)
VARIABLES Money Funds Bond Funds Equity Funds Balanced Funds
LR HR LR HR LR HR LR HR
After -0.113 0.000 0.070 -0.068 0.420 -0.275 0.174 0.296
(0.068) (0.500) (0.206) (0.198) (0.654) (0.546) (0.158) (0.185)
After×Treated -3.313** -0.688 7.098** -1.032 16.932 0.818 3.944* 0.643
(1.528) (1.657) (3.620) (1.987) (13.802) (3.455) (2.255) (1.181)
Controls Yes Yes Yes Yes Yes Yes Yes Yes Family-fixed effects Yes Yes Yes Yes Yes Yes Yes Yes Observations 2951 2834 2951 2834 2951 2834 2951 2834

49
Panel B: Bond Maturity
(1) (2) (3) (4) (5) (6)
VARIABLES Short-Term Bonds Medium-Term Bonds Long-Term Bonds
LR HR LR HR LR HR
After 0.105 0.090** 0.765* -4.410 -0.799** 4.251
(0.067) (0.041) (0.391) (3.095) (0.316) (2.969)
After×Treated 0.757** 0.397 1.604 -3.678 4.738* 2.249
(0.336) (0.479) (1.103) (9.684) (2.669) (9.883)
Controls Yes Yes Yes Yes Yes Yes Family-fixed effects Yes Yes Yes Yes Yes Yes Observations 2951 2834 2951 2834 2951 2834
Table 11: The Effect of MMF Closure on Managers’ Rotation The sample is conditional on the fund closing its operations. We track managers’ subsequent career outcomes. Possible career outcomes are: (1) staying in the same family and running a MMF, (2) staying in the same family and running a non-money market fund, (3) going to a different family and running a MMF, (4) going to a different family and running a non-money market fund, (5) leaving the fund industry (moving to private business, government institutions, setting up own company, etc.). We condition on a single manager departure in a given date (a particular multiple fund departure is called as one case).
Career Outcome MMF in the same family
Non-MMF in the same family
MMF in another family
Non-MMF in another family
Other finance career
# of Cases 61 30 35 22 40 % of Cases 32.4% 16.0% 18.6% 11.7% 21.3%