the unintended consequences of the zero-bound policy€¦ · the unintended consequences of the...
TRANSCRIPT

The Unintended Consequences of
the Zero-Bound Policy
Marco Di Maggio Columbia Business School
Marcin Kacperczyk
Imperial College and NBER
Abstract
We investigate the effect of the zero-bound interest rate policy on money market funds industry.
We find that, as the Fed funds rate approaches zero bound, money funds display reaching for yield
incentives in that they invest in riskier asset classes and hold less diversified portfolios. The
reduction in interest rates also increases the likelihood of funds exiting the market and lowers
expenses funds charge to investors. Consistent with the reputation concerns at stake, we find that
funds affiliated with large financial institutions are more likely to exit the market while funds
managed by independent asset management companies take on relatively more risk. Additional
evidence from the Fed’s forward guidance policy corroborates the findings.

1
I. Introduction
In the aftermath of the financial crisis of 2007-2008, the Federal Reserve took an unprecedented
decision to lower short-term nominal interest rates to zero, a policy commonly called a zero-bound
policy. Although this decision had a positive intention of stimulating a faltering economic growth
and boosting employment in the U.S. economy, it has also produced an adverse shock to
competitiveness of money market funds. Since money market funds invest in instruments that offer
rates that are close to the Fed funds rate, their gross profit margins collapsed nearly to zero and
many fund investors were facing investment opportunities with guaranteed negative returns after
paying their fund expenses. In this paper, we analyze the consequences of the interest rate policy for
the behavior of money market funds.
The traditional business model of money market funds used to rely on the idea that such
funds offer relatively low returns for the provision of ultimate safety. While this idea has been
somewhat shattered with the collapse of the Reserve Primary Fund and the run on money market
funds in September 2008, until then, money market funds offered positive rates to investors, even
after taking into consideration fund expenses. The consequence of the unprecedented change in the
interest rate to levels close to 0% has been that returns on traditional money market instruments,
such as Treasuries, repos, or deposits declined to similarly low levels. As a result, any fund investing
in such assets would guarantee negative net of expense returns to investors. Hence, it has become
obvious that this business model cannot be sustained as money would flow out of funds with
negative returns.
Such dire situation posed a dilemma for money market funds. On the one hand, they could
accept the situation and keep their risk profile as is. This, however, would force them to first reduce
or even waive their fees, and in the end, if the low-rates situation persist, to exit the market. On the

2
other hand, funds could reach for yield by shifting their risk into securities with higher interest rates,
thus accepting higher risk in their portfolios.
Money funds might increase the return offered to fund investors by means of reducing
expenses charged to investors, especially if they are part of larger financial institutions which can be
willing to subsidize the operation of the money funds. However, funds which struggle to generate
positive returns to their investors can also find it optimal to increase risk in their portfolios, which
would then lead to an increase in fund returns and potentially fund flows. As has been documented
in Kacperczyk and Schnabl (2013), money market funds face a typical positive flow-performance
relationship. Given that fund compensation is an increasing function of flows such strategy would
potentially improve the profitability of the funds themselves. Moreover, boosting fund net returns
above zero would likely prevent the fund from ultimate distress and exit from the market. The cost
of increasing risk, however, would be a higher chance of being run on in the event of distress in the
money market industry. The consequence of such runs would be distress of individual funds
themselves, which could generate high costs either in terms of the necessity to bail out the fund or
through the significant loss of reputation for the fund organization and other related business
centered on fund sponsor.
In this paper, we provide empirical evidence of the equilibrium response of money funds to
the low interest rates environment. We exploit both a time-series and cross-sectional variation in the
data to identify the effect of monetary policy on money market funds' strategies. Specifically, we
first look at the effect of the Fed funds rate on the funds return, expenses, probability to exit from
the industry, and the funds’ incentives to take risk. We show that there exists a strong discontinuity
in the effect of the Fed funds rate on these variables, because the Fed interest rate policy has no
significant effect when the rate is above one percent, but it becomes very significant both
economically and statistically in a low interest rate regime. In particular, we find that a reduction in

3
interest rate leads to a significant increase in risk-taking incentives, a reduction in charged expenses,
an increase in fund subsidies, and an increased probability to exit from the market.
Moreover, consistent with the differential incentives shaped by reputational concerns, we
find that the reaching for yield phenomenon is particularly pronounced for independent funds, that
is, funds that are not affiliated with a commercial bank, an investment bank, or an insurance
company. In contrast, rather than ramping up risk, affiliated funds are more likely to take the path
of exiting the market altogether. At the same time, we do not find significant differences across
fund types in terms of their expense policy.
To avoid any contamination of our results from other concurrent macro events and further
sharpen our empirical identification, we next turn to evidence from event studies related to an
unprecedented zero-bound interest rate policy introduced by the Fed in the aftermath of the
financial crisis. In particular, we study the money fund response to four FOMC announcements,
which signaled that interest rates would be kept low in the future. Those include the original
decision in December 2008 to lower Fed funds rate to zero, and subsequent four decisions of
forward guidance policies that provided more details on how long the bound would be maintained.
Important, these decisions were unlikely endogenous with respect to the behavior of money funds.
Within these event windows, we compare the money funds' risk choices, exit decisions, and expense
ratios both in the cross-section and in the time series.
We find that in the period of three to six months after these announcements, there is a
significant increase in the probability of exit from the fund industry, fund risk taking increases, as
measured by the funds’ spread and by the fraction of portfolio invested in riskier asset classes, and
expenses charged by money funds go down and the fund subsidies go up. Interestingly, while we do
not find any variation in the expenses incurred by these funds over time, the expenses charged are
4
significantly reduced during a zero interest rate period. This result suggests that money funds were
actively trying to maintain their net returns positive as a way of keeping their business alive and did
not simply witness a period of lower operating costs altogether. We also find significant differences
in the cross-section of funds consistent with our previous findings. Following the FOMC decisions,
funds that are affiliated with an independent sponsor take on relatively more risk but are less likely
to leave the money fund industry. At the same time we do not observe significant differences in the
cost policy across the two groups. These results are consistent with the explanation in which
reputational concerns shape up the strategic decisions of money funds.
Altogether, our results suggest that the unconventional monetary policy implemented during
the financial crisis by the Fed might have produced unintended consequences regarding the fragility
of an important part of financial markets, the market for short-term financing and shadow banking.
Specifically, low interest rates can decrease rather than increase the liquidity available for banks, as
one of the main sources of such wholesale funding, the money market funds, are incentivized to
invest in riskier securities when they are not forced to exit the market altogether.
Furthermore, the results highlight one important channel for monetary policy that has been
completely overlooked by the academic literature, but that is extremely relevant for practitioners and
policy makers. For instance, in August 2009 Fitch released a report about U.S. money market funds
stating that "Over the longer term, more conservative portfolio composition, combined with the
current low interest rate environment, may result in fund closures, fund consolidation, and/or a
resurgent appetite for credit and liquidity risk.”1
In the same spirit, a recent article on the Financial Times summarized the risks associated
with the zero interest rates as follows:
1 "U.S. Prime Money Market Funds: Managing Portfolio Composition to Address Credit & Liquidity Risks" is available on Fitch's web site at www.fitchratings.com.

5
“The risks are that as rates will plunge to zero or negative, money market funds and their investors
would panic as their sources of yield disappeared, and that banks will follow Bank of New York
Mellon's lead last year and consider the possibility of charging fees on deposits. Money market
funds would likely be subsidized for a time by their sponsors, but that can't be counted on to the
extent that it was before the crisis. Were this to pass, we couldn't with any certainty predict the
consequences—but given the panic that ensued when Reserve Primary broke the buck, it's worth
taking none of this lightly.”2
The rest of the paper proceeds as follows. In Section II, we discuss the related literature.
Section III provides further details about the institutional setting of money market funds. The
empirical design and data, as well as the empirical results are discussed in Section IV and Section V,
respectively. Section VI concludes.
II. Related Literature
Several papers have studied the role of money market funds during the financial crisis, the European
debt crisis, or outside the crisis. These include Christoffersen (2001), Christoffersen and Musto
(2002), Baba, McCauley, and Ramaswamy (2009), Duygan-Bump, Parkinson, Rosengren, Suarez, and
Willen (2010), McCabe (2010), Adrian, Kimbrough, and Marchioni (2011), Kacperczyk and Schnabl
(2013), Strahan and Tanyeri (2012), Wermers (2012), Chernenko and Sunderam (2012), and Di
Maggio (2012).
To the best of our knowledge ours is the first paper to examine the role of monetary policy
in affecting the risk-taking incentives of money fund managers. In this regard, the closest papers to
ours are Kacperczyk and Schnabl (2013), Strahan and Tanyeri (2012), and Di Maggio (2012) all of
2 Available at http://ftalphaville.ft.com/2012/07/20/1083261/ioer-negative-rates-and-ben/

6
which investigate the risk-taking incentives of money market funds before and after the collapse of
Lehman Brothers, and during the European debt crisis, respectively. The key difference between
these papers and ours is that we examine the role of the monetary policy to quantify the incentives
to reach for yields, to adjust fund expense policy, and to moderate the entry and exit dynamics of the
money fund industry.
More broadly, our paper sheds new light on the incentives for asset managers to reach for
yield, which has been identified as one of the core factors contributing to the buildup of credit that
preceded the financial crisis (Rajan (2010), Yellen (2011), and Stein (2013)). There might be several
explanations of the reaching-for-yield phenomenon. It could be driven by competition among fund
managers, or it could be a reflection of different preferences for risk or a desire to offset constraints
imposed by regulation. The contribution of this paper is to provide a setting in which the incentives
to reach for yield are on the one hand limited by strict regulation, yet on the other hand they are
significantly affected by changes in interest rates and expectations about future changes.
Our paper is also related to studies on the importance of monetary policy for asset prices.
Several papers investigate the response of the Treasury rates and asset prices to the FOMC
announcements (see among others, Krishnamurthy and Vissing-Jorgenson (2011), Gürkaynaka,
Sack, and Swanson (2005)) and of the term structure of interest rates to monetary policy surprises.
We contribute to this literature by examining the role of monetary policy in shaping fund managers’
incentives to reach for yield.
Finally, our paper has important implications for the vast literature on conducting the zero
interest rate monetary policy (for summary, see Woodford (2003), and Bernanke, Reinhart, and Sack
(2004)). In this regard, we highlight an important instability outcome that might be triggered by
conducting the zero-bound policy.

7
III. The Institutional Setting: Money Market Funds
Money market funds (MMFs) are important intermediaries between investors who want low-
risk, liquid investments and banks and corporations that have short-term borrowing needs. The
funds are key buyers of short-term debt issued by banks and corporations: commercial paper, bank
certificates, and repurchase agreements, with an aggregate volume of $1.8 trillion. Given the
importance of short-term credit markets to both investors and businesses, any disruption represents
a potential threat to financial stability. MMFs have recently drawn attention of academics as
illustrated by a strand of literature exploring their behavior during the financial crisis in 2007-2009
(Kacperczyk and Schnabl (2013) and Gorton and Metrick (2012)) and the more recent Sovereign
debt crisis (Chernenko and Sunderam (2012) and Ivashina, Scharfstein, and Stein (2012)). We
contribute to this literature by showing the impact of the zero interest rates on the funds' trading,
cost, and exit strategies.
Money market funds emerged in the 1970s as an alternative to bank deposits. At that time,
bank deposits were highly regulated and paid lower interest rates than did money market
instruments, which made money funds attractive to investors as they paid higher interest for taking
on comparable risks. Even though the regulation of bank deposits was eventually abolished, the size
of the fund industry grew steadily over time up to $2.4 trillion at the beginning of 2007 (see Federal
Reserve Flow of Funds Data).
An important characteristic of money funds is that, contrary to bank deposits, investments
in the funds are not insured by the government. But, contrary to regular mutual funds, money funds
seek to preserve the value of their assets at $1 per share. They do so by using historical cost
accounting, rather than market value pricing, to assess the value of their holdings. This allows them
to sell demand deposits that are considered almost as safe as bank deposits. The downside of this

8
approach is that it exposes them to runs. If the market value of a fund's holdings is expected to drop
below its amortized cost, investors tend to redeem their shares, which can exacerbate the market
value drop due to forced liquidation at re-sale prices. Also, funds may suffer losses on their
investments because of changes in interest rates or individual securities' defaults.
In the United States money market funds' holdings are regulated by Rule 2a-7 of the
Investment Company Act of 1940. The funds are prohibited from purchasing long-term assets such
as mortgage-backed securities, corporate bonds, or equity and can only hold short-term assets; and
even these short-term liabilities must be of high quality. As an additional requirement, to enhance
diversification, the funds cannot hold more than 5% of their assets in the securities of any individual
issuer with the highest rating and not more than 1% in the securities of any other issuer.
In January 2009, after a tumultuous year for money market funds, the SEC voted to amend
the 2a-7 rules to strengthen money market funds. The new rules seek to limit the risk and improve
on fund disclosure. For instance, funds are now required to have enhanced reserves of cash and
readily liquidated securities to meet redemption requests and they can invest only 3 percent (down
from 5 percent) of total assets in tier-2 securities, the term on which is limited to a maximum
maturity of 45 days.
Under the new rules, starting in November 2010 money market funds have make monthly
disclosure of detailed data, including each fund's holdings and shadow net asset value (NAV). This
information becomes available to the public after 60 days. The new N-MFP form on which it is
filed constitutes one the main sources of data for the present study.

9
IV. Research Design and Data
IV.A. Research Design
In our empirical tests we aim to identify the role of the interest rate policy for money funds’ risk-
taking behavior, the expense policy, and the likelihood to exit from the market. To this end, we
entertain two empirical strategies. In our first test, we examine the consequences of the changes in
the Fed funds rate over the longer period of 2005-2013. We restrict our attention to the period of
January 2005–December 2013 in order to have a relatively balanced panel around the time in which
the zero-bound policy was introduced. This period includes two distinct interest rate regimes: A
regime in which the rate is higher than zero percent (2005-2008) and a regime with zero interest
rates (2009-2013). As Figure 1 indicates, in the first regime the interest rate had been gradually
going up from 2% at the beginning of 2005 to 5.25% in the middle of 2007 and then subsequently
going down to 0-0.25% by the end of 2008. The second regime has been manifested by a
continuous zero interest rate policy (in fact, the rate has been cut to zero on December 16, 2008).
Our identification in this test comes from the various changes in interest rates over the
sample period. In addition, we examine the differences in fund behavior in periods of high rates and
low rates. In particular, we are interested to learn whether approaching zero bound alters fund
incentives in a significant way relative to other periods. To this end, we study fund responses
separately in periods with interest rates higher than 1% and in periods with rates equal to or less
than 1%.
In our second test, we refine our empirical strategy by looking only inside the zero interest-
rate regime. Our analysis of that sub-period allows us to keep the level of interest rates constant at
zero and further explore the importance of the additional communication from the Federal Reserve
regarding the duration of the zero-rate policy. In our context, the duration of zero rate policy is

10
crucial as it directly determines how long the money market fund business is subject to profit stress.
In particular, one could imagine that short-lasting policy would have different equilibrium
implications as money funds could withstand temporary headwinds by taking short-term losses. The
situation differs when the pressure is held for longer time.
In our analysis, we concentrate on the money fund behavior around events related to FOMC
meetings during which at least one of the following outcomes occurred: (1) a change in the interest
rates, (2) forward guidance announcement. Table 1 provides a short description of the events in a
chronological order. The first event date is December 16, 2008, which is the date of the meeting at
which the Fed funds rate was cut to 0-0.25%, while the other four event dates capture the meetings
in which the Fed gave its forward guidance regarding the duration of the zero-rate regime.
Specifically, on March 18, 2009, the Fed announced that the rates will be zero for “an extended
period of time”, while on August 9, 2011, January 25, 2012, and September 13, 2012 the Fed stated
that the rates will remain at zero until 2012, 2014, and 2015, respectively.
Our event-study analysis requires constructing reasonable windows around event dates.
Given that various money funds decisions can be adapted with different speed we consider two
horizons: a short-term horizon of three months after the event and a long-term horizon of six
months after the event. In both cases, the pre-event window is set at one month as we want to
ensure that no pre-event trends drive the patterns in our data. Our empirical strategy is to compare
the average fund behavior around the event date.
In both empirical tests, we also exploit cross-sectional differences across money market
funds. In particular, we distinguish between funds whose sponsors are affiliated with a large
financial institution, such as commercial bank, investment bank, or insurance company and funds
whose sponsors are affiliated with an independent asset management company. We believe the two

11
groups might exhibit distinct responses to the events of interest rate changes. For example, the
bank-affiliated funds might exhibit weaker incentives to reach for yield than independent funds to
limit the probability of the bad outcome in which the bank would be forced to invest resources to
save the fund. Independent funds, in turn, have stronger incentives to reach for yield in order to
provide investors with higher returns, which should compensate the investors for giving up the
implicit insurance of the bank. Moreover, bank-affiliated funds might have reputation at stake in
which case they might prefer to exit the less risky yet unprofitable fund industry rather than improve
its profitability by ramping up risk.
IV.B. Data
We collect data from four sources. First, we obtain data on the universe of taxable money market
funds from iMoneyNet, which cover the period from January 2005 to December 2013 and include
weekly fund-level data on yields, expense ratios (charged and incurred), average maturity, holdings
by instrument type, and fund sponsor. Second, we complement the data with information from the
CRSP Mutual Fund Database, especially assets under management of the fund sponsor. Third, we
use COMPUSTAT and companies' websites for information on fund sponsor characteristics. Similar
data, though for a different time period, have been already used and additionally discussed in
Kacperczyk and Schnabl (2013). Fourth, we gather detailed information about Fed funds rate
changes and the forward guidance policy from the Federal Reserve Board website.
We conduct our analysis at the fund portfolio level. We therefore aggregate all share classes
by fund and type of investor (retail, institutional). We compute fund characteristics (e.g., expense
ratio) as the weighted average with assets per share class as weights. Some funds offer both retail
and institutional share classes. Institutional shares are generally larger; hence, we classify a fund as

12
institutional if it offers at least one institutional class and as retail if it does not offer institutional
share classes.
Table 2 provides the summary statistics of the data. In columns (1) and (2), we provide
information about mean and standard deviation of various fund and sponsor characteristics in the
entire sample period. Our sample includes 349 different fund portfolios. The average fund size in
our sample equals approximately $8.3 billion. The average portfolio maturity is 40 days and the
average fund age equals 15.8 years. The average Fed funds rate in our sample equals 182 basis
points while the average gross fund return equals 231 basis points. Out of the abnormal profit of 48
basis points 38 basis points account for expenses, which leaves about 10 basis points accruing to
fund investors. Notably, our sample is quite balanced with respect to sponsor type as 59% of funds
have bank-affiliated sponsors and 41% are sponsored by independent asset management companies.
In the subsequent four columns, we compare sample properties between the high-rate and
low-rate regimes. This sample split is based on the median interest rate equal to 1% and reflects our
view of what we consider a period of profit stress. Comparing the two sub-samples we note a
number of interesting patterns. First, the spread during the low-rate period is 25% lower than that
in the high-rate period; also, the nominal gross return was almost ten times larger in the high-rate
period. This suggests that money market funds faced greater challenges in obtaining high returns in
a low interest rate environment. Second, if we look at the expenses charged they are significantly
lower in the low-rate period, with a drop from 50 to 28 basis points, while the expenses incurred
remain almost the same. This suggests that while the costs were not affected by the monetary
policy, the stress imposed on the profit margin reduced the possibility for the fund to charge fees to
the investors. In other words, funds were more likely to offer subsidies to their fund investors.
Third, while fund flows are positive during the earlier period, they become negative in the low
interest rate environment. This is consistent with the idea that investors have become less willing to

13
make investments in money market funds as their returns became less attractive. Finally, we observe
a significant decline of more than 50 in the number of funds over the two periods: from 326 to 274
funds in the second period, which constitutes a significant exit from this sector.
In the last four columns of Table 2 we focus only on the period of low interest rates and
report separate summary statistics for two major groups of funds: bank affiliated and independent.
Bank-affiliated funds are defined as funds sponsored by a commercial bank, an investment bank, or
an insurance company. Bank-affiliated funds are on average smaller with the difference of about $3
billion. They are also less risky as their spreads are lower; they invest in shorter maturity assets as
well as in safer assets as repos and Treasuries. They also charge slightly lower expenses, and they
face higher outflows, consistent with the flow-performance relationship observed in other studies
(Chevalier and Ellison (1997), and Kacperczyk and Schnabl (2013)).
V. Empirical Results
In this section, we present the main results of the paper. First, we illustrate the importance interest
rates play in generating fund returns and illustrate the link between fund returns and subsequent
fund flows. Next, we look at the effects on risk taking, fund exit, and expenses of changes in the
Fed funds rate near the zero interest rate bound and compare them to any other changes in interest
rates before the zero-bound policy. Finally, we zero in on the effects within the low interest rate
policy and examine similar behavior around the FOMC interest rate and forward guidance
announcements.

14
V.A. The Effect of the Fed Funds Rate Changes
V.A.1 Flow-Performance Relationship
We begin our analysis by identifying the link between interest rate and gross fund return. To this
end, we estimate the regression model of fund returns (Fund Return) on the Fed funds rate over the
entire sample period. In this regression model, we control for other determinants of fund returns
possibly correlated with the level of interest rates, such as the natural logarithm of fund size
(Log(Fund Size)), the natural logarithm of fund family size (Log(Family Size)), the level of expenses
charged by funds (Expenses), the natural logarithm of fund age (Age), the percentage change in fund
assets accounted for capital appreciation (Fund Flow), the standard deviation of fund flows (Fund
Flow Volatility), and an indicator variable for the fund that is institutional (Institutional). Further, we
account for any time-invariant fund and sponsor characteristics by introducing fund-fixed and
sponsor-fixed effects. To address a potential concern that interest rates do not vary across fund
observations within given week and thus Fed funds rate might simply proxy for the time trends in
the data we also include year-fixed effects. Finally, we cluster standard errors at the time dimension
to address the possibility that interest rates are identical across fund observations. We report the
results in Table 3.
Our results show that fund performance is higher in periods of higher interest rates. The
effect is statistically and economically highly significant. Specifically, a one-standard-deviation
increase in the interest rate leads to an increase of 128-194 basis points in the fund return, more than
60% change in terms of one standard deviation of fund returns. This result underscores the
importance of interest rate regimes for generating fund performance.
In the next test, we show that generating superior performance has important implications
for fund flows and hence for fund manager compensation. To this end, we estimate the standard

15
flow-performance relationship. Kacperczyk and Schnabl (2013) demonstrate the presence of such a
relationship in the pre-Lehman period for the subsample of institutional money funds. Here we
examine this relationship for all prime funds over the longer time period and separately for the high-
rate and low-rate regimes. Our set of controls mimics that used in Table 3. However, given the
nature of the data in some specifications we account for the finer week-level variation by
introducing week-fixed effects. In all regressions we cluster standard errors at the fund sponsor
level. Table 4 reports the results.
In column (1) we report the results for the full sample of money funds. We confirm the
findings from earlier studies that investors exhibit strong sensitivity to fund past returns. The
coefficient of Fund Return is positive and highly statistically significant. It is also economically
significant: A one-standard-deviation increase in Fund Return results in a fund flow of about 1.9% per
week, which is approximately 40% of the standard deviation of fund flows in the data. In terms of
fund size, it means over the year a fund with a one-standard-deviation higher return than the average
would almost double its size relative to the average fund.
In column (2), we also show that fund flows are positively correlated with the Fed funds
rate, which is a direct consequence of our earlier findings in Table 3. In column (3), we further
show that the flow-performance relationship does not depend on the level of interest rates, as the
coefficient of the interaction term Fund Return*Fed Rate is statistically insignificant. This result
however is obtained without properly accounting for week-fixed effects and does not account for
potential nonlinearities in which interest rates affect the sensitivity. To this end, in columns (4) and
(5) we further provide estimates of the flow-performance relationship separately for the period with
high interest rates and low interest rates.

16
At first glance, it seems that the flow-performance relationship is stronger in periods of
lower interest rates as the coefficient of Fund Return is about 30% larger in that sample. Hence, we
conclude that the changes in interest rates altered considerably the payoff per unit of extra
performance. What has also changed is the level of fund performance which made investors less
attracted to money funds and triggered significant fund responses in terms of their exit, risk-taking,
and expense strategies. We now discuss each of these adjustments.
V.A.2 Adjustments along Exit, Risk-Taking, and Expense Strategies
Since interest rate environment directly affects profit opportunities it is becoming increasingly more
difficult for funds to operate profitably as the interest rates approach zero rate bound.
Consequently, they might need to adjust along various margins, such as their exit strategies, their
risk, and expense policy.
We begin by analyzing the effect of the Fed rate on the number of active funds and on the
probability of their exit. To this end, we estimate the regression model for each of the two
dependent variables on the level of Fed funds rate using a full sample of funds and two sub-samples
based on the level of interest rates. Apart from the standard controls we used before, all regressions
include year/month-fixed effects and sponsor-fixed effects. We cluster standard errors at the week
level. Table 5 reports the results.
Overall, we find little effect of higher interest rates on exiting or attrition in this industry in
the full sample as highlighted by columns (1) and (4). However, significant differences emerge when
we compare results across two interest-rate regimes. While we again find little effect of interest rate
changes on exit strategies in the high-rate regime, as evidenced in columns (2) and (5), we find that
the changes in interest rates from 1% towards zero have a very important implications for fund exit,
as demonstrated in columns (3) and (6). In particular, we find that by reducing the Fed rate from

17
1% to 0% the number of funds in our sample decreases by about 11.3, and the probability of exiting
from the industry increases by 7.2%. Both effects are highly significant both statistically and
economically. Notably, in this specification, we include very fine year/month-fixed effects, which
makes it highly unlikely that we are picking up the time trend, or the effect of some unobserved
macro shock.
We next turn to the funds’ incentives to take risk. We use four different measures of risk,
similar to those used in Kacperczyk and Schnabl (2013). Spread is the difference between Fund
Return and the rate on Treasury bill; Holdings Risk is a long-short portfolio invested long in the
riskiest asset class (bank obligations) and short in the safest asset class (Repos and U.S. Treasuries
and Agency assets); Maturity Risk is the weighted average maturity of the fund; Concentration is a
Herfindhal index of the portfolio holdings in risky assets, such as commercial paper, asset-backed
commercial paper, floating-rate notes, and bank obligations. Higher values of each measure indicate
a greater degree of risk taking. We estimate the regression model in which the dependent variables
are various risk measures and the main independent variable is Fed Rate. As before, all regressions
include year/month-fixed effects and sponsor-fixed effects, and standard errors are clustered at the
week dimension. We report the results in Table 6. Given our interest in the effects of low-rate
policy we only report results for the low-rate regime; the high-rate regime results are significantly
weaker and omitted for brevity.
We find a statistically significant positive effect of reducing Fed Rate on the level of risk for
three out of four risk measures. The effect is negative, but statistically insignificant for Maturity Risk.
In terms of economic values, a reduction in the Fed Rate from 1% to 0% increases Spread by almost
95 basis points Holdings Risk by 6.8 percent, and Concentration by 2.4%. These are sizable effects,
especially for the money funds with returns close to zero.

18
Our last dimension of adjustment is the expense policy. It is apparent that in the wake of
low interest rates and thus low returns fund companies might want to maintain their client
relationship by reducing the fees charged to their investors, effectively increasing these investors’ net
returns. We want to contrast this behavior with the expenses that are truly incurred by the funds
which are more difficult to adjust. In addition, we measure the degree of subsidies that funds offer
to their investors by taking the difference between incurred and charged expenses. We estimate the
regression model in which Charged Expenses, Incurred Expenses, and Subsidy are our dependent variables
and Fed Rate is our main independent variable. All other controls are the same as before. However,
in contrast to previous regressions, we cluster standard errors at the sponsor level since fund
expenses seem to be quite persistent over time and thus this dimension of dependence produces
more conservative standard errors. Table 7 reports the results from the estimation for the full
sample and the two sub-samples of high and low rates.
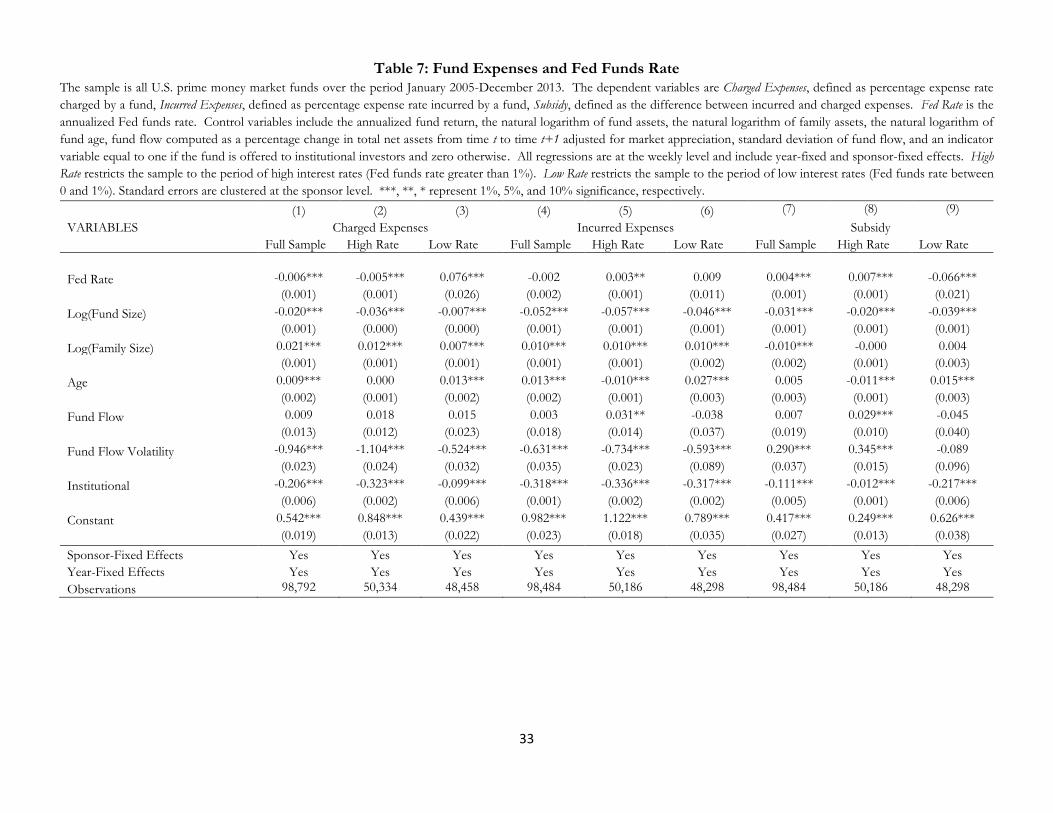
The results, in columns (1), (4), and (7), indicate a general negative effect of interest rates on
fund expenses, both charged and incurred, and a positive effect on fund subsidies. However, this
result is largely driven by the high-rate regime (columns (2), (5), and (8)), that is, fund expenses are
generally lower when interest rates are higher, perhaps because funds have generally higher profit
margins and do not need to charge much for their service. However, the opposite is true when
interest rates approach zero bound: Lower rates reduce the expenses charged by the funds. As the
Fed Rate goes down from 1% to 0% funds charge 7.6 basis points less for their service, as presented
in column (3). This reduction occurs despite the fact that fund incurred expenses are generally
unaffected by the interest rate change, as demonstrated in column (6). This asymmetric response in
expenses is equivalent to an increase in fund subsidies offered to investors. As presented in column
(9), a decrease in Fed Rate from 1% to 0% increases fund subsidy by an economically large 6.6 basis
points. This effect is statistically and economically highly significant.

19
V.A.3 Evidence from the Cross-Section of Funds
So far, we based our results on the time-series identification strategy, that is, we compared
changes in fund behavior across different levels of the Fed funds rate. In this section, we further
buttress our identification strategy using cross-sectional variation in the incentives to respond to
profit margin squeeze across different fund sponsors. As we have demonstrated, fund sponsors
might want to respond to margin deterioration either by changing their exit, their risk, or expenses
strategies. However, these responses also might depend on other concerns. In particular, fund
sponsors with greater reputation concerns at stake or greater ability to provide funding in case of the
run might want to internalize these negative spillovers by either taking less risk or leaving the
industry altogether. They might also entertain different pricing strategies. In our sample, we
postulate that the important dimension of differences is whether the fund is sponsored by a financial
institution (with large concerns and greater ability to pay) or is sponsored by an independent asset
management company (usually with less reputation concern and smaller ability to pay).
We explore these differences empirically using a difference-in-differences regression
approach. In particular, we want to compare exit, risk taking, and expenses strategies for funds with
different sponsor type across High-Rate and Low-Rate regimes. To this end, we define two
indicator variables: Independent Sponsor equal to one if the sponsor is an independent company and
zero if it is a financial institution; Low Rate equal to one if the Fed Rate is at most 1% and zero if the
rate is above 1%. The differential effect of the change in the interest rate regime across two fund
types will be measured by the coefficient of the interaction term Independent Sponsor* Low Rate.
In Table 8, we present the results for the number of funds and exit strategies. All
regressions include year/month-fixed and sponsor-fixed effects. We find a positive and statistically
significant effect of the interaction term for the number of funds: There are relatively more funds

20
sponsored by independent companies in the low-rate regime. At the same time, the results indicate
little evidence of differences across fund types in terms of their exit strategies.
Table 9 reports the results for the risk measures. In all regressions, we include week-fixed
effects; thus eliminating any possible effects due to time trends. Consistent with our hypothesis that
independent funds might have less at stake in terms of their risk taking, we find that such funds, on
average, take on more risk when the monetary policy shifts to lower interest rate regime. This effect
is statistically and economically large for all four measures of risk. Specifically, relative to affiliated
funds, the spread of independent funds increases by 2.4 basis points, holdings risk increases by 7.3
basis points, funds maturity risk increases by one third of the standard deviation, or equivalently by
4.5 days on average, and concentration increases by 3.8 percentage points. In all regressions, the
coefficient of Independent Sponsor is not statistically different from zero, which suggests the two
groups of funds are similar to each other in high-rate periods.
We entertain similar tests for two measures of expenses and subsidy and report the results in
Table 10. Although independent sponsors are on average less likely to subsidize their funds, we find
no statistically significant differential effect between the independent funds and the bank-affiliated
funds in terms of expense strategies. These results suggest that even though funds, in general, lower
their expenses in the low-rate regime they do not execute this strategy in economically distinct ways.
V.B. Fund Strategies around the FOMC Announcements
Up to this point we have analyzed the effect of Fed funds rate on different outcome variables over
different sample periods, also taking advantage of the cross-sectional differences across fund
sponsors. In this section, we turn into our second empirical strategy in which we evaluate fund
behavior, both in the time series and in the cross-section around the important decisions taken by
the FOMC during the low interest rate period. As we have argued before there are five events in

21
which the Fed has signaled important information regarding the level and duration of the zero
interest rate policy. We study the changes in fund behavior before and after such events, also
conditional on fund sponsor type. Our main variable in all tests is Event which is an indicator
variable equal to one for the period after the event date and zero beforehand.
In our analysis, we consider two types of windows: We first look at the interval between one
month before and three months after the event, then we investigate the effect over a longer time
interval as we compare the outcome over the six months after the event compared to the month
before the event. We restrict attention to one month before the event to avoid any contamination
with other potential events. We analyze these two types of windows because there are strategies that
the funds can immediately alter, such as the riskiness of their portfolio or expense policy, but also
other strategies for which we might not observe any effect for an extended period of time, such as
the exit from the market.
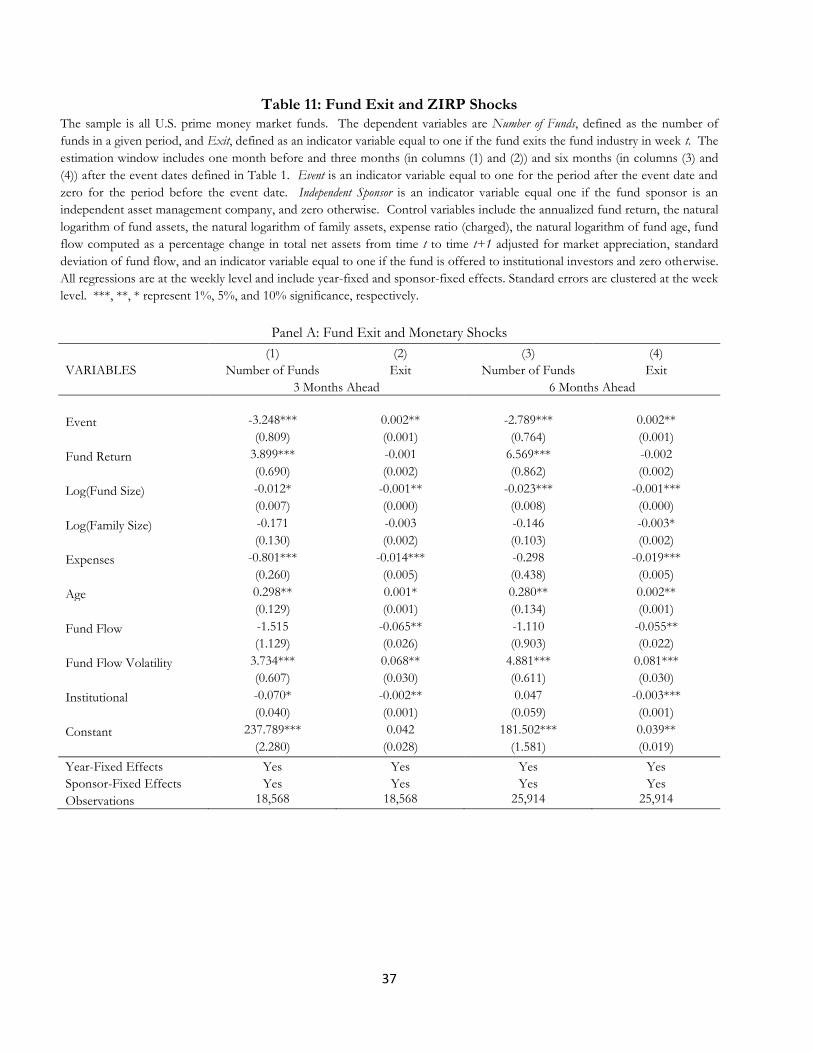
We begin with the analysis of the exit strategy. Panel A of Table 11 reports the results. We
find that, on average, three funds drop after the event both in the shorter and longer time window.
Similarly, we find that the probability of exiting the industry increases significantly in both horizons
following the event. We have reported the results for all the events together, but we find consistent
results for each event separately. Moreover, later events are more important than early ones,
perhaps the forward guidance policy extended the low-rate regime into a longer future with more
certainty. In sum, our results indicate that there is indeed tension in the industry generated by the
monetary policy.
Panel B shows a similar event study analysis but conditional on the sponsor type. The
incremental effect of change with respect to sponsor type is measured by the coefficient of the
interaction term Event*Independent Sponsor. We find that the independent funds are more likely to stay

22
and less likely to exit because these are the funds which are less wary of any reputational concerns
due to runs. Instead, these funds offset their profits’ squeeze by increasing their risk taking to attract
more investors. The result is particularly strong for the longer six-month window, which is
consistent with our premise that adjustments, such as exit might take longer to materialize.
Next, we perform a similar analysis for the risk-taking incentives. The results are reported in
Panel A and Panel B of Table 12. We find that as a result of strengthening the policy of the zero
interest rate, three out of four measures of fund riskiness increase. The only one that in fact goes
down is Maturity Risk. But this is likely driven by the provision in the Dodd-Frank Act which
implemented a significantly higher lower bound for the fraction of assets maturing within the next
seven days that money market funds need to hold. The results in the cross-section of funds,
reported in Panel B, generally paint a picture that funds sponsored by independent asset
management companies take on more risk following the change in the interest rate policy. This
result is true again for the same three measures of risk as before. Overall, these results are consistent
with our earlier finding that lowering interest rates makes such funds reach for yield relatively more.
Finally, we investigate changes in the expense policy. The results are reported in Panel A
(for the time series) and Panel B (for the cross-section) of Table 13. Consistent with the previous
findings, we find that the expenses charged (fund subsidies) get reduced (increased) following the
FOMC events. These effects are particularly strong for the longer, six-month window, which might
reflect some stickiness with which fund companies generally respond in terms of their expense
policies. Again, we find no differences across fund types in terms of their expense policies. Notably,
many funds often waive their expenses to investors, especially in the low-rate regimes, another
dimension of adjustment which can be used to alleviate the pressure due to low interest rate policy.
23
To the extent that the FOMC events trigger attrition in the fund industry the worry is that
our results for risk taking might be mechanically different by differences in the sample selection
before and after the events. To the extent that safer funds were more likely to exit we could observe
an increase in average risk taking even though individual funds might not change their policies at all.
We address this concern by focusing on a subset of funds that are present in both periods around
the event date. In Table 14, we present the results from the estimation of regression models similar
to those in Table 12. The results we find are qualitatively and quantitatively very similar to those
reported before; thus, our results are unlikely to be driven by the differential selection within the
event window.
In sum, our results corroborate our earlier findings that money funds respond to pressures
in their business due to unusually low interest rates either by increasing the riskiness of their
portfolios, lowering (increasing) the expenses (subsidies) they charge to their investors, or leaving
the fund industry altogether. The strength of these effects tends to vary with the fund sponsor,
especially when it comes to dimensions of risk and exit.
VI. Conclusion
This paper investigates the consequences of the zero interest rate policy on the money market funds’
behavior. The monetary policy has a direct effect on money market funds as these primarily invest
in asset classes whose returns are linked to the Fed funds rate. This constitutes a great setting to
explore the unintended consequences that monetary policy may have on financial markets.
We uncover novel empirical evidence showing that the low interest rate regime leads fund
managers to increase the risk of their portfolios in order to generate positive returns. The effect is
more pronounced for funds sponsored by asset management companies. Almost all funds
significantly reduced their expenses charged, even if the incurred expenses did not vary much over
24
time, as an attempt to deliver non-negative net returns to their investors. These subsidies amounted
to an economically large value of $27 million per average fund and about $7.3 billion for all funds.
We also show that the funds that are not successful in retaining their investors’ base, or are worried
about possible negative reputation spillovers, are more likely to leave this market as a response to
the cuts in interest rates.
References
Adrian, T., Kimbrough K., and Marchioni, D. (2010), “The Federal Reserve's Commercial Paper
Funding Facility”, Staff Report no. 423, Federal Reserve Bank of New York
Baba, N., McCauley, R., and Ramaswamy, S. (2009), “US Dollar Money Market Funds and non-US
Banks”, BIS Quarterly Review, March.
Bernanke, B., Reinhart, V., and Sack, B. (2004), “Monetary Policy Alternatives at the Zero Bound:
An Empirical Assessment”, Brookings Papers on Economic Activity 2004(2), 1-100.
Chernenko, S., and Sunderam, A. (2012), “Frictions in Shadow Banking: Evidence from the Lending
Behavior of Money Market Funds”, Fisher College of Business Working Paper, (2012-4).
Chevalier, J. and Ellison, G. (1997), “Career Concerns of Mutual Fund Managers”, Quarterly Journal of
Economics 114(2), 389-432.
Christoffersen, S. K. (2001), “Why Do Money Fund Managers Voluntarily Waive Their Fees?”,
Journal of Finance 56(3), 1117-1140.
Christoffersen, S. K. and Musto, D. K. (2002), “Demand Curves and the Pricing of Money
Management”, Review of Financial Studies 15(5), 1499-1524.
Di Maggio, M. (2013), “Market Turmoil and Destabilizing Speculation”, Columbia Business School
Working Paper.
Duygan‐Bump, B., Parkinson, P., Rosengren, E., Suarez, G. A., & Willen, P. (2013), “How Effective
Were the Federal Reserve Emergency Liquidity Facilities? Evidence from the Asset‐Backed
Commercial Paper Money Market Mutual Fund Liquidity Facility”, The Journal of Finance 68(2), 715-
737.
Gorton, G. B., & Metrick, A. (2012), “Who Ran on Repo?” (No. w18455). National Bureau of
Economic Research.

25
Gürkaynak, R. S., Sack, B., and Swanson, E. T. (2005), “Do Actions Speak Louder Than Words?
The Response of Asset Prices to Monetary Policy Actions and Statements”, International Journal of
Central Banking.
Ivashina, V., Scharfstein, D. S., and Stein, J. C. (2012), “Dollar Funding and the Lending Behavior of
Global Banks” (No. w18528). National Bureau of Economic Research.
Kacperczyk, M., and Schnabl, P. (2013), “How Safe are Money Market Funds?”, The Quarterly Journal
of Economics 128(3), 1073-1122.
Krishnamurthy, A., and Vissing-Jorgensen, A. (2012), “The Aggregate Demand for Treasury
Debt”, Journal of Political Economy 120(2), 233-267.
McCabe, P. (2010), “The Cross Section of Money Market Fund Risks and Financial Crises”, Federal
Reserve Board Working Paper.
Rajan, R. (2010), Fault Lines, Princeton University Press.
Stein, J. C. (2013, February). “Overheating in Credit Markets: Origins, Measurement, and Policy
Responses.” Speech delivered at “Restoring Household Financial Stability after the Great Recession:
Why Household Balance Sheets Matter,” a symposium sponsored by the Federal Reserve Bank of
St. Louis, St. Louis.
Strahan, P., and Tanyeri, B. (2012), “Once Burned, Twice Shy: Money Market Fund Responses to a
Systemic Liquidity Shock”, Boston College Working Paper.
Wermers, R. (2012), “Runs on Money Market Mutual Funds”, Available at SSRN 2024282.
Woodford, M. (2003), “Interest Rates and Prices: Foundations of a Theory of Monetary Policy”,
Princeton, NJ: Princeton University Press.
Yellen, J. (2011), Remarks at the International Conference: Real and Financial Linkage and Monetary
Policy, Bank of Japan, http://www.federalreserve.gov/newsevents/speech/yellen20110601a.htm.

26
Figure 1: Fed Funds Rate: 2005-2013 The figure presents the evolution of Fed funds rate over the period 2005-2013.
0%
1%
2%
3%
4%
5%
6%

27
Table 1: Zero Interest Rate Policy Events (ZIRP) We report the dates of FOMC meetings in which the Fed decided to change the Fed funds
rate or provided policy guidance about the prevailing zero interest rate policy.
Date Event
December 16, 2008 Fed funds rate reduced to 0-0.25 March 18, 2009 Zero rates for extended time period August 9, 2011 Zero rates at least until 2013 January 25, 2012 Zero rates at least until 2014 September 13, 2012 Zero rates at least until 2015

28
Table 2: Summary Statistics The sample is all prime money market funds. The data span the period January 2005-December 2013. The first two columns provide the results for the entire sample over the full period.
The subsequent two columns (High Rate) restrict the sample to the period of high interest rates (Fed funds rate greater than 1%). In the next two columns (Low Rate), we restrict the
sample to the period of low interest rates (Fed funds rate between 0 and 1%). The following four columns focus on the low-rate regime and summarize the data of funds whose sponsors
are affiliated with a financial institution (Affiliated) and for funds whose sponsors are independent asset management companies (Independent).
Variable Unconditional High Rate Low Rate Low Rate: Affiliated Low Rate: Independent
Mean St. dev. Mean St. dev. Mean St. dev. Mean St. dev. Mean St. dev.
Fed Rate (in %) 1.83 2.02 3.65 1.31 0.06 0.15 0.06 0.15 0.06 0.15
Fund Return (in bps) 231.07 206.28 419.13 114.58 46.95 53.23 46.41 52.78 47.72 53.84
Spread (in bps) 47.24 53.84 53.85 61.78 40.74 43.74 40.14 43.14 41.60 44.56
Holdings Risk (in %) -8.30 27.98 -5.13 26.19 -11.37 29.29 -14.34 27.32 -7.17 31.38
Maturity (in days) 40.29 13.05 39.55 12.85 41.00 13.21 39.12 12.77 43.66 13.36
Concentration (in %) 27.63 17.52 31.91 18.43 23.50 15.52 23.37 16.36 23.69 14.25
Expenses Charged (in bps) 38.54 25.38 49.69 27.98 27.63 16.37 27.16 16.60 28.29 16.02
Expenses Incurred (in bps) 56.99 32.38 58.36 32.62 55.65 32.10 53.74 28.30 58.34 36.63
Subsidy 18.34 27.33 8.50 20.50 27.97 29.65 26.53 25.58 30.01 34.48
Fund Size 8303 21651 7083 17173 9481 25176 8102 24211 11430 26356
Family Size 151599 253903 122320 204508 182160 293725 113790 118291 279344 415854
Age (in years) 15.80 7.86 13.40 7.04 18.13 7.91 17.28 7.87 19.33 7.81
Fund Flow (in %) 0.05 4.78 0.26 5.24 -0.16 4.28 -0.19 4.64 -0.12 3.70
Fund Flow Volatility (in %) 3.66 3.86 4.12 4.27 3.21 3.37 3.57 3.52 2.70 3.08
Independent Sponsor (in %) 40.92 49.17 40.37 49.07 41.44 49.26 0 0 100 0
Bank Affiliated Sponsor (in %) 59.08 49.17 59.63 49.07 58.56 49.26 100 0 0 0
Sponsor Equity 10117 17052 9955 16742 10275 17345 16580 19918 1374 5492
U.S. Treasuries & Agency 0.10 0.16 0.07 0.13 0.13 0.18 0.13 0.16 0.15 0.20
Repurchase Agreements 0.13 0.15 0.11 0.15 0.14 0.16 0.16 0.16 0.13 0.15
Bank Deposits 0.02 0.06 0.02 0.06 0.03 0.07 0.03 0.06 0.02 0.07
Bank Obligations 0.15 0.14 0.13 0.13 0.17 0.15 0.14 0.14 0.20 0.15
Floating-Rate Notes 0.18 0.17 0.20 0.17 0.17 0.17 0.17 0.18 0.16 0.15
Commercial Paper 0.30 0.22 0.34 0.24 0.26 0.19 0.26 0.19 0.26 0.19
Asset-Backed Commercial Paper 0.11 0.14 0.13 0.15 0.10 0.12 0.11 0.12 0.08 0.11
Institutional Funds (in %) 45.94 46.76 45.73 46.71 46.14 46.81 47.63 46.81 44.02 46.72
Number of Funds 349 326 274 159 115

29
Table 3: Fund Returns and Fed Funds Rate The sample is all U.S. prime money market funds over the period January 2005-December 2013. The
dependent variable is Fund Gross Return computed as the annualized return. Fed Rate is the annualized Fed
funds rate. Control variables include the natural logarithm of fund assets, the natural logarithm of family
assets, expense ratio (charged), the natural logarithm of fund age, fund flow computed as a percentage
change in total net assets from time t to time t+1 adjusted for market appreciation, standard deviation of
fund flow growth, and an indicator variable equal to one if the fund is offered to institutional investors and
zero otherwise. All regressions are at the weekly level. Column (1) includes year-fixed effects, column (2)
includes fund-fixed effects, column (3) includes sponsor-fixed effects, and column (4) includes year-fixed
and sponsor-fixed effects. Standard errors are clustered at the week level. ***, **, * represent 1%, 5%,
and 10% significance, respectively.
(1) (2) (3) (4)
VARIABLES Fund Gross Return
Fed Rate 62.291*** 93.025*** 94.370*** 62.291***
(5.087) (1.012) (0.963) (5.087)
Log(Fund Size) 1.260*** 16.683*** 5.170*** 1.260***
(0.061) (1.292) (0.361) (0.061)
Log(Family Size) 1.038*** 3.556*** 5.754*** 1.038***
(0.095) (0.779) (1.034) (0.095)
Expenses 20.641*** 118.308*** 86.409*** 20.641***
(1.957) (8.642) (6.641) (1.957)
Log(Age) 0.453 -5.946*** -8.508*** 0.453
(0.331) (1.382) (1.358) (0.331)
Fund Flow 21.525*** 10.017 15.402* 21.525***
(5.265) (8.677) (9.193) (5.265)
Fund Flow Volatility -32.930*** 104.429*** 98.761*** -32.930***
(4.181) (13.735) (13.816) (4.181)
Institutional 4.842*** -9.791*** 13.391*** 4.842***
(0.353) (1.198) (1.004) (0.353)
Constant 87.400*** -116.116*** -42.169*** 87.400***
(9.498) (15.848) (12.965) (9.498)
Year-Fixed Effects Yes No No Yes
Fund-Fixed Effects No Yes No No
Sponsor-Fixed Effects No No Yes Yes
Observations 98,496 98,496 98,496 98,496

30
Table 4: The Flow-Performance Relationship The sample is all U.S. prime money market funds over the period January 2005-December 2013. The dependent
variable is Fund Flow, computed as the percentage change in total net assets from time t to time t+1, adjusted for
market appreciation. Fed Rate is the annualized Fed funds rate. Fund Return is the annualized fund return. Control
variables include the natural logarithm of fund assets, the natural logarithm of family assets, expense ratio (charged),
the natural logarithm of fund age, fund flow computed as a percentage change in total net assets from time t to time
t+1 adjusted for market appreciation, standard deviation of fund flow, and an indicator variable equal to one if the
fund is offered to institutional investors and zero otherwise. All regressions are at the weekly level and include
sponsor-fixed effects. High Rate restricts the sample to the period of high interest rates (Fed funds rate greater than
1%). Low Rate restricts the sample to the period of low interest rates (Fed funds rate between 0 and 1%). Columns
(1), (4), and (5) additionally include week-fixed effects. Standard errors are clustered at the fund sponsor level. ***,
**, * represent 1%, 5%, and 10% significance, respectively.
(1) (2) (3) (4) (5)
VARIABLES Full Sample High Rate Low Rate
Fund Return 0.009***
0.003*** 0.007*** 0.009***
(0.001)
(0.001) (0.002) (0.002)
Fed Rate
0.001*** -0.002*
(0.000) (0.001)
Fed Rate*Fund Return
0.000
(0.000)
Log(Fund Size) -0.000*** -0.000** -0.001*** -0.001*** -0.000
(0.000) (0.000) (0.000) (0.000) (0.000)
Log(Family Size) 0.002*** 0.002*** 0.001*** 0.001 0.002***
(0.000) (0.000) (0.000) (0.001) (0.001)
Expenses -0.003** -0.001 -0.003** -0.003** -0.007*
(0.001) (0.001) (0.001) (0.001) (0.004)
Age -0.001 -0.001* -0.001 -0.001 -0.000
(0.001) (0.001) (0.001) (0.001) (0.001)
Fund Flow Volatility 0.072*** 0.073*** 0.071*** 0.092*** 0.042*
(0.014) (0.015) (0.015) (0.020) (0.022)
Institutional -0.000 0.000 -0.000 -0.001 -0.000
(0.001) (0.001) (0.001) (0.001) (0.001)
Constant -0.018*** -0.013** -0.011** -0.002 -0.022***
(0.005) (0.005) (0.005) (0.009) (0.008)
Sponsor-Fixed Effects Yes Yes Yes Yes Yes
Week-Fixed Effects Yes No No Yes Yes
Observations 98,948 98,974 98,948 50,572 48,376

31
Table 5: Fund Exit and Fed Funds Rate The sample is all U.S. prime money market funds over the period January 2005-December 2013. The dependent variables are Number of
Funds, defined as the number of funds in a given period, and Exit, defined as an indicator variable equal to one if the fund exits the fund
industry in week t. Fed Rate is the annualized Fed funds rate. Control variables include the annualized fund return, the natural logarithm of
fund assets, the natural logarithm of family assets, expense ratio (charged), the natural logarithm of fund age, fund flow computed as a
percentage change in total net assets from time t to time t+1 adjusted for market appreciation, standard deviation of fund flow, and an
indicator variable equal to one if the fund is offered to institutional investors and zero otherwise. All regressions are at the weekly level and
include year/month-fixed and sponsor-fixed effects. High Rate restricts the sample to the period of high interest rates (Fed funds rate greater
than 1%). Low Rate restricts the sample to the period of low interest rates (Fed funds rate between 0 and 1%). Standard errors are clustered at
the week level. ***, **, * represent 1%, 5%, and 10% significance, respectively.
(1) (2) (3) (4) (5) (6)
VARIABLES Number of Funds Exit
Full Sample High Rate Low Rate Full Sample High Rate Low Rate
Fed Rate 0.654 0.515 11.310*** 0.002 0.004 -0.072***
(0.478) (0.697) (3.063) (0.002) (0.002) (0.016)
Fund Return -0.061 -0.248** 0.174** -0.014*** -0.020*** -0.001
(0.061) (0.101) (0.070) (0.003) (0.004) (0.001)
Log(Fund Size) -0.001 -0.000 -0.002*** -0.001*** -0.002*** -0.001***
(0.001) (0.001) (0.001) (0.000) (0.000) (0.000)
Log(Family Size) -0.001 0.005** -0.000 -0.001* -0.000 -0.001
(0.002) (0.002) (0.001) (0.001) (0.000) (0.001)
Expenses -0.015* -0.017* -0.058** -0.014*** -0.023*** -0.011**
(0.008) (0.009) (0.028) (0.002) (0.004) (0.005)
Age 0.003** 0.005* 0.000 0.001* 0.000 0.001**
(0.001) (0.003) (0.001) (0.000) (0.000) (0.001)
Fund Flow 0.038 0.022 0.087 -0.029*** -0.018*** -0.041***
(0.081) (0.107) (0.113) (0.008) (0.007) (0.015)
Fund Flow Volatility -0.017 -0.093*** 0.034 0.037*** -0.005 0.076***
(0.020) (0.025) (0.026) (0.010) (0.010) (0.019)
Institutional -0.004** -0.006** -0.004** -0.004*** -0.008*** -0.002**
(0.001) (0.003) (0.002) (0.001) (0.001) (0.001)
Constant 290.883*** 291.512*** 175.000*** 0.054*** 0.069*** 0.018*
(0.927) (1.337) (0.014) (0.011) (0.013) (0.010)
Year/Month-Fixed Effects Yes Yes Yes Yes Yes Yes
Sponsor-Fixed Effects Yes Yes Yes Yes Yes Yes
Observations 98,792 50,334 48,458 98,792 50,334 48,458

32
Table 6: Fund Risk and Fed Funds Rate (Low-Rate Regime) The sample is all U.S. prime money market funds. The dependent variables are: the weekly annualized spread (Spread),
the fraction of assets held in risky assets, net of the riskless assets (Holdings Risk), average portfolio maturity (Maturity
Risk), and portfolio concentration, defined as a Herfindahl Index of asset classes (Concentration). Fed Rate is the
annualized Fed funds rate. Control variables include the natural logarithm of fund assets, the natural logarithm of
family assets, expense ratio (charged), the natural logarithm of fund age, fund flow computed as a percentage change
in total net assets from time t to time t+1 adjusted for market appreciation, standard deviation of fund flow, and an
indicator variable equal to one if the fund is offered to institutional investors and zero otherwise. All regressions are
at the weekly level and include year/month-fixed and sponsor-fixed effects. The sample is restricted to the period of
low interest rates (Fed funds rate between 0 and 1%). Standard errors are clustered at the week level. ***, **, *
represent 1%, 5%, and 10% significance, respectively.
(1) (2) (3) (4)
VARIABLES Spread Holdings Risk Maturity Risk Concentration
Fed Rate -94.917** -6.770** 0.924 -0.024*
(46.443) (3.070) (4.121) (0.014)
Log(Fund Size) 0.400*** 1.690*** 0.208*** 0.003***
(0.099) (0.042) (0.026) (0.000)
Log(Family Size) -2.371*** 0.694*** -0.395 0.009***
(0.604) (0.260) (0.290) (0.002)
Expenses 1.996*** 0.243 0.969*** 0.009***
(0.439) (0.265) (0.193) (0.001)
Fund Flow -37.591*** -6.721** -12.627*** 0.216***
(2.455) (2.798) (1.413) (0.012)
Fund Flow Volatility 4.346*** -3.275*** 11.074*** -0.030***
(0.737) (1.160) (0.502) (0.006)
Institutional -15.650*** -18.582*** -15.326*** 0.024***
(1.479) (1.299) (1.049) (0.007)
Constant -0.070 2.586*** -1.076*** 0.002
(0.140) (0.171) (0.129) (0.001)
Sponsor-Fixed Effects Yes Yes Yes Yes
Year/Month-Fixed Effects Yes Yes Yes Yes
Observations 45,322 46,065 46,054 46,065
33
Table 7: Fund Expenses and Fed Funds Rate The sample is all U.S. prime money market funds over the period January 2005-December 2013. The dependent variables are Charged Expenses, defined as percentage expense rate
charged by a fund, Incurred Expenses, defined as percentage expense rate incurred by a fund, Subsidy, defined as the difference between incurred and charged expenses. Fed Rate is the
annualized Fed funds rate. Control variables include the annualized fund return, the natural logarithm of fund assets, the natural logarithm of family assets, the natural logarithm of
fund age, fund flow computed as a percentage change in total net assets from time t to time t+1 adjusted for market appreciation, standard deviation of fund flow, and an indicator
variable equal to one if the fund is offered to institutional investors and zero otherwise. All regressions are at the weekly level and include year-fixed and sponsor-fixed effects. High
Rate restricts the sample to the period of high interest rates (Fed funds rate greater than 1%). Low Rate restricts the sample to the period of low interest rates (Fed funds rate between
0 and 1%). Standard errors are clustered at the sponsor level. ***, **, * represent 1%, 5%, and 10% significance, respectively.
(1) (2) (3) (4) (5) (6) (7) (8) (9)
VARIABLES Charged Expenses Incurred Expenses Subsidy
Full Sample High Rate Low Rate Full Sample High Rate Low Rate Full Sample High Rate Low Rate
Fed Rate -0.006*** -0.005*** 0.076*** -0.002 0.003** 0.009 0.004*** 0.007*** -0.066***
(0.001) (0.001) (0.026) (0.002) (0.001) (0.011) (0.001) (0.001) (0.021)
Log(Fund Size) -0.020*** -0.036*** -0.007*** -0.052*** -0.057*** -0.046*** -0.031*** -0.020*** -0.039***
(0.001) (0.000) (0.000) (0.001) (0.001) (0.001) (0.001) (0.001) (0.001)
Log(Family Size) 0.021*** 0.012*** 0.007*** 0.010*** 0.010*** 0.010*** -0.010*** -0.000 0.004
(0.001) (0.001) (0.001) (0.001) (0.001) (0.002) (0.002) (0.001) (0.003)
Age 0.009*** 0.000 0.013*** 0.013*** -0.010*** 0.027*** 0.005 -0.011*** 0.015***
(0.002) (0.001) (0.002) (0.002) (0.001) (0.003) (0.003) (0.001) (0.003)
Fund Flow 0.009 0.018 0.015 0.003 0.031** -0.038 0.007 0.029*** -0.045
(0.013) (0.012) (0.023) (0.018) (0.014) (0.037) (0.019) (0.010) (0.040)
Fund Flow Volatility -0.946*** -1.104*** -0.524*** -0.631*** -0.734*** -0.593*** 0.290*** 0.345*** -0.089
(0.023) (0.024) (0.032) (0.035) (0.023) (0.089) (0.037) (0.015) (0.096)
Institutional -0.206*** -0.323*** -0.099*** -0.318*** -0.336*** -0.317*** -0.111*** -0.012*** -0.217***
(0.006) (0.002) (0.006) (0.001) (0.002) (0.002) (0.005) (0.001) (0.006)
Constant 0.542*** 0.848*** 0.439*** 0.982*** 1.122*** 0.789*** 0.417*** 0.249*** 0.626***
(0.019) (0.013) (0.022) (0.023) (0.018) (0.035) (0.027) (0.013) (0.038)
Sponsor-Fixed Effects Yes Yes Yes Yes Yes Yes Yes Yes Yes
Year-Fixed Effects Yes Yes Yes Yes Yes Yes Yes Yes Yes
Observations 98,792 50,334 48,458 98,484 50,186 48,298 98,484 50,186 48,298

34
Table 8: Fund Exit and Fed Funds Rate: Conditioning on Sponsor Type The sample is all U.S. prime money market funds over the period January 2005-December 2013. The dependent variables are
Number of Funds, defined as the number of funds in a given period, and Exit, defined as an indicator variable equal to one if the
fund exits the fund industry in week t. Low Rate is an indicator variable equal to one if the Fed funds rate is less than or equal
1%, and zero otherwise. Independent Sponsor is an indicator variable equal one if the fund sponsor is an independent asset
management company, and zero otherwise. Control variables include the annualized fund return, the natural logarithm of fund
assets, the natural logarithm of family assets, expense ratio (charged), the natural logarithm of fund age, fund flow computed as
a percentage change in total net assets from time t to time t+1 adjusted for market appreciation, standard deviation of fund
flow, and an indicator variable equal to one if the fund is offered to institutional investors and zero otherwise. All regressions
are at the weekly level and include year/month-fixed and sponsor-fixed effects. Standard errors are clustered at the week level.
***, **, * represent 1%, 5%, and 10% significance, respectively.
(1) (2)
VARIABLES Number of Funds Exit
Low Rate -0.623 -0.009
(0.581) (0.008)
Independent Sponsor*Low Rate 0.003** 0.000
(0.001) (0.001)
Fund Return -0.046 -0.013***
(0.060) (0.003)
Log(Fund Size) -0.001 -0.001***
(0.001) (0.000)
Log(Family Size) -0.001 -0.001*
(0.002) (0.001)
Expenses -0.017** -0.014***
(0.007) (0.002)
Age 0.003** 0.001*
(0.001) (0.000)
Fund Flow 0.033 -0.029***
(0.082) (0.008)
Fund Flow Volatility -0.013 0.037***
(0.020) (0.010)
Institutional -0.004*** -0.004***
(0.001) (0.001)
Constant 292.123*** 0.058***
(0.113) (0.010)
Year-Month-Fixed Effects Yes Yes
Sponsor-Fixed Effect Yes Yes
Observations 98,795 98,795

35
Table 9: Fund Risk and Fed Funds Rate: Conditioning on Sponsor Type The sample is all U.S. prime money market funds over the period January 2005-December 2013. The dependent variables
are: the weekly annualized spread (Spread), the fraction of assets held in risky assets, net of the riskless assets (Holdings Risk),
average portfolio maturity (Maturity Risk), and portfolio concentration, defined as a Herfindahl Index of asset classes
(Concentration). Low Rate is an indicator variable equal to one if the Fed funds rate is less than or equal 1%, and zero
otherwise. Independent Sponsor is an indicator variable equal one if the fund sponsor is an independent asset management
company, and zero otherwise. Control variables include the natural logarithm of fund assets, the natural logarithm of
family assets, expense ratio (charged), the natural logarithm of fund age, fund flow computed as a percentage change in
total net assets from time t to time t+1 adjusted for market appreciation, standard deviation of fund flow, and an indicator
variable equal to one if the fund is offered to institutional investors and zero otherwise. All regressions are at the weekly
level and include week-fixed effects. Standard errors are clustered at the week level. ***, **, * represent 1%, 5%, and 10%
significance, respectively.
(1) (2) (3) (4)
VARIABLES Spread Holdings Risk Maturity Risk Concentration
Independent Sponsor -0.239 -0.130 -0.904 -0.026
(0.893) (2.535) (1.042) (0.020)
Independent Sponsor*Low Rate 2.449** 7.328** 4.519*** 0.038**
(1.224) (2.905) (1.170) (0.017)
Log(Fund Size) 0.847*** 3.029*** 0.540* -0.009**
(0.277) (0.634) (0.314) (0.005)
Log(Family Size) 0.867** 2.776*** 0.427** -0.013***
(0.361) (0.746) (0.209) (0.005)
Expenses 5.652** 10.423** 0.565 0.022
(2.426) (4.892) (1.978) (0.036)
Age 2.624* 2.216 3.655*** 0.055**
(1.548) (2.943) (1.338) (0.026)
Fund Flow 0.522 -40.494* 9.170 -0.255**
(7.537) (21.799) (8.570) (0.111)
Fund Flow Volatility -31.457** -85.261** -54.163*** -0.583***
(13.800) (36.820) (16.366) (0.194)
Institutional 2.469* 4.215 -0.298 -0.024
(1.327) (2.963) (1.045) (0.020)
Constant 16.236** -75.077*** 15.104* 0.232*
(8.237) (15.476) (8.017) (0.128)
Week-Fixed Effect Yes Yes Yes Yes
Observations 94,521 95,264 95,253 95,264

36
Table 10: Fund Expenses and Fed Funds Rate: Conditioning on Sponsor Type The sample is all U.S. prime money market funds over the period January 2005-December 2013. The dependent
variables are Charged Expenses, defined as percentage expense rate charged by a fund, Incurred Expenses, defined as
percentage expense rate incurred by a fund, Subsidy, defined as the difference between incurred and charged
expenses. Low Rate is an indicator variable equal to one if the Fed funds rate is less than or equal 1%, and zero
otherwise. Independent Sponsor is an indicator variable equal one if the fund sponsor is an independent asset
management company, and zero otherwise. Control variables include the annualized fund return, the natural
logarithm of fund assets, the natural logarithm of family assets, the natural logarithm of fund age, fund flow
computed as a percentage change in total net assets from time t to time t+1 adjusted for market appreciation,
standard deviation of fund flow, and an indicator variable equal to one if the fund is offered to institutional
investors and zero otherwise. All regressions are at the weekly level and include week-fixed effects. Standard
errors are clustered at the sponsor level. ***, **, * represent 1%, 5%, and 10% significance, respectively.
(1) (2) (3)
VARIABLES Charged Expenses Incurred Expenses Subsidy
Independent Sponsor 0.012 0.062 0.049*
(0.027) (0.040) (0.027)
Independent Sponsor*Low Rate -0.013 -0.031 -0.018
(0.024) (0.022) (0.030)
Log(Fund Size) -0.017*** -0.048*** -0.030***
(0.005) (0.010) (0.007)
Log(Family Size) 0.002 0.008 0.006
(0.005) (0.010) (0.007)
Age 0.023 -0.005 -0.027
(0.015) (0.024) (0.020)
Fund Flow 0.005 -0.009 0.001
(0.018) (0.035) (0.033)
Fund Flow Volatility -1.006*** -0.640*** 0.341*
(0.156) (0.240) (0.175)
Institutional -0.190*** -0.291*** -0.099***
(0.020) (0.030) (0.019)
Constant 0.505*** 1.008*** 0.496***
(0.097) (0.168) (0.135)
Week-Fixed Effects Yes Yes Yes
Observations 98,795 98,484 98,484
37
Table 11: Fund Exit and ZIRP Shocks The sample is all U.S. prime money market funds. The dependent variables are Number of Funds, defined as the number of
funds in a given period, and Exit, defined as an indicator variable equal to one if the fund exits the fund industry in week t. The
estimation window includes one month before and three months (in columns (1) and (2)) and six months (in columns (3) and
(4)) after the event dates defined in Table 1. Event is an indicator variable equal to one for the period after the event date and
zero for the period before the event date. Independent Sponsor is an indicator variable equal one if the fund sponsor is an
independent asset management company, and zero otherwise. Control variables include the annualized fund return, the natural
logarithm of fund assets, the natural logarithm of family assets, expense ratio (charged), the natural logarithm of fund age, fund
flow computed as a percentage change in total net assets from time t to time t+1 adjusted for market appreciation, standard
deviation of fund flow, and an indicator variable equal to one if the fund is offered to institutional investors and zero otherwise.
All regressions are at the weekly level and include year-fixed and sponsor-fixed effects. Standard errors are clustered at the week
level. ***, **, * represent 1%, 5%, and 10% significance, respectively.
Panel A: Fund Exit and Monetary Shocks
(1) (2) (3) (4)
VARIABLES Number of Funds Exit Number of Funds Exit
3 Months Ahead 6 Months Ahead
Event -3.248*** 0.002** -2.789*** 0.002**
(0.809) (0.001) (0.764) (0.001)
Fund Return 3.899*** -0.001 6.569*** -0.002
(0.690) (0.002) (0.862) (0.002)
Log(Fund Size) -0.012* -0.001** -0.023*** -0.001***
(0.007) (0.000) (0.008) (0.000)
Log(Family Size) -0.171 -0.003 -0.146 -0.003*
(0.130) (0.002) (0.103) (0.002)
Expenses -0.801*** -0.014*** -0.298 -0.019***
(0.260) (0.005) (0.438) (0.005)
Age 0.298** 0.001* 0.280** 0.002**
(0.129) (0.001) (0.134) (0.001)
Fund Flow -1.515 -0.065** -1.110 -0.055**
(1.129) (0.026) (0.903) (0.022)
Fund Flow Volatility 3.734*** 0.068** 4.881*** 0.081***
(0.607) (0.030) (0.611) (0.030)
Institutional -0.070* -0.002** 0.047 -0.003***
(0.040) (0.001) (0.059) (0.001)
Constant 237.789*** 0.042 181.502*** 0.039**
(2.280) (0.028) (1.581) (0.019)
Year-Fixed Effects Yes Yes Yes Yes
Sponsor-Fixed Effects Yes Yes Yes Yes
Observations 18,568 18,568 25,914 25,914

38
Panel B: Conditioning on Sponsor Type and Monetary Shocks
(1) (2) (3) (4)
VARIABLES Number of Funds Exit Number of Funds Exit
3 Months Ahead 6 Months Ahead
Event -3.280*** 0.002*** -2.862*** 0.002***
(0.803) (0.001) (0.767) (0.001)
Event*Independent Sponsor 0.077 -0.002 0.178** -0.003**
(0.067) (0.002) (0.081) (0.001)
Fund Return 3.900*** -0.001 6.574*** -0.002
(0.689) (0.002) (0.861) (0.002)
Log(Fund Size) -0.012* -0.001** -0.023*** -0.001***
(0.007) (0.000) (0.008) (0.000)
Log(Family Size) -0.172 -0.003 -0.150 -0.003*
(0.130) (0.002) (0.103) (0.002)
Expenses -0.802*** -0.013*** -0.309 -0.019***
(0.260) (0.005) (0.436) (0.005)
Age 0.298** 0.001* 0.281** 0.002**
(0.129) (0.001) (0.134) (0.001)
Fund Flow -1.515 -0.065** -1.106 -0.055**
(1.130) (0.026) (0.905) (0.022)
Fund Flow Volatility 3.727*** 0.068** 4.888*** 0.081***
(0.605) (0.030) (0.611) (0.030)
Institutional -0.070* -0.002** 0.045 -0.003***
(0.040) (0.001) (0.059) (0.001)
Constant 237.790*** 0.042 181.543*** 0.038*
(2.283) (0.027) (1.587) (0.019)
Year-Fixed Effects Yes Yes Yes Yes
Sponsor-Fixed Effects Yes Yes Yes Yes
Observations 18,568 18,568 25,914 25,914

39
Table 12: Fund Risk and ZIRP Shocks
The sample is all U.S. prime money market funds. The dependent variables are: the weekly annualized spread (Spread), the fraction of assets held in risky assets, net of the riskless
assets (Holdings Risk), average portfolio maturity (Maturity Risk), and portfolio concentration, defined as a Herfindahl Index of asset classes (Concentration). The estimation window
includes one month before and three months (in columns (1) -(4)) and six months (in columns (5)-(8)) after the event dates defined in Table 1. Event is an indicator variable equal
to one for the period after the event date and zero for the period before the event date. Independent Sponsor is an indicator variable equal one if the fund sponsor is an independent
asset management company, and zero otherwise. Control variables include the natural logarithm of fund assets, the natural logarithm of family assets, expense ratio (charged),
the natural logarithm of fund age, fund flow computed as a percentage change in total net assets from time t to time t+1 adjusted for market appreciation, standard deviation of
fund flow, and an indicator variable equal to one if the fund is offered to institutional investors and zero otherwise. All regressions are at the weekly level and include
year/month-fixed and sponsor-fixed effects (in Panel A) and year/month-fixed effects (in Panel B). Standard errors are clustered at the week level. ***, **, * represent 1%, 5%,
and 10% significance, respectively.
Panel A: Fund Risk and Monetary Shocks
(1) (2) (3) (4) (5) (6) (7) (8)
VARIABLES Spread Holdings Risk Maturity Risk Concentration Spread Holdings Risk Maturity Risk Concentration
3 Months Ahead 6 Months Ahead
Event 34.329*** 0.954*** -1.216** 0.005*** 21.341** 0.879*** -1.347*** 0.005***
(12.113) (0.323) (0.503) (0.002) (10.471) (0.271) (0.386) (0.001)
Log(Fund Size) 0.311*** 1.672*** 0.244*** 0.002*** 0.251*** 1.645*** 0.248*** 0.002***
(0.087) (0.051) (0.043) (0.000) (0.073) (0.048) (0.034) (0.000)
Log(Family Size) -7.141*** 0.632 -0.065 0.013*** -4.828*** 0.435 0.472 0.011***
(1.528) (0.524) (0.516) (0.004) (1.177) (0.395) (0.423) (0.003)
Expenses 3.950*** 2.043*** 1.898*** 0.015*** 3.140*** 1.296*** 1.659*** 0.012***
(0.914) (0.335) (0.289) (0.002) (0.697) (0.313) (0.246) (0.002)
Age -63.297*** -5.511 -14.730*** 0.173*** -52.901*** -2.220 -10.630*** 0.197***
(5.856) (3.417) (2.111) (0.021) (4.554) (3.474) (2.152) (0.018)
Fund Flow 2.211* 0.002 10.502*** -0.041*** 1.566 -0.739 9.684*** -0.037***
(1.286) (1.955) (0.854) (0.012) (1.043) (1.641) (0.681) (0.010)
Institutional -23.283*** -13.671*** -22.086*** 0.002 -21.940*** -19.000*** -21.336*** -0.011
(3.680) (2.358) (1.544) (0.008) (2.649) (2.182) (1.330) (0.007)
Constant -0.208 3.497*** -0.732*** 0.010*** -0.459** 3.350*** -0.738*** 0.008***
(0.235) (0.250) (0.152) (0.001) (0.193) (0.268) (0.189) (0.001)
Year/Month-Fixed Effects Yes Yes Yes Yes Yes Yes Yes Yes
Sponsor-Fixed Effects Yes Yes Yes Yes Yes Yes Yes Yes
Observations 16,830 16,882 16,879 16,882 23,462 23,527 23,524 23,527

40
Panel B: Conditioning on Sponsor Type and Monetary Shocks
(1) (2) (3) (4) (5) (6) (7) (8)
VARIABLES Spread Holdings Risk Maturity Risk Concentration Spread Holdings Risk Maturity Risk Concentration
3 Months Ahead 6 Months Ahead
Independent Sponsor -3.837 6.642** 4.768*** -0.000 -0.776 5.681 5.107*** -0.011
(2.878) (3.309) (1.366) (0.020) (2.940) (3.492) (1.484) (0.021)
Independent Sponsor*Event 9.215*** 1.821*** -1.010** 0.008** 4.646*** 3.405** -1.897*** 0.026***
(1.239) (0.634) (0.460) (0.004) (1.668) (1.533) (0.709) (0.007)
Log(Fund Size) 1.358** 3.102*** 0.559 -0.009* 1.121** 3.168*** 0.503 -0.008
(0.601) (0.889) (0.444) (0.005) (0.514) (0.871) (0.440) (0.005)
Log(Family Size) 1.132* 3.542*** 0.347 -0.012** 0.936* 3.336*** 0.427 -0.013**
(0.663) (0.939) (0.304) (0.005) (0.559) (0.904) (0.293) (0.005)
Expenses 15.013** 15.387** -2.012 0.046 13.661*** 15.591** -2.208 0.052
(5.818) (6.780) (3.046) (0.041) (4.966) (6.588) (2.981) (0.040)
Age 11.336*** 4.921 7.683*** 0.085*** 9.207*** 3.969 7.367*** 0.087***
(3.351) (4.337) (2.137) (0.032) (2.932) (4.171) (2.164) (0.032)
Fund Flow 3.399 -42.839 15.279 -0.248* 3.629 -45.113* 16.330 -0.247*
(15.427) (26.417) (9.695) (0.129) (12.685) (25.876) (10.039) (0.127)
Fund Flow Volatility -61.994** -53.305 -60.787*** -0.397* -52.152** -57.933 -60.876*** -0.403**
(25.558) (43.026) (18.732) (0.209) (21.349) (42.253) (18.776) (0.204)
Institutional 6.432** 8.657** -0.656 -0.006 5.285** 8.297** -0.567 -0.006
(2.908) (3.824) (1.505) (0.021) (2.481) (3.668) (1.472) (0.021)
Constant -34.986* -111.568*** -3.997 -0.012 -25.810 -104.344*** -2.431 -0.027
(18.869) (23.029) (12.725) (0.160) (16.505) (22.463) (12.892) (0.159)
Year/Month-Fixed Effects Yes Yes Yes Yes Yes Yes Yes Yes
Observations 16,830 16,882 16,879 16,882 23,462 23,527 23,524 23,527

41
Table 13: Fund Expenses and ZIRP Shocks
The sample is all U.S. prime money market funds. The dependent variables are Charged Expenses, defined as percentage
expense rate charged by a fund, Incurred Expenses, defined as percentage expense rate incurred by a fund, Subsidy, defined
as the difference between incurred and charged expenses. The estimation window includes one month before and three
months (in columns (1)-(3)) and six months (in columns (4)-(6)) after the event dates defined in Table 1. Event is an
indicator variable equal to one for the period after the event date and zero for the period before the event date.
Independent Sponsor is an indicator variable equal one if the fund sponsor is an independent asset management company,
and zero otherwise. Control variables include the natural logarithm of fund assets, the natural logarithm of family assets,
expense ratio (charged), the natural logarithm of fund age, fund flow computed as a percentage change in total net assets
from time t to time t+1 adjusted for market appreciation, standard deviation of fund flow, and an indicator variable equal
to one if the fund is offered to institutional investors and zero otherwise. All regressions are at the weekly level and
include year-fixed and sponsor-fixed effects (in Panel A) and week-fixed effects (in Panel B). Standard errors are clustered
at the sponsor level. ***, **, * represent 1%, 5%, and 10% significance, respectively.
Panel A: Fund Expenses and Monetary Shocks
(1) (2) (3) (4) (5) (6)
VARIABLES Charged Incurred Subsidy Charged Incurred Subsidy
3 months ahead 6 months ahead
Event -0.001 -0.002** -0.002 -0.014** -0.003*** 0.010**
(0.002) (0.001) (0.002) (0.006) (0.001) (0.005)
Log(Fund Size) -0.006*** -0.045*** -0.039*** -0.005*** -0.044*** -0.038***
(0.001) (0.001) (0.001) (0.001) (0.001) (0.001)
Log(Family Size) 0.014*** 0.031*** 0.020*** 0.006** 0.028*** 0.025***
(0.003) (0.003) (0.003) (0.002) (0.002) (0.003)
Age 0.010*** 0.026*** 0.016*** 0.012*** 0.031*** 0.019***
(0.003) (0.005) (0.004) (0.003) (0.004) (0.004)
Fund Flow -0.028 -0.006 0.029 -0.024 -0.005 0.028
(0.028) (0.032) (0.037) (0.023) (0.026) (0.029)
Fund Flow Volatility -0.699*** -0.804*** -0.127* -0.641*** -0.833*** -0.218***
(0.057) (0.044) (0.074) (0.044) (0.035) (0.061)
Institutional -0.133*** -0.318*** -0.184*** -0.120*** -0.317*** -0.196***
(0.012) (0.002) (0.011) (0.009) (0.002) (0.009)
Constant 0.445*** 0.648*** 0.167*** 0.197*** 0.566*** 0.337***
(0.034) (0.038) (0.042) (0.034) (0.032) (0.039)
Sponsor-Fixed Effects Yes Yes Yes Yes Yes Yes
Year-Fixed Effects Yes Yes Yes Yes Yes Yes
Observations 18,568 18,506 18,506 25,914 25,829 25,829

42
Panel B: Conditioning on Sponsor Type and Monetary Shocks
(1) (2) (3) (4) (5) (6)
VARIABLES Charged Incurred Subsidy Charged Incurred Subsidy
3 months ahead 6 months ahead
Independent Sponsor -0.003 0.030 0.032 -0.006 0.029 0.034
(0.020) (0.039) (0.027) (0.022) (0.039) (0.027)
Independent Sponsor*Event 0.005 0.008 0.003 0.011 0.011 0.000
(0.006) (0.005) (0.007) (0.012) (0.010) (0.013)
Log(Fund Size) -0.006 -0.047*** -0.041*** -0.006 -0.047*** -0.040***
(0.004) (0.011) (0.008) (0.004) (0.011) (0.008)
Log(Family Size) 0.003 0.004 0.001 0.004 0.005 0.000
(0.005) (0.012) (0.010) (0.005) (0.012) (0.010)
Age 0.015 -0.002 -0.016 0.016 0.002 -0.014
(0.013) (0.026) (0.022) (0.012) (0.026) (0.023)
Fund Flow -0.022 0.003 0.035 -0.012 0.004 0.032
(0.033) (0.046) (0.047) (0.029) (0.038) (0.039)
Fund Flow Volatility -0.789*** -0.592* 0.166 -0.751*** -0.599** 0.115
(0.149) (0.299) (0.240) (0.134) (0.287) (0.242)
Institutional -0.115*** -0.290*** -0.175*** -0.102*** -0.291*** -0.188***
(0.016) (0.033) (0.024) (0.015) (0.033) (0.025)
Constant 0.327*** 1.020*** 0.687*** 0.287*** 0.996*** 0.701***
(0.081) (0.188) (0.152) (0.074) (0.194) (0.162)
Week-Fixed Effects Yes Yes Yes Yes Yes Yes
Observations 18,568 18,506 18,506 25,914 25,829 25,829

43
Table 14: Fund Risk and ZIRP Shocks—Conditioning on Survival
The sample is all U.S. prime money market funds. The dependent variables are: the weekly annualized spread (Spread), the fraction of assets held in risky assets, net of the riskless
assets (Holdings Risk), average portfolio maturity (Maturity Risk), and portfolio concentration, defined as a Herfindahl Index of asset classes (Concentration). The estimation window
includes one month before and three months (in columns (1)-(4)) and six months (in columns (5)-(8)) after the event dates defined in Table 1. Event is an indicator variable equal to
one for the period after the event date and zero for the period before the event date. We restrict our estimation to the sample of funds that are present in both periods before and
after the event. Independent Sponsor is an indicator variable equal one if the fund sponsor is an independent asset management company, and zero otherwise. Control variables include
the natural logarithm of fund assets, the natural logarithm of family assets, expense ratio (charged), the natural logarithm of fund age, fund flow computed as a percentage change in
total net assets from time t to time t+1 adjusted for market appreciation, standard deviation of fund flow, and an indicator variable equal to one if the fund is offered to institutional
investors and zero otherwise. All regressions are at the weekly level and include year/month-fixed and sponsor-fixed effects (in Panel A) and year/month-fixed effects (in Panel B).
Standard errors are clustered at the week level. ***, **, * represent 1%, 5%, and 10% significance, respectively.
Panel A: Fund Risk and Monetary Shocks
(1) (2) (3) (4) (5) (6) (7) (8)
VARIABLES Spread Holdings Risk Maturity Risk Concentration Spread Holdings Risk Maturity Risk Concentration
3 Months Ahead 6 Months Ahead
Event 34.329*** 0.954*** -1.216** 0.005*** 21.341** 0.879*** -1.347*** 0.005***
(12.113) (0.323) (0.503) (0.002) (10.471) (0.271) (0.386) (0.001)
Log(Fund Size) 0.311*** 1.672*** 0.244*** 0.002*** 0.251*** 1.645*** 0.248*** 0.002***
(0.087) (0.051) (0.043) (0.000) (0.073) (0.048) (0.034) (0.000)
Log(Family Size) -7.141*** 0.632 -0.065 0.013*** -4.828*** 0.435 0.472 0.011***
(1.528) (0.524) (0.516) (0.004) (1.177) (0.395) (0.423) (0.003)
Expenses 3.950*** 2.043*** 1.898*** 0.015*** 3.140*** 1.296*** 1.659*** 0.012***
(0.914) (0.335) (0.289) (0.002) (0.697) (0.313) (0.246) (0.002)
Age -63.297*** -5.511 -14.730*** 0.173*** -52.901*** -2.220 -10.630*** 0.197***
(5.856) (3.417) (2.111) (0.021) (4.554) (3.474) (2.152) (0.018)
Fund Flow 2.211* 0.002 10.502*** -0.041*** 1.566 -0.739 9.684*** -0.037***
(1.286) (1.955) (0.854) (0.012) (1.043) (1.641) (0.681) (0.010)
Institutional -23.283*** -13.671*** -22.086*** 0.002 -21.940*** -19.000*** -21.336*** -0.011
(3.680) (2.358) (1.544) (0.008) (2.649) (2.182) (1.330) (0.007)
Constant -0.208 3.497*** -0.732*** 0.010*** -0.459** 3.350*** -0.738*** 0.008***
(0.235) (0.250) (0.152) (0.001) (0.193) (0.268) (0.189) (0.001)
Year/Month-Fixed Effects Yes Yes Yes Yes Yes Yes Yes Yes
Sponsor-Fixed Effects Yes Yes Yes Yes Yes Yes Yes Yes
Observations 16,830 16,882 16,879 16,882 23,462 23,527 23,524 23,527

44
Panel B: Conditioning on Sponsor Type and Monetary Shocks
(1) (2) (3) (4) (5) (6) (7) (8)
VARIABLES Spread Holdings Risk Maturity Risk Concentration Spread Holdings Risk Maturity Risk Concentration
3 Months Ahead 6 Months Ahead
Independent Sponsor -3.748 6.178* 4.633*** -0.008 -0.979 5.382 5.016*** -0.016
(2.837) (3.305) (1.355) (0.023) (2.893) (3.476) (1.469) (0.022)
Independent Sponsor*Event 9.167*** 2.507*** -0.823* 0.020* 4.972*** 3.865** -1.776** 0.034***
(1.212) (0.801) (0.473) (0.011) (1.631) (1.556) (0.702) (0.010)
Log(Fund Size) 1.367** 3.104*** 0.558 -0.009* 1.124** 3.171*** 0.501 -0.008
(0.601) (0.889) (0.444) (0.005) (0.514) (0.871) (0.440) (0.005)
Log(Family Size) 1.132* 3.541*** 0.346 -0.012** 0.935* 3.336*** 0.427 -0.013**
(0.664) (0.939) (0.304) (0.005) (0.560) (0.904) (0.293) (0.005)
Expenses 15.085** 15.406** -2.019 0.046 13.689*** 15.613** -2.217 0.052
(5.819) (6.778) (3.047) (0.041) (4.965) (6.586) (2.982) (0.040)
Age 11.204*** 4.882 7.694*** 0.085*** 9.156*** 3.929 7.385*** 0.087***
(3.367) (4.339) (2.138) (0.032) (2.936) (4.172) (2.165) (0.032)
Fund Flow 3.334 -42.871 15.281 -0.248* 3.592 -45.149* 16.336 -0.248*
(15.402) (26.403) (9.696) (0.129) (12.675) (25.859) (10.040) (0.127)
Fund Flow Volatility -61.740** -53.231 -60.808*** -0.396* -52.045** -57.844 -60.907*** -0.402*
(25.537) (43.025) (18.733) (0.209) (21.338) (42.252) (18.777) (0.204)
Institutional 6.473** 8.666** -0.660 -0.006 5.298** 8.305** -0.573 -0.006
(2.908) (3.823) (1.505) (0.021) (2.480) (3.667) (1.472) (0.021)
Constant -34.490* -111.411*** -4.036 -0.011 -25.613 -104.192*** -2.501 -0.026
(18.921) (23.038) (12.728) (0.160) (16.520) (22.468) (12.896) (0.159)
Year/Month-Fixed Effects Yes Yes Yes Yes Yes Yes Yes Yes
Observations 16,830 16,882 16,879 16,882 23,462 23,527 23,524 23,527