the uk renal registry uk renal registry december 2001 this report was prepared by dr david ansell...
TRANSCRIPT

ISSN 1471-3349
The Fourth Annual Report
The UK Renal Registry
December 2001
This report was prepared by Dr David Ansell and Professor Terry Feest
in association with A Armitage, C Byrne, R Burden, C Burton, P Roderick, G Warwick, E Will, A Williams
Copies of this report are provided as a service by the
Renal Association
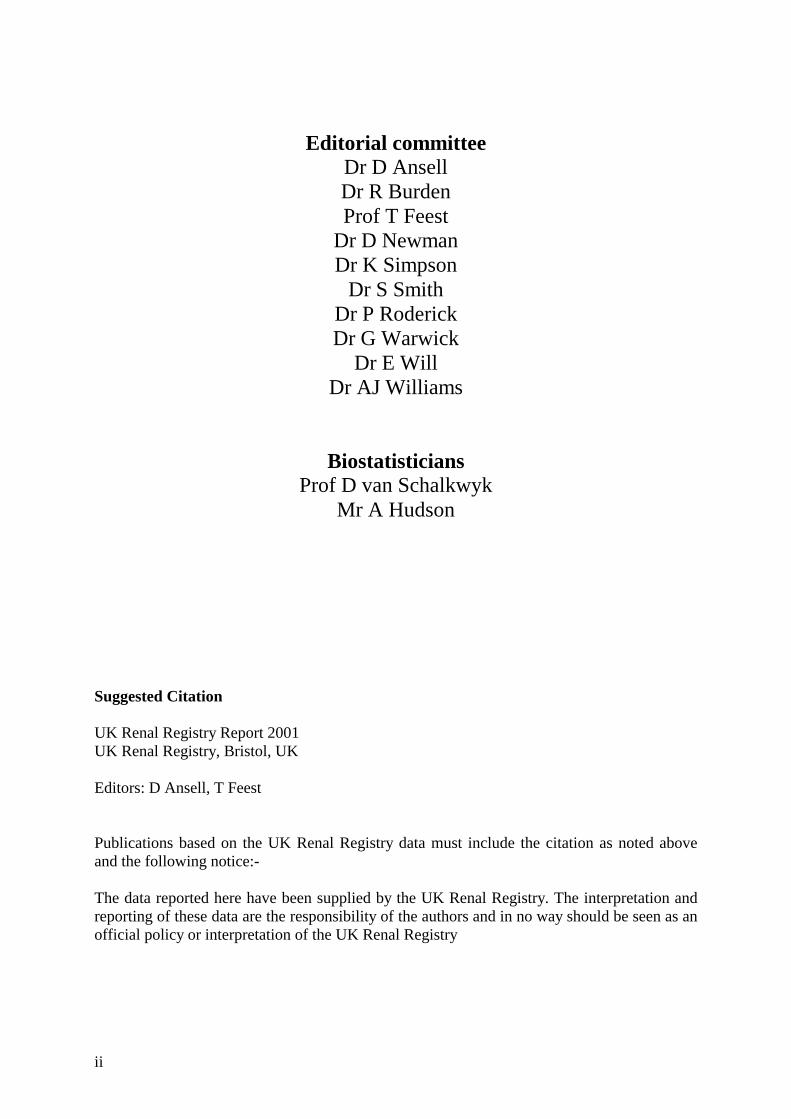
First year survival (from day 0) by age -1999 cohort
60%
65%
70%
75%
80%
85%
90%
95%
100%
0 30 60 90 120 150 180 210 240 270 300 330 360Days
Surv
ival
18-4445-5455-6465-7475-84>85
ii
Editorial committee Dr D Ansell Dr R Burden Prof T Feest
Dr D Newman Dr K Simpson
Dr S Smith Dr P Roderick Dr G Warwick
Dr E Will Dr AJ Williams
Biostatisticians Prof D van Schalkwyk
Mr A Hudson
Suggested Citation UK Renal Registry Report 2001 UK Renal Registry, Bristol, UK Editors: D Ansell, T Feest Publications based on the UK Renal Registry data must include the citation as noted above and the following notice:- The data reported here have been supplied by the UK Renal Registry. The interpretation and reporting of these data are the responsibility of the authors and in no way should be seen as an official policy or interpretation of the UK Renal Registry

iii
The UK Renal Registry
Southmead Hospital Southmead Rd
Bristol BS10 5NB
UK
Telephone 0117 959 5665
Fax 0117 959 5664
Email [email protected]
Web site www.renalreg.com
Clinical Data Managers Mrs H Corderoy
Mr T Ford
Systems Manager Mr D Bull
Programmer Mr M Brealey

iv
Editors Dr D Ansell and Prof T Feest Editorial Consultation Dr AJ Williams Contributors Specific contributions have been received towards the following chapters by :-
Chapters Dr A Armitage 3 Dr R Burden 4 Dr C Burton 7 Dr N Newman 8 Dr P Roderick 3, 4 Dr S Sadek 10 Dr E Will 2, 11
Additional contributors The satellite survey in chapter 3 included contributions from N Drey, R Greenwood and D Lamping. The collaborative work with UK Transplant in chapter 11 included contributions from S Armstrong, R Johnson, D Briggs and C Rudge.

v
UK Renal Registry Director: Dr D Ansell Accounts : Triangle 3 Ltd The UK Renal Registry Subcommittee Chairman : Prof T.G. Feest Secretary : Dr E Will Members : Dr R Burden
Dr R Foley Dr P Roderick Dr S Smith Dr G Warwick Dr A Williams Ex Officio Renal Association : Prof A Rees (president), Prof A Woolf (secretary)
Renal Association Standards Committee : Dr A Macleod
Scotland : Dr K Simpson
Wales : Dr R Moore
Northern Ireland : Dr C Doherty, J Woods British Association of Paediatric Nephrology : Dr M Lewis, Dr J Tizard British Transplant Society : Mr S Sadek, Mr W Wong
Association of Clinical Biochemists : Dr D Newman
Department of Health : Mr D Gilbert, Ms J Verity Health Commissioners : To be appointed National Kidney Federation (patients) : To be appointed
Retired Members 2001
Prof G Williams, Mrs V Said

vi
Registry Staffing and the next report In the last year the Registry has experienced several unexpected changes of staff. The Registry has now increased its staffing and has been fortunate to recruit two data managers, with excellent renal experience, and a senior medical statistician Professor Dirk van Schalkwyk from Cape Town University. The Registry is in the process of recruiting a junior statistician. In conjunction with the Richard Bright Renal Unit in Bristol, a Clinical Research Fellow has been recruited to help with analysis and preparation of reports and papers. The increase in staff has facilitated retrieval and loading of data from the year 2001, and it is hoped to close the database at the end of March 2002. This will enable sufficient time for timely production of a detailed report on the significantly increased number of units participating in the Registry during 2002.

vii
Contents
CHAPTER 1: SUMMARY OF THE YEAR 2001 REPORT ON DATA FROM 2000 .....1
CHAPTER 2: INTRODUCTION TO THE 2001 REPORT ................................................3 AREA COVERED BY THE RENAL REGISTRY. .............................................................................3
Centres in the 2001 Registry report ...................................................................................4 Centres recently joined the Registry...................................................................................5 Centres in the process of joining the Registry....................................................................5 Centres in discussion with the Registry..............................................................................6
SOFTWARE AND LINKS TO THE REGISTRY ................................................................................6 PAEDIATRIC REGISTRY LINKS .................................................................................................6 ANONYMITY AND CONFIDENTIALITY .......................................................................................7 NEW METHODS OF COMMISSIONING RENAL SERVICES ............................................................8
Renal Services definition ....................................................................................................9 INTERPRETATION OF THE DATA WITHIN THE REPORT ...............................................................9 INTEGRATION WITH THE AUDIT CYCLE...................................................................................10 THE REGISTRY AND CLINICAL GOVERNANCE........................................................................10 DISTRIBUTION OF REPORT .....................................................................................................11 FUTURE POTENTIAL OF THE REGISTRY...................................................................................11
CHAPTER 3: A NATIONAL SURVEY OF RENAL SATELLITE UNITS IN ENGLAND AND WALES .....................................................................................................13
SUMMARY .............................................................................................................................13 INTRODUCTION ......................................................................................................................13 METHODS ..............................................................................................................................15 RESULTS ................................................................................................................................15 DISCUSSION ...........................................................................................................................18 FURTHER WORK ....................................................................................................................20 REFERENCES..........................................................................................................................21
CHAPTER 4: NEW ADULT PATIENTS STARTING RENAL REPLACEMENT THERAPY...............................................................................................................................23
SUMMARY .............................................................................................................................23 INTRODUCTION ......................................................................................................................23 ACCEPTANCE RATES .............................................................................................................24 ACCEPTANCE RATES CALCULATED BY HEALTH AUTHORITY (TABLE 4.2)..............................24 ACCEPTANCE OF NEW PATIENTS BY RENAL UNIT (TABLE 4.4) ................................................26 ACCEPTANCE RATE BY RENAL UNIT......................................................................................27 ETHNICITY.............................................................................................................................27 AGE AND GENDER .................................................................................................................29 PRIMARY RENAL DIAGNOSIS .................................................................................................31 TREATMENT MODALITY.........................................................................................................32 THE FIRST CHANGE OF TREATMENT MODALITY......................................................................34
Change of treatment modality within the first year..........................................................34 First modality change over 2 years ..................................................................................34 Patients who were on haemodialysis after the first 90 days.............................................35 Patients who were on peritoneal dialysis after the first 90 days......................................35

viii
SURVIVAL OF NEW PATIENTS STARTING RENAL REPLACEMENT THERAPY ..............................36 COMPARISON WITH THE STANDARD RECOMMENDATION .......................................................36 SURVIVAL OF ALL NEW PATIENTS ..........................................................................................36 AGE DISTRIBUTIONS AND RELATIVE RISK OF DEATH ..............................................................37 REFERENCES..........................................................................................................................37
CHAPTER 5: ALL PATIENTS RECEIVING RENAL REPLACEMENT THERAPY IN 2000.....................................................................................................................................39
SUMMARY .............................................................................................................................39 INTRODUCTION ......................................................................................................................40 OVERALL PREVALENCE RATE ...............................................................................................40 RENAL UNIT ACTIVITY ...........................................................................................................40 PREVALENCE BY HEALTH AUTHORITY ..................................................................................41 CHANGE IN PREVALENCE 1998 –2000 BY HEALTH AUTHORITY............................................42 AGE .......................................................................................................................................44 GENDER.................................................................................................................................46 ETHNICITY.............................................................................................................................46 PRIMARY RENAL DISEASE .....................................................................................................47 DIABETES ..............................................................................................................................48 MODALITIES OF TREATMENT.................................................................................................49 HAEMODIALYSIS....................................................................................................................50 PERITONEAL DIALYSIS ..........................................................................................................51 MODALITY AND PRIMARY DIAGNOSIS....................................................................................52 MODALITY AND GENDER .......................................................................................................52 CHANGE IN TREATMENT MODALITIES 1997 –2000 ................................................................53 LONG TERM TRENDS ..............................................................................................................53 SURVIVAL ON RENAL REPLACEMENT THERAPY......................................................................54 PREVALENT SURVIVAL BY CENTRE ........................................................................................55
CHAPTER 6: ADEQUACY OF HAEMODIALYSIS (UREA REDUCTION RATIO)..57 SUMMARY .............................................................................................................................57 HAEMODIALYSIS FREQUENCY................................................................................................57 SOLUTE CLEARANCE STANDARDS..........................................................................................58 INTERPRETATION OF RESULTS................................................................................................58
Formulae for calculation of dialysis clearance................................................................58 Post dialysis urea samples................................................................................................58
CENTRES ACHIEVEMENT OF THE STANDARD..........................................................................59 CHANGES ACHIEVEMENT OF URR STANDARD DURING 1998-2000........................................61 ACHIEVEMENT OF STANDARDS IN NEW RENAL REPLACEMENT THERAPY PATIENTS STARTING HAEMODIALYSIS ....................................................................................................................62
CHAPTER 7: HAEMOGLOBIN AND RELATED VARIABLES ...................................65 SUMMARY .............................................................................................................................65 INCLUSION CRITERIA .............................................................................................................65 HAEMOGLOBIN ACHIEVEMENT BY DIALYSIS UNITS................................................................65 FACTORS INFLUENCING HAEMOGLOBIN .................................................................................72 HAEMOGLOBIN AND SERUM FERRITIN....................................................................................72 HAEMOGLOBIN AT START OF DIALYSIS ..................................................................................76 CHANGE IN HAEMOGLOBIN ACHIEVEMENT 1999 -2000........................................................78 CONCLUSION .........................................................................................................................82
ix
CHAPTER 8: PERFORMANCE AGAINST RENAL ASSOCIATION STANDARDS .83 INTRODUCTION ......................................................................................................................83 OVERVIEW OF PRESENTATION................................................................................................84 HAEMOGLOBIN ......................................................................................................................84 SERUM BICARBONATE ...........................................................................................................86 SERUM PHOSPHATE ...............................................................................................................87 INTACT PARATHYROID HORMONE ..........................................................................................88 DIALYSIS ADEQUACY ............................................................................................................89 BLOOD PRESSURE..................................................................................................................90 STATISTICAL ANALYSIS .........................................................................................................92
Methodology .....................................................................................................................92
CHAPTER 9: SURVIVAL OF INCIDENT ADULT PATIENTS.....................................95 SUMMARY .............................................................................................................................95 INTRODUCTION ......................................................................................................................95 STATISTICAL METHODS.........................................................................................................95 SURVIVAL PATTERNS.............................................................................................................96 THE “HAZARD FUNCTION” .....................................................................................................97 SURVIVAL WITHIN THE FIRST 90 DAYS...................................................................................97 SURVIVAL OVER 360 DAYS FROM START OF RENAL REPLACEMENT THERAPY.....................100 DEATH WITHIN THREE YEARS FROM START OF RENAL REPLACEMENT THERAPY .................101 SURVIVAL IN INDIVIDUAL CENTRES .....................................................................................102 FIRST YEAR SURVIVAL BY CENTRE AGED <65 AND >65 YEARS...........................................103 CHANGES IN SURVIVAL 1997 – 1999 BY CENTRE ................................................................103 RELATIONSHIP OF CENTRE SURVIVAL TO POPULATION MORTALITY .....................................106
CHAPTER 10: LISTING FOR RENAL TRANSPLANTATION...................................107 SUMMARY ...........................................................................................................................107 INTRODUCTION ....................................................................................................................107 LISTING FOR TRANSPLANTATION .........................................................................................108
Patients studied and statistical methods.........................................................................108 FACTORS INFLUENCING LISTING FOR TRANSPLANTATION ....................................................109
Age ..................................................................................................................................109 Primary renal disease.....................................................................................................110 Characteristics of the renal unit.....................................................................................110
FUTURE AUDIT.....................................................................................................................110
CHAPTER 11: QUALITY ASSURANCE, IMPROVEMENT AND THE NSF ...........111
APPENDIX A: THE RENAL REGISTRY RATIONALE...............................................113 A:1 EXECUTIVE SUMMARY ............................................................................................113 A:2 INTRODUCTION ........................................................................................................114 A:3 STATEMENT OF INTENT............................................................................................115 A:4 RELATIONSHIPS OF THE RENAL REGISTRY...............................................................115 A:5 THE ROLE OF THE REGISTRY FOR NEPHROLOGISTS ..................................................115 A:6 THE ROLE OF THE REGISTRY FOR TRUST MANAGERS ..............................................116 A:7 THE ROLE OF THE REGISTRY FOR COMMISSIONERS OF HEALTH CARE ......................116 A:8 THE ROLE OF THE REGISTRY FOR NATIONAL QUALITY ASSURANCE AGENCIES.............117 A:9 THE ROLE OF THE REGISTRY FOR PATIENTS .............................................................118 A:10 ABBREVIATIONS .........................................................................................................118

x
A:11 REFERENCES..............................................................................................................118
APPENDIX B: DEFINITION, STATISTICAL METHODOLOGY, ANALYSIS CRITERIA ............................................................................................................................119
DEFINITIONS OF ANALYSIS QUARTERS .................................................................................119 RENAL REGISTRY MODALITY DEFINITIONS ..........................................................................119
Home haemodialysis.......................................................................................................119 Satellite dialysis unit.......................................................................................................119 A renal satellite unit is defined as a haemodialysis facility which is linked to a main renal unit and not autonomous for medical decisions, and which provides chronic out patient maintenance haemodialysis, but with no acute or in-patient nephrology beds on-site...................................................................................................................................119 Treatment modality at 90 days .......................................................................................119 Start of end stage renal failure .......................................................................................119
ANALYSIS CRITERIA.............................................................................................................120 Definition of the Take-On population (Incidence) .........................................................120 Definition of the Prevalent population ...........................................................................120 Death rate calculation ....................................................................................................120 Odd Ratio........................................................................................................................120 Hazard Function.............................................................................................................120 Hazard ratio ...................................................................................................................121 Survival analyses of prevalent cohort ............................................................................121 Criteria for analysis by treatment modality in a quarter ...............................................121 Criteria for analysis of biochemistry in a quarter..........................................................121 Treatment modality on day 90 of starting RRT ..............................................................122 One year survival of the take-on population ..................................................................122 Analysis of one year survival of prevalent patients........................................................122
APPENDIX C: DATA PROTECTION AND THE UK RENAL REGISTRY IN 2002.125 INTRODUCTION ....................................................................................................................125 EUROPEAN LAW -DIRECTIVE 95/46/EC...............................................................................125 THE HEALTH AND SOCIAL CARE ACT 2001 (ENGLAND & WALES).....................................125 THE REGISTRY CASE ...........................................................................................................126 THE WAY FORWARD.............................................................................................................126
APPENDIX D: RENAL SERVICES DESCRIBED FOR NON-PHYSICIANS............129
APPENDIX E: MEASUREMENT OF DIALYSIS ADEQUACY..................................133 UREA REBOUND AND TIMING OF BLOOD SAMPLES ...............................................................133 PRACTICAL PROBLEMS OF TIMING OF BLOOD SAMPLES ........................................................133 CURRENT UK PRACTICE IN BLOOD SAMPLING .....................................................................134 IMPLICATIONS FOR URR RESULTS CALCULATED BY THE RENAL REGISTRY ........................134 REFERENCES........................................................................................................................135
APPENDIX F: LABORATORY CONVERSION FACTORS & CENTRE NAMES ..137

xi
Index of Figures Figure 2.1 Map of new Strategic Health Authorities.......................................................................... 8 Figure 2.2 Renal Registry audit cycle ................................................................................................ 10 Figure 3.1: Changes in Dialysis Modality in England 1993-1998.................................................... 14 Figure 3.2: Numbers of Renal Satellite Units linked to Main Renal Units..................................... 16 Figure 4.1: New patients by age group 1997 - 2000....................................................................... 29 Figure 4.2: Median Age of New Patients in 2000.............................................................................. 30 Figure 4.3: New patients 2000 - percentage of all dialysis on HD at day 90................................... 32 Figure 4.4: New patients - % of all dialysis patients on haemodialysis on day 90, by age ............ 33 Figure 5.1: Age profile of prevalent patients..................................................................................... 44 Figure 5.2: Age distributions of transplanted and dialysis patients................................................ 44 Figure 5.3: Median age of dialysis patients alive 31.12.00 ............................................................... 45 Figure 5.4: Age distribution by gender.............................................................................................. 46 Figure 5.5: Treatment modalities 31/12/200...................................................................................... 49 Figure 5.6: In each age group, percentage of patients on each modality........................................ 49 Figure 5.7: Percentage dialysis patients on haemodialysis by centre and age................................ 50 Figure 5.8: Proportion of HD patients treated by home and satellite dialysis, by centre. ............ 51 Figure 5.9: Use of connect and automated PD as percentage of total PD....................................... 51 Figure 5.10: Percentage of dialysis patients on haemodialysis by year .......................................... 53 Figure 5.11: Survival of prevalent patients alive 1/1/2000 ............................................................... 55 Figure 5.12: 2year survival of prevalent patients alive 1/1/1999 ..................................................... 55 Figure 6.1: Achievement of the RA Standard for haemodialysis clearance................................... 59 Figure 6.2: Percentage patients with URR > 65% in the last quarter of 2000............................... 59 Figure 6.3 Urea reduction ration distribution................................................................................... 59 Figure 6.4: Change in meeting URR standard in 2000 .................................................................... 60 Figure 6.4: Percentage URR . 65% and change in median URR 1997- 2000................................. 61 Figure 6.5: URR achievement and median URR .............................................................................. 62 Figure 6.6: Median URR within first three months of HD .............................................................. 62 Figure 6.7 Change in URR by length of time on RRT in 1999 –2000 ............................................ 63 Figure 7.1: Haemoglobin in patients on HD by 1g/dl bands............................................................ 67 Figure 7.2: Percentage of HD patients by centre achieving the RA Standard ............................... 67 Figure 7.3: Haemoglobin median and quartile ranges for haemodialysis patients ....................... 68 Figure 7.4: Percentage of HD patients by centre achieving the European Standard.................... 68 Figure 7.5: Distribution of haemoglobin for patients on PD by 1g/dl bands.................................. 70 Figure 7.6: Percentage of PD patients by centre achieving the RA Standard................................ 70 Figure 7.7: Percentage of PD patients by centre achieving a haemoglobin of at least 11.0 g/dl ... 71 Figure 7.8: Haemoglobin median and quartile ranges for peritoneal dialysis patients ................ 71 Figure 7.9: Percentage of HD patients with serum ferritin >>>> 100 mcg/dl....................................... 73 Figure 7.10: Percentage of HD patients with serum ferritin >>>> 200 mcg/dl..................................... 73 Figure 7.11: Percentage of PD patients with serum ferritin >>>> 100 mcg/dl ..................................... 75 Figure 7.12: Percentage of PD patients with serum ferritin >>>> 200 mcg/dl ..................................... 75 Figure 7.13: Percentage haemoglobin >10g/dl for new patients...................................................... 77 Figure 7.14: Haemoglobin distribution at start of dialysis .............................................................. 77 Figure 7.15: Percentage with haemoglobin > 10g/dl: new and prevalent patients ........................ 78 Figure 7.16: Haemoglobin < 9 g/dl in 1st 2 years since of RRT........................................................ 78 Figure 7.17: Median haemoglobin by time on RRT ......................................................................... 79 Figure 7.18: Change in haemoglobin 1999 –2000 haemodialysis .................................................... 80 Figure 7.19: Change in haemoglobin 1999 –2000 peritoneal dialysis ............................................. 81 Figure 7.20: Improvement in E&W of achieving the Hb standard 1998-2000 .............................. 82 Figure 8.1 Haemoglobin Percentage of HD patients achieving the RA Standard ........................ 84 Figure 8.2 Haemoglobin for patients on HD by 1g/dl bands........................................................... 85 Figure 8.3 Percentage of PD patients by centre achieving the RA Standard................................ 85 Figure 8.4 Distribution of haemoglobin for patients on PD by 1g/dl bands.................................. 86

xii
Figure 8.5 Percentage bicarbonate in lab reference range for haemodialysis .............................. 86 Figure 8.6 Percentage bicarbonate in lab reference range for peritoneal dialysis ....................... 87 Figure 8.7 Percentage serum phosphate in range 1.2-1.7 for haemodialysis................................. 87 Figure 8.8 Percentage serum phosphate in range 1.1-1.6 for peritoneal dialysis.......................... 88 Figure 8.9 Percentage patients with iPTH in 3x lab range on haemodialysis ............................... 88 Figure 8.10 Percentage patients with iPTH in 3x lab range on peritoneal dialysis ...................... 89 Figure 8.11 Percentage URR > 65% ................................................................................................. 89 Figure 8.12 Percentage haemodialysis patients <60 with BP in RA Standard range .................... 90 Figure 8.13 Percentage patients >60 with BP in RA Standard on haemodialysis......................... 90 Figure 8.14 Percentage pts age <60 with BP in RA Standard range on peritoneal dialysis.......... 91 Figure 8.15 Percentage pts age >60 with BP in RA Standard range on peritoneal dialysis.......... 91 Figure 9.1 Distribution of deaths in the 1st year................................................................................ 96 Figure 9.2 Distribution of deaths in 1st year UK 98 – 99 per 100 live patients at each time period
........................................................................................................................................................ 97 Figure 9.3 The hazard function for incident adults aged above and below 65 years..................... 98 Figure 9.4 The ratio of the hazard of death for aged>65 : aged <65, in the first 90 days. ............ 98 Figure 9.5 Kaplan-Meier survival curves by age band for 90 days................................................. 99 Figure 9.6 Hazard function by age band for the 1st 90 days ............................................................ 99 Figure 9.7 Log log transformation of Survival function over 90 days by age .............................. 100 Figure 9.8 Survival in the first year of renal replacement therapy............................................... 100 Figure 9.9 Hazard of death over three years from starting renal replacement therapy............. 101 Figure 9.10 Ratio of hazard of death over 3 years, above and below age 65................................ 101 Figure 9.11: Adjusted survival in the first 90 days in 1999 cohort................................................ 102 Figure 9.12: Adjusted survival in the first 1yr after 90 days in the 1999 cohort ......................... 102 Figure 9.13 First year survival patients aged <65 by centre.......................................................... 103 Figure 9.14 First year survival patients aged >65 by centre.......................................................... 103 Figure 9.15 Survival 90 day 1997 -1999 ........................................................................................... 104 Figure 9.16 Survival 1 year after 90 days 1997-99.......................................................................... 105 Figure 9.17 All cause population mortality v RRT survival .......................................................... 106 Figure 9.18 Population cardiac mortality v RRT survival............................................................. 106 Figure 10.1: Waiting lists as a percentage of all dialysis patients ................................................. 108 Figure 10.2: Time to listing for adult patients................................................................................. 109 Figure D.1 Components of urea rebound (from the DOQI report) ............................................ 133

xiii
Index of Tables England & Wales ................................................................................................................................... 4 Table 3.1: Changes in Renal Units in England 1993-1998 ............................................................... 15 Table 3.2: Organisational characteristics of renal satellite units in England and Wales.............. 17 Table 3.3: Treatment Acceptance Policies of Renal Satellite Units................................................. 17 Table 3.4: Comparison of NHS and Private Renal Satellite Units .................................................. 18 Table 4.1: Summary of new adult patients accepted during 2000 .................................................. 23 Table 4.2: Acceptance rate by Health Authority England............................................................... 25 Table 4.3: Acceptance rate by Health Authority Wales................................................................... 25 Table 4.4: Number of new patients accepted by renal units ............................................................ 26 Table 4.5: Ethnicity by centre............................................................................................................. 28 Table 4.6: Median age of ethnic groups accepted for renal replacement therapy......................... 29 Table 4.7: Percentage of males by age 1999-2000 ............................................................................. 29 Table 4.8: Percentage Primary renal diagnosis by age, and gender ratios .................................... 31 Table 4.9: Percentage diagnostic distribution of new RRT patients by unit.................................. 31 Table 4.10: HD patients at 90 days: changes in modality in subsequent year ............................... 34 Table 4.11: PD patients at 90 days: changes in modality in one year ............................................. 34 Table 4.12: Changes in modality over the first 2 years for patients on HD ................................... 35 Table 4.13: Changes in modality over the first 2 years for patients on PD.................................... 35 Table 4.14: One Year Patients Survival – patients age 18-55, 1999 cohort .................................... 36 Table 4.15: 90-day survival of new patients, 1999 cohort ................................................................ 36 Table 4.16: One Year Survival of new patients, 1999 cohort........................................................... 37 Table 4.17: Two-year survival of new patients, 1998 cohort ........................................................... 37 Table 4.18: Increased risk of death within one year of starting dialysis – non-diabetics.............. 37 Table 5.1: Summary of adult patients registered and total population covered 31/12/2000......... 40 Table 5.2: Increase in prevalent patients, by unit,............................................................................41 Table 5.3: Prevalence of renal replacement therapy by Health authority. .................................... 42 Table 5.4: Change of prevalence of RRT by Health authority, 1998-2000..................................... 43 Table 5.5: Median age and treatment modality ................................................................................ 44 Table 5.6: Ethnicity ............................................................................................................................. 47 Table 5.7: Percentage of transplanted patients in each ethnic group. ............................................ 47 Table 5.8: Primary renal disease in all patients, and according to age and gender ...................... 48 Table 5.9: Type of diabetes, median age, gender ratio, modality.................................................... 48 Table 5.10: Treatment modality by age and diabetic status. ........................................................... 48 Table 5.11: Percentage on each modality according to age ............................................................. 49 Table 5.12: Proportion of patients on each modality by diagnostic category. ............................... 52 Table 5.13: Treatment modality and gender..................................................................................... 52 Table 5.14: Treatment modality, age, and gender ............................................................................ 52 Table 5.15: Proportion of patients with different modalities of RRT 1997-2000........................... 53 Table 5.16: Survival of all dialysis patients ....................................................................................... 54 Table 5.17: Survival of dialysis patients alive on 1/1/2000, by age <65 and >65 years. ................. 54 Table 5.18: Survival of all prevalent dialysis patients by age band ................................................ 54 Table 5.19: Survival during 2000 of dialysis patients by age and diabetes .................................... 55 Table 6.1: Change in achievement of URR standard during 1998-2000 ........................................ 61 Table 7.1: Haemoglobin data for patients on haemodialysis ........................................................... 66 Table 7.2: Haemoglobin data for patients on peritoneal dialysis .................................................... 69 Table 7.3: Serum Ferritin concentration in haemodialysis patients ............................................... 72 Table 7.4: Serum Ferritin concentration in peritoneal dialysis patients ........................................ 74 Table 7.5: Haemoglobin at start of dialysis ....................................................................................... 76 Table 8.1 Renal Association Standards............................................................................................. 83 Table 9.1 90 day & 1 yr survival ........................................................................................................ 96 Table 10.1: Primary renal disease and listing for transplantation – age adjusted. ..................... 110

xiv

1
Chapter 1: Summary of the year 2001 report on data from 2000 After consultation with the participating renal units, a phased programme towards removal of anonymity has been agreed. This year the incidence and prevalence data in chapters 4 and 5 are identified by named renal unit. All the renal units in the UK are now negotiating participation in the Renal Registry.
_____________________________________ The data presented in this report relate to England and Wales. Due to technical difficulties, data held in the Scottish Renal Registry could not be transferred.
_____________________________________
For the first time, data are presented on acceptance rates for treatment by Health Authority. The estimated annual rate of adult patients starting renal replacement therapy (RRT) in England and Wales is 89 per million population (pmp) indicating that approximately 5350 patients started RRT in 2000. This is identical to the 1999 report. Incidence rates calculated from health authorities with complete Registry coverage varied from 157 down to 52. Haemodialysis was the modality of RRT at a day 90 for 60% of dialysis patients in England & Wales (58.8% in 1999). By the end of the first year, 16% of patients starting on PD had changed to HD, similar to last year’s data.
_____________________________________ In England & Wales there was a 4.8% increase in the total number of patients on RRT between the 1st January and 31st December 2000. This comprised a 5.1% increase in the number of patients on dialysis and a 4.6% increase in those with a transplant. For individual Health Authorities, the estimated dialysis prevalence varied from 329 to 693 pmp. The median age for all patients on treatment on 31/12/2000 was 54 years. Reporting of ethnic origin has improved. The proportion of white patients in individual units varied from 39% to 100%, Asian from 0% to 56%, and Black from 0% to 15%. Diabetes accounted for 16% of current incident patients, but 10% of all prevalent patients. Of prevalent dialysis patients 66% were on haemodialysis; HD is the predominant form of dialysis at all ages, but especially in the elderly. Connect PD has almost ceased. Cycling PD made little impact overall, but in a few units is the predominant form of PD
_____________________________________ The 90-day survival is 95% (95%CI 94-96%) for those aged less than 65 and 83% (95%CI 81-85%) for patients aged 65 and over. The one-year survival is 86% (95%CI 84-88%) for those aged less than 65 and 66% (95%CI 63-69%) for patients aged 65 and over. The first year survival from day 0 of renal replacement therapy was 96%, 94%, 90%, 84%, 72%, 65% for patients aged 18-34, 35- 44, 45-54, 55-64, 65- 74, and 85+ respectively.

2
The one-year survival of all prevalent patients established on renal replacement therapy for at least 90 days was 83.7%, and the two-year survival 68.4%. There are marked differences between centres in survival rates, but these are not consistent. Serial studies on one year survival rates for individual centres from 1997 – 1999, after adjustment to a standard age, showed wide variation. There was no relationship between a centre’s 90-day or 1- year-after-90 day survival, and the mortality rate of the local population for all cause mortality, or cardiac mortality.
_____________________________________ There were 82 satellite units in England & Wales on 31st March 1999 (73 in 1998), with 67% of main renal units possessing a satellite. There was a diverse range of models of service provision. 43% were not on an acute hospital site; there was a median of 8 HD stations, (range 3-31), and 19 units (26%) were commercially run. Only 9 units (12%) had regular daytime onsite medical supervision. Of the 2599 patients being treated in the renal satellite units, 42% were aged 65 or over, similar to the UK as a whole.
_____________________________________ In England & Wales, 74 % of patients achieved a URR > 65% compared with 65% in 1999 and 57% in 1998. There was a continuing rise in URRs over the 2 years from starting dialysis from 57% achieving a URR > 65% in the first 6 months (48% in 1999) to 83% at 2 years (73% in 1999).
_____________________________________ There is continuing improvement in the management of renal anaemia. In haemodialysis, 79% of patients had a haemoglobin > 10g/dl compared to 72% in 1999 and 69% in 1998. In PD 86% of patients had a haemoglobin >10g/dl in 2000, 80% in 1999, 78% in 1998
_____________________________________ A joint analysis of data held by UK Transplant and the Renal Registry showed that the factors significantly affecting whether a patient is listed for transplant are: age (p<0.0001), primary renal disease (p<0.0001), and the size of the renal unit (p<0.0001), with large units listing patients more quickly. Gender and ethnicity of the patient and whether the dialysis hospital also has a transplant unit were not found to have a significant effect. Pre-emptive listing (listing before dialysis) occurred in 21% of adults under 35 years old, only 4% of adults aged 55-64, and vary rarely in those over 65.
_____________________________________ The Renal Registry has a unique data collection system with huge potential for the future. This offers an opportunity for automated data collection for multi-centre studies and trials. There is also considerable interest in collection of data on cohorts of pre-end stage renal failure. Once the work of connecting the rest of the UK sites has been completed, the members of the Renal Association will be consulted on these future projects. With almost complete coverage of the UK, the UK Renal Registry is ideally situated to aid the implementation and monitoring of the National Service Framework.
_____________________________________

3
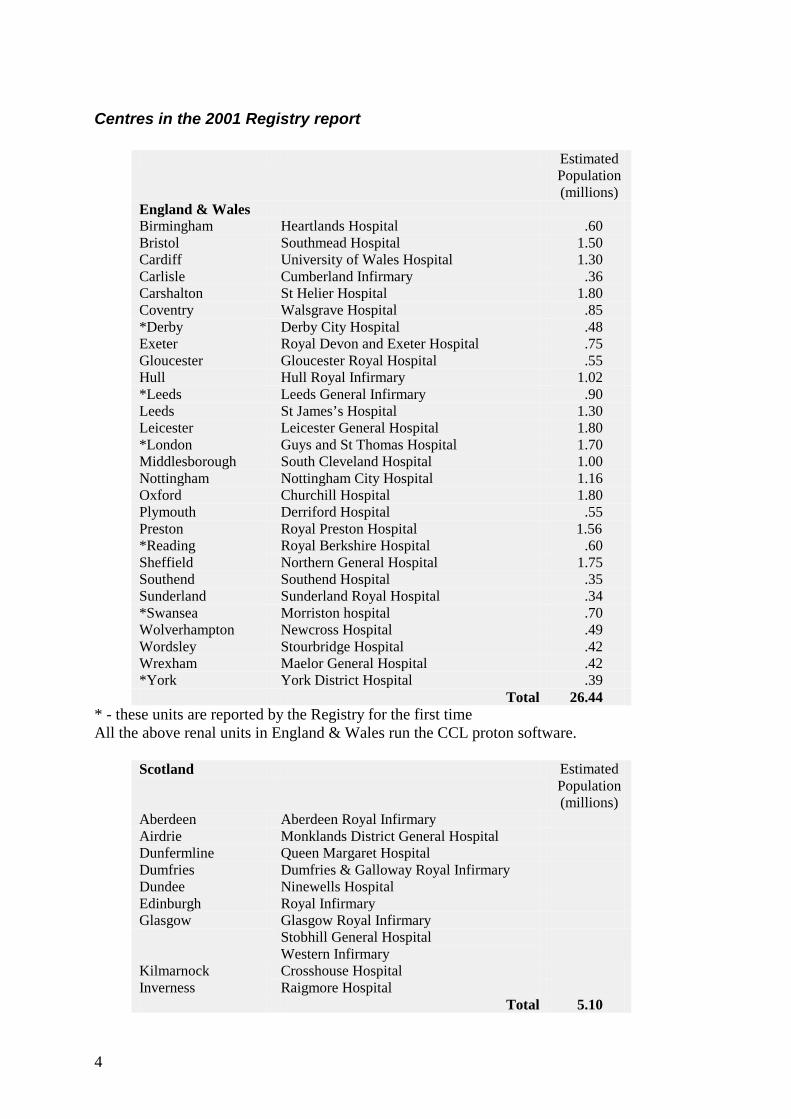
Chapter 2: Introduction to the 2001 Report Although this 2001 Renal Registry report is somewhat smaller than its immediate predecessor, it does contain the same basic data, from an increased number of renal units. The data are presented in a form to make it comparable with earlier reports. There is less commentary related to much of the core data, as the comments from last year remain valid for these data. There are also fewer chapters concerning activity somewhat peripheral to core Registry activity. For the first time in this report, data are presented on acceptance rates for treatment by health authority. There are two other important additions. Chapter 3 contains details of the recently completed survey of satellite dialysis units in the UK, which was supported by the Renal Registry. Chapter 9 contains detailed statistical analysis not available before, on the survival of both incident and prevalent patients. Since 1999, there has been an improvement in reporting of data concerning ethnic origin and morbidity, although these areas still remain major concerns for the Registry. This report on data from the year 2000 contains data from six renal units not previously included in the Renal Registry. During the year 2001 there has been a marked increase in the rate of new units joining the Renal Registry and there are now only 8 of the 75 renal units in the United Kingdom who are not linked to the Registry or in the process of being linked. These remaining 8 units are all in discussion with the Registry, and hope to join when once they have adequate electronic patient information systems. Area covered by the Renal Registry. The 2001 UK Renal Registry report refers to activity in 2000 and covers 54% of the UK adult population. In total 28 of the 63 adult units (45 %) in England and Wales (Table 2.1) have contributed to the report The English and Welsh units cover 51% of the population of 52.2 million. One centre in England, included in the previous year’s report, did not manage to submit all its data in time to be included in this report Although the 11 adult renal units in Scotland had submitted all their 2000 data to the Scottish Registry, due to a technical problem it was not possible to transfer the 2000 incident patient data, to the UK Registry in time for this report. It has though been possible to analyse the survival of the 1999 incident cohort from Scotland and also the prevalent cohort alive on 1st January 2000. The participating centres are listed in Table 2.1; the areas represented are shown in Figure 2.2.
4
Centres in the 2001 Registry report
Estimated Population (millions)
England & Wales Birmingham Heartlands Hospital .60 Bristol Southmead Hospital 1.50 Cardiff University of Wales Hospital 1.30 Carlisle Cumberland Infirmary .36 Carshalton St Helier Hospital 1.80 Coventry Walsgrave Hospital .85 *Derby Derby City Hospital .48 Exeter Royal Devon and Exeter Hospital .75 Gloucester Gloucester Royal Hospital .55 Hull Hull Royal Infirmary 1.02 *Leeds Leeds General Infirmary .90 Leeds St James’s Hospital 1.30 Leicester Leicester General Hospital 1.80 *London Guys and St Thomas Hospital 1.70 Middlesborough South Cleveland Hospital 1.00 Nottingham Nottingham City Hospital 1.16 Oxford Churchill Hospital 1.80 Plymouth Derriford Hospital .55 Preston Royal Preston Hospital 1.56 *Reading Royal Berkshire Hospital .60 Sheffield Northern General Hospital 1.75 Southend Southend Hospital .35 Sunderland Sunderland Royal Hospital .34 *Swansea Morriston hospital .70 Wolverhampton Newcross Hospital .49 Wordsley Stourbridge Hospital .42 Wrexham Maelor General Hospital .42 *York York District Hospital .39 Total 26.44
* - these units are reported by the Registry for the first time All the above renal units in England & Wales run the CCL proton software.
Scotland Estimated Population (millions)
Aberdeen Aberdeen Royal Infirmary Airdrie Monklands District General Hospital Dunfermline Queen Margaret Hospital Dumfries Dumfries & Galloway Royal Infirmary Dundee Ninewells Hospital Edinburgh Royal Infirmary Glasgow Glasgow Royal Infirmary
Stobhill General Hospital Western Infirmary
Kilmarnock Crosshouse Hospital Inverness Raigmore Hospital Total 5.10

5
Centres recently joined the Registry The following renal units have joined the Registry since the database was closed for this report. At least one file has been successfully loaded onto the Registry database from each site.
( indicates IT system used by hospital) Estimated
Population (millions)
Basildon (Mediqal) Bradford Bradford Royal Infirmary –(proton) .60 Cambridge Addenbrookes Hospital –(proton) 1.42 Liverpool Royal Infirmary –(proton) 1.75 London Kings College Hospital
(Filemaker Pro own system) 1.01
London St Mary’s Hospital –(proton) .81 Newcastle (New CCL Windows system) 1.31 Portsmouth St Mary’s Hospital –(proton) 2.00 Rhyl Ysbyty Clwyd (via Liverpool) Stevenage Lister (was on previously but developed new system) 1.25 Truro Royal Cornwall Hospital (proton) .36 Wirral Arrowe Park Hospital (proton)
Centres in the process of joining the Registry Work is in progress to connect the following centres to the Registry.
( indicates IT system used by hospital) Estimated Population (millions)
Bangor Ysbyty Gwynedd –(Baxter system) Birmingham Queen Elizabeth Hospital – (own system) 1.82 Dorset Dorchester Hospital - (Mediqal) .60 Ipswich Ipswich Hospital –(Baxter system) .33 Canterbury Kent & Canterbury – (Velos system) .91 London Hammersmith + Charring Cross
- (Own system) 1.3
London Royal Free –(King’s system) .67 London Royal London – (King’s system) Manchester -Hope Hope Hospital - (EDS hospital system) Norwich Norfolk & Norwich Hospital –(Mediqal) .84

6
Centres in discussion with the Registry All the remaining renal units have made contact with the Registry and are considering how to facilitate joining. These are:
Estimated Population (millions)
Northern Ireland Belfast + 3 renal units – (Mediqal system) Brighton (Buying new system) .98 Chelmsford Broomfield Hospital (Buying new system) London St George’s – (Own system) Manchester –Royal (Buying new system) Middlesex /UCLH (Infoflex system – not adequate for Registry) 1.40 Shrewsbury (Joining Bristol’s proton system) Stoke (Buying Cybernius - new Canadian system ) .70
Software and links to the Registry The factor preventing these remaining units from joining the Registry is that they do not yet have satisfactory active electronic patient information systems. For some of these units there has been a lack of finance available to purchase suitable systems. From the above lists it is evident that there are now 13 systems available for purchase and use in renal units. The Registry is working with the relevant companies to help them provide appropriate software links to the Registry. In addition, the Lister renal unit in Stevenage has developed an in-house system, which has a working Registry interface. The software has been offered free by the Trust to the NHS Information Agency (NHSIA), and there has been an agreement with the NHSIA to support the system. There is an annual support charge levied by the NHSIA for this system. Paediatric Registry Links In the UK there are an estimated 750 patients aged under 18 on renal replacement therapy. As most of the 11 UK paediatric renal units are small, the British Association of Paediatric Nephrology (BAPN) was able to set up its own database to collect data. The last 2 UK Registry Reports have included a chapter of analyses from these data. The paediatric registry has had difficulties with analysis of the paediatric data, and more recently with collection of data. There is a lack of direct funding of manpower resources to run the Paediatric Registry. Another problem has been the variable transfer of patients aged 15- 18 to adult units. In order to integrate these data with the adult Registry, and also provide funded resources for data management, the BAPN has asked the adult Registry to assess ways to collect this paediatric data. The Registry has obtained a grant from the English Department of Health to help automate data collection from the paediatric renal units, and will progress with this in 2002.

7
Anonymity and confidentiality There is considerable pressure for the Renal Registry to cease reporting centres anonymously. Removal of anonymity would not only aid the development of comparative audit and assist learning from best practice, but also would also assure public accountability. This has been discussed in the Renal Registry Committee and at the Renal Association Executive Committee, with both in agreement of the importance of structuring a timescale for removal of anonymity. After consultation with the participating renal units, a phased programme towards removal of anonymity was agreed. This year the incidence and prevalence data in chapters 4 and 5 are identified by named renal unit. This move has been aided by the introduction of software enabling allocation of patient postcodes to health authorities, which have known population demographics. This provides more accurate incidence and prevalence rates than the estimated renal unit catchment populations provided by the units themselves. In subsequent reports there will be phased removal of anonymity from data related to the indicators of quality of care, such as KT/V, haemoglobin, serum phosphate. Meaningful comparison of outcomes between renal units requires the ability to correct for case-mix. The co-morbidity data available to the Registry is not yet adequate for this. There also needs to be better standardisation of the definitions and coding of acute renal failure and endstage renal failure. Investigation by the Registry has shown that apparently high 90-day death rates in some units are due to inclusion of patients with acute renal failure. Until robust data are available that will permit correction for case-mix, the Registry wishes to maintain anonymity for outcome statistics. Where anonymity has been retained in the Report, neither the Chairman of the Registry nor the subcommittee members are aware of the identity of the centres within the analysis. Only the Renal Registry director, data manager and statistician are able to identify the centres. This identification is necessary so that any issues raised, and discrepancies in the analysis, can be discussed with the relevant centre. As it may be possible to identify a centre by the number of patients treated there, throughout this report the anonymous analyses which compare centres do not show actual numbers of patients in each centre.

8
New methods of Commissioning Renal Services In April 2002 the existing 95 Health Authorities in England will be reformed as 28 Strategic Health Authorities (StHAs). The proposed new boundaries and a list of the StHAs are shown below.
Figure 2.1 Map of new Strategic Health Authorities Within this rearrangement is the devolvement of power to primary care trusts (PCTs). It was initially stated that these "will take responsibility for securing the full range of services for their local populations". Since the consultation process, which started in mid 2001, there has been a considerable change in the wording of these proposals. The tertiary services that must be contracted for through a PCT consortium have now been defined in a ‘National Specialised Services Definitions Set’, and include renal services. The following paragraph has been copied from the DOH document:- ‘HARevenueResourceLimits2002-2003Annex8.doc’ 28 November 2001 PCTs will work in consortia to ensure that specialised services (as defined in the National Specialised Services Definitions Set) continue to be effectively commissioned at StHA and supra StHA levels. The NHS must ensure that local arrangements maintain service continuity and allow co-ordinated service development, where appropriate, on a national scale. PCTs will be financially bound and organisationally committed to the decisions made through these
1. Tyne, Wear and Northumberland 2. Cumbria & Lancashire 3. County Durham & Tees Valley 4. North Yorkshire and York, East Riding
& Hull, North & North East Lincolnshire
5. West Yorkshire 6. South Yorkshire 7. Greater Manchester 8. Cheshire & Merseyside 9. Trent 10. West Midlands North 11. West Midlands Central 12. Leicestershire & Northamptonshire &
Rutland 13. West Midlands South 14. Norfolk, Suffolk and Cambridgeshire 15. Bedfordshire & Hertfordshire 16. Thames Valley 17. Avon, Gloucestershire & Wiltshire 18. South West Peninsula 19. Somerset & Dorset 20. Hampshire & Isle of Wight 21. Essex 22. Kent 23. Surrey & Sussex 24. London North West 25. London Central 26. London North East 27. London South East 28. London South West

9
consortia. PCTs must honour existing agreements (financial and otherwise) negotiated by Regional Specialised Commissioning Groups and current specialised service commissioners. In 2002-03, Regional Specialised Commissioning Groups (RSCGs) will have a specific role in developing PCT capacity to commission specialised services as part of a planned transition to successor arrangements. Ensuring that enough people with the right skills continue in their roles is particularly important in the context of specialised services It is envisaged that StHAs will have a role in monitoring the performance of the specialised commissioning consortia. The services included in the National Specialised Services Definitions Set can be found on the DOH website at: http://www.doh.gov.uk/specialisedservicesdefinitions
Renal Services definition This definition of renal services has been copied from the above website. Renal Services have been a national priority since 1993 when the National Renal Review was set up. In February 2000 the Department of Health announced that a Renal National Service Framework (NSF) would be developed. When the renal NSF is published, it will be the key reference document for commissioning renal services. This definition will therefore be updated at that stage to ensure consistency with the renal NSF. It is not anticipated that there will be any change in the identification of renal services as specialised services that require collective commissioning arrangements. All nephrology should be considered as specialised, including:
Treatment for End Stage Renal Failure (ESRF) Treatment for acute renal failure General nephrology (provided in a main nephrology unit) Renal related surgery
Interpretation of the data within the report
We again state that caution must be used in interpretation of any apparent differences between centres.
As in last year’s report, the 95% confidence interval is shown for compliance with a Standard. Calculation of this confidence interval (based on the Poisson distribution), and the width of the confidence interval, depends on the number of patients within the Standard and the number of patients with data. To assess whether there is overall significant difference of the percentage reaching the Standard between centres, a chi-squared test has been used. Caution should be used when interpreting “no overlap” of 95% confidence intervals between centres in these presentations. When comparing data between many centres, it is not necessarily correct to conclude that two centres are significantly different if their 95% confidence intervals do not overlap. In this process the eye compares centre X with the other 40 centres and then centre Y with the other

10
39 centres. Thus 79 comparisons have been made and in any comparison at least 4 are likely to be “statistically significant” by chance at the commonly accepted 1 in 20 level. If 41 centres were compared with one another, then 860 individual comparisons would be made, and one would expect to find 42 “statistically significant” differences. To test for significance between individual centres to see where the differences lie would require multiple testing in this way and therefore was not performed by the Registry. The Registry has not tested for “significant difference” between the highest achiever of the standard and the lowest achiever, as these centres were not identifiable in advance of looking at the data, which renders the comparison invalid in statistical terms. Integration with the audit cycle. The UK Renal Registry is part of a national renal audit cycle as shown. With the presentation of this Registry data to the renal community, the challenge to nephrologists and the developing National Service Framework is to find effective and creative ways to use the data in the implementation part of the cycle, in order to improve clinical practice. The Renal Registry is at the forefront of speciality-based national developments in quality assurance/improvement, and not all the necessary formal structures are yet in place to allow full value to be derived from this opportunity.
Figure 2.2 Renal Registry audit cycle The Registry and Clinical Governance There has been considerable debate within the Renal Association Trustee and Executive committees, and the Registry committee, about the Registry’s responsibilities under clinical governance, particularly if an individual renal unit appears to be under-performing in some areas of activity. . For apparently serious errors of under-performance, the Registry will
Renal Association Standards
UK Renal Registry
Renal Unit Local Initiatives
(ad hoc)
Aids to implementation(? to be created)
.

11
discuss this further with the renal unit and help check the validity of these data. The Registry Report is also sent to the Chief Executive of each Trust in which a renal unit is situated, since the responsibility for clinical governance within the Trust lies with the Chief Executive. The Chief Executive is informed of the code of the Trust’s renal unit within the report. If, after such investigation, the problems persist, the Registry will recommend the renal unit seek an external peer review, and may need to inform the local commissioners. Distribution of Report The Renal Association has made a grant towards part of the report costs, to allow distribution to all members of the Association. The report will also be distributed to Health Authorities. Further copies of the report will be sent to individuals or organisations on request: a donation towards the £12 cost of printing and postage would be appreciated The full report will also appear on the Registry web site – www.renalreg.com Future potential of the Registry The Renal Registry has a unique data collection system with huge potential for the future. With almost complete coverage of the UK, the Registry is ideally situated to aid the implementation and monitoring of the National Service Framework. The Registry software resources in place at renal units offer an opportunity for automated data collection for multi-centre studies and trials. From the outset the database was designed to facilitate this, with provision for patients to be specifically flagged, and allowing easy addition of new data items, without requiring alterations to the existing basic software. The extension to research applications will require attention to compliance with Data Protection Act, an issue that is further discussed in Appendix D. There is also considerable interest in collection of data on cohorts of pre-end stage renal failure patients: many renal units already hold these data in their renal systems. Once the work of connecting the rest of the UK sites been completed, the members of the Renal Association will be consulted on these future projects.

12

13
Chapter 3: A national survey of renal satellite units in England and Wales Summary In order to meet the increasing demand for haemodialysis in the UK and to improve access to these services, renal satellite units have developed. These are largely nurse run chronic haemodialysis centres linked to main renal units. There were 82 satellite units in England & Wales on 31st March 1999 (73 in 1998), with 67% of main renal units possessing a satellite. A renal satellite unit is defined as a haemodialysis facility which is linked to a main renal unit and not autonomous for medical decisions, and which provides chronic out patient maintenance haemodialysis, but without in-patient nephrology beds on-site. Satellite units varied in their location and size with 43% not on an acute hospital site, a median of 8 HD stations, (range 3-31), and 19 units (26%) were commercially run. Only 9 units (12%) had regular daytime onsite medical supervision. Of the 2599 patients being treated in the renal satellite units, 42% were aged 65 or over, compared with 45% of haemodialysed aged 65 or over in the UK as a whole. 12% of patients dialysing in satellite units were diabetic and 28% of satellite units also accepted patients dialysing for their first time. Commercially run renal satellite units were more likely to be based on sites that were not within hospital grounds and were significantly larger than NHS renal satellite units (median number of HD stations 12 vs 8 p<.001). They were also less likely to accept patients who were hepatitis B positive. There was a diverse range of models of service provision for renal satellite units in England and Wales. They are heterogeneous in size, location, funding and staffing and despite relatively low levels of medical input are treating elderly patients with considerable comorbidity. It is important that their effectiveness, quality of care, acceptability to patients and carers and costs are evaluated. Introduction During the 1960s and 1970s renal replacement therapy programmes in the UK were provided by a small number of renal units based in teaching hospitals covering large catchment populations. Until CAPD was introduced in the late 1970’s treatment was restricted to younger patients without significant comorbidity, the majority of whom were trained to undergo Home Haemodialysis. Facilities for unit haemodialysis in the UK were very limited by contrast with the situation elsewhere in Europe. In the 1980’s renal services expanded in the UK. This expansion was partly due to investment prompted by a national target set in 1984
1 and also by the widespread use of CAPD, which allowed the treatment of an increased number of patients without the need for additional haemodialysis facilities. However, despite this, as the prevalence of patients requiring treatment for end-stage renal failure has continued to rise the majority of main renal units

14
have experienced progressive congestion of their haemodialysis facilities. This is contributed to by the increasing population of elderly patients with other co-morbid illnesses who are unable to manage CAPD, a decrease in the use of home haemodialysis programmes and the limited life-span of CAPD as a treatment. In 1992 the Department of Health in England commissioned a survey of all renal units. The results of this survey showed that the acceptance rate of new patients starting renal replacement therapy in 1991/2 was 67 per million population (pmp), which was well below the minimum estimated need of 80 pmp for the population under the age of 802-4. Moreover, there was considerable geographic variation between areas in both the supply of services and in acceptance rates. Whilst this was in part due to different population age and ethnic minority profiles, distance from renal units was inversely related to the acceptance rate, particularly in non-metropolitan areas, suggesting that access to services was a barrier to referral5. In the early 1980’s a few satellite renal units had been established in different parts of the country and then in 1994 National Renal Purchasing Guidelines, which were distributed to health authorities as a guide to commissioning effective renal care, recommended that the development of renal satellite units be expanded to improve geographical accessibility.6 These units would be attached to main renal units (MRU) and provide a chronic maintenance haemodialysis service, run by nurses, and mainly for the benefit of patients living at some distance from the main unit. These Guidelines hastened the development of renal satellite units and the decentralisation of renal services. Over the past decade the annual acceptance rates for renal replacement therapy in England has increased from 67 pmp in 1991/19926 to 82pmp in 19957 and 92 pmp in 19988. As shown in figure 3.1 the greatest growth has been in satellite haemodialysis.
Figure 3.1: Changes in Dialysis Modality in England 1993-1998
��������������������������������������������������������������������������������������������������������������������������������������������������������������������������
���������������������������������������������������������������������������������������������������������������������������������������������������������
������������������������������������������������������������������������������������������������������������������������������������������������
Changes in patients on each dialysis modality (England) 1993-1998
0102030405060708090
100
1993 1995 1998Year
Dia
lysis
mod
aliti
es
������������ PD
Home HDSatellite HDHosp HD

15
Table 3.1 shows that whilst the number of haemodialysis stations within main units increased by 37% over this period, there was a 300% increase in the number of haemodialysis stations within renal satellite units8,9 .
1993 1995 1998 % increase Main Renal Units 52 51 52 0% Main unit HD stations 743 832 1021 37% Satellite Units 36 60 73 103% Satellite unit HD stations 189 472 761 303%
• source- National Renal Surveys
Table 3.1: Changes in Renal Units in England 1993-1998 This is a survey of renal satellite units in England and Wales, focusing on their service delivery and organisational structure. Methods The directors of all renal units in England and Wales with a satellite unit attached, were contacted to confirm the number and name of each satellite units linked with their main unit. A renal satellite unit is defined as a haemodialysis facility which is linked to a main renal unit and not autonomous for medical decisions, and which provides chronic out patient maintenance haemodialysis, but without in-patient nephrology beds on-site. A questionnaire was sent seeking information on the structure, organisation and processes of care. Information was requested on policies for accepting patients categorised as high-risk, with temporary vascular access and for first dialysis. Details were sought about the arrangements for elective and emergency medical input. Demographic data were collected on the proportions of patients who were over 65 years of age and of those with diabetes. The questionnaire was piloted in two renal satellite units. Questionnaires were sent out at the beginning of 1999 requesting data relating to the 31st of March of that year. Data were entered directly into SPSS using "automated forms scanning". Standard summary statistics were used to describe the baseline data. Comparisons between different categories of renal satellite units were made by using either the Pearson’s Chi-squared test, the Mann-Whitney-U test or the two-sample t-test where appropriate. Results Of the 57 main renal units identified, 38 (67%) had a total of 82 renal satellite units. Questionnaires were returned from 74 (90%) of these units. Two main renal units didn’t respond (with six renal satellite units). Figure 3.2 demonstrates that while 5 main renal units had 4 or more satellite units; 19 (33%) did not have a satellite unit. In several cases a single satellite unit served more than one main renal unit.

16
Figure 3.2: Numbers of Renal Satellite Units linked to Main Renal Units Of the 2599 patients treated in the satellite units that responded to the survey, 1518 (58%) were male, 1101 (42%) were over 65 years (unit median 50%, IQR 35-58%, range 0-88%), and 311 (12%) were diabetic (unit median 14%, IQR 10-18%, range 0-42%).
Location Numbers Acute hospital 42/74 (57%) Other hospital 23/74 (31%) Non hospital 9/74 (12%) Unit management NHS 55 (74%),
Private 19 (26%) Median number of HD stations (range) 8 (3-31) Median number of patients (range) 34 (8-120)
Support services
CAPD support 6/69 (9%) Home HD support 6/69 (9%) APD support 4/69 (6%) Integral out-patient clinic 18/66 (27%) Permanent medical cover 9/74 (12%) Consultant 5/9 (56%) Associate specialist 1/9 (11%) Staff grade 3/9 (33%) SPR 3/9 (33%) Non-permanent medical cover 65/74 (88%)
Methods of receiving medical care
Phone call to MRU 57/65 (88%) GP Visits 4/65 (6%) Ambulance 999 call 25/65 (38%) Onsite emergency cover from local hospital
29/65 (45%) (81% for those on acute hospital site)
Call out of MRU staff 7/65 (11%) Other 16/65 (25%) Patient : Nurse Ratio 5.6 Patient : All Staff Ratio** 4.0
*denominator varies due to missing data ** includes healthcare assistants
Number of satellites per Renal units
0
5
10
15
20
25
0 1 2 3 4 or more
Satellites
Ren
al u
nits

17
Table 3.2: Organisational characteristics of renal satellite units in England and Wales Satellite units were sited mainly in acute hospitals (57%), with 31% on other hospital sites and 12% on non-hospital sites. Ownership was predominantly by the National Health Service (NHS), although a significant proportion 19 (26%) were commercially run, mainly by two companies. The size of the satellite units varied considerably, with a median of 8 haemodialysis stations (range 3-31) and 34 patients (range 8-120) per unit. Six satellite units (9%) also provided support for patients on other forms of renal replacement therapy. However, 27% did offer an integral out-patient clinic, thereby avoiding the need for the satellite patients to travel to the main renal unit for regular follow-up. Only 9 (12%) satellite units had permanent daytime medical cover (defined as a doctor regularly on site during the daytime most days of the week). This was mainly at consultant level (5/9), with other grades of doctor providing cover in the other hospitals. In the 65 (88%) satellite units which did not have on-site daytime medical cover, medical care was sought by a variety of means, principally by telephone advice from the main renal unit. A few satellite units (6%) also relied on cover from a local primary care physician. For more serious situations, 45% reported that they relied on support from the local acute hospital (rising to 81% for those units on an acute hospital site), 38% relied on emergency ambulance calls, and 11% would call out a doctor from the main renal unit. The average number of patients to whole time equivalent (WTE) staff ratio was 5.6 for nursing staff and 4.0 when healthcare assistants (HCAs) were included.
Policy Number of units (Percentage) Accept for first dialysis 18/65* (28%) Temporary neckline 63/74 (86%) Hep B +ve patent 36/74 (49%) Hep C +ve patent 54/74 (73%) HIV +ve patent 45/74 (61%)
* missing data Table 3.3: Treatment Acceptance Policies of Renal Satellite Units Eighteen (28%) renal satellite units accepted patients for their first dialysis without stabilising them first in the main renal unit, and 63 (85%) accepted patients with a temporary neckline: Seventy three of the 74 renal satellite unit would accept patients with a permanent tunnelled neckline. Only 36 (49%) renal satellite units would accept patients who were Hepatitis B positive, 54 (73%) accepted Hepatitis C positive patients, and 45 (61%) accepted HIV positive patients. Forty one (55%) renal satellite units dialysed some patients for less than 3 times per week (median 3% of patients per renal satellite unit). The most common factors influencing this decision were residual renal function in 28 units and patient choice in 20 units. Only 4 (10%) renal satellite units reported lack of staff or haemodialysis station time as a reason for dialysing patients less than thrice weekly. Only 4 (5%) renal satellite units reported re-use of dialysers. The majority of patients travelled for dialysis by hospital car (median 70% of patients per unit), 20% drove themselves and 5% relied upon ambulance transport

18
Table 3.4 compares NHS and commercially run renal satellite units. NHS renal satellite units were more likely to be on an acute (60% vs 47%) or other hospital (36% vs 16%) site. There was also a significant difference in unit size; commercialy run renal satellite units had a greater number of haemodialysis stations and patients, but did not differ in the patient: staff ratio or in the proportions of patients over 65 or diabetic.
Renal satellite unit characteristics NHS (55) Private (19) P value Location Acute hospital 33 (60%) 9 (47%) Other hospital 20 (36%) 3 (16%) Non hospital 2 (4%) 7 (37%)
.001
.001
.001 Median number of HD stations (range) 8 (3-16%) 12 (6-31) <.001 Median number of patients (range) 28 (8-96) 44 (22-120) .014 Patient:Staffing Ratios Patient : Nurse 5.5 5.8 NS Patient : All Staff 3.7 5.5 NS Unit treatment acceptance policies Accept for first dialysis 10/47 (21%) 8/18 (44%) NS Temporary neckline 50/55 (91%) 13/18 (72%) 0.045 Hep B +ve patent 34/55 (62%) 4/19 (21%) 0.002 Hep C +ve patent 17/55 (31%) 3/19 (16%) NS HIV +ve patent 25/55 (45%) 4/19 (21%) NS
Table 3.4: Comparison of NHS and Private Renal Satellite Units Treatment acceptance policies did not generally differ significantly, except that private renal satellite units were less likely to accept patients with temporary necklines or hepatitis B infection. The location of a renal satellite unit, (acute hospital site, non-hospital site or non-acute hospital site) appeared to have little impact on the organisation or processes of care. There was a non significant trend for renal satellite units on acute hospital sites to have slightly more nurses but fewer overall staff per patient than those on a non-acute site (Patient: Nurse Ratio Acute 5.4, non-Acute 5.9; Patient: All Staff Ratio Acute 4.1 non-Acute 3.8). Integral outpatient clinics were more common in renal satellite units based on acute hospital sites than in other locations. The satellite units with permanent medical staffing, they were more likely to accept patients for their first dialysis (62% vs 23% in non-medically staffed units, p=.019), and to provide an integrated out-patient clinic (86% vs 20% in non-medically staffed units, p=<.001). Discussion During the 1990s there was a significant increase in both the number of renal satellite units in England and Wales and the number of patients dialysing within them7,8. This development allowed expansion of patient numbers on haemodialysis and a reduction in patient travelling times to and from dialysis sessions. Renal satellite units have been opened in smaller towns in both rural areas and on the periphery of large conurbations, as well as in urban areas. This survey shows that renal satellite units are heterogeneous in size, location, finance, and the services they provide.

19
A key feature is that most are nurse run with no onsite medical cover. Despite this many are not based on acute hospital sites, some being sited on business parks or shopping centres that are some distance from the acute hospital services. Whilst there is some selection used when referring patients for satellite care, the proportions of patients on haemodialysis aged over 65 (42%) and with comorbidity such as diabetes (12%) are similar to those found by the UK Renal Registry for all HD patients at participating renal units in 1999 (45% over 65 years old and 14% diabetic respectively9). Moreover some of the satellite units also provide a haemodialysis service for patients who have not been previously stabilised on haemodialysis in the main renal unit. Senior nursing staff in these satellite renal units therefore carry a significant clinical and managerial responsibility. The link between the private sector and provision of renal services is well established and the choice to utilise a private company to provide a renal satellite unit is becoming increasingly common. The 1996 Renal Review7 found that 19% of renal satellite units in England and Wales had private sector involvement, rising to 26% by 1999. This study has shown many similarities in the services provided by private and NHS units. This is not surprising, as whilst the ownership of the units differs, the medical management remains the responsibility of an NHS consultant nephrologist. However there are differences, with private renal satellite units being significantly larger and also less likely to accept Hepatitis B+ve patients who would require an isolation cubicle with a dedicated machine10. In response to the increasing demand for renal replacement therapy, the growth in satellite haemodialysis care is a trend that is likely to continue. Key factors contributing to this increase are the current unmet need for renal replacement therapy, which is compounded by demographic change in ethnic minority groups with higher rates of renal failure such as Indo-Asians and African Caribbeans11. Modelling shows that a steady state of the prevalent pool will not be reached for several decades 12. Given the shortage of kidneys for transplantation, there will be an increasing need for haemodialysis. Satellite care seems a suitable option to providing an accessible haemodialysis service for an increasing elderly population on renal replacement therapy. In response to the increasing demand for renal replacement therapy, the growth in satellite haemodialysis care is a trend that is likely to continue. Key factors contributing to this increase are the current unmet need for renal replacement therapy, which is compounded by demographic change in ethnic minority groups with higher rates of renal failure such as Indo-Asians and African Caribbeans11. Modelling shows that a steady state of the prevalent pool will not be reached for several decades 12. Given the shortage of kidneys for transplantation, there will be an increasing need for haemodialysis. Satellite care seems a suitable option to providing an accessible haemodialysis service for an increasing elderly population on renal replacement therapy. The increase in demand for renal replacement therapy and resultant expansion in haemodialysis services is occurring in all other developed countries13,14. However most of these countries have a higher proportion and absolute number of patients on hospital haemodialysis than in the UK. They also have more renal centres and doctors per million population. Renal satellite care is described in the international literature although there is no universal definition for a renal satellite unit. In some countries, minimal care facilities (whereby the patients carry out their own dialysis in a centre with no medical supervision and often without a trained nurse on site), are included in the number of patients on satellite

20
dialysis. This makes comparison across countries problematic. Nevertheless data from national registries suggests there has been a major growth in renal satellite units in other countries14,15. Several questions are raised by the findings of this survey. :-
1. The optimal size for a renal satellite unit is unclear. Currently there is a large variation in size which in part reflects the geographical distribution of the catchment population of the main renal unit.
2. As a significant proportion of patients dialysing in these units are elderly and or diabetic, with co-existing co-morbidity, the safety of renal satellite units sited far from an acute medical facility needs to be investigated as most renal satellite units do not have permanent medical cover.
3. It is also important to evaluate patients’ views of dialysis away from the main unit, and the impact of care in a renal satellite unit on the patients’ quality of life.
4. As renal satellite units are becoming a significant part of the provision of renal replacement therapy in the UK, their cost effectiveness and how this varies by type of renal satellite unit needs to be evaluated.
5. As demand for renal replacement therapy continues to grow, more satellite renal units are likely to open, which might enable main renal units to concentrate on the treatment of the more complex and unstable haemodialysis patients. However it is possible that some renal satellite units, particularly those on an acute hospital site with a large local catchment population, will evolve into medically staffed autonomous renal units. These would then provide not only a chronic haemodialysis service for all haemodialysis patients in their catchment area, but also a full nephrology service. This would be closer to the model of services in other developed countries.
Further Work This study has shown a diverse range of models of service provision for the renal satellite units in England and Wales. There is an ongoing second phase of this study, funded by the Health Technology Assessment Programme at the Department of Health, with the aims of :-
1. Comparing the effectiveness, safety and acceptability of care for renal satellite units patients with a similar group of dialysis patients dialysing in the main renal unit.
2. Identifying and contrasting the resource use of both sets of patients and the resulting
cost differences between the satellite and parent main units.
3. Determining the improvement in geographical accessibility from dialysing in an renal satellite unit.
Acknowledgements: We are grateful to staff in all the renal satellite units who participated in this study, to Ms Joanne Turnbull for data management, to Dr David Ansell and the UK Renal Registry for national data and to members of the Steering Committee, especially Professor Joy Townsend and Mr Mark Mullee. The study was funded by the NHS Executive Health Technology Assessment Programme.

21
References
1. Patten J. Kidney patients. House of Commons Official Report (Hansard), London: House of Commons, 1984, 710 cols 309-10.
2. Department of Health. Report of the Health Care Strategy Unit Review of Renal
Services. Part II: Evidence for the Review. 1994. Unpublished.
3. Feest TG, Mistry CD, Grimes DS, Mallick NP. Incidence of advanced chronic renal failure and the need for end stage renal replacement treatment. BMJ 1990; 301: 897-900.
4. Renal Association. The provision of services for adult patients with renal disease in the
United Kingdom. London: Renal Association,1991.
5. Roderick P, Clements S, Stone N, Martin D, Diamond I. What determines geographical variation in rates of acceptance onto renal replacement therapy in England? J Health Serv Res Policy 1999; 4: 139-46.
6. Department of Health. Renal Purchasing Guidelines. London: Department of
Health,1996.
7. Roderick P, Ferris G, Feest T. The provision of renal replacement therapy in England and Wales; recent trends and future directions. Q J Med 1998; 91: 581-587.
8. Feest T, Rajamahesh J, Taylor H, Roderick P. The Provision of Renal Replacement
Therapy for Adults in the UK 1998. London: Department of Health,2000.
9. Ansell D, Feest T. The Third Annual Report of the UK Renal Registry. Bristol: UK Renal Registry, 2000.
10. The Renal Association. Treatment of adult patients with renal failure. Recommended
standards and audit measures. Second edition. London: Renal Association and Royal College of Physicians, 1997.
11. Roderick PJ, Clements S, Diamond I,Storkey M, Soni Raleigh V. Estimating the
demand for renal replacement therapy in Greater London: the impact of demographic trends in ethnic minority populations. . Health Trends 1998;30:46-50
12. Davies R, Roderick P. Predicting the future demand for renal replacement therapy in
England using simulation modelling. Nephrol Dial Transplant 1997; 12: 2512-6.
13. USRDS. 1999 Annual Data Report. Bethesda: National Institutes of Health,1999.
14. ANZDATA. The Twenty Second Report. Adelaide: Australia and New Zealand Dialysis and Transplant Registry,1999.

22
15. Canadian Institute for Health Information . 2001 Report, Volume 1: Dialysis and Renal Transplantation, Canadian Organ Replacement Register. Ontario: Canadian Institute for Health Information, 2001.

23
Chapter 4: New Adult Patients Starting Renal Replacement Therapy Summary The estimated rate of adult patients starting renal replacement therapy (RRT) in the England & Wales is 89 pmp indicating that approximately 5350 patients started RRT in 2000. This figure is identical to the 1999 report. Incidence rates calculated from health authorities with complete Registry coverage varied from 157 down to 52 per million population. Haemodialysis was the modality of RRT at a day 90 for 60% of dialysis patients in England & Wales (58.8% in 1999) By the end of the first year 16% of patients starting on PD had changed to HD, similar to last year’s data. The 90-day survival is 95% (95%CI 94-96%) for those aged less than 65 and 83% (95%CI 81-85%) for patients aged 65 and over. The one-year survival is 86% (95%CI 84-88%) for those aged less than 65 and 66% (95%CI 63-69%) for patients aged 65 and over. The consistency of many of these results from year to year, as more units join the Registry, gives grounds for confidence that the population of patients followed by the Registry is representative of the UK as a whole. Introduction This year the Registry has taken the first step towards relating details of new patients accepted for renal replacement treatment to local populations. A further change is that with the agreement of contributing centres, anonymity has been dropped for acceptance rates, demographic data and primary renal diagnosis. The number of units participating in the registry has increased by 5, (6 new, one unable to return the data for this period) to 28 of the 57 units (48%) in England and Wales.
England & Wales
No. of Units 28 No. of new patients on Registry 2357 Catchment population million 26.44 New patients pmp (95% C.I.)
89 (85 – 93)
New patients per Unit 90 Table 4.1: Summary of new adult patients accepted during 2000
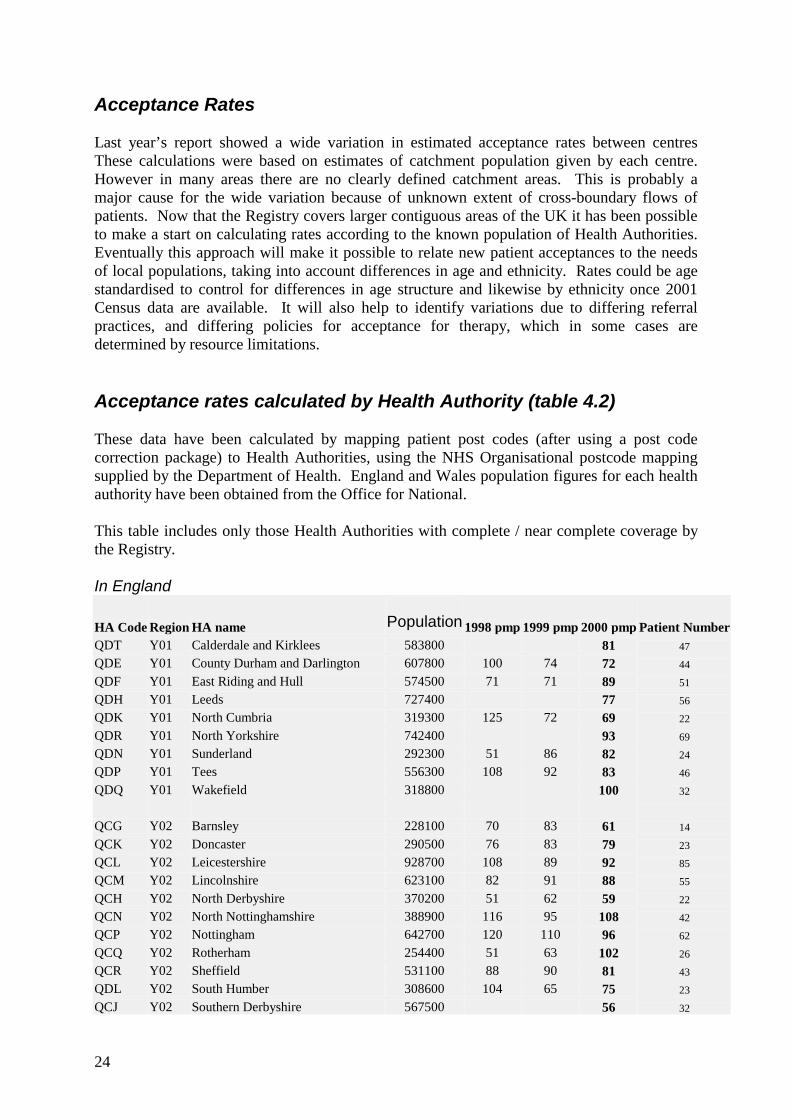
24
Acceptance Rates Last year’s report showed a wide variation in estimated acceptance rates between centres These calculations were based on estimates of catchment population given by each centre. However in many areas there are no clearly defined catchment areas. This is probably a major cause for the wide variation because of unknown extent of cross-boundary flows of patients. Now that the Registry covers larger contiguous areas of the UK it has been possible to make a start on calculating rates according to the known population of Health Authorities. Eventually this approach will make it possible to relate new patient acceptances to the needs of local populations, taking into account differences in age and ethnicity. Rates could be age standardised to control for differences in age structure and likewise by ethnicity once 2001 Census data are available. It will also help to identify variations due to differing referral practices, and differing policies for acceptance for therapy, which in some cases are determined by resource limitations. Acceptance rates calculated by Health Authority (table 4.2) These data have been calculated by mapping patient post codes (after using a post code correction package) to Health Authorities, using the NHS Organisational postcode mapping supplied by the Department of Health. England and Wales population figures for each health authority have been obtained from the Office for National. This table includes only those Health Authorities with complete / near complete coverage by the Registry. In England
HA Code Region HA name Population 1998 pmp 1999 pmp 2000 pmp Patient Number QDT Y01 Calderdale and Kirklees 583800 81 47 QDE Y01 County Durham and Darlington 607800 100 74 72 44
QDF Y01 East Riding and Hull 574500 71 71 89 51 QDH Y01 Leeds 727400 77 56 QDK Y01 North Cumbria 319300 125 72 69 22
QDR Y01 North Yorkshire 742400 93 69 QDN Y01 Sunderland 292300 51 86 82 24 QDP Y01 Tees 556300 108 92 83 46
QDQ Y01 Wakefield 318800 100 32 QCG Y02 Barnsley 228100 70 83 61 14
QCK Y02 Doncaster 290500 76 83 79 23 QCL Y02 Leicestershire 928700 108 89 92 85 QCM Y02 Lincolnshire 623100 82 91 88 55
QCH Y02 North Derbyshire 370200 51 62 59 22 QCN Y02 North Nottinghamshire 388900 116 95 108 42 QCP Y02 Nottingham 642700 120 110 96 62
QCQ Y02 Rotherham 254400 51 63 102 26 QCR Y02 Sheffield 531100 88 90 81 43 QDL Y02 South Humber 308600 104 65 75 23
QCJ Y02 Southern Derbyshire 567500 56 32

25
HA Code Region HA name Population 1998 pmp 1999 pmp 2000 pmp Patient Number QEA Y07 Coventry 304300 112 115 118 36 QEC Y07 Dudley 311500 80 64 71 22
QEG Y07 Solihull 205600 83 73 88 18 QEK Y07 Walsall 261200 115 77 20 QEL Y07 Warwickshire 506700 97 116 101 51
QEM Y07 Wolverhampton 241600 99 157 38 QCX Y08 East Lancashire 511200 39 68 74 38
QC4 Y08 Morecambe Bay 310300 45 71 100 31 QCY Y08 North-West Lancashire 466300 75 69 79 37
QAD Y10 Croydon 338200 50 56 89 30 QAH Y10 Lambeth, Southwark and Lewisham 745200 78 58
QA7 Y11 Berkshire 556600 108 60 QA8 Y11 Buckinghamshire 618900 63 76 71 44 QCC Y11 Northamptonshire 615800 71 73 89 55
QCE Y11 Oxfordshire 616700 76 65 62 38 QD8 Y12 Avon 999300 82 84 109 109
QDY Y12 Gloucestershire 557300 90 95 88 49 QDX Y12 North and East Devon 479300 81 88 92 44 QD5 Y12 Somerset 489300 67 84 69 34
QD6 Y12 South and West Devon 589100 119 107 97 57 Table 4.2: Acceptance rate by Health Authority England.
Health Authorities in Wales
HA Code Region HA name Population 1998 pmp
1999 pmp
2000 pmp
Patient Number
QW1 W00 Gwent 557200 102 75 93 52 QW2 W00 Bro Taf 739600 88 111 97 72 QW5 W00 Morgannwg 499700 26 14 82 41 Table 4.3: Acceptance rate by Health Authority Wales Other health authorities in England& Wales do not have complete coverage from Registry units to enable the take-on rate to be calculated. With the rapidly increasing coverage by the Registry it is anticipated that a much more complete picture will be available in the next report. These data continue to show a wide variation in take-on rate around the country from 52 per million per annum to 157 per million per annum. Whilst the unit with the highest acceptance has a relatively high ethnic minority population, and the very lowest areas have relatively small ethnic minority populations, there is no clear relationship between acceptance rates and the proportion of population from ethnic minorities.

26
With the formation of large strategic health authorities as described in Chapter 2, this geographic variation in acceptance rates may be partially obscured if reporting is done by such large areas. From table 4.2 it can be seen that contiguous areas with widely differing take-on rates will be merged into one authority, giving an average rate hiding the variation. To monitor the variation, it will therefore be necessary to continue to monitor acceptance rates for geographic areas smaller than those covered by the new strategic authorities. Using data from those areas with good Registry coverage, the annual acceptance rate in England is 86 per million population and 92 per million population in Wales. Acceptance of new patients by renal unit (table 4.4) The number of patients accepted by each renal unit is shown in table 4.4
Number of new patients
Centre Estimated catchment pop 1998 1999 2000
Bristol 1.50 122 119 151 Carlisle 0.36 40 26 27 Carshalton 1.67 141 108 117 Coventry 0.85 87 92 89 Cardiff 1.30 137 138 137 Derby 0.48 26 Exeter 0.75 74 82 71 Gloucester 0.55 49 59 46 Guys 1.73 122 Heartlands 0.60 71 71 77 Hull 0.84 73 65 81 Leicester 1.73 181 161 177 Leeds GI 0.90 68 Nottingham 1.16 129 128 113 Oxford 1.80 146 139 144 Plymouth 0.55 71 67 63 Preston 1.56 79 105 118 Reading 0.60 54 S Cleveland 1.00 109 92 90 Sheffield 1.75 129 134 136 Southend 0.35 43 39 StJames, Leeds 1.30 71 79 89 Sunderland 0.34 41 45 46 Swansea 0.70 61 Wolverhampton 0.49 75 77 Wordsley 0.42 46 43 40 Wrexham 0.42 51 58 York 0.34 40
Total E&W 26.44
N/A N/A 2357 Table 4.4: Number of new patients accepted by renal units

27
Acceptance rate by Renal Unit As discussed at the start of this chapter, the renal unit catchment populations are estimates based on information either from the local renal unit or the 1992 national renal survey, which analysed patient distributions in England by postcode and calculated a catchment population for each English renal unit. Many Health Authority boundaries have changed slightly over the last 10 years causing some redistribution, and cross boundary flow patterns between units will also have altered. The Welsh renal unit at Wrexham is uncertain of its cross boundary flow from England. For this reason incidence rates have not been calculated for each renal unit, as the estimates of catchment are not considered sufficiently accurate to render such a calculation meaningful. The difficulties are illustrated in the following paragraphs. 1. An example of differences in unit acceptance rates which are almost certainly due to
difficulties in establishing the catchment population is provided by Leeds where the incidence rates calculated from the Health Authority population was 77 pmp compared with the figures calculated from the catchment populations estimated by the hospitals which serve Leeds - St. James’ (estimated unit acceptance rate 61 pmp) and Leeds General Infirmary (estimated acceptance rate 90.7 pmp). Mapping individual patients from each unit it is clear that are large areas from which patients may go to either unit, rendering catchment populations difficult to assess. This probably explains much of the apparent variation between the units. It would be necessary to have more details of the demography of the city to assess possible variation due to differences in age and ethnic distribution.
2. A further instance where the figures are difficult to interpret is provided by the Plymouth
unit in south and west Devon (unit rate 140 pmp, Health Authority 97pmp) and the Exeter unit in north and east Devon (unit rate 84 pmp, Health Authority 92pmp). Again, although the acceptance rate may be genuinely higher in south and west Devon, mapping shows that much of the difference in unit acceptance rates is likely to be explained by difficulties in establishing the size of the catchment populations, and influx of patients to Plymouth from Cornwall.
3. A further example is North Cumbria. The Carlisle renal unit quotes the same catchment
population as the North Cumbria Health Authority, of 0.32 million. The Health Authority annual acceptance rate is 69 pmp, yet it is almost exclusively served by Carlisle whose calculated acceptance rate would be 84pmp. Inspection of the patients’ addresses indicates that the difference is due to several patients referred from outside the HA boundary into Carlisle, again an example of cross-boundary flow and an underestimate of the effective catchment population of the unit concerned.
4. In the case of smaller units and Health Authorities, small changes year on year in the
number of new patients will be reflected in relatively large changes in acceptance rates. The catchment populations shown in table 4.4 now take into account some of these considerations and as a result are slightly different from that shown in last years report. Ethnicity The number of units providing details of ethnicity has increased considerably; in the 1999 report only 6 units provided data on at least 85% of patients, in the 2000 report this had

28
increased to 12 and the figure for the current report is 17. In England, ethnicity data was missing in 24% of all the patients reported to the Registry in 2000 compared with 34% in the previous year. In 17 units the returns were high (>87%) rendering data from these units useful. Eight units provided little or no ethnicity data. In Wales and Scotland it is not health authority policy to collect ethnicity data. There was a notable increase in the percentage of Asian patients quoted by the Leicester unit – from 10% last year to 41.5% in this report.
Centre % sent White Black Asian Chinese Other Gloucester 100 100.0 Heartlands 100 85.7 2.6 7.8 2.6 Nottingham 100 87.6 4.4 6.2 1.8 Sheffield 100 94.9 4.4 0.7 Wolverhampton 100 80.5 5.2 13.0 1.3 Wordsley 100 92.5 7.5 Exeter 99 98.6 1.4 Preston 98 87.9 12.1 Bristol 97 93.8 1.4 4.8 Reading 96 78.8 3.8 13.5 1.9 Guys 95 73.3 22.9 1.9 Plymouth 94 94.9 3.4 1.7 Sunderland 93 100.0 Southend 92 97.2 2.8 Coventry 90 82.5 1.2 16.3 Leicester 90 56.0 1.9 41.5 St James, Leeds 87 89.6 1.3 7.8 1.3 Hull 78 98.4 1.6 Derby 46 100.0 S Cleveland 41 94.6 5.4 Carshalton 26 Carlisle 7 Oxford 6 Leeds GI 4 York 0 England 76 86.0 3.3 9.7 0.7
Table 4.5: Ethnicity by centre
Median age of incident patients Centre Ethnic minority All Hull 41 65 Preston 47 60 Plymouth 47 67 Sheffield 49 58 Reading 51 60 Carshalton 55 60 Southend 56 68 Leicester 56 61 Heartlands 56 66 Guys 57 59 Wolverhampton 62 69 Coventry 63 62 Nottingham 63 65 Exeter 63 64 Wordsley 63 64

29
StJames, Leeds 64 63 SCleveland 64 67 Bristol 64 67 England 57 64
Table 4.6: Median age of ethnic groups accepted for renal replacement therapy Higher acceptance rates are to be expected from the ethnic minority groups. The ethnic minority communities are also younger than the indigenous white populations. This is clearly reflected by the lower median age of those from ethnic minorities starting renal replacement therapy (table 4.5). As the ethnic communities age, even larger numbers of patients from them will be expected to start RRT. Age and Gender
Figure 4.1: New patients by age group 1997 - 2000 Figure 4.1 shows a four year increase in the proportion of over 75s taken onto the renal replacement programme. The incidence rate of 320 per million population in this age group is low when compared to other European populations, and probably still reflects an unmet need. Figure 4.2 shows the median age in each renal unit.
Percentage of males accepted for RRT Year 1997 1998 1999 2000 England & Wales 63.1 62.8 62.2 59.3
Table 4.7: Percentage of males by age 1999-2000 Although these data are not from the same centres there appears to be a trend over the 4 years to an increasing percentage of females being started on renal replacement therapy. This may be due to an increase in the incidence in patients aged 75-84 year age group, which is predominantly female in the general population.
New patients by age group
0
5
10
15
20
25
30
35
18-24 25-34 35-44 45-54 55-64 65-74 75-84 >=85
age range
% o
f pat
ient
s
1997199819992000

30
Figure 4.2: Median Age of New Patients in 2000
Median Age of New patients in 2000
50 55 60 65 70 75
York
Wolve
Sthend
Wrex
Glouc
SCleve
Plym
Bristl
Sund
Heart
Sw nse
Notts
Hull
Crdff
Words
Extr
StJms
Covnt
Leic
Carls
Oxfrd
Carsh
Redng
Prstn
Guys
LGI
Sheff
Derby
E&W C
entre
Age

31
Primary Renal Diagnosis The primary renal diagnoses for England and Wales, and by renal unit, are shown in tables 4.8 and 4.9. The high proportion of diabetic nephropathy seen in the USA and much of Europe, particularly the north, is still not seen in England and Wales. Diabetic nephropathy does not appear to be increasing as a proportion of the total patients starting RRT.
Diagnosis E&W < 65 E&W > 65 M:F Aetiology uncertain and GN not proven 16 24 1.7 Glomerulonephritis 14 6 2.3 Diabetes 19 13 1.5 Polycystic Kidney 10 2 1.1 Pyelonephritis 8 7 1.0 Renal Vascular disease 2 10 2.1 Hypertension 4 5 2.4 Other 13 12 1.3 No diagnosis sent 15 20 1.8 Total patients 1217 1160 1.5
Table 4.8: Percentage Primary renal diagnosis by age, and gender ratios
Unit
Not sent
Aetiology unk. * Diabetes GN
Pyelo-nephritis
Polycystic Kidney
Reno-Vasc Hypertens Other
Gloucester 0 32.6 8.7 15.2 6.5 8.7 13.0 0.0 15.2 Heartlands 0 23.4 18.2 11.7 7.8 7.8 9.1 2.6 19.5 Reading 0 24.1 22.2 14.8 9.3 9.3 5.6 1.9 13.0 Sheffield 0 23.5 19.9 8.8 8.1 5.1 5.9 7.4 21.3 Wolverhampton 0 28.6 26.0 7.8 11.7 7.8 2.6 9.1 6.5 Wordsley 0 35.0 22.5 2.5 5.0 7.5 5.0 12.5 10.0 Nottingham 1 26.8 23.2 12.5 7.1 7.1 10.7 3.6 8.9 S Cleveland 1 36.0 14.6 13.5 6.7 6.7 6.7 6.7 9.0 Bristol 1 24.8 14.1 11.4 8.7 8.7 9.4 3.4 19.5 StJames, Leeds 2 19.5 13.8 9.2 16.1 10.3 8.0 0.0 23.0 Guys 3 17.8 28.0 11.0 8.5 7.6 10.2 5.9 11.0 York 8 32.4 5.4 8.1 16.2 2.7 10.8 8.1 16.2 Swansea 8 5.4 23.2 21.4 14.3 1.8 8.9 8.9 16.1 Carlisle 11 20.8 20.8 16.7 8.3 8.3 8.3 0.0 16.7 Coventry 13 20.8 20.8 9.1 11.7 1.3 9.1 13.0 14.3 Leeds GI 15 19.0 22.4 19.0 8.6 5.2 6.9 5.2 13.8 Hull 15 24.6 27.5 14.5 5.8 7.2 4.3 4.3 11.6 Preston 17 23.5 22.4 13.3 10.2 6.1 5.1 1.0 18.4 Sunderland 17 15.8 31.6 7.9 5.3 5.3 2.6 21.1 10.5 Leicester 18 34.2 15.1 10.3 10.3 2.7 8.2 6.2 13.0 Southend 18 34.4 15.6 6.3 6.3 6.3 6.3 6.3 18.8 Oxford 20 19.1 15.7 14.8 7.8 16.5 5.2 2.6 18.3 Cardiff 34 - - - - - - - - Plymouth 35 - - - - - - - - Exeter 46 - - - - - - - - Wrexham 90 - - - - - - - - E&W 17 24.1 19.6 12.2 8.9 7.2 7.3 5.5 15.2
* - Aetiology uncertain and Glomerulonephritis not proven Diagnostic distributions were not calculated for units with less than 80% returns for diagnosis. Table 4.9: Percentage diagnostic distribution of new RRT patients by unit

32
Treatment modality The proportion of patients in each unit established on haemodialysis by day 90, and the variations with age are shown in figures 4.3 and 4.4.
Figure 4.3: New patients 2000 - percentage of all dialysis on HD at day 90
New patients 2000 : Percentage of all dialysis on HD at day 90
0 10 20 30 40 50 60 70 80 90 100
Sund
Hull
Heart StJms
SCleve Wrex
Stevn
Sthend LGI
Sw nse Bristl
Covnt
Derby York
Crdff Sheff
Plym
Glouc Carls
Notts Leic
Extr
Wolve Oxfrd
Carsh Prstn
Guys
Words Redng
E&W
Cen
tre
% of patients

33
Figure 4.4: New patients - % of all dialysis patients on haemodialysis on day 90, by age By day 90, 53 % of patients were established on haemodialysis, 35% on peritoneal dialysis, 1.6% transplanted, 0.3% stopped treatment without recovery, 8.8% died and 1.3% transferred out to a non-Registry centre.
New patients : Percentage of all dialysis patients on haemodialysis on day 90, by age
20 30 40 50 60 70 80 90 100
Sund
Stevn
H ull
H eart
StJm s
W rex
C arls
C ovnt
LG I
Sheff
Leic
SCleve
Sthend
York
D erby
P lym
Swnse
B ristl
W olve
G louc
C arsh
C rdff
Extr
N otts
P rstn
O xfrd
G uys
W ords
R edng
E&W
Cen
tre
% of patients
65+
< 65

34
The first change of treatment modality This analysis includes the 2191 patients from the 23 E&W centres and 11 Scottish centres who started RRT on dialysis in 1999 and analyses the first change in modality in the 12 months from the established modality at day 90.
Change of treatment modality within the first year
Established on Haemodialysis Modality
No of patients Percentage
Remains on HD 899 68 Changed to PD 46 4 Transplanted 70 5 Transferred out elsewhere 8 0.6 Recovered 16 1.2 Stopped Treatment (died) 15 1.1 Died (no change in modality) 262 20
Table 4.10: HD patients at 90 days: changes in modality in subsequent year The results in Table 4.10 are almost identical to those in the 2000 Report although only 4% changed to PD in the first year rather than the 6% reported previously
Established on Peritoneal Dialysis Modality No of patients Percentage Remains on PD 558 65 Change to HD 117 14 Transplanted 84 10 Transferred out elsewhere 7 0.8 Recovered 7 0.8 Stopped Treatment (died) 3 0.4 Died (no change in modality) 87 10
Table 4.11: PD patients at 90 days: changes in modality in one year The results in Table 4.11 are identical to those in the 2000 Report. The consistency of this data with the change from 912 patients to 2478 covering more varied regions of the country strongly suggests that this practice is reflective of the UK as a whole.
First modality change over 2 years Only centres on the Registry in 1998 had a full annual cohort of patients available for a 2-year follow up period. The analysis includes 2123 patients.

35
Patients who were on haemodialysis after the first 90 days These figures are similar to those in last year’s Report except for a marked fall in the percentage of patients transplanted - from 9% at one year and 18% at 2 years down to 3% and 7% respectively (table 4.12). This fall is probably explained by the increased waiting lists for transplantation without a corresponding increase in the transplant rate.
Established on Haemodialysis At end of 1 year At end of 2 years First Change in Modality No. of
Patients % of
Patients No. of
Patients % of
Patients Remains on HD 868 70 623 50 Changed to PD 55 4 63 5 Transplanted 61 5 130 10 Transferred out elsewhere 6 0.5 8 0.6 Recovered 14 1 20 1.6 Stopped Treatment (died) 27 2 35 3 Died (with no change in modality)
212 17 364 29
Total 1243 1243 Table 4.12: Changes in modality over the first 2 years for patients on HD
Patients who were on peritoneal dialysis after the first 90 days
Established on PD At end of 1 year At end of 2 years First Change in Modality No. of
Patients % of
Patients No. of
Patients % of
Patients Remains on PD 557 63 351 40 Changed to HD 142 16 211 24 Transplanted 85 10 152 17 Transferred out 5 0.6 6 0.7 Recovered 6 0.7 10 1 Stopped Treatment (died) 2 0.2 3 0.3 Died (with no change in modality)
83 9 147 17
Total 880 880 Table 4.13: Changes in modality over the first 2 years for patients on PD These data confirm the findings in the Report 2000, even though this previous report was on a smaller data set. Compared with last year there is a fall in the percentage of patients transplanted at one year from 11% to 7% and at 2 years from 20% down to 13% (table 4.13). This has been reflected in a greatly increased shift from PD to HD. The PD technique survival has effectively remained the same at 66% at one year and 41% at 2 years, but this was maintained at the expense of an increased shift to HD from 11% to 17% at one year and 20% to 24% at 2 years. The continual future rise in transplant waiting lists will have HD resource implications. As patients stay longer on PD, more of the inadequately dialysed patients will have to be transferred to HD. Few centres appear to be recoding withdrawal of treatment prior to death.

36
Survival of new patients starting renal replacement therapy The revised renal standards document concluded that “it is hard to set survival standards at present because these should be age sex and co-morbidity adjusted and this is not yet possible from Registry data. The last Standards document recommended at least 90% survival of patients 18-55 with standard primary renal disease. This may have been too low as the rate in participating centres in the Registry was 97%, though numbers were small. “ Standard Primary Renal Disease is a definition from EDTA which excludes patients with renal disease due to diabetes and other systemic diseases. It is more widespread practice to simply exclude diabetics, so we have also quoted these figures to allow comparison with reports from other registries. All the one and two year survival figures quoted in this chapter are from the first day of dialysis, not day 90 as quoted from the USA. Comparison with the Standard recommendation
Patients 18-55 - One Year Survival (95% CI) First Treatment Standard
Primary Renal Disease
All Diseases Except
Diabetes 1999 1999
92.8 91.7 All (90.5-95.2) (89.5-93.9)
89.2 87.4 Haemodialysis (95.9-93.5) (83.6-91.2)
97.5 98.0 Peritoneal dialysis (95.0-100) (96.0-100)
Table 4.14: One Year Patients Survival – patients age 18-55, 1999 cohort These survival figures are not as high as the revised standards document quotes from the Registry. Survival of all new patients As shown before, a high proportion (46%) of deaths within the first year occur within the first 90 days (tables 4.15, 4.16), a period excluded from the USA registry report.
Age Deaths/No of new patients
KM Survival Analysis (%)
KM 95% Confidence Interval
< 65 66/1337 95 94-96 ≥ 65 208/1232 83 81-85 All 274/2569 89 88-90
Table 4.15: 90-day survival of new patients, 1999 cohort
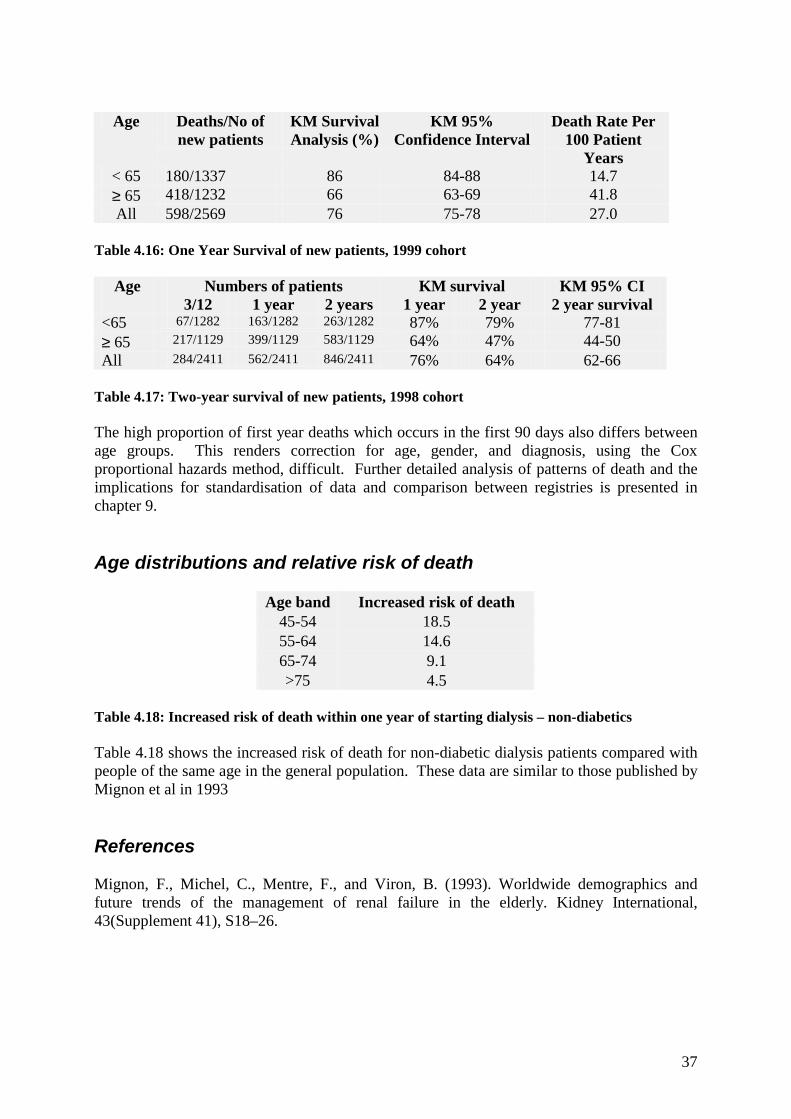
37
Age Deaths/No of
new patients KM Survival Analysis (%)
KM 95% Confidence Interval
Death Rate Per 100 Patient
Years < 65 180/1337 86 84-88 14.7 ≥ 65 418/1232 66 63-69 41.8 All 598/2569 76 75-78 27.0
Table 4.16: One Year Survival of new patients, 1999 cohort
Age Numbers of patients KM survival KM 95% CI 3/12 1 year 2 years 1 year 2 year 2 year survival
<65 67/1282 163/1282 263/1282 87% 79% 77-81 ≥ 65 217/1129 399/1129 583/1129 64% 47% 44-50 All 284/2411 562/2411 846/2411 76% 64% 62-66
Table 4.17: Two-year survival of new patients, 1998 cohort The high proportion of first year deaths which occurs in the first 90 days also differs between age groups. This renders correction for age, gender, and diagnosis, using the Cox proportional hazards method, difficult. Further detailed analysis of patterns of death and the implications for standardisation of data and comparison between registries is presented in chapter 9. Age distributions and relative risk of death
Age band Increased risk of death 45-54 18.5 55-64 14.6 65-74 9.1 >75 4.5
Table 4.18: Increased risk of death within one year of starting dialysis – non-diabetics Table 4.18 shows the increased risk of death for non-diabetic dialysis patients compared with people of the same age in the general population. These data are similar to those published by Mignon et al in 1993 References Mignon, F., Michel, C., Mentre, F., and Viron, B. (1993). Worldwide demographics and future trends of the management of renal failure in the elderly. Kidney International, 43(Supplement 41), S18–26.

38

39
Chapter 5: All Patients Receiving Renal Replacement Therapy In 2000 Summary In England & Wales there was a 4.8% increase in the total number of patients on RRT between the 1st January 2000 and 31st December 2000. This comprised a 5.1% increase in the number of patients on dialysis and 4.6% increase in those with a functioning transplant. This compares with 4.3% increase for the centres on the Registry during 1999. These data are consistent with the annual rises shown in the 1992, 1995 and 1998 Renal Reviews. On December 31st 2000, 1414656 patients receiving Renal Replacement Therapy from 28 renal units were enrolled in the Renal Registry in England and Wales. The number of patients in units with data for both 1998 and 1999 increased by 4.3% during 1999. For individual English and Welsh Health Authorities, the estimated dialysis prevalence varied from 329 to 693 pmp. In England and Wales, the average number of patients on RRT in each unit was 523. The median age for all patients on treatment on 31/12/00 was 54 years, unchanged from the 2 previous years. The median age of patients on peritoneal dialysis remains lower than that of those on haemodialysis. . 61% of all patients on treatment were male: this preponderance occurs at all ages. Reporting of ethnic origin has improved. The proportion of white patients in individual units varied from 39% to 100%, Asian from 0% to 56%, and Black from 0% to 15%. The most common primary renal disease recorded for prevalent patients under 65 years old was glomerulonephritis. In 28% of those over 65 it was not possible to give a diagnosis. Diabetes accounted for 16% of current incident patients, but 10% of all prevalent patients. Of those classified as Type I diabetics, 27% under 65 years old were on PD compared with 31% of Type 2 diabetics and 14% of the under 65 non-diabetics. In the over 65-year-old patients, use of PD was markedly) less common (20% type I, 28% type II, 20% non-diabetic). In England & Wales 66% of dialysis patients were on haemodialysis. The trend to an increased proportion of total patients on haemodialysis continues, but the proportion of dialysis patients on haemodialysis is now growing very slowly. Up to the age of 54 more patients are treated by transplantation than by dialysis. Haemodialysis is the predominant form of dialysis at all ages but especially in the older age groups. Connect PD has almost completely ceased. Cycling PD has not made much impact overall, but in a few units is the predominant form of PD The one-year survival of all patients established on renal replacement therapy for at least 90 days was 83.7%, and the two-year survival 68.4%.

40
Introduction On December 31st 2000, 14656 patients receiving Renal Replacement Therapy from 28 renal units in England and Wales were enrolled in the Renal Registry. This chapter describes their demographic details, diagnosis and treatment, and gives an analysis of the 1-year survival of patients who had been established for at least 3 months on RRT on 31/12/99. Anonymity has been removed. Prevalence rates are presented by Health Authority. Overall Prevalence Rate An overall summary of the prevalence of patients on renal replacement therapy in England and Wales is shown in table 5.1. The overall prevalence has a wide potential margin of error as it is calculated from the estimated catchment populations of the renal units. As discussed in chapter 4 there are significant errors in these estimates.
England & Wales No. of units 28
No. of patients 14656
Population (m)* 26.44
Patients (pmp)* 554
Mean Pats/unit 523
*=estimated figures Table 5.1: Summary of adult patients registered and total population covered 31/12/2000 Renal unit activity From table 5.2 it can be seen that there is a continuing increase in the number of prevalent patients on RRT in England and Wales, and in almost every participating unit. This increase is larger for the dialysis population than the transplant population.
Renal units No of patients
% increase in dialysis in 2000
% increase all patients
Bristol 913 6.1 4.3 Cardiff 973 11.3 5.0 Carlisle 161 11.9 1.9 Carshalton 679 2.6 2.0 Coventry 525 6.7 5.0 Derby 119 9.4 14.4 Exeter 450 11.8 5.9 Gloucester 243 9.3 11.0 Guys 1222 1.0 6.0 Heart lands 460 3.8 2.7 Hull 446 -2.2 2.5 Leeds GI 344 10.3 Leeds St James 817 9.9 Leeds total 1161 10.1 4.6 Leicester 983 3.8 4.8
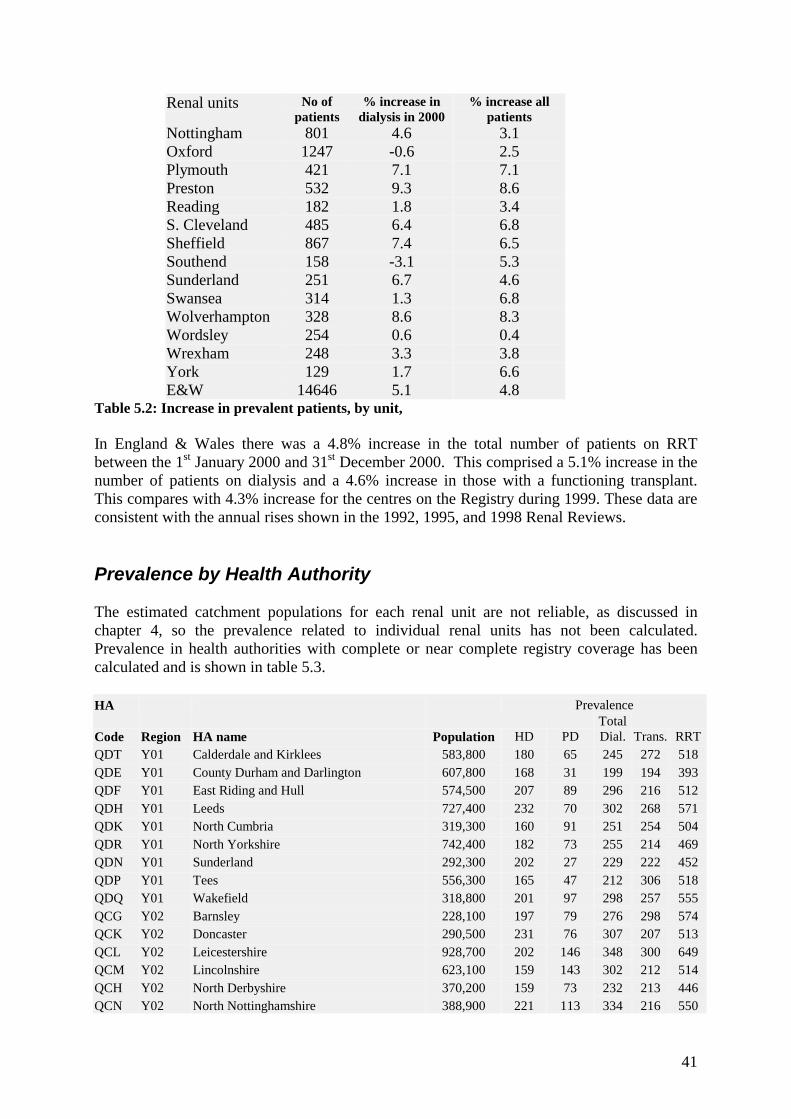
41
Renal units No of patients
% increase in dialysis in 2000
% increase all patients
Nottingham 801 4.6 3.1 Oxford 1247 -0.6 2.5 Plymouth 421 7.1 7.1 Preston 532 9.3 8.6 Reading 182 1.8 3.4 S. Cleveland 485 6.4 6.8 Sheffield 867 7.4 6.5 Southend 158 -3.1 5.3 Sunderland 251 6.7 4.6 Swansea 314 1.3 6.8 Wolverhampton 328 8.6 8.3 Wordsley 254 0.6 0.4 Wrexham 248 3.3 3.8 York 129 1.7 6.6 E&W 14646 5.1 4.8
Table 5.2: Increase in prevalent patients, by unit, In England & Wales there was a 4.8% increase in the total number of patients on RRT between the 1st January 2000 and 31st December 2000. This comprised a 5.1% increase in the number of patients on dialysis and a 4.6% increase in those with a functioning transplant. This compares with 4.3% increase for the centres on the Registry during 1999. These data are consistent with the annual rises shown in the 1992, 1995, and 1998 Renal Reviews. Prevalence by Health Authority The estimated catchment populations for each renal unit are not reliable, as discussed in chapter 4, so the prevalence related to individual renal units has not been calculated. Prevalence in health authorities with complete or near complete registry coverage has been calculated and is shown in table 5.3. HA Prevalence
Code Region HA name Population HD PD Total Dial. Trans. RRT
QDT Y01 Calderdale and Kirklees 583,800 180 65 245 272 518 QDE Y01 County Durham and Darlington 607,800 168 31 199 194 393 QDF Y01 East Riding and Hull 574,500 207 89 296 216 512 QDH Y01 Leeds 727,400 232 70 302 268 571 QDK Y01 North Cumbria 319,300 160 91 251 254 504 QDR Y01 North Yorkshire 742,400 182 73 255 214 469 QDN Y01 Sunderland 292,300 202 27 229 222 452 QDP Y01 Tees 556,300 165 47 212 306 518 QDQ Y01 Wakefield 318,800 201 97 298 257 555 QCG Y02 Barnsley 228,100 197 79 276 298 574 QCK Y02 Doncaster 290,500 231 76 307 207 513 QCL Y02 Leicestershire 928,700 202 146 348 300 649 QCM Y02 Lincolnshire 623,100 159 143 302 212 514 QCH Y02 North Derbyshire 370,200 159 73 232 213 446 QCN Y02 North Nottinghamshire 388,900 221 113 334 216 550

42
HA Prevalence
Code Region HA name Population HD PD Total Dial. Trans. RRT
QCP Y02 Nottingham 642,700 272 143 415 238 653 QCQ Y02 Rotherham 254,400 236 79 315 248 562 QCR Y02 Sheffield 531,100 265 51 316 196 512 QDL Y02 South Humber 308,600 279 81 360 230 590 QCJ Y02 Southern Derbyshire 567,500 199 132 331 277 608 QEA Y07 Coventry 304,300 289 131 420 256 677 QEC Y07 Dudley 311,500 167 164 331 196 526 QEG Y07 Solihull 205,600 190 68 258 156 413 QEK Y07 Walsall 261,200 226 96 322 57 379 QEL Y07 Warwickshire 506,700 189 132 321 288 610 QEM Y07 Wolverhampton 241,600 373 145 518 161 679 QCX Y08 East Lancashire 511,200 147 80 227 131 358 QC4 Y08 Morecambe Bay 310,300 122 81 203 126 329 QCY Y08 North-West Lancashire 466,300 139 107 246 165 412 QAD Y10 Croydon 338,200 157 98 255 186 441 QAH Y10 Lambeth, Southwark and Lewisham 745,200 191 121 312 204 515 QA7 Y11 Berkshire 556,600 138 192 330 363 693 QA8 Y11 Buckinghamshire 618,900 163 87 250 273 524 QAK Y11 East Surrey 419,900 93 74 167 236 402 QCC Y11 Northamptonshire 615,800 172 96 268 245 513 QCE Y11 Oxfordshire 616,700 133 84 217 274 491 QD8 Y12 Avon 999,300 223 72 295 297 592 QDY Y12 Gloucestershire 557,300 217 90 307 336 642 QDX Y12 North and East Devon 479,300 169 100 269 273 542 QD5 Y12 Somerset 489,300 200 80 280 221 501 QD6 Y12 South and West Devon 589,100 205 109 314 273 587 HA Code Region HA name Population
HD prev PD prev
Dial prev
Tx prev
RRT prev
QW1 W00 Gwent 557,200 174 102 276 343 619 QW2 W00 Bro Taf 739,600 204 95 299 333 632 QW5 W00 Morgannwg 499,700 174 110 284 274 558 Table 5.3: Prevalence of renal replacement therapy by Health authority. Change in prevalence 1998 –2000 by Health Authority Even where the Registry does not have complete coverage of a health authority, the proportion of population covered by the same renal unit is probably constant on a year-to-year basis.
HA code Region HA text
Prev 2000pmp
Prev 1999pmp
Prev 1998pmp
% change 99-00
% change 98-99
QDE Y01 County Durham and Darlington 393 344 336 14.4 2.5 QDF Y01 East Riding and Hull 512 463 447 10.5 3.5 QDK Y01 North Cumbria 504 501 485 0.6 3.2 QDN Y01 Sunderland 452 438 431 3.1 1.6

43
HA code Region HA text
Prev 2000pmp
Prev 1999pmp
Prev 1998pmp
% change 99-00
% change 98-99
QDP Y01 Tees 518 482 466 7.5 3.5 QCG Y02 Barnsley 574 509 460 12.9 10.5 QCK Y02 Doncaster 513 465 423 10.4 9.8 QCL Y02 Leicestershire 649 602 600 7.9 0.4 QCM Y02 Lincolnshire 512 456 425 12.3 7.2 QCH Y02 North Derbyshire 446 405 397 10.0 2.0 QCN Y02 North Nottinghamshire 550 496 465 10.9 6.6 QCP Y02 Nottingham 653 624 577 4.7 8.1 QCQ Y02 Rotherham 562 460 448 22.2 2.6 QCR Y02 Sheffield 512 442 409 15.7 8.3 QDL Y02 South Humber 590 544 531 8.3 2.4 QD9 Y07 Birmingham 259 237 226 9.2 4.8 QEA Y07 Coventry 677 664 670 2.0 -1.0 QEC Y07 Dudley 526 494 472 6.5 4.8 QEE Y07 Sandwell 182 169 145 8.2 16.7 QEG Y07 Solihull 413 355 365 16.4 -2.7 QEK Y07 Walsall 379 333 13.8 QEL Y07 Warwickshire 610 555 519 10.0 6.8 QEM Y07 Wolverhampton 679 592 14.7 QEN Y07 Worcestershire 162 145 145 11.5 0.0 QCX Y08 East Lancashire 360 276 270 30.5 2.2 QC4 Y08 Morecambe Bay 329 235 226 39.7 4.3 QCY Y08 North-West Lancashire 412 315 300 30.6 5.0 QC1 Y08 South Lancashire 182 134 35.7 QER Y09 Cambridgeshire 143 122 111 17.5 9.6 QED Y09 Herefordshire 149 137 137 8.7 0.0 QAY Y09 South Essex 237 213 11.3 QAD Y10 Croydon 361 355 322 1.7 10.1 QAJ Y10 Merton, Sutton and Wandsworth 241 220 214 9.4 3.0 QA8 Y11 Buckinghamshire 466 431 422 8.2 2.1 QAK Y11 East Surrey 360 348 324 3.4 7.4 QCC Y11 Northamptonshire 512 463 445 10.5 4.0 QCE Y11 Oxfordshire 491 454 431 8.2 5.3 QD8 Y12 Avon 592 550 534 7.6 3.0 QDY Y12 Gloucestershire 641 511 458 25.3 11.8 QDX Y12 North and East Devon 547 503 463 8.7 8.6 QD5 Y12 Somerset 501 472 431 6.1 9.5 QD6 Y12 South and West Devon 584 535 502 9.2 6.4 QD7 Y12 Wiltshire 347 337 342 2.9 -1.4 QW1 W00 Gwent 617 560 549 10.3 2.0 QW2 W00 Bro Taf 631 581 533 8.6 9.1 Table 5.4: Change of prevalence of RRT by Health authority, 1998-2000. In England & Wales there was a 4.8% increase in the total number of patients on RRT between the 1st January 2000 and 31st December 2000. This comprised a 5.1% increase in the number of patients on dialysis and a 4.6% increase in those with a functioning transplant. This compares with 4.3% increase for the centres on the Registry during 1999. The figures for individual health authorities are shown in table 5.4.

44
Age The median age for all patients on treatment on 31/12/200 was 54 years (table 5.5), which is unchanged from the previous year. The median age of patients on peritoneal dialysis remains lower than that of those on haemodialysis.
Transplants Peritoneal dialysis Haemodialysis All Median age E&W 48 58 63 54 Range between units 44 - 52 46 - 62 56 - 70 50 - 66
Table 5.5: Median age and treatment modality The age distribution of prevalent patients is shown in figure 5.1
Figure 5.1: Age profile of prevalent patients In England and Wales, 28% of patients were aged 65 or over and 10% were over the age of 75. This is unchanged from last year. The younger age distribution of transplant patients is shown in figure 5.2
Figure 5.2: Age distributions of transplanted and dialysis patients
Age distribution of RRT patients
0
0.5
1
1.5
2
2.5
3
3.5
0 10 20 30 40 50 60 70 80 90Age
% o
f pat
ient
s
TransplantDialysis
Age profile of prevalent patients 31/12/2000
0
5
10
15
20
25
18-24 25-34 35-44 45-54 55-64 65-74 75-84 85+age range
% o
f pat
ient
s

45
Figure 5.3 demonstrates the wide variation in median age (56 to 69) of dialysis patients in individual units. Whilst differences in local populations may account for some of this variation, referral and acceptance policies, survival rates and available resources are also likely to have a major impact.
Figure 5.3: Median age of dialysis patients alive 31.12.00
Median age of dialysis patients alive 31/12/00
50 55 60 65 70
Glouc York Sund Bristl Extr
Wrex Plym
Heart Carls
Oxfrd Sw nse SCleve Redng
Sthend Leic
Guys Wolve
Hull Prstn
LGI Carsh Notts
Derby Words Covnt StJms Sheff E&W
Cent
re
Age

46
Gender Overall 61% of all patients on treatment were male: the male preponderance occurs at all ages. The ration was similar in all age groups (figure 5.4). While the numbers are small the high proportion of males in the older age groups occurs in spite of the greater proportion of women in the general population at that age.
Figure 5.4: Age distribution by gender. Ethnicity Reporting of ethnic origin has improved. It is not currently a health service policy to collect ethnicity data in Scotland or Wales, so ethnicity data were not available from the Scottish or Welsh units. Of the English units, 4 provided little or no data at all while information was complete on at least 84% of patients in 21 units (table 5.6). The proportion of white patients in individual units varied from 39% to 100%, Asian from 0% to 56%, and Black from 0% to 15%.
% with data
complete
% White
% Black
% Asian
% Chinese
% Other
Exeter 100 100 0 0. 0 0 Gloucester 100 100 0 0 0 0 Sheffield 100 94 1 3 1 0 Preston 100 88 1 10 0 1 Wordsley 100 89 2 9 0 0 Heart lands 100 76 5 18 1 0 Wolverhampton 99 78 6 14 1 0
Age distribution by gender
0
200
400
600
800
1000
1200
1400
1600
1800
2000
18-24 25-34 35-44 45-54 55-64 65-74 75-84 >=85
Age range
Num
bers
of p
atie
nts
MaleFemale

47
% with data
complete
% White
% Black
% Asian
% Chinese
% Other
Southend 99 95 3 2 0 0 Bristol 98 93 3 2 1 1 Plymouth 98 97 1 0 0 0 Reading 98 73 7 17 2 2 Hull 97 99 0 0 0 0 St James 96 88 3 9 0 0 Sunderland 96 99 1 0 0 0 Coventry 94 81 2 16 0 0 Leicester 92 39 2 56 1 2 Nottingham 92 88 5 7 0 1 Guys 92 80 15 4 1 0 Carshalton 86 71 5 5 1 18 S. Cleveland 85 96 0 4 0 1 Derby 84 86 2 9 1 1 Cardiff 27 York 13 Carlisle 13 Swansea 9 Oxford 3 Leeds GI 3 Wrexham 0 E&W 75 84.2 3.7 10.1 0.5 1.5
Table 5.6: Ethnicity The percentages of patients with a functioning transplant belonging to each ethnic minority group are listed in table 5.7. There is a slightly lower percentage of the Asian and Black population with a transplant. This may be considered surprising in view of the relatively low age distribution of the ethnic minority patients, but difficulties in tissue matching and the higher incidence of diabetics with increased co-morbidity in this population may reduce the opportunities for transplantation.
% White % Black % Asian % Chinese % Other 86.8 2.2 8.8 0.5 1.6
Table 5.7: Percentage of transplanted patients in each ethnic group. Primary Renal Disease Details of primary renal disease, based on the original EDTA coding classification are shown in table 5.8. In as many as 27.9% of those over 65 it was not possible to give a diagnosis. Missing data were much more common in patients over 65 with 10% missing compared with 3% in patients aged under 65. Diabetes accounted for just over 10% of patients in both age groups, a much lower proportion than the 16% in current incident patients.

48
Diagnosis % All
patients Inter unit range
% Age < 65
%Age > 65
M : F Ratio
Aetiology uncertain * 22. 3 - 31 21 28 1.7 Glomerulonephritis** 16 3 - 25 18 9 2.3 Pyelonephritis 14 1 - 21 15 11 1.1 Diabetes 11 6 - 20 10 11 1.5 Renal Vascular disease 3 3 - 14 2 10 2.4 Hypertension 6 1 - 15 6 6 2.4 Polycystic kidney 9 1 - 10 10 4 1.0 Not sent 5 0 - 79 4 11 1.8 Other 13 3 - 21 14 10 1.3 Total Number of Patients 14033 11140 2893 1.55
* - includes patients listed as “glomerulonephritis not biopsy proven”. ** - biopsy proven.
Table 5.8: Primary renal disease in all patients, and according to age and gender Diabetes Diabetes was recorded as the primary diagnosis in 10% of all prevalent patients. The median age of type I diabetics was 51, and type II diabetics 65. Further details are given in table 5.9.
Type I Type II Non-Diabetics M : F ratio 1.40 1.62 1.54 Median Age on 31/12/00 Median Age started ESRF Median years on treatment
51 47 2.6
65 63 2.2
54 45
% on HD 39 61 % on PD 27 26 % transplanted 34 13
Table 5.9: Type of diabetes, median age, gender ratio, modality From table 5.10 it is clear that at any age diabetics are less likely to have received a transplant than other patients. Although more younger dialysing diabetics are on haemodialysis than peritoneal dialysis, the ratio of HD to PD is lower than in other patients. For older diabetics, the proportion on haemodialysis is very high.
Modality Type I < 65
Type II < 65
Non-diabetics < 65
Type I > 65
Type II > 65
Non-diabetics > 65
% HD 31 50 25 70 75 55 % PD 27 31 14 20 28 20 % transplant 42 19 61 7 5 25
Table 5.10: Treatment modality by age and diabetic status.

49
Modalities of Treatment
Figure 5.5: Treatment modalities 31/12/200. The number of patients on renal replacement therapy continues to rise, but the percentage of patients with a functioning transplant has continued to fall for the last 4 years. There are even fewer patients left on connect PD (0.1% 2000 and 0.7% 1999). Cycling PD has increased from 1.6% to 3.1% of all renal replacement therapy (figure 5.5).
18-24 25-34 34-44 45-54 55-64 65-74 75-84 85+ Haemodialysis 2 7 11 14 19 26 19 *
Peritoneal Dialysis 3 8 13 19 23 22 11 * Transplant 4 14 23 24 22 11 2 *
*- number very small Table 5.11: Percentage on each modality according to age In England & Wales 66% of dialysis patients were on haemodialysis. The variations in patterns of treatment with age are shown in figure 5.6 and table 5.11. Up to the age of 54 more patients are treated by transplantation than by dialysis. Haemodialysis is the predominant form of dialysis at all ages but more so in the older age groups.
Figure 5.6: In each age group, percentage of patients on each modality.
Treatment Modalities 2000
Cycling PD >= 6 nights/w k2.5%
CAPD Connect0.1%
CAPD Disconnect14.2%
Transplant46.9%
Cycling PD < 6 nights/w k0.6%
Hosp - HD26.1%
Satellite HD 7.8%
Home - HD1.7%
Home - HD
Hosp - HD
Satellite - HD
CAPD Connect
CAPD Disconnect
Cycling PD >= 6nights/wkCycling PD < 6nights/wkTransplant
Percentage Modality by Age Group
0
10
20
30
40
50
60
70
80
90
18-24 25-34 34-44 45-54 55-64 65-74 75-84 85+
Age Group
% o
f pat
ient
s
HaemodialysisPeritoneal DialysisTransplant

50
Haemodialysis
Figure 5.7: Percentage dialysis patients on haemodialysis by centre and age. The proportion of dialysis patients treated by haemodialysis as opposed to peritoneal dialysis varied widely from unit to unit and cannot be explained by age alone (Figure 5.7) The percentage of patients on haemodialysis treated in satellite units in England & Wales was 22%: home haemodialysis was only 5% of haemodialysis (figure 5.8).
% Dialysis Patients on HD by centre and by age
0 10 20 30 40 50 60 70 80 90 100
SundHeart
SthendStJmsYork
SCleveBristlSheff
HullWolveGloucWrexPlym
DerbyCrdffOxfrdCarlsNottsCovnt
ExtrLGI
Sw nsePrstnLeic
CarshGuys
WordsRedng
E&W
Cen
tre
% Dialysis on HD
>65<65
% Dialysis Patients on HD by centre
0 10 20 30 40 50 60 70 80 90 100
SundHeart
SthendStJmsYork
SCleveBristlSheff
HullWolveGloucWrexPlym
DerbyCrdffOxfrdCarlsNottsCovnt
ExtrLGI
Sw nsePrstnLeic
CarshGuys
WordsRedng
E&W
Cen
tre
% Dialysis on HD

51
Figure 5.8: Proportion of HD patients treated by home and satellite dialysis, by centre. Peritoneal Dialysis
Figure 5.9: Use of connect and automated PD as percentage of total PD.
Haemodialysis - non hospital
0
10
20
30
40
50
60
70
80Br
istl
Crdf
f St
Jms
Extr
Wol
ve
Prst
n Sw
nse
Leic
Sh
eff
Hull
Cars
h Y
ork
Notts
SC
leve
Ca
rls
Guy
s He
art
Oxf
rd
Covn
t De
rby
Wor
ds
Plym
St
hend
Su
nd
Glo
uc
Redn
g W
rex
LGI
E&W
Centre
% o
f all H
D pa
tient
s
% Home HD% Satellite HD
���������������������������������������������������������������������
����������������
��������������
���������������������������������������������������������������������������������������������������������������������������������������������������������������������������������������������������
���������������������
�������������������������������������������������������������������������������������������������������������������������������������������������������������������
��������������������������������������������������������������������������������������������������������������������������������������������������������������������������������������������������
��������������
Use of connect or automatedperitoneal dialysis
0 10 20 30 40 50 60 70 80 90 100
Bristl Carls
Carsh Covnt Crdff
Derby Extr
Glouc Guys Heart
Hull Leic LGI
Notts Oxfrd Plym Prstn
Redng SCleve
Sheff Sthend StJms Sund
Sw nse Wolve Words Wrex York E&W
Cen
tre
% of all PD patients
connect������������ cycling PD >=6 nights
cycling PD < 6 nights

52
The percentages of patients on each of the main types of peritoneal dialysis in individual units are shown in Figure 5.9. Only one centre used significant amounts of Connect PD, 2 other centres used it in less than 10% of PD patients. It was not used at all in the remaining centres. Cycling PD/APD is used in 18% of PD patients. There was a wide variation between units from 98% to 0% in the percentage of patients treated with one or other form of cycling PD. Modality and primary diagnosis There was wide variation in the probability of transplantation according to primary diagnosis (table 5.12), but there were no differences in the percentage of dialysis patients on either PD or HD by primary renal diagnosis. Diabetic patients, with a poorer overall survival make up a lower percentage of transplanted patients and as shown in last years report. Diabetics aged under 65 were less likely to be transplanted than others of a similar age.
Diagnosis % on HD % on PD % Transplanted Aetiology uncertain* 23 21 22 Glomerulonephritis 12 15 19 Pyelonephritis 12 12 18 Diabetes 14 16 6 Reno-vascular disease 5 4 1 Hypertension 6 5 5 Polycystic Kidney 7 6 12 Not sent 8 9 2 Other 13 12 15
* = Includes patients listed as “glomerulonephritis not biopsy proven Table 5.12: Proportion of patients on each modality by diagnostic category. Modality and gender
%Home
HD % Hosp
HD % Satellite
HD % connect
PD % disconnect
PD
% cycling PD >=6 nights
% cycling PD < 6 nights
Male 3.8 45.9 17.4 0.2 28.0 3.7 1.0 Female 2.2 45.8 16.9 0.3 28.5 4.8 1.4
Table 5.13: Treatment modality and gender Home haemodialysis was more common in males than females (table 5.13); this is consistent with last year’s data. Cycling PD was slightly more common in females.
Age < 65 HD
Age < 65 PD
Age < 65 Transp
Age > 65 HD
Age > 65 PD
Age > 65 Transp
Male 26.6 15.0 58.4 56.8 23.1 20.1 Female 25.7 18.9 55.4 58.6 18.1 23.2
Table 5.14: Treatment modality, age, and gender

53
In patients aged 65 and over, PD was more common in males, in comparison to being less common in those aged less than 65 years (table 5.14). Change in treatment modalities 1997 –2000 The pool of renal units participating in the Registry has changed over the last 4 years so changes in treatment modality are difficult to interpret. There seems to be a trend towards more haemodialysis, relatively stable numbers on peritoneal dialysis, with the proportion with a transplant falling (table 5.15).
At year end
Home - HD
Hosp – HD
Satellite - HD
Total HD
CAPD Conn.
CAPD Disconn
ect
Cycling PD >= 6 nights/wk
Cycling PD < 6
nights/wk
Total PD Transplant
1997 3.7 19.67 9.03 32.4 2.68 12.91 1.02 0.04 16.65 50.95 1998 2.4 23.6 5.6 31.6 0.9 16.6 0.9 0.1 18.5 49.9 1999 2.0 21.9 10.9 34.8 0.7 15.0 1.6 0.5 17.8 47.3 2000 1.7 26.1 7.8 35.6 0.1 14.2 2.5 0.6 17.4 46.9
Table 5.15: Proportion of patients with different modalities of RRT 1997-2000 Long term trends Both England & Wales and Scotland have shown an increasing percentage of patients being treated with haemodialysis (figure 5.10), with the steepest rise being since 1995. The 2000 data show this trend may be levelling in England & Wales. This may be due to capacity problems, with the Registry noting an increased use of twice weekly dialysis (chapter 6). The England data for 1992 and 1995 were from the national review.
Figure 5.10: Percentage of dialysis patients on haemodialysis by year
Percentage of dialysis patients on HD
40
45
50
55
60
65
70
75
80
1991 1992 1993 1994 1995 1996 1997 1998 1999 2000
Year
% o
f pat
ient
s
Sct HD
E&W HD

54
Survival on renal replacement therapy The one-year survival of all patients established on renal replacement therapy for at least 90 days on 1/1/200 was analysed, and the two-year survival of similar patients alive on 1/1/1999. The median age of the prevalent patients in both 1999 and 2000 was 61 years.
Dialysis patients Transplant patients 1999 2000 1999 2000
K-M 1 yr survival (95% CI)
84.8 83.8 – 85.8
83.7 82.7 – 84.7
97.5% 97.0 – 97.9
97.3% 96.8- 97.7
K-M 2 yr survival (95% CI)
68.4 66.9 – 69.9
Table 5.16: Survival of all dialysis patients There was a slightly different group of centres on the Registry in 2000 from that in 1999, thus the apparent slightly lower survival in 2000 is difficult to interpret. As expected the transplanted patients have a lower mortality than dialysis patients, but these patients are a selected younger fit population with a lower median age. Comparing transplant patients with non-diabetic dialysis patients aged less than 55 (tables 5.16, 5.17) there is still better survival of 97.3% v 92.1% survival during 2000. The relatively poor prognosis of diabetic patients is demonstrated.
Diabetic Non-diabetic All KM 1 yr survival < 65 (95% CI) 2000
78.7% 75.1 – 82.4
92.1% 91.1 – 93.2
89.9 88.8 – 90.9
-M 1 yr survival > 65 (95% CI) 2000
71.7% 66.4 – 77.1
76.0% 74.1 – 77.9
75.4 73.7 – 77.2
Table 5.17: Survival of dialysis patients alive on 1/1/2000, by age <65 and >65 years. The marked deterioration in prognosis with advancing age is shown in table 5.18. The trend is similar in diabetics (table5.19).
KM
survival Stand Error
95% CI 18-34 96.4% 0.84% 94.7% - 98.0% 35-44 92.4% 1.09% 90.3% - 94.6% 45-54 89.0% 1.08% 86.8% - 91.1% 55-64 86.0% 1.03% 84.0% - 88.0% 65-74 78.2% 1.12% 76.0% - 80.4% 75-84 71.5% 1.52% 68.5% - 74.5% 85+ 68.0% 5.38% 57.5% - 78.6%
Table 5.18: Survival of all prevalent dialysis patients by age band

55
Non diabetic Diabetic
KM
survival Stand Error
95% CI
KM survival
Stand Error
95% CI
<55 93.9% 0.60% 92.7% - 95.1% 81.5% 2.32% 77.0% - 86.1% 55-64 88.7% 1.07% 86.6% - 90.8% 78.4% 2.85% 72.8% - 84.0% 65-74 79.0% 1.25% 76.5% - 81.4% 74.2% 3.00% 68.3% - 80.1% >=75 71.9% 1.57% 68.8% - 75.0% 62.9% 6.28% 50.6% - 75.2%
Table 5.19: Survival during 2000 of dialysis patients by age and diabetes Prevalent survival by centre
Figure 5.11: Survival of prevalent patients alive 1/1/2000 There was no significant difference in the year 2000 prevalent survival by centre.
Figure 5.12: 2year survival of prevalent patients alive 1/1/1999 Figure 5.12 it should be noted is unadjusted data
Adjusted 1yr survival of prevalent dialysis patients alive 1/1/200adjusted for age 60
50556065707580859095
100
A2 A4 C6 A5 A1 C2 B9 C3 B3 B7 C1 C7 B4 A9 B2 D1 S7 B5 C8 A3 B1 B6 C5 E&W
Centre
% s
urvi
val
lines show 95% confidence intervals
2 year survival of prevalent patients alive 1/1/1999
40
50
60
70
80
90
100
B9 B6 C3 B5 B7 A3 C1 A4 B2 C6 B3 B4 C8 A5 A1 C7 B1 D1 A9 A2 C5 C2
Centre
% s
urvi
val

56

57
Chapter 6: Adequacy of haemodialysis (Urea reduction ratio) Summary In England & Wales a uniform method of measuring the post dialysis urea sample (as suggested in the 1997 Renal Association standards document) has still not been implemented. This standardisation is essential to permit meaningful comparative audit among participating renal units. In England & Wales, 74 % of patients achieved a URR > 65% compared with 65% in 1999 and 57% in 1998. Due to ‘population distribution curves’, centres will need to reach a median URR of 75% for almost all patients to have a URR >65%. No centres achieved the RA standard A cross sectional analysis of patients in 2000 showed there was a continuing rise in URRs over the 2 years from starting dialysis. This rose from 57% achieving a URR > 65% in the first 6 months (48% in 1999) to 83% achieving this at 2 years (73% in 1999). Within England and Wales, there has been a year on year increase in dialysis adequacy over the four years of the Registry. The Renal Registry data demonstrate that ‘adequate’ URR results can be achieved. It is hoped that the wide variation in URR achieved in these early cycles of audit of hospital haemodialysis will continue to decrease. Attention is drawn to the limitation in the use of URR to measure dialysis adequacy. It is used at present as it permits verifiable comparison between centres from the data collected by the Registry. Haemodialysis frequency The Standards document states “The frequency of dialysis should be three times per week in the majority of patients. Reduction of dialysis frequency to twice per week because of insufficient dialysis facilities is unacceptable”. Twice weekly haemodialysis is not recommended except where there is good preservation of residual renal function. One would expect this to be well under 10% of total patients The Registry has found it difficult to obtain complete, or near complete, returns of frequency of dialysis from many renal units and is therefore not sufficiently confident of its figures to publish them. However the clinical directors forum of the Renal Association has recently conducted a survey of this issue (Scoble). In those renal units with good Registry returns there was good concordance of the data between the survey and the Registry. From this survey 53 units have returned data so far, Whilst overall only 6.2% of patients in the UK dialyse less than three times a week, there is a range between renal units of 0% to 39%. At least 10% of patients dialyse twice weekly in 23% of units, and 6 units had more than 20% dialysing twice weekly. Twice weekly dialysis

58
is particularly common in Northern Ireland but rare in Scotland. Both the survey and the Registry have ascertained that in Northern Ireland the main reason given was financial constraints. Limitation of resources was a major cause in England, either through physical lack of space (3 units), financial constraints (3), patient preference (3) and nursing staff constraints (1). Solute clearance Standards The Renal Standards document considers both Kt/V and Urea Reduction Ratio (URR) as indicators of adequacy of haemodialysis, and recommends that all patients stable on three times a week haemodialysis should have:
A urea reduction ratio > 65% or Kt/V > 1.2 (dialysis and residual renal function)
Interpretation of results
Formulae for calculation of dialysis clearance Several different methods are in use for calculating Kt/V, and they give results which vary significantly. Some calculations include the contribution from residual renal function, and need collection of post dialysis urea blood urea samples from the previous dialysis. Other formulae ignore residual renal function, and require, as a minimum, knowledge of pre and post dialysis weights, and duration of treatment. For meaningful comparisons, the Registry would need to calculate Kt/V by a single method from the raw data. This raw data is not available from many units. The simpler calculation of URR, the percentage fall in blood urea during a dialysis session, only requires knowledge of pre and post dialysis blood urea, and thus remains the method used by the Registry. This ignores any contribution to clearance by residual renal function. URR has been shown to correlate with patient survival (Owen, Held).
Post dialysis urea samples At present, post dialysis sampling methodology is not uniform across units. This has a major effect on post dialysis urea measurements. This is discussed more fully in the 1999 Registry report. In 2000, the renal standards document recommended the “slow flow” method of collecting post dialysis urea samples, but three methods of collecting samples are described in the new renal standards document. There has been no major move by centres to a single “post urea” measurement technique. In 1999 some of the centres in England moved to the Mactier “stop-dialysate-flow” method (see appendix E), which is the sole recommended method in Scotland. It has been observed that there are often major discrepancies between recommended methods and actual practice. Use of the Mactier method has been shown to give higher post dialysis urea readings and thus a lower URR than the two other main methods in use. Thus centres using this technique will appear to have lower dialysis clearance and lower achievement of the standard compared with centres the other methods.

59
Centres achievement of the Standard
Figure 6.1: Achievement of the RA Standard for haemodialysis clearance The overall, the achievement of the Renal Association standard improved again in 2000. In England & Wales, 74 % of patients achieved a URR > 65% compared with 65% in 1999 and 57% in 1998.
Figure 6.2: Percentage patients with URR > 65% in the last quarter of 2000
Figure 6.3 Urea reduction ration distribution
Percentage URR > 65%
20
30
40
50
60
70
80
90
100
A24
D154
B71
A87
B50
B67
A542
A13
C39
A63
B28
A37
C19
C85
B426
C713
C914
C649
B17
B918
C50
A44
A910
B843
A76
B38
E&W18
Centre
% o
f pa
tient
s >
6
Low er 95% CI
% w ith URR >= 65
Upper 95% CI
Urea reduction ratio
50
55
60
65
70
75
80
D 154
A 24
B 71
A 542
B 67
B 50
A 87
C 39
A 63
A 37
A 13
C 19
C 914
C 85
C 649
B 28
C 713
B 426
B 918
C 50
B 17
A 44
A 910
B 843
A 76
B 38
E&W18
Centre
Ure
a re
duct
ion
ra
Upper quartileMedian URRLower quartile
������� ������ ����� �������������
����������������
��������������
�������������� ������
����������������
���������� ����
��������������
��������������
������������
������������
����������
����������
��������
����������������
���������������������
������������
������������������
����������
����������������
�����������������������
��������������������� ������
����������
����������
�������������������
��������������
������ ���������������
������������
������� ������� ������������������
����������
����������
��������
����������������
����������������������������
������������������
������������������������
��������������������
������������
������������
��������������������� ������
������
���������������
����������
��������
����������������
��������������
��������������������� ������
������������
���������������
���������������
��������
���������������������
���������������������
������������������
������������������
���������������
���������������
����������������
��������������������������������
����������������������������
������������������������
������������������
��������������������
����������������
��������������������
���������������������
Urea Reduction ratio
0%
10%
20%
30%
40%
50%
60%
70%
80%
90%
100%
D 1
54
A 2
4
A 5
42
A 8
7
B 7
1
B 5
0
B 6
7
C 6
49
C 3
9
A 1
3
B 4
26
B 2
8
A 3
7
C 1
9
A 6
3
C 7
13
C 8
5
C 9
14
B 9
18
B 1
7
B 8
43
C 5
0
A 4
4
A 9
10
A 7
6
B 3
8
E&W
18
Centre
Per
cent
age
of p
atie
nt
> = 75%
65 - 74%������� 60 - 64%������� 55 - 59%�������
45 - 54%
< 45%

60
Figure 6.4: Change in meeting URR standard in 2000
Change in meeting URR standard in 2000
0
10
20
30
40
50
60
70
80
90
100
A1 A2 A3 A4 A5 A6 A7 A8 A9 B1 B2 B3 B4 B5 B6 B7 B9 C1 C3 C5 C7 C8 C9 E&W Centre
Perc
enta
ge o
f UR
R >
65%
Low er 95% CI
% w ith URR >= 65
Upper 95% CI
1st point = 1st quarter 20002nd point = 4th quarter 2000

61
Changes achievement of URR standard during 1998-2000
Percentage patients with URR>65% Centre Quarter 1
1998 Quarter 4 1998
Quarter 4 1999
Quarter 4 2000
A1 59 67 80 80 A2 96 84 89 92 A4 56 55 51 49 A5 46 57 51 83 A6 77 B1 67 40 52 66 B3 18 29 34 28 B4 53 60 62 75 B5 51 51 70 84 B6 70 92 87 83 B7 71 64 70 84 B9 61 55 50 65 C1 50 64 82 76 C3 68 64 70 80 C5 73 57 65 60 C7 49 61 62 73 C8 62 45 70 74
E&W 57 57 65 74 Table 6.1: Change in achievement of URR standard during 1998-2000
Figure 6.4: Percentage URR . 65% and change in median URR 1997- 2000 In the last 4 years, England & Wales have shown a substantial rise in the percentage of patients achieving a URR > 65% but still lag behind the US, where 82% of patients achieve a URR >65% with a median URR of 71.4%. The median URR in E&W is 69%. Because of the steepness of the distribution curve around this point, there need only be a small change in median URR to achieve a large change in achievement of the standard, as is illustrated in figure 6.4. It would only need a small improvement in median URR to obtain the same results as in the US. The US data sits on the UK predictive line of identity between median URR and % achieving URR>65%. This indicates that distributions of data and working practice in the two countries may have close similarities.
Percentage URR > 65% and change in median URR 1997 - 2000 E&W
30
40
50
60
70
80
90
100
1997 1998 1999 2000 1997 1998 1999 2000
Year
% of patients URR > 65%and 95% CI
Median URR and quartiles

62
Figure 6.5: URR achievement and median URR The improvement in attainment of the URR standard in England and Wales from 1997 to 2000 looks impressive (fig 6.4), but some caution must be used in interpretation, as there are increasing numbers of renal units each year, and thus different renal units included. That the improvement is real is suggested by the significant improvement in performance of participating units during 2000. Achievement of standards in new renal replacement therapy patients starting haemodialysis As reported last year, URRs were lower in new patients on haemodialysis than in patients from the same unit established on treatment for more than 3 months (fig 6.6). This may in part be due to early patients retaining a degree of residual renal function and needing less dialysis. However the 2000 data shows a considerable improvement URR in this early period indicating that there are additional factors involved.
Figure 6.6: Median URR within first three months of HD
URR > 65% v Median URR
30
40
50
60
70
80
90
100
60 62 64 66 68 70 72 74
Median URR
% p
atie
nts
> 65
Urea reduction ratio of patients starting dialysis
40
45
50
55
60
65
70
75
80
A817
A645
A221
B734
B52
C13
B134
C514
C950
C85
A70
C323
B644
B948
A429
B324
A930
E&W44
Centre
Ure
a re
duct
ion
ratio
Upper quartileMedian URRLower quartile

63
As shown in last years report, URRs were lower in patients starting dialysis than those of all HD patients at the same unit (which excludes patients within the first 3 months). This in part was probably partly due to a degree of residual renal function, although the 2000 data shows a considerable improvement in this target (Fig 6.7) indicating that there are additional factors involved In the UK, URRs slowly increased with time on RRT with the median URR changing from 66% (64% in 1999) in the first 6 months to 71% (69% in 1999) at 2 years. Although the change in median URR is small, due to the steep slope of the distribution curve, there is a substantial increase in the percentage of patients with a URR > 65% throughout these time periods (fig 6.7). This does not necessarily indicate that the URR of individuals increases with time. It may be that those patients who died in the earlier periods had a lower URR than the survivors. The Registry is collecting sequential individual patient data and will analyse this at a later date. The year on year improvement in dialysis clearance is also reflected in these figures.
This figure shows “cross-sectional” results for all patients at the year-end on dialysis for the specified time Figure 6.7 Change in URR by length of time on RRT in 1999 –2000
0102030405060708090
% o
f pat
ient
s
<=6 months 6m - 1yr 1-2 yrs >2 years
Time
% URR > 65% in E & W from start of RRT
19992000

64

65
Chapter 7: Haemoglobin and related variables This chapter describes the position at the end of 2000 for all units from England and Wales on the Registry. The Renal Association Standards document 1997 recommends that “a target haemoglobin concentration of 10g/dl should be achieved in 85% of patients after 3 months on dialysis.” Summary There is continuing evidence of improvement in the management of renal anaemia in centres submitting data to the Registry. In haemodialysis, 79% of patients had a haemoglobin > 10g/dl compared to 72% in 1999 and 69% in 1998. In peritoneal dialysis 86% of patients had a haemoglobin >10g/dl in 2000 compared to 80% in 1999 and 78% in 1998. An increasing proportion of centres achieved the Renal Association standard for both haemodialysis and peritoneal dialysis patients. There is evidence of significantly different approaches to iron replacement in different centres. There is evidence of different approaches to management of renal anaemia pre-dialysis, which will in part reflect availability of erythropoiesis stimulating treatments. In different centres, between 19% and 61% of patients started dialysis with a haemoglobin greater than 10g/dl. Inclusion criteria Patients were included in this analysis if they had been stable at the same centre, on the same modality of dialysis for 3 months. The last available haemoglobin from each patient in the last quarter of 2000 was used in the analysis. Centres with less than 50% completeness of data were not shown on the figures. In the figures, data completeness is indicated by the percentage missing figure below the code letter for the renal unit. No laboratory harmonisation is used for haemoglobin. Haemoglobin achievement by dialysis units The data for haemoglobin concentrations have been presented in a variety of ways. This has enabled comparison with the Renal Association Standard for haemoglobin achievement but also provides centres with their median haemoglobin. The spread of haemoglobin concentrations may indicate differences in the way that units manage renal anaemia and a number of different measures of spread have been included. In both modalities a higher proportion of patients included in the 2000 data achieved the RA Standard haemoglobin of 10g/dl than in previous years, but it should be noted that in each year new centres have been added to the Registry. In haemodialysis 79% of patients had a haemoglobin >10g/dl compared to 72% in 1999 and 69% in 1998. In peritoneal dialysis 86% of patients had a haemoglobin >10g/dl in 2000 compared to 80% in 1999 and 78% in 1998.

66
5 of the 27 centres with sufficient data achieved the Standard of 85% of haemodialysis patients with haemoglobin >10g/dl (2 of 22 centres in 1999). 14 of the 27 centres had 95% confidence intervals that included 85% (5 of 22 in 1999). 19 of 27 centres achieved the Standard for peritoneal dialysis (9 of 22 in 1999) and all but 2 centres data had 95% confidence intervals that included the 85% standard. These data provide increasing evidence that the RA Standard for haemoglobin is achievable. For the first time the percentage of patients with haemoglobin greater than 11.0g/dl is shown in this years report. 85% of patients with a haemoglobin greater than 11.0g/dl has been recommended as the standard in European centres. No centre achieved this standard for haemodialysis patients (range 40% to 75% ≥ 11g/dl) but 3 centres achieved the European standard for peritoneal dialysis (range 46% to 93% ≥ 11g/dl). There were some differences between centres, e.g. in haemodialysis centres B5 and B6 both achieved the standard but in centre B5 there was a considerably higher proportion of patients with haemoglobin greater than 12g/dl and a median haemoglobin of 11.9g/dl compared to 11.3g/dl in B6. Whether this is a statistical quirk influenced by centre size or the result of a successful targeting strategy in B6 is uncertain. In peritoneal dialysis B6 had a broad spread.
Centre % data return
Median Hb g/dl
90% range
Quartile range
% Hb ≥≥≥≥ 10 g/dl
Mean Hb g/dl
Standard deviation
A1 97 11.4 8.5 - 13.4 10.2 - 12.3 79 11.2 1.5 A2 99 10.9 7.6 - 13.5 9.6 - 12.0 68 10.7 1.8 A3 99 11.5 8.4 - 14.0 10.4 - 12.6 83 11.4 1.7 A4 98 10.7 7.7 - 13.4 9.9 - 11.7 72 10.8 1.5 A5 94 11.8 8.3 - 13.9 10.5 - 12.7 82 11.5 1.7 A6 98 11.8 9.4 - 14.2 10.7 - 12.8 85 11.8 1.6 A7 98 11.2 8.6 - 13.9 10.4 - 11.9 84 11.2 1.5 A8 93 11.8 8.5 - 14.0 10.9 - 12.7 90 11.7 1.5 A9 99 11.3 8.3 - 13.6 10.5 - 12.4 82 11.3 1.6 B1 95 10.6 8.1 - 12.8 9.9 - 11.4 74 10.6 1.4 B2 97 11.3 8.7 - 14.1 10.4 - 12.6 82 11.3 1.7 B3 97 11.1 8.8 - 13.9 10.3 - 12.0 80 11.1 1.4 B4 89 10.8 7.9 - 13.7 9.9 - 12.0 73 10.8 1.8 B5 100 11.9 9.3 - 14.7 11.0 - 12.8 91 11.9 1.6 B6 93 11.4 9.3 - 12.9 10.6 - 12.0 90 11.3 1.1 B7 87 11.0 8.7 - 13.2 10.0 - 11.8 77 10.9 1.4 B8 76 10.6 8.1 - 14.3 9.3 - 11.9 67 10.8 1.9 B9 95 11.1 8.1 - 14.0 10.0 - 12.1 76 11.2 1.8 C1 92 11.5 7.8 - 13.8 10.2 - 12.2 78 11.2 1.7 C3 78 11.0 8.1 - 13.2 9.9 - 12.0 74 10.9 1.6 C4 69 11.4 8.5 - 14.0 10.4 - 12.5 84 11.4 1.6 C5 91 11.0 8.0 - 15.0 10.0 - 12.0 88 11.4 1.8 C6 100 11.5 8.7 - 13.5 10.2 - 12.4 80 11.3 1.5 C7 89 10.8 8.0 - 13.2 9.9 - 11.8 73 10.8 1.6 C8 83 11.1 8.6 - 14.1 10.3 - 12.1 81 11.2 1.5 C9 94 10.4 8.2 - 13.5 9.5 - 11.7 64 10.6 1.7 D1 82 11.3 7.9 - 13.5 10.5 - 12.3 82 11.2 1.7
E&W 90 11.2 8.3 - 13.8 10.1 - 12.2 79 11.2 1.6 Table 7.1: Haemoglobin data for patients on haemodialysis

67
Figure 7.1: Haemoglobin in patients on HD by 1g/dl bands Figure 7.1 shows the spread of data by 1g/dl bands. The centres are ordered by increasing percentage with a haemoglobin ≥ 10 g/dl, with centres to the left having the highest percentage
Figure 7.2: Percentage of HD patients by centre achieving the RA Standard
����� ������������������
������������ ����
��������������
������������
��������
��������������
������������
����������
������
������������
����������
������
������������
���������������
��������
������������
���������������
������������
������������������������
���������������
��������
������������������������
���������������
������������
��������������
����������
��������
�������������������
������������
��������������
������������
������������
���������������������
������������������
���������������
���������
������������������
���������������
���������
������������������
����������
����������������
������������������������
���������������
������������
������������
���������������
����������������
������������������
��������������������
��������������������
���������������������
�������������������������
����������������������������
�����������������������������������
������������������������
����������������
������������������������������������������
������������������������������������
��������������������
�����������������������������������
������������������������������
�������������������������
������������
������������������������������
�������������������������
������������������
������������������������������
������������������������������
��������������������
������������������������������
�������������������������
������������������������
������������������������������
�������������������������
��������������������
������������������������������
�������������������������
��������������������
�����������������������������������
Haemoglobin distribution : haemodialysis
0%
10%
20%
30%
40%
50%
60%
70%
80%
90%
100%
B50
B67
A87
C59
A62
A72
C431
A31
D118
A91
B23
A56
C817
C60
B33
A13
C18
B713
B95
C322
B15
B411
C711
A42
A21
B824
C96
E&W10
Centre
Perc
enta
ge o
f pat
ient
s >= 12.0����� 11.0 - 11.9
10.0 - 10.9����� 9.0 - 9.9�����
����� < 9.0
Percentage haemoglobin > 10 g/dL : haemodialysis
50
55
60
65
70
75
80
85
90
95
100
B50
B67
A87
C59
A62
A72
C431
A31
D118
A91
B23
A56
C817
C60
B33
A13
C18
B713
B95
C322
B15
B411
C711
A42
A21
B824
C96
E&W10
Centre
% o
f pat
ient
s
Lower 95% Cl
% with hb>=10
Upper 95% Cl
RA Standard

68
Figure 7.3: Haemoglobin median and quartile ranges for haemodialysis patients
Figure 7.4: Percentage of HD patients by centre achieving the European Standard
Haemoglobin : haemodialysis
8.5
9.0
9.5
10.0
10.5
11.0
11.5
12.0
12.5
13.0
13.5
B50
A62
A87
A56
A31
C18
C60
C431
A13
B67
B23
A91
D118
A72
C817
B95
B33
C59
C322
B713
A21
B411
C711
A42
B824
B15
C96
E&W10
Centre
Hae
mog
lobi
n g/
d
Lower quartileMedian
Upper quartile
Percentage haemoglobin > 11 g/dL : haemodialysis
30
35
40
45
50
55
60
65
70
75
80
85
90
95
100
B50
A87
A62
A56
B67
C431
C59
C18
C60
A91
A31
A13
D118
B23
B33
C817
A72
B95
C322
B713
A21
B411
B824
C711
A42
B15
C96
E&W10
Centre
% o
f pat
ient
Lower 95% Cl% with hb>=11Upper 95% Cl

69
Centre % data
return Median Hb g/dl
90% range
Quartile range
% Hb ≥ 10 g/dl
Mean Hb g/dl
Standard deviation
A1 100 11.9 10.3 - 13.9 11.2 - 12.9 96 11.9 1.3 A2 100 11.3 9.0 - 14.0 10.6 - 12.6 83 11.4 1.5 A3 98 12.4 9.2 - 15.8 11.5 - 13.6 91 12.5 1.7 A4 100 11.6 9.2 - 13.9 10.8 - 12.6 88 11.6 1.4 A5 98 11.7 8.9 - 15.0 10.5 - 12.6 83 11.7 1.8 A6 96 11.9 9.4 - 15.9 11.2 - 13.1 94 12.2 1.8 A7 97 11.6 8.7 - 13.7 10.5 - 12.6 85 11.5 1.6 A8 100 11.4 9.5 - 14.4 10.5 - 12.9 92 11.6 1.6 A9 100 11.7 9.9 - 13.7 10.4 - 13.2 91 11.9 1.5 B1 98 11.0 8.6 - 14.1 9.7 - 12.1 69 11.0 1.8 B2 99 11.9 9.7 - 14.2 11.2 - 12.6 92 11.9 1.3 B3 94 11.3 8.9 - 13.7 10.4 - 12.6 87 11.4 1.5 B4 99 11.6 8.8 - 14.7 10.7 - 12.7 88 11.7 1.6 B5 100 12.0 8.5 - 15.0 11.6 - 13.3 90 12.1 1.7 B6 100 12.3 9.4 - 15.1 10.9 - 13.1 79 12.0 1.9 B7 100 10.9 7.9 - 14.1 9.9 - 12.3 73 11.0 1.8 B8 94 11.6 8.6 - 14.2 10.6 - 12.3 84 11.4 1.6 B9 99 12.0 9.3 - 14.6 10.8 - 12.8 86 11.9 1.7 C1 95 12.0 8.6 - 14.3 10.9 - 12.9 87 11.8 1.5 C3 96 11.8 9.7 - 13.3 10.6 - 12.8 91 11.6 1.3 C4 98 11.3 8.8 - 13.8 10.3 - 12.3 81 11.2 1.6 C5 100 12.0 10.0 - 14.0 11.0 - 13.0 100 12.1 1.3 C6 99 11.6 9.2 - 14.6 10.5 - 13.0 87 11.8 1.8 C7 90 11.5 9.1 - 14.1 10.6 - 12.3 85 11.4 1.5 C8 97 11.3 9.0 - 14.3 10.5 - 12.6 85 11.5 1.6 C9 96 11.4 8.8 - 13.9 10.4 - 12.6 82 11.4 1.6 D1 90 12.3 10.5 - 14.4 11.3 - 13.4 100 12.4 1.3
E&W 95 11.6 9.0 - 14.3 10.6 - 12.7 86 11.6 1.6 Table 7.2: Haemoglobin data for patients on peritoneal dialysis

70
Figure 7.5: Distribution of haemoglobin for patients on PD by 1g/dl bands
Figure 7.6: Percentage of PD patients by centre achieving the RA Standard
����� ����� ���� �����������������
�������� ����
�������������� �������
������������ ����� �����
�������� ���
���������������������
������������ ������
����������
���������� ����
������������
��������������
�����������������
����������
��������
��������������
��������������
������������
������������
�������������
������������
��������������
���������������������
������������
���������������
���������������
��������
���������
������� ������������
������������������
����������
���������������
����������������
������������
����������������������������
������������
������������������������������
������������������������
������������������������������
������������������������������
��������������������
�����������������������������������
����������������������������
������������������������
������������������������
������������������������������
����������������
��������������������
����������������������������
����������������������������
������������������������������
��������������������
�������������������������
����������������
���������������
������������������������������������������
������������������������
������������������������������
�������������������������
������������������������� ����
��������
����������������
����������������������������
������������������������������
Haemoglobin distribution : peritoneal dialysis
0%
10%
20%
30%
40%
50%
60%
70%
80%
90%
100%
C5
0
D1
10
A1
0
A6
4
B2
1
A8
0
A3
2
A9
0
C3
4
B5
0
B4
1
A4
0
C1
5
C6
1
B3
6
B9
1
C7
10
A7
3
C8
3
B8
6
A5
2
A2
0
C9
4
C4
2
B6
0
B7
0
B1
2
E&W
5
Centre
Per
cent
age
of p
atie
nt >=12.0�����11.0 - 11.9
10.0 - 10.9�����
9.09 - 9.9���������� < 9.0
Percentage haemoglobin > 10 g/dl : peritoneal dialysis
55
60
65
70
75
80
85
90
95
100
C50
D110
A10
A64
B21
A80
A32
A90
C34
B50
B41
A40
C15
C61
B36
B91
A73
C710
C83
B86
A52
A20
C94
C42
B60
B70
B12
E&W5
Centre
% o
f pat
ient
s
Lower 95% Cl% with hb >=10Upper 95% Cl
RA Standard

71
Figure 7.7: Percentage of PD patients by centre achieving a haemoglobin of at least 11.0 g/dl
Figure 7.8: Haemoglobin median and quartile ranges for peritoneal dialysis patients
Percentage haemoglobin > 11 g/dL : peritoneal dialysis
30
35
40
45
50
55
60
65
70
75
80
85
90
95
100
C50
A32
B50
A64
D110
A10
B21
B60
C15
B91
A40
B86
A52
A90
C61
B41
C83
C34
A73
A20
C94
C710
B36
A80
C42
B12
B70
E&W5
Centre
% o
f pat
ient
s
Lower 95% Cl% with hb>=11Upper 95% Cl
Haemoglobin : peritoneal dialysis
9.5
10.0
10.5
11.0
11.5
12.0
12.5
13.0
13.5
14.0
A31
D118
A62
C59
B50
B67
A13
B95
B23
A91
C18
C60
B411
A56
A87
C322
A42
A72
C817
B824
A21
C711
B33
C96
C431
B15
B713
E&W10
Centre
Haem
oglo
bin
g/dL
Lower quartileMedianUpper quartile

72
Factors influencing haemoglobin Erythropoietin prescription and iron stores influence haemoglobin concentration. Other influences are less certain. Erythropoietin data are not available in this years report. Haemoglobin and serum ferritin Centres use different variables as measures of iron stores: serum ferritin is most commonly used. For this report, serum ferritin levels have been analysed and are shown in tables 7.3 and 7.4. As with haemoglobin the distribution of serum ferritin concentrations is represented by the inter-quartile and 90% ranges. The percentage with serum ferritin over 100 mcg/l and 200mcg/l can be compared between units using the 95% confidence intervals shown in figures 9-12.
Centre % data return
Median ferritin
90% range Quartile range
% ferritin > 100µg/l
A1 100 287 45 - 947 159 - 447 84 A2 100 247 43 - 833 138 - 404 85 A3 99 433 124 - 980 310 - 642 97 A4 100 268 70 - 877 147 - 435 91 A5 94 461 66 - 1069 264 - 698 93 A6 98 400 105 - 740 294 - 532 96 A7 100 622 118 - 1096 372 - 929 97 A8 93 468 252 - 887 405 - 565 99 A9 100 341 164 - 597 253 - 404 99 B1 95 380 161 - 748 267 - 486 97 B2 99 242 97 - 1327 164 - 350 95 B3 98 312 95 - 922 195 - 461 94 B4 80 344 64 - 964 182 - 568 91 B5 100 496 179 - 826 413 - 621 98 B6 96 447 120 - 763 304 - 571 98 B7 100 566 91 - 1287 308 - 764 95 B8 76 301 77 - 1675 159 - 460 85 B9 88 349 112 - 906 222 - 530 97 C1 89 330 88 - 1213 169 - 508 93 C2 2 * * * * C3 84 153 30 - 566 83 - 242 68 C4 60 809 142 - 1219 559 - 994 98 C5 95 358 63 - 1190 224 - 541 93 C6 99 334 52 - 867 198 - 532 90 C7 89 525 116 - 1308 302 - 719 96 C8 97 288 51 - 858 161 - 469 88 C9 89 500 90 - 1306 271 - 778 93 D1 84 282 115 - 804 210 - 426 97
E&W 92 377 72 - 1038 215 - 586 92 * insufficient data
Table 7.3: Serum Ferritin concentration in haemodialysis patients

73
Figure 7.9: Percentage of HD patients with serum ferritin >>>> 100 mcg/dl
Figure 7.10: Percentage of HD patients with serum ferritin >>>> 200 mcg/dl
Percentage ferritin > 100 mcg/L : haemodialysis
55
60
65
70
75
80
85
90
95
100
A90
A87
B50
B64
C440
A31
B912
A70
B15
D116
A62
C711
B21
B70
B32
C911
C111
A56
C55
B420
A40
C61
C83
B824
A20
A10
C316
E&W8
Centre
% F
errit
in >
100
mcg
/L
Lower 95% CI
% with ferritin >= 100
Upper 95% CI
Percentage ferritin > 200 mcg/L : haemodialysis
30
40
50
60
70
80
90
100
A8
7
B5
0
C4
40
A6
2
B6
4
B1
5
A3
1
A9
0
C7
11
A7
0
B7
0
C9
11
A5
6
C5
5
D1
16
B9
12
C6
1
B3
2
B4
20
A1
0
B8
24
C1
11
C8
3
A2
0
A4
0
B2
1
C3
16
E&W
8
Centre
% F
errit
in >
200
mcg
/L
Lower 95% CI% with ferritin >= 200Upper 95% CI

74
Centre % data
return Median ferritin µg/l
90% range Quartile range
% ferritin > 100µg/l
A1 100 213 46 - 720 128 - 325 84 A2 94 184 28 - 896 105 - 268 76 A3 100 97 17 - 660 64 - 232 47 A4 90 220 43 - 747 128 - 356 83 A5 94 202 27 - 791 107 - 374 77 A6 96 340 46 - 830 205 - 453 91 A7 99 272 65 - 857 189 - 427 92 A8 100 271 67 - 687 168 -481 88 A9 100 214 28 - 620 122 - 436 77 B1 98 309 91 - 850 170 - 521 92 B2 100 277 30 - 878 164 - 408 83 B3 93 153 27 - 599 78.5 - 271 68 B4 98 230 49 - 788 137 - 383 84 B5 100 281 121 - 783 192 - 439 98 B6 100 420 247 - 951 372 -511 100 B7 100 342 62 - 1292 197 - 383 90 B8 85 195 19 - 522 111 - 344 79 B9 94 290 77 - 1205 181 - 458 92 C1 95 281 32 - 1248 153 - 614 87 C3 98 192 60 - 546 116 - 285 87 C4 97 216 49 - 1089 135 - 442 84 C5 93 283 51 - 722 137 - 450 77 C6 96 194 23 - 790 94 - 317 74 C7 90 233 49 - 675 130 - 368 84 C8 96 334 97 - 1068 197 - 489 95 C9 85 147 35 - 885 92 - 391 71 D1 98 276 33 - 737 141 - 369 83
E&W 93 237 43 - 850 134 - 410 83 * insufficient data
Table 7.4: Serum Ferritin concentration in peritoneal dialysis patients
Hb> 10g/dL v percentage with ferritin > 100 mcg/l : haemodialysis
404550556065707580859095
100
60 65 70 75 80 85 90 95 100Percentage Fe rritin > 100mcg/L
% H
b >
10g/
dL

75
Figure 7.11: Percentage of PD patients with serum ferritin >>>> 100 mcg/dl
Figure 7.12: Percentage of PD patients with serum ferritin >>>> 200 mcg/dl Most centres had ferritin levels greater than 100 mcg/L in a high proportion of patients. The proportion with this ferritin level was higher in haemodialysis than peritoneal dialysis patients. This could reflect a greater difficulty in giving intravenous iron to peritoneal dialysis patients or could indicate that peritoneal dialysis patients achieve acceptable levels of haemoglobin with a lesser iron requirement. Policies on iron treatment differ between centres and in individual centres may differ between haemodialysis and peritoneal dialysis. Centre C3 is a low outlier for ferritin in haemodialysis but has above average proportion with ferritin ≥ 100 mcg/dl in peritoneal dialysis. Centre A3 is a low outlier in peritoneal dialysis patients but has 97% of haemodialysis patients with ferritin ≥ 100 mcg/dl.
Percentage ferritin > 100 mcg/L : peritoneal dialysis
20
30
40
50
60
70
80
90
100
B6
0
B5
0
C8
100
B1
0
A7
1
B9
6
A6
4
B7
5
A8
3
C1
0
C3
3
C4
22
C7
100
B4
1
A1
0
B2
10
A4
9
D1
100
B8
8
A9
44
C5
5
A5
58
A2
6
C6
9
C9
100
B3
46
A3
0
E&W
100
Centre
% F
errit
in >
100
mcg
/L
Low er 95% CI
% w ith ferritin >= 100
Upper 95% CI
Percentage ferritin > 200 mcg/L : peritoneal dialysis
0
10
20
30
40
50
60
70
80
90
100
B 6
0
A 6
4
B 7
5
C 8
100
A 7
1
B 9
6
B 2
10
C 1
0
B 1
0
B 5
0
C 5
5
C 7
100
D 1
100
A 4
9
C 4
22
A 1
0
A 9
44
B 4
1
A 5
58
B 8
8
C 6
9
C 3
3
C 9
100
A 2
6
B 3
46
A 3
0
E&W
100
Centre
% F
errit
in >
200
mcg
/L
Lower 95% CI% with ferritin >= 200Upper 95% CI

76
Centre C4 has 98% of haemodialysis patients with ferritin ≥ 100 mcg/dl but a median ferritin of 809 mcg/dl compared to Centre A9 which has 99% with ferritin ≥ 100 mcg/dl but a median of 341 mcg/dl. As in previous years there is no direct relationship demonstrated between serum ferritin levels and the achievement of the Renal Association Standard for haemoglobin. Haemoglobin at start of dialysis The haemoglobin concentration in the first quarter in which a patient starts dialysis will reflect the pre-dialysis management in those patients already under medical review within a centre but will also be affected by the proportion of patients presenting late for renal replacement therapy.
Centre % data return
Median Hb g/dl
90% range Quartile range
%Hb > 10g/dL
A1 99 9.9 7.3-12.5 8.6-10.9 49 A2 98 9.6 7.5-12.3 8.6-10.4 38 A3 96 10.2 7.8-12.9 9.3-11.7 61 A4 100 10.4 8.6-12.1 9.6-11.1 55 A5 99 10.4 8.2-13.2 9.3-11.3 59 A6 78 9.8 7.0-13.6 8.8-11.0 49 A7 98 10.1 8.2-12.8 9.2-11.2 53 A8 80 10.4 7.9-12.5 8.9-10.9 66 A9 92 9.7 7.1-11.9 8.6-10.8 39 B1 98 9.4 7.1-11.6 8.7-10.4 37 B2 94 10.1 8.3-12.0 9.3-10.8 55 B3 83 9.8 7.8-12.9 8.9-11.1 49 B4 91 9.8 6.9-12.7 8.6-11.2 48 B5 98 10.5 8.0-13.0 9.1-11.7 59 B6 100 9.9 8.6-13.4 9.2-11.1 48 B7 90 9.5 7.5-12.1 8.6-10.5 38 B8 42 9.3 5.1-10.7 8.2-10.2 36 B9 90 10.1 7.3-13.1 8.9-11.1 55 C1 98 8.8 6.7-11.9 7.7-9.6 19 C3 82 9.5 7.2-12.2 8.3-10.7 38 C4 82 9.5 7.4-11.7 8.9-10.4 38 C5 85 9.0 7.0-12.1 9.0-11.0 41 C6 95 10.4 7.7-13.6 9.2-11.6 59 C7 96 9.4 7.4-11.7 8.5-10.4 32 C8 90 10.4 8.0-13.2 9.3-11.5 60 C9 39 * * * * D1 76 10.1 7.9-13.0 9.5-11.4 52
E&W 86 9.9 7.4-12.7 8.9-11.0 48 Table 7.5: Haemoglobin at start of dialysis

77
Figure 7.13: Percentage haemoglobin >10g/dl for new patients
Figure 7.14: Haemoglobin distribution at start of dialysis
New patients % Hb > 10 g/dl
0
10
20
30
40
50
60
70
80
90
A820
A34
C810
C65
B52
A51
B910
B26
A40
A72
D124
A622
A11
B317
B60
B49
C515
A98
B710
C318
C418
A22
B12
B858
C74
C12
E&W14
Centre
% H
b >
10g/
dl
Lower 95% CI% with hb >= 10Upper 95% CI
������������������������������
��������������������
����������������������������
�������������������������
��������������������
�����������������������������������
������������������������������������
����������������
���������������������
������������������������������
����������������
������������������������������������������
������������������������������������������
������������������������
����������������������������
������������������������������������������������
��������������������
�������������������������������������������������
������������������������������������������
���������������������������������������������
������������������������������������������������
������������������������������������������
�����������������������������������
����������������������������������������
������������������������������������������
�������������������������������������������������������
������������������������
���������������
����������������
������������������������������������������
�������������������������
��������������������
�����������������������������������
������������������������
����������������������������
��������������������������������������������������������
������������������������������������
����������������������������
������������������������������������������
������������������������������
������������������������
��������������������������������������������������������
������������������������
���������������������������������������������
�������������������������������������������������
������������������������������������������
�������������������������
����������������������������������������������������������������
������������������������������������������
�����������������������������������
����������������
������������������������������������������������
������������������������������ ����
��������������������
��������������� ����
������������
����������������������������
��������������������
����������������������������
�����������������������������������
������������������
��������������������
�����������������������������������
������������������������������
����������������
���������������������
������������������������
����������������
����������������������������
������������������������������
���������������
�����������������������������������
������������������������
��������������������
����������������
������������
���������������
������������������������
���������� ����
������������
Haemoglobin Distribution: New patients
0%
10%
20%
30%
40%
50%
60%
70%
80%
90%
100%
D124
C810
C74
C65
C515
C418
C318
C12
B910
B858
B710
B60
B52
B49
B317
B26
B12
A98
A820
A72
A622
A51
A40
A34
A22
A11E&W14
Centre
% p
atie
nts
> = 12.0�������� 11.0 - 11.9
10.0 - 10.9����
9.0 - 9.9����< 9.0

78
Figure 7.15: Percentage with haemoglobin > 10g/dl: new and prevalent patients A significant proportion of new patients are very anaemic with haemoglobin < 9g/dl which may reflect patients presenting late with uraemia. The large variation in new patients haemoglobin between centres and the lack of relationship between haemoglobin of new patients and haemoglobin of established patients probably reflects differing policies on use of erythropoiesis stimulating treatments in pre-dialysis patients. Current standards for anaemia management in renal failure do not apply pre-dialysis. Change in Haemoglobin Achievement 1999 -2000
Figure 7.16: Haemoglobin < 9 g/dl in 1st 2 years since of RRT
Percentage of patients with Hb > 10g/dL
0
10
20
30
40
50
60
70
80
90
100
A8 A3 C8 C6 B5 A5 B9 B2 A4 A7 D1 A6 A1 B3 B6 B4 C5 A9 B7 C3 C4 A2 B1 B8 C7 C1 E&WCentre
% o
f pat
ient
s
New patientsHD at start of 2000
05
101520
253035
% o
f pat
ient
s
<0.5 0.5 -1 1 - 2 2+Years
Patients with Haemoglobin < 9 g/dl by time in ESRF UK 1999 -2000
UK HD 1999UK PD 1999UK HD 2000UK PD 2000

79
Figure 7.16 shows that since 1999 fewer patients are starting renal replacement therapy severely anaemic with a haemoglobin of less than 9 g/dl. For patients both on haemodialysis and peritoneal dialysis this proportion has more than halved. These results for 2000 are now similar to those achieved in the 1999 US data.
Figure 7.17: Median haemoglobin by time on RRT In 2000 there has been a marked rise in median haemoglobins for patients on both dialysis modalities, across all time points. There is now no fall in haemoglobin for patients on PD after 1- 2 years, although the fall in haemoglobin still occurs for those on PD > 2years, although to a lesser extent. As shown last year, a median haemoglobin of 11.5g dl should indicate that > 85% of patients have a haemoglobin above 10 g/dl and achieve the Renal Associations standard. Figures 7.18 show the improvement for patients on haemodialysis across all centres with 2 years of data. Two of the newer centres A6 and C9 with no data for 1999 show no improvement in the year 2000. Figure 7.19 is a similar graph for patients on peritoneal dialysis. Centre B6 is the only centre to show a drop in achieving the standard over this time period.
9.5
10.0
10.5
11.0
11.5
12.0
Hb g
/dl
<=6 months 6 m - 1yr 1- 2 yrs >2 years Median all
Years
Haemoglobin by time in ESRFHD 1999PD 1999HD 2000PD 2000

80
Figure 7.18: Change in haemoglobin 1999 –2000 haemodialysis
Haemoglobin > 10 g/dl from start 1999 to end of 2000 by centre : haemodialysis
20
30
40
50
60
70
80
90
100
A1 A2 A3 A4 A5 A6 A7 A8 A9 B1 B2 B3 B4 B5 B6 B7 B8 B9 C1 C3 C4 C5 C6 C7 C8 C9 D1 E&W
Centre
% H
b >
10 g
/dl
Lower 95% CI% with hb >= 10Upper 95% CI
* 1st point - Jan 1999o 2nd point - Jan 2000 3rd point - Dec 2000

81
Figure 7.19: Change in haemoglobin 1999 –2000 peritoneal dialysis
Haemoglobin > 10 g/dl at start 1999 to end of 2000 by centre : peritoneal dialysis
20
30
40
50
60
70
80
90
100
A1 A2 A3 A4 A5 A6 A7 A8 A9 B1 B2 B3 B4 B5 B6 B7 B8 B9 C1 C3 C4 C5 C6 C7 C8 C9 D1 E&W
Centre
% >
Hb
10 g
/dl
Lower 95% CI% with hb >= 10Upper 95% CI
* 1st point - Jan 1999o 2nd point - Jan 2000 3rd point - Dec 2000

82
Figure 7.20: Improvement in E&W of achieving the Hb standard 1998-2000 The US data for October 2000, from the ESRD Clinical Performance Measures project showed that 91% of patients had a haemoglobin >10 g/dl and 74% achieved a haemoglobin >11 g/dl. Median haemoglobin in the US was 11.7 g/dl, which is consistent with the Registry prediction a median haemoglobin of 11.5g/dl is required to achieve 85% of patients above 10g/dl. Conclusion There is continuing evidence of improvement in the management of renal anaemia in centres submitting data to the Renal Registry. For peritoneal dialysis 86% of all patients whose data had been submitted to the Registry had a haemoglobin ≥10 g/dl. An increasing proportion of centres achieved the Renal Association standard for both haemodialysis and peritoneal dialysis patients. There is evidence of significantly different approaches to iron replacement in different centres. There is evidence of different approaches to management of renal anaemia pre-dialysis which will in part reflect availability of erythropoiesis stimulating treatments.
Haemoglobin > 10 g/dl at start 1998 to end of 2000 England & Wales
20
30
40
50
60
70
80
90
100
Heamodialysis Peritoneal dialysis
% >
Hb
10 g
/dl
Low er 95% CI
% w ith hb >= 10
Upper 95% CI
* 1st point - Jan 1998o 2nd point - Jan 1999 3rs point - Jan 2000 4th point - Dec 2000

83
Chapter 8: Performance Against Renal Association Standards Introduction The Standards Committee of the Renal Association have identified a number of laboratory and clinical variables which may relate to quality of care or outcomes and have recommended minimum standards or target ranges which should be achieved in established dialysis patients These are shown in table 8.1.
Standard Haemodialysis Peritoneal dialysis
Haemoglobin >10g/dl in >85% of patients >10g/dl in >85% of patients Calcium Local normal range Local normal range Phosphate 1.2-1.7 mmol/l 1.1-1.6 mmol/l Albumin Local normal range 70% of patients in the local
normal range Bicarbonate Local normal range Lower local normal to upper
local normal +3mmol/l Parathyroid Hormone 2–3x local normal range 2–3x local normal range Systolic BP <160 mmHg aged over 60
<140 mmHg aged under 60 <160 mmHg aged over 60 <140 mmHg aged under 60
Diastolic BP <90 mmHg <90 mmHg Adequacy URR >65% or KT/V >1.2 CC>50l/week or KT/V.1.7
for CAPD (65l/week and 2.0 for APD
Table 8.1 Renal Association Standards This year due to previously mentioned problems with albumin measurement and correction of calcium, these graphs have not been included here although will be released in the ‘web’ publication. Also the parathyroid hormone level achievements have been standardised at < 23 pmol/l rather than the local laboratory range as these locally provided ranges have shown not to be population, method or equipment based. Data are included for the last quarter of 2000. Patients were excluded if they had not been on renal replacement therapy for at least three months or if they had transferred unit or changed dialysis modality in the three month period prior to data sampling. This ensures that the results for a unit reflect stable treatment patterns and are not adversely affected by new patients which the unit has not had chance to treat effectively. The problems of comparing biochemical variables such as albumin, calcium and bicarbonate identified in the previous reports still apply; and comparative data must be interpreted with caution. Achievement of Standards defined around the local laboratory reference range is dependent on the source of derivation for the reference range. Biochemical data have been harmonised as described previously. The harmonisation constants for an individual laboratory change year on year and are monitored. The urea reduction ratios may be influenced by post-dialysis sampling techniques; this is discussed again this year in detail in the appendix.

84
Results have been ranked in order of performance purely for clarity of presentation, otherwise the figures would be difficult to read. The ranking does not necessarily imply significant differences in the performance of different units and the significance of the ranking order has not been tested. The figures which show a percentage of patients reaching a ‘target’ also include the 95% confidence interval for that percentage. This provides an estimate in the potential variation around this figure in repeated measurement and provides an indication of the overlap between centres. Some of the results are also shown as bar charts divided into bands. The numbers immediately under each centre on the figures are the percentage of missing data from that centre for patients on that treatment modality. These methods are the best way the Registry has found to convey the underlying data for the larger number of centres. Overview of presentation In the following section the figures use a common modified box-plot format with data presented separately for haemodialysis and peritoneal dialysis. The figures showing the percentage of patients reaching the Renal Association Standard include the 95% confidence interval calculated for this figure. Where medians are displayed, the 25th and 75th centiles for the unit are included. Figures showing the percentage within a range (as defined by the Renal Association Standard or a Renal Registry defined range) also include the 95% confidence interval calculated for this figure. Data completeness is indicated by the percentage missing figure below the unit code letter. Haemoglobin
Figure 8.1 Haemoglobin Percentage of HD patients achieving the RA Standard
Percentage haemoglobin > 10 g/dL : haemodialysis
50
55
60
65
70
75
80
85
90
95
100
B50
B67
A87
C59
A62
A72
C431
A31
D118
A91
B23
A56
C817
C60
B33
A13
C18
B713
B95
C322
B15
B411
C711
A42
A21
B824
C96
E&W10
Centre
% o
f pat
ient
s
Lower 95% Cl
% with hb>=10
Upper 95% Cl
RA Standard

85
Figure 8.2 Haemoglobin for patients on HD by 1g/dl bands
Figure 8.3 Percentage of PD patients by centre achieving the RA Standard
��������
��������������
������������
��������
��������������
������������
����������
��������
���������������������
����������
��������
��������������
������������
����������
������
��������������
���������������
��������
���������������������
������������������
���������������
������������
������������������
���������������
����������������
����������������������������
������������������
������������
��������
��������������
������������
��������
��������������
������������������
���������������
������������
��������������
���������������
������������
���������������������
������������������
���������������
���������
���������������������
����������
����������������
���������������������
������������������
���������������
������
������������������
���������������
������������
���������������������
������������������������
��������
��������������������
�������������������������������������������������
������������������������������
����������������
����������������������������
������������������������������
�������������������������
����������������
�����������������������������������
��������������������
����������������
����������������������������
������������������������
��������������������
������������������
�����������������������������������
������������������������������
������������������������
����������������������������
������������������������������
�������������������������
������������
������������������������������
��������������������
����������������
����������������������������
������������������������
��������������������
Haemoglobin distribution : haemodialysis
0%
10%
20%
30%
40%
50%
60%
70%
80%
90%
100%
B50
B67
A87
C59
A62
A72
C431
A31
D118
A91
B23
A56
C817
C60
B33
A13
C18
B713
B95
C322
B15
B411
C711
A42
A21
B824
C96
E&W10
Centre
Per
cent
age
of p
atie
n >= 12.0���11.0 - 11.9
10.0 - 10.9������ 9.0 - 9.9��� < 9.0
Percentage haemoglobin > 10 g/dl : peritoneal dialysis
55
60
65
70
75
80
85
90
95
100
C50
D110
A10
A64
B21
A80
A32
A90
C34
B50
B41
A40
C15
C61
B36
B91
A73
C710
C83
B86
A52
A20
C94
C42
B60
B70
B12
E&W5
Centre
% o
f pat
ient
s
Lower 95% Cl% with hb >=10Upper 95% Cl
RA Standard

86
Figure 8.4 Distribution of haemoglobin for patients on PD by 1g/dl bands Serum Bicarbonate
Figure 8.5 Percentage bicarbonate in lab reference range for haemodialysis
������ ����� ����������������
������
������������
����������
��������
��������������
������������
����������
��������
������
������������
���������������
��������
��������������
������������
����������
��������
���������
��������������
����������
������������
����������
��������
��������������
������ ����������
��������
������
������������
����������
��������
��������������
������������
����������
��������
������
������������
�����������������
���������������������
������������������
���������������
������������
���������
�����������������������������������
����������
��������������������
����������������������������
������������������������������������
������������������������������
������������������������
����������������������������������� ������
������������������������
��������������������
����������������
������������������
������������������������������
�������������������������
��������������������
�����������������������������������
������������������������������
��������������������
��������������������
���������
������������������������������������
������������������������������
����������������
�����������������������������������
������������������������������
��������������������
������������
������������
����������������������������
�������������������������
Haemoglobin distribution : peritoneal dialysis
0%
10%
20%
30%
40%
50%
60%
70%
80%
90%
100%
C5
0
D1
10
A1
0
A6
4
B2
1
A8
0
A3
2
A9
0
C3
4
B5
0
B4
1
A4
0
C1
5
C6
1
B3
6
B9
1
C7
10
A7
3
C8
3
B8
6
A5
2
A2
0
C9
4
C4
2
B6
0
B7
0
B1
2
E&W
5
Centre
Perc
enta
ge o
f pat
ient
s
>=12.0��� 11.0 - 11.9
10.0 - 10.9������ 9.09 - 9.9���
< 9.0
Percentage bicarbonate within lab ref. range : haemodialysis
10
20
30
40
50
60
70
80
90
100
C738
B70
D113
C36
A21
B50
B15
A57
B21
B92
A40
C50
C82
A10
C15
C69
B62
A31
A90
Centre
% o
f pat
ient
s
Low er 95% CI
% w ith bicarb in labs ref range
Upper 95% CI

87
Figure 8.6 Percentage bicarbonate in lab reference range for peritoneal dialysis Serum Phosphate
Figure 8.7 Percentage serum phosphate in range 1.2-1.7 for haemodialysis
Percentage of patients with bicarbonate in lab. ref. range :peritoneal dialysis
20
30
40
50
60
70
80
90
100
A110
C755
B70
A90
C50
B22
A20
B12
D10
A41
B60
C315
C81
C15
A54
B50
C61
B321
B92
A32
Centre
% o
f pat
ient
s
Lower 95% CI% with bicarb in labs ref rangeUpper 95% CI
Serum Phosphate, percentage in 1.2 - 1.7 mmol/L : haemodialysis
0
10
20
30
40
50
60
C50
C15
C60
A21
C710
B50
B70
C35
A31
A90
D112
A56
B21
A10
C82
B62
B91
B49
A40
B14
B31
E&W5
Centre
% o
f pat
ient
s
Lower 95% CI
% with phos between 1.2 and 1.7
Upper 95% CI
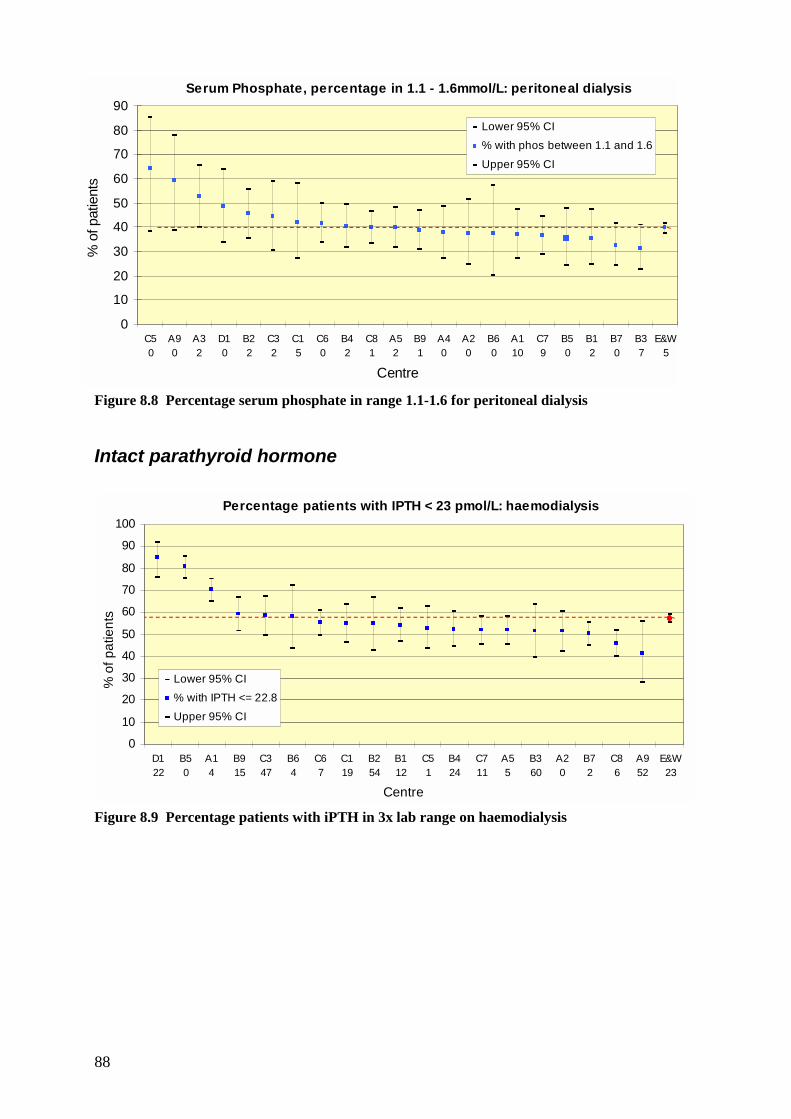
88
Figure 8.8 Percentage serum phosphate in range 1.1-1.6 for peritoneal dialysis Intact parathyroid hormone
Figure 8.9 Percentage patients with iPTH in 3x lab range on haemodialysis
Serum Phosphate, percentage in 1.1 - 1.6mmol/L: peritoneal dialysis
0
10
20
30
40
50
60
70
80
90
C50
A90
A32
D10
B22
C32
C15
C60
B42
C81
A52
B91
A40
A20
B60
A110
C79
B50
B12
B70
B37
E&W5
Centre
% o
f pat
ient
s
Lower 95% CI% with phos between 1.1 and 1.6Upper 95% CI
Percentage patients with IPTH < 23 pmol/L: haemodialysis
0
10
20
30
40
50
60
70
80
90
100
D122
B50
A14
B915
C347
B64
C67
C119
B254
B112
C51
B424
C711
A55
B360
A20
B72
C86
A952
E&W23
Centre
% o
f pat
ient
s
Lower 95% CI% with IPTH <= 22.8Upper 95% CI

89
Figure 8.10 Percentage patients with iPTH in 3x lab range on peritoneal dialysis Dialysis Adequacy
Figure 8.11 Percentage URR > 65%
Percentage patients with IPTH <23 pmol/L: peritoneal dialysis
0
20
40
60
80
100
120
C50
D15
B50
B77
B362
B216
A914
C712
B15
A55
A10
C66
B911
A219
C370
B421
C86
C110
E&W22
Centre
% o
f pat
ient
s
Low er 95% CI
% w ith IPTH <= 22.8
Upper 95% CI
Percentage URR > 65%
20
30
40
50
60
70
80
90
100
A24
D154
B71
A87
B50
B67
A542
A13
C39
A63
B28
A37
C19
C85
B426
C713
C914
C649
B17
B918
C50
A44
A910
B843
A76
B38
E&W18
Centre
% o
f pat
ient
s >
65%
Low er 95% CI
% w ith URR >= 65
Upper 95% CI

90
Blood Pressure
Figure 8.12 Percentage haemodialysis patients <60 with BP in RA Standard range
Figure 8.13 Percentage patients >60 with BP in RA Standard on haemodialysis
Percentage of patients age > 60 with BP <160/90 : haemodialysis
0102030405060708090
100
B710
C77
B25
C62
C87
A10
B53
B63
C50
C38
A92
C112
A30
A21
B31
A40
E&W29
Centre
% o
f pat
ient
s
Lower 95% CI
% diastolic & systolic in range
Upper 95% CI
Percentage of patients age < 60 with BP <140/90 : haemodialysis
0102030405060708090
100
A588
B20
B711
C713
C65
C85
C313
A12
C50
B51
A20
B67
C17
A42
A31
A92
B31
E&W27
Centre
% o
f pat
ient
s
Lower 95% CI% diastolic & systolic in rangeUpper 95% CI

91
Figure 8.14 Percentage pts age <60 with BP in RA Standard range on peritoneal dialysis
Figure 8.15 Percentage pts age >60 with BP in RA Standard range on peritoneal dialysis
Percentage of patients age < 60 with BP <140/90 :peritoneal dialysis
0102030405060708090
100
C719
B24
A12
B511
C88
C63
B37
B73
C16
E&W46
Centre
% o
f pat
ient
s
Lower 95% CI
% diastolic & systolic in range
Upper 95% CI
Percentage of patients age > 60 with BP <160/90 :peritoneal dialysis
0102030405060708090
100
B22
C75
C115
A12
C86
B50
B74
C65
B38
E&W46
Centre
% o
f pat
ient
s
Lower 95% CI% diastolic & systolic in range
Upper 95% CI

92
Statistical analysis
Methodology Chi-squared tests were used to see whether the percentage of patients with data in a given range varied significantly between centres. Degrees of freedom are equal to the number of centres with over 50% completeness minus 1. Haemoglobin. A chi-squared test was used to determine whether the percentage of patients with haemoglobin ≥10g/dl differed between centres. For patients on HD, the percentage of patients with haemoglobin ≥10g/dl was found to differ significantly between centres (X2 = 105.7, d.f. = 27, p<0.001). For patients on PD, the percentage of patients with haemoglobin ≥10g/dl was found to differ significantly between centres (X2 = 62.7, d.f. = 27, p<0.001). Ferritin A chi-squared test was used to determine whether the percentage of patients with ferritin ≥100 mcg/L differed between centres. For patients on HD, the percentage of patients with ferritin ≥100 was found to differ significantly between centres (X2 = 252.9, d.f. = 27, p<0.001). For patients on PD, the percentage of patients with ferritin ≥100 was found to differ significantly between centres (X2 =164.1, d.f. = 27, p<0.001). Bicarbonate A chi-squared test was used to determine whether the percentage of patients with bicarbonate within the Standard varied between centres. For this analysis, note that the patients were categorised as having bicarbonate within the Standard or not having a bicarbonate within the Standard (regardless of whether the patient's bicarbonate was below or above the Standard). Note that the Standards are different for HD and PD. For patients on HD, the percentage of patients with bicarbonate within the Standard differed significantly between centres (X2 = 378.7, d.f. = 19, p<0.001). For patients on PD, the percentage of patients with bicarbonate within the Standard differed significantly between centres (X2 = 129.6, d.f. = 19, p<0.001).
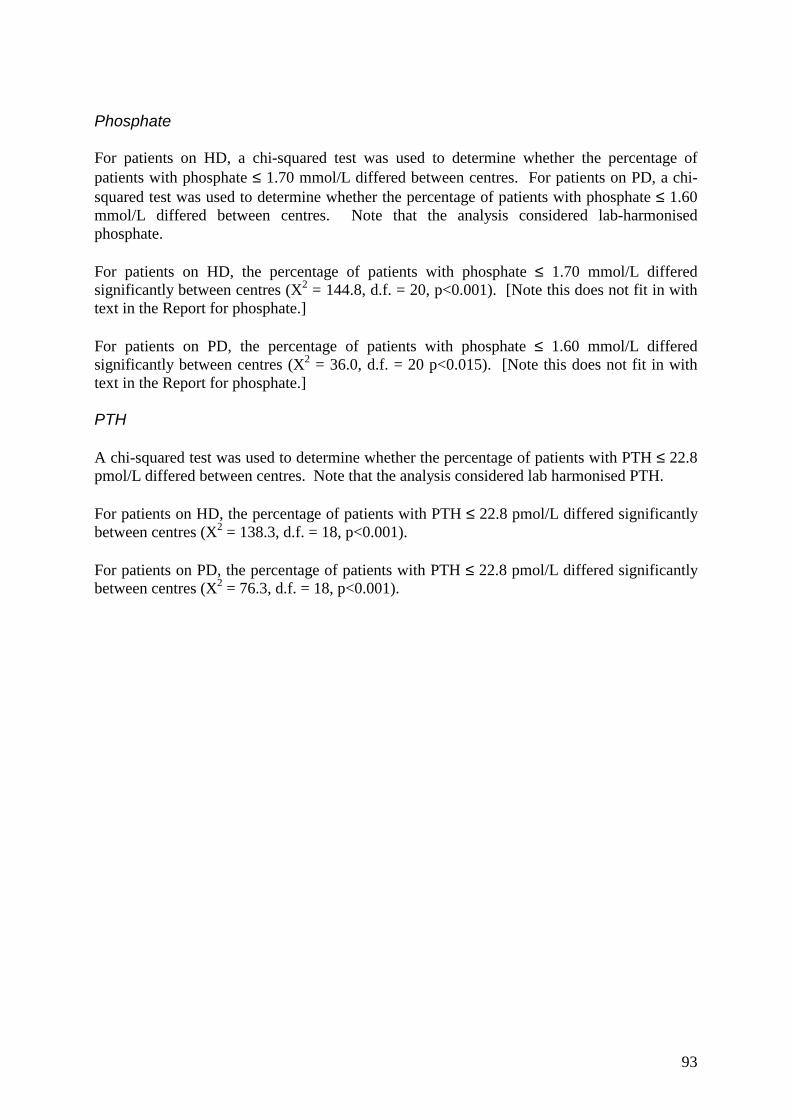
93
Phosphate For patients on HD, a chi-squared test was used to determine whether the percentage of patients with phosphate ≤ 1.70 mmol/L differed between centres. For patients on PD, a chi-squared test was used to determine whether the percentage of patients with phosphate ≤ 1.60 mmol/L differed between centres. Note that the analysis considered lab-harmonised phosphate. For patients on HD, the percentage of patients with phosphate ≤ 1.70 mmol/L differed significantly between centres (X2 = 144.8, d.f. = 20, p<0.001). [Note this does not fit in with text in the Report for phosphate.] For patients on PD, the percentage of patients with phosphate ≤ 1.60 mmol/L differed significantly between centres (X2 = 36.0, d.f. = 20 p<0.015). [Note this does not fit in with text in the Report for phosphate.] PTH A chi-squared test was used to determine whether the percentage of patients with PTH ≤ 22.8 pmol/L differed between centres. Note that the analysis considered lab harmonised PTH. For patients on HD, the percentage of patients with PTH ≤ 22.8 pmol/L differed significantly between centres (X2 = 138.3, d.f. = 18, p<0.001). For patients on PD, the percentage of patients with PTH ≤ 22.8 pmol/L differed significantly between centres (X2 = 76.3, d.f. = 18, p<0.001).

94

95
Chapter 9: Survival of incident adult patients Summary The first year survival from day 0 of renal replacement therapy was 96%, 94%, 90%, 84%, 72%, 65% for patients aged 18-34, 35- 44, 45-54, 55-64, 65- 74, 85+ respectively. There was no relationship between a centre’s 90 day or 1 year after 90 day survival and the mortality rate of the local population for all cause mortality or only cardiac mortality There are marked differences between centres in survival rates, but these are not consistent. Serial studies on one year survival rates for individual centres from 1997 – 1999, after adjustment to a standard age, showed wide variation Introduction The 'Renal Registry' database enables analysis of the influence of different factors on patient survival. These factors are related to patient case mix [e.g. age, gender, ethnicity, underlying diagnosis & other co-morbidity] or are dependent on treatment [e.g. haemoglobin, mode of dialysis, serum phosphate]. For individual renal units such analysis allows comparison with performance in previous years, and with other centres. Survival rates can either be looked at in relation to:
(a) An 'incident cohort' in which patients who started renal replacement therapy in a particular year are included
or (b) A 'prevalent cohort' in which all (or a defined group) of patients undergoing renal replacement therapy at a particular time are included
The analyses presented in this chapter examine survival whilst on renal replacement therapy, including transplantation, of incident patients. Patients are censored when moving to a centre which does not report to the Registry. Death rates in different centres contributing to the UK Renal Registry are reported here. These are very crude data. Adjustment can be made between centres on the basis of age, but there is need for more detailed information relating to co-morbidity and ethnic origin. With this lack of information about case-mix, no significance can currently be attributed to any apparent differences in survival between centres. Statistical Methods The 'number of days at risk ' was calculated for each patient and the sum of these values for all patients divided by 365 represents the 'number of patient years at risk'. The mortality rate was defined as : Number of deaths on dialysis Number of patient years at risk

96
The unadjusted survival probabilities (with 95% confidence intervals) were calculated using the Kaplan Meier Method in which the probability of surviving more than a given time can be estimated for members of a 'cohort of patients' without accounting for the characteristics of the members of that cohort. Where centres are small or the survival probabilities greater than 90% the confidence intervals are only approximate. In order to estimate the differences in survival of different subgroups of patients within the cohort a 'Stratified Proportional Hazards Model (Cox) ' was used where appropriate. The results from the Cox Model are interpreted using a hazard ratio. For example, for diabetics when compared with non-diabetics, the hazard ratio is the ratio of the estimated hazards for diabetics relative to non-diabetics, where the hazard is the risk of dying at time t given that the individual has survived until this time. The underlying assumption of a proportional hazards model is that this ratio remains constant throughout the time period under consideration. The proportional hazards model was tested for validity in all cases. Survival patterns This analysis relates primarily to the 1999 cohort of patients, with earlier patients studied for the longer-term survival analysis. Analysis of the survival of incident patients reveals a complex picture. As shown in chapter 4, the death rate in the first 90 days is much higher than in the rest of the first year (table 9.1). The high early risk of death my also vary by age and diagnosis.
Age 90 day KM Survival 1 yr KM Survival
< 65 95 86 ≥ 65 83 66 All 89 76
Table 9.1 90 day & 1 yr survival The number of deaths per 100 live patients in each 30-day time interval was plotted. Figure 9.1 shows that the death rate levels not at day 90, but at day 150. Thereafter the death rate appears fairly constant.
Figure 9.1 Distribution of deaths in the 1st year
Distribution of deaths in 90 days E&W 1998-99
02468
1012141618
0 10 20 30 40 50 60 70 80 90
Days
Perc
enta
ge o
f dea
ths
Distribution of deaths in 1st year E&W 1998-99
02468
10121416182022
0 30 60 90 120 150 180 210 240 270 300 330 360
Days
Perc
enta
ge o
f dea
ths

97
Fig. 9.1 shows the distribution of deaths as a percentage of all deaths within the 90-day and 360 day time period. When analysed as a percentage of total deaths in the 1st year, 20% occur within the first 30 days and 47% within 90 days for England & Wales. Figure 9.2 shows the difference between Scotland (with a generally higher mortality) and England & Wales. There is an apparent greater variation in the Scottish data due to smaller numbers of patients in this group.
Figure 9.2 Distribution of deaths in 1st year UK 98 – 99 per 100 live patients at each time period The distribution of deaths in the first few months may also show differences between units, even where overall survival is similar. Different distribution patterns may give an indication of differences in practice. The “hazard function” The hazard function is the probability of dying in a short time interval. The hazards expressed below are the probability of dying on any single day Survival within the first 90 days Analysis of the hazard of death within the first 90 days shows that for patients aged over 65 there is a large hazard of death at the start of renal replacement therapy, which then falls rapidly. This compares with the risk for those aged less than 65 years, which decreases to day 60 and then rises. By day 90 the 95% confidence intervals for these two groups overlap.
Distribution of deaths in 1st year UK 1998-99 per 100 live patients at each time period
0
1
2
3
4
5
6
7
0 30 60 90 120 150 180 210 240 270 300 330 360
Days
Dea
ths
per 1
00 li
ve p
atie
nts
E&WScotland

98
Figure 9.3 The hazard function for incident adults aged above and below 65 years Calculation of the ratio of the hazard of death for those aged over 65: aged less than 65, confirms that the ratio between these two groups is not constant throughout the first 90 days (figure 9.4).
Figure 9.4 The ratio of the hazard of death for aged>65 : aged <65, in the first 90 days.
Hazard function for two age classes
0
0.001
0.002
0.003
0 10 20 30 40 50 60 70 80 90Time (days)
Haz
ard
18 - 64LCL (18-64)UCL (18-64065 +UCL (65+)LCL (65+)
Hazard ratio in first 90 daysAge >=65 v under 65
0
1
2
3
4
5
6
7
5 15 25 35 45 55 65 75 85
Days from start RRT
Haza
rd ra
tio

99
Figure 9.5 Kaplan-Meier survival curves by age band for 90 days The figure above shows the Kaplan-Meier survival curves and indicates the different mortality rates between the different age bands in the first 90 days for those patients starting Renal Replacement Therapy in 1999.
Figure 9.6 Hazard function by age band for the 1st 90 days The hazard functions shown in figure 9.6 indicate that the hazard of death is not of a constant proportionality between the different age bands during the first 90 days. Thus the Cox proportional hazard model cannot be used on this untransformed data to adjust survival by centre to the same age for all centres. Through the use of a standard statistical method of log, log transformation, it is possible to obtain proportionality between the age bands, for use in
90 day survival by age -1999 cohort
70%
75%
80%
85%
90%
95%
100%
0 10 20 30 40 50 60 70 80 90Days
Sur
viva
l 18-4545-5455-6465-7475-84>85
90 day hazard function per 100 patients by age
0
0.05
0.1
0.15
0.2
0.25
0.3
0.35
0 10 20 30 40 50 60 70 80Days
Haz
ard
func
tion
18-4545-5455-6465-7475-84>85

100
the application of a proportional hazards model (Figure 9.7). These methods were used in making age adjustments in the individual centre data shown later.
Figure 9.7 Log log transformation of Survival function over 90 days by age Survival over 360 days from start of Renal Replacement therapy Kaplan-Meier survival curves over 360 days from the first renal replacement therapy for the same age bands are shown in figure 9.8. There is a marked variation from 96% survival in the 18-44 age group to 65% in those over 85.
Figure 9.8 Survival in the first year of renal replacement therapy
90 day survival by age -1999 cohort
-3.00
-2.75
-2.50
-2.25
-2.00
-1.75
-1.50
-1.25
-1.001.0 1.1 1.2 1.3 1.4 1.5 1.6 1.7 1.8 1.9 2.0
Log Days
Log
(-ve
log
Sur
vival
)
18-4445-5455-6465-7475-84>85
First year survival (from day 0) by age -1999 cohort
60%
65%
70%
75%
80%
85%
90%
95%
100%
0 30 60 90 120 150 180 210 240 270 300 330 360Days
Sur
viva
l
18-4445-5455-6465-7475-84>85
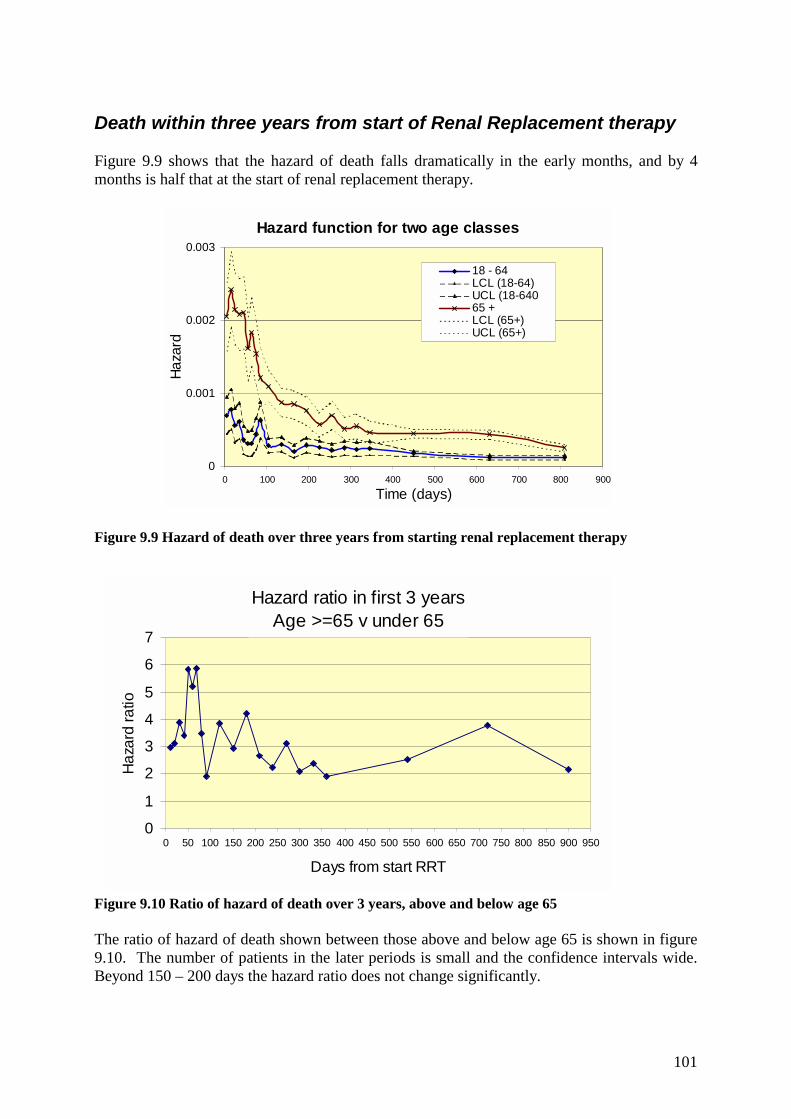
101
Death within three years from start of Renal Replacement therapy Figure 9.9 shows that the hazard of death falls dramatically in the early months, and by 4 months is half that at the start of renal replacement therapy.
Figure 9.9 Hazard of death over three years from starting renal replacement therapy
Figure 9.10 Ratio of hazard of death over 3 years, above and below age 65 The ratio of hazard of death shown between those above and below age 65 is shown in figure 9.10. The number of patients in the later periods is small and the confidence intervals wide. Beyond 150 – 200 days the hazard ratio does not change significantly.
Hazard ratio in first 3 yearsAge >=65 v under 65
0
1
2
3
4
5
6
7
0 50 100 150 200 250 300 350 400 450 500 550 600 650 700 750 800 850 900 950
Days from start RRT
Haza
rd ra
tio
Hazard function for two age classes
0
0.001
0.002
0.003
0 100 200 300 400 500 600 700 800 900
Time (days)
Haza
rd
18 - 64LCL (18-64)UCL (18-64065 +LCL (65+)UCL (65+)

102
Survival in individual centres The survival of incident patients in individual centres is shown in figures 9.11 and 9.12. The results are age adjusted. As already discussed, the different hazard ratio between different age groups in the first 90 days and subsequent time renders it invalid to use the Cox proportional hazard method to make adjustments throughout the first year. Thus periods of 90 days and one year after 90 days have been used. In the absence of good co-morbidity date no adjustment can be made for co-morbidity. It thus not possible to attach significance to any apparent differences between centres.
Figure 9.11: Adjusted survival in the first 90 days in 1999 cohort
Figure 9.12: Adjusted survival in the first 1yr after 90 days in the 1999 cohort
Adjusted survival in the first 90 days in 1999 cohortadjusted to age 59.2 years
60
65
70
75
80
85
90
95
100
A 9 D 1 A 2 B 9 A 5 A 1 B 4 C 8 A 4 C 2 B 2 C 6 B 3 A 3 C 3 C 7 B 1 B 7 C 5 B 5 C 1 B 6
Centre
% s
urvi
val
n=2,058
Adjusted survival in the first 1yr after 90 days : 1999 cohortadjusted to age 58.3 years
50556065707580859095
100
C6 A2 A4 B5 A5 C7 A9 B4 C3 B2 B9 B1 A1 C8 B7 A3 C1 C2 C5 D1 B3 B6
Centre
% s
urvi
val
n = 1,994

103
First year survival by centre aged <65 and >65 years
Figure 9.13 First year survival patients aged <65 by centre The first year survival by centre from day 0 of starting renal replacement therapy is shown below. By showing survival separately for those aged under 65 and over 65 years it has not required an adjustment for age.
Figure 9.14 First year survival patients aged >65 by centre Changes in survival 1997 – 1999 by centre The 90-day survival for each individual centre was originally adjusted using the Cox proportional hazards model, to a standard age of 59.2 years. This was chosen as it was the median age of the patients starting RRT in England and Wales during 1997. This median age varies on a year-by-year basis. In addition the median age in 1997 of those surviving 1year after 90 days is slightly younger at 58.3 years, as more of the older patients die within the first 90 days. This produced a separate age to adjust survival to for the 1 year after 90 days. This year in the 1999 data we have kept to this method, although for the serial data we have adjusted both the 90 day and 1 year after 90 days data to the same age of 60 years. The age of 60 has been reached in agreement with several other international registries to standardise survival adjustment for comparative purposes. In future reports all comparative survival will be adjusted to this figure. Direct international comparison is still limited, as countries vary in the percentage of diabetic patients with poorer survival and ethnic minorities with better survival.
Survival in the first year aged < 65 by centre : 1999 cohort
40
50
60
70
80
90
100
B3 A4 A1 D1 B9 B2 C6 C1 C2 C3 B4 B5 B7 A9 B1 C8 C7 A5 A3 C5 A2 B6
Centre
% s
urvi
val
Survival in the first year aged >= 65 by centre : 1999 cohort
40
50
60
70
80
90
100
A2 B6 C7 C6 C3 A5 C4 A1 A3 B4 B5 A9 B7 B9 B2 B3 C8 C1 A4 C2 D1 B1 C5
Centre
% s
urvi
val

104
Figure 9.15 Survival 90 day 1997 -1999
Adjusted 90 day survival of all RRT patients in 1997 -1999adjusted for age 60
50
55
60
65
70
75
80
85
90
95
100
A1 A2 A3 A4 A5 A9 B1 B2 B3 B4 B5 B6 B7 B9 C1 C2 C3 C5 C6 C7 C8 D1 ZS E&WCentre
% s
urviv
al
1st plot point -19972nd plot point 19983rd plot point -1999

105
Figure 9.16 Survival 1 year after 90 days 1997-99
Adjusted 1yr after 90 day survival of all RRT patients in 1997 -1999adjusted for age 60
60
65
70
75
80
85
90
95
100
A1 A2 A3 A4 A5 B1 B2 B3 B4 B5 B6 B7 B9 C1 C2 C3 C5 C6 C7 C8 D1 Sct E&WCentre
% s
urvi
val
1st plot point -19972nd plot point 19983rd plot point -1999

106
Relationship of centre survival to population mortality To investigate whether the low 90 day survival rate was related to increased ‘local’ co-morbidity factors, data on ‘all cause mortality’ was obtained from the Office for National Statistics (ONS). The death rate for the local population by health authority was plotted against the 90-day and one year after 90 days survival of patients starting renal replacement therapy.
Figure 9.17 All cause population mortality v RRT survival There appeared to be no correlation between local population mortality rates and mortality rate on renal replacement therapy either at 90 days or 1 year after 90 days (figure 9.17).
Figure 9.18 Population cardiac mortality v RRT survival Figure 9.18 demonstrates no relation between the population cardiac mortality and survival at 90 days or 1 year after 90 days.
Survival v population cardiac mortality
70
75
80
85
90
95
100
1.5 1.6 1.7 1.8 1.9 2.0 2.1 2.2 2.3 2.4 2.5 2.6 2.7Cardiac deaths per1000 pop
Sur
viva
l
90 day1yr
Scotland
Survival v population all cause mortality
70
75
80
85
90
95
100
8.0 8.5 9.0 9.5 10.0 10.5 11.0 11.5 12.0Deaths all causes per1000 pop
Sur
viva
l
90 day1yr
Scotland

107
Chapter 10: Listing for Renal Transplantation This chapter was written in collaboration with UK Transplant and the British Transplantation Society. Summary This is a joint analysis of data held by UK Transplant and the Renal Registry. The time to listing for transplantation, and factors relating to this, were analysed in 4944 patients (2602 <65 years), from 34 renal units throughout the UK, who started renal replacement therapy during 1998 or 1999. Factors that significantly affected whether a patient was listed for transplant were: age (p<0.0001), primary renal disease (p<0.0001), and the size of the renal unit (p=0.0001), with large units listing patients more quickly. Gender and ethnicity of the patient and whether the dialysis hospital also has a transplant unit were not found to have a significant effect. Of the 2602 patients aged 18-64 years, 1110 (43%) were listed for transplantation within one year, 1347 (52%) within two years and 1406 (54%) by 2½ years. This compares with 3%, 4% and 5%, respectively, of those aged >64 years. Pre-emptive listing (listing before dialysis) occurred in 21% of adults under 35 years old, only 4% of adults aged 55-64, and vary rarely in those over 65. The chance of a patient less than 65 years old on dialysis being listed for transplant varied significantly between primary renal disease groups. It was as low for diabetes as renal vascular disease, and best for those with polycystic kidney disease and glomerulonephritis. Larger renal units were more likely to list patients than smaller ones (p<0.0001), and had higher rates of pre-emptive listing for transplantation. Introduction This work was carried out as a joint project with UK Transplant. Data have been analysed only for those centres on both the Renal Registry and the UK Transplant databases. UK Transplant holds the waiting list, recipient tissue typing data and donor information for patients waiting for, or having received, a renal transplant in the UK. Linking this data with the pre-transplant history, post-transplant failure data, and quarterly biochemistry and blood pressure data, collected by the Renal Registry provides a unique database. It is possible to analyse the whole Renal Replacement Therapy history of patients from participating centres in a longitudinal manner, and relate this to the events around renal transplantation. The first such analyses were presented in the 2000 report. With more centres joining the Registry it is anticipated that it will shortly be possible to develop substantially more detailed and comprehensive analyses for joint publication.

108
This chapter examines factors related to access to the national waiting list for renal transplantation. Listing for transplantation Figure 10.1, originally produced in the 2000 Registry Report, indicates that at any one time the majority of dialysis patients are not on the national transplant waiting list. Even in the 18-24 age group, 35% of dialysis patients are not registered on the national transplant waiting list. The time taken for new patients to be registered on the waiting list from first starting dialysis may significantly influence these data.
Figure 10.1: Waiting lists as a percentage of all dialysis patients Figure 10.1 only includes data from centres on the UK Renal Registry and is therefore an approximation for the UK. Patients listed for transplantation before needing dialysis but not yet dialysing were not included. The “all UK RR” numbers include those patients temporarily suspended from the waiting list. The Australian data, taken from the ANZDATA report, excludes suspended patients (personal communication).
Patients studied and statistical methods The Renal Registry, covering approximately 50% of the UK, reported 4944 patients (2602 <65 years) starting their first renal replacement therapy during 1998 or 1999. The databases of UK Transplant and the UK Renal Registry have been linked to obtain a unique dataset comprising data for 4944 adult renal dialysis patients and their associated listing dates where applicable. Using these data, the aim of this study was to investigate factors that influence whether a patient is listed for renal transplant on the national waiting list. Patients were from 34 dialysis units throughout the UK, 17 of which were also transplant centres. Factors included in the analysis were age at start of renal replacement therapy, primary disease, gender, ethnicity, and for the renal units renal replacement therapy
�������������������������������������������������������
����������������������������������������������������������������������������������������
�������������������������������������������������
����������������������������������������������������������������������
�����������������������������������
���������������������������������������������
�����������������������������������������������
����������������������������������������������������������������
���������
��������������������
�����������������������������������
��������
������
�����������������
0
10
20
30
40
50
60
70
% o
f Dia
lysi
s pa
tient
s
18 to 24 25 to 34 35 to 44 45 to 54 55 to 64 65 to 74
Age group
Waiting list as percentage of all dialysis patients by age group on 1/1/1999
active UK RRall UK RR����
���� Australia

109
prevalence rate and whether the renal unit has its own attached transplant service. Separate multifactorial logistic models were developed for patients aged less than 65 years and patients aged 65 years or older for the binary outcome listed/not listed. Cox’s proportional hazards regression models were fitted to analyse the combined effect of these factors. Factors influencing listing for transplantation Factors that significantly affected whether a patient was listed for transplant were: age (p<0.0001), primary renal disease (p<0.0001), and the size of the renal unit (p=0.0001). Gender and ethnicity of the patient and whether the dialysis hospital also has a transplant unit were not found to have a significant effect.
Age To analyse the effect of age on the time from starting renal replacement therapy to listing on the active transplant waiting list, Kaplan-Meier survival curves were constructed for patients grouped by age (see figure 10.2). Patients who died were censored at time of death. Those who were listed before starting dialysis were included with a time to listing of 0 days. Age was a major factor in determining the speed of listing for transplantation (figure 10.2). As expected, the percentage of patients listed decreased with increasing age over 34 years (p<0.0001), and listing took longer. Of the 2602 patients aged 18-64 years, 1110 (43%) were listed for transplantation within one year, 1347 (52%) within two years and 1406 (54%) by 2½ years. This compares with 3%, 4% and 5%, respectively, of those aged >64 years. Multifactorial analysis of the 2342 patients aged 65 or older showed primary disease and age to be significant.
Figure 10.2: Time to listing for adult patients.
Time to listing for adults starting dialysis 1998by age band
0%
10%
20%
30%
40%
50%
60%
70%
80%
90%
100%
0.00 0.25 0.50 0.75 1.00 1.25 1.50 1.75 2.00 2.25 2.50 2.75 3.00
Years
% o
f pat
ient
s no
t lis
ted
18-3435-4445-5455-6465+

110
Of patients aged 18-34, 21% were pre-emptively listed for transplantation, by age 55-64 this had fallen to 4%, and was very rare in those over 65. There appeared to be long delays in listing patients. The proportions in each age group finally listed by the time of this analysis were (in ascending age order) 86%, 75%, 77%, 42%, and 9%. In the 55-64 year old age group delays in listing for transplantation may be due to the need to investigate co-morbidity, particularly cardio-vascular disease and fitness for operation. This is unlikely to explain the delays in listing the younger patients.
Primary renal disease Age-adjusted results for the primary disease groups are shown in table 10.1: Primary disease No. of patients
starting dialysis
Relative chance of
listing
95% confidence
interval
P value
Aetiology uncertain/GN not proven (baseline)
470
1.0
Glomerulonephritis (GN) 349 1.7 1.2 – 2.3 0.002 Pyelonephritis 242 1.3 0.9 – 1.9 0.1 Diabetes 540 0.3 0.2 - 0.4 <0.0001 Renal Vascular Disease 78 0.3 0.2 – 0.6 0.0001 Hypertension 122 1.4 0.9 – 2.1 0.2 Polycystic kidneys 237 3.0 2.0 – 4.3 <0.0001 Other 360 0.3 0.2 - 0.4 <0.0001 Not reported 204 0.4 0.2 - 0.6 0.0001
Table 10.1: Primary renal disease and listing for transplantation – age adjusted. The chance of a patient less than 65 years old on dialysis being listed for transplant varied significantly between primary renal disease groups. It was low for diabetes and renal vascular disease, and highest for those with polycystic kidney disease and glomerulonephritis.
Characteristics of the renal unit It initially appeared that patients were more likely to be listed pre-emptively, and more quickly in renal units which were also transplant units. However, further analysis showed this to be related to the size of the renal unit, especially with regard to the number of patients under 65, and not to the presence of a transplant centre. Larger renal units were more likely to list patients than smaller ones (p<0.0001), and had higher rates of pre-emptive listing for transplantation (without preceding dialysis). The reason why larger renal units list more patients and list them more quickly are unclear. Whether this is due to pressure on dialysis facilities, more active clinical management, or other factors requires investigation. Future audit The reasons for the variations in time to listing need further understanding. Centre by centre analysis of the pre-dialysis work up for transplantation, and time to listing, show wide variation between centres and could form the basis of useful comparative audit of the performance and effectiveness of different renal units.

111
Chapter 11: Quality Assurance, Improvement and the NSF This year the national coverage is again increased. With recent developments there is the real prospect of complete national enrolment. The UK Renal Registry is now on a sound financial and organisational footing, and leads nationally in the area of audit and speciality-based data collection. The Registry has started the process of removing anonymity where the data are reliable. Each Annual Report has shown a different emphasis, while maintaining the core demographic and quality assurance data necessary for planning and comparative audit. The UKRR Reports have been a vehicle for the early publication of several pieces of work, on Renal Manpower, the Renal Review and now the HTA Satellite Dialysis Survey. These are important to prevent misconceptions both at individual units and the Department of Health, and is especially relevant in this first National Service Framework year. There is evidence about the validity of the Registry data. Comparison with the Renal Review data in the 2000 Report showed the demographic and clinical outcome data from the Registry to be representative of the UK as a whole. Successive Reports show consistent findings in the clinical variable distributions. Further progress at renal unit level has been made in recording patient ethnicity and co-morbidity, as demonstrated in this year’s document. A yet greater improvement is required, particularly if reliable comparative mortality data are to be presented in future. The agreement to progressively release the anonymity restrictions at renal unit level should act as a spur in this effort, since under-reporting of co-morbidity will always tend to portray unit outcomes in a worse light than necessary. Experience from undertaking Registry activities suggests that a more explicit and structured approach to quality assurance and improvement is required, in order to support the development of the Speciality in the light of audit data and the Standards Document. The Registry itself is not mandated or resourced to translate its findings into action at Unit clinical level. This problem is clearly illustrated by the persisting weakness of the data on dialysis dose (URR), because of indeterminate post-dialysis sampling methods. It is not currently the task of any particular renal group to consider Registry findings and then influence the clinical community to improve methodology and outcomes. While it may be more comfortable to leave such a default, given the many day to day pressures with which clinicians grapple, it will be hard to maintain the initial impetus of the Registry, and its support, if the findings are not fully employed to improve and develop management of renal patients. The UK, through the Registry, has a unique potential in Europe to translate this national effort into continuing quality improvement at the level of patient outcomes. Further consideration of the structures of the audit cycle will be required to capitalise on this lead position. A National Service Framework for renal services is in process of production. This is therefore a very important year for the UK renal community. This report, should contribute significantly to the NSF and the further development of the Speciality. If appropriately resourced, the database should in future be pivotal in the monitoring and development of the NSF.

112

113
Appendix A: The Renal Registry Rationale 1. Executive summary 2. Introduction 3. Statement of intent 4. Relationships of the renal registry 5. The role of the Renal Registry for nephrologists 6. The role of the Renal Registry for trust managers 7. The role of the Renal Registry for commissioning agencies 8. The role of the Renal Registry National Quality Assurance schemes 9. The role of the Renal Registry for patients. 10. Abbreviations 11. References A:1 Executive summary 1.1 The Renal Registry has been established by the Renal Association to act as a resource in the development
of patient care in renal disease. 1.2 The Registry will act as a source of comparative data for Audit/Benchmarking, Planning, Policy and
Research. The collection and analysis of sequential biochemical and haematological data will be a unique feature of the Registry.
1.3 Agreements will be made with participating renal centres which ensure a formal relationship with the
Registry and safeguard confidentiality 1.4 The essence of the Agreement will be the acceptance of the Renal Registry Data Set Specification as the
basis of data transfer and retention. 1.5 Data will be collected quarterly to maintain Unit-level quality assurance, with an annual report and six
monthly Unit Reports. 1.6 Ultimately activity will have to be self-funded by capitation of renal patients from commissioning
agencies. 1.7 The Registry is likely, with the express agreement of participants, to become responsible for providing
data to Trusts, Commissioning Authorities and Regional Offices, and the new ERA-EDTA Registry. 1.8 The development of the Registry will be open to influence from all interested parties, including
Clinicians, Trusts, Commissioning Authorities and Patient Groups. 1.9 The Registry has charitable status through the Renal Association.

114
A:2 Introduction 2.1 Registry-based National Specialty Comparative Audit is likely to be one of the cornerstones of NHS
development. “The National Renal Review” published in 1995 recommended participation of renal units in comparative audit (1). Chief Executives are now responsible for Clinical Governance and comparative audit at national level will be an essential part of this agenda, (2). The UK Renal Registry will facilitate such audit. This audit demands regular transmission of large volumes of data, which has become possible with developments in electronic data handling. The Scottish Renal Registry, established with financial support from the Scottish Office, demonstrated the practicalities of electronic data collection in a UK renal environment.
2.2 The need for careful comparative audit is likely to be confirmed through the development of Government
Agencies, such as the National Institute for Clinical Excellence (NICE) and the Centre for Health Improvement (CHIMP). The final relationship of the Registry to these organisations as they develop is yet to be defined.
2.3 Demographic information on patients receiving Renal Replacement Therapy (RRT) throughout Europe
was collected from 1965 in the Registry of the European Dialysis and Transplant Association (EDTA). This voluntary exercise was conducted on paper and by post, demanded considerable effort and time from participating units, and eventually proved impossible for many UK renal units. In recent years the incompleteness of UK data returns to EDTA has meant that it was not possible to build a picture of activity RRT in the UK for planning and policy purposes, although three ad hoc national data collections from England and Wales were solicited from renal centres in 1992, 1996 and 1999. The Registry will meet this need for demographic and economic data necessary for effective planning.
2.4 Together with the need to know the demographic and economic elements of the Health Service has
developed a need to underpin clinical activity more rigorously through the scientific evidence base (for example the Cochrane Initiative) and by quality assurance activity through audit. These initiatives require comprehensive information about the Structures Processes and Outcomes' of RRT, which go well beyond the detail previously compiled by EDTA.
2.5 The Registry is recognised as one of the few High Quality Clinical Databases available for general use
(3). 2.6 The aspiration for renal services to be provided within a National Service Framework (NSF) is
underpinned by the development of the Renal Registry (A First Class Service: Quality in the new NHS) (4). Although the Department of Health has no immediate plans for a NSF for renal services, the Renal Alliance, a group comprising patients, nephrologists and representatives of other groups involved with renal care, is in the process of developing a shadow NSF. Input from the Renal Registry will be an important feature of the Framework.
2.7 Similar cultural pressures have more recently affected all clinical disciplines, so that Registries are
implemented or planned in cardiac surgery, intensive care, diabetes etc. 2.8 The Renal Association has made a start in the area of Audit by publishing guidelines in 'Renal Standards'
documents. It was apparent during the development of the guidelines that many criteria of clinical performance were uncertain or unknown, and that only the accumulated data of practising renal units could provide the evidence for advice on best practice and what might realistically be achieved. A common data registration provides the simplest device for such comparative audit.
2.9 The recent emphasis on Evidence Based Practice is being supported by the changes in research funding
(Culyer Report), which lean towards collaborative projects and include both basic science and 'Health Services Research' components. It is apparent that a RRT database could be invaluable to a wide range of research studies
2.10 It can be seen that the need for a Registry of RRT has developed for a variety of reasons; international
comparisons, national planning, local Trust and Health Authority management, standard setting, audit, and research. The opportunity for data gathering partly arises from improvements in information technology. While it was possible to see the need for a national renal database a decade and a half ago, the circumstances are now ideal for the maintenance of a data repository for all the purposes described

115
above, supported by the clinical users and resourced for national benchmarking as a routine part of RRT management.
A:3 Statement of intent The Renal Registry provides a focus for the collection and analysis of standardised data relating to the incidence, clinical management and outcome of renal disease. Data will be accepted quarterly according to the Renal Registry Data Set Specification (RRDSS) by automatic downloading from renal centre databases. There will be a core data set, with optional elements of special interest which may be entered by agreement for defined periods. A Report will be published annually to allow comparative audit of facilities, patient demographics, quality of care and outcome measures. Participation is voluntary but the expectation is that all UK renal and transplant units will take advantage of the database by their involvement ultimately. There will be an early concentration on RRT, including transplantation, with an extension to other nephrological activity at a later date. The Registry will provide an independent source of data and analysis on national activity in renal disease.
A:4 Relationships of the Renal Registry 4.1 The Registry is a registered Charity through the Renal Association (No. 800733). It was established by
a sub-committee of the Renal Association, with additional representation from the British Transplantation Society (BTS) the British Association for Paediatric Nephrology (BAPN), and the Scottish Renal Registry. There is cross representation with the Renal Association Standards and Clinical Trials Committees. The Registry has a Chairman and Secretary nominated by the Renal Association. The Registry has an observer from the Department of Health, and participants from the National Federation of Kidney Patients Associations and Health Care Commissioners.
4.2 It is anticipated that there will be a need for the development of a number of sub-committees as the
database and participation enlarges, particularly for data analysis and interpretation. 4.3 The Scottish Renal Registry sends data to the Renal Registry for joint reporting and comparison 4.4 It is anticipated that the return of English, Welsh and Northern Irish data to the EDTA registry will be
through the Renal Registry. The Scottish Renal Registry already sends data to ED . 4.5 A paediatric database has been developed in collaboration with the Renal Registry, and the two databases
are compatible. Data from paediatric renal units will be entered on the database, which will allow long-term studies of renal cohorts over a wide range of age.
4.6 The basis of participation for Renal Units nationally will be an Agreement to accept the Renal Registry
Data Set Specification for the transmission and retention of data. This will consist of a core data set of some 200 items and further optional elements, which will be returned on a special understanding with the unit for a defined period of reporting. The Agreement will specify the conditions of participation and guarantee Unit anonymity until there is general agreement to disclosure of Unit identity. The responsibilities of the Unit and Registry are clarified in the clauses of the Agreement, as well as the conditions of publication of data. The recent Data Protection Act may have implications for the Registry (5), but the Department of Health has indicated that Registry activity may continue in its present form pending further discussion and clarification of the act.
A:5 The role of the Registry for nephrologists 5.1 The clinical community have become increasingly aware of the need to define and understand their
activities, particularly in relation to national standards and other renal units.
5.2 The Registry is run by a sub-committee of the Renal Association and therefore by colleagues with similar concerns and experience.
5.3 The Renal Standards documents are designed to give a basis for unit structure and performance, as well
as patient-based elements such as case-mix and outcomes. It is anticipated that Standards will become

116
increasingly based on research evidence and the Cochrane Collaboration has resourced reviews of renal topics recently, which will support the conversion from clinical anecdote.
5.4 The registry data will be available to allow comparative review of many elements of renal unit practice.
Data will be anonymised and presented to allow a contrast of individual unit activity and results against national aggregated data.
5.5 Reports of demographic and treatment variables will be available to the participating centres for
distribution to Trust, Health Authorities and Regional Offices as required and agreed with the Unit. Reports should facilitate discussion between clinicians, Trust officers and Commissioners.
5.6 Customised data reports can be made available by agreement with the Registry sub-committee. A
donation to cover any costs incurred will be requested.
5.7 The Registry committee will welcome suggestions for topics of national audit or research which colleagues feel are of sufficient widespread interest for the Registry to undertake.
5.8 The database has been designed to provide research database facilities for future participation in national
and international trials. Members of the Renal Association and other interested parties are welcome to apply to the Registry sub-committee to conduct local or national audit and research using the database. All such projects will need the agreement of the Registry sub-committee, and any costs involved must be met by the applicants.
5.9 These facilities will only be sustainable through co-operation between nephrologists and the Registry.
There is a need for high quality and comprehensive data entry at source. Attention will be necessary to the conditions listed in formal Agreements with the Registry.
A:6 The role of the Registry for Trust Managers 6.1 As the basis of the Clinical Governance initiative, the gathering and registration of data relating to patient
management is regarded as an essential part of routine patient management in the health service.
6.2 One of the principles of health service informatics is that the best data are acquired from clinical information recorded at the point of health care delivery.
6.3 Renal Services data entered on local systems by staff directly engaged with patients is likely to be of the highest quality, and it is this that the Registry intends to capture.
6.4 The Registry will provide a cost-effective source of detailed information on renal services.
6.5 The regular reports of the Registry will supply the details of patient demographics, treatment numbers and changes, treatment quality and outcomes. Data will be compared with national standards and national performance for benchmarking and quality assurance. The assessment of contract activity and service delivery will be possible through the data returns without the need for further, costly Trust or commissioner administrative activity. These data should be particularly valuable to Contracts Managers and those responsible for Clinical Governance.
6.6 Data will be available on Unit case mix, infrastructure and facilities.
6.7 It is anticipated that data on patients with renal disease other than those requiring RRT will become available in time.
6.8 It is anticipated that Trust interests will ultimately be served by the participation of a national trust representative in the management body of the Registry as Registry activity expands.
A:7 The role of the Registry for Commissioners of health care

117
7.1 The Commissioners of health care are taken to include Regional Specialty Commissioning Groups and those supporting them, Primary Care Groups (PCGs) and Health Authorities.
7.2 The use of information sources such as the Registry is advised in the National Renal Review so as to
promote benchmarking and quality assurance on renal programmes. The comprehensive tracking of relatively small but costly renal cohorts should be regarded as a routine part of case management.
7.3 The Registry will be able to provide validated, comparative reports of renal unit activity on a regular
basis to participating centres. These will allow assessment of unit performance in a wide range of variables relating to 'Structure, Process and Outcome' measures.
7.4 There are economies of scale in the performance of audit through the Registry, since multiple local audits
will no longer be required. 7.5 The incidence of RRT treated locally will be apparent from new patient registrations. Mortality and renal
transplant rates should also be of interest. The geographical origin of ESRF cases will be indicated by postcode data, which allows the assessment of referral and treatment patterns. This information will allow the expression of geographical and ethnic variations. These data will indicate unmet need in the population and permit judgements of the equity of service provision. The future Registry database should give information on nephrology and pre-dialysis patients, which will allow prediction of the need for RRT facilities.
7.6 Registry data will be used to track patient acceptance and prevalence rates over time, which will allow the
modelling of future demand and validation of predictions. 7.7 Information on the clinical diagnosis of new and existing RRT patients will point to areas where possible
preventive measures will have maximal impact. 7.8 The results of higher acceptance rates in the elderly and the consequences of increasing demand from
ethnic groups bearing a high prevalence of renal, circulatory and diabetic disease will be measurable. 7.9 Comparative data will be available in all categories for national and regional benchmarking. 7.10 The Registry offers independent expertise in the analysis of Renal Services data and their interpretation, a
resource that is widely required but difficult to obtain. 7.11 The cost of supporting the Registry is estimated at between £10 and £15 per registered patient per annum,
which is less than 0.05% of the typical cost of a dialysis patient per annum. It is expected that the costs will need to be explicit in renal services contracts so as to ensure the continuation of the Registry on a sound basis.
7.12 The Registry sub-committee now includes a representative of health care commissioners, which allows an
influence on the development of the Registry and the topics of interest in data collection and analysis. A:8 The role of the Registry for national quality assurance agencies 8.1 The role of the Registry in national QA as developed through NICE and CHImp will depend on decisions as
to the roles of those agencies (6). 8.2 The demographic, diagnostic and outcomes data could support the investigation of clinical effectiveness in a
variety of ways, depending on the focus of interest. 8.3 There may be pressure from some quarters to publish reports in which renal units are clearly identified. The
maintenance of Unit anonymity is likely to be important to some, and it may compromise cooperation significantly if abrogated without agreement. Ultimately it is possible that a decision could be forced on the Registry from outside, although it is hoped this situation will not arise. Consideration of this issue in particular would be welcome in nephrological circles, with correspondence to the Registry Sub-Committee.

118
A:9 The role of the Registry for patients The ultimate aim of the Registry is to improve care for patients with renal disease. Appropriate use of the registry information should improve equity of access to care, adequacy of facilities, availability of important but high cost therapies such as erythropoietin, and appropriate and efficient use of resources. The continuing comparative audit of the quality of care should facilitate improvement of care and outcomes of care. It is intended to identify and publish examples of good practice. In these ways patients will be the ultimate beneficiaries of the exercise.
A:10 Abbreviations
ARF Acute Renal Failure BAPN British Association of Paediatric Nephrology BTS British Transplantation Society CCL Clinical Computing Limited CHImp Commission for Health Improvement EDTA European Dialysis and Transplant Association ERA European Renal Association ESRF End Stage Renal Failure HCFA USA Health Care Finance Administration NFKPA National Federation of Kidney Patients’ Associations NHS National Health Service NICE National Institute of Clinical Excellence PCG Primary Care Group RRDSS Renal Registry Data Set Specification RRT Renal Replacement Therapy UKTSSA United Kingdom Transplant Support Service Authority USRDS United States Renal Data System
A:11 References 1. NHS Executive. Review of Renal Services in England 1993-4. London: Department of Health 1996.Black
N. High-quality clinical databases: breaking down barriers. Editorial. Lancet 1999; 353:1205-1206. 2. Black N. Clinical Governance: fine words or action? Br Med J 1998;316:297-298. 3. Black N. High-quality clinical databases: breaking down barriers. Editorial. Lancet 1999; 353:1205-1206. 4. NHS Executive. A First Class Service: Quality in the New NHS. London: Department of Health 1998. 5. Office of the Data Protection Registrar. The Data Protection Act 1998: an introduction. Wilmslow: Office
of the Data Protection Registrar, 1998. 6. Rawlins M. In pursuit of excellence: the National Institute of Clinical Excellence. Lancet 1999;353:1079-
1082.

119
Appendix B: Definition, statistical methodology, analysis criteria Definitions of analysis quarters
Quarter Dates
Quarter 1 1 January – 31 March
Quarter 2 1 April – 30 June
Quarter 3 1 July – 30 September
Quarter 4 1 October – 31 December
The quarterly biochemistry data are extracted from renal unit systems as the last data item stored for that quarter. If the patient treatment modality is haemodialysis, the software will try to select a pre-dialysis value. Renal Registry modality definitions
Home haemodialysis A home haemodialysis patient ceases to be classed as such, if they need greater than 2 weeks of hospital dialysis when not an inpatient.
Satellite dialysis unit
A renal satellite unit is defined as a haemodialysis facility which is linked to a main renal unit and not autonomous for medical decisions, and which provides chronic out patient maintenance haemodialysis, but with no acute or in-patient nephrology beds on-site
Treatment modality at 90 days This is used by the USRDS and is the modality that the patient is on at day 90 regardless of any changes from the start. It is a general indicator of initial dialysis, but could miss failed CAPD. This would also miss patients intended for home haemodialysis, who will not be home yet. This is modality is calculated by the Registry, which allows the definition to be changed.
Start of end stage renal failure This is defined as the date of the first dialysis (or of pre-emptive transplant). If a patient is started as ‘Acute’ renal failure and does not recover the date of start of renal replacement should be backdated to the start of acute dialysis. If a patient is started on dialysis and dialysis is temporarily stopped for under 90 days for any reason (including access failure and awaiting formation of further access) except recovery of

120
renal function the date of start of RRT remains the date of first dialysis. If they stopped for longer than 90 days they are classed as recovered. Analysis criteria
Definition of the Take-On population (Incidence) The take-on population in a year included patients who later recovered from ESRF after 90 days from the start of treatment. Patients newly transferred into a centre who are already on renal replacement therapy (RRT) are excluded in the take on population for that centre. Patients restarting dialysis after a failed transplant are also excluded (unless they started RRT in that current year). Since patients who restarted RRT after recovering from ESRF, are included in the take-on population the following scenarios can occur:- A patient may start RRT in 1999, recover and then restart RRT in 1999. These patients are counted twice in the analysis providing they have been receiving RRT for greater than 90 days on each occasion. Patients who started treatment at a centre and then transferred out soon after receiving treatment are counted at the original centre for all analyses of treatment on the 90th day.
Definition of the Prevalent population This is calculated as all patients that are alive on 31st December and includes the incident cohort for that year alive on that date.
Death rate calculation The death rate per 100 patient years was calculated by counting the number of deaths and dividing by the person years exposed. This includes all patients, including those who died within the first three months of therapy. The person years at risk was calculated by adding up for each patient the number of days at risk (until they died or transferred out) and dividing by 365.
Odd Ratio Odds of dying :-
Probability of dying for someone with a phosphate of 1.71-2.10 mmol/L probability of surviving for someone with a phosphate of 1.71 –2.10 mmol/L
Odds ratio is the odds of dying with a phosphate of 1.71-2.10 odds of dying in the reference group
Hazard Function The hazard function is the probability of dying in a short time interval considering survival to that interval.

121
Hazard ratio Probability of dying in the next interval for a phosphate of 1.71-2.10 mmol/L
probability of dying in the next interval for a phosphate in the ref range
Survival analyses of prevalent cohort These analyses exclude the current years incident cohort
Criteria for analysis by treatment modality in a quarter The following quarterly entries were included and excluded: - Patients on haemodialysis with a treatment centre of ‘elsewhere’ were removed. It should be noted that there were some patients on transplant with a treatment centre of ‘Elsewhere’. These patients were included. Entries for which the hospital centre was not the primary treatment centre were removed from the analysis of data for that centre. Patients who had been on RRT for less than 90 days were removed. (by definition of ESRF) There were a few exceptions to these rules:- 1. If a patient's initial entry on the treatment time line contained a 'transferred in' code, then
the patient was assumed to have been on RRT for longer than 90 days, since the patient must have started RRT earlier than this elsewhere. Therefore, patients with an initial entry on the treatment timeline with a 'transferred in' code were included for all quarters. For example, a patient with an initial treatment modality of 'transferred in' on the 1st March 1999, would be included for quarter 1/99, even though the number of days on RRT would be calculated as 30 days.
2. For patients who recovered renal function, for a period of time, then went into ESRF, the
length of time on RRT was calculated from the day the patient restarted RRT. For example, for a patient with an initial treatment start date of the 1st March 1999, who recovered on the 1st June 1999 and then resumed RRT again on the 1st November 1999, the number of days on RRT would be calculated from the 1st November 1999. The patient would be excluded from the analysis for quarter 4/99, since on the 31st December 1999, they only would have been on RRT for 60 days. The patient would be included in the analysis from quarter 1/2000 onwards.
Patients who had transferred out or stopped treatment without recovery of function before the end of the quarter, were excluded.
Criteria for analysis of biochemistry in a quarter The analysis used information from the quarterly treatment table. In addition to the treatment modality criteria listed above, patients with the following quarterly entries were also excluded: -
1. Patients who had 'transferred in' to the centre in that particular quarter were excluded. For example, if a patient transferred in on the 1st March 99, then the

122
patient was excluded from that biochemistry analysis of the centre they transferred to in that quarter.
2. Patients who had changed treatment modality in that particular quarter were excluded
Treatment modality on day 90 of starting RRT This is obtained from the treatment modality of the take-on population after 90 days of being on RRT. For this reason patients who started treatment between 1/10/98 and 31/9/99 were used in this analysis. The sample used was that defined by the take-on population. Patients are counted at their take-on hospital centre rather than at their hospital centre on day 90. This is important since some patients had transferred out of their initial hospital centre by day 90. Patients who died before they reached 90 days are excluded.
One year survival of the take-on population The sample used was the same as that defined for the take-on population except for recovered renal function patients, who were excluded. Patient's who transferred out of their initial treatment centre, were censored on the day they transferred out if there was no further information in the timeline.
Analysis of one year survival of prevalent patients The death rate within year was calculated separately for the patients established on dialysis and with a functioning transplant on 1st January 1999. As there is an increased death rate in the first six months following transplantation, patients were only included in the analysis if they had not received a transplant between 1st July 1999 and 31st December 1999. For the same reason patients who received a transplant within the year were censored at the time of transplantation. The sample criteria thus became:
1. Patients who had been receiving renal replacement therapy for more than 90 days on 1/1/99.
2. Patients who had a transplant between 1/7/98 and 31/12/98 were excluded
3. Patients who transferred into a Registry centre were excluded if information was not available to confirm that they had not received a transplant between 1/7/98 and 31/12/98.
4. The few patients who recovered renal function in 1999 were excluded.
5. Patients who transferred out of a Registry centre to a non-Registry centre were censored at that date

123
6. A transplant patient whose transplant failed was censored at the time of restarting dialysis, and dialysis patients who received a transplant were censored at the time of transplant.
7. Patients who died, received a transplant, or transferred out on 1/1/99 were included and were counted as being at risk for one day.
8. Patients who died on the day of the transplant were censored on this day, rather than counted as a dialysis death.

124

125
Appendix C: Data Protection and the UK Renal Registry in 2002 Introduction The political and social context of data management has changed since the UK Renal Registry was established. In particular, there has been growing concern that the NHS should become more ‘patient-centred’. In addition, the benefits of data collection for science and research are no longer assumed to be self-evident and need to be demonstrated outside the medical arena. Whenever patient identification is a necessary component of the research or data collection it has become important to obtain informed consent. This has ethical and legal considerations. Although the formal position has evolved with the Data Protection and Human Rights Acts of 1998 certain circumstances have suggested the need for further legislation. For example, very large research exercises make consent impractical to obtain, the condition of some patients makes consent impossible, and the bias introduced by selective refusal/omissions might make data un-interpretable. European Law -Directive 95/46/EC This law relates to the protection of individuals with regard to the processing of personal data and on the free movement of such data. 1) Member States shall prohibit the processing of personal data revealing racial or ethnic origin, political opinions, religious or philosophical beliefs, trade-union membership, and the processing of data concerning health or sex life. Paragraph 1 shall not apply where processing of the data is required for the purposes of preventive medicine, medical diagnosis, the provision of care or treatment or the management of health-care services, and where those data are processed by a health professional subject under national law or rules established by national competent bodies to the obligation of professional secrecy or by another person also subject to an equivalent obligation of secrecy. The EU law therefore excludes collection of medical information from the data protection laws. The Health and Social Care Act 2001 (England & Wales) In England & Wales, Section 60 of the Health and Social Care Act 2001 provides discretionary powers to the secretary of state ensuring that the patient identifiable information needed to support essential NHS activity can be used without the individual consent of patients. The powers can only be used to support medical purposes that are in the interests of patients or the wider public, where consent is not a practicable alternative and where anonymised information will not suffice. The decisions are to be reviewed annually. An effort towards obtaining consent or the development of patient anonymity is expected of any group seeking to use Section 60.

126
The Patient Information Advisory Group (PIAG). has been established as the advisory mechanism to the secretary of state. Because of the numerous activities that might require consideration, it has been anticipated that broad classes of exceptions will be formulated, with only a limited number of applications requiring detailed PIAG consultation. The Registry hopes that one such class might encompass generic, registry-type, data collection. The UK Renal Registry has submitted its application to PIAG for consideration of exemption from the need to seek individual patient consent. The Registry Case The Registry is the cornerstone of monitoring renal replacement therapy in Britain. Involvement of all UK renal units is confidently expected within the next few years. This has been mandated by advice from the Department of Health to Health Authorities. The Registry is funded by a capitation fee from health authorities, endorsed by the Department. The annual Reports are the basis of assessment for health provision, management and outcomes in renal disease nationally. The accurate demographic and quality performance data will be one foundation of the renal National Service Framework which is currently under development. The evidence of treatment distribution is critical to ensure the developing NHS agenda on equity of patient access. These clinical data are the basis of national comparative audit and quality improvement initiatives that are equal to, or in advance of, any developments in other medical specialities. It is hoped that these benefits of the Registry will be recognised as being sufficiently important to invoke the term ‘essential NHS activity’ thus enabling the secretary of state to use his discretionary powers (Section 60, Health & Social Care Act). There are over 37,000 patients on the Registry database. Some will have been identified retrospectively after an acute presentation, others may have been unable to give consent through incapacity of one kind or another. The need for patient identification hinges on the need to track the course of treatment between renal dialysis and transplant units. If any compelling example of this need were required, the demise of the previous European Renal Registry was in part because of the intractable difficulties of following patients during transitions of treatment, with a huge ‘lost to follow up’ cohort. The Renal Registry will be at the heart of the Renal NSF and supplies crucial information to government about an expanding and resource-intensive service. Patient identification is required for data validation. The way forward The principles of data protection are scrupulously observed at the Registry and only those directly involved in data validation and analysis have access to patent-identifiable material. Nevertheless, it is necessary to explore how individual patient consent can best be obtained. This might involve a single Registry-solicited enrolment at the start of renal treatment. It is also important to establish, perhaps from data already available, what bias would be introduced were selective refusal to consent a factor. The suggestion that receiving NHS treatment for renal disease should carry an obligation to individuals to provide consent is not widely supported. A formula for satisfying all the ethical and legal issues may yet develop

127
from other experience of the practicalities of NHS data collection. It should be noted that other applications of the Registry database would have to be examined on their merits and the availability of the data for all purposes, such as identification of patients for research, cannot be assumed. The current Renal Registry data collection has continued in the confidence that existing data protection procedures, apart from consent, are well established and that the case for exception under the Clause 60 provisions will have a prima facie validity. The Registry anticipates detailed examination of its submission to PIAG, while the possibility of obtaining consent is examined further within the discipline.

128

129
Appendix D: Renal services described for non-physicians (reproduced from the Renal Association Standards document)
This appendix is taken from the Renal Association Standards document and provides background information on renal failure and discusses the services available for its treatment. Chronic renal failure
1. In chronic irreversible renal failure, the kidneys are slowly destroyed over months or years. To begin with there is little to see or find, and this means that many patients present for medical help very late in their disease, or even in the terminal stages. Tiredness, anaemia, a feeling of being 'run down' are often the only symptoms. However, if high blood pressure develops, as often happens when the kidneys fail, or is the prime cause of the kidney disease, it may cause headache, breathlessness and perhaps angina. Ankle swelling may occur if there is a considerable loss of protein in the urine.
2. Progressive loss of kidney function is often described as chronic renal insufficiency when
in its early stages, chronic renal failure when it becomes obvious, and end stage renal failure when it reaches its terminal stage. At this point, if nothing is done, the patient will die. Two complementary forms of treatment, dialysis and renal transplantation are available and both are needed if end stage renal disease is to be treated.
3. The incidence of end stage renal failure rises steeply with advancing age. Consequently
an increasing proportion of patients treated for end stage renal failure in this country are elderly and the proportion is even higher in some other developed countries. Evidence from the United States suggests that the relative risk of end stage renal failure in the black population (predominantly of African origin) is two to four times higher than for whites [US Renal Data System 1993]. Data collected during the review of renal specialist services in London suggest that there is in the Thames regions a similar greater risk of renal failure in certain ethnic populations (Asian and Afro-Caribbean) than in whites [Roderick et al 1994]; this is supported by national mortality statistics [Raleigh et al 1996]. people from the Indian subcontinent have a higher prevalence of non-insulin dependent diabetes, and those with diabetes are more likely than whites to develop renal failure. This partly explains the higher acceptance rate of Asians on to renal replacement programmes.
Causes of renal failure
4. Most renal diseases that cause renal failure fall into a few categories.:-
I. Auto-immune disease. 'Glomerulonephritis' or 'nephritis' describes a group of diseases in which the glomeruli (the filters that start the process of urine formation) are damaged by the body's immunological response to tissue changes or infections elsewhere. Together, all forms of nephritis account for about 30% of renal failure in Britain. The most severe forms are therefore treated with medications that suppress the immune response, but treatment makes only a small impact on the progress of this group of patients to end stage renal failure
II. Systemic disease. Although many generalised diseases such as systemic lupus, vasculitis, amyloidosis and myelomatosis can cause kidney failure, by far the most important cause is diabetes mellitus (about 20% of all renal disease in many countries). Progressive kidney damage may begin after some years of diabetes, particularly if the blood sugar and high blood pressure have been poorly controlled. Careful lifelong supervision of diabetes has a major impact in preventing kidney damage.
III. High' brood pressure. Severe ('accelerated') hypertension damages the kidneys, but the damage can be halted — and to some extent reversed — by early detection and early treatment of high blood pressure. This is a common cause of renal failure in patients of African origin.
IV. Obstruction. Anything that obstructs the free flow of urine can cause back-pres-sure on the kidneys. Much the commonest cause is enlargement of the prostate in elderly men; although only a small proportion of them develop kidney failure,

130
prostatism is so common that it becomes a major cause of renal failure over the age of 70 [Feest et al 1990, 1993].
V. Infection of urine. Cystitis is a very common condition, affecting about half of all women at some time in their lives, but it rarely has serious consequences. However, infection of the urine in young children or patients with obstruction, kidney stones or other abnormalities of the urinary tract may result in scarring of the kidney and eventual kidney failure.
VI. Genetic disease. One common disease, polycystic kidneys, and many rare inher-ited diseases affecting the kidneys account for about 8% of all kidney failure in Britain. Although present at birth, polycystic kidney disease often causes no symptoms until middle age or later. Understanding of its genetic basis is rapidly advancing and may lead to the development of effective treatment.
VII. Disease of renal blood vessels. This is being more and more frequently recognised as a cause of renal failure, both acute and chronic. It is especially common in patients aged more than 65 years.
Co-morbidity 5. Renal failure is often accompanied by other disease processes. Some are due to the
primary disease, e.g. diabetes may cause blindness and diseases of the nerves and blood vessels. Others, such as anaemia, bone disease and heart failure, are con sequences of the renal failure. Coincidental diseases such as chronic bronchitis and arthritis are particularly common in older patients with renal failure. All these conditions, collectively called co-morbidity, can influence the choice of treatment for renal failure and may reduce its benefits. Expert assessment of the patient before end stage renal failure can reduce co-morbidity and increase the benefit and cost effectiveness of treatment. Thus early detection and referral of patients at risk of renal failure is important. Studies in France and in the United States showed that the mortality rate among patients aged over 55 years at the start of regular dialysis increased dramatically if dialysis was started late in the illness [Jungers et al 1993; Byrne et al 1994]
Renal replacement therapy
6. The term renal replacement therapy is used to describe treatments for end stage renal failure in which, in the absence of kidney function, the removal of waste products from the body is achieved by dialysis and other kidney functions are supplemented by drugs. The term also covers the complete replacement of all kidney functions by transplantation.
Renal dialysis 7. Dialysis involves the removal of waste products from the blood by allowing these
products to diffuse across a thin membrane into dialysis fluid, which is then discarded along with the toxic waste products. The fluid is chemically composed to draw or "attract' excess salts and water from the blood to cross the membrane, without the blood itself being in contact with the fluid.
Haemodialysis 8. The method first used to achieve dialysis was the artificial kidney, or haemodialysis.
This involves the attachment of the patient's circulation to a machine through which fluid is passed, and exchange can take place. A disadvantage of this method is that some form of permanent access to the circulation must be produced to be used at every treatment. Each session lasts 4-5 hours and is needed three times a week.
Peritoneal dialysis
9. The alternative is peritoneal dialysis, often carried out in the form of continuous ambulatory peritoneal dialysis (CAPD). In this technique, fluid is introduced into the peritoneal cavity (which lies around the bowel) for approximately 6 hours before withdrawal. The washing fluid must be sterile in order to avoid peritonitis (infection and inflammation of the peritoneum), which is the main complication of the treatment. A silastic tube must be implanted into the peritoneum and this may give problems such as kinking and malposition. Each fluid exchange lasts 30-60 minutes and is repeated three or four times daily. Neither form of dialysis corrects the loss of the hormones secreted by the normal kidney so replacement with synthetic erythropoietin and vitamin D is often necessary.
Renal transplantation
10. Renal transplantation replaces all the kidney's functions, so erythropoietin and vitamin D supplementation are unnecessary. A single kidney is placed, usually in the pelvis close to the bladder, to which the ureter is connected. The kidney is attached to a nearby artery and vein The immediate problem is the body's acute rejection of the foreign graft which

131
and vein. The immediate problem is the body's acute rejection of the foreign graft, which has largely been overcome during the first months using drugs such as steroids and cyclosporin. These drugs, and others that can be used for that purpose, have many undesirable side effects, including the acceleration of vascular disease, so myocardial infarcts and strokes are commoner in transplant patients than in age-matched controls. During subsequent years there is a steady loss of transplanted kidneys owing to a process of chronic rejection; treatment of this is quite unsatisfactory at the moment, so many patients require a second or even a third graft over several decades, with further periods of dialysis in between.

132
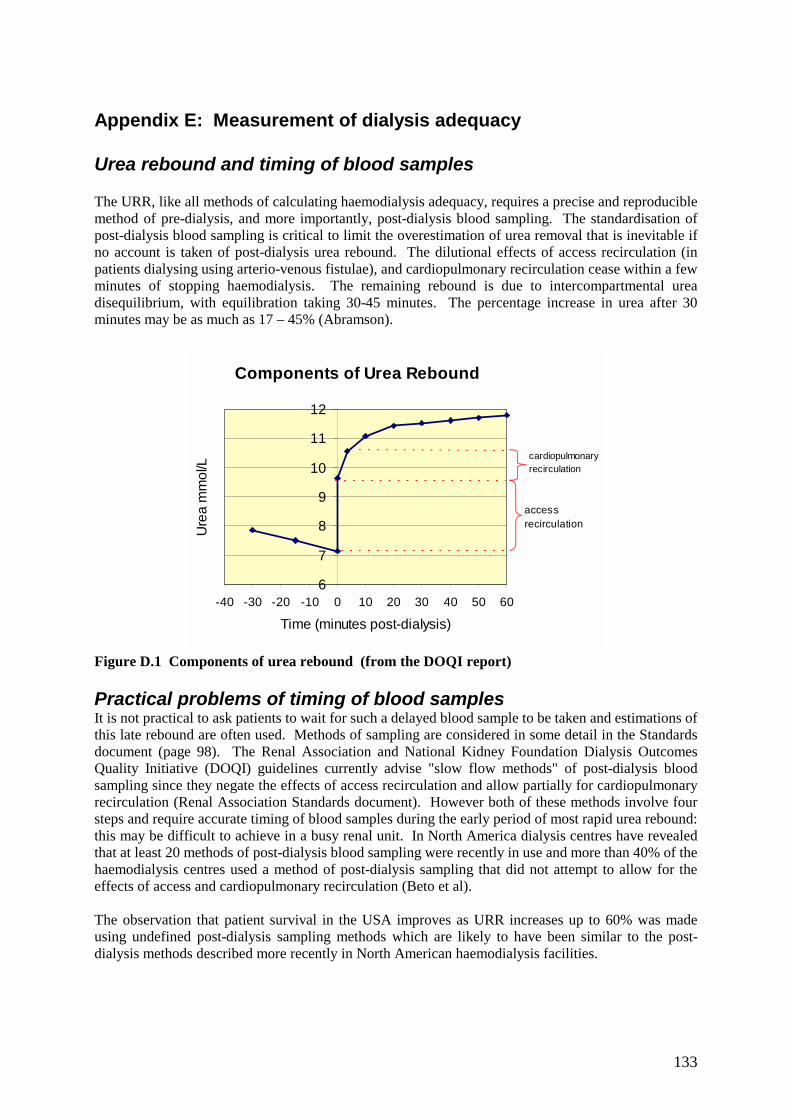
133
Appendix E: Measurement of dialysis adequacy Urea rebound and timing of blood samples The URR, like all methods of calculating haemodialysis adequacy, requires a precise and reproducible method of pre-dialysis, and more importantly, post-dialysis blood sampling. The standardisation of post-dialysis blood sampling is critical to limit the overestimation of urea removal that is inevitable if no account is taken of post-dialysis urea rebound. The dilutional effects of access recirculation (in patients dialysing using arterio-venous fistulae), and cardiopulmonary recirculation cease within a few minutes of stopping haemodialysis. The remaining rebound is due to intercompartmental urea disequilibrium, with equilibration taking 30-45 minutes. The percentage increase in urea after 30 minutes may be as much as 17 – 45% (Abramson).
Components of Urea Rebound
6
7
8
9
10
11
12
-40 -30 -20 -10 0 10 20 30 40 50 60
Time (minutes post-dialysis)
Ure
a m
mol
/L
accessrecirculation
cardiopulmonaryrecirculation
Figure D.1 Components of urea rebound (from the DOQI report) Practical problems of timing of blood samples It is not practical to ask patients to wait for such a delayed blood sample to be taken and estimations of this late rebound are often used. Methods of sampling are considered in some detail in the Standards document (page 98). The Renal Association and National Kidney Foundation Dialysis Outcomes Quality Initiative (DOQI) guidelines currently advise "slow flow methods" of post-dialysis blood sampling since they negate the effects of access recirculation and allow partially for cardiopulmonary recirculation (Renal Association Standards document). However both of these methods involve four steps and require accurate timing of blood samples during the early period of most rapid urea rebound: this may be difficult to achieve in a busy renal unit. In North America dialysis centres have revealed that at least 20 methods of post-dialysis blood sampling were recently in use and more than 40% of the haemodialysis centres used a method of post-dialysis sampling that did not attempt to allow for the effects of access and cardiopulmonary recirculation (Beto et al). The observation that patient survival in the USA improves as URR increases up to 60% was made using undefined post-dialysis sampling methods which are likely to have been similar to the post-dialysis methods described more recently in North American haemodialysis facilities.
134
Current UK practice in blood sampling An informal survey by the Registry of the methods of post-dialysis sampling used by participating UK renal units has shown a wide range of sampling techniques in use. Many units obtain the post-dialysis blood sample immediately at the end of the dialysis session with no "slow flow" period. A similar observation was made in a survey of all adult renal units in Scotland in early 1998 (Mactier). This widespread use of immediate post-dialysis sampling will overestimate urea removal during dialysis and hence the URR, as the sample is diluted by access recirculation of ‘just dialysed blood’, and there is no account of cardiopulmonary recirculation and the disequilibrium component of the urea rebound. For good comparative audit, it is essential that a standardised post dialysis sampling technique is used which is simple and reproducible. In the absence of a formal programme of standardisation of dialysis methods in the UK, only one method of sampling has been in evaluation. In 1999 all the renal units in Scotland, and some in England, have utilised a standardised method of post-dialysis blood sampling from any point in the extracorporeal circuit, 5 minutes after stopping the dialysate flow while the dialyser blood flow rate remains unchanged (Traynor et al). This "stop dialysate flow" method does not require exact timing of blood sampling, permits blood sampling from the arterial or venous limbs of the extracorporeal circuit and is practical to perform in a busy unit. This has proved reproducible, allowing for both access and cardiopulmonary recirculation, if not for the disequilibrium component of urea rebound. This technique has been verified in 117 patients. During the same haemodialysis session the URR was 69.1 (s.d. 9.3%) when using the "stop dialysate flow" method compared with 71.7 (s.d. 8.3%), when blood sampling was performed immediately at the end of haemodialysis (p < 0.0001). The method is being further evaluated. It should be noted that the extent of urea rebound depends on the intensity of dialysis in terms of K/V and t, so that a wide range of treatment conditions are required to validate any sampling method. The ‘stop dialysate flow method is not suitable for conversion to estimate Kt/V, unlike versions of ‘slow flow’, so that international and historical data comparisons may be compromised by concentration on this method. Implications for URR results calculated by the Renal Registry Without a standardised post dialysis sampling technique in use by all units, it must be accepted that many units will be overestimating URR by taking immediate “no slow flow” samples. This is part of a wider problem with URR, however, because it takes no account of urea removal by ultrafiltration. This distorts the equivalence of URR 65% and Kt/V 1.2, which is further flawed because of the effects of variable dialysis time, t. For these reasons URR is not a reliable indicator of haemodialysis dose, despite its relationship to outcomes. This is particularly important when the distribution of unit results clusters around the Standard 65% value, because even a small bias in the data will profoundly shift the percentage compliance with Standard. Values well above (or below) the Standard will be scarcely affected. There are several examples of this from Figures 5.1 and 5.2, where it is clear that a very small change in median URR achieved can make a profound difference to the compliance with the Standard. However, any attempt to increase URR values will tend to increase delivered dialysis doses. In very large-scale mortality studies, these niceties appear to be less relevant. It should be stressed again that the observation that patient survival in the USA improves as URR increases up to 60%, was made using undefined post-dialysis sampling methods.

135
References 1. Abramson F, Gibson S, Barlee V, Bosch JP: Urea kinetic modeling at high urea
clearances: Implications for clinical practice. Advances in Renal Replacement Therapy 1:5-14, 1994
2. Beto JA, Bansal VK, Ing TS, Daugidas JT. Variation in blood sample collection for
determination of haemodialysis adequacy. Arner J Kid Dis 1998; 31: 135-141. 3. Clinical practice guidelines for haemodialysis adequacy. National Kidney Foundation
Dialysis Outcomes Quality Initiative (DOQI). 1997; 25-61. 4. Clinical practice guidelines of the Canadian Society of Nephrology for the treatment of
patients with chronic renal failure. J Am Soc Nephrol 1999; 10: S307. 5. Held PJ, Port FK, Wolfe RA, Stannard DC, Carroll CE, Daugirdas JT, Greer JW, Hakim
RM: The dose of hemodialysis and patient mortality. Kidney Int 50:550-556, 1996 6. Leblanc M, Charbonneau R, Lalumiere G, Cartier P, Deziel C: Postdialysis urea rebound:
Determinants and influence on dialysis delivery in chronic haemodialysis patients. Am J Kidney Dis 27:253-261, 1996
7. Owen WF, Lew NL, Liu Y. Lowrie KG, Lazarus JM. The urea reduction ratio and serum
albumin as predictors of mortality in patients undergoing haemodialysis. N Engl J Med 1993; 329: 1001-1006.
8. Treatment of adult patients with renal failure. Recommended standards and audit
measures. The Renal Association 1998; 21 -22. 9. Traynor J. Geddes CC, Walbaum D, MacGregor M, Allam B. Fox JG, Mactier RA. A
new method of post-dialysis blood sampling: the "stop dialysate flow" method. Nephrol Dial Transplant 1999; 14: 2063A.
10. The Scottish Renal Registry. Audit of quality of hospital haemodialysis in Scotland.
Nephrol Dial Transplant 1997; 12: 29-32. 11. The Scottish Renal Registry. The quality of hospital haemodialysis in Scotland -
improvement with audit. Health Bulletin 1999; 57: 237-240. 12. Seghal AR, Snow RJ, Singer ME, et al. Barriers to Adequate Delivery of
Hemodialysis.Am J Kidney Dis 1998;31:593-601

136

137
Appendix F: Laboratory conversion factors & Centre Names Conversion factors from SI units Albumin g/dl = g/L x 0.1 Calcium mg/dl = mmol/L x 4 Phosphate mg/dl = mmol/L x 3.1 Cholesterol Mg/dl = mmol/L x 38.5 PTH ng/L = pmol/L x 9.5 Urea Centre abbreviations used in chapter 4 & 5 City Abbrev Renal Unit Birmingham Heartlands Heart Heartlands Hospital Bristol Bristl Southmead Hospital Cardiff Crdff University of Wales Hospital Carlisle Carls Cumberland Infirmary Carshalton Carsh St Helier Hospital Coventry Covnt Walsgrave Hospital Derby Derby Derby City Hospital Exeter Extr Royal Devon and Exeter Hospital Gloucester Glouc Gloucester Royal Hospital Hull Hull Hull Royal Infirmary Leeds LGI LGI Leeds General Infirmary Leeds, St James' StJms St James’s Hospital Leicester Leic Leicester General Hospital London - Guys Guys Guys and St Thomas Hospital Middlesbrough SCleve South Cleveland Hospital Nottingham Notts Nottingham City Hospital Oxford Oxfrd Churchill Hospital Plymouth Plym Derriford Hospital Preston Prstn Royal Preston Hospital Reading Redng Royal Berkshire Hospital Sheffield Sheff Northern General Hospital Southend Sthend Southend Hospital Stourbridge Words Sunderland Royal Hospital Sunderland Sund Morriston hospital Swansea Swnse Newcross Hospital Wolverhampton Wolve Stourbridge Hospital Wrexham Wrex Maelor General Hospital York York York District Hospital

138