the uaw’s impact on wages in the us auto industry … · the uaw’s impact on wages in the us...
TRANSCRIPT

The UAW’s Impact on Wages in the US Auto Industry Zucker 1
The UAW’s Impact on Wages in the
US Auto Industry
Much economic debate has occurred over the effect that unions have on the wages, profits, and employment of the industry they represent. This paper focuses on the United Automobile Workers (UAW) labor union and determines if the union’s declining influence between 1960 and 2000 significantly reduced the wages of US autoworkers. The paper utilizes time-series data that reviews correlation between the variables, includes a regression that analyzes the relationship between autoworker wages and UAW union density, controls for other factors that affect autoworker wages, and controls for possible structural shifts in the industry. The results indicate that there is a statistically significant, positive relationship between union density and wages, and also exemplify the significance of other variables that affect wages, such as the market share of the Big Three auto companies and the public approval of unions.
Alec Zucker
Dr. Michele Naples ECO 495: Senior Thesis in Economics
April 11th, 2014

The UAW’s Impact on Wages in the US Auto Industry Zucker 2
The Rise and Fall of the UAW
Since its inception in 1935, the United Automobile Workers (UAW) labor union has had
a significant impact on the American automobile industry. The higher wages, pensions, and
generous benefit packages that so many autoworkers enjoy today may have never have been
possible without the efforts of the UAW. The US auto industry, which has been primarily
dominated by Ford, General Motors, and Chrysler (also known as the Big Three), became a
shining example of economic prosperity after World War II; consequently, the UAW’s
involvement and influence had significant implications for thousands of workers across the US.
Like many other public and private sector unions, the UAW’s power eroded between 1960 and
the early 1990s. While some attribute the union’s decline to increased competition from foreign
autoworkers, others point to policy changes and the worsening public perception of unions that
have constrained the UAW’s ability to advocate in favor of US autoworkers.
The purpose of this paper is to determine whether or not there is a statistically significant
relationship between union density and wages for US autoworkers, and thus the paper will work
to answer this question: has the UAW’s level of union density, which declined throughout the
forty-year period between 1960 and 2000, significantly impacted the wages of the unionized
autoworkers it represented? Before analyzing data, my hypothetical answer to this question is
yes. An influential UAW has additional leverage in the collective bargaining process that decides
the wages of the autoworkers, whereas management will take advantage of a weaker union and
provide lower wages with less generous benefit packages to maximize profits. The analysis will
be conducted relative to the changing economic and political conditions between 1960 and 2000,
while also controlling for other variables, like the profit rate of the industry and the market share
of the Big Three auto producers, which all simultaneously affect the American auto industry.

The UAW’s Impact on Wages in the US Auto Industry Zucker 3
In order to determine if the UAW’s union density raises the wages of its members, I
conduct a quantitative study, using time-series data over a forty-year period between 1960 and
2000, which will utilize multivariate regressions containing several independent variables that
may impact autoworker wages, the dependent variable. I review the correlation between the
variables, a regression that analyzes the relationship (or lack thereof) between union density and
wages while controlling for other factors that affect autoworker wages, and finally a regression
controlling for structural shifts in the industry. The results of my study indicate that there is a
statistically significant, positive relationship between union density and wages, and also
exemplify the significance of other variables that affect wages, such as the market share of the
Big Three auto companies as well as the overall public approval of unions.
A Cost-Benefit Analysis of Unions and the UAW
Much economic literature has been written regarding the impact unions have had on the
wages for unionized employees. Bryson 2007 provides a comprehensive overview of the effect
unions have on wages, and he notes that a union’s bargaining strength determines whether or not
the union is successful in augmenting the wages of its members. He argues that a union’s
bargaining leverage is enhanced if more workers within an industry are enrolled relative to the
total number of workers in the industry (see Bryson 2007, p. 33-34). Freeman and Medoff 1984
concur with Bryson and show that unions have consistently augmented the wages of the
employees they represent, particularly amongst the less educated. The authors show that the
union-wage effect is more substantial for unskilled workers, like most autoworkers who have
attained solely a high-school diploma or some college, than for highly-skilled workers, which
implies that the UAW should have increased the wages for workers in the auto industry (see
Freeman and Medoff 1984, p. 11-17). Card 1996 concurs with Freeman and Medoff in that the

The UAW’s Impact on Wages in the US Auto Industry Zucker 4
wage effect is stronger for unskilled labor than skilled labor, and also adds that underlying wage
differences due to age, education, and region are typically smaller for unionized workers (see
Card 1996, p. 976). This wage effect typically fosters the least amount of disagreement, as most
economists also agree that firms with a unionized workforce tend to have lower profit rates than
firms with non-unionized labor. Addison and Hirsch 1989 claim that lower profitability amongst
unionized firms is “well-established” and is primarily caused by the higher wages and benefit
packages that unions garner for their constituencies. The authors also note that unions in
competitive markets are less likely to obtain large wage premiums and are more effective in
specialized industries (see Addison and Hirsch 1989, p. 72-89, 100-101). My study will confirm
that this union-wage effect has occurred in the US auto industry throughout the UAW’s existence
and will review other factors that affect the wages of unionized employees, like the profit rate
and economic conditions.
DeFina 1983 delves deeper into how this wage premium that unions generate results, and
his paper also reviews the implications for the allocation of resources and efficiency that occur as
a result of the higher wages unions earn for their members. He notes that changes in the prices
and quantities of commodities and factors of production that vary across industries lead to a
wage premium in unionized sectors, though these adjustments often carry a deadweight loss.
While some argue that the wage differential between unionized and non-unionized sectors
diminishes efficiency in the unionized industries, DeFina disagrees, arguing that the union-wage
differential decreases economic efficiency only minimally. In response to his critics, DeFina
experimented with his data and removed the wage differential between unionized and non-
unionized sectors. He found that the efficiency gain from eliminating the differential never
exceeded 0.2% of GNP in every scenario (see Defina 1983, p. 408, 427-428). These findings

The UAW’s Impact on Wages in the US Auto Industry Zucker 5
discredit the notion that the higher wages earned by unions like the UAW reduce efficiency in
their respective sectors. Borjas 1979 adds to Defina’s analysis of the union-wage effect, noting
that the effect on the reservation wage, the lowest wage at which a prospective employee will
accept a particular job, is weaker than its effect on the actual wage. He also shows that the union-
wage effect is larger in the early years of job tenure and gradually declines after this point as the
worker ages (see Borjas 1979 p. 38-39).
Bryson 2007 also explains how the wage effect generated by unions creates a wage
differential between unionized and non-unionized sectors, primarily for three reasons. First,
unique to unionized sectors, unions fight against pressure to reduce wages in times of recession.
Second, unions garner a higher wage premium in their sector that limits labor entry into the
unionized sector, since firms can only spend so much on labor (the Wage-Fund Doctrine), which
increases labor supply and competition in the non-unionized sector. This increased competition
for fewer jobs in non-unionized sectors lowers the wages in these industries. And third, which
compresses wage inequality between unionized and non-unionized sectors but not enough to
diminish the difference, employers in non-unionized sectors often feel threatened that their
workers may unionize, so they raise wages to prevent them from having a reason to organize (see
Bryson 2007, p. 34). Bryson also shows that the wage premium generated by unions occurs
throughout the world, including a 17% increase in wages for unionized sectors (compared to
non-unionized industries) in the US between 1993 and 2002. He also claims that, despite the fact
that union density has declined in countries like the US and the UK, there is minimal evidence of
a declining wage premium that unions earn, as non-unionized workers still make significantly
less than unionized workers in related industries (see Bryson 2007, p. 38-41).

The UAW’s Impact on Wages in the US Auto Industry Zucker 6
In addition to the benefits that unions achieve for their members, some economists have
argued that union activities also improve the fortunes for workers in other industries that may be
unrelated to unionized industries. Budd 1992 shows that unions like the UAW have often used
pattern-bargaining during contract negotiations, which is a principle ensuring that when a
contract is agreed upon, that contract may serve as a pattern (or model) for contracts with other
firms. He discovered a significant amount of pattern-following in industries with few economic
ties to the auto industry, such as in agriculture and aerospace, as well as in other manufacturing
industries. Furthermore, Budd found that the importance of pattern-bargaining declined after
1980, in conjunction with waning UAW influence (see Budd 1992, p. 524, 536-538). Freeman
and Medoff 1984 agree with this assessment, claiming that non-union workers often enjoy higher
wages as a result of pattern-bargaining by organized workers (see Freeman and Medoff 1984, p.
12-14). For these reasons, an analysis to determine if the unionized auto industry’s impact on
wages also affects the overall manufacturing industry may validate these claims.
Freeman and Medoff 1984 also draw many conclusions regarding the effect of unions on
wage inequality and employment in the labor market. They discredit the claim that unions
significantly increase wage inequality between unionized and non-unionized sectors, arguing that
the reduction the in initial wage-inequality between skilled and unskilled labor (due to
differences in skill) overrides this outcome and leads to a net-reduction in wage inequality. Since
skilled labor is less likely to unionize, the unions who typically represent unskilled labor reduce
wage inequality among the varying skill levels, which outweighs the inequality between
unionized and non-unionized sectors (see Freeman and Medoff 1984, p. 11-12). Card 1996 also
showed that unions tend to reduce wage inequality due to differences in age, education, and

The UAW’s Impact on Wages in the US Auto Industry Zucker 7
region in their particular industry, so this is more evidence that unions do not augment inequality
between workers (see Card 1996, p. 976).
In terms of employment, Freeman and Medoff state that unionized workers enjoy better
job security than non-unionized workers. However, they explain that during an economic
downturn, unionized firms are more likely to make temporary layoffs and fewer cuts in wages
than non-unionized firms (see Freeman and Medoff 1984, p. 10-14). Therefore, even though
unions may have a positive effect on wages by maintaining pre-recession levels, they may
decrease employment for individuals seeking work in a particular industry. Despite having better
job security according to Freeman and Medoff, as well as higher wages, Borjas 1979 found that
union members typically have lower levels of job satisfaction, though this satisfaction is highly
dependent on tenure. In turn, unions may garner additional benefits, such as higher wages and
more generous benefit packages, for their more senior members as a result of this finding (see
Borjas 1979, p. 38-39).
While the UAW was a powerful voice for US autoworkers, economists have presented
several theories as to why the union’s influence declined in the 1980s and 1990s. Bluestone 2011
notes that the UAW fought for rules that undermined efficiency, felt their privileged status would
last forever in a changing automotive market, and fell victim to mistakes by management that
reduced their competitiveness in the face of foreign competition. He also claims that the UAW
failed to encourage auto companies to produce innovative vehicles of high quality to compete
with foreign imports (see Bluestone 2011, slides 6-14). Contrary to Bluestone’s arguments,
Lichtenstein 1985 attributes much of the blame to pattern-bargaining, stating that the technique
reduced the efficiency and competitiveness of the auto-industry firms, which hindered the efforts
of labor (see Lichtenstein 1985, p. 360-366). Despite the disagreement over the causes of the

The UAW’s Impact on Wages in the US Auto Industry Zucker 8
union’s decline, economists concur that the UAW’s advocacy power was reduced and likely
affected the wages of autoworkers.
Data and Methodology
In order to formulate a conclusion as to whether or not union density augments the wages
of unionized workers in the US auto industry, I will conduct a quantitative study that analyzes
several multivariate regressions with control variables. This study will utilize time-series data
and will attempt to identify a relationship between union density and wages over a forty-year
period, including 40 yearly observations between 1960 and 2000, while also controlling for
structural shifts between the two decades prior to and following 1980. The dependent variable
for the multivariate regression will be the wages of all autoworkers adjusted for inflation,
represented in 1980 dollars1. As shown in Figure 1 on page 31, the average autoworker wage
(adjusted for inflation) has steadily declined between 1960 and 2000. The main explanatory
variable for the regression is union density, a measure of the UAW’s strength or influence on
company activities that impact their members, such as the collective bargaining over wages. This
variable is calculated by dividing the number of UAW members (in millions by year) by the total
number of production workers (who produce durable goods like cars) in the US manufacturing
industry2. As shown in Figure 2 on page 32, the UAW’s power has significantly declined since
1960, which has likely affected wages, profits, and employment in the US auto industry. A
statistically significant, positive relationship between union density and the wages of
autoworkers, after all other variables are controlled for, would indicate that a stronger UAW is
favorable for the wages of its members.
1 The data for this variable was compiled by Seth Myers from a BLS union fact sheet, and was converted to 1980 dollars using the BLS’s inflation calculator. 2 The data for the number of UAW members per year comes from the Walter P. Reuther Library at the US Department of Labor, compiled by Brent Snavely. The data for number of production workers by industry comes from the US Census Bureau, published in Historical Statistics of the US, Vol. 2 pages 130-132.

The UAW’s Impact on Wages in the US Auto Industry Zucker 9
There are numerous variables to be controlled for in this quantitative study. The first two
variables account for the relative condition of the US economy as well as Michigan’s economy,
where much of the auto industry’s production takes place. I include a variable measuring the
unemployment rate of the United States for each year, and also a variable including the
unemployment rate of Michigan3. There are, unfortunately, only 25 observations for Michigan’s
unemployment rate, as the BLS did not begin accounting for state-level unemployment until
1976. Due to the fact that unions typically have less bargaining power during times of high
unemployment, with a surplus in the supply of labor and thus more competition for fewer jobs,
higher unemployment should reduce the wages of autoworkers, particularly if this economic
hardship is present in Michigan.
Another variable that will capture the economic conditions faced by the UAW will be the
average profit rate for the US auto industry and overall manufacturing industry4. Unemployment
tends to be a lagging indicator of economic downturns, while falling profits are a leading
indicator, so this variable may have more of an immediate impact on the wages of autoworkers
because the falling profits spark wage cuts and unemployment. I predict the profit rate for the
industry to be inversely related to worker wages, as firms with reduced profits will cut wages to
increase their low residual, the amount of money remaining after all company expenses are paid
for.
Productivity, measured as the yearly output for each production worker in the US
manufacturing sector (in thousands of dollars) is another variable I control for5. In any industry,
3 The data for the US unemployment rate was received from the Current Population Survey, while data for Michigan’s annual unemployment rate (1976-2000) was compiled by Dave Manuel from the BLS. 4 Data for these variables was compiled from the Automotive News: Market Data Book from the BEA for the years 1960-1985 for both variables, while data for the auto industry from 1985-2000 was compiled by the Rocky Mountain Institute, and data for the manufacturing industry from 1985-2000 was compiled by Chris Harman from the ISJ. 5 Data for this variable was taken from studies completed by the BLS and the BEA compiled by Mark J. Perry.

The UAW’s Impact on Wages in the US Auto Industry Zucker 10
workers are compensated for higher levels of productivity, so I expect worker productivity to be
positively correlated with the wages of UAW members. Data on the productivity of autoworkers,
while preferable, was unfortunately unavailable for this study.
In addition to these variables that control for the economic conditions for each yearly
observation, I also control for partisanship, the market-share of the Big Three, the public opinion
about unions, and significant changes in industry-related regulations. I create a dummy variable
equaling “1” if the President during the yearly observation was a Democrat, as Democrats have
been shown to advocate in favor of unions while Republicans have typically been pro-business.
For these reasons, I predict this variable to be positively associated with wages, as additional
political support for unions increases their leverage and ability to negotiate for their members.
Another important variable I will include is the market share of the Big Three American
automakers, equaling the annual number of sales by the Big Three divided by the total annual
number of vehicle sales in the US measured as a percentage6. A stronger US auto industry would
be expected to raise wages because a higher market share implies a greater demand for US
automobiles, allowing producers to raise prices and later wages as profits rise. In turn, I predict
that Big Three market share will be positively related to wages.
The public perception of unions may affect their power at the bargaining table as well as
their membership, so a variable showing the public opinion on unions, measured as the
percentage of the public that approve of the activities of unions, could affect wages7. I expect
this variable to be positively correlated with wages, as higher public support of unions should
increase their strength in collective bargaining and raise wages. Finally, new regulations imposed
on the US auto industry, particularly the strict emissions standards passed in 1975, may impact
6 Data for this variable from 1960-1977 was compiled by John Samsen and from 1978-2000 by Mark J. Perry. 7 Data for this variable was compiled from a Gallup Poll by Jeffrey Jones.

The UAW’s Impact on Wages in the US Auto Industry Zucker 11
the sales, profits, and wages of the industry. I control for the passage of this regulation by
including a dummy variable equaling “1” for each yearly observation after and including 1975,
and I expect this variable to be inversely related to wages as stronger regulations raise costs for
employers which should induce them to press for lower wages for UAW members. Table 1 on
page 20 shows a description of each variable, each variable’s STATA syntax, and each variable’s
predicted sign in the regression. Table 2 on page 21 exhibits the descriptive statistics for each
variable.
Regression Results and Analysis
Prior to reviewing the multivariate regressions, it is essential to scrutinize the strength of
the linear correlations between the various independent variables and UAW wages. The
Pearson’s r-coefficient measures, on a scale from -1 to 1, the degree or strength of the linear
relationship between two variables. Table 3 on page 22 displays the various r-coefficients that
show the strength of the correlation between each explanatory variable and wages, and also
presents the degree of pair-wise correlation between all of the explanatory variables.
Table 3, in agreement with my hypothesis, shows a strong positive correlation between
the UAW’s density and the wages of its members. The correlation coefficients also show several
interactions among other factors that may affect my experiment. As expected, wages and union
density were positively correlated with the market share of the Big Three. However, other
correlations ran against pre-conceived notions. UAW member wages, for example, were
positively correlated with unemployment and the profit rate of the auto industry, while were
negatively correlated with productivity. This contradicts economic theory (Perfect Competition
Labor-Market Theory) because wages typically fall when unemployment rises, when profits rise,
and when worker productivity falls. Other intriguing findings that discredit my predictions

The UAW’s Impact on Wages in the US Auto Industry Zucker 12
include a positive correlation between union density and the auto industry profit rate, and a
strong negative correlation between union density and the productivity of manufacturing
workers. However, these are simple correlations; the multi-variate regression will control for
other factors.
The first regression, with the results shown on page 23 in Table 4, controlled for the
average manufacturing wage (“ladjmanufwage”) in the automobile wage equation to see if
autoworkers are significantly affected by the wages, profits, and employment of the overall
manufacturing industry, as distinct from the UAW. This proved to be correct, as most of the
variables, including union density, were insignificant with the exception of manufacturing
wages, which displayed a statistically significant positive relationship with autoworker wages.
Some economists have argued that the auto industry is a only a fraction of the entire US
manufacturing industry, and in turn the wages, profits, and employment of the auto industry
adhere to the long-term trends of the overall manufacturing industry. While this hypothesis may
be true, I omit the average manufacturing wage in the following regressions because
manufacturing wages should be highly correlated with autoworker wages, to the extent that we
see pattern-bargaining, for instance. That correlation may override and ultimately disguise other
relationships in the regression between autoworker wages and union density, for example,
because its strength is very significant. By omitting this variable, I am able to determine whether
or not there are underlying relationships between wages and other explanatory variables that may
not be as strong as the relationship between autoworker wages and manufacturing wages.
After running a regression that omitted the control variable for manufacturing wages, as
shown on page 24 in Table 5, I can conclude that my hypothesis, which stated that union density
should augment the wages of UAW members, was proven to be correct. First of all, the

The UAW’s Impact on Wages in the US Auto Industry Zucker 13
regression boasts a very impressive 0.9574 adjusted R-squared value, which implies that the
explanatory variables explain 95.74% of the variation in the dependent variable. This outcome
shows that the regression is very effective at predicting the value of the wages and thus the
findings deserve merit. UAW union density, the main explanatory variable, is shown to have a
statistically significant, positive relationship with the wages of US autoworkers. Figure 3 on page
33 shows this statistically significant positive relationship graphically. Furthermore, the
regression results exemplify other statistically significant relationships that confirm my
predictions. According to the results, as the market share of the Big Three US auto producers
rises, the wages of autoworkers also rise, which makes sense because a higher market share
implies an increased demand for domestic automobiles, which raises the prices of the vehicles as
well as the wages of the workers that produce them. The public perception of unions, as
expected, was also shown to have a statistically significant positive relationship with wages,
meaning that unions like the UAW had additional leverage at the bargaining table when the
public approved of their activities.
Due to the fact that the adjusted R-squared value for the regression is very high, I test to
determine if there is non-stationarity, heteroskedasticity, and autocorrelation present in the model
to confirm the validity of the results. As shown in Table 11 on page 30, the results for the
Dickey-Fuller test for stationarity, the t-statistic is a very low 0.042, which indicates that
stationarity is fortunately not a problem in the model. In turn, each variable contains a unit root
and was not generated by a stationary process. To test for heteroskedasticity and see if the
relationships were found randomly, I conduct a Breusch-Pagan test with the results shown in
Table 12 on page 30. Since the chi-square value is a low 0.47, this value is insignificant and
therefore heteroskedasticity is not a problem in the model.

The UAW’s Impact on Wages in the US Auto Industry Zucker 14
For autocorrelation, as shown in Table 13 on page 30, the Durbin-Watson statistic of 1.51
falls within the range of significance for a regression with 9 variables and 41 observations (at 1%
significance, 0.844 – 1.876), and therefore autocorrelation is unfortunately occurring in the
model. In order to correct for this autocorrelation, I utilize the “prais” STATA command to
produce regression results that are corrected for autocorrelation to see if there are significant
differences from the results shown in Table 5. As shown in the results in Table 6 on page 25,
which are corrected for autocorrelation, there are no significant changes in the statistically
significant, positive relationship between UAW union density and wages or in the significance of
the model (Adjusted R-squared is unchanged). Furthermore, Big Three market share continues to
have a statistically significant positive relationship, though the positive relationship between US
union approval and wages becomes insignificant. Nonetheless, because the statistically
significant positive relationship between wages and union density remains unchanged after
correcting for autocorrelation, autocorrelation is not a serious problem in the regression results.
Overall, the conclusions on stationarity, heteroskedasticity, and autocorrelation add additional
support to the study’s findings.
In addition to testing for stationarity, autocorrelation amongst the variables, and
heteroskedasticity, I also test for structural shifts in the data. To account for structural shifts, I
break the data into two separate regressions, one using data between 1960 and 1980, and the
other using data between 1980 and 2000. I chose 1980 as the dividing year not only because it
represents the median point in my data, but also because with the election of Ronald Reagan, the
US economic perspective shifted from being pro-union to pro-business. In Table 7 and Table 8
on pages 26 and 27 are the results for two separate regressions, the first using only the data from
1960 to 1980, and the second using only data from 1980 to 2000. Note that the variables

The UAW’s Impact on Wages in the US Auto Industry Zucker 15
measuring the unemployment rate for Michigan and the vehicle emissions standards were
omitted from both regressions due to a lack of available data.
In Table 7, there are not many significant differences between this regression using only
the first half of data and the regression using all forty years of data. Union density still has a
strong positive relationship with union wages and Big Three market share also still positively
affects wages (though this relationship is less significant). The main differences are that US
unemployment becomes a very significant variable, with a negative relationship with wages, and
that productivity also becomes moderately significant with a negative relationship with wages.
Even though the negative relationship between productivity and wages contradicts economic
theory, the strong negative relationship between unemployment wages confirms economic theory
because, as unemployment rises, there is more competition in the labor market for fewer jobs,
which decreases wages. Nonetheless, since the R-squared value is still very high and the
statistically significant positive relationship between wages and density still exists, structural
shifts are not present in the first half of data.
In Table 8, using data from 1980 to 2000, there also are not many significant differences
from the regression using all forty years of data. Union density retains a strong positive
relationship with wages, and public approval of unions still has a direct relationship with union
wages. One key difference is that the coefficient for the Big Three’s market share, while still
significant, becomes negative, which contradicts my hypothesis of a higher market share
augmenting wages for US autoworkers. Another difference is that US unemployment becomes
insignificant, contrary to the first half of the data in Table 7, and that the productivity of all
manufacturing workers becomes very significant with a negative relationship with wages
(contradicts economic theory). Despite these minor differences, there are no significant changes

The UAW’s Impact on Wages in the US Auto Industry Zucker 16
in the statistically significant positive relationship between wages and union density, in the high
R-squared value of the model, and in key control variables between the regressions controlling
for structural shifts and the regression utilizing all forty year of data. Hence, structural shifts are
not a problem in the model as some may have anticipated given the change in ideology in the US
that occurred after 1980.
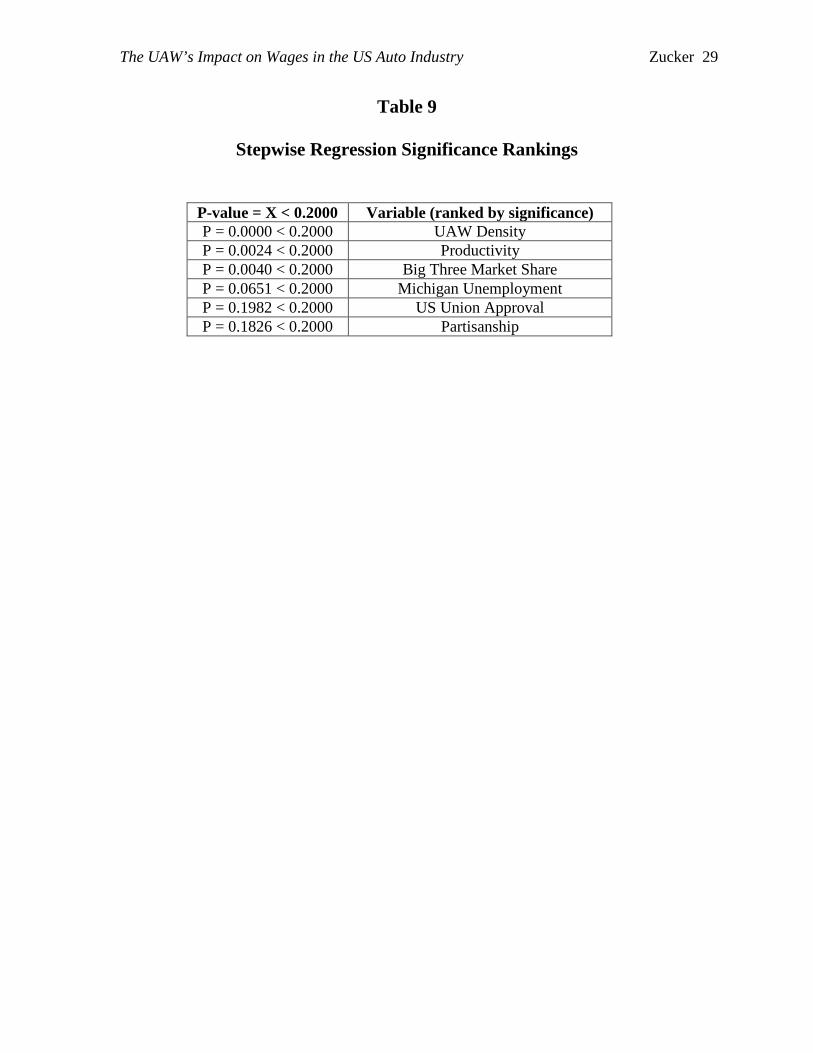
Tables 9 and 10 on pages 28 and 29 show the regression results and significance rankings
of a stepwise regression to see which variables have the greatest effect on autoworker wages in
the model and which variables could be removed to make the model simpler while retaining
satisfactory predictive ability. As shown in the results, the prior statistically significant variables
(density, Big Three market share, and US union approval) remain significant, with union density
fortunately having the smallest p-value in Table 9 and, therefore, the greatest impact on wages.
As expected, the auto industry profit rate, unemployment for US, and environmental regulations
all drop out from the results because their effects on the dependent variable are minimal at best.
Despite the fact that the variable was statistically insignificant in almost all of the previous
regressions, productivity was shown to have the second largest effect on wages with a very small
p-value in Table 9. Furthermore, Michigan unemployment and partisanship were also listed as
affecting wages, though their relationships remain insignificant in the regression results in Table
10 and are ranked to have a much smaller effect on wages compared to the other listed variables
(with the exception of US union approval).
Conclusions
After conducting several multivariate regressions using time-series data, controlling for
alternative explanations, and accounting for statistical flaws in the data, I can conclude that the

The UAW’s Impact on Wages in the US Auto Industry Zucker 17
more influence and leverage the UAW obtained in collective bargaining, the more successful the
union was in augmenting the wages of its members. As shown in Table 5 and Figure 3, union
density and wages have a statistically significant positive relationship in a regression that
explained over 95% of the variation in the dependent variable, which confirms the economic
argument that unions raise the wages of their members. Therefore, my hypothesis, which argued
that the UAW’s declining union density between 1960 and 2000 significantly reduced the wages
of autoworkers, was proven to be correct. A key caveat in this conclusion is that wages in the
overall US manufacturing industry were omitted from the regression, so the argument that the
US auto industry adheres to long-term wage trends in the manufacturing industry still deserves
consideration. The study also shows other relationships between wages and several of the
variables that were controlled for. A greater market share for the Big Three automakers, for
example, was also shown to increase the wages of autoworkers, and a stronger public perception
of unions augmented their power at the bargaining table and thus raised the wages of union
members. These findings are additional evidence that can be used in future studies when
considering which factors significantly affect the wages of US autoworkers.
Not only did the regression results that drove my conclusion explain almost all of the
variation in the dependent variable, but they also passed several statistical tests, such as tests for
stationarity, autocorrelation, and heteroskedasticity, that would have indicated a random or
erroneous relationship. Furthermore, the test for structural shifts showed that the relationship was
not a result of a change in ideology that occurred in 1980, as the positive relationship between
union density and wages remains statistically significant throughout the two decades prior to and
after 1980. Future studies reviewing this topic will hopefully have more years of data at their

The UAW’s Impact on Wages in the US Auto Industry Zucker 18
disposal, and if the UAW continues to decline like many economists are predicting, the effect
that this diminishing union density will have on autoworker wages must be deciphered.
In terms of policy recommendations, this paper exemplifies the fact that workers are
much better off when they unionize, and that if governments want to expand opportunities and
incomes for the working-class, they must pass policies that promote the creation, rights, and
expansion of unions. The US middle-class reached its peak of economic prowess during the
1960s, when union density also reached its pinnacle of success. Since then, as union influence
eroded, the US has seen massive increases in income inequality and minimal real-income gains
for the working-class. A future study that determines if there is a relationship between union
density and income inequality would add considerable merit to the idea of promoting union
rights to thwart the growing income differential between the wealthy and the working-class.
Given the results of this study, I would predict that union density would have an inverse
relationship with income inequality, as stronger unions augment the wages of their members who
typically represent the US middle-class. All in all, the US government should advocate in favor
of pro-union policies to raise the wages of the working-class and reduce rising levels of income
inequality.
Works Cited

The UAW’s Impact on Wages in the US Auto Industry Zucker 19
Addison, John T. and Barry T. Hirsch. “Union Effects on Productivity, Profits, and Growth: Has the Long Run Arrived?” Journal of Labor Economics , Vol. 7, No. 1 (Jan., 1989), pp. 72-105. Print.
"Automotive and Oil Industry Profits." The Rocky Mountain Institute. N.p., n.d. Web. 2 Apr.
2014. <http://www.rmi.org/RFGraph-Automotive_and_oil_industry_profits>. Automotive News: Market Data Book. 1st ed. Vol. 2. Washington, DC: US Census, 1986. Print. Bluestone, Barry. "Negotiating the Future: A New Approach to Labor Relations in the Public
Sector." NLC State Managers Conference. South Dakota, Custer State Park. 28 July 2011. Lecture.
Borjas, George J. "Job Satisfaction, Wages, and Unions." The Journal of Human Resources 14.1
(1979): 21-40. JSTOR. Web. 2 Apr. 2014. <http://www.jstor.org/stable/145536>. Bryson, Alex. "The Effect of Trade Unions on Wages." Reflections and Perspectives of
Economic Life 2.3 (2007): 33-45. Cairn.Info. Web. 2 Apr. 2014. <http://www.cairn.info/revue-reflets-et-perspectives-de-la-vie-economique-2007-2-page-33.htm>.
Budd, John W. “The Determinants and Extent of UAW Pattern Bargaining.” Industrial and
Labor Relations Review , Vol. 45, No. 3 (Apr., 1992), pp. 523-539. Print. Card, David. "The Effects of Unions on the Structure of Wages: A Longitudinal Analysis."
Econometrica - The Econometric Society 64.4 (1996): 957-79. JSTOR. Web. 2 Apr. 2014. <http://www.jstor.org/stable/2171852>.
"CPI Inflation Calculator." U.S. Bureau of Labor Statistics. N.p., n.d. Web. 2 Apr. 2014.
<http://www.bls.gov/data/inflation_calculator.htm>. "Current Population Survey." US Bureau of Labor Statistics. N.p., n.d. Web. 20 Jan. 2014.
<www.bls.gov/cps>. DeFina, Robert H. "Unions, Relative Wages, and Economic Efficiency." Journal of Labor
Economics 1.4 (1983): 408-29. JSTOR. Web. 2 Apr. 2014. <http://www.jstor.org/stable/2534862>.
Freeman, Richard B., and James L. Medoff. What Do Unions Do? New York: Basic, 1984. Print. Harman, Chris. "Snapshots of Capitalism Today and Tomorrow." International Socialism
Journal. N.p., 4 Jan. 2007. Web. 2 Apr. 2014. <http://www.isj.org.uk/index.php4?id=292%22>.
"Historical State Unemployment Rates Since 1976." DaveManuel.com. N.p., n.d. Web. 2 Apr.

The UAW’s Impact on Wages in the US Auto Industry Zucker 20
2014. <http://www.davemanuel.com/historical-state-unemployment-rates.php>. Historical Statistics of the United States. B ed. Vol. 2. New York: Cambridge UP, 2006. Print. Jones, Jeffrey. "In U.S., Labor Union Approval Steady at 52%." Gallup - Inc. N.p., 31 Aug.
2012. Web. 2 Apr. 2014. <http://www.gallup.com/poll/157025/labor-union-approval-steady.aspx>.
Lichtenstein, Nelson. UAW Bargaining Strategy and Shop-Floor Conflict: 1946–1970. Industrial
Relations: A Journal of Economy and Society, 1985, 24: 360–381. Myers, Seth. "Disparity on the Factory Floor." Bloomberg.com. Bloomberg, 18 Oct. 2012.
Web. 20 Jan. 2014. <http://go.bloomberg.com/multimedia/disparity-on-the-factory-floor/>.
Perry, Mark J. "Amazing US Manufacturing Productivity Gains." CARPE DIEM - Professor
Mark J. Perry's Blog for Economics and Finance. N.p., 7 May 2011. Web. 2 Apr. 2014. <http://mjperry.blogspot.com/2011/05/americas-amazing-manufacturing.html>.
Perry, Mark J. "The Big Three's Dramatic U-Turn." CARPE DIEM - Professor Mark J. Perry's
Blog for Economics and Finance. N.p., 22 Jan. 2012. Web. 2 Apr. 2014. <http://mjperry.blogspot.com/2012/01/big-threes-dramatic-u-turn.html>.
Samsen, John. "Chrysler Corporation 1962: The Right Cars for the Wrong Time." Allpar.com.
N.p., n.d. Web. 2 Apr. 2014. <http://www.allpar.com/history/plymouth/1962.html>. Snavely, Brent. "UAW Membership up for 2nd Year in a Row." Detroit Free Press. N.p., 31
Mar. 2012. Web. 20 Jan. 2014. <http://www.freep.com/article/20120331/BUSINESS01/203310348>.

The UAW’s Impact on Wages in the US Auto Industry Zucker 21
Table 1
Variable Descriptions and Expected Coefficient Signs Variable Syntax (expected sign)
Description
ladjuawwage (dv) Log of average wage for UAW members by year (in 1980 dollars) uawdensity (+) UAW density, = # of members (millions) / # of manufacturing workers
usunemp (-) The Unemployment Rate of the United States dempres (+) Dummy equaling “1” if President was a Democrat during year of obs.
autoprofrate (-) The annual profit rate for the American Auto Industry michunemp (-) The Unemployment Rate of the state of Michigan
big3mktshare (+) The US market share of the Big Three automakers (US sales / total sales) manufproduc (+) The avg. productivity of US manufacturing workers
vecs (-) Dummy equaling “1” if vehicle emissions standards were used in obs. usunionapprov (+) Percentage of US public approving of union activities (Gallup Poll)
const. The regression’s constant (or y-intercept)

The UAW’s Impact on Wages in the US Auto Industry Zucker 22
Table 2
Descriptive Statistics for Each Variable
Variable # of obs. Mean Standard Dev. Minimum Maximum ladjuawwage 41 3.36 0.526 2.65 4.03 uawdensity 41 0.102 0.231 0.061 0.141 usunemp 41 5.98 1.44 3.4 10.3 dempres 41 0.488 0.506 0 1
autoprofrate 41 7.19 8.42 -12.7 23.8 michunemp 25 8.38 3.26 3.4 16.7
big3mktshare 41 0.771 0.084 0.61 0.91 manufproduc 41 43.9 16.84 20 82
vecs 41 0.634 0.488 0 1 usunionapprov 41 61.7 3.57 56 70

The UAW’s Impact on Wages in the US Auto Industry Zucker 23
Table 3
Correlation Coefficients for Each Variable
Variable wage density usunemp dempres profrate michunemp mktshare productiv vecs unionapprov
wage 1.00 - - - - - - - - - density 0.92 1.00 - - - - - - - -
usunemp 0.54 0.68 1.00 - - - - - - - dempres -0.17 -0.29 -0.51 1.00 - - - - - - profrate 0.51 0.44 0.23 -0.03 1.00 - - - - -
michunemp 0.45 0.67 0.93 -0.67 0.17 1.00 - - - - mktshare 0.86 0.74 0.60 0.02 0.50 0.40 1.00 - - - productiv -0.88 -0.94 -0.74 0.43 -0.38 -0.73 -0.78 1.00 - -
vecs -0.86 -0.53 0.44 -0.07 -0.54 -0.64 -0.82 0.75 1.00 - unionapprov -0.52 -0.61 -0.41 0.04 -0.03 -0.39 -0.54 0.69 -0.67 1.00

The UAW’s Impact on Wages in the US Auto Industry Zucker 24
Table 4
Multivariate Regression (including overall manufacturing wages) Dependent Variable - “ladjuawwage”
N = 41 R-squared value = 0.9942 F (9, 32) = 286.75 Adj. R-squared value = 0.9908
Variable Coefficient Standard Error t-statistic P-value uawdensity 0.539 1.68 0.32 0.753 usunemp 0.034 0.023 1.48 0.159
dempres * -0.053 0.026 -2.06 0.057 autoprofrate -0.00056 0.00093 -0.60 0.560
michunemp ** -0.028 0.010 -2.83 0.013 ladjmanufwage *** 0.764 0.0995 7.67 0.000
big3mktshare 0.083 0.527 0.16 0.876 manufproduc -0.0022 0.0029 -0.76 0.461
vecs -0.004 0.004 0.97 0.64 usunionapprov 0.0099 0.007 1.44 0.17
constant 0.418 0.482 0.87 0.399

The UAW’s Impact on Wages in the US Auto Industry Zucker 25
Table 5
Multivariate Regression (omitting manufacturing wages) Dependent Variable - “ladjuawwage”
N = 41 R-squared value = 0.9716 F (9, 32) = 324.27 Adj. R-squared value = 0.9574
Variable Coefficient Standard Error t-statistic P-value uawdensity *** 10.47 2.29 4.56 0.000
usunemp -0.029 0.046 -0.65 0.527 dempres -0.074 0.055 -1.34 0.199
autoprofrate -0.0015 0.002 -0.74 0.471 michunemp -0.0235 0.021 -1.10 0.289
big3mktshare ** 2.665 0.871 3.06 0.007 manufproduc -0.0041 0.0062 -0.66 0.519
vecs -0.1007 0.062 -1.64 0.112 usunionapprov * 0.029 0.014 2.11 0.051
constant -0.948 0.961 -0.99 0.338

The UAW’s Impact on Wages in the US Auto Industry Zucker 26
Table 6
Multivariate Regression, Adjusted for Autocorrelation
Dependent Variable - “ladjuawwage”
N = 41 R-squared value = 0.9812 F (9, 32) = 104.13 Adj. R-squared value = 0.9717
Variable Coefficient Standard Error t-statistic P-value uawdensity ** 9.889 2.38 4.15 0.001
usunemp -0.0059 0.042 -0.14 0.890 dempres -0.0809 0.0512 -1.58 0.134
autoprofrate 0.00003 0.0021 0.01 0.990 michunemp -0.0321 0.0211 -1.52 0.148
big3mktshare * 1.942 0.907 2.14 0.048 manufproduc -0.0052 0.0062 -0.94 0.413
vecs -0.1009 0.061 -1.65 0.110 usunionapprov 0.0188 0.0135 1.39 0.183
constant 0.223 0.985 0.23 0.824

The UAW’s Impact on Wages in the US Auto Industry Zucker 27
Table 7
Regression Testing for Structural Shifts (1960-1980) Dependent Variable - “ladjuawwage”
N = 21 R-squared value = 0.9488 F (7, 13) = 34.45 Adj. R-squared value = 0.9213
Variable Coefficient Standard Error t-statistic P-value uawdensity ** 5.86 2.14 2.74 0.017 usunemp *** -0.064 0.013 -5.19 0.000
dempres -0.051 0.036 -1.44 0.174 autoprofrate -0.005 0.004 1.47 0.166
big3mktshare * 1.74 0.965 1.80 0.095 manufproduc * -0.016 0.0084 -1.85 0.088 usunionapprov 0.0042 0.0156 0.27 0.790
constant * 2.21 1.16 1.91 0.079

The UAW’s Impact on Wages in the US Auto Industry Zucker 28
Table 8
Regression Testing for Structural Shifts (1980-2000) Dependent Variable - “ladjuawwage”
N = 21 R-squared value = 0.9851 F (7, 13) = 122.41 Adj. R-squared value = 0.9770
Variable Coefficient Standard Error t-statistic P-value uawdensity ** 3.51 1.41 2.49 0.027
usunemp -0.009 0.0107 -0.84 0.417 dempres 0.0492 0.0340 1.45 0.171
autoprofrate -0.00092 0.00094 -0.99 0.342 big3mktshare * -1.12 0.613 -1.83 0.090
manufproduc *** -0.0151 0.0035 -4.26 0.001 usunionapprov * 0.0135 0.0071 1.88 0.082
constant *** 3.464 0.729 4.75 0.000
The UAW’s Impact on Wages in the US Auto Industry Zucker 29
Table 9
Stepwise Regression Significance Rankings
P-value = X < 0.2000 Variable (ranked by significance) P = 0.0000 < 0.2000 UAW Density P = 0.0024 < 0.2000 Productivity P = 0.0040 < 0.2000 Big Three Market Share P = 0.0651 < 0.2000 Michigan Unemployment P = 0.1982 < 0.2000 US Union Approval P = 0.1826 < 0.2000 Partisanship

The UAW’s Impact on Wages in the US Auto Industry Zucker 30
Table 10
Stepwise Regression Results
Dependent Variable - “ladjuawwage”
N = 21 R-squared value = 0.9858 F (7, 13) = 162.53 Adj. R-squared value = 0.9798
Variable Coefficient Standard Error t-statistic P-value uawdensity ** 3.671 1.286 2.85 0.013
manufproduc *** -0.015 0.0032 -4.89 0.000 big3mktshare ** -1.178 0.457 -2.58 0.022
michunemp -0.0072 0.0047 -1.54 0.145 usunionapprov * 0.012 0.0064 1.88 0.082
dempres 0.0442 0.0315 1.40 0.183 constant *** 3.61 0.562 6.42 0.000

The UAW’s Impact on Wages in the US Auto Industry Zucker 31
Table 11
Dickey-Fuller Test for Stationarity
Dickey-Fuller Test 1% Critical Value 5% Critical Value 10% Critical Value
t-statistic = 0.042 P-value = 0.9619
-3.648 -2.958 -2.612
Table 12
Breusch-Pagan Test for Heteroskedasticity
Breusch-Pagan Test Chi-square (1) Prob. > chi-square No Heteroskedasticity Present 0.47 0.4933
Table 13
Durbin-Watson Test for Autocorrelation
Durbin-Watson Test Lower Limit Upper Limit DW-stat (9,41) = 1.51 0.844 1.876

The UAW’s Impact on Wages in the US Auto Industry Zucker 32
Figure 1
The Decline in Wages for UAW Members from 1960 to 2000
2.5
33.
54
4.5
1960 1970 1980 1990 2000year
ladjuawwage

The UAW’s Impact on Wages in the US Auto Industry Zucker 33
Figure 2
The Decline in UAW Density from 1960 to 2000
.06
.08
.1.1
2.1
4
1960 1970 1980 1990 2000year
uawdensity

The UAW’s Impact on Wages in the US Auto Industry Zucker 34
Figure 3
The Positive Relationship between UAW Union Density and Wages
2.5
33.
54
.06 .08 .1 .12 .14uawdensity
ladjuawwage