the transformation of the demographic differential between
TRANSCRIPT

The Transformation of the Demographic Differential
Between the U.S. Military and the U.S. Population
Ryan Moffett1
University of California, Berkeley
Economics Department2
April 2009
Abstract: Using Defense Department and U.S. Census Bureau data from 1997–2006,
this paper analyzes the demographic differential between the U.S. Army and the
population it represents. The shifting trends in the demographic composition are shown
to primarily come from the military recruit labor market and only slightly from military
separations. This labor market is analyzed to discover the relationship between the
racial composition and the market factors: educational attainment, family income,
unemployment, military conflict, race relations, and politics. Fieldwork to discover a
relationship between recruiting practices and the demographic composition found no
evidence of local racial targeting; however national policies targeting Hispanic
underrepresentation are discussed. Time series trend analysis shows that the racial
composition was very steady from 1997–2001, with African Americans being
overrepresented, while white, Hispanic, and Asian cohorts remained underrepresented.
Then, after the invasion of Afghanistan and Iraq, a varied transition began in
accessions: African Americans decreased 43.1 percent, whites increased 21.9 percent
and Hispanics showed little change from their steady increase. Furthermore, time series
analysis indicates a flaw in the Defense Department’s current annual reporting method,
and recommendations for continued observation are made to preemptively detect an
overcorrection that could cause another demographic differential.
Acknowledgement: This thesis would not be possible without the encouragement, helpful discussions,
and continued support of my advisor, Professor Jeffrey Romm. Special thanks also go to Stephanie Gong
for her invaluable help with editing and thoughtful notes. All mistakes are the responsibility of the author.
1 e-mail: [email protected]
2 Undergraduate honors thesis

Moffett i
Table of Contents Page:
List of Figures ................................................................................................................................. ii
List of Tables ................................................................................................................................. iii
Introduction ......................................................................................................................................1
Data Sources ....................................................................................................................................3
2006 Representation.........................................................................................................................5
Military Recruit Labor market .........................................................................................................7
Role of Education ..................................................................................................................7
Family Income .......................................................................................................................9
The Economy ......................................................................................................................13
Army Recruiting ............................................................................................................................16
Interview Process and Results .......................................................................................................16
In-Depth Race/Ethnicity Examination ...........................................................................................27
Black/African American Representation .............................................................................28
White Representation ..........................................................................................................35
Hispanic/Latino Representation ..........................................................................................38
Dream Act ..................................................................................................................40
Military Separations .......................................................................................................................44
Solution from the Navy ..................................................................................................................46
Conclusion .....................................................................................................................................46
Appendix A: Data Tables...............................................................................................................50
Appendix B: Glossary of Terms ....................................................................................................54
Works Cited ...................................................................................................................................55
Works Consulted ............................................................................................................................60
Moffett ii
List of Figures Page:
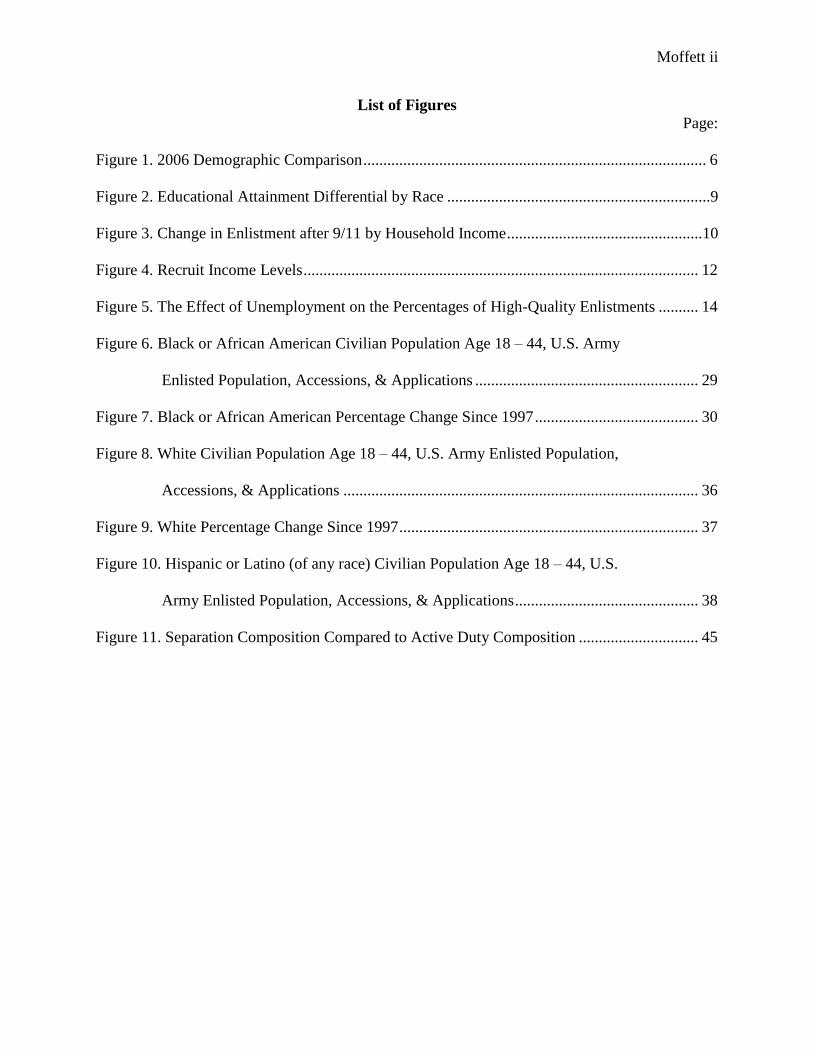
Figure 1. 2006 Demographic Comparison ...................................................................................... 6
Figure 2. Educational Attainment Differential by Race ..................................................................9
Figure 3. Change in Enlistment after 9/11 by Household Income .................................................10
Figure 4. Recruit Income Levels ................................................................................................... 12
Figure 5. The Effect of Unemployment on the Percentages of High-Quality Enlistments .......... 14
Figure 6. Black or African American Civilian Population Age 18 – 44, U.S. Army
Enlisted Population, Accessions, & Applications ........................................................ 29
Figure 7. Black or African American Percentage Change Since 1997 ......................................... 30
Figure 8. White Civilian Population Age 18 – 44, U.S. Army Enlisted Population,
Accessions, & Applications ......................................................................................... 36
Figure 9. White Percentage Change Since 1997 ........................................................................... 37
Figure 10. Hispanic or Latino (of any race) Civilian Population Age 18 – 44, U.S.
Army Enlisted Population, Accessions, & Applications .............................................. 38
Figure 11. Separation Composition Compared to Active Duty Composition .............................. 45
Moffett iii
List of Tables
Page:
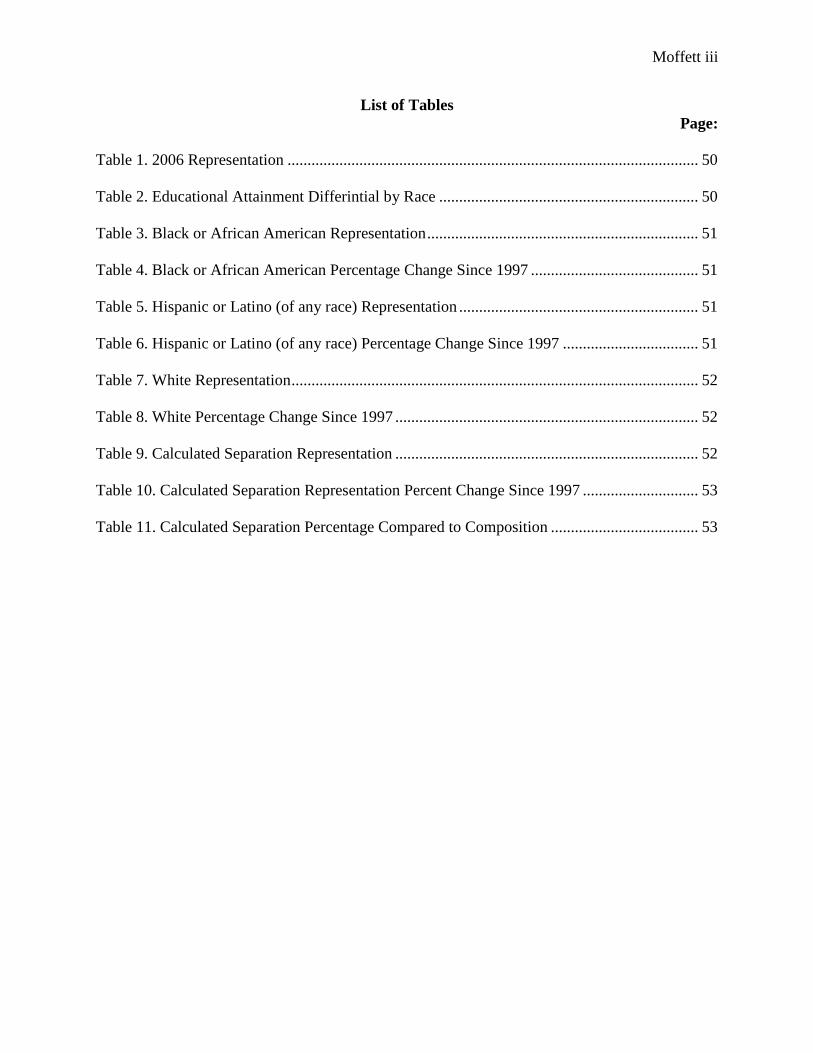
Table 1. 2006 Representation ....................................................................................................... 50
Table 2. Educational Attainment Differintial by Race ................................................................. 50
Table 3. Black or African American Representation .................................................................... 51
Table 4. Black or African American Percentage Change Since 1997 .......................................... 51
Table 5. Hispanic or Latino (of any race) Representation ............................................................ 51
Table 6. Hispanic or Latino (of any race) Percentage Change Since 1997 .................................. 51
Table 7. White Representation ...................................................................................................... 52
Table 8. White Percentage Change Since 1997 ............................................................................ 52
Table 9. Calculated Separation Representation ............................................................................ 52
Table 10. Calculated Separation Representation Percent Change Since 1997 ............................. 53
Table 11. Calculated Separation Percentage Compared to Composition ..................................... 53

Moffett 1
Introduction
As the increasingly unpopular war on terrorism continues and additional American lives
are lost in Iraq and Afghanistan, the task of enlisting new recruits into the military has become
ever more difficult. Meanwhile, the economy has recently emerged from a period of success with
improving opportunity, to a recession with increasing unemployment and economic pessimism.
The increasing stress on recruitment has caused government policy and military recruiting
practices to be called into question. Combined, these socioeconomic, political, and policy factors
have been shaping the military’s demographic composition, primarily through the recruit labor
market. The U.S. Government, through the Defense Department, has implied the goal that the
Military’s racial composition be mostly consistent with the population it serves
(Population…FY2004 ix). However, the military’s racial composition has been going through an
evolving transition at a much different pace than that of the U.S. civilian population. In fact, the
demographic differential between the military’s racial composition and that of the civilian
population it represents has contracted greatly from its peak in the nineteen-eighties: raising
questions about the magnitude of influence these aforementioned factors have had on the
differential through the recruit labor market from 1996 to 2007.
This paper will compare the racial composition of the U.S. Army to the civilian
population over the ten year period from 1997 through 2006. The Army population will be
further broken down by inflows (accessions), outflows (separations), attempted accessions
(applications), and stock (current active duty population). This paper will forgo a historical
examination of how the Army population came to be out of sync as observed in 1997, and
instead concentrate on causes of the change in flows since then. Inflows will be examined by
breaking down the effects of the role of education, family income levels, unemployment rates,

Moffett 2
recruiting practices, and government policy on the recruit labor market; a lot of which have
ultimately shaped accessions. Additional fieldwork examines the incentives of Army recruiters
and the possibility of racially biased recruiting practices. After examining the broader recruit
labor market, the trends exhibited by individual racial and ethnic cohorts are examined over the
time series, including the contrasting magnitudes of change after each of the Middle East
invasions by the United States. Finally, this paper concludes with a policy recommendation to
improve the monitoring of the demographic differential.
This research concentrates on the U.S. Army for simplification, but other U.S. Military
branches also exhibit similar demographic differentials. The fact that the Army is the largest
branch, maintains the largest representation of African American soldiers, and has seen the
greatest transformation of racial composition during the last decade, provides reason for
concentrating on this particular branch of service. Furthermore, enlisted soldiers were focused on
due to comparable reasons of size and representation. To include officers in the comparisons
would be misleading, given that the requirement of a four-year college degree to become a
commissioned officer requires a different population comparison. The civilian population used
for comparison and the composition of the recruit labor market, was limited to ages 18 – 44 in
order to maintain consistency with the Defense Department reporting policy and to properly
account for age requirements and limits for enlisted personnel3.
3 The military allows recruits to enlist at age 17 with parental permission, but due to the rarity and likelihood of
these recruits attaining age 18 by completion of entry level schools, 18 is considered the best age minimum.
For the purpose of this paper, the term Civilian and U.S. population include all of those counted by the U.S. Census
Bureau. This includes civilians, service members, and Veterans. Given the relative small size of these groups, these
additions change the total population very little. The CPS does not have a representational sample that the Veteran
populations could be extrapolated from, for the removal from comparisons used in this paper.
Moffett 3
Data Sources
Before any cause and effect examination can be initiated, this research requires a sturdy
foundation of accurate statistical data. The two primary sources of data used for this research are
the Current Population Survey (CPS) and the Office of the Under Secretary of Defense,
Personnel and Readiness. The CPS is a statistical survey conducted by the U.S. Census Bureau
for the Bureau of Labor Statistics (BLS). It proves to be a better source than standard Census
statistics for this paper, because of its greater frequency of completion and additional data filters.
The CPS data was collected through the use of the Integrated Public Use Microdata Series
(IPUMS) data extraction tools which combine census microdata for social and economic
research. Other data that proved useful from the U.S. Census Bureau were from the 2006
American Community Survey and the American Fact Finder Database. The Defense Department
data is made available by the Senate Armed Services Committee’s requirement that the Office of
the Under Secretary of Defense publish the annual report Population Representation in the
Military Services to provide a snapshot of the current Department of Defense demographic. The
data used for these reports is attained by all Defense Department agencies and maintained by the
Defense Manpower Data Center (DMDC). The most recent published report covers fiscal year
(FY) 20064. It is inconvenient that the Defense Department has yet to publish FY: 2007, and FY:
2008, but the transformational trends during the ten year period from 1997 to 2006 prove worthy
to study. Future updates and composition monitoring are recommended as new data is published.
For statistical consistency, only civilian data collected from the CPS was used for
comparison, charts, and graphs5. Data was collected for the years 1997 to 2006 due to relevance
4 The fiscal year for the Department of Defense purposes is October 1
st through September 30
th.
5 Statistical data on the civilian racial representation was actually collected from IPUMS-USA, Fact Finder, and the
Department of Defense through the Defense Manpower Data Center (DMDC). When compared though, all of these
data sources differ by as much as 2 to 5 percent.

Moffett 4
in trending and importance of examining the most recent published data. Making complete
comparisons across all years is difficult because racial categories were expanded and changed
during the FY: 2003 reporting period. The Defense Department increased its reporting categories
from four (white, black, Hispanic, other) to eight (white, black, American Indian or Alaskan
Native [AIAN], Asian, Native Hawaiian or Other Pacific Islander [NHPI], two or more races,
and Hispanic or not Hispanic). The change in reporting policy was made in 2003 to comply with
the requirements of the Office of Management and Budget (OMB) recommendations set forth in
Standards for Maintaining, Collecting, and Presenting Federal Data on Race and Ethnicity.
However, due to this dramatic change in statistical gathering; the FY: 2003 active duty racial
data was not complete in the annual report6. It appears that both the U.S. Census Bureau and the
Defense Department have continually altered their demographic categories for reporting
purposes. Using only the provided data, it would also be improper to compare the Hispanic or
Latino category with any other category, due to the different policy for counting this group. Both
the Census Bureau and Office of the Under Secretary of Defense present their populations by
race in one table, leaving out Hispanics and Latinos, and then display only Hispanic and Latinos
in a separate ethnicity table. Therefore, most Hispanics and Latinos are counted twice in multiple
categories. For this reason, all comparisons will be made on a one-to-one basis between the same
category in the total population and Army population.
6 In most cases data from different groups will be compared in the same year and reporting category so the new
reporting method should not cause anomalies. However, in the case of the missing 2003 data, for graphical
representation 2003 was estimated by a simple average between 2002 and 2004.
Moffett 5
2006 Representation
With statistical data from the CPS and the Office of the Under Secretary of Defense, the
racial differential between the total U.S. population, the U.S. Army, and the U.S. Army’s
accessions7 can be examined. As mentioned earlier, the most current data available is from FY:
2006, and will be used here as the most recent point in time for comparison. To begin with,
solders labeled ―white‖ were the largest racial cohort in the Army but underrepresented in
comparison to the civilian population. According to CPS data, 78.8 percent of Americans were
labeled white in 2006, while only 66.6 percent of the Army population and 74.9 percent of
accessions were white in 2006. The Asian population was also underrepresented on active duty,
and even more so in current accessions. According to the CPS, 5.1 percent of Americans
considered themselves Asian, but only 3.3 percent of Army soldiers and less than 2.0 percent of
current recruits did. The greatest surprise to common media opinion comes from the data on
individuals the government considers Hispanic or Latino8. According to CPS data, Hispanics
made up 17.4 percent of all Americans in 2006, but only 11.6 percent of the Army. The Hispanic
cohort is not currently closing their underrepresentation with a matching representation of 11.6
percent of accessions. Given the current rate of civilian Hispanic population increase and lack of
equal representation by Hispanic recruits, this racial divide can be expected to continue its
expansion. In 2006 only those categorized as black or African American were overrepresented in
the Army compared to the civilian population. African Americans made up 13.1 percent of the
U.S. population, but an astounding 22.7 percent of the Army’s enlisted population. Of equal
7 Only non-prior service (NPS) accessions were examined, as the Defense Department breaks accessions into two
Groups: NPS and prior service. Prior service accessions represent a slightly different cohort since they have
previously enlisted, separated and are usually returning for different reasons then NPS Accessions. NPS accessions
also make up a majority of new recruits. 8 Common media opinion references the multiple articles found during this research that alludes to military
recruiters targeting the Hispanic Cohort to fill their ranks.

Moffett 6
importance and the topic of later discussion however, is the drop in African American accessions
closer to their target percentage; in 2006 they made up 12.6 percent of accessions and this
number has shown continual decreases since the beginning of war on terrorism (Miriam et al.;
Population…FY 2006 2-7). The data from 2006 quickly points out two issues central to this
paper: the overrepresentation by African Americans and underrepresentation by whites and
Hispanics. Figure 1 is a visual representation of the differences between the three populations by
the race and ethnic categories reported. Each bar represents the cohorts percentage of the total
composition of the associated population.
Figure 1
0%
10%
20%
30%
40%
50%
60%
70%
80%
90%
White Black or African
American
AIAN Asian NHPI Other Race
Two or more races
Hispanic or Latino (of any race)
US Civilians Age 18-44
US Army Enlisted
US Army Accessions
FY: 2006 Demographic Comparison
Source: U.S. Army data from ten separate annual reports Population Representation in the Military Services,
FY: 1997 – FY: 2006 published by the Office of the Under Secretary of Defense, Personnel and
Readiness (see works cited). Table of data also provided in appendix A.
Note: Both the Census Bureau and the DOD classify Hispanic or Latino as an Ethnicity, different from the other
(race) categories in this graph, so they should not be compared except within their own classification,

Moffett 7
Military Recruit Labor Market
Military accessions are the inflows of new recruits which alter the active duty
demographic composition and comprise the new recruit labor market. Although outflows
(separations) will be briefly discussed later, it is the examination of accessions along criteria
such as education, family income, unemployment rate, demographics, and other characteristics
that have shown change worthy of further assessment. These factors have all been proven to
affect the recruit labor market as a whole, but they are not consistent along racial cohorts so they
also affect the demographic differential.
Role of Education
An essential side note to consider is the importance that the racial differential in
education attainment plays on military accessions and general statistical comparisons. The
Defense Department maintains a policy that requires greater than 90 percent of military members
hold a high school degree or higher credential (Population…FY2004 2-16). According to
Manpower Quality in the All-Volunteer Force, published in 2004, the reason for this requirement
is that ―over 75 percent of recruits with high school diplomas will complete at least two years of
service, compared to just over 55 percent of their nongraduate peers‖ (Armor and Sackett).
Unfortunately high school completion is not equal across demographic cohorts. In-depth
comparisons on the racial differential between these populations could factor in these educational
roadblocks. For example, although the Census data would say that Hispanics make up 17.4
percent of the population, and African Americans 13.9 percent, if their high school completion
rates are not equal across race, these cohorts may not make up the same percentages of the true
recruit labor market (Miriam et al.). According to the Department of Education data, published in

Moffett 8
Population Representation in the Military Services: FY 2004, only ―62 percent of 18 to 24 year-
old Hispanics completed high school… compared to 75 percent of Blacks and 80 percent of
Whites‖ (2-13). Therefore, percentages gathered from CPS data cannot be directly tied to the
market for recruits without factoring this in. According to CPS data, considering only the high-
school-graduate population would show marginally greater overrepresentation by African
Americans, greater underrepresentation by whites and Asians, and less underrepresentation by
the Hispanic population (Miriam et al.). Figure 2 provides a look at the demographic differential
between the civilian population with and without high school completion from 1997 to 2006. It
does this by displaying the difference between a civilian comparison population with a high
school diploma, and a comparison population with no education attainment filter. It is clear that
the reporting of the Hispanic cohort would see the greatest change if education was factored into
the demographic differential, as their underrepresentation would be decreased if the military
composition was only compared to the diploma attained population. However, given the Defense
Department’s goal to close the demographic differential, this paper will assume that the problem
of high school graduation rates will be left as a separate concern. Furthermore, it will be assumed
that the more worthy goal should be an equal representation of the American population and not
just to the high school diploma-holding American population9. Additional evidence will be
presented later to suggest that the Hispanic cohort may not follow the higher attrition rate
correlation with a lack of high school completion statistic described above.
9 By no means should this suggestion of a comparison population subordinate the real problem of low graduation
rates of the Hispanic cohort. The assumption here is that the Department of Education should work toward raising
these rates to an equal level and the Defense Department should plan accordingly.

Moffett 9
Figure 2
Family Income
Another important issue when discussing the new recruit labor market is the examination
of family income levels as another disparity that many people might assume adds to the racial
misrepresentation. In other words, it is thought to be true that most recruits come from lower
income families or that recruiters target those recruits who stand to gain the most monetarily by
enlisting in the Military. So after the attacks on 9/11, it would be easy to assume that when
recruiting became more difficult, recruiters would move further into lower-income
neighborhoods. However, The Heritage Center for Data Analysis argues that this assumption is
incorrect. In their report, Who Bears The Burden? Demographic Characteristics of U.S. Military
Recruits Before and After 9/11, published November 2005, Tim Kane, Ph.D. analyzed
recruitment data between 1999 and 2003. His findings were that ―Proportionally, both poorer
-5.0%
-4.0%
-3.0%
-2.0%
-1.0%
0.0%
1.0%
1997 1998 1999 2000 2001 2002 2003 2004 2005 2006
Educational Attainment Differential by Race
White Black or African American Hispanic or Latino (of any race)
-4.2%
Source: CPS Data (Miriam et al.)
Calculation: Representation in the population with at least 12th
grade completed minus (-) the representation
in the general population without education filter. Calculated in percentages and rounded to nearest
tenth.
Note 1: Only those categories with consistent recording across all years displayed in table.
Note 2: The largest difference is in the Hispanic/Latino Cohort. The -4.2 percentage is actually quite large
given that this number represents -4.2 percent of the US population since it is a compositional
difference.

Moffett 10
and richer areas provide slightly fewer recruits, and middle-income areas provide slightly more‖
(Kane 10). In figure 3, Kane provides a visual chart displaying recruits in income bracket
$40,000 and below, provided the same number or fewer recruits after 9/11; conversely, brackets
above $40,000 provided the same or more. Income levels were measured by family, and not by
actual recruit as this data are unavailable. According to the U.S. Census Bureau, the median
household income for this time period was $46,326 (DeNavas-Walt, et al. 4). Since it is the case
that income is not evenly distributed over racial cohorts, this trend may in fact expand the racial
gap in the military population.
Figure 3
*Percentage point difference represents the distribution of 2003 recruits minus the distribution of 1999
recruits. Positive bars indicate higher levels of recruits from that income cohort.
**Median household income was calculated by ZIP code tabulation area, based on the Census 2000.
Source: (Kane 2003, 10)
Note: Heritage Foundation calculations based on data from the U.S. Department of Defense, Office of
the Under Secretary of Defense, January 2003-September 2003 Non-Prior Service Enlisted
Accessions, and U.S. Bureau of the Census, United States Census 2000, Summary File 3, at
www.census.gov/Press-Release/www/2002/sumfile3.html
Change in Enlistments After 9/11, by Household Income
Percentage Point Difference*
Median Household Income** ($ thousands)

Moffett 11
Whereas figure 3 presents the changes in accessions by income level from late 2001 until
the published date of 2003, figure 4 moves outside the standard ten-year time period of this paper
to examine current recruit composition by income. Figure 4 was constructed by the National
Priority Project (NPP) which breaks down recruits into deciles by medium family income from
the zip code of their enlistment. Although it would be more exact to compare actual recruit
family income, this information is not currently available. The x-axis on this chart is broken
down into ten deciles; each representing 10 percent of the youth population ages 18–24. For
example, the first decile shows that 10 percent of the youth population lives in communities with
a median household income between $0 and $30,839. The vertical bars represent the quantity of
recruits coming from those areas during the corresponding years. According to the NPP, youth
from the lowest decile and the two highest deciles are underrepresented, and the NPP points out
that the two highest Deciles have seen a continued drop since 2005. It appears that the majority
of accessions for these years have come from middle to lower middle income neighborhoods.
Similar to the previous figure, another important comparison point is the 2008 median household
income at $50,170, which lies in the 6th
decile (National Priorities…).

Moffett 12
Figure 4
This information is important for two reasons. First of all, although both the highest and
lowest income cohorts are underrepresented, this data fails to show a significant targeting of
lower income youth. Second, if the different racial cohorts are not evenly spread throughout this
distribution, it can be assumed that the civilian family income level of the recruit labor market
has had and will continue to have an effect on the racial composition of the Army. The debate
over the true impact of family income on military accession is not that simple though, and will
likely continue for years to come. For a different point of view, Ann Tyson of the Washington
Post argued in 2005 that pentagon data showed that the military was increasingly relying ―on
economically depressed, rural areas where youths' need for jobs may outweigh the risks of going
Source: (National Priorities…)
Note: Actual graph copied from source due to authors not publishing or making public data used in its
creation. ―Median household income estimates by ZIP code are drawn from 2008 estimates from
Claritas, Inc. [http://www.claritas.com/Default.jsp] (These data were purchased by NPP.) Army data
were obtained from the Army through a [Freedom of information act] FOIA request submitted by
NPP. Recruits from Puerto Rico and U.S. territories are not included. The numbers indicating the
decile ranges are from 2008‖.
2008 MHI: $50,170
Recruit Income Levels
Income Deciles
Per
cen
tage
of
Rec
ruit
s

Moffett 13
to war‖ (A01). Tyson also quotes Anita Dancs, research director for the NPP, as saying, "A lot
of the high recruitment rates are in areas where there is not as much economic opportunity for
young people" (qtd. in Tyson A01). Regardless of the magnitude of family income levels on
military accessions, it should be a clear goal of the Defense Department to include income levels
in its goal to create a representational military population.
The Economy
The state of the economy plays a large role in the supply of military recruits. Civilian
employment is a substitute for military service; therefore the supply of civilian employment is in
direct competition with military recruitment. Periods of high unemployment, when jobs are
difficult to attain in the civilian market can make youth more willing to consider military service,
and recruitment of what the Defense Department calls ―high quality recruits‖ becomes easier.
High quality recruits are the most sought after members of the recruit labor market, and are
designated as such by the Defense Department following completion of high school and the
attainment of a certain, unpublished, high score on the Armed Services Vocational Aptitude
Battery (ASVAB)10
. For comparison during the 1990s, when youth unemployment11
was
relatively high, as much as 14.2 percent in 1992, 74 percent of new recruits were high quality,
but in 2000 when youth unemployment was 9.3 percent, the proportion of high quality recruits
was as low as 57 percent (Bicksler and Nolan 3). In figure 5, you can see the relationship
between the youth unemployment rate and high quality accessions for the 20 year period of 1985
to 2005.
10
The ASVAB has also been identified as the Armed Forces Qualification Test (AFQT) in recent publications. 11
Youth Unemployment is the measure of unemployment of the civilian noninstitutional population, ages 16 to 24.

Moffett 14
Figure 5
Analysis completed for the Defense Department of the relationship between the
unemployment rate and high quality enlistment rates estimate that a 10 percent decrease in
unemployment (e.g. from 5 percent to 4.5 percent) would reduce high quality Army enlistments
by approximately 5 percent, or nearly 2,500 recruits. Now this is not to say that recruitment will
fall by this amount; it is important to point out the success of the Defense Department in
reaching its recruitment goals. During the 24 years from 1982 to 2006, the department has only
failed to reach its goals three times in 1998 and 1999, during periods of low unemployment, and
then more recently in 2005. Therefore, the decrease in high quality accessions associated with a
decrease in unemployment would likely mean an increase in non-high quality accessions. If the
racial composition is not equal across this high/non-high quality divide, it can be assumed that a
change in unemployment would affect the racial composition of accessions. The Army has not
Source: U.S. Department of Defense and the U.S. Bureau of Labor Statistics, 2006. (Bicksler and Nolan 3)
The Effect of Unemployment on the Percentages of High-Quality Enlistments

Moffett 15
consistently published the racial breakdown of recruits by what they consider high quality or not.
However, given that some minority cohorts have lower high school completion rates, as
discussed previously, and may score lower on ASVAB due to language barriers or other reasons
to be discussed later: these minority cohorts may comprise a larger portion of non-high quality
recruits. This disparity in representation would suggest that a decrease in youth unemployment
could cause an increase in the representation of some minority cohorts in the accession
population.
This relationship between unemployment and accessions is especially important now
given that the youth unemployment rate has risen from 11 percent in 2005 to 14 percent in 2008
and is expected to continually increase throughout 2009 as the recession continues to hurt the job
market (U.S. Bureau of Labor Statistics). This increasing unemployment rate will increase the
supply of high quality recruits. Adding to the complexity of this relationship is the disparity in
unemployment among racial cohorts. For example, the fact that African Americans have a youth
unemployment rate nearly twice that of whites would lead to a greater representation of African
Americans in the military than whites (Baron and Williams A1). Holding all else constant, as the
current recession worsens, the Defense Department should expect an increase in minority
accessions representing racial groups with inconsistently higher youth unemployment rates.
Remembering that this increase will be countered somewhat by the increase in the
nonrepresentational high quality recruit supply discussed previously. Further reporting of the
racial breakdown of recruits in these quality designations by the Defense Department, and
examination of the possibility of differing relations between unemployment and accessions by
individual cohorts is required to fully understand the complex relationship between
unemployment and the military’s racial composition.
Moffett 16
Army Recruiting
Army recruiters are on the front line of accessions, and regardless of whether they
contribute to the racial differential or not, distinguishing between the policies they are guided by
and their actual methods may hold the key to corrective policy. Recruiting is the primary basis
for accessions into the military and the center of much of the controversy surrounding race and
questionable tactics. Along with analyzing published statistics and reading the available
literature, interviews were also conducted to search for a link between recruiters and both the
cause and solution to the demographic differential. The method used to investigate how
recruiters conduct themselves on the job was observation and a series of interview questions.
Interviews and observations to examine possible racial targeting concentrated on two
distinct areas of California, with data collected from the Bay Area near Oakland and the Central
San Joaquin Valley, near Fresno. The Bay Area was chosen for its high Asian and African
American population in comparison to other areas of California. For comparison, the southern
San Joaquin Valley was chosen for its high representation of Hispanics, Laotians, and Hmongs.
These two areas provide two demographically distinct populations and offer a chance to examine
if Americans, of Asian descent, are being ignored as statistics may suggest, or if Hispanic
Americans are being targeted as recent public media reports have claimed.
Interview Process and Results
Conducting interviews proved to be no small task, and the difficulties involved will be
discussed later. The goal of this small field study was to gain the opinions of recruiters
conducting operations in California. Recruiters are unlikely to admit to discriminatory recruiting

Moffett 17
policies, so the interviews were designed to allow recruiters to discuss race as much as they felt
comfortable.
Recruiters were asked a set of similar questions for comparability, but all were also
encouraged to elaborate as much as they wished on any topic. The questions were designed to
attain the opinion of the local recruiters rather than politically correct answers that the Army
Command might have given if asked. Recruiters of different races including: white, African
American, and Hispanic were interviewed. These interviews were conducted during normal
office hours at recruiting offices. All interview participants will remain anonymous to protect
their privacy and military careers.
Prior to meeting with recruiters, the military regulations outlining their duties were
examined to gain a better understanding of their practices and the regulation of their daily
activities. These include Army Regulation (AR) 601–1, Assignment of Enlisted Personnel to the
U.S. Army Recruiting Command, December 2006; AR 601–210 Active and Reserve Components
Enlistment Program, dated June 2007; and U.S. Army Recruiting (USAREC) Regulation 672-
10, Recruiting Incentive Awards, dated February 2002. The first two regulations provide
directives for doing the job of Army Recruiter. The third regulation covers incentive programs
set in place to motivate recruiters to succeed in their jobs and enlist large numbers of what these
regulations call ―high quality‖ recruits, as explained earlier. U.S. Army regulations are in-depth,
in general, and these examples correspond to this, but none of these regulations have any
mention of race or ethnicity. The third regulation listed, USAREC Reg. 672-10 describes an
incentive program that may have the capacity to add demographic corrective factors. If
recruiters are truly motivated by this incentive matrix, which is outlined later, then a program

Moffett 18
establishing greater incentives for underrepresented racial cohorts may increase recruiters’ effort
expended towards recruiting members from these cohorts.
Devoid of the Army’s recruiter incentive program, what are the incentives that really
motivate recruiters? In general the job of a recruiter is not sought after by the average soldier. A
majority of recruiters are selected by the Department of the Army, and the selected soldier is
given no choice but to do the job. While conducting field research, not one recruiter who had
volunteered for the job, could be contacted. According to those interviewed, the job of recruiter
is commonly described throughout active duty as one of the worst duties to be assigned to while
serving in the military. This forced labor supply then does not come with the self-motivation in
the form of wanting to do the job that many other labor markets have. Of course, there are
always some exceptional soldiers who choose the duty to further their career or for other
personal reasons.
The Army attempts to motivate its recruiters with a complex and possibly irrelevant
incentive program. USAREC Regulation 672-10 explains that after completion of recruiting
school the Basic Recruiter Badge is awarded. This badge is like most other badges worn by
soldiers on their uniforms, except that in the recruiter’s case, it becomes the basis for a complete
incentive program. Once a recruiter starts their job, they begin to earn points for every recruit
they enlist. As points are accumulated, the recruiter progresses through an award matrix with
nine steps. Each of the first seven steps add luster to the recruiters badge. The first three steps
are the addition of gold stars, then a gold badge, three more sapphire stars to replace the gold
ones, and then the badge is complete. The next level in the system is the award of a recruiter
ring, and finally the last award is the Glen E. Morrell Award, which is issued to very few
recruiters because the point requirement is twice that of the recruiter’s ring (USAREC 2).

Moffett 19
Although these incentives may be difficult to achieve, and provide a feeling of personal
accomplishment, they provide little more in value. The Ring can be worn in very few uniforms,
and in today’s Army the badge can sometimes be looked at with negative condemnation, because
some combat veterans believe that volunteering to recruit can be used as a way out of going to
war.
During the interviews, recruiters confirmed that the current incentive program provided
by the Army does not motivate them. With the exception of one recruiter, all of the recruiters
interviewed said they cared little about the Recruiter Badge Incentive Program. From the
interviews conducted, it appears that recruiters at different hierarchical levels share correlating
levels of concern for the point system. Recruiters in their initial year or so on the job seem to
care very little about the points and just try to maintain the minimum, but later as their skills
progress they may become more interested in the program. Even the showing of interest in points
does not come at a level sufficient to say the system really caries much weight in the recruiters
choices or actions while on the job. These awards provide no monetary value and do little to help
the soldier succeed once they return to their regular Army positions. Given this lack of
consideration for the current point system, it is evident that any effort to structure a demographic
correcting point system would have to also include a revision to current incentives with added
value in mind.
While examining the regulations covering Army recruiting, a full set of classroom
presentations12
used in the formal recruiting training program to transform soldiers into Army
recruiters was also provided for assessment. After searching through presentation after
presentation, the most notable revelation is the level of sophistication and market research at the
12
PowerPoint documents distributed by the U.S. Army recruiting school at For Jackson South Carolina, available to
all students of the course, and those interested in becoming an Army recruiter.

Moffett 20
supervisor/command level. During a six week course a new recruiter can expect to learn how to
sell the Army and successfully complete their three year recruiting commitment. The school
places special consideration on the punishment recruiters face for illegal actions like
inappropriate relations with recruits, such as romantic or other non professional relationships.
However, race specific recruiting tactics are not discussed in the presentations. The last section
in recruiting school involves several practical exercise simulations where recruiters are put
through scenarios they might face on the job. According to the regulations, new recruiters also
receive onsite training once they arrive at their prospective offices. With no mention of race in
either the regulations or classroom material it leads to the suggestion that if racially biased tactics
are in fact taught, this would have to take place on a one-on-one basis in simulation or during on-
site job training.
While interviewing recruiters, a problem arose quickly with the likelihood of on-site
racially-biased instruction. One of the complaints made by recruiters was the lack of actual
onsite training. This is most likely due to the lack of available trained recruiters. When a new
recruiter arrives on site as a replacement, most of the time the individual being replaced has been
gone for a few months. This lack of overlap leads to low continuity and forces fresh recruiters to
forge new relationships with community members and campus faculty. Recruiters are still bound
to discuss their hardships and successful practices with one another so racial tactics may still
arise. All recruiters interviewed for this research denied such activities, but denial does not
overrule the possibility.
If the planned recruiter incentive programs are not motivating recruiters to do their job,
then what is? Sense of job importance and self-drive to succeed probably provide some
motivation, but this may be negligible given that none of the recruiters interviewed had
Moffett 21
volunteered for the duty and a strong majority expressed dislike for the job. It turns out fear is
the biggest motivator for the recruiters interviewed. The fear of reprimand for not ―making the
mission13
‖ is very high on the recruiter’s mind. The recruiters interviewed stated that they felt
little support or compassion from their commands, and a couple of recruiters explained that they
felt their command was out to protect their own careers given the difficult work environment
within the recruiting field. When asked if a system of monetary compensation could work as an
incentive program, most recruiters rejected the idea. The recruiters interviewed believe that if a
system of bonuses reflecting job success were instilled, it would create a cut-throat environment.
Various recruiters also voiced fears that a monetary compensation program could cause some
recruiters to push some unqualified individuals into the service to increase their bonus.
When recruiters were asked to come up with ideas to make recruitment more productive,
they discussed recruit incentives instead of recruiter incentives. They asked for more lucrative
incentives for new recruits, explaining that cash bonuses for new recruits helped more than other
alternatives. A need for more recruiters was also expressed, which stems from the complaint
mentioned earlier, with the lack of recruiter continuity and overlap during transition.
If incentives for recruiters are too difficult to outline and manipulate then maybe a
program where new recruit demographics are taken into consideration when recruit incentives
are assigned would work. This plan could prorate incentives based on the Army’s need for the
new recruit’s demographic. This system has some immediately noticeable pros and cons. The
lack of current symmetry or complete information given to current recruits would make this
program possible. As it currently stands, new recruits are not fully informed on how the system
works, nor do they know what the recruit before or after them will receive. It is common for new
soldiers to find that they received completely different contract terms than the soldiers they
13
―making the mission‖ is successfully enlisting the suggested quota for the recruiter, in the given time period.

Moffett 22
attend initial training with, to include number of required active-duty years, bonuses, and other
enlistment incentives. If an Asian female recruit did not know that she was receiving a larger
bonus because the Army needed more recruits with her characteristics, she might not mind.
Conversely, if the Army becomes over populated with white males, they might not have to offer
the same bonus to gain another white male recruit. This quickly becomes a system analogous to
affirmative action and may be described by some as pure discrimination that would potentially
inspire negative media attention. If a system of this type were put in place it would mean that
African Americans, which are the only race overrepresented in the Army, would receive fewer
incentives for enlistment than other less represented races. The morale of African American
soldiers could presumably decrease quickly if they came to believe this program made their
service worth less than the service of individuals with other racial different backgrounds. This
system would be highly controversial and most likely could never be established.
The reason recruiters representing different races were so easily available for interviews,
is that recruiting offices are purposely kept diverse. One recruiter interviewed explained that the
race of the recruiter was always a factor in the command’s decision when assigning them to a
local office. The stated reason for this is to maintain a good mix of racial representation in all
recruiting offices. A recruiter explained that when a new recruit walks into an office seeking
information, the Army wants to show that they represent a racially diverse group. Recruiters
explained that the race of the individual recruit does not dictate which recruiter works with them.
During the interview process two new high school recruits were observed interacting with their
recruiters: one Hispanic female with a white male recruiter and one white male with a Hispanic
male recruiter, the suggested assumption is that this is a purely coincidence.

Moffett 23
Most recruiters interviewed were hesitant to discuss race and demographics. Interview
responses explain that the Army expends large amounts of time and effort to instill political
correctness in its soldiers. At a minimum, all Army units have an Equal Opportunity
Representative that conducts quarterly classes for all soldiers to attend. Recruiters consequently
only discussed race when they were alone in the interview and trusted that their responses would
remain anonymous.
When asked whether one race or demographic was particularly difficult to enlist, most
recruiters quickly responded ―no.‖ Bay Area recruiters did however point to some facts about the
Asian community that they felt made their job more difficult, further explaining that they believe
the Asian community is very family orientated. One recruiter explained that for an Asian
teenager to join the Army, the recruiter would have to meet with ―the mother, father, aunt, uncle,
grandma, and grandpa, and that it would be a decision they would all have to make.‖ Recruiters
in Central California said they see very few African Americans enter their office and that they
only make up about one percent of local recruits. However, this low representation is consistent
to Census data stating that only 2.0 percent of the population in this recruiting office’s target
county (Tulare) were African American in 2007 (U.S. Census Bureau).
When asked whether one race or demographic was particularly easier to enlist, recruiters
were again hesitant to single one out. They stated that recruiting for the most part was difficult
and that very few individuals were easy to enlist. Recruiters in Central California explained that
Hispanic males in the area were more likely to be enticed by signing bonuses and benefits the
Army had to offer. According to the same recruiting office, about 70 percent of local recruits are
Hispanic14
. However according to Census data, only 56.7 percent of the target county were
14
These percentages were only an estimate of a recruiter interviewed and could not be confirmed by official
documents breaking down local recruits as this information is not publically available.
Moffett 24
Hispanic in 2007 (U.S. Census Bureau). This difference would suggest that unlike the national
population comparison, Hispanic accessions are overrepresented in this recruiting office.
The interviews provided one possible recommendation to decrease the difficulty of
recruiting and possibly increase recruiting levels when the complaint about location from nearly
all of the interviewees became a trend. The complaint from those interviewed was that they had
little input in the Department of the Army’s choice of where they would recruit from. One
recruiter explained that new recruiters could make a wish-list of about six broad geographic
regions, but may not receive any of them. When new recruiters arrive at their duty office for the
first time, most have never been to the area and know very little about it. One recruiter in a Bay
Area office explained that he grew up in a small town in Texas, and was having a difficult time
adapting to the way of life and the large, diversely-populated Bay Area. This individual had a
strong desire to recruit in Texas and believes he would have had a less difficult time doing so.
So why does the Army not place many of its recruiters back in the towns they themselves were
recruited from? Recruiters explained that if the local office did not need someone depicting their
demographic, they could not be assigned there. According to recruiters interviewed, these
decisions are currently made at the battalion or company level and not at the national command
level. Alternatively, if the national management of recruiters took demographics and location
choices into account when assigning individuals, they may increase the opportunity for recruiters
to work in areas they are more familiar with. Simultaneously, this may also cause the
representation of the recruiting force to match that of the local recruit supply, given that the
recruiters would come directly from it.
While conducting interviews with recruiters, it was easy to recognize that they hold the
mindset that those not in agreement with their efforts, may be out to harm them. This stems from

Moffett 25
the many negative media reports about recruiters and protests at all levels. Conducting research
in the Bay Area proved difficult because protests have shut down the Army recruiting office in
Oakland, and organizations such as Code-Pink15
continually protest for the removal of the
Marine officer recruiting center in Berkeley. An Army recruiter operating in the Bay Area said
that adults in the area disliked his presence and regularly complained to him about the war in
Iraq and President Bush16
―as if [he] had a direct line to the president.‖ Recruiters in the Bay
Area brought up the anti-war movements of the Vietnam War and said they were now tasked
with enlisting the children and grandchildren of the past protestors.
Community leaders from areas around the nation and from differing racial groups stress
that recruiters stay away from the population they represent. In November of 2008, ―voters in
the Northern California cities of Arcata and Eureka approved ballot measures barring military
recruiters from initiating contact with anyone under 18‖ (Zavis 1). In 2007, when Army
recruiters sponsored a day of the Bronx Latino Festival, which they have done for the last three
years, two local elected officials, surrounded by about a dozen supporters, stood nearby in
protest. Assemblyman Jose Rivera of the Bronx said ''We should not be allowing our public
recreational space to be used for recruiting our youngsters to get killed in Iraq'' and City
Councilwoman Melissa Mark-Viverito, who represents East Harlem and the Mott Haven section
of the Bronx added, ''Our children are not for sale'' (Santos 3). Councilwoman Melissa Mark-
Viverito went on to say ―the Army… had increasingly focused its recruiting efforts on the city's
low-income and minority neighborhoods. Last year, the Army opened a recruitment station on
15
Code Pink is a women-initiated self proclaimed grassroots peace and social justice group working to end the wars
in Iraq and Afghanistan, stop new wars, and redirect resources into healthcare, education, green jobs and other life-
affirming activities. http://www.codepink4peace.org/article.php?list=type&type=3 16
This interview was conducted while President George W. Bush was still in office.
Moffett 26
103rd Street in East Harlem, which is predominantly Hispanic, much like the crowd [at the
Bronx Latino Festival]‖ (Santos 3).
Much of the difficulties in recruiting start well before a recruiter finds themselves on the
job, but stem from the military’s policy of taking soldiers who occupy traditional military jobs
and demanding that they perform as salesmen. The increase in the military’s suicide rate is not
limited to combat troops and has seen a dramatic increase in the recruiter population, so much so
that a military investigation was ordered to investigate four recruiter suicides in one Houston
Texas district. In January 2009, the investigation found that ―poor leadership, job-related stress,
personal and medical problems contributed to the deaths‖ (Jordan). Douglas Smith from Army
Recruiting Command explained that every recruiter was required to stand down February 13th
2009 "to discuss suicide prevention and wellness resources available to [recruiters]" (Jordan).
The stresses of the job add to the explanation that recruiting for the military is difficult, and the
ineffective incentive program points to recruiters taking the path of least resistance in this task,
consequently enlisting whomever they can get to sign the dotted line. This may lead to
recruiting statistics that suggest racial targeting, if one racial cohort exhibits a higher willingness
to enlist, or is generally more likely to have interest in military service17
.
Maybe the most interesting finding of the field study was that the interviews almost did
not happen. The fact that recruiters feel targeted by local community members, media
organizations, and academia led to some difficulties when conducting this research. The first few
attempts to conduct interviews were cut short, when the research’s affiliation with U.C. Berkeley
and the topic of racial demographics were announced. Initially, the attempted interviews were
conducted in a very professional manner; appointments were made and a professional approach
was presented. Over the phone, recruiters refused to answer questions and requested that all
17
This may be amplified in geographic locations where economic polarity among races is great.

Moffett 27
questions come through a public affairs office or the regional recruiting command. Furthermore,
the recruiters explained that one of these two offices would have to approve each and every
question before it would be answered by a local recruiter. Six phone calls were made to this
public affairs office without a response, and then another couple of calls were made to a different
Army public affairs office, again without a response. A valid attempt was made to go through
the formal process of dealing with the public affairs office to learn how things would develop,
but honest responses from actual recruiters are worth far more to this paper then the structured
response from a public affairs office that does not recruit or deal with demographic differences
on a regular basis.
Successful interviews only occurred after an alternate approach was used. Interviews
were initiated with unannounced visits to recruiting offices. They proceeded very informally as
informational interviews to help out a student Veteran in need of some answers. Little to no
emphasis was placed on the association with U.C. Berkeley. Even with this alternate approach,
most interviews still began by initially being pushed away but with lengthy conversations many
of these turned into successful interviews. In the end, some interviews were successful, while
others were not. Complete and continued research in this area would be much more productive
with Army command support.
In-Depth Race/Ethnicity Examination
Now that some relatively broad topics have been discussed, this paper will continue by
breaking down the composition of the compared populations by race to examine the trends over
the last ten years, from 1997 through 2006. The black/African American representation will be
covered first, since it has seen the largest change during this time of transition. Then the white

Moffett 28
representation will serve as a good contradictory comparison, and finally the Hispanic/Latino
representation will be examined. These sections will also include race/ethnicity-specific topics.
Due to the inconsistencies with the reporting and recording data discussed previously, other races
will not be closely examined in this section.
Black/African American Representation
For many decades now, the black or African American population has been the only
recorded racial cohort to be overrepresented in all U.S. military services18
, but this over
representation has been declining over the last decade. Up until late 2001, the decline in African
American accessions was small year to year, but from FY: 2001 to FY: 2006, the Defense
Department statistics show the number of African American enlisted accessions has fallen by
43.1 percent19
(Population… FY1997 B-3; Population… FY2006 B-3). The Army has seen a
larger decline than any other military branch. In 2000, according to the Pentagon statistics, more
than 42,000 African American men and women applied to enlist, but by 2006 this number had
been cut in half to just over 21,000 (Population…FY1997–FY2006). Some of the factors that
affect the representation percentages of African Americans include race relations on active duty,
economic substitutes such as employment or education attainment, and population sentiment
towards the military, the government, and the current wars in Middle-East.
18
The ―other race‖ category has seen inconsistent times of overrepresentation, but due to the changes in reporting
categories mentioned earlier, this category has also seen large fluctuations throughout the examined time period. 19
43.1% ≈ [{FY:2006 Accessions (8,793) – FY:2001 Accessions(15,444)} ÷ FY:2001 Accessions (15,444)].

Moffett 29
Figure 6
In figure 6, you can see that the population representation of enlisted soldiers in the Army
claiming black or African American as their race has dropped seven percent from 1997 to 2006.
This can also be represented as about 29,50020
less African American soldiers in the army in
2006 than would have been if the representation rate had not fallen. Accession data compared to
separation calculations (presented later) makes it clear that the drop in the African American
representation has been mostly fueled by a drop in associated civilians entering the Army. This
20
29,537 = [(29.68% - 22.65%) x 420,165]; 29.68% and 22.65% are the black or African American representation
in 1997 and 2006 respectively, 420,165 is the total reported enlisted Army population in 2006.
0%
5%
10%
15%
20%
25%
30%
35%
1997 1998 1999 2000 2001 2002 2003 2004 2005 2006
Pe
rce
nt
of
Po
pu
lati
on
Year
Black or African American Civilian Population Age 18 – 44, U.S.
Army Enlisted Population, Accessions, & Applications
Enlisted Army
Civilian Population
Accessions
Applications
29.7%
22.7%
Decreased 7.0%,
Decreased 0.01%
23.4%
12.6%
Decreased 10.8%,
13.3%
Afganistan
Invasion
Iraq
Invasion
Source: U.S. Civilians age 18-44 from CPS data (Miriam et al.); U.S. Army enlisted, accessions, and
application data from ten separate annual reports Population Representation in the Military Services,
FY: 1997 – FY: 2006 published by the Office of the Under Secretary of Defense, Personnel and
Readiness (see works cited). Table of data also provided in appendix A.

Moffett 30
decrease in representation percentages seems to have accelerated in 2002 and continued to drop
through 2006. Although Defense Department data is not yet available past FY: 2006; preliminary
data, for FY: 2008, from The Chief of Army Demographics shows further declines (-3.7 percent)
for active duty soldiers, down to 19 percent (Maxwell B-24). It will be interesting to see if the
increase in unemployment in 2008 and the election of a president with plans to remove troops
from Iraq will slow or stop the decrease in African American representation in the U.S. Military.
In figure 7 you will see a representation of the rate of change for African American
representation. It is evident from this graph that the large decrease in representation of accessions
has been independent of the steadiness of the civilian population and it appears that large
decreases in accession representation have occurred after both recent Middle Eastern invasions.
Figure 7
-60%
-50%
-40%
-30%
-20%
-10%
0%
10%
1997 1998 1999 2000 2001 2002 2003 2004 2005 2006
Black or African American Percent Change Since 1997
Black or African American (Army) Black or African American (Civilian)
Black or African American Accesions Black or African American Applications
-46.2%Afghanistan
Invasion
Iraq
Invasion
-23.7%
Source: U.S. Civilians age 18-44 from CPS data (Miriam et al.); U.S. Army enlisted, accessions, and
application data from ten separate annual reports Population Representation in the Military Services,
FY: 1997 – FY: 2006 published by the Office of the Under Secretary of Defense, Personnel and
Readiness (see works cited). Table of data also provided in appendix A.
Note: percent change calculated based on 1997 as base year.

Moffett 31
The military occasionally gains attention for the behavior of individuals or groups of
service members acting in a discriminatory manner, but according to a 2007 Cass military study,
completed in association and with the support of the Army Research Institute for the Behavioral
and Social Sciences (ARI), ―since the early 1980s, race relations have generally been positive in
the armed forces. Much of this is due to equal opportunity advisers (EOAs), who monitor racial
incidents and look at patterns of race in assignments and promotions‖ (Soeters and van der
Meulen 16). These EOAs also conduct regular mandatory training for all service members and
surveys those members to track the sentiment of different racial cohorts. Furthermore, ―[in]
surveys conducted in Somalia, Bosnia and Iraq, over three-quarters of both white and black
soldiers say that race relations are better in the Army then in civilian life‖ (Soeters and van der
Meulen 16). These facts along with others reported by the Army’s Equal Opportunity
Department and the Inspector General would counter possible claims that the African American
military population is dropping due to an increase in racial tensions on active duty21
.
As mentioned earlier when discussing unemployment, civilian opportunities serve as
substitutes for the new recruit labor supply. According to this, one reason why the military has
seen a fall in the racial representation of African American members is that this cohort has seen
an increasing number of substitute opportunities. According to an article published in The
Boston Globe in 2007, ―Pentagon and military analysts say the downturn in enlistments partly
reflects the fact that young African-Americans have broader options, pointing to the growing
number of black students in college‖ (Baron and Williams A1). Holding all else constant, as
opportunities outside the military are increased for African Americans, their representation of
accessions will continue to decline.
21
This is also countered by separation statistics showing the decrease in African American representation has
primarily come from the recruit labor market and accessions.
Moffett 32
Another factor affecting the African American accessions are the ongoing wars in
Afghanistan, which started in October 2001, and Iraq, March 2003. The data provided in the
Defense Department’s annual reports suggests that these wars have had a large impact on
recruiting, accessions, and retention. A New York Times/CBS news poll22
conducted in late
2005 reported that ―[n]early two-thirds of people surveyed said the war was having an impact in
their communities. Of those, 39 percent said it was a negative impact and 19 percent said it was a
positive impact.‖ More importantly though is that this poll ―showed a stark racial divide. 58
percent of blacks said the war was having a negative impact, compared to only 36 percent of
whites‖ (Hernandez and Thee 6). More recently, a 2007 CBS News poll found that 83 percent of
African-American respondents said the Iraq invasion was a mistake. In addition, a 2006 Pew
Research Center poll shows President Bush’s approval rating hitting a new low with African
American voters at about 9 percent (Baron and Williams A1). The cause of this racial divide is
difficult to explain, but the result of it helps explain the drop in African American enlistment
applications and accessions. Military analysts, Pentagon surveys, and interviews with young
African Americans cite the unpopular Iraq war is the biggest reason for the drop in African
American accessions. Additionally, in 2007, they said that ―mistrust of the Bush administration
[was] adding to the problem‖ (Baron and Williams A1).
Distrust of the Bush administration by the African American population is not limited to
the Iraq war. Evidence has shown that domestic problems such as those surrounding Hurricane
22 The New York Times/CBS News poll is based on telephone interviews conducted Sept. 9 to 13 with 1,167 adults
from throughout the U.S.. Black Americans were sampled at a higher rate than normal to permit the analysis of
black attitudes in greater depth. Of the total in the new poll, 877 said they were white, and 211 said they were black.
The results of the poll have been weighted to account for household size and the number of telephone lines into the
residence and to adjust the sample for variations relating to geographic region, sex, age, marital status and education.
Blacks and nonblacks were then weighted to their proper proportion of the overall population. For blacks, the
margin of sampling error is plus or minus seven percentage points (Hernandez and Thee 2005, 6).
Moffett 33
Katrina have also caused distrust in the government and unwillingness to enlist. In 2007, two
years after Hurricane Katrina, a group of potential African American recruits said this when
questioned about the possibility of enlisting in the Army: ―why would we go over there and help
them [Iraqis], when [the U.S. government] can't help us over here?‖ referring to the cleanup after
hurricane Katrina (Baron and Williams A1). Although President Bush has left office, ―some
military specialists worry that the trend could persist long after the current administration and
wars are over‖ (Baron and Williams A1).
The drop in African American representation in accessions has been substantial and
relatively quick; it is of great importance then, that those who are interested in matching racial
compositions examine the causes and produce a better understanding of these trends to establish
if there is a problem. Given that the African American population historically and presently still
remains overrepresented, this decrease in accessions can be viewed as a correction to the past
overrepresentation. If a representational military of matching composition is what the Defense
Department seeks, then this fall is in the right direction towards this goal. However, care must
be taken to monitor the extreme rate of decline in order to preemptively recognize a greater
problem, such as the representation continuing to fall far below that of the representation of the
civilian population. If future African American representation of accessions remains close to the
civilian representations, the active duty population can be expected to better resemble the civilian
population composition. Alternately, if accessions continue to drop at their current rate of
change, then the active duty representation may drift out of alignment with the civilian
population, swinging like a pendulum from overrepresentation to underrepresentation. This sort
of overcorrection could leave the Defense Department exchanging one problem for another.

Moffett 34
Other nations have had similar decreases in military representation by minority groups
with differing results. For example, a survey of the Dutch armed forces showed that
deterioration in the military’s diversity between 2000 and 2005 caused ―the attitudes of the
Dutch service (wo)men towards colleagues of Dutch minority groups in the military have
become less favorable23
. On average, the respondents developed a slightly more negative view
then before‖ (Soeters and van der Meulen 8)24
. Although this sentiment change is reported as
slight, any negative sentiment change towards minorities should be monitored for causes and
possible solutions.
It is important to repeat that although the African American representation in the military
is falling, given the 12.6 percent representation of FY: 2006 accessions are below the 13.2
percent representation of the current civilian population; the active duty enlisted population still
remains well above that of the civilian population at 22.7 percent. In 2007, an international study
of military diversity across thirteen countries praises this overrepresentation and points out, ―that
a disproportionately black Army stands out as one of the most respected organizations in
American society has a profound meaning. Not only have the military played a central role as an
avenue of black achievement, but they have also shown that a large African-American presence
has been conductive for the smooth operation of a major American institution‖ (Soeters and van
der Meulen 21). If the military served a role in African American achievement or a stepping
stone to improved sentiment, it was definitely not an easy means towards this goal.
No one knows whether these declines in the black representation in the military are
permanent, whether they will continue to fall at their current pace, or whether the end of
23
―less favorable‖ is undefined in this reporting source of the survey conducted in the Dutch military. 24
This is only an example of what could happen in general with a drop in minority representation. Since the Dutch
decrease in representation went from underrepresented to further underrepresented, it is not a good comparison to
the Army’s African American population decrease.
Moffett 35
President Bush’s term in office and the planned withdrawal of troops from Iraq will reverse the
trend. Some facts however suggest that it is unreasonable to suggest that the representation will
ever return to the heights of overrepresentation seen in the 80’s and 90’s. The substitutes of
higher education and increasing economic alternatives should remain, and in regards to African
American sentiment towards military service, a 2007 Pentagon-sponsored surveys suggest that
―attitudes among military-age African-Americans may have changed for good‖ (Baron and
Williams A1)25
.
White Representation
The white cohort is the largest by quantity in the military, but underrepresented when
compared to the civilian population. The white representation shown in figure 8 has had
contrasting changes when compared to the black/African American representation in figure 6.
Whereas the active duty African American population has decreased 7.0 percent, the active duty
white population has grown 9.8 percent (Population…FY1997–FY2006). Accessions have also
had contrasting growth following the invasions of Afghanistan and Iraq. Whereas the
aforementioned drop in African American accessions was 56.9 percent, the increase in white
accessions from FY: 2001 to FY: 2006 was 21.9 percent26
(Population… FY1997 B-3;
Population… FY2006 B-3). Since the white population is much larger by quantity, their increase
in accessions more than compensated for the decrease in African American accessions and
helped the Defense Department reach its increased recruitment goals27
. White applications and
accessions only show a decrease, similar to that of the African American cohort, following the
25
Although this paper concentrates on the enlisted ranks, it is of note that according to Chief of Army
Demographics; since FY:1985 even though African Americans representation has decreased in the Army, African
Americans have increased their representation among officers (Maxfield 8). 26
21.9% ≈ [{FY:2006 Accessions (52,272) – FY:2001 Accessions(42,885)} ÷ FY:2001 Accessions(42,885)]. 27
White increase = 9,387, African American decrease = 6,651, difference = 2,736.

Moffett 36
completion of the first year of the Iraq conflict, and this is partially reversed by 2006.
Meanwhile, CPS data shows that the white cohort is slowly decreasing in its representation
among the civilian population.
Figure 8
A look at the percentage change of the white representation in figure 9 shows a consistent
contrast to that mentioned above. Notice that after the second year of the Iraq war, the white
representation among accessions cannot maintain its large increase and settles to just below pre-
Iraq war levels. An important aside is to observe that the economy is not a zero-sum game, so
50%
55%
60%
65%
70%
75%
80%
85%
1997 1998 1999 2000 2001 2002 2003 2004 2005 2006
Pe
rce
nt
of
Po
pu
lati
on
Year
White Civilian Population Age 18 – 44, U.S. Army Enlisted
Population, Accessions, & Applications
White (Army)
White (Civilian)
White Accessions
White Applications
78.8%
56.8%
Increased 12.8%
81.6%
74.9%
Increased 9.8%
62.2%
Afghanistan
Invasion
Iraq
Invasion
Decreased 2.7%
66.8%
Source: U.S. Civilians age 18-44 from CPS data (Miriam et al.); U.S. Army enlisted, accessions, and
application data from ten separate annual reports Population Representation in the Military Services,
FY: 1997 – FY: 2006 published by the Office of the Under Secretary of Defense, Personnel and
Readiness (see works cited). Table of data also provided in appendix A.

Moffett 37
increased opportunities for one cohort, like those mentioned for African Americans, do not
convey reduced opportunities for another cohort.
Although the changes for the white cohort have been in opposing directions to the
African American cohort and given that they also have opposite under/over representation, the
conclusion that these changes are in the correct direction to build a more representational
military seems consistent. Likewise, given the abrupt changes since 2001, continued monitoring
and policy adjustment should be completed as necessary to support progress toward reflective
representation, while avoiding considerable overrepresentation like that seen by other cohorts in
the past.
Figure 9
-10%
0%
10%
20%
30%
1997 1998 1999 2000 2001 2002 2003 2004 2005 2006
White Civilian Age 18-44, U.S. Army, Accessions, & Applications
Percentage change from 1997 to 2006
White (Army) White (Civilian) White Accessions White Applications
-3.3%
Afganistan
Invasion
Iraq
Invasion
20.5%
17.2%
Source: U.S. Civilians age 18-44 from CPS data (Miriam et al.); U.S. Army enlisted, accessions, and
application data from ten separate annual reports Population Representation in the Military Services,
FY: 1997 – FY: 2006 published by the Office of the Under Secretary of Defense, Personnel and
Readiness (see works cited). Table of data also provided in appendix A.
Note: percent change calculated based on 1997 as base year.

Moffett 38
Hispanic / Latino Representation
Hispanics are now the largest minority group in America and while their accession rates
have seen continual increase over the last several years, accession growth has not kept up with
civilian population growth. Multiple military services have recognized this separation and have
begun to look into strategies to target the Hispanic recruit labor force. For this reason, this paper
will now examine trends in Hispanic representation, government policies to increase
representation, and Hispanic aimed recruiting practices.
Figure 10
0%
5%
10%
15%
20%
25%
1997 1998 1999 2000 2001 2002 2003 2004 2005 2006
Pe
rce
nt
of
Po
pu
lati
on
Year
Hispanic or Latino (of any race) Civilian Population Age 18 – 44, U.S.
Army Enlisted Population, Accessions, & Applications
Enlisted Army
Civilian Population
Accessions
Applications
17.4%
7.0%
Increased 4.4%13.0
11.6%
Increased 4.6%
9.6%
Afganistan
Invasion
Iraq
Invasion
Source: U.S. Civilians age 18-44 from CPS data (Miriam et al.); U.S. Army enlisted, accessions, and application
data from ten separate annual reports Population Representation in the Military Services, FY: 1997 –
FY: 2006 published by the Office of the Under Secretary of Defense, Personnel and Readiness (see
works cited). Table of data also provided in appendix A.

Moffett 39
Figure 10 shows that the increase in the active duty Hispanic representation has slightly
exceeded that of the increase in representation in the civilian population, but the increase has
failed to fill the gap and relieve the representation differential. The increase in the Hispanic
enlisted population is due to a relatively smaller increase in accessions from 9.6 percent to 11.6
percent of all Army accessions (Population…FY1997–FY2006). Note that the accessions have
not increased by as much as the enlisted population, so it is likely that the overall increase is also
a factor of Hispanics lengthening their terms of service as has been documented in the Marines
(Hattiangadi, Lee, and Quester 52). Future increases in Hispanic applications and accessions
will be required to close this differential and there are a few policies in consideration to
accomplish this.
The U.S. Army Accessions Command (USAAC) is now recommending a new tool to
generate an increase in Hispanic recruits. For many Hispanics, English is a second language and
in their presentation, Shaping the Youth Market, the USAAC cites Census data that shows 1.25
million of the current 5.44 million 17-24 year old Hispanics do not speak English ―very well‖ or
―exclusively‖. They further claim that after accounting for the medically, morally, and aptitude
disqualified, they calculate 91,000 Hispanic males with English language deficiencies keeping
them from participating in the new recruit labor market. To counter this problem, the USAAC
has suggested a Spanish language Armed Services Vocational Aptitude Battery (ASVAB) test.
If this test is approved, recruits would be given the choice of tests. Taking the test in a more
comfortable home language should provide opportunity to score higher and less of a chance of
being aptitude disqualified (USAAC 32). A 2006 report by Strategic Analysis Inc., Recruiting
an All-Volunteer Force: the Need for Sustained Investment in Recruiting Resources, cites a lack
Moffett 40
of English language proficiency as a partial cause for Hispanics to have lower ASVAB scores
(Bicksler and Nolan 5).
As was noted earlier, there is a relationship between recruits graduating high school, and
an increased probability of their completing their first enlistment. On this front, Hispanic high
school graduation rates have continually increased over the past 15 years from about 55 percent
to 65 percent. While these graduation rates are increasing, they are still below the rates of some
other races: 77 percent for African Americans and 82 percent for whites (Bicksler and Nolan 8).
A 2004 report published for the Marines titled Recruiting Hispanics: the Marine Corps
Experience points out key facts that counter this problem of low high school graduation rates.
The study examined new Hispanic recruits in the Marine Corps and suggests that ―Hispanic
recruits have attrition rates substantially below average. They are less likely than all recruits to
drop out of boot camp and less likely to leave the service before the end of their first term. Thus,
first-term attrition among this group, which comprises a growing proportion of the total Marine
Corps force, is lower than average‖ (Hattiangadi, Lee, and Quester 56). Similar studies have not
yet been completed to insure that these results are duplicated in other U.S. military services, but
if they prove true across the Department of Defense then they should be used to offset the
argument that a Spanish language ASVAB would provide inadequate military accessions.
DREAM Act
Another possible solution for the low representation by Hispanics comes in the form of
the Development, Relief, and Education for Alien Minors Act of 2005 S.2075, otherwise known
as the DREAM Act. This year approximately 60,000 non-U.S. Citizens will graduate from high
schools located around the U.S. (Durbin). If this legislation is passed, it would provide

Moffett 41
immigrants with two new ways of gaining citizenship. Under the current provisions in the bill,
immigrants who entered the country prior to age 16 and at least five years prior to the passage of
the legislation are eligible for six years of conditional residency status upon completion of either
an associate degree or two years of military service. At the end of the six year conditional
residency period, if the participant demonstrated good moral character they would be allowed to
apply for U.S. citizenship (Durbin).
Many groups have shown their support for this bill, and as of October 2007, fifty-five
congressional representatives had signed on to co-sponsor the bill. According to San Diego
Union-Tribune staff writer, Leslie Berestein, ―[t]he DREAM Act has the support of mainstream
Latino organizations, such as the National Council of La Raza and the League of United Latin
American Citizens, who praise it as a life-changing opportunity for students‖ (Berestein). On the
other side though, the Alameda Times-Star reported that in a time span from September 13th
to
the 28th
, 2007, ―California Senator Dianne Feinstein, who is a strong supporter of the bill,
reported receiving 4,000 phone calls about the Dream Act. Her spokesman Scott Gerber said
about 239 calls were in favor of the bill, and 3,805 opposed‖ (Friedman and Llanos). Although it
seems that primary objections to the bill stem from citizens’ reluctance to offer new benefits to
immigrants they believed entered the country illegally, a few others oppose the inclusion of the
military option as having a negative impact. These opponents argue that the DREAM Act does
not provide an incentive to join the military or go to college, but instead threatens deportation for
those not willing to comply.
The passage of the dream act would definitely increase non-citizen Army recruiting by
expanding the Hispanic recruit labor market. According to the nonpartisan think tank, Migration
Policy Institute, ―the act would immediately make about 360,000 young people eligible for

Moffett 42
conditional legal status. The legislation could also make 715,000 undocumented children,
between the ages of 5 to 17, eligible for legal status‖ (Berestein). The increase in the Hispanic
recruit labor market would be two fold. Not only would the large number of new prospects
increase the size of supply, but this new supply would come with an additional built in incentive
to join the Army. Alternatively, you may look at this new supply of possible recruits as a
completely new market, given that they face a different set of incentives and substantially less
alternate substitutes and therefore are more inelastic in supply. These immigrants would not
have the substitute opportunity of regular employment that most prospects face, as it would still
be illegal for civilian employers to hire these immigrants until they obtained their conditional
residency. The U.S. Army Accession Command estimates that this act would only generate an
increase of 500 Hispanic recruits annually, of which 40 percent would be from California
(USAAC 35).
None of the recruiters interviewed during this research were aware of the provision in the
DREAM Act to allow undocumented immigrants to join the military. The recruiters explained
that immigrants with valid work visas have been eligible to join the military for many years, and
that it would be easier to gain citizenship while serving. The DREAM Act would also allow
those without proper documentation to join the military. This brings up a point that is rarely
recognized in the debate over the DREAM Act: that the military has been recruiting non-U.S.
citizens for several years. According to the 2007 Cass military study, ―[a]s of 2003 there were
approximately 30,000 foreign-born, non-U.S. citizens in the American armed forces‖ (Soeters
and van der Meulen 6). This includes recruits from many nations not usually considered
including China, Turkey, Romania, Germany, Jamaica, as well as Mexico, and other Latin
American nations. For many of these recruits, service is a method to gain citizenship and unlike

Moffett 43
the DREAM Act’s provisions, many of these soldiers gain citizenship prior to completing their
initial enlistment. According to Pentagon statistics, approximately 8,000 non-U.S. Citizens join
the military each year to take advantage of an accelerated path to citizenship. This trend is
currently increasing, and the government wants to further accelerate the process; about 4,000
immigrants serving in uniform became citizens in 2005, compared with 750 in 2001
(Bender A1).
The recruiters interviewed expressed that although the DREAM Act would likely
increase accessions, it would be difficult to find ―fully qualified‖ undocumented recruits. They
explained that having poor English skills hurts a recruit’s chance of passing the ASVAB. This
however should have little to do with the immigrants targeted by this bill, considering that
eligibility for military service under the DREAM act requires an immigrant to have been present
in the U.S. school system for at least four years of high school and to have successfully
graduated. If graduates of high school cannot speak English well enough to pass the relatively
low standards of the ASVAB, then maybe other issues exist in the education system that need to
be solved before this bill can make a dramatic impact on recruiting. Alternatively, this may be
another endorsement for the Spanish language ASVAB.
Although the DREAM Act was initially introduced to congress in 2001, as of February
2009, the DREAM act has yet to be passed into law. In the summer of 2007 the DREAM Act
was attached to the Comprehensive Immigration Reform Act of 200728
, but after criticism not
particularly related to the DREAM Act, the bill failed to pass. Supporters of the bill hope that it
will reenter debate in 2009 under the new administration.
Despite the current status of the DREAM Act, in December of 2008, Defense Department
officials announced they would implement a one year pilot program to enlist 1,000 foreign
28
Secure Borders, Economic Opportunity and Immigration Reform Act of 2007 (S. 1348)
Moffett 44
recruits lacking a green card, but who had been in the country legally for the last two years. The
official goal of the program is to help the military address shortages in medical personnel and
foreign-language specialists (Zavis 1). Although this program appears not to target Hispanic
recruits, recruiters in the Los Angeles region have already taken notice and say that expanding
the program would ―greatly increase the pool of qualified recruits in Los Angeles‖ (Zavis 1).
Cohort Breakdown Summary
In summary, the representation of African American accessions has decreased rapidly
over the last decade, while the white representation has increased at nearly half the rate over this
same period, and the Hispanic representation has experienced slow steady increases. The
composition of the military population appears to be going through a transition with rapid rates
of change in the composition of the recruit labor supply. Over the last decade all three of the
cohorts examined above have moved towards closing the racial representation differential. One
cause, event or policy cannot stake claim to closing this gap, but it has likely been the
composition of the several factors discussed here affecting these cohorts differently that has
increased the representation of white and Hispanic recruits while decreasing African American
representation.
Military Separations
For the purpose of this paper, military separations are any outflows from active duty to
include completion of enlistment, all versions of discharge, death, and retirement. The most
notable revelation here is that separation trends broken down by race do not match accession
trends. Figure 11 is the comparison of the racial composition of separations compared to the
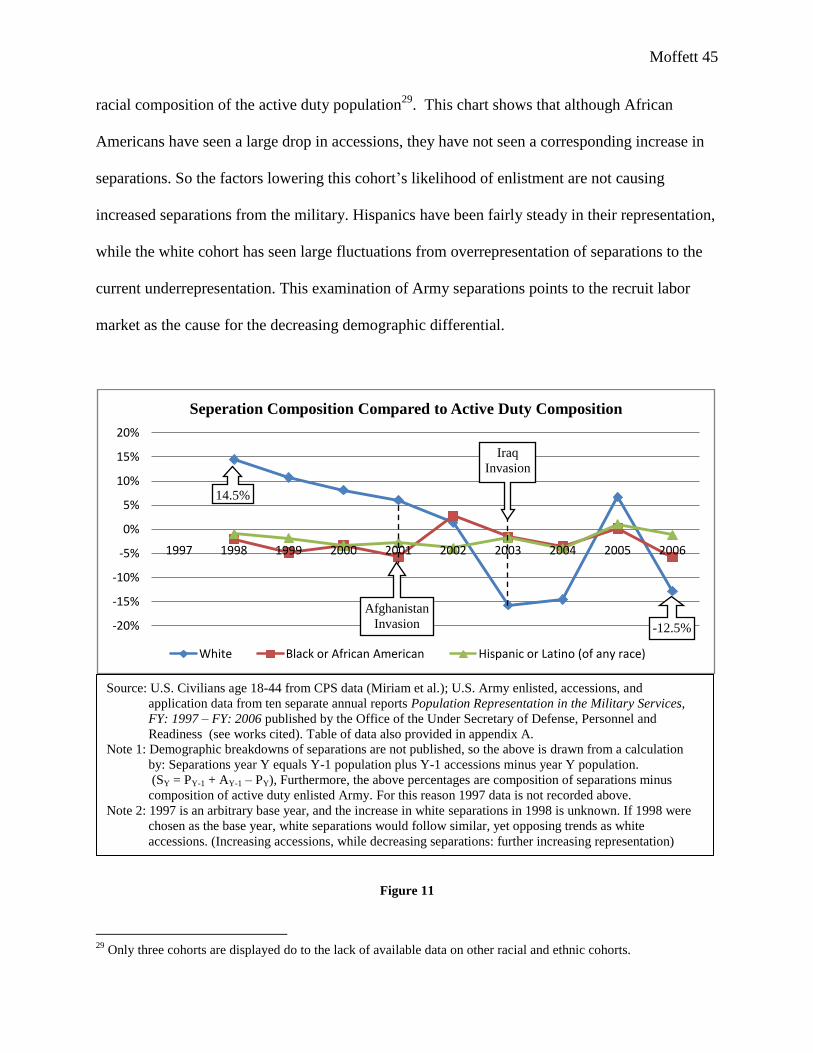
Moffett 45
racial composition of the active duty population29
. This chart shows that although African
Americans have seen a large drop in accessions, they have not seen a corresponding increase in
separations. So the factors lowering this cohort’s likelihood of enlistment are not causing
increased separations from the military. Hispanics have been fairly steady in their representation,
while the white cohort has seen large fluctuations from overrepresentation of separations to the
current underrepresentation. This examination of Army separations points to the recruit labor
market as the cause for the decreasing demographic differential.
Figure 11
29
Only three cohorts are displayed do to the lack of available data on other racial and ethnic cohorts.
-20%
-15%
-10%
-5%
0%
5%
10%
15%
20%
1997 1998 1999 2000 2001 2002 2003 2004 2005 2006
Seperation Composition Compared to Active Duty Composition
White Black or African American Hispanic or Latino (of any race)
-12.5%
Afghanistan
Invasion
Iraq
Invasion
14.5%
Source: U.S. Civilians age 18-44 from CPS data (Miriam et al.); U.S. Army enlisted, accessions, and
application data from ten separate annual reports Population Representation in the Military Services,
FY: 1997 – FY: 2006 published by the Office of the Under Secretary of Defense, Personnel and
Readiness (see works cited). Table of data also provided in appendix A.
Note 1: Demographic breakdowns of separations are not published, so the above is drawn from a calculation
by: Separations year Y equals Y-1 population plus Y-1 accessions minus year Y population.
(SY = PY-1 + AY-1 – PY), Furthermore, the above percentages are composition of separations minus
composition of active duty enlisted Army. For this reason 1997 data is not recorded above.
Note 2: 1997 is an arbitrary base year, and the increase in white separations in 1998 is unknown. If 1998 were
chosen as the base year, white separations would follow similar, yet opposing trends as white
accessions. (Increasing accessions, while decreasing separations: further increasing representation)

Moffett 46
Solution from the Navy
As mentioned previously, other U.S. Military services have similar racial disparity in
their composition. The U.S. Navy has recognized this as a problem and in an effort to rectify it,
the Navy’s top admiral has established ―benchmarks‖ for the percentage of nonwhite admirals he
would like to see in command within a thirty year time requirement. In a message sent to
subordinate officers, Chief of Naval Operations Admiral Gary Roughead directs them to use
these benchmark guidelines when recommending promotions. The Navy Times reports that
Admiral Roughead ―set goals for an admiralty in 2037 that is 36 percent nonwhite —
specifically, 10 percent black, 13 percent Asian or Pacific Islander and 13 percent Hispanic,
according to an e-mail to admirals dated Feb. 27 [2008]‖ (Ewing). Navy Admiral Mark
Ferguson has since stressed that these are not quotas, but unofficial guidelines. These admirals
believe that the benchmarks ―reflect projected trends for those groups in the U.S. population…
with the idea that the makeup of the Navy’s officer corps should mirror American society‖
(Ewing). The Navy is also conducting ―diversity reviews‖ and establishing benchmarks for each
Navy division. Similar plans for other U.S. military services have yet to be announced. However,
it is not uncommon for one service to act alone on issues such as this and it may take success by
the Navy in implementing this plan for other services to replicate it.
Conclusion
The data presented here demonstrates that there have been considerable changes in the
racial composition of the Army over the observed time period. Socioeconomic and political
factors in the last decade have caused the racial representation by the largest cohorts to progress
towards closing the demographic differential that has existed since soon after the abolition of the
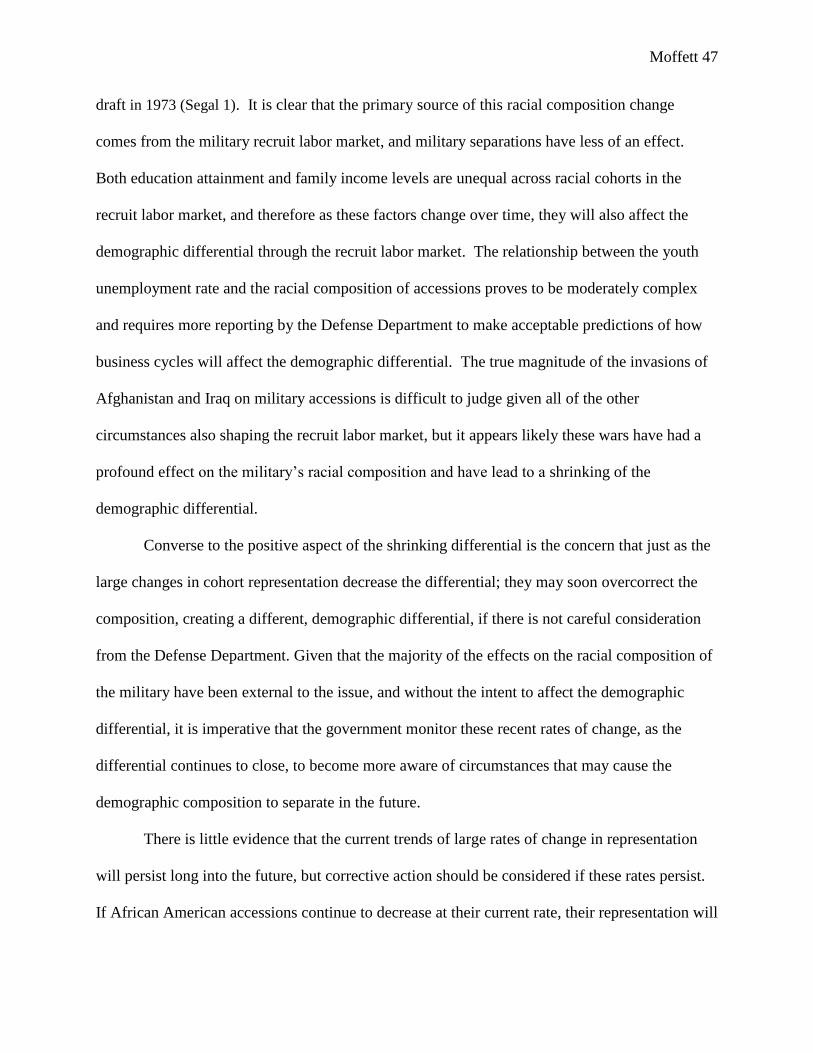
Moffett 47
draft in 1973 (Segal 1). It is clear that the primary source of this racial composition change
comes from the military recruit labor market, and military separations have less of an effect.
Both education attainment and family income levels are unequal across racial cohorts in the
recruit labor market, and therefore as these factors change over time, they will also affect the
demographic differential through the recruit labor market. The relationship between the youth
unemployment rate and the racial composition of accessions proves to be moderately complex
and requires more reporting by the Defense Department to make acceptable predictions of how
business cycles will affect the demographic differential. The true magnitude of the invasions of
Afghanistan and Iraq on military accessions is difficult to judge given all of the other
circumstances also shaping the recruit labor market, but it appears likely these wars have had a
profound effect on the military’s racial composition and have lead to a shrinking of the
demographic differential.
Converse to the positive aspect of the shrinking differential is the concern that just as the
large changes in cohort representation decrease the differential; they may soon overcorrect the
composition, creating a different, demographic differential, if there is not careful consideration
from the Defense Department. Given that the majority of the effects on the racial composition of
the military have been external to the issue, and without the intent to affect the demographic
differential, it is imperative that the government monitor these recent rates of change, as the
differential continues to close, to become more aware of circumstances that may cause the
demographic composition to separate in the future.
There is little evidence that the current trends of large rates of change in representation
will persist long into the future, but corrective action should be considered if these rates persist.
If African American accessions continue to decrease at their current rate, their representation will

Moffett 48
surely fall below their civilian representation. Conversely, if white accessions continue to
increase at their given pace, while the civilian representation decreases, the Army’s white
representation can be expected to eventually become overrepresented. Additionally, the Hispanic
cohort will not be expected to close their underrepresentation gap without the Defense
Department continually taking this cohort into consideration when designing recruitment
programs.
The time series trends examined in this paper make evident the need for time series
assessments to be included in the Under Secretary of Defense’s annual evaluation of the
Department of Defense’s demographic composition. The current policy of comparing the
reported year to just one previous year fails to convey the large changes taking place in the
composition of these populations over time. These fluid populations should be examined as
moving lines with inflows and outflows and not as singular independent data points.
Educating the public about the demographic differential or lack thereof is also of great
importance. The recent drop in the African American representation among new recruits is
rarely mentioned within the media, but interest groups are quick to point out targeted marketing
aimed at Hispanics, while neglecting to realize their current and projected future
underrepresentation. Recruiting tactics should be monitored for possibilities of racial targeting,
but policies to lower the demographic differential should be welcomed.
This research found no proof of racially biased recruiting practices by the individual
recruiters observed in California, but instead found desperate, fear-incentivized recruiters
looking to find success through the easiest means available. However, examining recruiting on a
macro-scale, you can assume that policies such as the Spanish ASVAB, DREAM Act, and
Latino themed sponsorships are in fact targeting an underrepresented demographic. The field

Moffett 49
research portion of this research was limited by its inclusion of only two regional locations and
few interviewees. Complex definite conclusions about racial targeting would require more data
from many sources and regions to limit the effect of outliers.
The questions involved in this research study have evolved over time, but the underlying
interest in the demographic differential between the U.S. Military and the civilian population has
become much clearer. At the same time, new questions have also come to light that may provide
ideas for future research, including: how do marketing campaigns used by the Military influence
different demographics comparably? And what are the differences in the decision making
process for new recruits based on demographic characteristics? Furthermore, although this
research concentrated on the U.S. Army, it is worth noting that examination of the Defense
Department’s demographic reports clearly suggests further questions as to why the demographic
composition is different between branches. For example, the large difference between the Navy
and Marine’s African American population percentages; with up to 21.0 percent of the Navy
being African American, but only 11.2 percent of the Marines (Population…FY2006 B-24). The
Asian cohort, though not discussed at length in this paper due to the population size and
inconsistency with raw data, is also greatly underrepresented. Given the projected increase in the
Asian population, it may also prove useful to further examine the causes for this
underrepresentation and develop solutions for a more representational military.

Moffett 50
Appendix A: Data Tables
*Sources and calculations for all tables in Appendix A are discussed in the text of this
paper, if not otherwise noted beneath tables. Individual references are not provided after each
table because of the amount of raw data sources, but can be found in the attached works cited.
All civilian data comes from the Current Population Survey (CPS) through IPUMS; reference
(Miriam et al.). All Department of Defense data is from Population Representation in the Military
Service: FY(given year). Tables are provided to provide data representation beyond the in text
graphical figures and to provide the opportunity for fact checking.
Table 1
Table 2
US Civilians
Age 18-44
US Army
Enlisted
US Army
Accessions
White 78.82% 66.62% 74.93%
Black or African American 13.19% 22.65% 12.60%
AIAN 0.85% 0.97% 1.20%
Asian 5.09% 3.27% 1.96%
NHPI 0.28% 0.33% 0.70%
Other Race 1.75% 6.12% 8.20%
Two or more races 0.02% 0.04% 0.40%
Hispanic or Latino (of any race) 17.35% 11.63% 11.59%
2006 Representation
1997 1998 1999 2000 2001 2002 2003 2004 2005 2006
White 0.4% 0.2% 0.3% 0.2% 0.0% 0.0% -0.2% -0.1% -0.2% -0.1%
Black or African
American -0.5% -0.3% -0.4% -0.2% -0.2% -0.2% 0.0% -0.1% -0.1% -0.1%
Hispanic or Latino
(of any race) -3.4% -3.5% -3.4% -3.5% -3.6% -4.1% -4.2% -4.2% -4.2% -4.2%
Educational Attainment Differential by Race
Source: CPS Data (Miriam et al.)
Calculation: Representation in the population with at least 12th
grade completed minus (-) the representation
in the general population without education filter. Calculated in percentages and rounded to nearest
tenth.
Note 1: Only those categories with consistent recording across all years displayed in table.
Note 2: The largest difference is in the Hispanic/Latino Cohort. The -4.2 percentage is actually quite large
given that this number represents -4.2 percent of the US population since it is a compositional
difference.

Moffett 51
Table 3
Table 4
Table 5
Table 6
Table 7
1997 1998 1999 2000 2001 2002 2003 2004 2005 2006
Enlisted Army 29.7% 29.5% 29.4% 29.1% 28.9% 27.5% 26.3% 25.1% 23.9% 22.7%
Civilian Population 13.3% 13.3% 13.5% 13.6% 13.6% 13.1% 12.9% 12.9% 13.1% 13.2%
Accessions 23.4% 23.2% 24.0% 23.0% 22.3% 17.1% 15.9% 14.2% 12.0% 12.6%
Applications 26.6% 25.5% 26.0% 25.7% 23.8% 19.3% 18.0% 14.6% 13.1% 14.0%
Black or African American Representation
1997 1998 1999 2000 2001 2002 2003 2004 2005 2006
Enlisted Army -0.7% -1.0% -2.1% -2.6% -7.2% -11.4% -15.5% -19.5% -23.7%
Civilian Population 0.5% 1.6% 2.6% 2.9% -0.8% -2.4% -2.7% -1.4% -0.5%
Accessions -0.8% 2.5% -1.7% -4.6% -26.9% -32.0% -39.2% -48.9% -46.2%
Applications -4.2% -2.4% -3.2% -10.4% -27.5% -32.3% -45.2% -50.6% -47.2%
Black or African American Percentage Change Since 1997
1997 1998 1999 2000 2001 2002 2003 2004 2005 2006
Enlisted Army 7.0% 7.6% 8.3% 9.1% 9.7% 10.4% 10.9% 11.3% 11.6% 11.6%
Civilian Population 13.0% 13.4% 13.8% 14.7% 15.3% 17.6% 16.4% 16.6% 17.0% 17.4%
Accessions 9.6% 10.3% 10.7% 10.9% 11.1% 11.6% 10.7% 12.6% 12.2% 11.6%
Applications 10.1% 10.7% 10.8% 11.5% 11.9% 12.4% 13.5% 12.8% 13.2% 12.6%
Hispanic or Latino (of any race) Representation
1997 1998 1999 2000 2001 2002 2003 2004 2005 2006
Enlisted Army 9.5% 19.4% 30.7% 39.6% 49.6% 56.0% 62.3% 66.0% 66.9%
Civilian Population 3.5% 6.2% 13.3% 18.0% 35.6% 26.3% 28.1% 31.1% 33.6%
Accessions 7.5% 11.6% 14.5% 15.7% 21.4% 12.4% 32.0% 27.6% 21.3%
Applications 6.0% 7.0% 14.6% 18.5% 23.3% 34.2% 27.7% 31.6% 25.8%
Hispanic or Latino (of any race) Percentage Change Since 1997
1997 1998 1999 2000 2001 2002 2003 2004 2005 2006
Enlisted Army 56.8% 56.3% 55.6% 55.2% 54.9% 55.7% 59.6% 63.5% 65.1% 66.6%
Civilian Population 81.6% 81.4% 81.1% 80.9% 80.7% 80.4% 79.5% 79.4% 79.0% 78.8%
Accessions 62.2% 61.4% 60.1% 61.3% 62.1% 66.5% 76.8% 72.5% 71.8% 74.9%
Applications 57.6% 58.3% 57.4% 57.3% 58.7% 62.4% 70.3% 62.9% 63.5% 68.3%
White Representation

Moffett 52
Table 8
Table 9
Table 10
1997 1998 1999 2000 2001 2002 2003 2004 2005 2006
Enlisted Army -0.9% -2.3% -2.8% -3.5% -2.1% 4.8% 11.7% 14.6% 17.2%
Civilian Population -0.2% -0.5% -0.8% -1.1% -1.4% -2.5% -2.6% -3.1% -3.4%
Accessions -1.2% -3.3% -1.4% -0.2% 7.0% 23.5% 16.6% 15.5% 20.5%
Applications 1.1% -0.3% -0.6% 1.8% 8.3% 22.0% 9.2% 10.2% 18.5%
White Percentage Change Since 1997
1997 1998 1999 2000 2001 2002 2003 2004 2005 2006
White 70.8% 66.3% 63.3% 60.9% 57.1% 43.8% 48.9% 71.8% 53.8%
Black or African
American 27.5% 24.6% 25.8% 23.3% 30.3% 24.7% 21.6% 24.1% 16.9%
Hispanic or Latino
(of any race) 6.7% 6.5% 5.7% 7.0% 6.6% 9.2% 7.4% 12.6% 10.5%
Calculated Separation Representation
1997 1998 1999 2000 2001 2002 2003 2004 2005 2006
White 0.0% -6.4% -10.5% -14.0% -19.4% -38.1% -30.9% 1.5% -24.0%
Black or African
American 0.0% -10.4% -6.1% -15.3% 10.4% -9.9% -21.4% -12.2% -38.4%
Hispanic or Latino
(of any race) 0.0% -3.5% -14.7% 3.6% -1.4% 36.1% 9.3% 87.9% 55.6%
Calculated Separation Representation Percent Change Since 1997
Calculation: Demographic breakdowns of separations are not published, so the above is calculated by:
Separations year Y equals Y-1 population plus Y-1 accessions minus year Y population.
(SY = PY-1 + AY-1 – PY).
Calculation: Demographic breakdowns of separations are not published, so the above is calculated by:
Separations year Y equals Y-1 population plus Y-1 accessions minus year Y population.
(SY = PY-1 + AY-1 – PY), Furthermore, the above percentages the change from 1998 to the given year.
(e.g. -24% for white, 2006, would mean that the white representation among separations has decreased
by 24% from 1998 to 2006.

Moffett 53
Table 11
1997 1998 1999 2000 2001 2002 2003 2004 2005 2006
White 14.5% 10.7% 8.1% 6.0% 1.4% -15.7% -14.6% 6.7% -12.8%
Black or African
American -2.0% -4.8% -3.3% -5.6% 2.8% -1.6% -3.5% 0.2% -5.7%
Hispanic or Latino
(of any race) -0.9% -1.8% -3.4% -2.8% -3.8% -1.7% -4.0% 1.1% -1.2%
Calculated Separation Percentage Compared to Composition
Calculation: Demographic breakdowns of separations are not published, so the above is calculated by:
Separations year Y equals Y-1 population plus Y-1 accessions minus year Y population.
(SY = PY-1 + AY-1 – PY), Furthermore, the above percentages are composition of separations minus
composition of active duty enlisted Army. For this reason 1997 data is not recorded above.

Moffett 54
Appendix B: Glossary of Terms
Adm........................................Admiral
AFQT .....................................Armed Forces Qualification Test
AIAN .....................................American Indian or Alaskan Native
AR .........................................Army Regulation
ARI ........................................Army Research Institute for the Behavioral and Social Sciences
ASVAB ..................................Armed Services Vocational Aptitude Battery
BLS ........................................Bureau of Labor Statistics
Boot camp .............................Initial military training, also known as ―Basic Training‖
CPS ........................................Current Population Survey
DOD .......................................Department of Defense
DREAM Act .........................Development, Relief, and Education for Alien Minors Act of 2005
S.2075,
EOA ......................................equal opportunity advisers
FOIA .....................................Freedom of information act
IPUMS ...................................Integrated public use microdata series, (Census microdata for
social and economic research)
NHPI ......................................Native Hawaiian or Other Pacific Islander
NPP .......................................National Priorities Project]
OMB .....................................Office of Management and Budget
USAAC ..................................U.S. Army Accessions Command
USAREC ................................United States Army Recruiting Command

Moffett 55
Works Cited
Armor, David J. and Paul R. Sackett. ―Manpower Quality in the All-Volunteer Force.‖ In The
All-Volunteer Force: Thirty Years of Service. Ed. Barbara A. Bicksler, Curtis L. Gilroy,
and John T. Warner. Washington, D.C.: Brassey’s, Inc, 2004.
Baron, Keven, and Joseph Williams. "Military sees big decline in black enlistees - Iraq war cited
in 58% drop since 2000." The Boston Globe 7 Oct. 2007 Third ed., National sec.: A1.
Lexis Nexis. University of California, Berkeley, Berkeley. 22 Mar. 2009
<https://www.lexisnexis.com/us/lnacademic/results/docview/docview.do?docLinkInd=tru
e&risb=21_T5841338723&format=GNBFI&sort=RELEVANCE&startDocNo=1&result
sUrlKey=29_T5841338732&cisb=22_T5841338731&treeMax=true&treeWidth=0&csi=
8110&docNo=1>.
Bender, Bryan. "Immigration bill offers a military path to US dream." The Boston Globe 16 June
2007, Third ed., National sec.: A1. Lexis Nexis. University of California, Berkeley,
Berkeley. 14 Mar. 2009 <https://www.lexisnexis.com/us/lnacademic/results/docview/
docview.do?start=3&sort=RELEVANCE&format=GNBFI&risb=21_T5841459871>.
Berestein, Leslie. "Military Aspect of Immigrant Bill Eyed." Sign on San Diego, by the Union-
Tribune. 26 Sept. 2007. 3 Oct. 2007
<http://www.signonsandiego.com/news/military/20070926-9999-1n26dream.html>.
Bicksler, Barbara A. and Lisa G. Nolan. Recruiting an All-Volunteer Force: The Need for
Sustained Investment in Recruiting Resources, Policy Perspectives. Vol. 1, Number 1.
September 2006
Moffett 56
DeNavas-Walt, Carmen, Bernadette D. Proctor, and Cheryl Hill Lee, U.S. Census Bureau,
Current Population Reports, P60-231, Income, Poverty, and Health Insurance Coverage
in the United States: 2005, U.S. Government Printing Office, Washington, DC, 2006.
Durbin, Richard. Development, Relief, and Education for Alien Minors Act of 2005, S.2075. 18
Nov 2005. <http://www.dreamact.info/>.
Ewing, Philip. "CNO: Future Navy needs more minority admirals." Navy Times 22 Sept. 2008.
14 Mar. 2009 <http://www.navytimes.com/news/2008/09/navy_diversity_092208/>.
Friedman, Lisa, and Connie Llanos. "Opponents Mobilize Against 'Dream Act'" Alameda Times-
Star 28 Sept. 2007. 2 Oct. 2007
<http://www.insidebayarea.com/timesstar/localnews/ci_7025039>.
Hattiangadi, Anita U., Gary Lee, and Aline O. Quester. Recruiting Hispanics: The Marine Corps
Experience. Final Report. D0009071.A2/Final. Alexandria, Va.: Center for Naval
Analyses. 2004.
Hernandez, Raymond, and Megan Thee. "Iraq's Costs Worry Americans, Poll Indicates." The
New York Times 17 Sept. 2005, Late Edition ed., Section A; Column 1; Foreign Desk;
The Reach Of War: Public Opinion; sec.: 6.
Jordan, Bryant. "Army Recruiting Takes Mandatory Stand-Down." Benefiting the US Army, US
Navy, US Air Force, Marine Corps, Coast Guard - Military.com. 12 Feb. 2009. 15 Mar.
2009 <http://www.military.com/news/article/February-2009/army-recruiting-takes-
mandatory-stand-down.html>.
Kane, Tim, Ph.d. Who Bears the Burden? Demographic Characteristics of U.S. Military Recruits
Before and After 9/11. The Heritage Center for Data Analysis. Washington, D.C.: The
Heritage Foundation, 2005. 2-21.

Moffett 57
Maxfield, Dr. Betty D. Chief Office of Army Demographics, Headquarters, Department of the
Army Deputy Chief of Staff, Army G-1, The Changing Profile of the Army FY: 2008.
2008. <http://www.armyg1.army.mil/demographics>.
Miriam King, Steven Ruggles, Trent Alexander, Donna Leicach, and Matthew Sobek. Integrated
Public Use Microdata Series, Current Population Survey: Version 2.0. [Machine-
readable database]. Minneapolis, MN: Minnesota Population Center [producer and
distributor], 2004. cps.ipums.org/cps
National Priorities Project: Chart 6: Active-duty Army - Recruits by Neighborhood Income,
2005, 2007, 2008. National Priorities Project. 2008. 22 Feb. 2009
<http://www.nationalpriorities.org/militaryrecruiting2008/active_duty_army/recruits_by_
neighborhood_income>.
Santos, Fernanda. "At Bronx Latino Festival, the Army Sponsors the Music." The New York
Times 30 July 2007, Late Edition - Final ed., sec. B: 3. Lexis Nexis. University of
California, Berkeley, Berkeley. 14 Mar. 2009 <https://www.lexisnexis.com/us/
lnacademic/results/docview/docview.do?start=2&sort=RELEVANCE&format=GNBFI&
risb=21_T5841459871>.
Segal, Mady and David Segal, "African Americans and Latinos in the U.S. Military: Trends in
Representation" Paper presented at the annual meeting of the American Sociological
Association, Montreal Convention Center, Montreal, Quebec, Canada, Aug 10, 2006
<Not Available>. 2009-03-04 <http://www.allacademic.com/meta/p103683_index.html>
Soeters, Joseph and Jan van der Meulen, ed. Cultural Diversity in the Armed Forces, An
international comparison. Cass Military Studies. New York: Routledge, 2007.

Moffett 58
Tyson, Ann S. "Youths in Rural U.S. are Drawn to Military: Recruits' Job Worries Outweigh
War Fears." The Washington Post 4 Nov. 2005, sec. A: 01.
United States Bureau Of Labor Statistics 2008 Employment Status Of The Civilian
Noninstitutional Population 16 To 24 Years Of Age By Sex, Race, And Hispanic Or
Latino Ethnicity, July 2005-2008, Economic News Release, http://data.bls.gov/cgi-
bin/print.pl/news.release/youth.t02.htm
United States. Department of Defense. Office of the Under Secretary of Defense, Personnel and
Readiness. Population Representation in the Military Service: FY1997. 1998.
United States. Department of Defense. Office of the Under Secretary of Defense, Personnel and
Readiness. Population Representation in the Military Service: FY1998. 2000.
United States. Department of Defense. Office of the Under Secretary of Defense, Personnel and
Readiness. Population Representation in the Military Service: FY1999. 2001.
United States. Department of Defense. Office of the Under Secretary of Defense, Personnel and
Readiness. Population Representation in the Military Service: FY2000. 2002.
United States. Department of Defense. Office of the Under Secretary of Defense, Personnel and
Readiness. Population Representation in the Military Service: FY2001. 2003.
United States. Department of Defense. Office of the Under Secretary of Defense, Personnel and
Readiness. Population Representation in the Military Service: FY2002. 2004.
United States. Department of Defense. Office of the Under Secretary of Defense, Personnel and
Readiness. Population Representation in the Military Service: FY2003. 2005.
United States. Department of Defense. Office of the Under Secretary of Defense, Personnel and
Readiness. Population Representation in the Military Service: FY2004. 2006.

Moffett 59
United States. Department of Defense. Office of the Under Secretary of Defense, Personnel and
Readiness. Population Representation in the Military Service: FY2005. 2007.
United States. Department of Defense. Office of the Under Secretary of Defense, Personnel and
Readiness. Population Representation in the Military Service: FY2006. 2008.
United States. U.S. Army Accessions Command (USAAC). Shaping the Youth Market.
Accessions Research Consortium. 2005.
United States. U.S. Army Recruiting Command. Department of the Army. Recruiting Incentive
Awards USAREC Regulation 672-10. Fort Knox, 2002.
United States. U.S. Census Bureau. State & County Quick Facts Tulare County, California.
2007. 02 Mar. 2009 <http://quickfacts.census.gov/qfd/states/06/06107.html>.
Zavis, Alexandra. "Army Wants More from L.A.; Recruiting Is Tough Because Of the Large
Immigrant Population and Poor Schools. But A New Push Is On." Los Angeles Times 28
Dec. 2008, Home ed., California, B sec.: 1. Lexis Nexis. University of California,
Berkeley, Berkeley. 14 Mar. 2009 <https://www.lexisnexis.com/us/lnacademic/results/
docview/docview.do?start=4&sort=RELEVANCE&format=GNBFI&risb=21_T5841459
871>.

Moffett 60
Works Consulted
Hosek, Susan D., Peter Tiemeyer, Rebecca Kilbourn, Debra A. Strong, Selika Ducksworth,
Reginald Ray. Minority and Gender Differences in the Officer Career Progression.
California: RAND; National Defense Research Institute, 2001.
United States. Department of the Army. Army Regulation (AR) 601–1, Assignment of Enlisted
Personnel to the U.S. Army Recruiting Command. Washington, DC, 2006.
United States. Department of the Army. AR 601–210 Active and Reserve Components
Enlistment Program. Washington, DC, 2007.