the text and graphics are presented here in pdf format (print - usgs
TRANSCRIPT

Estimation of Peak Streamflows forUnregulated Rural Streams in Kansas
Water-Resources Investigations Report 00–4079
Prepared in cooperation with theKANSAS DEPARTMENT OF TRANSPORTATION
U.S. Department of the InteriorU.S. Geological Survey

Photograph on cover is Kansas River at Wamego, Kansas, March 1997.
U.S. Department of the InteriorU.S. Geological Survey
Estimation of Peak Streamflows for Unregulated Rural Streams in Kansas
By PATRICK P. RASMUSSEN and CHARLES A. PERRY
Water-Resources Investigations Report 00–4079
Prepared in cooperation with the KANSAS DEPARTMENT OF TRANSPORTATION
Lawrence, Kansas2000
U.S. Department of the Interior
Bruce Babbitt, Secretary
U.S. Geological Survey
Charles G. Groat, Director
For additional information write to: Copies of this report can be purchased from:
U.S. Geological SurveyInformation ServicesBuilding 810, Federal CenterBox 25286Denver, CO 80225–0286
District ChiefU.S. Geological Survey4821 Quail Crest PlaceLawrence, KS 66049–3839
The use of firm, trade, or brand names in this report is for identification purposes only and does not constitute endorsement by the U.S. Geological Survey.

Contents III
CONTENTS
Abstract ................................................................................................................................................................................. 1Introduction .......................................................................................................................................................................... 1
Purpose and Scope....................................................................................................................................................... 1Previous Studies .......................................................................................................................................................... 2Acknowledgments ....................................................................................................................................................... 2
Factors Affecting Occurrence of Floods................................................................................................................................ 2Physical Characteristics............................................................................................................................................... 2Climatic Characteristics............................................................................................................................................... 7
Occurrence of Extreme Floods .............................................................................................................................................. 7Estimation of Peak-Streamflow Frequencies at Gaging Stations on Unregulated, Rural Streams ...................................... 7
Log-Pearson Type III Techniques................................................................................................................................ 10Historical Peak Discharges and Outlier Thresholds .......................................................................................... 11Skew Coefficient ............................................................................................................................................... 11
Peak-Streamflow Frequencies at Gaging Stations....................................................................................................... 12Regression Equations for Estimation of Peak-Streamflow Frequencies at Ungaged Sites on Unregulated, Rural Streams 13
Regression Analysis .................................................................................................................................................... 13Selected Physical and Climatic Characteristics................................................................................................. 13Regression Equation Results ............................................................................................................................. 14
Use of Regression Equations ....................................................................................................................................... 16Summary ............................................................................................................................................................................... 16Selected References .............................................................................................................................................................. 16
FIGURES
1–3. Maps showing:1. Location of unregulated streamflow-gaging stations in Kansas used for estimation of peak-
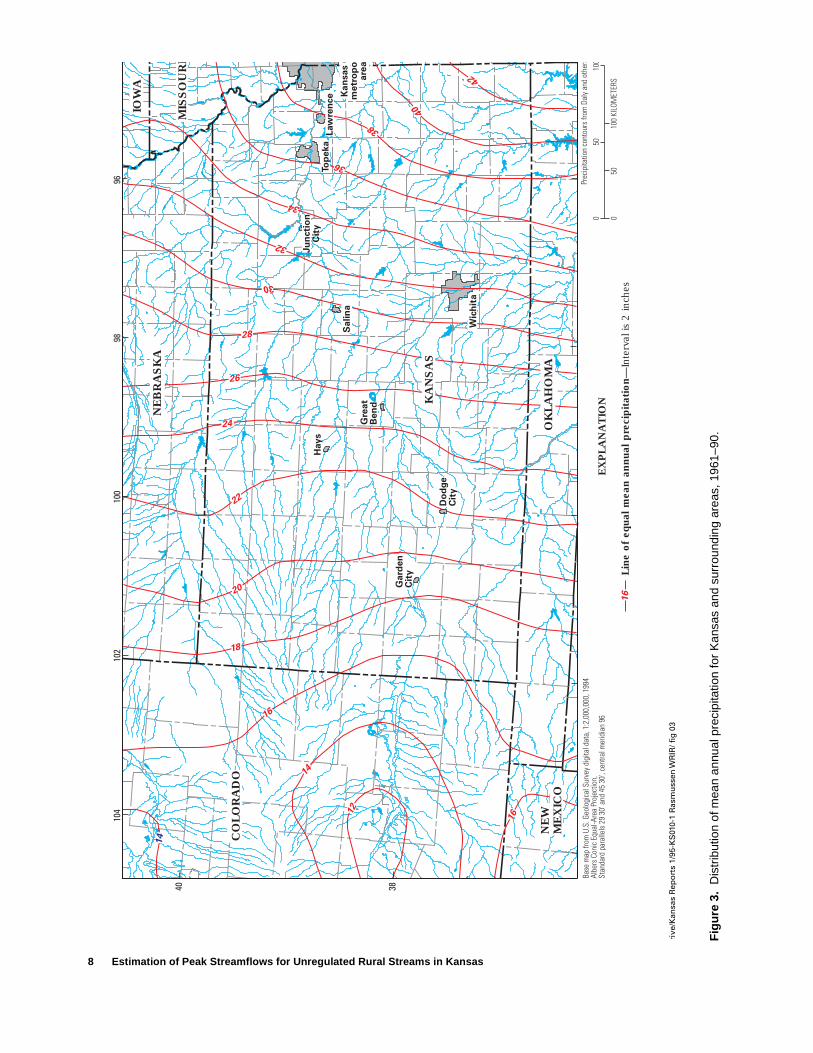
streamflow frequencies...................................................................................................................................... 32. Generalized soil permeability for Kansas and surrounding areas ..................................................................... 53. Distribution of mean annual precipitation for Kansas and surrounding areas, 1961–90................................... 8
4. Graph showing relation between maximum observed discharge and contributing-drainage area.......................... 10
TABLES
1. Maximum observed discharge relative to contributing-drainage area for largest observed floods in Kansas........ 92. Number of streamflow-gaging stations for selected ranges of contributing-drainage areas and average
length of record for those stations ........................................................................................................................... 113. Selected physical and climatic characteristics as predictors of peak-streamflow discharges for unregulated,
rural streams in Kansas ........................................................................................................................................... 144. Generalized least-squares regression equations for estimating 2- to 200-year peak-streamflow discharges
for unregulated, rural streams in Kansas................................................................................................................. 155. Streamflow-gaging station information, physical and climatic characteristics, and peak-streamflow magnitude
and frequency estimates for selected gaging stations with at least 10 years of annual peak-discharge data for unregulated, rural streams in Kansas ......................................................................................................... 18

IV Estimattion of Peak Streamflow for Unregulated rural streams in Kansas
Temperature can be converted to degrees Celsius (oC) or degrees Farenheit (oF) by the equations:
oC = 5/9(oF - 32)oF = 9/5 (oC) + 32.
Vertical DatumSea Level: In this report, “sea level” refers to the National Geodetic Vertical Datum of 1929—a geodeticdatum derived from a general adjustment of the first-order level nets of the United States and Canada,formerly called Sea Level Datum of 1929.
DefinitionsWater year: In U.S. Geological Survey reports dealing with surface-water supply, water year is the 12-month period, October 1 through September 30. The water year is designated by the calender year inwhich it ends and which includes 9 of the 12 months. Thus the year ending September 30, 1998, is calledthe “1998 water year.”
CDA—Contributing-drainage areaGg—Generalized skewness coefficientGs—Station skewness coefficientGLS–Generalized least squaresIACWD—Interagency Advisory Committee on Water DataLat—LatitudeLng—LongitudeP—Mean annual precipitationRMSE—Root-mean-square errorS—Soil permeabilitySl—Main channel slopeSTATSGO—State soil geographic data baseWLS—Weighted least squares
CONVERSION FACTORS, ABBREVIATIONS, VERTICAL DATUM, AND DEFINITIONS
Multiply By To obtain
cubic foot per second (ft3/s) 0.02832 cubic meter per secondfoot (ft) 0.3048 meter
foot per mile (ft/mi) 0.1894 meter per kilometerinch (in.) 25.4 millimeter
inch per hour (in/h) 25.4 millimeter per hourmeter (m) 3.281 footmile (mi) 1.609 kilometer
square mile (mi2) 2.590 square kilometer

Introduction 1
Estimation of Peak Streamflows for Unregulated Rural Streams in KansasBy Patrick P. Rasmussen and Charles A. Perry
Abstract
Peak streamflows were estimated at selected recurrence intervals (frequencies) ranging from 2 to 200 years using log-Pearson Type III distribu-tions for 253 streamflow-gaging stations in Kan-sas. The annual peak-streamflow data, through the 1997 water year, were from streamflow-gaging stations with unregulated flow in mostly rural basins. A weighted least-squares regression model was used to generalize the coefficients of station skewness. The resulting generalized skewness equation provides more reliable esti-mates than the previously developed equation for Kansas.
A generalized least-squares regression model then was used to develop equations for estimating peak streamflows for sites without stream gages for selected frequencies from selected physical and climatic basin characteristics for sites without stream gages. The equations can be used to esti-mate peak streamflows for selected frequencies using contributing-drainage area, mean annual precipitation, soil permeability, and slope of the main channel for ungaged sites in Kansas with a contributing-drainage area greater than 0.17 and less than 9,100 square miles. The errors of predic-tion for the generalized least-squares-generated equations range from 31 to 62 percent.
INTRODUCTION
There is a continuing need for peak-streamflow information on Kansas streams. Information concerning frequency of peak streamflows in rural
areas is vital to the safe and economic design of trans-portation drainage structures, such as bridges and cul-verts, and flood-control structures, such as dams, levees, and floodways. Effective flood-plain manage-ment programs and flood-insurance rates also are based on the analysis of peak-streamflow frequency.
A study of peak-streamflow frequencies was con-ducted by the U.S. Geological Survey in cooperation with the Kansas Department of Transportation. Much of the data used in this study, especially for many of the partial-record streamflow-gaging stations located on small streams, were collected by the U.S. Geologi-cal Survey (Putnam and others, 1998) as part of a cooperative program initiated with the Kansas Depart-ment of Transportation in 1956.
Purpose and Scope
The purpose of this report is to present results from an analysis of peak-streamflow frequencies for unregulated, mostly rural streams at streamflow-gaging stations with 10 or more years of record, and to present equations for determining peak-streamflow frequencies at ungaged sites in Kansas. This report includes data through the 1997 water year and super-sedes previous U.S. Geological Survey reports that provide flood-frequency results and (or) techniques for Kansas streams.
The scope of the analyses included (1) determina-tion of peak-streamflow frequencies for 253 stream-flow-gaging stations in Kansas (fig. 1) using log-Pearson Type III techniques; (2) derivation of an equa-tion to estimate the generalized skewness coefficients of the distribution of peak flows for each station, and (3) development of equations for relating the gaged, peak streamflow to respective physical and climatic characteristics and for estimating peak streamflows for

2 Estimation of Peak Streamflows for Unregulated Rural Streams in Kansas
selected recurrence intervals (frequencies) at ungaged, unregulated, mostly rural stream sites.
Previous Studies
Since 1960, seven studies have investigated vari-ous generalization techniques for estimating peak-streamflow frequencies for Kansas streams. Studies by Ellis and Edelen (1960), Irza (1966), Jordan and Irza (1975), and Clement (1987) analyzed peak-streamflow frequencies by using the available data and techniques to develop regression equations to estimate peak streamflows. Both Patterson (1964) and Matthai (1968) used the index-flood method, and Hedman and others (1974 used an active-channel-width concept to estimate the peak streamflow for selected recurrence intervals.
The generalization technique presented in this report incorporates the most recent analytical methods for estimating peak-streamflow frequency and is con-sidered more reliable than those techniques previously reported for use with unregulated, rural streams in Kansas.
Acknowledgments
Some of the peak-streamflow data used in the flood-frequency analysis were collected through coop-erative agreements between the U.S. Geological Sur-vey and numerous Federal, State, and local government agencies, including: U.S. Army Corps of Engineers; Kansas Water Office; Kansas Department of Agriculture, Division of Water Resources; Arkansas River Compact Administration; Johnson County Department of Public Works; city of Hays; city of Wichita; city of Topeka; Hillsdale Lake Resource and Conservation District; U.S. Fish and Wildlife Service; and Kansas Department of Transportation.
FACTORS AFFECTING OCCURRENCE OF FLOODS
Flooding on small streams in Kansas is generally the result of very intense thunderstorms that affect almost all of the watershed and produce rainfall rates that exceed soil-infiltration rates. Within large water-sheds, flooding generally is the result of prolonged rainfall that affects a major part of the total drainage basin. The prolonged rainfall eventually saturates the
soil to the point that only a small part of the subse-quent rainfall can infiltrate the soil. Physical constric-tions in the stream channels, such as bridges or culverts, logs or ice jams, or backwater from high flows in other interconnected channels, can increase the depth of flooding. Kansas streams rarely experience flooding that results from snowmelt or dam failures.
Physical Characteristics
Physical characteristics within the respective watersheds have a pronounced effect on the nature of flooding. Watersheds with various basin and channel slopes, shapes, and drainage patterns have varying effects on the potential for flooding. For example, steep slopes tend to allow excess rainfall to move more rapidly away from the headwater areas but allow more rapid accumulation at downstream locations where flood conditions occur. Varying watershed shapes also cause different responses to excess rainfall. Long, nar-row watersheds generally are less affected by small, isolated storms because usually only a part of the watershed receives intense rainfall. On the other hand, compact-shaped watersheds have a greater chance to be affected entirely by storms of comparable size, and the dendritic (tree-like) stream pattern facilitates more rapid concentration of runoff at or near the watershed’s outlet; this increases the likelihood of downstream flooding.
Other physical characteristics affecting the flood potential of watersheds are the types of soils and land-use and treatment practices within the watershed. For example, the flood potential from watersheds with soils of low permeability (fig. 2) is greater than that from watersheds where highly permeable soils tend to allow greater infiltration and less runoff. Land-treat-ment practices, such as contour farming and construc-tion of water-retention structures, can reduce the amount of rapid runoff to a stream system and thus reduce stream peaks.
Physiographically, Kansas is located almost entirely within the Interior Plains as described by Schoewe (1949). The hydrologic characteristics of the physiographic provinces within the Interior Plains are beyond the scope of this report, but the fact that there are significant variations denotes the complex nature of and difficulty in attempting to define flood-frequency relations across the State.

Figure 1. Location of unregulated streamflow-gaging stations in Kansas used for estimation of peak-streamflow frequencies.
Cheyenne
Sherman
Wallace
Greeley Wichita Scott Lane Ness Rush
PawneeHodgemanFinneyKearnyHamilton
Stanton Grant Haskell
Gray
FordEdwards
Stafford
Pratt
Kingman
Reno
Rice
Barber
HarperSumner
Sedgwick
Harvey
MarionChase
Butler Greenwood
Elk
Chautauqua
Woodson
Wilson NeoshoCrawford
CherokeeMontgomery Labette
Cowley
Kiowa
ComancheStevens Seward
Meade ClarkMorton
Barton
Logan
Thomas
Gove Trego Ellis
Sheridan Graham Rooks Osborne Mitchell
LincolnRussell
Ellsworth
Ottawa
Saline
McPherson
RawlinsDecatur Norton Phillips Smith Jewell Republic
WashingtonMarshall Nemaha Brown
Donlphan
Jefferson Leavenworth
Atchison
JacksonCloud Clay
Geary
Riley
Wabaunsee
ShawneeDouglas
Johnson
Franklin
Osage
Lyon
Coffey
Morris
Dickinson
Pottawatomie
Miami
LinnAnderson
Allen Bourbon
104
40
38
102 100 98 96
0
0 50 100 MILES
50 100 KILOMETERS
Base map from U.S. Geological Survey digital data, 1:2,000,000, 1994Albers Conic Equal-Area Projection,Standard parallels 29 30' and 45 30', central meridian 96
EXPLANATION
Streamflow-gaging station—Number corresponds to map index number used in tables 1 and 5
11
7 814
27
2930 31
44
32
45
28
26
150152
160 161 162171
164170
172163
159
168
167166
183
182
198
199
201
184
180
169177
178
179
185
200
187 188194 196
192
189
215
244
245
246
220
216
224
227 228
229 230 251
253
231 252
249
218
219221
223 222
225
226
234232
235
217248
146145
149
148
250
147
240
242 241
243
191
190
238
239
195
233
193
186
181
174
176
17542
197
157
158
155
156
151
207
206
204 208209 211
210
212
212
213 214
165
153
154
205203
202
13
9
1017
16
18
6057
59
61
62
63
66
67 68
50
69
1920
70
7121
22
73
23 24
25 96 95
8497
8583
82
81
80
76
79
7877
101
99
100
98
102 103
8889
87
9091
86 932
3
4
5
1
115105
107
116117
106114
118 118
123
120
121
122
124
140141
139
138 142
144
247
136
137
143
135128
134133
130131
129
127
237
236 132
125126
108
110
111
113112104
94
92
72
52
5147
37 4634
36
35
33 4849
39
38
53
41
40
74
5475
5543
17356
58
64
65
15
8
12
COLORADO
NEBRASKA
IOWA
MISSOURI
NEWMEXICO OKLAHOMA
KANSAS
Neosho
Fork
RiverSaline
River
North
Rep
ublica
n
River
B
lueR
iverB
ig
Delaw
areR
River
SouthFork Solomon
Wyan-dotte
Smoky
HillRiver
Cim
arron
River
ArkansasRiver
SouthFork
Nor
thFork
Ninnescah
River
R
iver
Kansas
Verd
igris
River
Rive r
Elk
FallArkan
sasR
iver
MIS
SO
UR
I
RIVER
River

104
40
38
102 100 98 96
0
0 50 100 MILES
50 100 KILOMETERS
Base map from U.S. Geological Survey digital data, 1:2,000,000, 1994Albers Conic Equal-Area Projection,Standard parallels 29 30' and 45 30', central meridian 96
COLORADO
IOWA
NEWMEXICO
OKLAHOMA
KANSAS
Soil permeability from U.S. Department of Agriculture (1994)
EXPLANATION
WichitaDodge City
Hays
Great Bend
Salina
Garden City
Topeka
Lawrence
JunctionCity
Kansas Citymetropolitan
area
NEBRASKAMISSOURI
Areas of equal average soil permeability (S), in inches per hour
0.58
0.90
1.40
0.16
0.24
0.38
2.15
3.35
5.20
8.00
12.4
Water body
Figure 2. Generalized soil permeability for Kansas and surrounding areas.

Estimation of Peak-Streamflow Frequencies at Gaging Stations on Unregulated, Rural Streams 7
Generally, it has been accepted that the nature of flooding follows one of two patterns—one typical of the eastern one-third of the State and one typical of the western two-thirds. The arbitrary dividing line passes through Wichita and west of Junction City (locations shown in fig. 2). Crippen and Bue (1977) identified a similarly located boundary within the State when dividing the conterminous United States into flood regions for a study of maximum floodflows. The topography of the western two-thirds of the State is typical of the high plains region and is characterized by flat or gently sloping surfaces with little relief and soils of high permeability (fig. 2). The topography of the eastern one-third of the State is more variable, with alternating hills and lowlands having soils of low per-meability (fig. 2).
Land-surface elevations within the State range from about 700 ft above sea level at the Kansas-Oklahoma State line in southeast Kansas to about 4,135 ft above sea level at a point near the Kansas-Colorado State line in western Kansas—a vertical dif-ference of about 3,435 ft. Average basin slope for the 253 streamflow-gaging stations in Kansas is about 10 ft/mi.
Climatic Characteristics
The climate of Kansas is affected by the move-ment of frontal air masses over the open, inland plains, and seasonal precipitation extremes are common. About 70 percent of the mean annual precipitation falls from April through September. Precipitation dur-ing early spring and late fall occurs in association with frontal air masses that produce low-intensity rainfall of regional coverage. During the summer months, the weather is dominated by warm, moist air from the Gulf of Mexico or by hot, dry air from the Southwest. Summer precipitation generally occurs as high inten-sity thunderstorms.
Watersheds in Kansas exhibit a wide range of cli-matic characteristics that affect peak-streamflow frequency. Generally, the climatic characteristics vary in an east-west direction, with little north-south varia-tion. The general climate of the western part of Kansas is semiarid with hot, dry summer months and cold, windy winter months. The eastern part of the State tends to be considerably more humid, with sultry summer months and cold winter months. Mean annual precipitation in the State varies from about 16 in. in
the extreme western part to about 42 in. in the south-east (Daly and others, 1997) (fig. 3).
OCCURRENCE OF EXTREME FLOODS
Moderate flooding is an annual occurrence in Kan-sas; however, the State has experienced several extreme floods. Notably, the floods of 1951 in river basins of eastern and north-central Kansas were the result of a large storm system. Likewise, the floods that occurred on the Elk River during 1976 were extreme. The Great Bend area experienced extreme flooding during June 1981 when an isolated but very intense storm system produced up to 20 in. of rain dur-ing a 12-hour period (Clement and Johnson, 1982). Several storm systems during the summer of 1993 caused flooding in the Saline and Solomon River Basins of central Kansas (fig. 1) and all of the river basins in northeast and east-central Kansas. In 1995, intense storms caused widespread flooding in the east-ern two-thirds of Kansas.
These are but a few of many floods that have been experienced on Kansas streams that are among the largest of floods recorded. The maximum observed discharges in relation to the respective contributing-drainage areas for the largest observed floods in Kan-sas are listed in table 1. The relation between maxi-mum discharge and contributing-drainage area for the data presented in table 1 are depicted graphically in figure 4. Envelope curves have been drawn through the highest points for both eastern and western Kansas. No recurrence interval can be assigned to the curves although they represent peak discharges generally sev-eral times greater than those having 100-year recurrence intervals.
ESTIMATION OF PEAK-STREAMFLOW FREQUENCIES AT GAGING STATIONS ON UNREGULATED, RURAL STREAMS
Techniques from Bulletin 17B of the Interagency Advisory Committee on Water Data (1981) for esti-mating peak-streamflow frequency were used with annual maximum peak-streamflow data from 253 streamflow-gaging stations with 10 or more years of unregulated, rural peak-streamflow record. Unregulated, rural peak-streamflow record is defined as less than 10 percent of the basin is regulated by a dam or is impervious. The drainage areas for these
8 Estimation of Peak Streamflows for Unregulated Rural Streams in Kansas
104
40
38
102
100
98
96
0050
100
5010
0 KI
LOM
ETER
S
Base
map
from
U.S
. Geo
logi
cal S
urve
y di
gita
l dat
a, 1
:2,0
00,0
00, 1
994
Albe
rs C
onic
Equ
al-A
rea
Proj
ectio
n,St
anda
rd p
aral
lels
29
30' a
nd 4
5 30
', ce
ntra
l mer
idia
n 96
Prec
ipita
tion
cont
ours
from
Dal
y an
d ot
her s
EX
PLA
NA
TIO
N
Lin
e of
equ
al m
ean
annu
al p
reci
pitat
ion—
Inte
rval
is 2
inch
es
CO
LO
RA
DO
NEB
RA
SK
A
IOW
A
MIS
SO
UR
I
NEW
MEX
ICO
OK
LA
HO
MA
KA
NS
AS
To
pe
ka
Wic
hit
a
Ga
rde
nC
ity
Do
dg
eC
ity
Gre
at
Be
nd
Sa
lin
a
Hay
s
Law
ren
ce K
an
sa
s C
me
tro
po
are
a
Ju
ncti
on
Cit
y
14
161
2
14
16
18
20
22
24
26
28
30
32
34
36
38
40
42
16
rive
/Kan
sas
Rep
ort
s 1/
95-K
S01
0-1
Ras
mu
ssen
WR
IR/ f
ig 0
3
Fig
ure
3.
Dis
trib
utio
n of
mea
n an
nual
pre
cipi
tatio
n fo
r K
ansa
s an
d su
rrou
ndin
g ar
eas,
196
1–90
.

Estimation of Peak-Streamflow Frequencies at Gaging Stations on Unregulated, Rural Streams 9
Table 1. Maximum observed discharge relative to contributing-drainage area for largest observed floods in Kansas [--not applicable; *, indicates that station is not listed in table 5 at the end of this report and is not in figure 1]
Station map index
number (fig. 1)
U.S. Geological
Survey station number U.S. Geological Survey station name or location
Contributing-drainage area
(square miles)
Maximum observed discharge
Date
Magnitude (cubic feet
per second)
Eastern Kansas
-- 06815600* Wolf River near Hiawatha 41 Aug. 9, 1968 40,000
81 06878500 Lyon Creek near Woodbine 230 July 1951 93,000
83 06879650 Kings Creek near Manhattan 4.09 May 13, 1995 10,200
105 06889100 Soldier Creek near Goff 2.06 May 10, 1970 7,080
131 06912300 Dragoon Creek tributary near Lyndon 3.76 June 11, 1981 8,200
134 06913500 Marais des Cygnes River near Ottawa 1,250 July 11, 1951 142,000
191 07147020 Whitewater River tributary near Towanda .17 June 5, 1965 510
215 07165700 Verdigris River near Madison 181 July 11, 1951 128,000
219 07166700 Burnt Creek at Reece 8.85 June 9, 1965 20,500
221 07167500 Otter Creek at Climax 129 July 3, 1976 107,000
226 07169800 Elk River at Elk Falls 220 July 3, 1976 200,000
236 07179500 Neosho River at Council Grove 250 July 11, 1951 121,000
237 07179600 Four Mile Creek near Council Grove 55 June 26, 1969 68,100
242 07181500 Middle Creek near Elmdale 92 June 27, 1969 90,000
243 07182000* Cottonwood River at Cottonwood Falls 1,327 July 11, 1951 196,000
244 07182400 Neosho River at Strawn 2,933 July 11, 1951 400,000
247 07183000 Neosho River near Iola 3,818 July 13, 1951 436,000
249 07183500 Neosho River near Parsons 4,905 July 14, 1951 410,000Western Kansas
14 06847600 Prairie Dog Creek tributary at Colby 7.53 June 18, 1975 4,300
37 06863900 North Fork Big Creek near Victoria 54 Aug. 9, 1974 26,400
66 06873500 South Fork Solomon River at Alton 1,720 July 12, 1951 91,900
68 06873800 Kill Creek tributary near Bloomington 1.45 May 21, 1961 2,000
73 06876200 Middle Pipe Creek near Miltonvale 10.2 Sept. 26, 1973 6,400
75 06876900 Solomon River at Niles 6,770 July 14, 1951 178,000
80 06878000 Chapman Creek near Chapman 300 July 1951 46,700
165 07142100 Rattlesnake Creek tributary near Mullinville 10.3 Sept. 26, 1973 7,000
-- 07143800* Black Kettle Creek tributary near Halstead 1.65 June 2, 1962 2,440
178 07144000 East Emma Creek near Halstead 58 Aug. 25, 1960 18,000
180 07144780 North Fork Ninnescah River above Cheney Reservoir 787 Oct. 30, 1979 87,000
183 07144900 South Fork Ninnescah River tributary near Pratt 1.48 July 5, 1987 2,310
-- * Dry Walnut Creek tributary near Great Bend 2.28 June 15, 1981 5,720
-- * Dry Walnut Creek tributary near Great Bend 1.19 June 15, 1981 3,080
-- * Dry Walnut Creek tributary near Great Bend .92 June 15, 1981 1,870
-- * Dry Walnut Creek tributary near Great Bend .66 June 15, 1981 1,340

10 Estimation of Peak Streamflows for Unregulated Rural Streams in Kansas
stations ranged from 0.17 to 9,100 mi2 and extend into parts of Nebraska, Colorado, New Mexico, or Okla-homa for some stations. A summary of drainage-area distribution and average observed length of record per station for those stations used in the analysis is given in table 2. Peak streamflows for 2-, 5-, 10-, 25-, 50-, 100-, and 200-year recurrence intervals were calculated.
Log-Pearson Type III Techniques
In 1966, under the authority of House Document 465 (1966), the Interagency Advisory Committee on Water Data (IACWD) investigated various techniques for the analysis of peak-streamflow frequency and in 1967 recommended that the log-Pearson Type III frequency distribution be adopted as the standard tech-nique to be used in Federal practice (U.S. Water Resources Council, 1967). Subsequently, the U.S.
Water Resources Council conducted additional studies that resulted in improvements to the initial log-Pearson Type III technique. The improvements were reported in Bulletin 17B (Interagency Advisory Committee on Water Data, 1981).
The log-Pearson Type III technique transforms the arithmetic values of peak discharges to log values, then three statistics of the log values (mean, standard deviation, and skewness) are computed by the method of moments. The skewness coefficient is adjusted by weighting the computed station skewness with a gen-eralized skew coefficient.
The reliability of the estimated peak-streamflow frequency is dependent on the assumption that the dis-tribution to which the data are fit is correct and that the data are accurate and drawn from a representative sample of random and independent events. The length of the period used to compute the estimates of peak-streamflow frequencies and the variability of the data
Figure 4. Relation between maximum observed discharge and contributing-drainage area (modified from Crippen and Bue, 1977).
1 10,00010 100 1,000
Contributing-drainage area, in square miles
100
1,000,000
1,000
10,000
100,000
Dis
char
ge,
in c
ub
ic f
eet
per
sec
on
d
Western Kansasenvelope curve
Western Kansas data point
Eastern Kansasdata point
Eastern Kansas envelope curve

Estimation of Peak-Streamflow Frequencies at Gaging Stations on Unregulated, Rural Streams 11
are the principal measures of the reliability. Generally, the longer the record the more reliable the estimates become because the size of the sampling error is pro-portional to the inverse of the square root of the length of the record.
Historical Peak Discharges and Outlier Thresholds
Many of the records of annual peak discharges at streamflow-gaging stations used in this study con-tained additional information relating to peak dis-charges that occurred before, during, or after the period of systematic record collection and represented maximum occurrences during an extended period. For example, it may be known that the maximum peak dis-charge recorded during the systematic record collec-tion was the largest since a point in time before the beginning or after the ending of the recorded period. Likewise, a peak discharge that occurred outside of the period of systematic record may be known to be larger than any peak discharge that occurred during that period. This “historical data” can be used to make adjustments to the original distribution of the data by assigning a historical period of record that is longer than the systematic period, resulting in adjusted recur-rence intervals of the annual maximum peak discharges.
Many drainage areas in Kansas, primarily western Kansas, have physical and climatic characteristics that can yield small annual peak streamflows. These small annual peak streamflows are considered low outliers if they are less than a certain threshold. The outlier thresholds identify data points that depart significantly from the trend of the remaining data, are defined by
the IACWD (1981), and are accounted for in the anal-ysis. In some situations, usually where there is more than one low outlier, the threshold appears too low. A visual inspection of the log-Pearson Type III distribu-tion curve allows the analyst to observe the low-outlier threshold relative to the peak-discharge data set and adjust as deemed appropriate. Low-outlier thresholds were increased for 25 stations in Kansas to improve the fit of the data to the log-Pearson Type III distribu-tion. Higher outliers were computed using the IACWD (1981) method.
Skew Coefficient
The IACWD (1981) recommends that the skew-ness coefficient computed from station records be weighted with a generalized skewness coefficient to reduce the bias caused primarily by records having rel-atively short lengths. The default method entails esti-mating the generalized skewness coefficient from a map showing lines of equal skewness for the entire United States (Interagency Advisory Committee on Water Data, 1981). The map showing generalized skewness coefficients of logarithms of annual peak streamflows is based on the skewness coefficients computed from station records collected through 1973 at 2,972 streamflow-gaging stations nationwide having 25 or more years of unregulated record and drainage areas less than 3,000 mi2. The root-mean-square error (RMSE) between the isolines on the map and the sta-tion data for the entire country is 0.55.
Although using the IACWD (1981) map of gener-alized skewness probably improves most peak-stream-flow frequency computations, the spatial position of the lines of equal skewness is subjective. The IACWD (1981) recommends that skewness coefficients be regionalized by one of three techniques—(1) averaging the station skewness coefficients within a specific area, (2) developing a local skewness map, or (3) relating the coefficients to predictor variables, such as physical and climatic characteristics of the drainage basins.
The greatest problem encountered when estimat-ing the value of the skewness coefficient is the large error in results that are computed from short-term gag-ing-station records. A weighted least-squares (WLS) regression model was developed by Tasker and Ste-dinger (1986) to solve this problem. This WLS model weights the error variances on the basis of the length of the data record and variability in the data. The WLS model is well adapted for analysis of hydrologic data
Table 2. Number of streamflow-gaging stations for selected ranges of contributing-drainage areas and average length of record for those stations
Contributing-drainage area(square miles)
Number of streamflow-
gaging stations
Average observed
length of record (years)
0.17 to less than 1 13 30.2
1 to less than 3 17 28.8
3 to less than 10 28 31.5
10 to less than 30 33 25.1
30 to less than 100 37 25.2
100 to less than 300 37 33.8
300 to less than 1,000 45 34.2
1,000 to less than 3,000
31 36.4
3,000 to 9,100 14 35.9

12 Estimation of Peak Streamflows for Unregulated Rural Streams in Kansas
having variable accuracy because of the ability to sep-arate the error of prediction into the sampling error and model error and to treat each error separately on the basis of length of the peak-streamflow record at the gaging station. The sampling error is a function of the length of the record and the degree of deviation from the average predictor variables. The model error, in this case, is the error associated with the formulation of the model. The error that can be expected when using the regression equation is the error of prediction, which includes both the sampling and model errors.
The WLS regression model weights each unbiased estimate of skewness on the basis of the length of the record of annual peak discharges. The technique relates the station skewness coefficient determined from the log-Pearson Type III distribution to one or more physical or climatic characteristics of the respec-tive drainage basins. The result of the computations yields the coefficients and constants of a regression equation, as well as their significance to the equation. The resulting equation can be used to estimate the gen-eralized skewness coefficient.
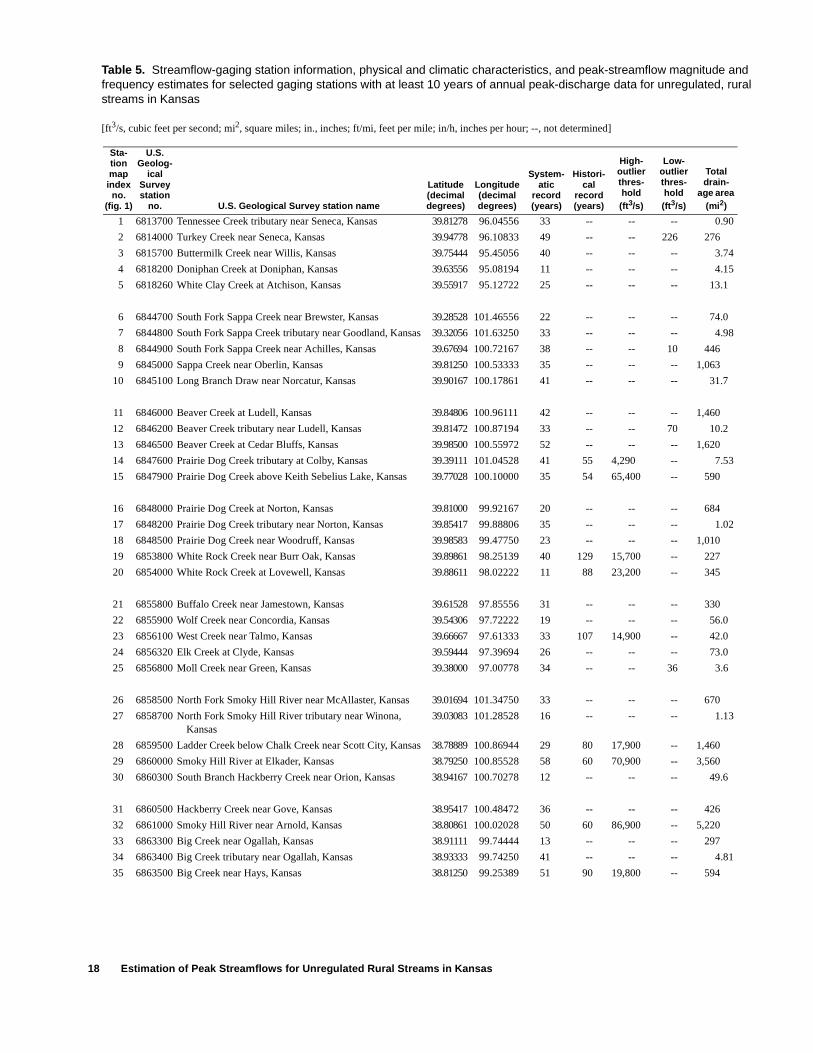
The WLS regression model in this report used sta-tion skewness computed from 253 streamflow-gaging-station records in Kansas as the dependent variable and several physical and climatic characteristics for each station as independent (predictor) variables. A summary of the results, including description and dimensions of the various physical and climatic char-acteristics for each gaging station used in the analysis, is provided in table 5 (at the end of this report).
The computation of the generalized skewness coefficient was limited to those stations having drain-age areas no larger than 9,100 mi2. The length of record for all stations was 11 or more years, and the value of station skewness ranged from -1.76 to 1.99. Contributing drainage area (CDA), latitude (Lat), and longitude (Lng) were the independent variables that yielded the best equation on the basis of the magnitude of the RMSE.
The equation used for estimating the generalized skewness coefficient at streamflow-gaging stations in Kansas is:
Gg = 1.191 + 0.0641 log10(CDA) + 0.0935 (Lat) -0.0519 (Lng), (1)
where
Gg = generalized skewness coefficient for the selected gaging station to be used in lieu of the IACWD Bulletin 17B map of
generalized skewness (Interagency Advisory Committee on Water Data, 1981);
CDA = contributing-drainage area, in square miles;
Lat = latitude of the gaging station, in deci-mal degrees; and
Lng = longitude of the gaging station, in dec-imal degrees.
A weighted skewness coefficient used to compute the frequency of peak streamflows was the result of weighting estimates of the station skewness coefficient (Gs) and generalized skewness coefficient (Gg), where the weights were estimates as recommended in IACWD Bulletin 17B (1981, p. 12–13). In this case, the RMSE associated with the generalized skewness coefficient (Gg) is the error of prediction of the esti-mating equation. The RMSE is 0.19 for equation 1, whereas it is 0.35 in the most recent previously pub-lished peak-streamflow report for Kansas (Clement, 1987). Increased record length is most likely the rea-son the RMSE has improved.
Peak-Streamflow Frequencies at Gaging Stations
Using the unregulated annual peak streamflows recorded for 253 streamflow-gaging stations with lengths of record equal to or greater than 10 years, log-Pearson Type III distributions were fitted to the peak-streamflow data for each site. Adjustments then were made to account for data that represented low or high outliers and for historical data where necessary. Final estimates of peak-streamflow frequencies (table 5) were computed using the generalized skewness coeffi-cients (Gg) obtained for each station using equation 1 and weighted with the station skewness coefficient (Gs) as recommended in IACWD Bulletin 17B (1981).
A study by Perry and Rasmussen (in press) points out that the effects of streamflow trends are not accounted for using the peak-streamflow frequency techniques in Bulletin 17B. Further investigation may be required to fully understand the effects of trends on peak streamflow and how to adjust the peak-stream-flow analysis accurately. Peak-streamflow frequency analysis assumes a random sampling of a stable popu-lation of annual peak streamflows. If that population is not stable (that is, mean and standard deviations are not constant), it may be necessary to adjust the peak-

Regression Equations for Estimation of Peak-Streamflow Frequencies at Ungaged Sites on Unregulated, Rural Streams 13
streamflow data to obtain the best-fit peak-streamflow frequency analysis. However, the persistence of trends must be considered also.
REGRESSION EQUATIONS FOR ESTIMATION OF PEAK-STREAMFLOW FREQUENCIES AT UNGAGED SITES ON UNREGULATED, RURAL STREAMS
Regression Analysis
Although information concerning peak-stream-flow frequencies is available at many streamflow-gaging-station locations in Kansas, often such information is needed at stream sites where insuffi-cient or no data are available. Generalization of the peak-streamflow frequency information at gaging sta-tions will facilitate estimates at ungaged sites. Multi-ple-regression analysis was used in this study to relate the peak streamflow at selected frequency intervals to various physical and climatic characteristics.
Research by Tasker and Stedinger (1989) indicates that generalized least squares (GLS) is appropriate for hydrologic regression. GLS regression takes into con-sideration the time-sampling error (length of record at each site) and the cross correlation of annual peak streamflows between sites.
The GLS regression model in this study used base-10 logarithmic transformation for both dependent and independent variables. The form of the model equation is:
log10Qt =log10a + b1log10X1+ b2log10X2....+ bnlog10Xn, (2)
which is equivalent to:
, (3)
whereQt is peak discharge for recurrence interval
t, in years (dependent variable);X1 - Xn are physical and climatic characteristics
(independent variables);a is the regression constant; andb1 - bn are the regression coefficients.
Selected Physical and Climatic Characteristics
The independent variables tested in the regression analysis were physical and climatic characteristics of
each drainage basin. Initially, eight physical and cli-matic characteristics were tested: contributing-drainage area (CDA), mean annual precipitation (P), soil permeability (S), latitude and longitude, main channel length, main channel slope (Sl), basin slope, basin shape, and basin elevation.
In previous peak-streamflow frequency studies for Kansas, characteristics describing the physiography and climate of each drainage basin were calculated using rough approximations with paper maps. Depending on the scale of the map or the techniques used to calculate the characteristic, a variety of errors could occur. Some physical characteristics that possi-bly could improve the regression estimates were nearly impossible to calculate and either were esti-mated or ignored for the analysis.
For this study, ARC/INFO geographical informa-tion systems (GIS) software was used to estimate physical and climatic characteristics. Many spatial-data sets were available for this task, including: (1) 30-m gridded elevation data (U.S. Geological Sur-vey, 1998) for determining the drainage-basin bound-ary, contributing-drainage area, basin slope, and mean basin elevation, (2) STATSGO soil-permeability data (U.S. Department of Agriculture, 1994), and (3) 30-year (1961–90) mean annual precipitation data (Daly and others, 1997). Drainage boundaries were determined using GIS for all 253 gaging stations used in the report. The drainage boundaries and the spatial-data sets just mentioned were used to calculate average physical and climatic characteristics for each basin (table 3).
Regression analysis relies on the assumption that independent variables are not closely interrelated. Vio-lation of this rule generally results in regression coeffi-cients that are unstable, and it becomes difficult to evaluate the interrelated variables’ importance to the respective equations. Therefore, a simple cross-corre-lation matrix was computed for all independent vari-ables and was used in the analysis to identify variables that might pose problems if included in the same anal-ysis. Pairs of variables having correlation coefficients greater than 0.8 were considered closely interrelated, were evaluated further in the initial analysis, and only the more significant variable of the pair was included in the final analysis.
The ability of a regression equation to reliably estimate the peak streamflow having selected recur-rence intervals at ungaged sites is measured by the error of prediction. The error of prediction is the mea-
Qt 10aX1
b1X2
b2…Xn
bn=

14 Estimation of Peak Streamflows for Unregulated Rural Streams in Kansas
sure of confidence in the estimated peak streamflow and describes the range within which an estimate would occur two-thirds of the time. Computed in loga-rithmic units, the RMSE, or the error of prediction, can be expressed as a percentage as shown in Hardison (1971). The percentages are unequal in the positive and negative directions. For example, the standard error of estimate of 0.17 logarithmic units represents errors of +48 and -32 percent; the average of the two percentages without regard to sign is 40 percent.
Regression Equation Results
Regression analysis was performed, and equations were developed for peak streamflow having recurrence intervals of 2, 5, 10, 25, 50, 100, and 200 years. The independent variables that most contribute to the explanation of the variance in the dependent variable (the peak streamflow) were CDA, P, Sl, and S. Table 4 gives the equations, the errors of prediction, and the equivalent years of record for each recurrence interval.
Attempts were made to improve the error of pre-diction for the regression equations by developing regional equations for smaller parts of the State. The first attempt was to divide the State along 97o longitude, similar to the division developed by Crippen and Bue (1977) as discussed earlier. Separate equations were developed for the gaging stations in the eastern and western divisions. The prediction error for the equations representing the eastern division decreased slightly, whereas the prediction error for the equations representing the western division increased.
Another attempt to reduce the prediction error was to group gaging stations according to drainage areas. The prediction errors for most of the equations devel-oped for various groups tested were greater than the original error of prediction for equations developed
from all 253 gaging stations. The best results were achieved when stations with contributing-drainage areas ranging from 30 to 9,100 mi2 were grouped together. Standard errors of prediction were reduced between 12 and 20 percent from predictions errors using all 253 stations. Standard error of prediction for equations developed for stations with contributing-drainage areas ranging from 0.17 to less than 30 mi2 were equal to or slightly greater than the standard errors for the equations developed using all the stations. The error of prediction for the most reli-able equations ranged from 0.131 (31 percent) for the 10-year recurrence interval in large basins to 0.248 (62 percent) for the 200-year recurrence interval in small basins.
A direct statistical comparison of the equations from Clement (1987) to the equations from the current investigation is not possible because of differing data and groups of gages upon which the equations are based. Clement (1987) developed equations that were based on 218 gaging stations compared to the two groups of 91 and 164 gaging stations used in the cur-rent investigation. A review of the standard error of prediction of the equations indicates the errors in the 1987 study are generally about 15 percent less than those of the current investigation. However, separate regression analysis (not included in this report) was done using (1) peak streamflow record through 1903 for 237 gaging stations, (2) the same basin characteris-tics as in this investigation, and (3) the same drainage-area grouping as described in this investigation. The standard errors of prediction of the resulting equations are about 13 percent greater than those for the equa-tions presented in this report.
Hardison (1971) related prediction error and streamflow variability to equivalent years of record.
Table 3. Selected physical and climatic characteristics as predictors of peak-streamflow discharges for unregulated, rural streams in Kansas
Basin characteristics
code Description of basin physical or climatic characteristic
CDA Contributing-drainage area upstream from the streamflow-gaging station that contributes directly to the streamflow, in square miles.
P Mean annual precipitation for the entire basin, in inches.
Sl Slope of the main channel, in feet per mile, as measured by dividing the difference in elevation at points in the channel at 10 and 85 percent of the main channel length by the intervening main channel length.
S Average soil permeability for the entire basin, in inches per hour.

Regression Equations for Estimation of Peak-Streamflow Frequencies at Ungaged Sites on Unregulated, Rural Streams 15
Table 4. Generalized least-squares regression equations for estimating 2- to 200-year peak-streamflow discharges for unregulated, rural streams in Kansas
[Qt, estimated peak discharge, in cubic feet per second, for a t-year recurrence interval; CDA, contributing-drainage area for the site, in square miles; P,
average mean annual precipitation for the entire basin, in inches; Sl, slope of the main channel, in feet per mile; S, average soil permeability for the entire basin, in inches per hour]
Qt Regression equations
Model standard error of
prediction (log10 units)
Model standard error of
prediction (percent)
Average equivalent
years of record
For drainage areas ranging from 30 to 9,100 square miles
Q2
0.000182 (CDA)0.532(P)4.055 0.177 +50/-33 6.0
0.00000501(CDA)0.648(P)4.614(Sl)0.557 .157 +44/-30 7.6
0.00001477(CDA)0.646(P)4.307(Sl)0.5266(S)-0.1736 .155 +43/-30 7.8
Q5
0.007166(CDA)0.494(P)3.281 .154 +43/-30 10
0.000344(CDA)0.592(P)3.760(Sl)0.4596 .138 +37/-27 13
0.001336(CDA)0.590(P)3.373(Sl)0.4235(S)-0.2231 .133 +36/-26 14
Q10
0.0390(CDA)0.480(P)2.931 .150 +41/-29 14
0.00245(CDA)0.570(P)3.371(Sl)0.4117 .137 +37/-27 17
0.01085(CDA)0.568(P)2.945(Sl)0.374(S)-0.248 .131 +35/-26 19
Q25
0.195(CDA)0.469(P)2.603 .153 +42/-30 19
0.0163(CDA)0.550(P)3.001(Sl)0.365 .144 +39/-28 21
0.0829(CDA)0.549(P)2.532(Sl)0.326(S)-0.275 .136 +37/-27 24
Q50
0.508(CDA)0.465(P)2.411 .159 +44/-31 21
2.482(CDA)0.473(P)1.916(S)-0.318 .150 +41/-29 24
0.283(CDA)0.539(P)2.283(S)-0.293(Sl)0.298 .144 +39/-28 26
Q100
1.16(CDA)0.462(P)2.250 .166 +47/-32 23
5.93(CDA)0.471(P)1.733(S)-0.332 .156 +43/-30 26
0.810(CDA)0.532(P)2.070(S)-0.309(Sl)0.272 .153 +42/-30 27
Q200
2.30(CDA)0.461(P)2.110 .174 +49/-33 24
12.7(CDA)0.470(P)1.575(S)-0.344 .164 +46/-31 27
2.050(CDA)0.526(P)1.882(S)-0.324(Sl)0.250 .163 +46/-31 28
For drainage areas ranging from 0.17 to less than 30 square miles
Q2 0.0126(CDA)0.579(P)2.824 .216 +64/-39 4.1
Q5 0.300(CDA)0.600(P)2.138 .184 +53/-35 7.0
Q10 1.224(CDA)0.611(P)1.844 .183 +58/-37 9.0
Q25 4.673(CDA)0.622(P)1.572 .198 +58/-37 10
Q50 10.26(CDA)0.628(P)1.415 .214 +64/-39 11
Q100 19.80(CDA)0.634(P)1.288 .232 +71/-44 11
Q200 34.68(CDA)0.640 (P)1.181 .248 +77/-44 11

16 Estimation of Peak Streamflows for Unregulated Rural Streams in Kansas
The equivalent years of record is the number of years of streamflow record necessary to provide an estimate equal in accuracy to the regression equation. The accuracy of the regression equations for unregulated, rural streams, expressed in average equivalent years of record, is summarized in table 4.
Use of Regression Equations
The GLS regression equations shown in table 4 may be used to estimate the peak streamflow for spe-cific recurrence intervals (frequencies) at ungaged sites by determining the values of the physical and cli-matic characteristics relative to the site and substitut-ing the values into the respective equations. The values for contributing-drainage area (CDA) can be deter-mined from digital data using GIS or paper topo-graphic maps. The values for mean annual precipita-tion (P) and soil permeability (S) can be determined from digital data using GIS or from figures 2 or 3. Both P and S are areal averages for the entire drainage area. Main channel slope (Sl) can be measured and calculated from topographic maps.
The equations shown in table 4 were developed using data from streams located in rural basins, whose contributing-drainage areas ranged from 0.17 to 9,100 mi2, during periods of record when flows were unregulated. Therefore, the equations should not be used to estimate peak streamflow if the watershed is not predominately rural, if the contributing-drainage area is smaller than 0.17 mi2 or larger than 9,100 mi2, or if streamflow is affected by regulation.
SUMMARY
Estimates of peak streamflow for selected frequen-cies were computed by using observed annual peak-streamflow data collected through the 1997 water year for streamflow-gaging stations located on unregulated rural streams in Kansas with 10 or more years of record. Log-Pearson Type III distributions were fitted to the observed annual peak-streamflow data for each streamflow-gaging station by using techniques recom-mended by the Interagency Committee on Water Data. Peak streamflows for 2-, 5-, 10-, 25-, 50-, 100-, and 200-year recurrence intervals were calculated.
A weighted least-squares (WLS) regression model was used to estimate a generalized skew coefficient for all the stations in this analysis. The WLS regression
model used station skew coefficients computed from 253 streamflow-gaging-station records in Kansas as the dependent variable and several physical and cli-matic characteristics for each station as independent (predictor) variables in a regression equation. The root-mean-square error (RMSE) for this equation (0.19) decreased from a RMSE of 0.35 for a previ-ously developed equation.
Regression equations then were developed to com-pute peak streamflows for ungaged sites at selected recurrence intervals by using generalized least-square regression to relate peak streamflow at gaging stations to physical and climatic characteristics. The significant independent variables in the regression equations were contributing-drainage area, mean annual precipita-tion, average soil permeability, and slope of the main channel. Standard error of prediction did not improve when the State was divided into eastern and western areas. The standard error of prediction for the regres-sion equations was smallest when the group of 253 streamflow-gaging stations was divided into two groups on the basis of contributing-drainage area. Standard error of prediction for equations developed for stations with contributing-drainage areas greater than 0.17 and less than 30 mi2 were equal to or slightly greater than the standard errors for the equations developed using all the stations. Standard errors of prediction for equations developed for stations with contributing-drainage areas between 30 and 9,100 mi2 were reduced between 12 and 20 percent from predic-tions errors using all 253 stations. The errors of pre-diction for all the generated equations ranged from 31 to 62 percent.
SELECTED REFERENCES
Clement, R.W., 1987, Floods in Kansas and techniques for estimating their magnitude and frequency on unregu-lated streams: U.S. Geological Survey Water-Resources Investigations Report 87–4008, 50 p.
Clement, R.W. and Johnson, D.G., 1982, Flood of June 15, 1981, in Great Bend and vicinity, central Kansas: U.S. Geological Survey Water-Resources Investigations Report 82–4123, 12 p.
Crippen, J.R., and Bue, C.D., 1977, Maximum floodflows in the conterminous United States: U.S. Geological Sur-vey Water-Supply Paper 1887, 52 p.
Daly, C., Taylor, C.H., and Gibson, W.P., 1997, The PRISM approach to mapping precipitation and temperature, in Reprints of 10th Conference on Applied Climatology,

Selected References 17
Reno, Nevada: American Meteorological Society, p. 10–12.
Ellis, D.W., and Edelen, G.W., Jr., 1960, Kansas streamflow characteristics, part 3, Flood frequency: Kansas Water Resources Board Technical Report No. 3, 221 p.
Hardison, C.H., 1969, Accuracy of streamflow characteris-tics, in Geological Survey Research, 1969: U.S. Geo-logical Survey Professional Paper 650–D, p. D210–D214.
_____1971, Prediction error of regression estimates of streamflow characteristics at ungaged sites, in Geologi-cal Survey Research, 1971: U.S. Geological Survey Professional Paper 750–C, p. C228–C236.
Hedman, E.R., Kastner, W.M., and Hejl, H.R., 1974, Kansas streamflow characteristics—part 10, Selected stream-flow characteristics as related to active-channel geome-try of streams in Kansas: Kansas Water Resources Board Technical Report No. 10, 21 p.
Hershfield, D.M., 1961, Rainfall frequency atlas of the United States: U.S. Department of Commerce, Weather Bureau Technical Paper 40, 115 p.
House Document 465, 1966, A unified national program for managing flood losses, 89th Congress, 2d session: U.S. Government Printing Office, 47 p.
Interagency Advisory Committee on Water Data, 1981, Guidelines for determining flood flow frequency: Washington, D.C., Bulletin 17B of the Hydrology Committee, 28 p.
Irza, T.J., 1966, Preliminary flood-frequency relations for small streams in Kansas: Lawrence, Kansas, U.S. Geo-logical Survey open-file report, 19 p.
Jennings, M.E., Thomas, W.O., and Riggs, H.C., 1994, Nationwide summary of U.S. Geological Survey regional regression equations for estimating magnitude and frequency of floods for ungaged sites, 1993: U.S. Geological Survey Water-Resources Investigation Report 94–4002, 196 p.
Jordan, P.R., and Irza, T.J., 1975, Kansas streamflow char-acteristics—magnitude and frequency of floods in Kansas, unregulated streams: Kansas Water Resources Board Technical Report No. 11, 34 p.
Matthai, H.F., 1968, Magnitude and frequency of floods in the United States—part 6B, Missouri River Basin below Sioux City, Iowa: U.S. Geological Survey Water-Supply Paper 1681, 636 p.
Patterson, J.L., 1964, Magnitude and frequency of floods in the United States—part 7, Lower Mississippi River Basin: U.S. Geological Survey Water-Supply Paper 1691, 636 p.
Perry, C.A., and Rasmussen, T.J., in press, Trends in annual peak flows of selected streams in central Great Plains: Journal of the American Water Resources Association.
Putnam, J.E., Lacock, D.L., Schneider, D.R., Carlson, M.D., and Dague, B.J., 1998, Water resources data, Kansas, water year 1997: U.S. Geological Survey Water-Data Report KS–97–1, 445 p.
Schoewe, W.H., 1949, The geography of Kansas—part 2, Physical geography: Transactions of the Kansas Acad-emy of Science, v. 52, no. 3, p. 261–333.
Tasker, G.D., and Stedinger, J.R., 1986, Regional skew with weighted LS regression: Journal of Water Resources Planning and Management, v. 112, book 2, p. 225–237.
—— 1989, An operational GLS model for hydrologic regression: Journal of Hydrology, v. 111, p. 361–375.
U.S. Department of Agriculture, 1994, State soil geographic (STATSGO) data base: Soil Conservation Service Mis-cellaneous Publication 1462, 37 p.
U.S. Geological Survey, 1998, National elevation data base: Sioux Falls, South Dakota, National Mapping Division EROS Data Center, accessed June 6, 1998, at URL http://edcwww2.cr.usgs.gov/ned/ned.html
U.S. Water Resources Council, 1967, A uniform technique for determining flood flow frequency: Washington, D.C., Bulletin 15 of the Hydrology Committee, 15 p.
18 Estimation of Peak Streamflows for Unregulated Rural Streams in Kansas
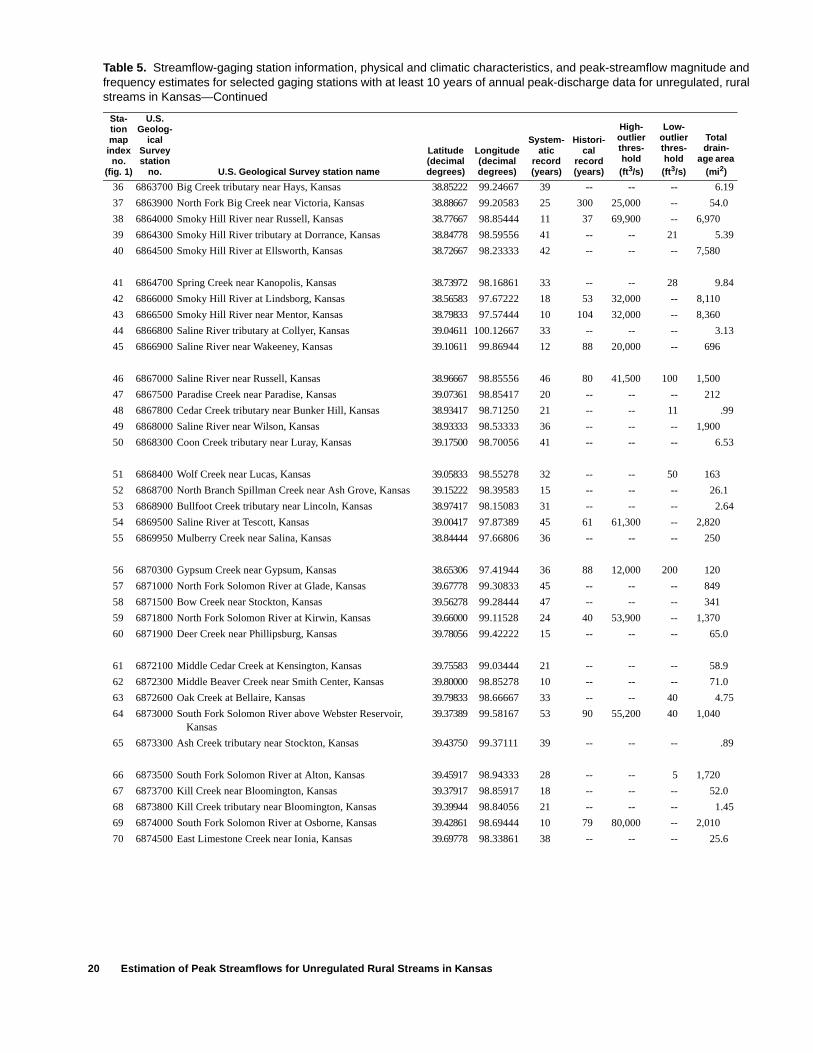
Table 5. Streamflow-gaging station information, physical and climatic characteristics, and peak-streamflow magnitude and frequency estimates for selected gaging stations with at least 10 years of annual peak-discharge data for unregulated, rural streams in Kansas—Continued
Sta-tion map index
no. (fig. 1)
U.S. Geolog-
ical Survey station
no. U.S. Geological Survey station name
Latitude (decimal degrees)
Longitude (decimal degrees)
System-atic
record (years)
Histori-cal
record (years)
High-outlier thres-hold (ft3/s)
Low-outlier thres-hold (ft3/s)
Total drain-
age area (mi2)
1 6813700 Tennessee Creek tributary near Seneca, Kansas 39.81278 96.04556 33 -- -- -- 0.90
2 6814000 Turkey Creek near Seneca, Kansas 39.94778 96.10833 49 -- -- 226 276
3 6815700 Buttermilk Creek near Willis, Kansas 39.75444 95.45056 40 -- -- -- 3.74
4 6818200 Doniphan Creek at Doniphan, Kansas 39.63556 95.08194 11 -- -- -- 4.15
5 6818260 White Clay Creek at Atchison, Kansas 39.55917 95.12722 25 -- -- -- 13.1
6 6844700 South Fork Sappa Creek near Brewster, Kansas 39.28528 101.46556 22 -- -- -- 74.0
7 6844800 South Fork Sappa Creek tributary near Goodland, Kansas 39.32056 101.63250 33 -- -- -- 4.98
8 6844900 South Fork Sappa Creek near Achilles, Kansas 39.67694 100.72167 38 -- -- 10 446
9 6845000 Sappa Creek near Oberlin, Kansas 39.81250 100.53333 35 -- -- -- 1,063
10 6845100 Long Branch Draw near Norcatur, Kansas 39.90167 100.17861 41 -- -- -- 31.7
11 6846000 Beaver Creek at Ludell, Kansas 39.84806 100.96111 42 -- -- -- 1,460
12 6846200 Beaver Creek tributary near Ludell, Kansas 39.81472 100.87194 33 -- -- 70 10.2
13 6846500 Beaver Creek at Cedar Bluffs, Kansas 39.98500 100.55972 52 -- -- -- 1,620
14 6847600 Prairie Dog Creek tributary at Colby, Kansas 39.39111 101.04528 41 55 4,290 -- 7.53
15 6847900 Prairie Dog Creek above Keith Sebelius Lake, Kansas 39.77028 100.10000 35 54 65,400 -- 590
16 6848000 Prairie Dog Creek at Norton, Kansas 39.81000 99.92167 20 -- -- -- 684
17 6848200 Prairie Dog Creek tributary near Norton, Kansas 39.85417 99.88806 35 -- -- -- 1.02
18 6848500 Prairie Dog Creek near Woodruff, Kansas 39.98583 99.47750 23 -- -- -- 1,010
19 6853800 White Rock Creek near Burr Oak, Kansas 39.89861 98.25139 40 129 15,700 -- 227
20 6854000 White Rock Creek at Lovewell, Kansas 39.88611 98.02222 11 88 23,200 -- 345
21 6855800 Buffalo Creek near Jamestown, Kansas 39.61528 97.85556 31 -- -- -- 330
22 6855900 Wolf Creek near Concordia, Kansas 39.54306 97.72222 19 -- -- -- 56.0
23 6856100 West Creek near Talmo, Kansas 39.66667 97.61333 33 107 14,900 -- 42.0
24 6856320 Elk Creek at Clyde, Kansas 39.59444 97.39694 26 -- -- -- 73.0
25 6856800 Moll Creek near Green, Kansas 39.38000 97.00778 34 -- -- 36 3.6
26 6858500 North Fork Smoky Hill River near McAllaster, Kansas 39.01694 101.34750 33 -- -- -- 670
27 6858700 North Fork Smoky Hill River tributary near Winona, Kansas
39.03083 101.28528 16 -- -- -- 1.13
28 6859500 Ladder Creek below Chalk Creek near Scott City, Kansas 38.78889 100.86944 29 80 17,900 -- 1,460
29 6860000 Smoky Hill River at Elkader, Kansas 38.79250 100.85528 58 60 70,900 -- 3,560
30 6860300 South Branch Hackberry Creek near Orion, Kansas 38.94167 100.70278 12 -- -- -- 49.6
31 6860500 Hackberry Creek near Gove, Kansas 38.95417 100.48472 36 -- -- -- 426
32 6861000 Smoky Hill River near Arnold, Kansas 38.80861 100.02028 50 60 86,900 -- 5,220
33 6863300 Big Creek near Ogallah, Kansas 38.91111 99.74444 13 -- -- -- 297
34 6863400 Big Creek tributary near Ogallah, Kansas 38.93333 99.74250 41 -- -- -- 4.81
35 6863500 Big Creek near Hays, Kansas 38.81250 99.25389 51 90 19,800 -- 594
Table 5. Streamflow-gaging station information, physical and climatic characteristics, and peak-streamflow magnitude and frequency estimates for selected gaging stations with at least 10 years of annual peak-discharge data for unregulated, rural streams in Kansas
[ft3/s, cubic feet per second; mi2, square miles; in., inches; ft/mi, feet per mile; in/h, inches per hour; --, not determined]

Generalized Least-Squares Regression Equations 19
Sta-tion map index no.
(fig. 1)
Contribu-ting drain-age area
(mi2)
Mean annual precipi-tation (in.)
Soil perme-ability (in/h)
Main channel
slope (ft/mi)
General-ized
skew-ness
coeffi-cient
Weighted skew-ness
coeffi-cient
Discharge for indicated recurrence interval (ft3/s)
2-year 5-year 10-year 25-year 50-year 100-year 200-year
1 0.90 34.0 0.395 62.1 -0.0742 -0.047 201 497 794 1,300 1,790 2,390 3,090
2 276 32.3 .467 5.89 .0946 -.1089 5,820 12,500 18,400 27,700 36,000 45,300 55,900
3 3.74 36.6 .367 67.2 -.0091 -.1147 1,520 2,760 3,750 5,160 6,320 7,580 8,930
4 4.15 36.7 1.083 44.6 .0018 -.0627 1,080 2,480 3,820 6,030 8,070 10,500 13,300
5 13.1 36.8 .955 37.7 .0243 .0788 1,100 2,180 3,120 4,610 5,950 7,490 9,260
6 74.0 18.3 1.296 10.8 -.2821 -.3779 52 382 996 2,600 4,670 7,740 12,100
7 4.98 18.2 1.296 14.4 -.3626 -.3187 54 389 1,020 2,690 4,900 8,260 13,100
8 378 19.2 1.297 7.00 -.1614 -.1685 342 1,210 2,290 4,430 6,730 9,730 13,600
9 900 19.8 1.321 7.33 -.1148 -.1415 827 2,570 4,570 8,320 12,200 17,000 23,100
10 31.7 21.9 1.299 12.8 -.1812 -.1514 294 693 1,070 1,680 2,230 2,870 3,600
11 1,120 18.5 1.325 8.11 -.1277 -.1046 440 1,110 1,780 2,920 4,000 5,300 6,840
12 10.2 21.3 1.291 33.2 -.2569 -.3999 298 665 974 1,430 1,800 2,190 2,610
13 1,320 18.8 1.326 7.72 -.0893 .064 413 1,060 1,730 2,960 4,190 5,740 7,680
14 7.53 19.2 1.296 16.7 -.314 -.437 215 568 898 1,410 1,860 2,350 2,880
15 590 20.7 1.362 7.11 -.1081 -.1862 599 1,680 2,820 4,820 6,760 9,100 11,900
16 689 21.0 1.361 7.03 -.0908 .0372 2,760 7,180 11,900 20,400 29,000 39,800 53,200
17 1.02 22.8 1.299 67.8 -.2663 -.3926 185 366 507 701 854 1,010 1,180
18 1,000 21.6 1.368 5.61 -.0409 .0823 2,300 5,020 7,610 11,900 16,000 20,800 26,600
19 227 26.5 1.299 6.95 -.0267 .1703 1,520 3,040 4,430 6,680 8,760 11,200 14,100
20 345 27.1 1.306 6.12 -.0043 .2749 2,790 4,910 6,710 9,480 11,900 14,800 18,000
21 330 27.9 1.103 6.15 -.0222 .1535 1,670 3,890 6,140 10,100 14,000 18,900 25,000
22 56.0 28.8 1.013 8.79 -.0714 -.0863 910 1,770 2,490 3,570 4,490 5,520 6,640
23 42.0 29.6 .843 7.07 -.0622 .1582 676 1,870 3,250 5,920 8,780 12,600 17,600
24 73.0 30.1 .993 11.0 -.0424 .072 546 1,350 2,170 3,640 5,100 6,910 9,150
25 3.60 31.1 .778 20.4 -.126 -.2802 371 809 1,190 1,750 2,230 2,750 3,320
26 650 17.1 1.448 7.84 -.2405 -.3164 327 1,930 4,580 11,000 18,900 30,100 45,700
27 1.13 18.4 1.296 69.2 -.4129 -.3056 342 611 810 1,080 1,290 1,500 1,730
28 1,330 17.7 1.395 6.87 -.2171 -.0893 646 2,590 5,270 11,100 17,900 27,500 40,400
29 3,390 17.7 1.530 13.2 -.19 -.2754 1,510 6,400 13,000 26,900 42,200 62,500 88,700
30 49.6 19.6 1.294 9.34 -.2857 -.2099 397 1,190 2,050 3,590 5,110 6,970 9,210
31 421 19.5 1.288 6.71 -.2137 -.1192 508 2,340 5,100 11,500 19,300 30,600 46,500
32 5,220 18.4 1.522 11.4 -.1331 -.1133 2,230 7,660 14,400 27,800 42,300 61,400 86,100
33 297 21.4 1.278 6.27 -.189 -.165 1,340 4,430 8,090 15,100 22,500 31,900 43,800
34 4.81 21.8 1.201 15.8 -.3016 -.1102 211 707 1,310 2,510 3,790 5,470 7,630
35 594 21.8 1.175 5.82 -.1535 -.2795 1,280 3,210 5,050 7,990 10,600 13,600 17,000
20 Estimation of Peak Streamflows for Unregulated Rural Streams in Kansas
36 6863700 Big Creek tributary near Hays, Kansas 38.85222 99.24667 39 -- -- -- 6.19
37 6863900 North Fork Big Creek near Victoria, Kansas 38.88667 99.20583 25 300 25,000 -- 54.0
38 6864000 Smoky Hill River near Russell, Kansas 38.77667 98.85444 11 37 69,900 -- 6,970
39 6864300 Smoky Hill River tributary at Dorrance, Kansas 38.84778 98.59556 41 -- -- 21 5.39
40 6864500 Smoky Hill River at Ellsworth, Kansas 38.72667 98.23333 42 -- -- -- 7,580
41 6864700 Spring Creek near Kanopolis, Kansas 38.73972 98.16861 33 -- -- 28 9.84
42 6866000 Smoky Hill River at Lindsborg, Kansas 38.56583 97.67222 18 53 32,000 -- 8,110
43 6866500 Smoky Hill River near Mentor, Kansas 38.79833 97.57444 10 104 32,000 -- 8,360
44 6866800 Saline River tributary at Collyer, Kansas 39.04611 100.12667 33 -- -- -- 3.13
45 6866900 Saline River near Wakeeney, Kansas 39.10611 99.86944 12 88 20,000 -- 696
46 6867000 Saline River near Russell, Kansas 38.96667 98.85556 46 80 41,500 100 1,500
47 6867500 Paradise Creek near Paradise, Kansas 39.07361 98.85417 20 -- -- -- 212
48 6867800 Cedar Creek tributary near Bunker Hill, Kansas 38.93417 98.71250 21 -- -- 11 .99
49 6868000 Saline River near Wilson, Kansas 38.93333 98.53333 36 -- -- -- 1,900
50 6868300 Coon Creek tributary near Luray, Kansas 39.17500 98.70056 41 -- -- -- 6.53
51 6868400 Wolf Creek near Lucas, Kansas 39.05833 98.55278 32 -- -- 50 163
52 6868700 North Branch Spillman Creek near Ash Grove, Kansas 39.15222 98.39583 15 -- -- -- 26.1
53 6868900 Bullfoot Creek tributary near Lincoln, Kansas 38.97417 98.15083 31 -- -- -- 2.64
54 6869500 Saline River at Tescott, Kansas 39.00417 97.87389 45 61 61,300 -- 2,820
55 6869950 Mulberry Creek near Salina, Kansas 38.84444 97.66806 36 -- -- -- 250
56 6870300 Gypsum Creek near Gypsum, Kansas 38.65306 97.41944 36 88 12,000 200 120
57 6871000 North Fork Solomon River at Glade, Kansas 39.67778 99.30833 45 -- -- -- 849
58 6871500 Bow Creek near Stockton, Kansas 39.56278 99.28444 47 -- -- -- 341
59 6871800 North Fork Solomon River at Kirwin, Kansas 39.66000 99.11528 24 40 53,900 -- 1,370
60 6871900 Deer Creek near Phillipsburg, Kansas 39.78056 99.42222 15 -- -- -- 65.0
61 6872100 Middle Cedar Creek at Kensington, Kansas 39.75583 99.03444 21 -- -- -- 58.9
62 6872300 Middle Beaver Creek near Smith Center, Kansas 39.80000 98.85278 10 -- -- -- 71.0
63 6872600 Oak Creek at Bellaire, Kansas 39.79833 98.66667 33 -- -- 40 4.75
64 6873000 South Fork Solomon River above Webster Reservoir, Kansas
39.37389 99.58167 53 90 55,200 40 1,040
65 6873300 Ash Creek tributary near Stockton, Kansas 39.43750 99.37111 39 -- -- -- .89
66 6873500 South Fork Solomon River at Alton, Kansas 39.45917 98.94333 28 -- -- 5 1,720
67 6873700 Kill Creek near Bloomington, Kansas 39.37917 98.85917 18 -- -- -- 52.0
68 6873800 Kill Creek tributary near Bloomington, Kansas 39.39944 98.84056 21 -- -- -- 1.45
69 6874000 South Fork Solomon River at Osborne, Kansas 39.42861 98.69444 10 79 80,000 -- 2,010
70 6874500 East Limestone Creek near Ionia, Kansas 39.69778 98.33861 38 -- -- -- 25.6
Table 5. Streamflow-gaging station information, physical and climatic characteristics, and peak-streamflow magnitude and frequency estimates for selected gaging stations with at least 10 years of annual peak-discharge data for unregulated, rural streams in Kansas—Continued
Sta-tion map index
no. (fig. 1)
U.S. Geolog-
ical Survey station
no. U.S. Geological Survey station name
Latitude (decimal degrees)
Longitude (decimal degrees)
System-atic
record (years)
Histori-cal
record (years)
High-outlier thres-hold (ft3/s)
Low-outlier thres-hold (ft3/s)
Total drain-
age area (mi2)

Generalized Least-Squares Regression Equations 21
36 6.19 22.2 1.035 14.8 -.2765 -0.1364 63 209 382 717 1,070 1,530 2,100
37 54.0 22.9 1.258 8.30 -.2108 -.2145 263 1,250 2,640 5,570 8,770 13,000 18,300
38 6,970 19.5 1.462 9.70 -.0676 -.192 7,810 16,000 22,900 33,100 41,800 51,400 61,800
39 5.39 26.2 1.076 24.8 -.2469 -.1911 245 631 1,010 1,660 2,250 2,960 3,780
40 7,580 20.0 1.457 8.95 -.0377 -.1724 6,920 16,700 26,000 41,200 55,000 71,100 89,500
41 9.84 27.8 1.138 17.8 -.2181 -.235 461 1,170 1,870 3,000 4,040 5,250 6,630
42 8,110 20.6 1.463 7.41 -.0217 .1793 5,910 11,000 15,500 22,400 28,600 35,800 44,100
43 8,360 20.8 1.450 6.65 .0059 .2919 5,080 10,400 15,500 24,100 32,400 42,600 55,000
44 3.13 22.1 1.201 33.2 -.323 -.2645 161 565 1,050 1,980 2,930 4,130 5,620
45 696 20.6 1.369 7.17 -.1536 -.2084 2,720 8,200 14,200 25,100 35,900 49,100 65,000
46 1,500 21.7 1.388 6.86 -.0926 -.0769 2,270 6,630 11,500 20,500 29,700 41,400 55,900
47 212 23.9 1.307 7.29 -.137 -.2027 947 3,160 5,780 10,800 15,900 22,400 30,500
48 0.99 25.9 1.118 99.3 -.2921 -.162 130 223 292 387 462 541 623
49 1,900 22.4 1.362 6.28 -.0724 -.1429 4,940 10,900 16,300 24,800 32,300 40,800 50,500
50 6.53 24.9 1.188 43.2 -.2165 -.2587 357 1,070 1,830 3,170 4,470 6,040 7,890
51 163 25.0 1.195 16.4 -.1301 -.1601 1,570 3,660 5,600 8,730 11,600 14,800 18,500
52 26.1 25.8 1.029 14.0 -.1642 -.1866 342 1,100 1,960 3,600 5,260 7,360 9,950
53 2.64 27.5 1.186 31.0 -.2319 -.2033 104 239 362 555 727 922 1,140
54 2,820 23.7 1.313 5.02 -.0206 -.0468 3,110 6,940 10,500 16,300 21,700 27,900 35,200
55 250 28.3 1.123 9.67 -.0923 -.1365 2,310 4,530 6,380 9,100 11,400 13,900 16,700
56 120 30.9 .881 9.54 -.1177 -.0709 2,290 4,310 5,960 8,400 10,500 12,700 15,200
57 849 21.3 1.335 7.79 -.0655 -.2132 1,580 4,790 8,320 14,700 21,000 28,800 38,200
58 341 21.6 1.451 6.73 -.1004 .159 926 2,960 5,320 9,790 14,400 20,200 27,500
59 1,370 21.5 1.377 7.60 -.0439 .0564 3,950 10,100 16,700 28,500 40,400 55,300 73,900
60 65.0 23.0 1.366 16.5 -.1333 -.2286 1,210 3,430 5,760 9,790 13,600 18,300 23,700
61 58.9 23.8 1.223 8.61 -.1183 .0345 577 1,350 2,100 3,390 4,610 6,100 7,890
62 71.0 24.5 1.248 11.1 -.0995 -.1213 765 1,390 1,880 2,590 3,170 3,790 4,460
63 4.75 24.8 1.222 22.0 -.1653 -.0569 91 273 481 875 1,290 1,810 2,470
64 1,040 20.9 1.463 8.29 -.1026 -.085 2,800 8,330 14,600 26,300 38,300 53,600 72,700
65 .89 22.9 1.201 58.9 -.2822 -.1342 37 150 304 637 1,020 1,540 2,240
66 1,680 21.6 1.410 8.38 -.048 -.0095 3,600 12,300 23,400 46,300 72,000 107,000 154,000
67 52.0 24.4 1.203 10.9 -.1478 -.1976 182 1,150 2,890 7,480 13,600 23,100 37,000
68 1.45 25.0 1.165 23.9 -.2446 -.284 208 585 970 1,630 2,240 2,960 3,790
69 2,010 22.1 1.391 7.93 -.0329 .0914 3,130 7,070 10,900 17,400 23,700 31,300 40,400
70 25.6 26.9 1.228 11.8 -.1108 -.2317 608 1,320 1,940 2,880 3,680 4,580 5,550
Sta-tion map index no.
(fig. 1)
Contribu-ting drain-age area
(mi2)
Mean annual precipi-tation (in.)
Soil perme-ability (in/h)
Main channel
slope (ft/mi)
General-ized
skew-ness
coeffi-cient
Weighted skew-ness
coeffi-cient
Discharge for indicated recurrence interval (ft3/s)
2-year 5-year 10-year 25-year 50-year 100-year 200-year

22 Estimation of Peak Streamflows for Unregulated Rural Streams in Kansas
71 6875800 Limestone Creek near Glen Elder, Kansas 39.53833 98.31611 22 -- -- -- 210
72 6876000 Solomon River at Beloit, Kansas 39.41917 98.05917 44 89 124,000 -- 5,530
73 6876200 Middle Pipe Creek near Miltonvale, Kansas 39.35000 97.56889 21 -- -- -- 10.2
74 6876700 Salt Creek near Ada, Kansas 39.14167 97.83611 38 101 15,900 -- 384
75 6876900 Solomon River at Niles, Kansas 38.96889 97.47611 44 89 178,000 -- 6,770
76 6877120 Mud Creek at Abilene, Kansas 38.92972 97.22750 28 -- -- -- 87.0
77 6877200 West Turkey Creek near Elmo, Kansas 38.66778 97.17167 21 -- -- -- 26.6
78 6877400 Turkey Creek tributary near Elmo, Kansas 38.68250 97.18444 21 -- -- -- 2.48
79 6877500 Turkey Creek near Abilene, Kansas 38.80611 97.18139 30 88 23,600 -- 143
80 6878000 Chapman Creek near Chapman, Kansas 39.03111 97.04000 44 47 46,600 -- 300
81 6878500 Lyon Creek near Woodbine, Kansas 38.88472 96.90972 21 -- -- -- 230
82 6879200 Clark Creek near Junction City, Kansas 39.00778 96.73889 32 -- -- -- 200
83 6879650 Kings Creek near Manhattan, Kansas 39.10194 96.59500 18 -- -- -- 4.09
84 6879700 Wildcat Creek at Riley, Kansas 39.29278 96.83056 21 -- -- -- 14.0
85 6879815 Wildcat Creek at Manhattan, Kansas 39.18472 96.61028 16 -- -- -- 74.0
86 6882510 Big Blue River at Marysville, Kansas 39.84222 96.66083 13 95 39,700 -- 4,780
87 6884025 Little Blue River at Hollenberg, Kansas 39.98000 97.00444 22 -- -- -- 2,750
88 6884100 Mulberry Creek tributary near Haddam, Kansas 39.81361 97.29889 32 -- -- -- 1.64
89 6884200 Mill Creek at Washington, Kansas 39.81389 97.03889 38 95 14,600 -- 344
90 6884300 Mill Creek tributary near Washington, Kansas 39.81333 97.00833 41 -- -- -- 3.2
91 6884400 Little Blue River near Barnes, Kansas 39.77583 96.85806 40 95 41,900 2,400 3,320
92 6884500 Little Blue River at Waterville, Kansas 39.77778 96.86111 33 55 72,900 -- 3,510
93 6884900 Robidoux Creek at Beattie, Kansas 39.86333 96.42972 19 -- -- 157 40.0
94 6885500 Black Vermillion River near Frankfort, Kansas 39.68417 96.43750 44 50 38,200 -- 410
95 6886000 Big Blue River at Randolph, Kansas 39.45000 96.71667 43 -- -- -- 9,100
96 6886500 Fancy Creek at Winkler, Kansas 39.47222 96.83194 35 46 24,000 880 174
97 6887200 Cedar Creek near Manhattan, Kansas 39.25861 96.56333 32 -- -- -- 13.4
98 6887600 Kansas River tributary near Wamego, Kansas 39.17444 96.26250 34 -- -- -- .83
99 6888000 Vermillion Creek near Wamego, Kansas 39.35000 96.21944 43 71 26,000 -- 243
100 6888030 Vermillion Creek near Louisville, Kansas 39.27833 96.24278 14 -- -- -- 297
101 6888300 Rock Creek near Louisville, Kansas 39.26472 96.37972 32 -- -- -- 128
102 6888500 Mill Creek near Paxico, Kansas 39.06222 96.18111 44 63 77,100 -- 316
103 6888600 Dry Creek near Maple Hill, Kansas 39.05167 96.02056 21 75 7,290 -- 15.6
104 6888900 Blacksmith Creek tributary near Valencia, Kansas 39.02222 95.83500 33 -- -- 60 1.31
105 6889100 Soldier Creek near Goff, Kansas 39.62417 95.96583 23 37 7,080 -- 2.06
Table 5. Streamflow-gaging station information, physical and climatic characteristics, and peak-streamflow magnitude and frequency estimates for selected gaging stations with at least 10 years of annual peak-discharge data for unregulated, rural streams in Kansas—Continued
Sta-tion map index
no. (fig. 1)
U.S. Geolog-
ical Survey station
no. U.S. Geological Survey station name
Latitude (decimal degrees)
Longitude (decimal degrees)
System-atic
record (years)
Histori-cal
record (years)
High-outlier thres-hold (ft3/s)
Low-outlier thres-hold (ft3/s)
Total drain-
age area (mi2)

Generalized Least-Squares Regression Equations 23
71 210 26.6 1.219 6.66 -0.0659 -0.0209 1,060 1,910 2,600 3,590 4,430 5,340 6,340
72 5,530 23.1 1.333 6.30 .0273 .215 8,000 16,100 23,700 36,200 47,800 61,800 78,500
73 10.2 30.0 .951 29.6 -.1289 -.044 532 1,270 2,000 3,220 4,380 5,760 7,400
74 384 27.0 1.105 4.65 -.0613 -.151 1,430 4,030 6,800 11,700 16,600 22,500 29,600
75 6,770 24.0 1.286 5.23 .0211 .242 6,510 12,600 18,100 27,100 35,400 45,200 56,800
76 87.0 30.8 1.220 6.09 -.0908 -.119 2,570 4,670 6,330 8,710 10,700 12,800 15,000
77 26.6 32.7 .550 12.2 -.1454 -.2651 1,200 2,220 3,000 4,080 4,940 5,850 6,790
78 2.48 32.5 .462 26.3 -.2108 -.1978 292 840 1,430 2,460 3,470 4,700 6,160
79 143 32.8 .480 6.67 -.0862 -.0511 2,960 6,550 9,870 15,300 20,200 25,900 32,500
80 300 30.9 1.022 4.25 -.0372 .17 3,630 7,130 10,300 15,300 20,000 25,400 31,800
81 230 34.1 .532 5.45 -.0515 -.1501 6,410 18,000 30,300 52,200 73,600 99,800 131,000
82 200 33.8 .460 6.12 -.035 -.0839 4,320 8,970 13,100 19,400 25,000 31,300 38,400
83 4.09 33.6 .457 20.0 -.127 -.0565 428 1,930 4,210 9,590 16,300 26,100 40,000
84 14.0 31.9 .538 10.2 -.0872 -.1633 936 2,020 2,980 4,450 5,740 7,190 8,810
85 74.0 32.4 .564 8.0 -.0395 -.07 2,470 4,380 5,880 80,30 9,800 11,700 13,800
86 4,780 28.7 .808 3.0 .1354 -.1965 19,100 32,800 42,900 56,700 67,500 78,800 90,500
87 2,750 27.6 1.367 4.5 .1151 .1123 11,200 21,000 29,300 42,100 53,400 66,300 81,000
88 1.64 30.5 1.031 52.0 -.1225 .0343 166 414 669 1,120 1,560 2,110 2,790
89 349 30.6 .907 4.58 .0403 -.1853 4,830 8,160 10,600 13,900 16,500 19,200 22,000
90 3.20 31.4 .737 52.4 -.0888 -.0264 524 1,090 1,600 2,400 3,120 3,940 4,880
91 3,320 28.2 1.279 4.33 .1088 -.0704 13,100 21,200 27,200 35,400 41,900 48,700 55,900
92 3,510 28.2 1.281 4.26 .1104 .0719 11,600 24,000 35,400 53,700 70,600 90,300 113,000
93 40.0 32.2 .325 13.5 .0162 -.0726 1,850 3,930 5,780 8,700 11,300 14,300 17,600
94 410 33.3 .359 5.72 .0638 .0525 7,030 15,700 24,100 38,000 51,200 66,900 85,700
95 9,100 28.9 .946 2.69 .1138 .1151 23,600 40,700 54,500 74,700 91,900 111,000 132,000
96 174 31.0 .731 8.40 -.0003 -.0993 5,690 10,600 14,600 20,500 25,400 30,700 36,500
97 13.4 33.0 .400 37.6 -.0777 -.1361 1,530 3,560 5,470 8,560 11,400 14,600 18,400
98 .83 34.2 .446 96.4 -.1474 -.2128 217 457 663 972 1,240 1,530 1,850
99 243 34.9 .426 5.50 .0294 -.2083 6,190 12,600 17,900 25,800 32,400 39,700 47,500
100 297 34.9 .431 4.63 .027 .0541 6,610 9,650 11,800 14,600 16,800 19,100 21,500
101 128 33.9 .602 10.6 -.0048 -.0209 5,880 10,100 13,400 18,100 21,900 26,100 30,600
102 316 34.7 .505 10.5 .0117 -.1791 11,600 23,000 32,400 46,300 58,000 70,800 84,600
103 15.6 35.3 .427 16.8 -.0646 .1227 1,670 3,080 4,280 6,110 7,730 9,560 11,600
104 1.31 35.5 .394 65.9 -.1267 -.1193 385 724 999 1,400 1,730 2,090 2,490
105 2.06 35.5 .317 25.1 -.0646 .136 402 880 1,340 2,120 2,870 3,770 4,860
Sta-tion map index no.
(fig. 1)
Contribu-ting drain-age area
(mi2)
Mean annual precipi-tation (in.)
Soil perme-ability (in/h)
Main channel
slope (ft/mi)
General-ized
skew-ness
coeffi-cient
Weighted skew-ness
coeffi-cient
Discharge for indicated recurrence interval (ft3/s)
2-year 5-year 10-year 25-year 50-year 100-year 200-year

24 Estimation of Peak Streamflows for Unregulated Rural Streams in Kansas
106 6889120 Soldier Creek near Bancroft, Kansas 39.59500 95.97139 24 37 13,100 -- 10.5
107 6889140 Soldier Creek near Soldier, Kansas 39.56583 95.96250 33 -- -- -- 16.9
108 6889160 Soldier Creek near Circleville, Kansas 39.46306 95.95000 33 -- -- -- 49.3
109 6889180 Soldier Creek near St. Clere, Kansas 39.37583 95.91806 18 -- -- -- 80.0
110 6889200 Soldier Creek near Delia, Kansas 39.20222 95.87361 39 89 29,000 -- 157
111 6889500 Soldier Creek near Topeka, Kansas 39.10000 95.72417 68 -- -- -- 290
112 6889600 South Branch Shunganunga Creek near Pauline, Kansas 39.97889 95.70972 21 -- -- -- 3.84
113 6889630 Shunganunga Creek at Topeka, Kansas 39.03167 95.68250 28 -- -- -- 33.5
114 6890100 Delaware River near Muscotah, Kansas 39.52139 95.53250 28 73 40,000 -- 431
115 6890300 Spring Creek near Wetmore, Kansas 39.63667 95.84528 21 -- -- -- 21.0
116 6890500 Delaware River at Valley Falls, Kansas 39.35083 95.45444 46 103 86,900 -- 922
117 6890560 Rock Creek 6 miles north of Meriden, Kansas 39.28861 95.58250 14 -- -- -- 1.89
118 6890600 Rock Creek near Meriden, Kansas 39.19278 95.55139 14 -- -- -- 22.0
119 6890700 Slough Creek tributary near Oskaloosa, Kansas 39.20139 95.30250 21 -- -- -- .83
120 6890800 Slough Creek near Oskaloosa, Kansas 39.22361 95.33667 21 -- -- -- 31.0
121 6891050 Stone House Creek at Williamstown, Kansas 39.06667 95.33583 26 -- -- -- 12.9
122 6891500 Wakarusa River near Lawrence, Kansas 38.91111 95.26028 43 93 24,100 -- 425
123 6892000 Stranger Creek near Tonganoxie, Kansas 39.11639 95.01083 68 -- -- -- 406
124 6893080 Blue River near Stanley, Kansas 38.81250 94.67528 28 -- -- -- 46.0
125 6893300 Indian Creek at Overland Park, Kansas 38.94167 94.66944 34 -- -- -- 26.6
126 6893350 Tomahawk Creek near Overland Park, Kansas 38.91306 94.63167 13 -- -- -- 23.9
127 6910800 Marais des Cygnes River near Reading, Kansas 38.56667 95.96389 29 -- -- 350 177
128 6911000 Marais des Cygnes River at Melvern, Kansas 38.51500 95.69139 33 -- -- -- 351
129 6911500 Salt Creek near Lyndon, Kansas 38.60889 95.63806 58 -- -- -- 111
130 6911900 Dragoon Creek near Burlingame, Kansas 38.70833 95.83889 37 98 15,000 -- 114
131 6912300 Dragoon Creek tributary near Lyndon, Kansas 38.69250 95.68500 34 -- -- 100 3.76
132 6912500 Hundred and Ten Mile Creek near Quenemo, Kansas 38.64472 95.55944 24 44 38,500 1,500 322
133 6913000 Marais des Cygnes River near Pomona, Kansas 38.58417 95.45333 15 -- -- -- 1,040
134 6913500 Marais des Cygnes River near Ottawa, Kansas 38.61667 95.25694 48 100 141,000 -- 1,250
135 6913600 Rock Creek near Ottawa, Kansas 38.55417 95.26722 21 -- -- -- 10.2
136 6913700 Middle Creek near Princeton, Kansas 38.47750 95.25222 33 -- -- -- 52.0
137 6914000 Pottawatomie Creek near Garnett, Kansas 38.33361 95.24861 58 -- -- -- 334
138 6914250 South Fork Pottawatomie Creek tributary near Garnett, Kansas
38.23333 95.24778 34 -- -- 35 .35
139 6914500 Pottawatomie Creek at Lane, Kansas 38.44389 95.08389 25 -- -- -- 513
140 6915000 Big Bull Creek near Hillsdale, Kansas 38.63667 94.89139 24 71 45,100 -- 147
Table 5. Streamflow-gaging station information, physical and climatic characteristics, and peak-streamflow magnitude and frequency estimates for selected gaging stations with at least 10 years of annual peak-discharge data for unregulated, rural streams in Kansas—Continued
Sta-tion map index
no. (fig. 1)
U.S. Geolog-
ical Survey station
no. U.S. Geological Survey station name
Latitude (decimal degrees)
Longitude (decimal degrees)
System-atic
record (years)
Histori-cal
record (years)
High-outlier thres-hold (ft3/s)
Low-outlier thres-hold (ft3/s)
Total drain-
age area (mi2)

Generalized Least-Squares Regression Equations 25
106 10.5 35.2 0.343 18.0 -0.0223 0.1683 1,220 2,200 3,030 4,280 5,380 6,640 8,060
107 16.9 35.2 .358 14.6 -.0113 .1298 1,850 3,360 4,640 6,580 8,270 10,200 12,400
108 49.3 35.8 .381 10.8 .0095 .1819 4,030 6,850 9,140 12,500 15,400 18,700 22,300
109 80.0 35.5 .434 9.20 .0165 -.0964 4,440 7,220 9,250 12,000 14,200 16,400 18,800
110 159 35.6 .476 6.56 .0217 .1723 4,510 7,650 10,200 13,900 17,100 20,600 24,600
111 290 35.7 .556 5.55 .0366 -.1996 5,970 11,700 16,400 23,300 29,000 35,200 41,900
112 3.84 35.8 .394 18.3 -.0008 .0426 758 1,450 2,040 2,950 3,740 4,640 5,660
113 34.0 35.7 .422 9.33 -.0273 -.1863 2,150 2,910 3,390 3,970 4,390 4,790 5,180
114 431 36 .398 5.80 .097 -.0452 12,500 18,700 23,000 28,600 32,900 37,400 41,900
115 21.0 35.4 .393 20.2 .0074 .1332 1,600 3,680 5,750 9,360 12,900 17,200 22,500
116 922 36.3 .432 4.63 .1063 -.0373 14,000 27,500 39,000 56,400 71,600 88,600 108,000
117 1.98 36.7 .441 51.7 -.0772 -.1584 413 853 1,230 1,800 2,300 2,840 3,440
118 22.0 36.6 .489 11.9 -.0175 .0635 2,090 3,220 4,040 5,170 6,060 7,010 8,010
119 .83 38.9 .370 59.4 -.095 -.182 173 486 817 1,400 1,960 2,650 3,470
120 31.0 38.6 .462 13.3 .006 .1123 3,670 5,510 6,850 8,670 10,100 11,700 13,300
121 12.9 38.7 .777 34.7 -.033 -.1827 1,720 3,720 5,470 8,160 10,500 13,100 16,000
122 425 36.6 .617 3.78 .0537 -.1667 6,130 12,000 16,800 23,800 29,600 36,000 43,000
123 406 37.9 .503 2.86 .0845 .0173 6,170 11,300 15,500 21,700 27,000 32,900 39,500
124 46.0 39.3 .608 15.0 .0129 .109 4,820 8,610 11,700 16,400 20,500 25,000 30,100
125 26.6 39.3 .643 12.1 .01 .0431 4,060 6,210 7,770 9,890 11,600 13,300 15,200
126 23.9 39.4 .634 16.8 .0063 -.0243 2,630 4,890 6,760 9,520 11,900 14,500 17,300
127 177 35.8 .399 6.21 -.0394 -.0879 7,860 18,200 28,100 44,200 59,100 76,500 96,800
128 351 36.6 .421 4.17 -.0111 -.1561 7,050 17,300 27,300 43,800 59,000 76,900 97,600
129 111 36.6 .460 5.80 -.0316 -.2327 4,270 9,170 13,400 19,800 25,200 31,200 37,700
130 114 36.1 .443 6.63 -.032 -.0881 4,780 8,780 12,000 16,600 20,500 24,700 29,300
131 3.76 36.5 .493 36.1 -.1204 -.0747 1,220 2,940 4,610 7,430 10,100 13,200 16,900
132 322 36.2 .464 6.70 .0055 .181 7,990 14,100 19,200 26,800 33,500 41,100 49,600
133 1,040 36.5 .477 3.41 .038 .0908 9,310 21,200 32,800 52,700 71,800 95,000 123,000
134 1,250 36.7 .520 2.84 .0563 .1246 11,200 25,200 38,900 62,500 85,200 113,000 147,000
135 10.2 38.5 .365 12.0 -.0839 .0624 597 1,300 1,960 3,060 4,090 5,310 6,760
136 52.0 38.1 .649 8.74 -.0449 .0677 3,300 5,310 6,840 8,970 10,700 12,600 14,600
137 334 38.3 .545 4.40 -.0064 -.0162 11,300 20,100 27,100 37,200 45,700 54,900 65,000
138 .35 39.8 .656 125 -.2068 -.1288 183 310 405 535 639 747 861
139 513 38.8 .579 3.27 .0244 .0999 13,400 25,500 36,000 52,100 66,500 82,800 101,000
140 147 39.2 .659 8.12 .0176 .1503 6,880 14,300 21,100 32,500 43,000 55,600 70,600
Sta-tion map index no.
(fig. 1)
Contribu-ting drain-age area
(mi2)
Mean annual precipi-tation (in.)
Soil perme-ability (in/h)
Main channel
slope (ft/mi)
General-ized
skew-ness
coeffi-cient
Weighted skew-ness
coeffi-cient
Discharge for indicated recurrence interval (ft3/s)
2-year 5-year 10-year 25-year 50-year 100-year 200-year

26 Estimation of Peak Streamflows for Unregulated Rural Streams in Kansas
141 6915100 Big Bull Creek at Paola, Kansas 38.57667 94.89556 26 -- -- -- 230
142 6916000 Marais des Cygnes River at Trading Post, Kansas 38.25056 94.68639 34 -- -- -- 2,880
143 6916500 Big Sugar Creek at Farlinville, Kansas 38.23528 94.85361 24 -- -- -- 198
144 6916700 Middle Creek near Kincaid, Kansas 38.05667 95.18750 34 -- -- -- 2.02
145 6917000 Little Osage River at Fulton, Kansas 38.01917 94.71333 49 -- -- 1,600 295
146 6917100 Marmaton River tributary near Bronson, Kansas 37.90556 95.09528 34 -- -- 31 .88
147 6917380 Marmaton River near Marmaton, Kansas 37.81750 94.79167 26 -- -- -- 292
148 6917400 Marmaton River tributary near Fort Scott, Kansas 37.79056 94.79639 41 -- -- -- 2.80
149 6917500 Marmaton River near Fort Scott, Kansas 37.86306 94.67667 46 -- -- -- 408
150 7138600 White Woman Creek tributary near Selkirk, Kansas 38.52500 101.62111 40 -- -- 10 38.0
151 7138650 White Woman Creek near Leoti, Kansas 38.48111 101.48778 20 -- -- 1 750
152 7138800 Lion Creek tributary near Modoc, Kansas 38.48000 101.05000 21 -- -- -- 7.00
153 7139700 Arkansas River tributary near Dodge City, Kansas 37.71444 100.01472 39 -- -- 40 8.66
154 7139800 Mulberry Creek near Dodge City, Kansas 37.59806 100.01444 22 -- -- -- 73.8
155 7140300 Whitewoman Creek near Bellefont, Kansas 37.92389 99.64194 33 -- -- -- 14.0
156 7140600 Pawnee River tributary near Kalvesta, Kansas 38.06167 100.35000 33 -- -- -- 6.89
157 7140700 Guzzlers Gulch near Ness City, Kansas 38.29444 99.95278 19 -- -- -- 58.2
158 7140850 Pawnee River near Burdett, Kansas 38.20667 99.64306 14 -- -- -- 1,090
159 7141200 Pawnee River near Larned, Kansas 38.20000 99.34722 73 -- -- -- 2,150
160 7141400 South Fork Walnut Creek tributary near Dighton, Kansas 38.48278 100.41500 21 -- -- -- .81
161 7141600 Long Branch Creek near Ness City, Kansas 38.45028 99.88056 33 -- -- 6 28.0
162 7141780 Walnut Creek near Rush Center, Kansas 38.46861 99.36861 28 -- -- -- 1,260
163 7141800 Otter Creek near Rush Center, Kansas 38.40444 99.30722 33 -- -- -- 17.0
164 7141900 Walnut Creek at Albert, Kansas 38.46111 99.01389 39 -- -- -- 1,410
165 7142100 Rattlesnake Creek tributary near Mullinville, Kansas 37.58639 99.42139 33 -- -- 11 10.3
166 7142300 Rattlesnake Creek near Macksville, Kansas 37.87222 98.87500 38 -- -- -- 784
167 7142500 Spring Creek near Dillwyn, Kansas 37.95667 98.84083 21 -- -- -- 14.3
168 7142575 Rattlesnake Creek near Zenith, Kansas 38.09361 98.54583 25 107 29,300 -- 1,050
169 7142700 Salt Creek near Partridge, Kansas 38.03944 98.08694 33 -- -- -- 85.0
170 7142860 Cow Creek near Claflin, Kansas 38.52222 98.58333 22 -- -- 20 43.0
171 7142900 Blood Creek near Boyd, Kansas 38.53611 98.85972 33 -- -- -- 61.0
172 7143100 Little Cheyenne Creek tributary near Claflin, Kansas 38.45694 98.53556 41 -- -- 30 1.48
173 7143200 Plum Creek near Holyrood, Kansas 38.59806 98.42417 20 -- -- 120 19.0
174 7143300 Cow Creek near Lyons, Kansas 38.30833 98.19167 52 69 24,000 -- 728
175 7143500 Little Arkansas River near Geneseo, Kansas 38.45667 98.09000 21 -- -- 100 25.0
Table 5. Streamflow-gaging station information, physical and climatic characteristics, and peak-streamflow magnitude and frequency estimates for selected gaging stations with at least 10 years of annual peak-discharge data for unregulated, rural streams in Kansas—Continued
Sta-tion map index
no. (fig. 1)
U.S. Geolog-
ical Survey station
no. U.S. Geological Survey station name
Latitude (decimal degrees)
Longitude (decimal degrees)
System-atic
record (years)
Histori-cal
record (years)
High-outlier thres-hold (ft3/s)
Low-outlier thres-hold (ft3/s)
Total drain-
age area (mi2)

Generalized Least-Squares Regression Equations 27
141 230 39.4 0.660 4.26 0.0242 0.177 5,650 9,180 12,000 15,900 19,300 23,000 27,000
142 2,880 38.1 .594 2.08 .075 .1356 19,900 39,600 57,400 85,900 112,000 142,000 178,000
143 198 40.2 .657 8.03 -.0097 .1418 6,490 13,100 19,200 29,000 38,100 48,800 61,400
144 2.02 40.0 .903 36.2 -.1714 -.2962 677 1,340 1,860 2,610 3,210 3,860 4,530
145 295 40.7 .727 4.97 -.0115 .1765 8,560 14,800 19,900 27,500 34,000 41,400 49,600
146 .88 40.4 .755 29.9 -.2038 -.2541 204 349 455 597 707 820 935
147 292 41.3 .828 5.89 -.0347 .126 16,600 27,900 36,900 50,000 61,100 73,200 86,600
148 2.80 41.7 .687 35.6 -.1668 -.3272 923 1,430 1,770 2,190 2,500 2,800 3,100
149 408 41.5 .826 4.55 -.0152 -.1524 11,800 22,900 32,100 45,600 56,900 69,300 82,700
150 7.59 16.3 1.104 16.3 -.4246 -.3256 61 169 278 459 626 818 1,040
151 750 15.9 1.225 12.6 -.2939 -.3653 232 1,400 3,310 7,870 13,400 21,100 31,600
152 1.19 19.0 1.096 31.8 -.4508 -.5317 92 182 250 340 408 476 544
153 8.66 21.8 1.088 14.0 -.4134 -.3366 229 487 702 1,020 1,270 1,550 1,840
154 73.8 21.7 1.302 7.30 -.3646 -.3526 249 675 1,090 1,770 2,380 3,080 3,860
155 14.0 22.9 1.062 10.7 -.3611 -.2303 179 713 1,420 2,870 4,470 6,590 9,320
156 6.89 20.3 .745 15.3 -.4047 -.3166 255 745 12,60 2,130 2,950 3,910 5,020
157 58.2 21.0 1.200 9.64 -.3029 -.304 425 1,260 2,130 3,650 5,080 6,780 8,760
158 1,090 20.3 1.167 5.00 -.2134 -.2757 469 1,430 2,460 4,300 6,070 8,210 10,700
159 2,010 21.0 1.116 4.18 -.1817 -.0317 2,250 4,530 6,530 9,620 12,300 15,400 18,900
160 .81 20.6 1.111 15.8 -.4283 -.5225 56 107 145 194 231 267 303
161 28.0 20.9 1.128 9.99 -.3049 -.3916 75 433 1,000 2,310 3,840 5,950 8,740
162 1,150 21.0 1.168 5.97 -.1732 -.2096 1,000 2,390 3,700 5,790 7,670 9,830 12,300
163 17.0 22.9 1.110 13.1 -.2933 -.3003 394 955 1,470 2,280 2,990 3,790 4,670
164 1,310 21.4 1.176 5.36 -.152 -.2257 1,310 2,850 4,200 6,250 8,010 9,970 12,100
165 10.3 24.5 1.062 13.1 -.3897 -.3568 416 1,090 1,730 2,750 3,650 4,670 5,800
166 356 24.1 5.569 4.96 -.236 -.0969 400 1,340 2,490 4,770 7,230 10,500 14,600
167 14.3 24.4 3.750 10.7 -.3158 -.2993 305 1,170 2,260 4,400 6,650 9,530 13,100
168 519 24.4 5.899 4.10 -.1877 .1833 501 1,580 2,950 5,850 9,190 13,900 20,400
169 72.0 28.3 3.666 5.11 -.224 -.2187 1,150 2,160 2,950 4,070 4,980 5,950 6,970
170 43.0 25.8 1.041 6.73 -.2189 -.1905 556 1,580 2,680 4,610 6,480 8,760 11,500
171 61.0 24.5 1.074 9.82 -.2222 -.2981 955 2,320 3,570 5,540 7,270 9,220 11,400
172 1.48 25.6 1.041 21.7 -.3164 -.1319 105 175 227 297 353 411 472
173 19.0 26.7 1.041 9.40 -.2263 -.0736 657 1,230 1,690 2,370 2,950 3,580 4,260
174 499 26.1 1.297 3.44 -.1504 -.047 1,940 4,690 7,420 12,000 16,400 21,700 28,000
175 25.0 27.6 .830 20.8 -.2146 -.3314 927 1,360 1,630 1,970 2,210 2,440 2,670
Sta-tion map index no.
(fig. 1)
Contribu-ting drain-age area
(mi2)
Mean annual precipi-tation (in.)
Soil perme-ability (in/h)
Main channel
slope (ft/mi)
General-ized
skew-ness
coeffi-cient
Weighted skew-ness
coeffi-cient
Discharge for indicated recurrence interval (ft3/s)
2-year 5-year 10-year 25-year 50-year 100-year 200-year

28 Estimation of Peak Streamflows for Unregulated Rural Streams in Kansas
176 7143600 Little Arkansas River near Little River, Kansas 38.41389 98.01667 26 -- -- -- 71.0
177 7143665 Little Arkansas River at Alta Mills, Kansas 38.11222 97.59167 25 -- -- -- 736
178 7144000 East Emma Creek near Halstead, Kansas 38.02778 97.42778 14 -- -- -- 58.0
179 7144200 Little Arkansas River at Valley Center, Kansas 37.83222 97.38778 79 -- -- -- 1,330
180 7144780 North Fork Ninnescah River above Cheney Reservoir, Kansas
37.84472 97.93583 25 -- -- -- 787
181 7144800 North Fork Ninnescah River near Cheney, Kansas 37.66667 97.76667 14 -- -- -- 930
182 7144850 South Fork South Fork Ninnescah River near Pratt, Kansas
37.58611 98.82778 19 -- -- 80 21.0
183 7144900 South Fork Ninnescah River tributary near Pratt, Kansas 37.67500 98.72306 32 -- -- 80 1.48
184 7145200 South Fork Ninnescah River near Murdock, Kansas 37.56417 97.85278 47 -- -- -- 650
185 7145300 Clear Creek near Garden Plain, Kansas 37.66333 97.65611 33 -- -- 100 5.03
186 7145500 Ninnescah River near Peck, Kansas 37.45722 97.42222 26 41 69,900 -- 2,130
187 7145700 Slate Creek at Wellington, Kansas 37.25000 97.40333 38 -- -- -- 154
188 7145800 Antelope Creek tributary near Dalton, Kansas 37.27611 97.28361 33 -- -- 25 .41
189 7146570 Cole Creek near Degraff, Kansas 37.94722 96.78056 19 34 22,000 -- 30.0
190 7146700 West Branch Walnut River tributary near Degraff, Kansas 37.95528 96.85111 21 -- -- -- 11.0
191 7147020 Whitewater River tributary near Towanda, Kansas 37.85083 97.06028 34 -- -- 10 .17
192 7147070 Whitewater River at Towanda, Kansas 37.79583 97.01250 36 -- -- -- 426
193 7147200 Dry Creek tributary near Augusta, Kansas 37.67972 97.03056 21 -- -- -- .90
194 7147800 Walnut River at Winfield, Kansas 37.22417 96.99444 61 105 104,000 -- 1,880
195 7147990 Cedar Creek tributary near Cambridge, Kansas 37.32194 96.62583 35 -- -- -- 2.41
196 7148100 Grouse Creek near Dexter, Kansas 37.22722 96.71222 30 89 50,900 -- 170
197 7148700 Dog Creek near Deerhead, Kansas 37.28056 98.87333 21 -- -- -- 5.31
198 7148800 Medicine Lodge River tributary near Medicine Lodge, Kansas
37.31167 98.58889 21 -- -- -- 2.04
199 7149000 Medicine Lodge River near Kiowa, Kansas 37.03806 98.46778 51 -- -- -- 903
200 7151500 Chikaskia River near Corbin, Kansas 37.12889 97.60111 38 75 59,900 -- 794
201 7151600 Rush Creek near Harper, Kansas 37.25333 98.07972 33 -- -- -- 12.0
202 7155590 Cimarron River near Elkhart, Kansas 37.12500 101.89722 26 -- -- 100 2,900
203 7155900 North Fork Cimarron River tributary near Elkhart, Kansas
37.19083 101.89833 33 -- -- 10 75.0
204 7156000 North Fork Cimarron River tributary near Richfield, Kansas
37.31000 101.77167 21 -- -- -- 103
205 7156010 North Fork Cimarron River at Richfield, Kansas 37.25833 101.77500 15 -- 32,000 -- 463
206 7156100 Sand Arroyo Creek near Johnson, Kansas 37.50000 101.76111 15 -- -- 5 619
207 7156220 Bear Creek near Johnson, Kansas 37.62639 101.76111 31 -- -- -- 835
208 7156600 Cimarron River tributary near Moscow, Kansas 37.33528 101.05000 33 -- -- -- 13.0
209 7156700 Cimarron River tributary near Satanta, Kansas 37.27083 100.92667 38 -- -- -- 2.41
210 7157100 Crooked Creek near Copeland, Kansas 37.56528 100.55417 33 -- -- 10 44.0
Table 5. Streamflow-gaging station information, physical and climatic characteristics, and peak-streamflow magnitude and frequency estimates for selected gaging stations with at least 10 years of annual peak-discharge data for unregulated, rural streams in Kansas—Continued
Sta-tion map index
no. (fig. 1)
U.S. Geolog-
ical Survey station
no. U.S. Geological Survey station name
Latitude (decimal degrees)
Longitude (decimal degrees)
System-atic
record (years)
Histori-cal
record (years)
High-outlier thres-hold (ft3/s)
Low-outlier thres-hold (ft3/s)
Total drain-
age area (mi2)

Generalized Least-Squares Regression Equations 29
176 71.0 27.7 0.855 8.32 -0.1857 -0.0068 1,200 2,360 3,360 4,900 6,240 7,760 9,470
177 681 29.5 2.071 3.58 -.1289 -.1466 5,000 12,200 19,200 30,800 41,500 54,100 68,700
178 58.0 31.5 .796 9.00 -.1969 -.1965 3,400 8,990 14,600 24,200 33,200 43,800 56,300
179 1,250 30.3 2.025 2.30 -.1276 -.319 6,290 13,900 20,400 30,100 38,300 47,200 56,800
180 550 26.9 5.484 5.85 -.1777 -.0545 3,990 12,300 21,900 40,400 59,900 85,200 117,000
181 693 27.5 4.962 5.36 -.1792 -.2024 4,050 10,600 17,100 28,200 38,500 50,600 64,700
182 21.0 25.5 2.002 10.6 -.3391 -.1672 712 1,500 2,190 3,240 4,150 5,160 6,280
183 1.48 25.7 2.126 18.8 -.3992 -.2609 373 680 915 1,240 1,500 1,760 2,040
184 543 27.3 3.085 7.13 -.2 -.2904 5,850 12,600 18,300 26,700 33,800 41,500 49,900
185 5.03 30.4 1.184 15.3 -.3109 -.3807 612 1,060 1,380 1,800 2,120 2,430 2,750
186 1,790 28.1 3.774 4.80 -.1545 -.0223 11,700 20,300 27,000 36,600 44,400 53,000 62,200
187 154 30.7 .876 6.08 -.2411 -.3367 3,620 7,650 11,000 15,800 19,800 24,100 28,600
188 .41 32.0 .681 56.5 -.3975 -.2376 135 244 327 441 532 627 726
189 30.0 33.7 .447 7.36 -.1892 -.1115 1,950 4,420 6,700 10,400 13,700 17,500 21,900
190 11.0 33.9 .436 13.2 -.22 -.1583 1,310 2,440 3,350 4,640 5,710 6,850 8,080
191 .17 33.5 .365 66.2 -.3567 -.2749 84 173 246 352 440 535 636
192 426 33.0 .468 4.15 -.1415 -.1801 7,490 17,300 26,200 40,500 53,300 67,900 84,300
193 .90 35.8 .365 42.9 -.3248 -.2169 225 373 478 619 728 839 952
194 1,870 34.3 .488 2.50 -.1528 -.1497 19,900 39,100 55,000 78,600 98,400 120,000 144,000
195 2.41 35.6 .493 53.2 -.3098 -.4033 575 1,660 2,740 4,530 6,150 8,000 10,100
196 170 35.4 .497 8.16 -.2046 -.1768 8,250 17,000 24,500 35,800 45,500 56,100 67,800
197 5.31 25.2 2.986 30.9 -.4083 -.3587 271 938 1,710 3,110 4,490 6,170 8,160
198 2.04 26.3 1.444 27.4 -.4173 -.4663 135 508 944 1,740 2,510 3,430 4,500
199 903 25.5 2.562 8.27 -.267 -.3332 4,030 7,450 10,000 13,500 16,300 19,100 22,000
200 794 28.7 2.648 7.79 -.2171 -.3124 8,530 18,700 27,400 40,300 51,200 63,000 75,700
201 12.0 28.9 1.881 21.5 -.347 -.3305 1,190 2,290 3,140 4,310 5,250 6,220 7,230
202 2,420 16.2 2.782 17.5 -.4094 -.3623 1,330 4,000 6,800 11,600 16,000 21,300 27,200
203 10.0 16.3 1.098 16.4 -.5561 -.5442 72 722 2,090 5,820 10,700 17,800 27,600
204 58.9 16.1 1.893 13.8 -.489 -.4275 791 2,420 4,100 6,930 9,510 12,500 15,800
205 463 16.0 3.157 16.5 -.4366 -.3256 870 3,650 7,320 14,800 22,800 33,200 46,300
206 619 15.9 3.462 15.2 -.4052 -.438 146 541 1,000 1,850 2,680 3,680 4,850
207 835 15.9 1.180 13.9 -.385 -.4388 724 3,020 5,940 11,600 17,300 24,400 33,000
208 8.0 18.0 2.14 29.2 -.5048 -.5664 468 1,400 2,310 3,740 4,970 6,310 7,730
209 2.41 19.0 1.895 41.6 -.5378 -.5524 202 576 931 1,480 1,950 2,450 2,990
210 44.0 19.9 .940 11.4 -.4101 -.4883 488 1,630 2,860 4,960 6,900 9,120 11,600
Sta-tion map index no.
(fig. 1)
Contribu-ting drain-age area
(mi2)
Mean annual precipi-tation (in.)
Soil perme-ability (in/h)
Main channel
slope (ft/mi)
General-ized
skew-ness
coeffi-cient
Weighted skew-ness
coeffi-cient
Discharge for indicated recurrence interval (ft3/s)
2-year 5-year 10-year 25-year 50-year 100-year 200-year

30 Estimation of Peak Streamflows for Unregulated Rural Streams in Kansas
211 7157400 Crooked Creek tributary at Meade, Kansas 37.29639 100.33944 33 -- -- -- 6.57
212 7157500 Crooked Creek near Nye, Kansas 37.03167 100.20806 55 -- -- -- 1,160
213 7157700 Kiger Creek near Ashland, Kansas 37.19333 99.91333 32 -- -- -- 34.0
214 7157900 Cavalry Creek at Coldwater, Kansas 37.26667 99.34444 28 -- -- -- 39.0
215 7165700 Verdigris River near Madison, Kansas 38.13750 96.10139 21 73 127,000 -- 181
216 7166000 Verdigris River near Coyville, Kansas 37.70556 95.90556 20 -- -- -- 747
217 7166200 Sandy Creek near Yates Center, Kansas 37.84639 95.83528 41 -- -- -- 6.8
218 7166500 Verdigris River near Altoona, Kansas 37.49056 95.68028 21 -- -- 1,600 1,140
219 7166700 Burnt Creek at Reece, Kansas 37.78528 96.23111 13 -- -- -- 8.85
220 7167000 Fall River near Eureka, Kansas 37.78528 96.23111 30 -- -- -- 307
221 7167500 Otter Creek at Climax, Kansas 37.70833 96.22500 50 94 106,000 -- 129
222 7168500 Fall River near Fall River, Kansas 37.64278 96.05917 10 27 47,900 -- 585
223 7169200 Salt Creek near Severy, Kansas 37.62000 96.25194 21 -- -- 900 7.59
224 7169500 Fall River at Fredonia, Kansas 37.50833 95.83333 13 46 48,900 4,000 827
225 7169700 Snake Creek near Howard, Kansas 37.54111 96.24000 21 -- -- 40 1.84
226 7169800 Elk River at Elk Falls, Kansas 37.37556 96.18528 30 -- -- -- 220
227 7170000 Elk River near Elk City, Kansas 37.26639 95.91778 31 -- -- -- 575
228 7170500 Verdigris River at Independence, Kansas 37.22389 95.67861 31 -- -- -- 2,890
229 7170600 Cherry Creek near Cherryvale, Kansas 37.29611 95.54750 21 -- -- 501 15.0
230 7170700 Big Hill Creek near Cherryvale, Kansas 37.26667 95.46806 24 -- -- -- 37.0
231 7170800 Mud Creek near Mound Valley, Kansas 37.19389 95.44778 34 -- -- -- 4.22
232 7171700 Spring Branch near Cedar Vale, Kansas 37.11333 96.45806 38 -- -- -- 3.10
233 7171800 Cedar Creek tributary near Hooser, Kansas 37.10750 96.57417 34 -- -- -- .56
234 7171900 Grant Creek near Wauneta, Kansas 37.10944 96.39861 21 -- -- 200 20.0
235 7172000 Caney River near Elgin, Kansas 37.00361 96.31500 59 -- -- -- 445
236 7179500 Neosho River at Council Grove, Kansas 38.66500 96.49389 27 62 120,000 210 250
237 7179600 Four Mile Creek near Council Grove, Kansas 38.59972 96.49833 14 -- -- 1,500 55.0
238 7180000 Cottonwood River near Marion, Kansas 38.35139 97.05833 30 97 65,000 -- 329
239 7180300 Spring Creek tributary near Florence, Kansas 38.18333 96.91361 34 -- -- -- .55
240 7180500 Cedar Creek near Cedar Point, Kansas 38.19861 96.82278 59 142 52,300 -- 110
241 7181000 Cottonwood River at Elmdale, Kansas 38.37083 96.62917 10 -- -- -- 1,050
242 7181500 Middle Creek near Elmdale, Kansas 38.39333 96.71778 40 -- -- -- 92.0
243 7182000 Cottonwood River at Cottonwood Falls, Kansas 38.38528 96.60528 37 111 -- -- 1,330
244 7182400 Neosho River at Strawn, Kansas 38.26667 95.86667 61 -- -- -- 2,930
245 7182520 Rock Creek at Burlington, Kansas 38.19611 95.75667 21 -- -- -- 8.27
Table 5. Streamflow-gaging station information, physical and climatic characteristics, and peak-streamflow magnitude and frequency estimates for selected gaging stations with at least 10 years of annual peak-discharge data for unregulated, rural streams in Kansas—Continued
Sta-tion map index
no. (fig. 1)
U.S. Geolog-
ical Survey station
no. U.S. Geological Survey station name
Latitude (decimal degrees)
Longitude (decimal degrees)
System-atic
record (years)
Histori-cal
record (years)
High-outlier thres-hold (ft3/s)
Low-outlier thres-hold (ft3/s)
Total drain-
age area (mi2)

Generalized Least-Squares Regression Equations 31
211 6.57 21.4 1.034 33.1 -0.477 -0.4638 292 1,300 2,620 5,220 7,900 11,200 15,300
212 813 20.5 1.673 4.23 -.3608 -.4016 992 3,600 6,650 12,200 17,800 24,400 32,300
213 34.0 22.3 1.993 29.9 -.4187 -.4052 368 689 929 1,250 1,500 1,750 2,000
214 39.0 24.8 2.725 8.61 -.3785 -.3149 492 1,290 2,050 3,290 4,410 5,680 7,110
215 181 36.1 .485 11.2 -.0861 -.1726 8,120 18,700 28,400 43,800 57,600 73,400 91,300
216 747 36.7 .540 4.98 -.0768 -.0697 18,300 43,400 67,500 108,000 145,000 190,000 242,000
217 6.80 39.3 .660 19.3 -.1908 -.249 1,240 1,990 2,530 3,220 3,740 4,270 4,810
218 1,140 37.5 .670 3.33 -.0735 -.067 16,400 32,800 46,900 68,300 87,000 108,000 131,000
219 8.85 35.3 .493 36.0 -.2098 -.0977 1,630 4,100 6,570 10,800 14,800 19,600 25,300
220 307 35.3 .515 9.95 -.111 -.1376 11,700 29,900 48,100 79,100 108,000 143,000 184,000
221 129 36.2 .461 13.2 -.142 -.3741 7,480 18,000 27,400 41,800 54,200 67,600 82,200
222 585 35.8 .517 6.28 -.0975 -.1541 16,200 31,700 44,500 63,300 79,100 96,300 115,000
223 7.59 36.6 .390 21.9 -.2306 -.2731 2,950 5,110 6,700 8,830 10,500 12,200 13,900
224 827 36.3 .616 5.46 -.0887 -.1442 18,800 32,600 43,000 57,400 69,000 81,100 94,000
225 1.84 36.8 .320 38.4 -.2768 -.185 497 969 1,360 1,920 2,390 2,890 3,440
226 220 36.5 .446 9.21 -.1563 -.0541 9,000 21,300 33,300 53,400 72,200 94,600 121,000
227 575 37.4 .740 5.25 -.1258 -.2147 12,600 30,400 47,000 73,800 97,900 125,000 157,000
228 2,890 37.3 .695 2.68 -.0724 -.0243 34,400 60,400 81,000 111,000 135,000 162,000 190,000
229 15.0 41.7 .851 16.5 -.2053 -.0413 2,530 4,580 6,230 8,640 10,700 12,900 15,300
230 37.0 41.3 .833 9.10 -.1788 -.0072 3,540 6,770 9,510 13,600 17,200 21,200 25,700
231 4.22 43.0 .952 25.7 -.245 -.0775 1,270 2,180 2,870 3,840 4,630 5,460 6,350
232 3.10 34.8 .510 50.1 -.3136 -.4588 816 2,150 3,390 5,310 6,960 8,750 10,700
233 .56 34.9 .510 165 -.3678 -.4608 147 331 485 705 883 1,070 1,270
234 20.0 35.7 .561 33.6 -.2589 -.2909 3,160 5,510 7,230 9,530 11,300 13,100 15,000
235 445 35.5 .555 7.39 -.1781 -.3575 14,900 30,100 42,200 59,400 73,100 87,600 103,000
236 250 33.8 .433 4.88 -.0481 .1393 10,100 23,000 35,900 58,000 79,600 106,000 139,000
237 55.0 33.4 .444 13.4 -.0966 .017 5,370 11,300 16,700 25,400 33,400 42,600 53,300
238 329 32.4 .662 5.54 -.0991 -.167 6,460 12,200 16,800 23,300 28,800 34,600 40,900
239 .55 33.0 .682 43.2 -.2853 -.4216 116 291 450 694 902 1,130 1,370
240 110 33.3 .518 9.42 -.1317 -.3073 5,740 10,800 14,700 20,100 24,500 28,900 33,600
241 1,050 32.9 .566 3.74 -.0428 -.0091 9,600 16,000 20,900 27,800 33,300 39,300 45,700
242 92.0 34.1 .456 3.69 -.113 -.1693 6,960 15,000 22,100 33,100 42,700 53,500 65,400
243 1,330 33.1 .544 3.19 -.0336 .0969 10,300 24,500 39,000 64,400 89,500 121,000 159,000
244 2,930 34.1 .508 2.75 .0157 .1201 20,400 44,800 68,300 108,000 145,000 191,000 246,000
245 8.27 37.4 .471 8.34 -.1486 -.0919 1,020 2,370 3,660 5,760 7,690 9,960 12,600
Sta-tion map index no.
(fig. 1)
Contribu-ting drain-age area
(mi2)
Mean annual precipi-tation (in.)
Soil perme-ability (in/h)
Main channel
slope (ft/mi)
General-ized
skew-ness
coeffi-cient
Weighted skew-ness
coeffi-cient
Discharge for indicated recurrence interval (ft3/s)
2-year 5-year 10-year 25-year 50-year 100-year 200-year

32 Estimation of Peak Streamflows for Unregulated Rural Streams in Kansas
246 7182600 North Big Creek near Burlington, Kansas 38.11028 95.75722 33 -- -- -- 46.0
247 7183000 Neosho River near Iola, Kansas 37.89083 95.43056 55 -- -- -- 3,820
248 7183100 Owl Creek near Piqua, Kansas 37.85000 95.57500 11 -- -- -- 177
249 7183500 Neosho River near Parsons, Kansas 37.34000 95.10972 42 -- -- 6,500 4,910
250 7183800 Limestone Creek near Beulah, Kansas 37.40333 94.88778 33 -- -- -- 12.0
251 7184000 Lightning Creek near McCune, Kansas 37.28167 95.03222 47 -- -- -- 197
252 7184500 Labette Creek near Oswego, Kansas 37.19167 95.19167 37 43 20,100 -- 211
253 7184600 Fly Creek near Faulkner, Kansas 37.10417 94.93917 21 -- -- -- 27.0
Table 5. Streamflow-gaging station information, physical and climatic characteristics, and peak-streamflow magnitude and frequency estimates for selected gaging stations with at least 10 years of annual peak-discharge data for unregulated, rural streams in Kansas—Continued
Sta-tion map index
no. (fig. 1)
U.S. Geolog-
ical Survey station
no. U.S. Geological Survey station name
Latitude (decimal degrees)
Longitude (decimal degrees)
System-atic
record (years)
Histori-cal
record (years)
High-outlier thres-hold (ft3/s)
Low-outlier thres-hold (ft3/s)
Total drain-
age area (mi2)

Generalized Least-Squares Regression Equations 33
246 46.0 37.6 0.489 5.93 -0.1089 -0.0739 3,210 4,850 6,000 7,500 8,660 9,830 11,000
247 3,820 35.1 .531 1.84 .0105 .1231 23,700 48,300 70,700 107,000 140,000 180,000 226,000
248 177 40.4 .608 5.87 -.0863 -.0531 6,940 14,400 20,900 31,200 40,200 50,500 62,200
249 4,910 36.4 .578 1.85 -.0173 .1787 28,700 50,800 69,300 97,300 122,000 149,000 181,000
250 12.0 42.4 .993 16.2 -.1673 -.2453 3,140 6,540 9,400 13,600 17,200 21,100 25,300
251 197 42.2 1.021 3.43 -.1083 .087 7,250 16,800 26,300 42,600 58,300 77,600 101,000
252 211 40.9 .813 4.74 -.123 -.1391 8,330 13,200 16,600 21,200 24,700 28,300 32,000
253 27.0 42.1 1.227 7.80 -.1753 -.1696 4,190 11,000 17,900 29,700 40,900 54,200 69,900
Sta-tion map index no.
(fig. 1)
Contribu-ting drain-age area
(mi2)
Mean annual precipi-tation (in.)
Soil perme-ability (in/h)
Main channel
slope (ft/mi)
General-ized
skew-ness
coeffi-cient
Weighted skew-ness
coeffi-cient
Discharge for indicated recurrence interval (ft3/s)
2-year 5-year 10-year 25-year 50-year 100-year 200-year

Cow Creek near Hutchinson, Kansas,July 22, 1999. View upstream from left bank. Photograph by Mike Holt, USGS.
Kansas River at Wamego, Kansas,July, 1993. View upstream from leftbank. Photograph by Charles Perry, USGS.
Cimarron River near Elkhart, Kansas,May 3, 1999. View upstream from left bank. Photograph by Craig Dare, USGS.
Back cover
Arkansas River near Coolidge, Kansas,May 6, 1999. View downstream from right bank. Photograph by Craig Dare, USGS.

Patrick P. Rasmussen and Charles A
. Perry—Estim
ation of Peak Streamflow
s for Unregulated Rural Stream
s in Kansas—U
SGS/W
RIR 00–4079