the technical take - may 21, 2014
TRANSCRIPT
Report prepared by:
Ryan Lewenza, CFA, CMT
North American Equity Strategist
Inside
Technical Commentary ......................... 2
Technical Trading Ideas ........................ 9
Sentiment Indicators ........................... 12
Overbought/Oversold Stocks .............. 13
Market Statistics .................................. 14
This document is for distribution to Canadian
clients only.
Please refer to Appendix A in this report for
important information.
Volume 18 Highlights
The S&P/TSX Composite Index (S&P/TSX) has broken above an important resistance level of roughly 14,300, and is quickly approaching its all-time high around 15,000. Given the strong year-to-date (YTD) gain for the S&P/TSX, it is technically overbought on a weekly basis with a Relative Strength Index (RSI) reading of 69. With the index technically overbought (on a weekly basis) and it approaching key technical resistance, we believe the S&P/TSX is likely to encounter a period of consolidation in the coming months.
The Canadian industrials sector has underperformed YTD, but we
believe the technical profile of the sector has improved of late. The sector continues to trend higher in a short-term upward channel, and is trading above its important 50- and 200-day MAs. More importantly, the sector has recently broken above its short-term relative downtrend, which has been in place since December 2013.
The intermediate- and long-term trends remain firmly bullish for
major U.S. indices. As such, we maintain our constructive long-term view of the U.S. equity markets. In the short term, however, some concerning technical trends have started to emerge. These trends, if they persist, could be early warning signs of a potential pullback over the seasonally weak summer period. First, U.S. government bond yields continue to trend lower. Second, the consumer discretionary sector continues to underperform versus the consumer staples sector, a sign of "risk off". And third, the higher beta indices, such as the Nasdaq and Russell 2000 continue to underperform, which points to a clear divergence in the U.S. equity markets.
In this week’s report, we highlight Cenovus Energy Inc. (CVE-N)
and as an attractive buy candidate, and recommend investors trim/sell AT&T Inc. (T-N) and CBS Corp. (CBS-N).
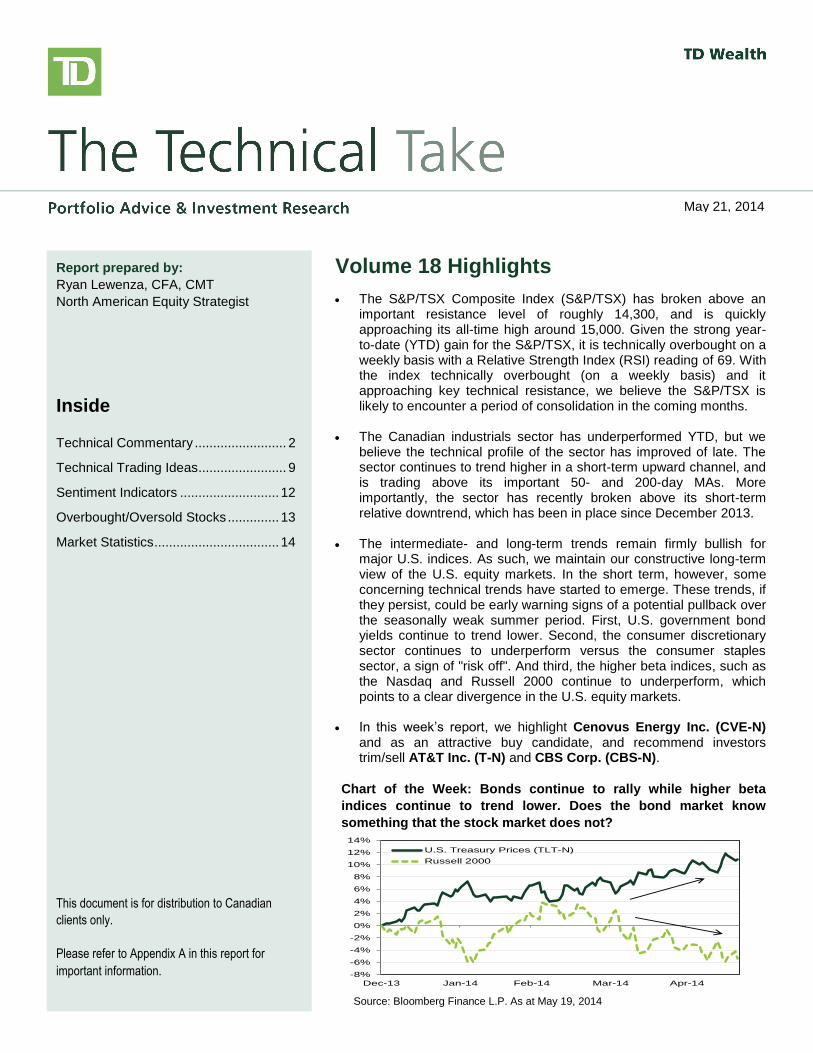
Chart of the Week: Bonds continue to rally while higher beta
indices continue to trend lower. Does the bond market know
something that the stock market does not?
May 21, 2014
-8%
-6%
-4%
-2%
0%
2%
4%
6%
8%
10%
12%
14%
Dec-13 Jan-14 Feb-14 Mar-14 Apr-14
U.S. Treasury Prices (TLT-N)
Russell 2000
Source: Bloomberg Finance L.P. As at May 19, 2014
The Technical Take May 21, 2014
Page 2
Technical Commentary
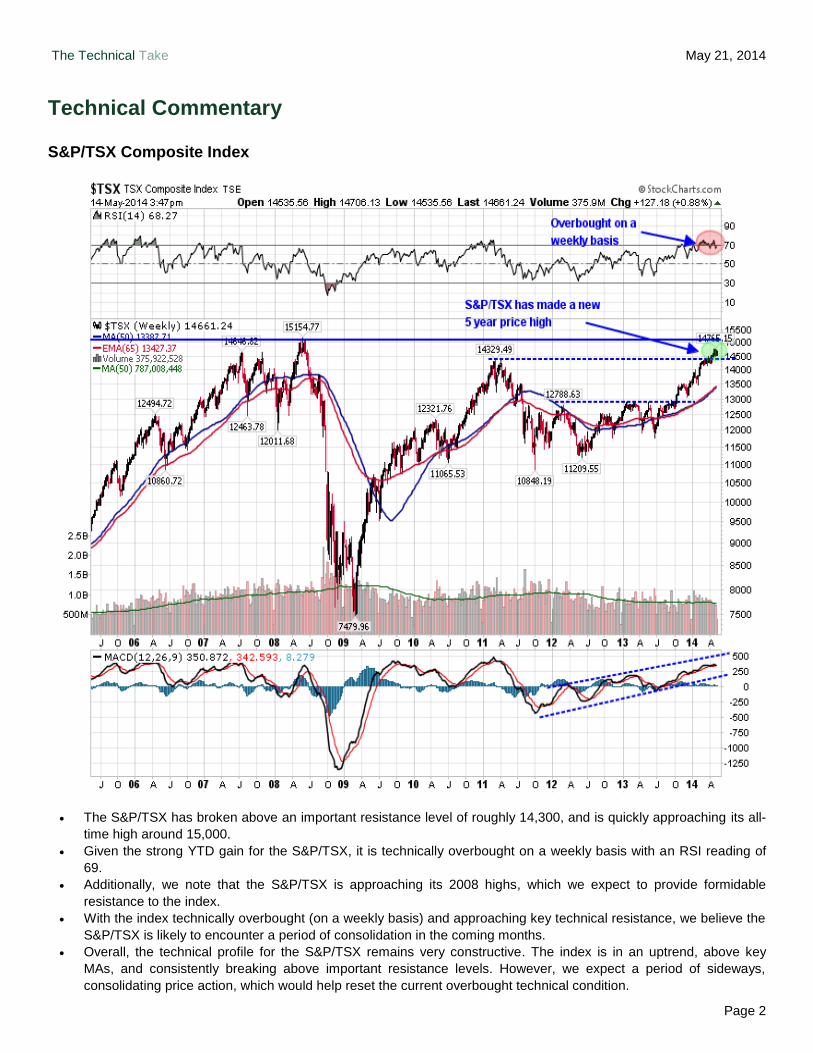
S&P/TSX Composite Index
The S&P/TSX has broken above an important resistance level of roughly 14,300, and is quickly approaching its all-
time high around 15,000.
Given the strong YTD gain for the S&P/TSX, it is technically overbought on a weekly basis with an RSI reading of
69.
Additionally, we note that the S&P/TSX is approaching its 2008 highs, which we expect to provide formidable
resistance to the index.
With the index technically overbought (on a weekly basis) and approaching key technical resistance, we believe the
S&P/TSX is likely to encounter a period of consolidation in the coming months.
Overall, the technical profile for the S&P/TSX remains very constructive. The index is in an uptrend, above key
MAs, and consistently breaking above important resistance levels. However, we expect a period of sideways,
consolidating price action, which would help reset the current overbought technical condition.

The Technical Take May 21, 2014
Page 3
Canadian Sector Highlights
Last Trend of Trend of RSI Market
Name Price 50 DMA 50 DMA 200 DMA 200 DMA 14 Day Condition Current 2 3 4 5 6
S&P/TSX TELECOM SERV IDX 1215.10 1178.47 Uptrend 1136.71 Uptrend 72.58 Overbought 1 6 11 8 3 10
S&P/TSX FINANCIALS INDEX 2161.72 2130.72 Uptrend 2028.34 Uptrend 62.85 Neutral 2 9 10 7 4 8
S&P/TSX CONS DISCRET IDX 1602.40 1553.81 Uptrend 1465.37 Uptrend 63.35 Neutral 3 4 7 4 6 2
S&P/TSX UTILITIES INDEX 1916.96 1893.01 Uptrend 1805.37 Uptrend 50.71 Neutral 4 11 8 10 1 4
S&P/TSX INDUSTRIALS IDX 2125.08 2059.63 Uptrend 1924.69 Uptrend 60.75 Neutral 5 5 4 2 10 3
S&P/TSX COMPOSITE INDEX 14697.13 14415.13 Uptrend 13547.62 Uptrend 60.29 Neutral 6 7 6 6 5 7
S&P/TSX CONS STAPLES IDX 2807.18 2741.04 Uptrend 2600.66 Uptrend 58.62 Neutral 7 1 5 9 8 6
S&P/TSX ENERGY INDEX 3333.90 3204.26 Uptrend 2932.75 Uptrend 58.27 Neutral 8 8 9 1 2 1
S&P/TSX MATERIALS INDEX 2288.63 2303.21 Downtrend 2200.31 Uptrend 49.71 Neutral 9 10 3 11 7 9
S&P/TSX HEALTH CARE IDX 1669.96 1743.20 Downtrend 1591.40 Uptrend 47.28 Neutral 10 2 1 3 11 11
S&P/TSX INFO TECH INDEX 150.81 153.83 Downtrend 144.44 Uptrend 47.64 Neutral 11 3 2 5 9 5
Ranking of Weekly Momentum
Source: Bloomberg Finance L.P. As at May 13, 2014.
Weekly Momentum:
The telecommunications sector rebounded sharply last week, driven by price gains in BCE Inc. (BCE-T), Rogers
Communications Inc, (RCI.B-T) and Telus Corp. (T-T). The sector jumped to the top spot in our sector rankings,
following multiple weeks of poor relative performance.
Financials also reversed their recent string of weak performance, climbing to the second spot in our sector rankings.
The materials sector remains under pressure, with the sector near the bottom of our sector rankings in four of the
last six weeks.
The health care and information technology sectors reversed their recent gains, falling to the bottom of our sector
rankings.
Market Condition:
With the recent strength in the telecommunications sector, it is now technically overbought with an RSI level of
72.58. With the sector at horizontal price resistance, and technically overbought, we see the potential for some
short-term profit taking.
Other:
The materials, health care, and information technology sectors are trading below their respective 50-day MAs. All
10 GICs sectors are trading above their respective 200-day MAs, which is a sign of technical strength.
The Technical Take May 21, 2014
Page 4
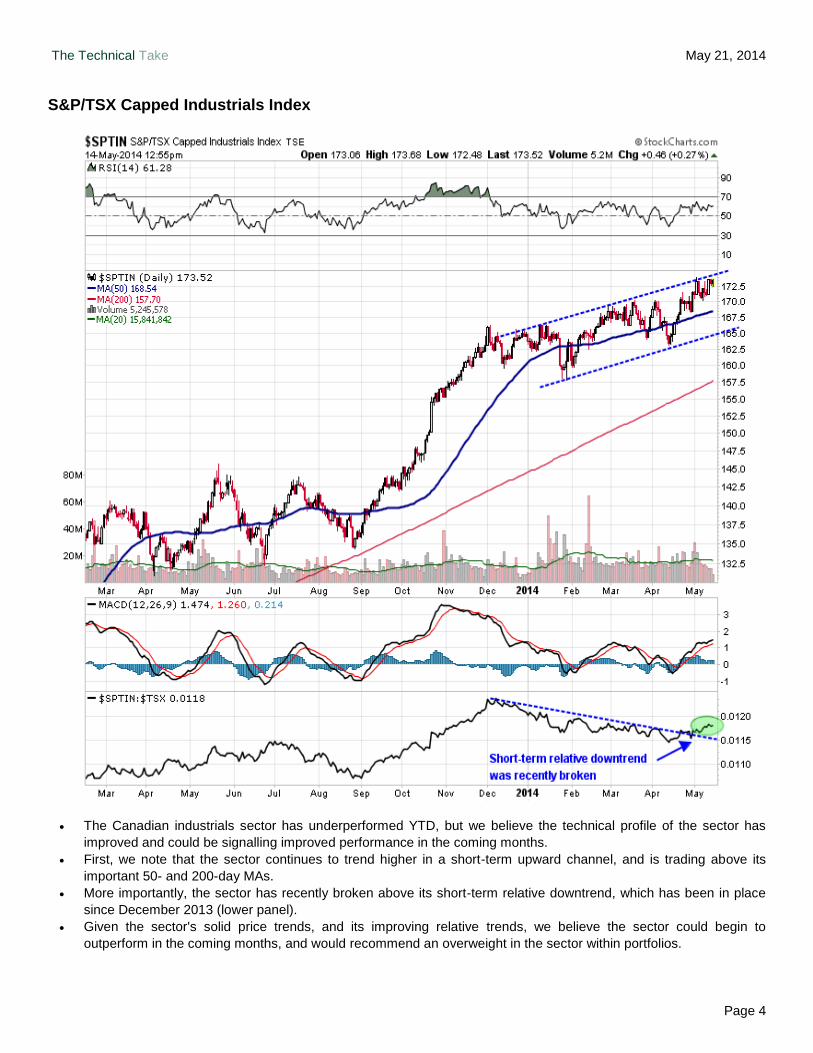
S&P/TSX Capped Industrials Index
The Canadian industrials sector has underperformed YTD, but we believe the technical profile of the sector has
improved and could be signalling improved performance in the coming months.
First, we note that the sector continues to trend higher in a short-term upward channel, and is trading above its
important 50- and 200-day MAs.
More importantly, the sector has recently broken above its short-term relative downtrend, which has been in place
since December 2013 (lower panel).
Given the sector's solid price trends, and its improving relative trends, we believe the sector could begin to
outperform in the coming months, and would recommend an overweight in the sector within portfolios.
The Technical Take May 21, 2014
Page 5
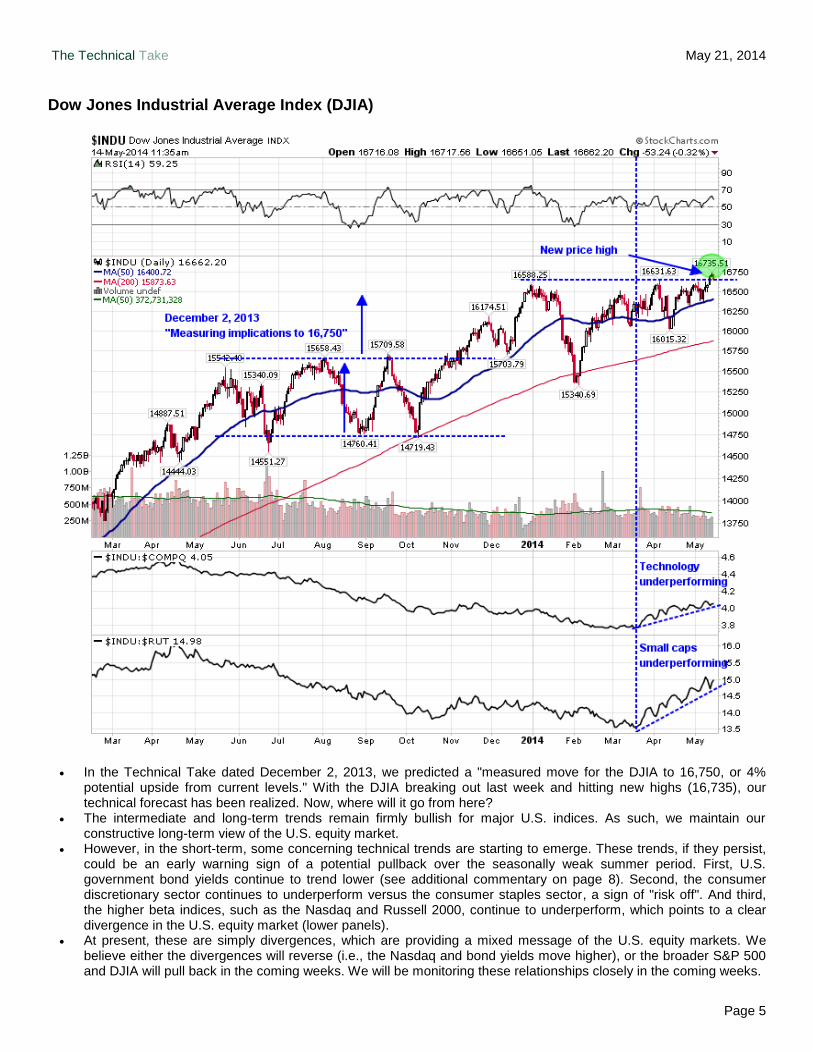
Dow Jones Industrial Average Index (DJIA)
In the Technical Take dated December 2, 2013, we predicted a "measured move for the DJIA to 16,750, or 4% potential upside from current levels." With the DJIA breaking out last week and hitting new highs (16,735), our technical forecast has been realized. Now, where will it go from here?
The intermediate and long-term trends remain firmly bullish for major U.S. indices. As such, we maintain our constructive long-term view of the U.S. equity market.
However, in the short-term, some concerning technical trends are starting to emerge. These trends, if they persist, could be an early warning sign of a potential pullback over the seasonally weak summer period. First, U.S. government bond yields continue to trend lower (see additional commentary on page 8). Second, the consumer discretionary sector continues to underperform versus the consumer staples sector, a sign of "risk off". And third, the higher beta indices, such as the Nasdaq and Russell 2000, continue to underperform, which points to a clear divergence in the U.S. equity market (lower panels).
At present, these are simply divergences, which are providing a mixed message of the U.S. equity markets. We believe either the divergences will reverse (i.e., the Nasdaq and bond yields move higher), or the broader S&P 500 and DJIA will pull back in the coming weeks. We will be monitoring these relationships closely in the coming weeks.
The Technical Take May 21, 2014
Page 6
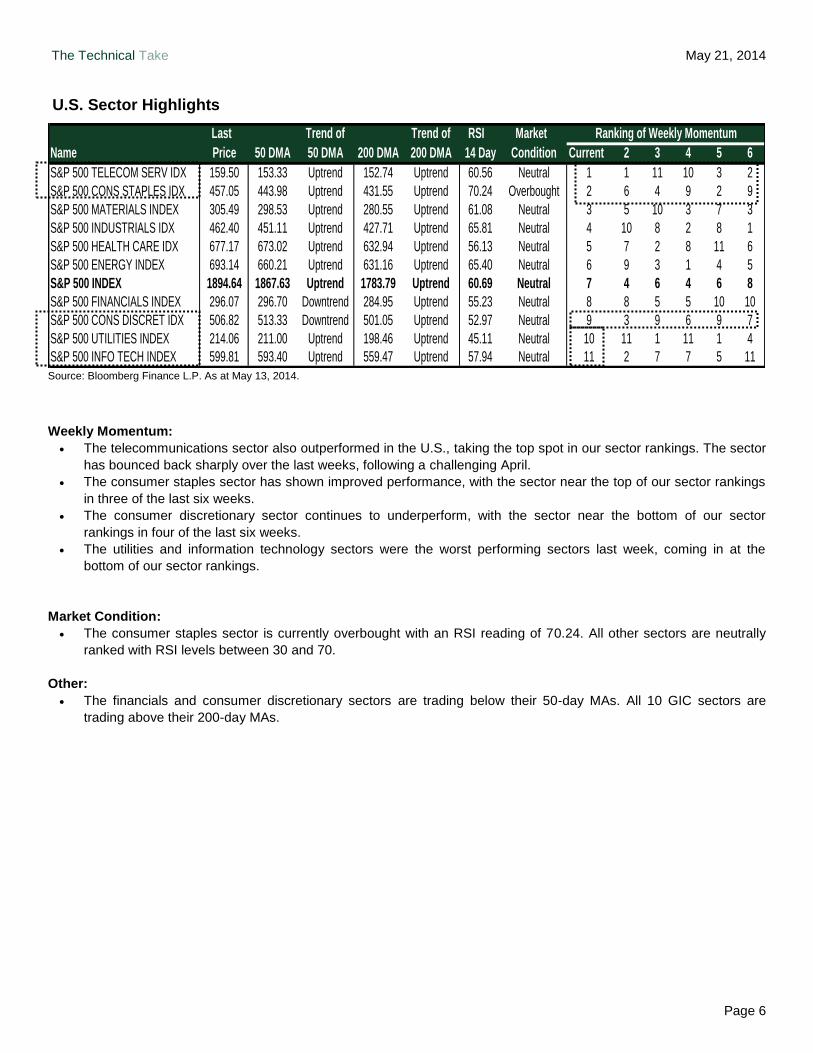
U.S. Sector Highlights
Last Trend of Trend of RSI Market
Name Price 50 DMA 50 DMA 200 DMA 200 DMA 14 Day Condition Current 2 3 4 5 6
S&P 500 TELECOM SERV IDX 159.50 153.33 Uptrend 152.74 Uptrend 60.56 Neutral 1 1 11 10 3 2
S&P 500 CONS STAPLES IDX 457.05 443.98 Uptrend 431.55 Uptrend 70.24 Overbought 2 6 4 9 2 9
S&P 500 MATERIALS INDEX 305.49 298.53 Uptrend 280.55 Uptrend 61.08 Neutral 3 5 10 3 7 3
S&P 500 INDUSTRIALS IDX 462.40 451.11 Uptrend 427.71 Uptrend 65.81 Neutral 4 10 8 2 8 1
S&P 500 HEALTH CARE IDX 677.17 673.02 Uptrend 632.94 Uptrend 56.13 Neutral 5 7 2 8 11 6
S&P 500 ENERGY INDEX 693.14 660.21 Uptrend 631.16 Uptrend 65.40 Neutral 6 9 3 1 4 5
S&P 500 INDEX 1894.64 1867.63 Uptrend 1783.79 Uptrend 60.69 Neutral 7 4 6 4 6 8
S&P 500 FINANCIALS INDEX 296.07 296.70 Downtrend 284.95 Uptrend 55.23 Neutral 8 8 5 5 10 10
S&P 500 CONS DISCRET IDX 506.82 513.33 Downtrend 501.05 Uptrend 52.97 Neutral 9 3 9 6 9 7
S&P 500 UTILITIES INDEX 214.06 211.00 Uptrend 198.46 Uptrend 45.11 Neutral 10 11 1 11 1 4
S&P 500 INFO TECH INDEX 599.81 593.40 Uptrend 559.47 Uptrend 57.94 Neutral 11 2 7 7 5 11
Ranking of Weekly Momentum
Source: Bloomberg Finance L.P. As at May 13, 2014.
Weekly Momentum:
The telecommunications sector also outperformed in the U.S., taking the top spot in our sector rankings. The sector
has bounced back sharply over the last weeks, following a challenging April.
The consumer staples sector has shown improved performance, with the sector near the top of our sector rankings
in three of the last six weeks.
The consumer discretionary sector continues to underperform, with the sector near the bottom of our sector
rankings in four of the last six weeks.
The utilities and information technology sectors were the worst performing sectors last week, coming in at the
bottom of our sector rankings.
Market Condition:
The consumer staples sector is currently overbought with an RSI reading of 70.24. All other sectors are neutrally
ranked with RSI levels between 30 and 70.
Other:
The financials and consumer discretionary sectors are trading below their 50-day MAs. All 10 GIC sectors are
trading above their 200-day MAs.
The Technical Take May 21, 2014
Page 7
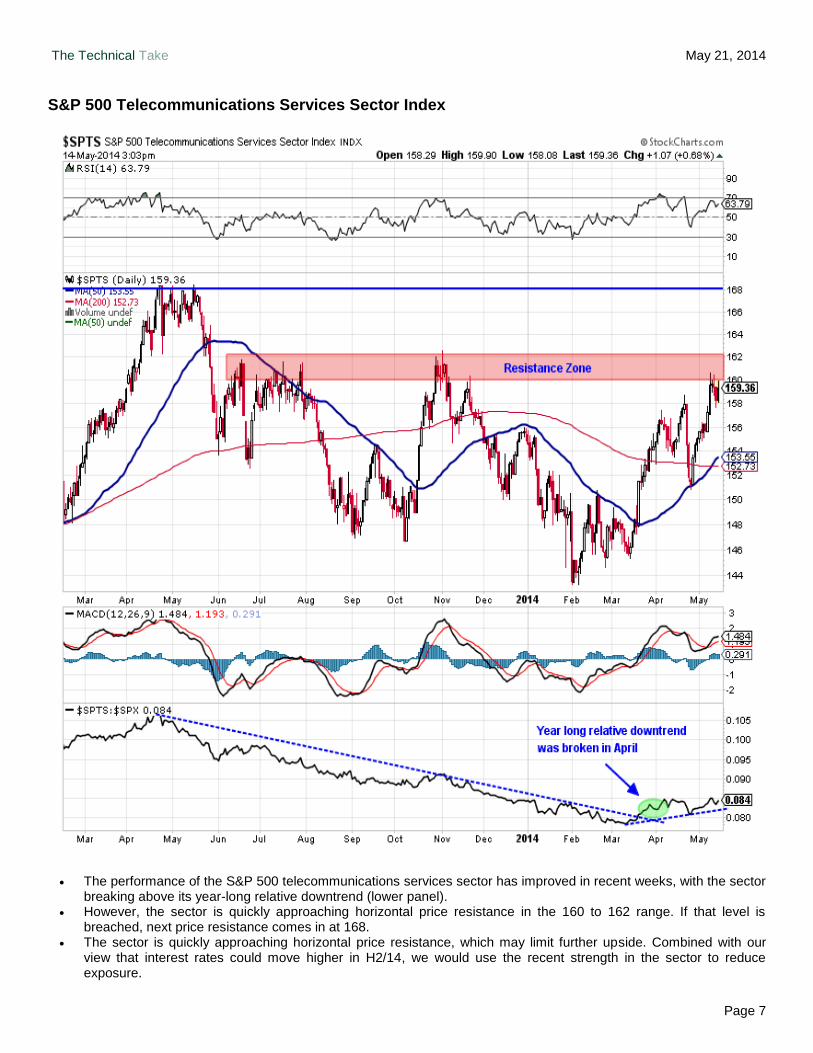
S&P 500 Telecommunications Services Sector Index
The performance of the S&P 500 telecommunications services sector has improved in recent weeks, with the sector breaking above its year-long relative downtrend (lower panel).
However, the sector is quickly approaching horizontal price resistance in the 160 to 162 range. If that level is breached, next price resistance comes in at 168.
The sector is quickly approaching horizontal price resistance, which may limit further upside. Combined with our view that interest rates could move higher in H2/14, we would use the recent strength in the sector to reduce exposure.
The Technical Take May 21, 2014
Page 8
Intermarket Picture
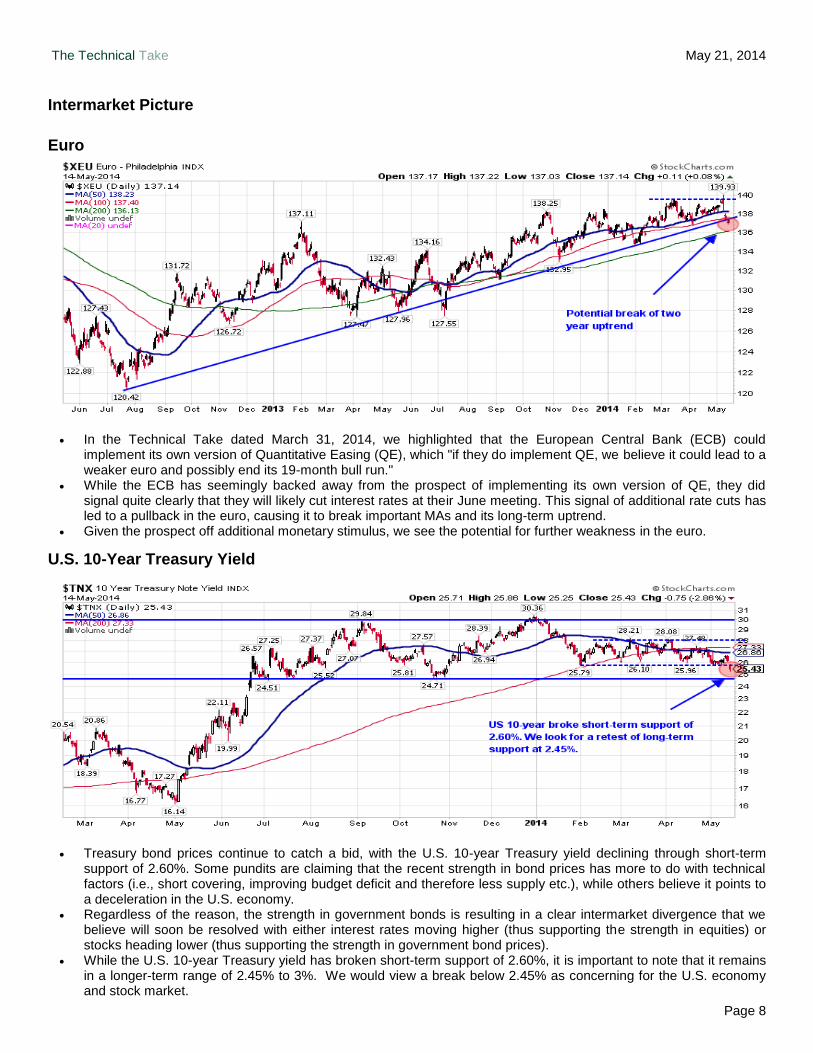
Euro
In the Technical Take dated March 31, 2014, we highlighted that the European Central Bank (ECB) could implement its own version of Quantitative Easing (QE), which "if they do implement QE, we believe it could lead to a weaker euro and possibly end its 19-month bull run."
While the ECB has seemingly backed away from the prospect of implementing its own version of QE, they did signal quite clearly that they will likely cut interest rates at their June meeting. This signal of additional rate cuts has led to a pullback in the euro, causing it to break important MAs and its long-term uptrend.
Given the prospect off additional monetary stimulus, we see the potential for further weakness in the euro.
U.S. 10-Year Treasury Yield
Treasury bond prices continue to catch a bid, with the U.S. 10-year Treasury yield declining through short-term support of 2.60%. Some pundits are claiming that the recent strength in bond prices has more to do with technical factors (i.e., short covering, improving budget deficit and therefore less supply etc.), while others believe it points to a deceleration in the U.S. economy.
Regardless of the reason, the strength in government bonds is resulting in a clear intermarket divergence that we believe will soon be resolved with either interest rates moving higher (thus supporting the strength in equities) or stocks heading lower (thus supporting the strength in government bond prices).
While the U.S. 10-year Treasury yield has broken short-term support of 2.60%, it is important to note that it remains in a longer-term range of 2.45% to 3%. We would view a break below 2.45% as concerning for the U.S. economy and stock market.
The Technical Take May 21, 2014
Page 9
Technical Trading Ideas
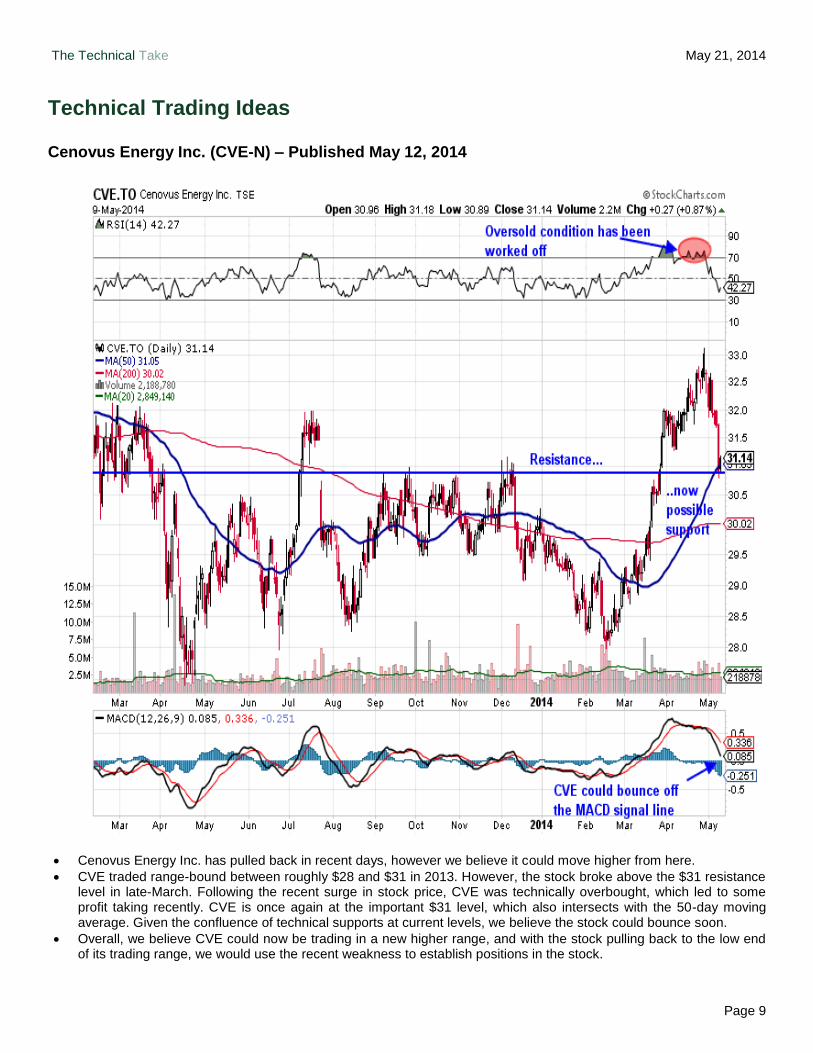
Cenovus Energy Inc. (CVE-N) – Published May 12, 2014
Cenovus Energy Inc. has pulled back in recent days, however we believe it could move higher from here.
CVE traded range-bound between roughly $28 and $31 in 2013. However, the stock broke above the $31 resistance level in late-March. Following the recent surge in stock price, CVE was technically overbought, which led to some profit taking recently. CVE is once again at the important $31 level, which also intersects with the 50-day moving average. Given the confluence of technical supports at current levels, we believe the stock could bounce soon.
Overall, we believe CVE could now be trading in a new higher range, and with the stock pulling back to the low end of its trading range, we would use the recent weakness to establish positions in the stock.

The Technical Take May 21, 2014
Page 10
AT& T Inc. (T-N) – Published May 14, 2014
AT&T Inc. has rallied sharply from its March lows (15%) but we believe it is likely to pull back.
First, we note that T is trading at long-term resistance of $36.50 to $37, which dates back to its April 2013 highs. This resistance may help to cap further upside.
Second, momentum has begun to weaken with the MACD indicator possibly rolling over and the RSI indicator negatively diverging with T's share price.
Finally, we believe U.S. government bond yields could move higher in H2/14, which if correct, could pressure interest sensitive stocks like T.
We are targeting T pulling back to its 50-day MA at $34.50; however, if government bond yields move higher in H2/14, T could retest the low $30s, in our opinion.
The Technical Take May 21, 2014
Page 11
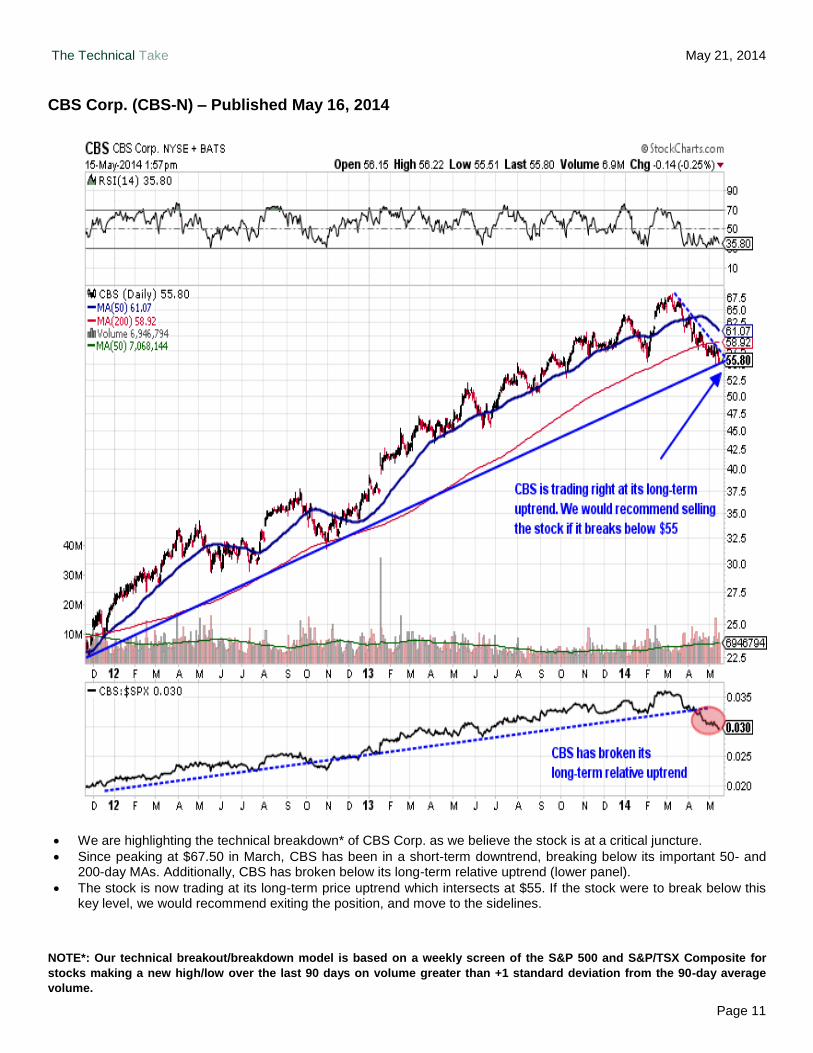
CBS Corp. (CBS-N) – Published May 16, 2014
We are highlighting the technical breakdown* of CBS Corp. as we believe the stock is at a critical juncture.
Since peaking at $67.50 in March, CBS has been in a short-term downtrend, breaking below its important 50- and 200-day MAs. Additionally, CBS has broken below its long-term relative uptrend (lower panel).
The stock is now trading at its long-term price uptrend which intersects at $55. If the stock were to break below this key level, we would recommend exiting the position, and move to the sidelines.
NOTE*: Our technical breakout/breakdown model is based on a weekly screen of the S&P 500 and S&P/TSX Composite for
stocks making a new high/low over the last 90 days on volume greater than +1 standard deviation from the 90-day average
volume.
The Technical Take May 21, 2014
Page 12
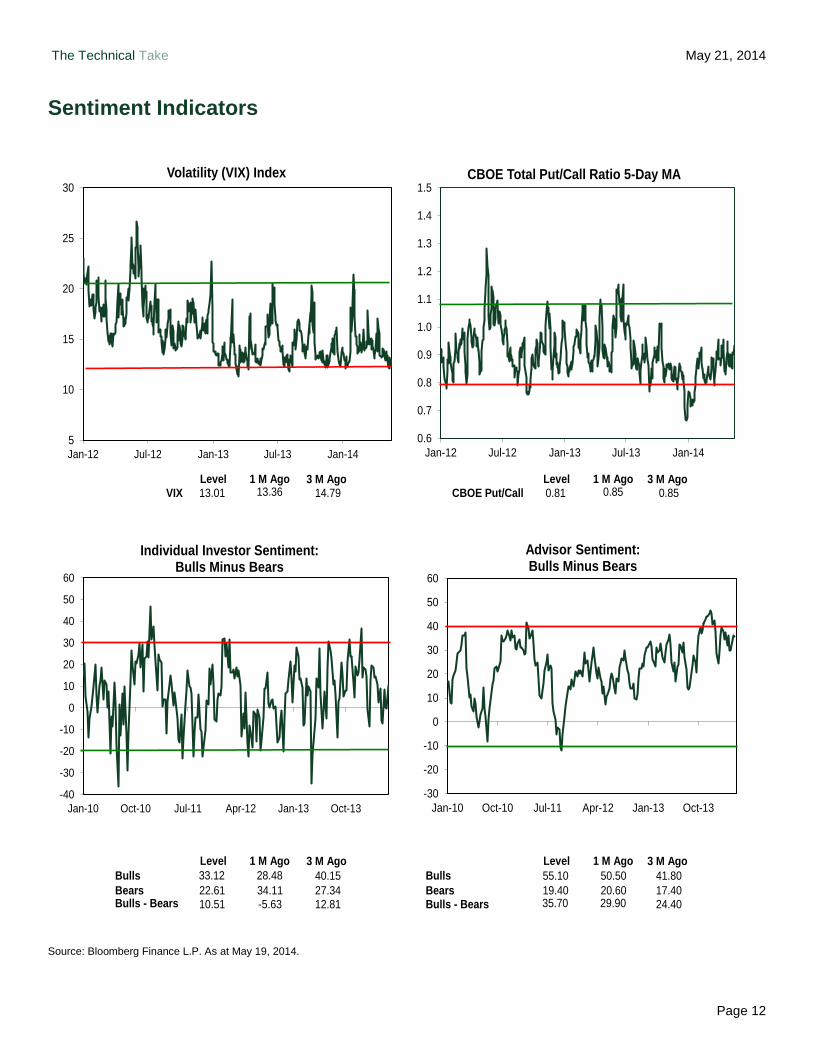
Sentiment Indicators
Level 1 M Ago 3 M Ago Level 1 M Ago 3 M Ago 13.01 13.36 14.79 0.81 0.85 0.85
Level 1 M Ago 3 M Ago Level 1 M Ago 3 M Ago
Bulls 33.12 28.48 40.15 Bulls 55.10 50.50 41.80
Bears 22.61 34.11 27.34 Bears 19.40 20.60 17.40 Bulls - Bears 10.51 -5.63 12.81 35.70 29.90 24.40
VIX CBOE Put/Call
Bulls - Bears
-40
-30
-20
-10
0
10
20
30
40
50
60
Jan-10 Oct-10 Jul-11 Apr-12 Jan-13 Oct-13
Individual Investor Sentiment: Bulls Minus Bears
-30
-20
-10
0
10
20
30
40
50
60
Jan-10 Oct-10 Jul-11 Apr-12 Jan-13 Oct-13
Advisor Sentiment: Bulls Minus Bears
5
10
15
20
25
30
Jan-12 Jul-12 Jan-13 Jul-13 Jan-14
Volatility (VIX) Index
0.6
0.7
0.8
0.9
1.0
1.1
1.2
1.3
1.4
1.5
Jan-12 Jul-12 Jan-13 Jul-13 Jan-14
CBOE Total Put/Call Ratio 5-Day MA
Source: Bloomberg Finance L.P. As at May 19, 2014.
The Technical Take May 21, 2014
Page 13
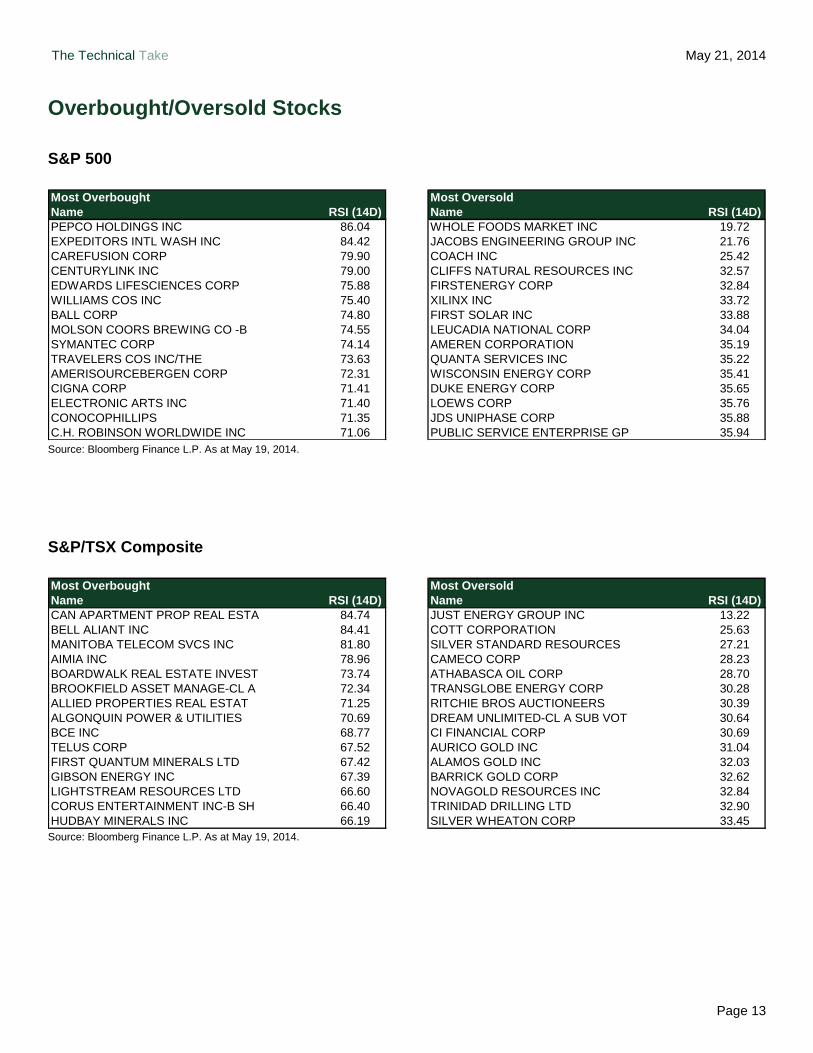
Overbought/Oversold Stocks
S&P 500
Most Overbought Most Oversold
Name RSI (14D) Name RSI (14D)
PEPCO HOLDINGS INC 86.04 WHOLE FOODS MARKET INC 19.72
EXPEDITORS INTL WASH INC 84.42 JACOBS ENGINEERING GROUP INC 21.76
CAREFUSION CORP 79.90 COACH INC 25.42
CENTURYLINK INC 79.00 CLIFFS NATURAL RESOURCES INC 32.57
EDWARDS LIFESCIENCES CORP 75.88 FIRSTENERGY CORP 32.84
WILLIAMS COS INC 75.40 XILINX INC 33.72
BALL CORP 74.80 FIRST SOLAR INC 33.88
MOLSON COORS BREWING CO -B 74.55 LEUCADIA NATIONAL CORP 34.04
SYMANTEC CORP 74.14 AMEREN CORPORATION 35.19
TRAVELERS COS INC/THE 73.63 QUANTA SERVICES INC 35.22
AMERISOURCEBERGEN CORP 72.31 WISCONSIN ENERGY CORP 35.41
CIGNA CORP 71.41 DUKE ENERGY CORP 35.65
ELECTRONIC ARTS INC 71.40 LOEWS CORP 35.76
CONOCOPHILLIPS 71.35 JDS UNIPHASE CORP 35.88
C.H. ROBINSON WORLDWIDE INC 71.06 PUBLIC SERVICE ENTERPRISE GP 35.94 Source: Bloomberg Finance L.P. As at May 19, 2014.
S&P/TSX Composite
Most Overbought Most Oversold
Name RSI (14D) Name RSI (14D)
CAN APARTMENT PROP REAL ESTA 84.74 JUST ENERGY GROUP INC 13.22
BELL ALIANT INC 84.41 COTT CORPORATION 25.63
MANITOBA TELECOM SVCS INC 81.80 SILVER STANDARD RESOURCES 27.21
AIMIA INC 78.96 CAMECO CORP 28.23
BOARDWALK REAL ESTATE INVEST 73.74 ATHABASCA OIL CORP 28.70
BROOKFIELD ASSET MANAGE-CL A 72.34 TRANSGLOBE ENERGY CORP 30.28
ALLIED PROPERTIES REAL ESTAT 71.25 RITCHIE BROS AUCTIONEERS 30.39
ALGONQUIN POWER & UTILITIES 70.69 DREAM UNLIMITED-CL A SUB VOT 30.64
BCE INC 68.77 CI FINANCIAL CORP 30.69
TELUS CORP 67.52 AURICO GOLD INC 31.04
FIRST QUANTUM MINERALS LTD 67.42 ALAMOS GOLD INC 32.03
GIBSON ENERGY INC 67.39 BARRICK GOLD CORP 32.62
LIGHTSTREAM RESOURCES LTD 66.60 NOVAGOLD RESOURCES INC 32.84
CORUS ENTERTAINMENT INC-B SH 66.40 TRINIDAD DRILLING LTD 32.90
HUDBAY MINERALS INC 66.19 SILVER WHEATON CORP 33.45 Source: Bloomberg Finance L.P. As at May 19, 2014.

The Technical Take May 21, 2014
Page 14
Market Statistics
Region Index Last 1 Week 1 Month 3 Month YTD 1 Year 3 Year 5 Year
U.S. S&P 500 1885.08 -1.41 0.32 1.68 1.21 12.27 11.95 15.67
Dow Jones Industrial Average 16511.86 -2.04 -0.20 1.50 -1.22 6.78 9.38 14.22
Dow Jones Transportation 7906.40 -0.95 2.54 7.94 5.78 20.23 12.84 20.05
Dow Jones Utilities 529.74 -0.92 -2.22 1.49 8.23 3.15 6.48 9.93
Nasdaq Composite 4125.82 -0.86 -0.02 -4.05 -1.96 17.11 13.46 18.83
Russell 2000 1114.43 -2.20 -3.64 -5.64 -5.77 9.87 9.77 17.51
Russell 1000 Value 954.19 -1.60 -0.19 2.83 2.07 11.83 11.75 15.39
Russell 1000 Growth 874.37 -1.24 0.68 -0.24 0.39 13.72 12.25 16.85
Canada S&P/TSX Composite 14514.74 -1.01 0.04 2.74 6.50 15.01 2.11 7.51
S&P/TSX 60 830.29 -0.82 0.42 2.48 6.00 14.82 2.08 6.25
S&P/TSX Smallcap 659.38 -2.12 -2.37 2.23 7.55 19.32 -3.75 9.34
S&P/TSX Venture 976.55 -1.87 -2.90 -3.59 4.06 3.76 -21.47 -2.07
International DAX 9659.39 -1.18 2.44 0.21 0.91 13.99 9.87 13.85
FTSE 100 6844.55 -1.03 2.67 -0.16 0.78 0.69 4.57 8.77
Nikkei 225 14006.44 -2.43 -3.01 -5.32 -13.60 -8.49 13.58 8.73
Hang Seng 22704.50 2.16 0.33 1.18 -2.02 -2.28 -0.53 5.83
Shanghai 2005.18 -2.08 -2.79 -4.99 -5.10 -12.88 -11.10 -5.11
MSCI World 1683.69 -0.71 0.91 1.80 1.49 11.03 8.04 12.07
MSCI EAFE 1933.30 -0.84 0.64 1.05 0.68 8.28 4.24 8.21
MSCI Emerging Markets 1031.95 1.27 2.33 8.92 3.27 -1.21 -3.17 6.49
S&P 500 Sectors Consumer Discretionary 507.29 -1.53 -0.57 -2.49 -5.15 10.67 16.51 22.74
Comsumer Staples 453.07 -1.43 0.70 5.69 2.01 5.58 10.74 13.80
Energy 683.14 -1.53 0.30 7.41 4.53 11.60 7.18 12.16
Financials 294.19 -1.93 -0.81 1.19 -0.90 8.58 11.38 13.15
Health care 676.25 -0.64 2.04 -1.33 4.63 19.09 17.31 17.86
Industrials 458.85 -2.54 -0.45 2.53 0.07 18.37 11.94 18.09
Information Technology 601.57 -0.47 1.72 1.08 2.18 16.83 12.75 17.35
Materials 302.85 -1.05 0.66 3.30 3.37 16.19 7.97 13.27
Telecommunications 160.92 0.03 0.93 5.37 1.81 -4.65 5.37 9.11
Utilities 209.81 -1.22 -2.40 2.39 8.67 3.46 6.77 9.88
S&P/TSX Sectors Consumer Discretionary 1584.94 -1.80 0.29 6.20 5.54 25.17 13.44 14.79
Comsumer Staples 2767.33 -1.58 1.49 5.57 7.58 14.48 15.93 14.00
Energy 3277.56 -1.05 -1.58 8.66 12.28 18.47 1.21 5.54
Financials 2148.06 -0.85 -0.11 2.54 2.56 16.71 5.95 10.91
Health care 1656.83 0.29 6.16 -12.94 9.39 49.22 31.71 45.45
Industrials 2092.07 -1.60 2.25 3.63 4.08 19.69 14.53 17.94
Information Technology 147.80 -2.26 -2.03 -4.62 2.65 7.44 -9.51 -12.76
Materials 2234.15 -1.33 0.28 -5.99 7.99 1.10 -15.69 -3.07
Telecommunications 1220.11 0.85 2.95 5.68 5.62 2.42 9.10 13.90
Utilities 1893.14 -1.58 -2.10 1.25 6.98 -4.20 -1.36 6.69 Source: Bloomberg Finance L.P. 3 and 5 year returns are annualized. As at May 19, 2014.
The Technical Take May 21, 2014
Page 15
Appendix A – Important Disclosures
General Research Disclosure
The statements and statistics contained herein are based on material believed to be reliable, but are not guaranteed to be accurate or
complete. This report is for informational purposes only and is not an offer or solicitation with respect to the purchase or sale of any
investment fund, security or other product. Particular investment, trading, or tax strategies should be evaluated relative to each
individual’s objectives. Graphs and charts are used for illustrative purposes only and do not reflect future values or future performance.
This document does not provide individual financial, legal, investment or tax advice. Please consult your own legal, investment and tax
advisor. All opinions and other information in this document are subject to change without notice. The Toronto-Dominion Bank and its
affiliates and related entities are not liable for any errors or omissions in the information or for any loss or damage suffered.
TD Waterhouse Canada Inc. and/or its affiliated persons or companies may hold a position in the securities mentioned, including
options, futures and other derivative instruments thereon, and may, as principal or agent, buy or sell such securities. Affiliated persons
or companies may also make a market in and participate in an underwriting of such securities.
Full disclosures for all companies covered by TD Securities Inc. can be viewed at
https://www.tdsresearch.com/equities/welcome.important.disclosure.action
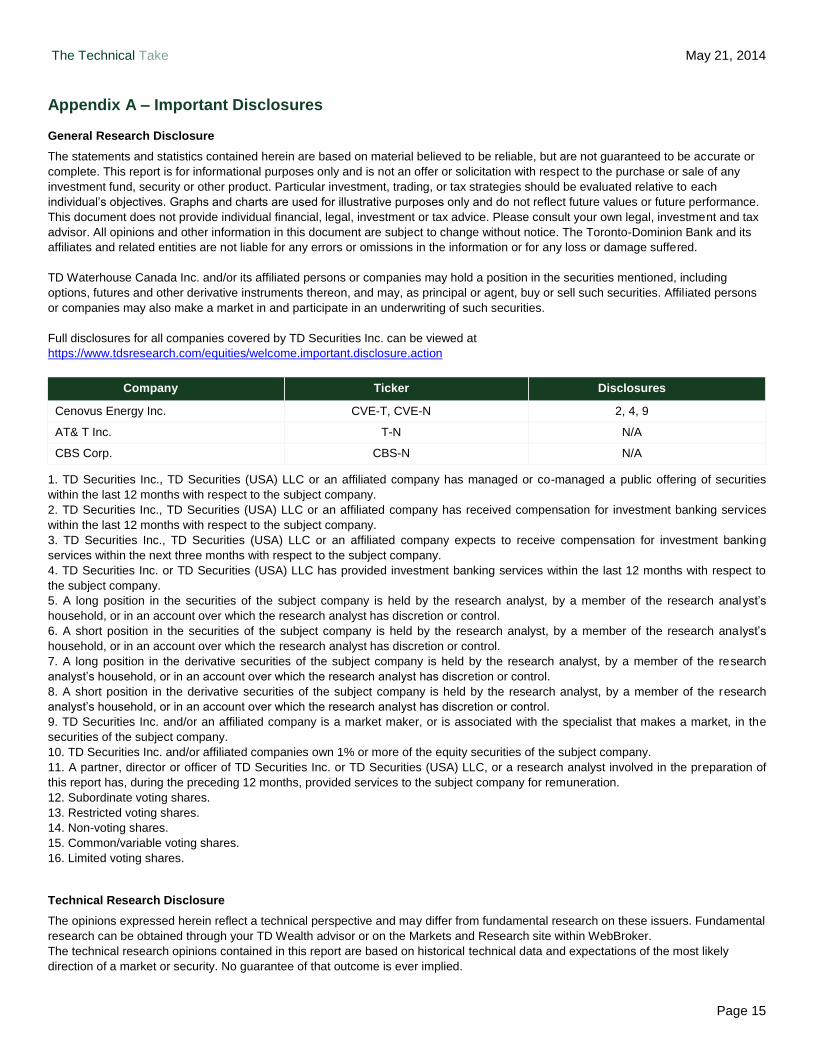
Company Ticker Disclosures
Cenovus Energy Inc. CVE-T, CVE-N 2, 4, 9
AT& T Inc. T-N N/A
CBS Corp. CBS-N N/A
1. TD Securities Inc., TD Securities (USA) LLC or an affiliated company has managed or co-managed a public offering of securities
within the last 12 months with respect to the subject company.
2. TD Securities Inc., TD Securities (USA) LLC or an affiliated company has received compensation for investment banking services
within the last 12 months with respect to the subject company.
3. TD Securities Inc., TD Securities (USA) LLC or an affiliated company expects to receive compensation for investment banking
services within the next three months with respect to the subject company.
4. TD Securities Inc. or TD Securities (USA) LLC has provided investment banking services within the last 12 months with respect to
the subject company.
5. A long position in the securities of the subject company is held by the research analyst, by a member of the research analyst’s
household, or in an account over which the research analyst has discretion or control.
6. A short position in the securities of the subject company is held by the research analyst, by a member of the research ana lyst’s
household, or in an account over which the research analyst has discretion or control.
7. A long position in the derivative securities of the subject company is held by the research analyst, by a member of the research
analyst’s household, or in an account over which the research analyst has discretion or control.
8. A short position in the derivative securities of the subject company is held by the research analyst, by a member of the research
analyst’s household, or in an account over which the research analyst has discretion or control.
9. TD Securities Inc. and/or an affiliated company is a market maker, or is associated with the specialist that makes a market, in the
securities of the subject company.
10. TD Securities Inc. and/or affiliated companies own 1% or more of the equity securities of the subject company.
11. A partner, director or officer of TD Securities Inc. or TD Securities (USA) LLC, or a research analyst involved in the preparation of
this report has, during the preceding 12 months, provided services to the subject company for remuneration.
12. Subordinate voting shares.
13. Restricted voting shares.
14. Non-voting shares.
15. Common/variable voting shares.
16. Limited voting shares.
Technical Research Disclosure
The opinions expressed herein reflect a technical perspective and may differ from fundamental research on these issuers. Fundamental
research can be obtained through your TD Wealth advisor or on the Markets and Research site within WebBroker.
The technical research opinions contained in this report are based on historical technical data and expectations of the most likely
direction of a market or security. No guarantee of that outcome is ever implied.
The Technical Take May 21, 2014
Page 16
Research Report Dissemination Policy
TD Waterhouse Canada Inc. makes its research products available in electronic format. These research products are posted to our
proprietary websites for all eligible clients to access by password and we distribute the information to our sales personnel who then may
distribute it to their retail clients under the appropriate circumstances either by email, fax or regular mail. No recipient may pass on to
any other person, or reproduce by any means, the information contained in this report without our prior written consent.
Analyst Certification
The Portfolio Advice and Investment Research analyst(s) responsible for this report hereby certify that (i) the recommendations and
technical opinions expressed in the research report accurately reflect the personal views of the analyst(s) about any and all of the
securities or issuers discussed herein, and (ii) no part of the research analyst’s compensation was, is, or will be, directly or indirectly,
related to the provision of specific recommendations or views expressed by the research analyst in the research report.
Conflicts of Interest
The Portfolio Advice & Investment Research analyst(s) responsible for this report may own securities of the issuer(s) discussed in this
report. As with most other employees, the analyst(s) who prepared this report are compensated based upon (among other factors) the
overall profitability of TD Waterhouse Canada Inc. and its affiliates, which includes the overall profitability of investment banking
services, however TD Waterhouse Canada Inc. does not compensate its analysts based on specific investment banking transactions.
Corporate Disclosure
TD Wealth represents the products and services offered by TD Waterhouse Canada Inc. (Member – Canadian Investor Protection
Fund), TD Waterhouse Private Investment Counsel Inc., TD Wealth Private Banking (offered by The Toronto-Dominion Bank) and
TD Wealth Private Trust (offered by The Canada Trust Company).
The Portfolio Advice and Investment Research team is part of TD Waterhouse Canada Inc., a subsidiary of The Toronto-Dominion
Bank.
Trade-mark Disclosures
Bloomberg and Bloomberg.com are trademarks and service marks of Bloomberg Finance L.P., a Delaware limited partnership, or its
subsidiaries. All rights reserved.
“TD Securities” is the trade name which TD Securities Inc. and TD Securities (USA) LLC jointly use to market their institutional equity
services.
TD Securities is a trade-mark of The Toronto-Dominion Bank representing TD Securities Inc., TD Securities (USA) LLC, TD Securities
Limited and certain corporate and investment banking activities of The Toronto-Dominion Bank.
All trademarks are the property of their respective owners.
® The TD logo and other trade-marks are the property of The Toronto-Dominion Bank.