the swedish sustainable energy market opportunitis and barriers for new al mimar
TRANSCRIPT
MA
ST
ER
THESIS
Master in technical project management and business development, 60credits
The Swedish sustainable energy market:Opportunities and barriers for new actors
Barriers and obstacles to Swedish solar market
Samer Al-Mimar
Dissertation in Industrial Management and Business Administration, 15credits
Helsingborg 2016-07-25

Abstract Sweden is moving from the fossil-atomic age, making ready for photovoltaics (PV) to
assume a noteworthy part in a future formed by renewable power production. Sweden is a global leader in renewable energy, environment technology, and Clean-tech. The country fully embraces green technologies and this area has a major business potential. The goal is to reach a 50 percent share of renewable energy by 2020. Photovoltaic (PV) system is one of the main sources of renewable energy sources, the rate of installed PV increased in Sweden. During 2014 36.2 MWp installed, which is almost double installed power 19.1 MWp during 2013. During 2013 and 2014 1.1 MWp sold to the electrical grid and 9.5 MWp of the off-grid system been sold. It was and will be always a problem to start a business or to enter a new market or technology, struggle to understand the market, solve the problems, and increase the sales to achieve the success. Since many companies face difficulties, selling products and getting more projects, for that a research document made to investigate more and find solutions. The purpose of this research to identify solar market entrance obstacles and barriers, and how can new entrants makes solar market entrance. Investigate the statues que of today market and the predict future for solar market in Sweden. Data collection sequence started with identifying customer needs, then review the literature, and finally interview Swedish solar firms. The interviewed firms were five firms operating in Southern of Sweden. The information outcome from the process identifies market obstacles and barriers, providing ideas about the today market situation, predicting the market future, and setting a plan for market entrance for a new entrant. The research neglected the firm size, concentrating on market obstacles and barriers.
Search Words: (Renewable energy, Sustainable energy, Solar energy, Market entrance, Entrance strategies, Entrance obstacle &barriers).

Acknowledgement I express my gratitude to the supervisors Richard Grönevall, Henrik Florén, and
Christer Norr, for their help and guidance during the whole research. Especially, I am very grateful to my parents for teaching me perseverance and rewards of work and for encouraging me despite the 5000 km distance between us. I am indebted to my wife Raghad Al-Khateeb, my daughter Mira and my brother Mohammed for their help and support attentive and who always encouraged me. I absolutely want to thank my classmates for being helpful, attentive and who always encouraged me.

Table of Contents Introduction ................................................................................................................................ 1
1.1. The purpose ..................................................................................................................... 1
1.2. Research questions .......................................................................................................... 2
1.3. Overview of Sweden and photovoltaic market ............................................................... 2
1.4. More Motivation to Adopt Renewable Energy ............................................................... 3
1.5. Barriers & Obstacles adopting renewable energy sources (Photovoltaic system) .......... 4
1.6. Analysed firms ................................................................................................................ 5
1.7. Research Limitation ........................................................................................................ 5
Literature Review....................................................................................................................... 6
2.1. Market Entry ................................................................................................................... 6
2.1.1. Step by step Entry .................................................................................................... 7
2.2. Diffusion of innovation ................................................................................................... 8
2.2.1. Innovation ................................................................................................................ 9
2.2.2. Early adopters .......................................................................................................... 9
2.2.3. Early Majority .......................................................................................................... 9
2.2.4. Late Majority ........................................................................................................... 9
2.2.5. Laggard .................................................................................................................. 10
2.3. Diffusion process .......................................................................................................... 10
2.4. Business Life Cycle ...................................................................................................... 10
2.4.1. Start-up stage ......................................................................................................... 11
2.4.2. Growths stage......................................................................................................... 11
2.4.3. Maturity.................................................................................................................. 12
2.4.4. Decline ................................................................................................................... 12
2.5. SWOT analysis ............................................................................................................. 12
2.6. Barriers to Growth and Development ........................................................................... 13
2.7. Definition of obstacles & barriers ................................................................................. 14
2.8. Barriers to Entry ............................................................................................................ 16
2.9. Type of barriers & obstacles ......................................................................................... 18
2.9.1. Technical barriers & obstacles ............................................................................... 19
2.9.2. Administrative barriers & obstacles....................................................................... 21
2.9.3. Market environment barrier & obstacle ................................................................. 22
2.9.4. Economical barrier & obstacle ............................................................................... 23

Research methodology ............................................................................................................. 27
3.1. Methodology ................................................................................................................. 27
3.2. Research Method .......................................................................................................... 28
3.3. Data Collection ............................................................................................................. 30
3.4. Research design ............................................................................................................ 31
3.5. Information gathering method ...................................................................................... 31
3.6. Questionnaire design ..................................................................................................... 32
3.7. Interviews ...................................................................................................................... 33
3.8. Data Analysis ................................................................................................................ 34
Empirical Case Study ............................................................................................................... 35
4.1. Overview of Sweden ..................................................................................................... 35
4.2. Swedish Solar Energy ................................................................................................... 36
4.2.1. The installed photovoltaic capacity in Sweden ...................................................... 37
4.3. The solar cell system competitiveness .......................................................................... 38
4.3.1. Price ....................................................................................................................... 38
4.3.2. Prices of the system ............................................................................................... 39
4.3.3. Photovoltaic system cost analysis .......................................................................... 40
4.4. Monetary parameters and programs.............................................................................. 41
4.4.1. Leasing schemes and third party ownership .......................................................... 41
4.4.2. Cooperatives financed the photovoltaic ................................................................. 41
4.5. The power demand & power prices .............................................................................. 41
4.6. The support ................................................................................................................... 43
4.6.1. The government financial assistance for PV program ........................................... 43
4.6.2. The green electricity certificate system ................................................................. 44
4.6.3. Guarantees of origin ............................................................................................... 45
4.7. Prosumers’ expansion measures ................................................................................... 45
4.7.1. Tax ......................................................................................................................... 45
4.7.2. Register .................................................................................................................. 45
4.7.3. Reduction ............................................................................................................... 46
4.7.4. Regulation .............................................................................................................. 46
4.8. PV in economy .............................................................................................................. 46
4.8.1. Labour places ......................................................................................................... 46
4.8.2. Business value ........................................................................................................ 47

Empirical Finding .................................................................................................................... 48
5.1. Interviews ...................................................................................................................... 48
5.1.1. Varmitek Energisystem ab ..................................................................................... 48
5.1.2. Nibe ........................................................................................................................ 50
5.1.3. PPAM Solkraft ....................................................................................................... 51
5.1.4 Rexel Energy Solution ............................................................................................ 53
5.1.5. K-utveckling engineering ab .................................................................................. 54
Research analysis and discussion............................................................................................. 57
6.1. Examination and discourse ........................................................................................... 57
6.2. Diffusion of innovation ................................................................................................. 59
6.3. Diffusion Process .......................................................................................................... 60
6.4. Business life cycle......................................................................................................... 61
6.5. SWOT Analysis ............................................................................................................ 61
6.5.1. Strength and Weakness .......................................................................................... 61
1. Varmitek Energisystem ab ........................................................................................... 62
2. Nibe .............................................................................................................................. 62
3. PPAM Solkraft ............................................................................................................. 63
4. Rexel Energy Solutions................................................................................................ 63
5. K-utveckling engineering ab ........................................................................................ 64
6.5.2. Opportunity and Threats ........................................................................................ 64
6.6. Obstacles and barriers ................................................................................................... 69
6.6.1. Technical barriers & obstacles ............................................................................... 69
6.6.2. Administrative barriers & obstacles....................................................................... 70
6.6.3. Market environment barrier & obstacles ............................................................... 71
6.6.4. Economical barrier & obstacles ............................................................................. 71
6.7. Similarities and un-similarities ..................................................................................... 72
Conclusion and Recommendation ........................................................................................... 74
7.1 Research question one .................................................................................................... 74
7.2. Research question two .................................................................................................. 76
7.3. Market entrance barriers and obstacles ......................................................................... 77
7.3.1. Green light to market ............................................................................................. 78
7.3.2. Red light to market................................................................................................. 79
7.4. Type of barriers and obstacles ...................................................................................... 79

7.4.1. Technical obstacle and barriers .............................................................................. 79
7.4.2. Administrative barriers & obstacles....................................................................... 80
7.4.3. Market environment barrier & obstacles ............................................................... 80
7.4.4. Economical barrier & obstacles ............................................................................. 80
7.4. Suggestions for further study ........................................................................................ 80
Bibliography ............................................................................................................................ 82
Appendix .................................................................................................................................. 89
List of Figures Figure 1: The diffusion of innovation. (Rogers E. , 2003). ....................................................... 9 Figure 2: The five stages of the decision innovation process (Rogers E. M., 1983). .............. 10 Figure 3: Business life cycle (Hisrich, R. D., Peters & M. P., 2002, p. 502). ......................... 11 Figure 4: Main internal/external and intangible/tangible barriers. (Barth, 2004, p. 68) .......... 16 Figure 5: Impact on business research (Bryman & Bell., 2011, p. 29). ................................... 29 Figure 6: Cumulative installed PV power in Sweden (Lindahl J. , 2015). .............................. 37 Figure 8: Average typical prices for PV systems (Exl. VAT) (Lindahl J. , 2015). ................. 39 Figure 10: Average of twelve Swedish installation companies cost in the end of 2014 (Lindahl J. , 2015). ................................................................................................................... 40 Figure 11: Weekly price on the Nord Pool spot market in 2014 (Lindahl J. , 2013)............... 42 Figure 13: Evolution of the lowest variable electricity price (Lindahl J. , 2015). ................... 43 Figure 14: The quota level in the green electricity certificate system (Lindahl J. , 2015). ..... 44 Figure 7: The Swedish PV market divided into market segments (Lindahl J. , 2015) ............ 89 Figure 9: The price difference for PV systems (Exl. VAT) (Lindahl J. , 2015). ..................... 89 Figure 12: Average daily spot price between 1/6 and 31/8 (Lindahl J. , 2013) ....................... 90 Figure 15: Evolution of the number of PV related labor places in Sweden (Lindahl J. , 2015)................................................................................................................................................... 90
List of tables Table 1: PV power and national energy market (Lindahl J. , 2015). ....................................... 38 Table 2: Module prices drop – SEK/Wp (Lindahl J. , 2015) ................................................... 39 Table 3: National trends in system prices for different applications (Exl. VAT) – SEK/Wp. 40 Table 4: Estimated PV-related labor places in 2014. ............................................................... 46 Table 5: Value of PV business ................................................................................................. 47 Table 6: Swedish solar market SWOT..................................................................................... 67 Table 7: The cumulative installed PV power in 4 sub-markets (Lindahl J. , 2015) ................ 90 Table 8: Turnkey Prices of typical applications (Exl. VAT) – SEK/Wp (Lindahl J. , 2015) .. 91 Table 9: Cost breakdown of a residential PV system < 10 kWp – SEK/W ............................. 92 Table 10: Country overview .................................................................................................... 92 Table 11: PV in the green electricity certificate system .......................................................... 93
List of Nomenclature
PV: Photovoltaic
R&D: Research and development
kWp/h: Kilowatts peak per hour
kWp/yr: Kilowatts peak per year
SEK/kWp: Swedish krona per kilowatts peak
SEK/kWh: Swedish krona per kilowatts hour
DNO: The Distribution Network Operator
CO: Carbon monoxide
VAT: Value-added tax
ROT: Tax subsidy, short for the renovation, remodeling and extension.
GO: Guaranty of origin
TOC: Tenant owner cooperative
GHG: Greenhouse gas
GDP: Gross domestic product
OECD: The Organisation for Economic Co-operation and Development
BLC: Business life cycle
Clean-tech: Clean technology includes clean energy, environmental, and sustainable or green, products, and services.
Introduction The supply of energy is a key factor in modern societies. As the old fossil sources for
energy are dwindling, conflicts arise between competing nations and regions. Fossil energy sources also contribute to the pollution of the environment and emission of greenhouse gasses. With renewable energy sources, many of these drawbacks with fossil fuels can be eliminated as the energy will be readily available for all without cost or environmental impact (Al-Mimar, 2015). Sweden is moving from the fossil-atomic age, making ready for photovoltaics (PV) to assume a noteworthy part in a future formed by renewable power production. Sweden is a global leader in renewable energy, environment technology, and Clean-tech. The country fully embraces green technologies and this area has a major business potential. The goal is to reach a 50 percent share of renewable energy by 2020.
To clarify market obstacles and barriers it is essential to understand the concepts and each principle, the obstacles are the character that has to be removed or passed which stop the progress, while barriers are the character that cannot be removed or passed which stop the organization from entering into new territory. The data collection sequence start by sending questionnaire to customers to identify customer barriers and obstacles to adopt the photovoltaic system. Based on literature review and interviews with customers, the researcher managed to accumulate questionnaires to Swedish solar companies. The interviews carried with firms operates in Sweden within the solar business, the interviewee is not reflecting the firm point of view but reflecting the interviewee point of view. Varmitek Energisystem and K-Utveckling recently started their photovoltaic department while Rexel was in the market for a long time now, Nibe considered as big player in heat pump business in Sweden and over the globe. Finally, PPAM operates in many locations over Sweden and has their own product. The researcher has background experience in renewable energy and specialist in solar energy, the researcher personal aim to gain more knowledge in Swedish solar market obstacles and barriers.
1.1. The purpose
It was and will be always a problem to start a business or to enter a new market or technology, struggle to understand the market, solve the problems, and increase the sales to achieve the success. Since many companies face difficulties, selling products and getting more projects, for that a research document made to investigate more and find solutions. In connection, the researcher personal aim based on the experience in solar market is to increase awareness of the solar market in Sweden, identifying market obstacles and barriers, have clear picture of the current market situation, the predicted future, and how the new entrant can step into the Swedish solar market.
Difficulties not only caused by market and sales, it caused by both internal factors such as management, teams and products and external factors that affect the entrants. The research start with building the case based on actual market and in relevant will try to find
1

reasonable solutions for the difficulties and set solid future plans. The importance of identifying the barrier come in specifying the reasons hold back the firms from development and economic of scale, getting more innovation for new technology and new business opportunities, identifying solar market future and market growth is important for new entrant, the solid prediction provide confidence to the new players. The market development can be below the economic level, which affect the labor market. Moving to market that is more competitive hindered because of market barrier (Bartlett & Bukvić, 2001, p. 5). The market barriers can be external or internal, tangible or intangible or mix between them (Barth, 2004). The barriers to development ruin the chance of fast re-employ the working force from useless big firms to new entrants. The barriers and obstacle are important manners determines the market entrance, identifying them help new entrant set strategy to enter the new market with awareness of the market situation, reducing the risks and guaranty the market growth. The firm size effect shall neglect in this research and more focus on market barriers and obstacles. From the above concern the researcher identify two-research question related to solar market future and entrance barriers and obstacles that have been describe in 1.2.
1.2. Research questions
The aim of this research is to answer the following research questions:
RQ1: What is the predicted future for solar market in Sweden?
RQ2: How can entrant make a solar market entrance in Sweden?
Referring to the energy reports and the interviews the predicted solar market future the first research question can answered, while theories, national reports, interviews, and final finding can define and answer the research question related to solar market entrance in Sweden.
1.3. Overview of Sweden and photovoltaic market
The kingdom of the Sweden is the fourth largest country in the European Union with an area of 450295 Km2 and has a population that passed the 9.5 million mark in 2012. Sweden’s economy rebounded thanks to its strong monetary policies, exports, and structural reforms undertaken in the aftermath of the banking crisis in the early 1990s. (Lindahl J. , 2013, pp. 19-20).
Sweden one of the most developed countries in many fields, with a history of egalitarianism, fair welfare, and peace, Sweden reached desirable living standards motivated towards foreign trade and capitalism. Sweden considers one of the high-developed industrial countries supported by strong knowledge based on the service sector. The existing of raw material and the old manufacturing industries which support the economy, Sweden compete with highly specialized and research companies. However, 75 % of the Swedish workforce in the service sector, which count as the largest employer in the country (Kalin, 2012). Based on
2

fast processing times and low bureaucracy in Sweden, make it very easy to start a new business in the most efficient country in the Nordic country.
The market entrance can be a hard step to take in Sweden base on well-developed industry, high quality, developed technology, non-stop product development, and high environmental awareness. Also, Swedish has high purchasing power and price awareness and customers used to get high-quality products and standard of living. Ethics and gender equality are a strong orientation on business-to-business market and the business to consumer. Entering any market required hard work on planning and fundamental efforts. Entering the Swedish market required understanding business culture and commercial practices. An understanding needed that there is no real wrong or right when it comes to business cultures. Sweden is a different country speaks different languages, business done differently following the Swedish way, and that does not mean it is the right way to do business. In order to operate a new business in Sweden man must understand how things are operating in the country and how the culture understanding is important (Kalin, 2012).
The rate of installed PV increased in Sweden. During 2014 36.2 MWp installed, which is almost double installed power 19.1 MWp during 2013. During 2013 and 2014 1.1 MWp sold to the electrical grid and 9.5 MWp of the off-grid system sold. During 2014 35.1 MWp of grid connected power were installed by companies and private peoples which double the grid connected PV system and significantly grown in the market contribute. More details listed in the following chapters.
1.4. More Motivation to Adopt Renewable Energy
The motivation for adopting and installing renewable energy sources can be economic, environmental, and social aspects. (S. Organ, G. Squires & D. G. Proverbs., 2013). To make the customer purchase the PV system main customer motivation must interview. The mainly be; better natural environment, reasonable offers, increase the real estate value, good government financial support, independent power source and group force when neighbors purchasing the system (Jager, 2005).
A Swedish household cooperative study showed that main motivation for Swedish house owners to purchase and install PV system is the environmental concern, self-adequacy, the objection against big scale production, and the self-delight of producing your own energy (Palm J. , 2013). The Swedish customers became witness of the great results from other sustainable systems. Such as solar heating and heat pumps, the customer became aware of the great differences and advantages of such systems, for that more PV system installed today and more customers convinced with such system (Hoppe T. , 2012, p. 796).
The endogenous factors such as the desire for energy conservation and technology awareness can motivate the household to purchase and install a photovoltaic system, other factors such as market structure, regulatory, initial cost, and characteristics considered as exogenous factors (T. Islam & N. Meade, 2012). Certainly, the government financial support
3
very important as it motivates the customer and provides confidante to purchase the system, especially when the time come to change the roof and renovate the premises.
Other factors such as high income, middle age customer with high education make them more willing to get a tax reduction of adopting renewable energy sources, installing renewable energy sources increased when income increases and when energy prices increases (I. Kostakis & E. Sardianou., 2011). The study by (J. Martinsson, L. J. Lundqvist & A. Sundström., 2011) showed that high-income people have more consideration towards environmental issues and adopting renewable power help the environment and in Sweden, the environment considers very important.
1.5. Barriers & Obstacles adopting renewable energy sources (Photovoltaic system)
Besides what have been mentioned before it is obvious of existing several technical and non-technical obstacles to adopting the photovoltaic system. The slow growing in a photovoltaic system is Sweden related to a shortage of information about the system (T. Islam & N. Meade., 2013). The major obstacle to the photovoltaic system is the initial cost of the system and long payback time due to low energy prices in Sweden and low solar radiation (R. Margolis & J. Zuboy., 2006).
Also, shortages of technical knowledge and customer concern with gambling of installing photovoltaic system are regard as big obstacles for the product. The bureaucratic obstacles to acquiring approval for installing the photovoltaic system from municipality and constructions authorities considered as the main headache to the customers (Jager, 2005). The certainty for potential customers to gain building permission to install photovoltaic system is vague, as well as the long waiting time for getting government support for photovoltaic system and the low budget planned for photovoltaic system in Sweden make the customer unconfident when it comes to take discussion for buying photovoltaic system (Palm A. , 2014).
The long lifetime of more than 25 years for photovoltaic system make it necessary to change the roof before installing the photovoltaic system which will add the more high cost of changing the roof, these obstacles kill the motivation to sell the photovoltaic system in Sweden. Extra cost added to system total cost, is the high installation cost based on high labor cost, the mechanical installation to be carry on by roof specialist. In addition, the high electrical installation cost as well because such installation cannot be carried on in Sweden without specialist carrying special electrical license and that exhaust the overall cost, which reduces the margin and increases the payback time. The Swedish buyers mainly concern about the cost and payback time like any buyer around the world, but the Swedish buyers want to wait for the prices to fall down in order to get better deals plus the concern regarding claiming the government support because of the reasons mentioned earlier. The average payback time between 9-12 years, and the low electrical prices in Sweden not supporting the reduction in payback time and increase the annual profits.
4

1.6. Analysed firms
Varmitek Energisystem ab, operate in Helsingborg, supply and install heat pumps since 12 years, providing service after sales. The firm started the solar cell department relying on long customers list supplied with heat pump and solar thermal. The firm importing material from Germany and outsource the installation part. The firm enters the solar market two years back and targeting small and medium projects.
Nibe has significant annual sales. The firm operate in many countries with more than 10,000 employees. The firm supply heat pump to Sweden market and recently started to sale solar packages to be install by buyers or sub-contractors working with Nibe. The firm targeting the loyal customers and provide another solution to reduce the power consumption by combining the solar system with heat pump system.
PPAM Solkraft targeting all type of projects, the firm has it is own team to design and install the solar system. The firm has stock of material, which provides strength to control costs. The firm targeting the market through direct sales and web shop with online calculation. The firm has it is own products manufactured in China. The firm launched in 2002 and have research and development strategy to create a better product suitable to Sweden market. The firm has teams all over Sweden to cover the market and easily reach the customers.
Rexel Energy Solution one of the giants in electrical material distribution, operate in 38 countries. The main target of Rexel is to increase awareness of energy solution and energy efficient products. The firm targeting the solar market through web shop with a wide range of products from leading manufacturers suits all type of customers. The customer can select the desired material and Rexel responsibility to deliver the best quality material to the customer in short time.
K-utveckling engineering ab, started 2003 in project management, and mainly operates in nuclear power plant management, and all type of projects consulting all over Sweden. The firm targeting medium and large projects, the firm depends on direct sales and web shop sales. The firm import the product from abroad.
1.7. Research Limitation
The research limited to neglect the firm's size, due to the technical capabilities of any technical expert to design the system with proper technical tools, with availability of highly competitive product prices from around the world. Also, the minimum import prices “MIP” from China limited the price competition and create price visibility to everyone (Policy, 2016). Sweden imports the product from abroad, only limited products are made in Sweden as the country is more oriented toward research and development.
This research will study the market obstacles and barriers for firms already operating in Sweden, and will not refer to firms trying to enter the Swedish market from the external
5

environment. The analyzed firms are traders not manufacturing firms. Solar industry can share similarities with other markets and shall describe in later chapters. The interviews are not reflecting the firm point of view, but reflecting the interviewee point of view.
Literature Review In this chapter the researcher, review the literature by referring to market entry and
step-by-step entry. Defining the diffusion of innovation includes process and steps, with business life cycle including business life stages. Also, SWOT review of market and product, barriers to growth and development, definition of obstacles and barrier. The researcher defines four types of barrier and obstacles based on customer feedback from interviews. The barriers and obstacles types are technical, administrative, market environment and economic barriers and obstacles.
2.1. Market Entry
The past writing has distinguished diverse types of the entrance. The study by Geroski (1991) concentrates on a passage by an all over again participant to an industry in which it has no past involvement. It is still gainful to perceive the other potential types of the entrance. The writing perceives four distinct types of passage (Geroski P. , 1991).
1. De novo section (additionally alluded to as Greenfield or start up passage) by anotherorganization to another industry
2. Existing organization entering another industry new limit
3. Existing organization entering another industry existing limit
4. Existing organization entering another item place
Another potential approach to take a view of the distinctive sorts of business sectorpassage is to concentrate on whether the contestant is expensive or little. Despite the fact that both will be considered as new contestants to an industry, the conditions of passage are altogether different for the two, in a vast part identifying with the current abilities (Gaynor & H. Wilson, 1998). Blees & al. (2003) have reasoned that extensive participants, more often than not entering through differentiating from another industry, will have the existing knowledge, existing and entrenched associations with suppliers and clients, have entry to dissemination systems, and more often than not have admittance to extraordinary measures of money related capital. Then again, little contestants more often than not have less or no related knowledge and experience the ill effects of an absence of budgetary capital. The prior examination has likewise centered on distinguishing the most favorable purpose of passage for organizations. (Lieberman & Montgomery., 1998) presented the idea of a first mover point of preference which recommends that the main organizations to market can acquire better overall revenues, can arrange lower expenses of capital and can achieve a head begin
6
once again its adversaries, putting them into a worthwhile aggressive position in connection to the later contestants. Much research has distinguished particular points of interest for right on time participants over later contestants. A few studies have furthermore indicated express impacts, for example, higher pieces of the overall industry of first movers than their adherents (e.g. Kerin et al. 1992) along these lines pushing for an early section into an industry. The suggestions for all over again, little contestants have been that the business life cycle and the timing of passage have more critical consequences for the post-section execution for little organizations than vast ones. Research discoveries, likewise recommend that particularly in commercial enterprises where the hindrances to passage are high. Another organization ought to enter in the early phases of the business lifecycle as the impact of section boundaries on the early execution of the participant directed when contrasted with entering at later 13 stages, a finding that has much more accentuation in commercial enterprises where economies of scale and capital prerequisites are huge ( Robinson & McDougal., 2001). Hence, the past exploration would propose that some section obstructions are much higher for little participants contrasted with bigger contestants with a considerably bigger impact on the off chance that the little participant is an again contestant with no current capacities or money related capital (Blees & al. 2003). The expansive, officially existing organizations can utilize their current foundation and brand name when entering another industry or a business sector. Notwithstanding profiting by existing abilities and resources, the bigger organizations, for the most part, have considerably more money related influence and are normally better in drawing in new capital financing to bolster their entrance ( Robinson & McDougal., 2001). Moreover, they generally are sufficiently extensive to affect the focused positions in an industry. Bigger participants will frequently have cooperative energies with existing operations and can pick up economies of scale and degree much sooner than the littler contestants can. As talked about in the accompanying parts, a fruitful passage, as a rule, requires noteworthy cash flow to have the capacity to meet the occupants' business sector power and to have the capacity to handle the hindrances to passage. From multiple points of view, little participants are frequently first and most specifically influenced by the activities of the occupants, for example, diverse sorts of retaliatory activities. On the other hand, little organizations may have the capacity to escape a portion of the more straightforward assaults as they may see as to a lesser extent a risk than expansive scale participants may. Still, the post-passage execution been decidedly connected with the size of the section. More procedures that are forceful been connected with longer-term execution and the shot of moving the learning and experience bend even more rapidly with a more extensive degree. (Asikainen, 2012, pp. 12-13).
2.1.1. Step by step Entry
The systematical system regularly brings down the dangers of the entrance of the fact that the firm can portion the danger. On the off chance that it falls flat in its beginning of entrance, the firm save the expense of going further; it would need to put every one of its chips on the table on the off chance that it attempted to enter a definitive target gather immediately. Systematically entrance likewise permits the firm to gather capital for resulting shifts in position, for which it may need to pay a hardened cost if all were required on the
7
double. In addition, a firm can step into a key gathering in which overcoming versatility hindrances requires moderately reversible speculations. Just in the event that it is fruitful at this stride will the firm then endeavor entrance into a vital gathering where overwhelming interests in promoting, research, and development, or other salvageable regions are required to overcome versatility boundaries. The investigation of step-by-step entrance can be pivoted to determine suggestions for existing firms in the business. In the event that there is especially sheltered step by step entrance procedures, then it unmistakably pays to direct interests in portability hindrances to shut them off (Porter M. E., 1980, pp. 356-357).
The most effective factors for market entry are internal firm capabilities, these capabilities are financial, experience and clear market entrance strategy. To create strategy the firm should study the market and be aware of obstacles and barriers.
2.2. Diffusion of innovation
The hypothesis that tries to clarify how, why and define until what rate new thoughts and innovation spread through societies (Rogers E. , 2003). Roger (2003) contends that diffusion is the procedure of a development imparted over specific channels after some time among members in a social framework. The diffusion of innovation depends on the following factors: time, communication channels, social system, and the innovation itself while the process depends on the economic capital. To self-sustain the innovation should be highly adopted. Roger (1962) defines the adopter categories as an innovator (2.5%), early adopters (13.5%), early majority (68%) where the innovation reach critical mass, and laggards (16%) (Rogers E. M., 1962, p. 150). The below figure show the diffusion of innovations designed by Rogers (2003), the blue curve (Bell-shape frequent curve) shows the consumers sequential sections following the new technology while saturation level showed in yellow curve (Cumulative S-shaped curve) with market share.
Both curves created by the same data, the innovation adoption by a member over a period of the social system. The blue curve shows the data in term of the quantity of people embracing every year while the yellow curve shows the cumulative data basis. (Rogers E. , 2003, p. 243). The S-curve adapter started very slow at the beginning due to the low adapter at that stage. Then it moves very fast until the half of the individuals of the adopted system. Then the adoption became slower with continuous incensement as little remaining people with adopting at the end. The diffusion of an innovation can be reduced because the uncertainty and role of information (Rogers E. , 2003, p. 244).
8
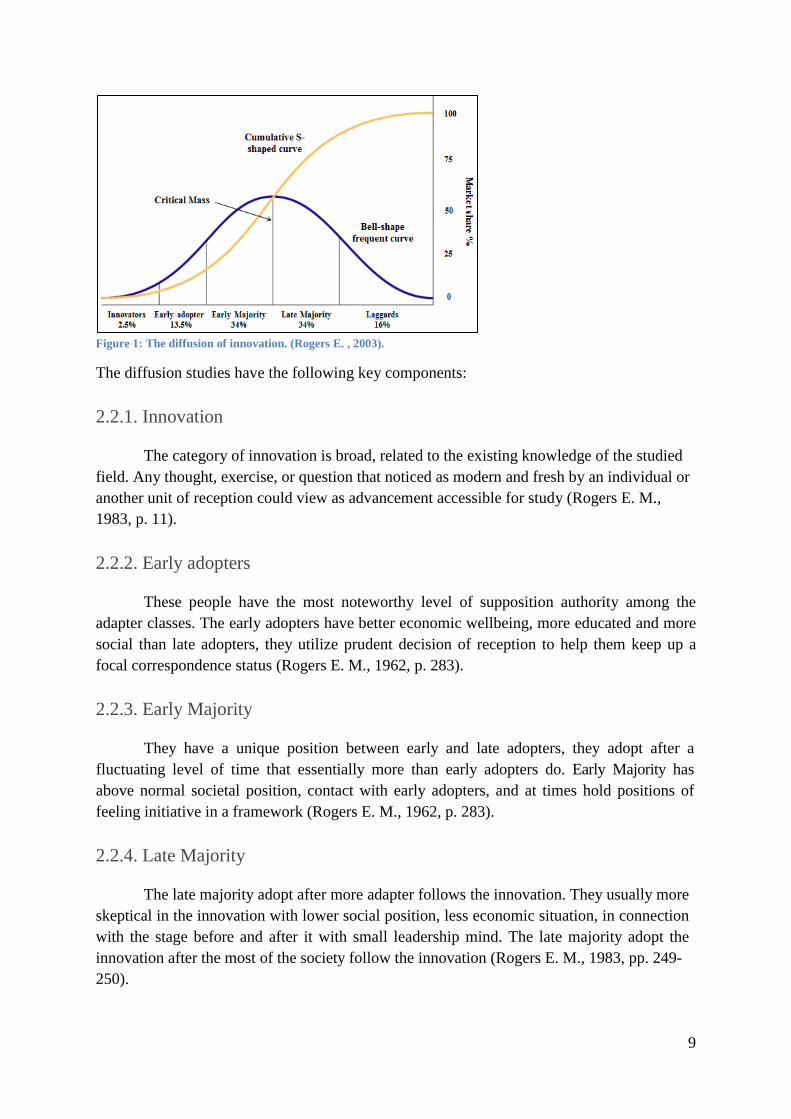
Figure 1: The diffusion of innovation. (Rogers E. , 2003).
The diffusion studies have the following key components:
2.2.1. Innovation
The category of innovation is broad, related to the existing knowledge of the studied field. Any thought, exercise, or question that noticed as modern and fresh by an individual or another unit of reception could view as advancement accessible for study (Rogers E. M., 1983, p. 11).
2.2.2. Early adopters
These people have the most noteworthy level of supposition authority among the adapter classes. The early adopters have better economic wellbeing, more educated and more social than late adopters, they utilize prudent decision of reception to help them keep up a focal correspondence status (Rogers E. M., 1962, p. 283).
2.2.3. Early Majority
They have a unique position between early and late adopters, they adopt after a fluctuating level of time that essentially more than early adopters do. Early Majority has above normal societal position, contact with early adopters, and at times hold positions of feeling initiative in a framework (Rogers E. M., 1962, p. 283).
2.2.4. Late Majority
The late majority adopt after more adapter follows the innovation. They usually more skeptical in the innovation with lower social position, less economic situation, in connection with the stage before and after it with small leadership mind. The late majority adopt the innovation after the most of the society follow the innovation (Rogers E. M., 1983, pp. 249-250).
9

2.2.5. Laggard
The final adopter of innovation, with very small to no leadership mind and they, usually have the lower economic position, older age adopters, with a small network connection with friends and family. The other name for this category can be traditional to describe the adopter in this category (Rogers E. M., 1983, p. 250).
2.3. Diffusion process
The process going through five steps process, it happens within the same social environment in network communication over time to create decision-making. These five stages of process are knowledge, (with access to innovation with limited information), persuasion (searching more about innovation information), decision (the evaluation stage of Accept/Reject which most difficult stage in the process), implementation (Identify the advantages and looking for more information), and confirmation (Final decision of continue using that innovation or not) (Rogers E. M., 1983, p. 272).
Figure 2: The five stages of the decision innovation process (Rogers E. M., 1983).
The five steps needed to accomplish tasks and gain development.
2.4. Business Life Cycle
The business life cycle is the life cycle of business from beginning to it is termination. Each stage has its own significance importance and describes the development of the new project. All industries have the same business life cycle, an organization in the same market have a variation of lifetime stages (Hisrich, R. D., Peters & M. P., 2002, p. 502). The sales development over time used to identify the life cycle. Life cycle stages are a start-up, early growth and rapid growth, maturity and end with decline. Usually, the first stage start with low sales level and sales increased in growth level. The maturity level reached after the rapid growth level and finally with sales decline the business can be terminated (Hisrich, R. D., Peters & M. P., 2002, p. 502). Below graph can describe the business life cycle for the new venture.
10

Figure 3: Business life cycle (Hisrich, R. D., Peters & M. P., 2002, p. 502).
The business life cycle stages define as the following stages.
2.4.1. Start-up stage
At this stage the business still in early establishment stage. During start-up stage, the working plan strategies are set within starting period (Audretsch D. , 1995, p. 442). The risk is very high at this stage based on unfamiliarity with the business. It is important to have plans with clear future strategies to ensure future success (Mullins, 2010, p. 22). The sales are low during this stage with high cost and no profit, which create enormous cost and risk, for that it is important to set a future plan and study everything before entrance (Porter M. E., 1980).
2.4.2. Growths stage
The Early growth: firm began to gain profits at this stage, it can take a long time to reach this stage between five to seven years from start-up stage (Audretsch D. B., 1995, p. 442). This stage described as a more developed stable stage. The market competitiveness is high at this stage with slow or lack of development in the concept of sales (Hisrich, R. D., Peters & M. P., 2002, p. 501).
Rapid growth: this stage is harder to enter into new ventures. Sales volume is satisfying and many firms will be delighted with sales augmentation at this stage without growth (Hisrich, R. D., Peters & M. P., 2002, p. 501). The entrant more desire to grow and developed at this stage. For that, more employees can hire to develop the business (Audretsch D. B., 1995, p. 442). As mentioned in the above figure, in this stage more sales can be achieved with cost reduction and gain more profits, and that motivate a business owner to response to the market by developing the business and move to the next level (Porter M. E., 1980).
11
2.4.3. Maturity
More stability to the business can notice at this level with solidity to market challenges. The firm can survive in this stage due to the scale of economic and can easily pass unstable market challenges (Audretsch D. B., 1995, p. 442). This stage is a more profitable stage with high development rates in sales, size, and competence (Hisrich, R. D., Peters & M. P., 2002, p. 502). As mentioned in the above figure, this stage more cost reduction, constant sales with more profits (Porter M. E., 1980).
2.4.4. Decline
The final stage of business life cycle is the easiest to reach. At this point, the business will retreat (Macpherson, A. & Holt, R., 2007, p. 175). Any business can fail down with big losses in sales and force the management to cut down the operations to minimize the losses (Hisrich, R. D., Peters & M. P., 2002, p. 504). In order to restart the business life cycle the firm management need to recreate itself and began the life cycle again (Audretsch D. B., 1995, p. 442), or sell everything and walk away. This stage came with a reduction in sales and profits while the cost remains constant (Porter M. E., 1980).
The previous studies argued, the significance of entrance barrier on prior theory has suggested that the importance of specific entry on entrants subsistence, and activities on business life cycle and the strategic entrance to new market. (Bain, 1956), (Stigler, 1968), (Porter M. E., 1980), (Hay, D.& Morris, D., 1991), ( Robinson & McDougal., 2001), (Pehrsson, 2009), and by different industries and products (Karakaya & Stahl., 1989), (Yang, 1998), (Karakaya, 2002), (Pehrsson, 2009). The business life cycle, structural type, and new market properties must be consider while a strategic plan is set for market entrance. The identification and awareness of business life cycle are vital for firms’ management planning to make entrance actions. Firms’ management can overcome difficulties through the early business life cycle, individual’s adequate controls by business development and will expect to fulfill the different roles (Bartlett & Bukvić, 2001).
The effect for de novo, the entry timing, and business life cycle are more important for small entrants than big entrants ( Robinson & McDougal., 2001). Previous studies finding were, in industries with high entrance barrier it is better to enter the market in early stages rather than later stages when entrance can be harder and costly ( Robinson & McDougal., 2001).
2.5. SWOT analysis
SWOT analysis is the instrument utilized for examination and Planning to assessing the components influencing on the accomplishment of business (Wanare, D. R. S., & Mudiraj, A. R., 2014). The SWOT used as a business instrument to highlight the diverse components influencing the business process, which the association plans to outline, actualize for accomplishing the mission and vision of the association. Albert S. Humphrey introduced the concept between 1960 – 1970, who was a consultant in the American business and
12

management (Wanare, D. R. S., & Mudiraj, A. R., 2014). The SWOT concept definition is strength, weaknesses, opportunities, and threats. The instrument distinguishes the inner and outside key variable, which is by all accounts extremely essential and vital to accomplishing the hierarchical objectives and destinations. The SWOT concept very important for the decision makers, define tangible and intangible market benefit, which help to make the decision.
Strength: attributes of the business or venture that give it favorable position over others.
Weaknesses: qualities that place the business or venture unfavorable with respect to others.
Opportunities: components that the business or venture could adventure further bolstering its good fortune.
Threats: components in the environment that could bring about the inconvenience for the business or venture.
In SWOT analysis, the internal factors are Strength and Weaknesses while the external factors are Opportunity and Threats. The next stage in SWOT analysis is creating a matrix listing all the variables which creating Strength, Weaknesses, Opportunities, and Threats to the organization (Wanare, D. R. S., & Mudiraj, A. R., 2014).
SWOT analysis offer investigate conceivable outcomes for new endeavors or answers for issues, Settle on choices about the best way for your drive and have a clear picture regarding barriers and obstacles, define the possible changes in an effective way and set future plans to the predicted threats and opportunities (Box, 2015). Strength and Weaknesses described as internal factors related to the firm itself while the external factors, which are the Opportunity and Threats related to the market, on other words Strength, Weaknesses can connect to obstacles by the firm, Opportunity, and Threats connected to barriers. The firm with proper firm Strength and market Opportunity creates golden results, firms with firm Weaknesses and market Threats creates barriers and stop the operations.
2.6. Barriers to Growth and Development
The entrance barriers can be identifying in early stages in most cases, but more knowledge must be chaining to define the barriers. The influence of barriers to growth and development and the number of these barriers must be identifying to conduct the development.
Barth (2004) mentioned, “Various characteristics can describe growth such as management style, organizational structure, formal system, strategy development and change as the firm passes through many stages or phases.” The revolutionary period’s changes related to external and the internal condition is characterized “the critical task for management in each revolutionary period is to find a new set of organization practices that will become the basis for managing the next period of evolutionary growth” (Barth, 2004, p. 13).
13
In order to avoid “Growing pains” (Flamholtz, 1986) well-planned strategies needed to develop the firm's, avoiding difficulties in early stages and plan ahead. To transfer a firm from entrepreneur to a professional managed organization, minimum four key characteristics prevent the firm from changing. As (Hofer, W.C & Charan, R., 1984) argued; “1- a highly centralised decision making system, 2- an overdependence on one or two key individuals for firm survival and growth, 3- an inadequate repertoire of managerial skills and training, 4- a paternalistic atmosphere.”
Barriers to growth and development related to entrance barrier if the firm operate in the same atmosphere and tried to launch new organization activity with new market or new segment, as described by Barber et al, the main points can be brief to three main points: 1- motivation and management, 2- market structure and opportunities, 3- resources. The motivation to enter a new market can interpret as pull force that attracts a new company to enter a new market, which related to a management decision to take that step to expand the firm and develop it (McGee, 1989). Also, the resources are an important part of the market entrance, which not means financial resources only, but skilled labor and technology (Bosworth & Jacobs., 1989), (Rothwell & Beesley, 1989). The technological resources play a significant role in entrance barriers and development. A firm can avoid barriers by reducing the level of technology, which results in slow growth (Bosworth & Jacobs., 1989). McGee (1989) argued that sustained growths of new market or products needs to be combine with new skills and structure in the firm.
The entrance barriers can define in different ways and aspects, it could be inside the organization environment or external. Nevertheless, a general definition for barriers can describe as an obstacle to reach the goal or to accomplish the mission.
2.7. Definition of obstacles & barriers
To identify market obstacles and barriers it is important to illustrate the two concepts and understand each principle, also, it considered to be important characteristics when design market entrance strategy. For that, an analysis of market difficulties must be practice, the identification and illustration of obstacles and barriers can easily perform. In the perfectly competitive markets, an absence of entrance barriers can notice, within such market environment firms can easily enter and exit the market seeking financial gain, for that firms operating in such market environment cannot make a financial gain (Roberts, 1989).
Obstacles define as object create hardness to accomplish something, something you have to remove or pass, or something that stops the progress (Webster´s, 1994). Understanding the obstacles can create preferable business strategies before and after launch, identifying the obstacles can help to set prior plans for easily overcome these obstacles (V. Auken, & E. Howard,, 1999). The business entrance process starting with evaluating the market status and analysis the value outcome for market entrance, if the value outcome lower than the investment cost then more information need to be collected and studied again or ending the process (V. Auken, & E. Howard,, 1999).
14

In order to overcome entrance obstacles, it depends on the business obstacles and the individual characteristics. The business entrance can be affected by the target and characteristics of the individuals (Starr J & Fondas N, 1992), business condition (Bird, 1992), existing of sources (E Hansen & K Allen, 1992), the market opportunity (Bhave, 1994). The shortage of any of these factors can identify as an obstacle to market entrance, for that the new entrants must have the proficiency to overcome these obstacles (V. Auken, & E. Howard,, 1999). Without the necessary proficiency these obstacles can build barriers that cannot overcome, the barriers more solid and harder to overcome, some obstacle can overcome while other obstacles harder or not possible to overcome then it can define as barriers.
The barriers comprehend can be “a material object of set of objects that separates or marks off or serves as a barricade, something immaterial that separates (language barrier between people), a factor (such as canyon or lack of food) that keeps organisms from interbreeding or spreading into new territory” (Webster´s, 1994, p. 315). In relative aspects, more barriers can define, and these barriers prevent firms from growth and development, these barriers can be market opportunities and structure, as well as motivation, resources and management. (Barber, J., Metc.alfe, J. S. & Porteous, M, 1989).
The concept can divide into operational and conceptual aspects. Barth (2004) defines these concepts “The conceptual definition describes the concept by, for example, using other concepts, while the operation definition is empirical in nature and serves to measure the concept” (Barth, 2004, p. 26). The predominantly definition of barriers is operational (Barber et al., 1989). While the conceptual aspects usually ignored, the one, which gives an idea about qualities and attributes of barriers, these barriers, can prevent firms from entering a new market or prevent firms from development and growth.
“Barriers also can be defined as external and internal the firm, the three most important external barriers was 1- it is too easy to copy innovations, 2- government bureaucracy, 3- lack of government assistance, while the most important internal barriers were 1-lack of time, 2- inadequate research and development, design and testing within the firm, 3- inadequate financial means”. (Barth, 2004, p. 29). Also (Pihkala, T., Ylinenpää, H. & Vesalainen, J, 2002) defined eight exploratory factors to innovation barriers which are, 1- employment policy barrier, 2- financial barriers, 3- tax barriers, 4- legislative barriers, 5 risk-propensity barriers,6- competence and information barriers, 7- external support barriers, 8- market competition barriers (Barth, 2004, p. 29).
15
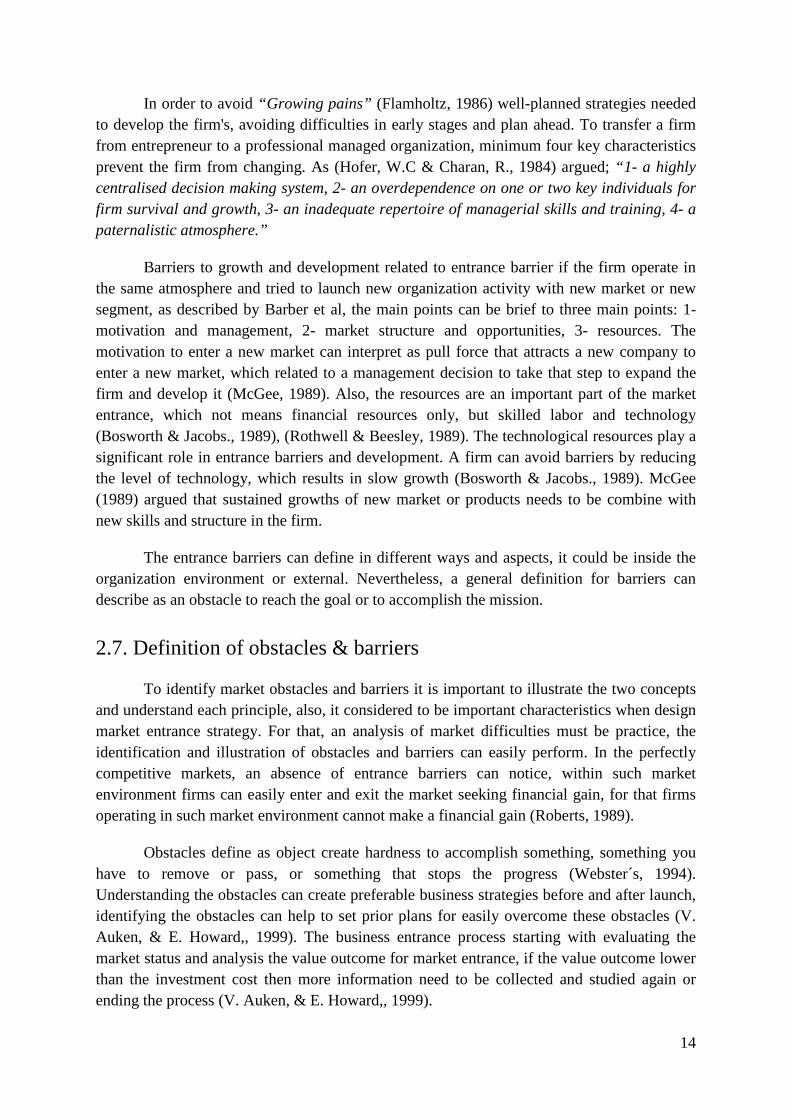
Figure 4: Main internal/external and intangible/tangible barriers. (Barth, 2004, p. 68)
As mentioned before two type of barrier can be identified (external and internal) barriers also these barriers can be tangible and intangible barriers. The deficiency of planning for strategies and accounting system related to internal and tangible barriers, which mainly created because of the high initial cost, long payback time, and shortage of venture capital. The deficiency of management skills with a shortage of capabilities and resources related to internal and intangible barriers, which created because of easily copied by competitors. The deficiency of government support, institutional factors, and bad tax system. Which created because of the small domestic market, high social insurance, high-income tax and a shortage of government support? Finally, the deficiency of appropriate business network, learning program and culture aspects, which created because of external and intangible barriers, which created because of national inclination towards resentful attitude to successful businessmen, national inclination to get a job with secure future and could be the education system motivate people to get a job (Barth, 2004, pp. 63-68).
2.8. Barriers to Entry
By hypothetical information, obstructions to passage characterized as components that utmost rivalry by a forestalling market section of new organizations. These boundaries can be either basic or key; the mechanical association research convention has unequivocally centered on the basic obstructions coming from the qualities of industry structure while the vital hindrances examined in the vital administration stream as an asset for making upper hand for the officeholders in the commercial place. The two exploration streams are reciprocal instead of opposing.
16
The modern association view takes the business as the unit of examination and spotlights on the basic qualities of an industry and the business on-screen characters' responses to these attributes. Bain (1956) centered his thoughtfulness regarding the qualities of the business sector that prevent passage from new rivalry and permit the occupants to win above typical benefits without actuating section. Stigler (1968) later extended Bain's perspective by including the enthusiasm for the post-section conditions and concentrated on the effectiveness of the occupants versus later contestants by characterizing a hindrance to the section as a differential cost that should be borne by later participants (Geroski, P., Gilbert, R. & Jacquemin, A., 1990). Likewise, later include contemplations for conduct as determinant for business sector execution, and business sector structure. In this manner underscoring that, the occupant techniques can influence the auxiliary attributes of an industry in the long haul. The basic obstructions in an industry can be any basic viewpoint that takes into account the officeholders to raise their costs over the base normal expense of the potential participants, along these lines hampering the potential section and diminishing rivalry (Han, J., N. Kim & H. Kim., 2001). These auxiliary elements can incorporate angles, for example, economies of scale, the level of innovation, total cost focal points, or administrative regulations present in an industry (Asikainen, 2012, p. 14).
There are numerous commercial ventures where the hindrances to section are high because of the auxiliary qualities of the business, for example, in a few oligopolies that have a high promoting force (e.g. cigarette industry), or high innovative hindrances because of licenses (e.g. human services industry) (Blees, J., Kemp, R., Maas, J. & Mosselman, M., 2003). These industry structures are prone to serve the occupants in an industry, making boundaries passage for a new rivalry. The vital administration view (Porter M. E., 1980) concentrates on individual organizations as the unit of examination, and their methodologies on coming to enhance their execution and to locate a beneficial aggressive position in connection to others on-screen characters, for example, new participants. In this view, the on-screen characters are proactive and through their procedures can construct key hindrances to passage and influence their focused surroundings. Officeholder organizations will try to detail such techniques that will permit is to outstand the opposition from unrivaled execution. This, better esteem creation capacity alludes than as upper hand and unequivocally connected to the organization assets (Barney, 1991). By vital administration sees, the officeholders can utilize their unrivaled assets as a preference and make serious section obstructions to a hinder passage from the new rivalry. In this way, the key hindrances are an outcome from the occupants' conduct and passage dissuading procedures. These techniques may incorporate retaliatory activities by officeholders or other direct assaults towards the new participants, influencing both the passage choice and post-section execution of the contestants. In commercial enterprises, where the occupants have solid business sector forces, and awesome collected assets. They will probably have the capacity to increase manageable upper hands through techniques abusing their unrivaled asset base, that can just gradually and unreasonable be coordinated by the contestants, to prevent passage from new participants furthermore to make boundaries for development for different officeholders (Blees, J., Kemp, R., Maas, J. & Mosselman, M., 2003), (Asikainen, 2012, p. 15).
17
The two streams joined recommend that economies of scale, capital necessities, and item separation would be the most critical obstructions to section (e.g. Bain 1956; Hofer 1975; Porter 1980; Hay and Morris 1991; Pehrsson 2009; Lutz and al. 2010). Robinson and McDougall (2001) have further underscored in their exploration that item separation is the key boundary as far as post-passage achievement measured by gainfulness (Asikainen, 2012, p. 16).
2.9. Type of barriers & obstacles
Barriers to the business sector passage incorporate various diverse variables that limit the capacity of new contenders to enter and start working in a given industry (Porter M. E., 1980). An industry might require new participants to make huge interests in capital hardware or existing firms might have earned solid client loyalties that might be troublesome for new contestants to succeed. The others incorporate the force held by suppliers and purchasers, the current contenders and the way of rivalry, and the extent to which comparative items or administrations can go about as a substitute for those gave the business. Understanding their industry and reckoning its future patterns and headings give them the learning they have to respond and control their part of that industry. Kenneth (1994) explained “Since both we and our rivals are in the same business, the key is in finding the varying capacities in the middle of us and the opposition in managing the business drives that affect us. In the event that we can distinguish capacities, we have that are better than contenders, we can utilize that capacity to set up an upper hand” (Cook K. J., 1994).
The simplicity of entrance into an industry is vital in light of the fact that it decides the probability that an organization will confront new contenders. In commercial enterprises that are anything but difficult to enter, wellsprings of upper hand tend to disappear rapidly. Then again, in commercial enterprises that are hard to enter, wellsprings of upper hand last more, and firms additionally have a tendency to create more noteworthy operational efficiencies because of the weight of rivalry. The simplicity of passage into an industry relies on two components: the response of existing contenders to new contestants; and the hindrances to the market entrance that win in the business. Existing contenders are well on the way to respond emphatically against new participants when there is a background marked by such conduct when the contenders have put significant assets in the business, and when the business portrayed by moderate development (Cook K. J., 1995).
The following barriers are the main concentrated barriers in this study, based on previous barriers studies the following barrier have been identified based on four groups of barriers. The four groups of barriers & obstacles can internal or external barriers or tangible and intangible barriers, it can be a mix between internal, external barriers, tangible and intangible. More barriers can identify based on technology development and creation of new business segment with newly innovative products. The new entrants struggle to win a barrier passage to the incumbent, and in the following text, these barriers have identified and explained well.
18
2.9.1. Technical barriers & obstacles
These barriers can define as affect to the market entrance. A company starts up can initiate by few people, but company grows and development required more expert employees to cope with difficulties (Bartlett & Bukvić, 2001, p. 181). Higher entrance barriers imply that future benefits will more than balance the present expenses of the section. Being first or one of the early participants can minimize entrance costs furthermore here and there yield leverage in product output differentiation. In any case, if numerous different firms likewise enter early, this entryway might shut. In this way, the premium in such commercial enterprises is on moving early and afterward smoothen blocking the later entrance to the industry (Porter M. E., 1980, p. 345). In numerous business sectors and commercial ventures, set up contenders have increased client faithfulness and brand distinguishing proof through their long-standing publicizing and client administration endeavors. This makes a hindrance to the market entrance by constraining new contestants to invest energy and cash to separate their items in the commercial center and beat these loyalties (Porter M. E., 1980, p. 9).
The location is a vital determinant that can prompt auxiliary cost weaknesses in connection to the incumbents if the contestants need to move for a not exactly suitable area concerning the business, or an all the more immoderate one (Reijmer & van Noort, 1999). In new, quickly developing commercial industry, the aggressive structure is generally not settled and the expenses of passage might be substantially less than they will be for later participants. Presumably, no firm will have bolted up supplies of crude materials, made critical brand recognizable proof, or have much proclivity to fight back to an entrance. Going firms might confront limits on the rate at which they can grow. In any case, a firm ought not to enter another industry since it is in another industry. Entrance will not be defend unless a full auxiliary examination prompts the forecast of benefits for a period sufficiently long to legitimize the speculation. It is likewise critical to note that in a few commercial ventures the expense of section for pioneers is more noteworthy than that for firms entering later in light of the expenses of spearheading. At last, different participants might well be perspective into another industry and with the end goal. It should anticipate that benefits would stay high. The firm should have some monetary premise for trusting that later contestant will confront entrance costs higher than its own (Porter M. E., 1980, p. 345).
However, the entrepreneurs usually have the unwillingness to leave leadership to expert managers (Storey, 1994). Competence barriers can found in the same organization, which raises the barriers. Deficiency of talented work prompts lacks in human capital, which is important to run the operations (Gerlach & Wagner., 1994). The firm can fail to grow and build strategies because of non-qualified staff with proper knowledge and right skills to help the firm pass through barriers (Audretsch D. B., 1995, p. 440). However, the skilled staff very important but the officeholders can build the business wage rate, creating costly entrance because of the relative work power of their operations and their absence of economies of scale (Gollier, 1991). The technical lead gives favorable position to officeholders as the contestants require vast ventures to achieve the same level of technical leads (Karakaya & Stahl., 1989). The deficient information and knowledge regarding industry can create wrong
19
entrance strategies that create a high cost of entry and strength the entrance barriers (Schmalensee, 1982), (Prabhu & Stewart, 2001), (Karakaya, 2002).
High investment in research and development can make a higher barrier for incumbents to enter the market (Harrigan K. , 1981), (Karakaya, 2002). The in-house manufacturing can create high market competition (Porter M. E., 1980). The internal development can help in the market entrance, by making of another business element in an industry, including the higher capacity of production, dissemination connections, the strength of sales, etc. Similar economic issues can create in joint ventures, as they are likewise recently started substances, the effort variation between partners is not clear. In internal development, it is important to estimate the possible action by the incumbent and the structural barriers entry for that industry. This type of entrance is the costly entrance, with the potential risk of the incumbent firms (Porter M. E., 1980, p. 340). Another component regularly disregarded is the impact the participant's new limit will have on the supply-request equalization in the business. In the event that the interior contestant's expansion to industry limit is huge, its endeavors to fill its plant will imply that in any event some different firms will have abundance limit. High settled expenses are prone to trigger value slicing or different endeavors to fill limit that will endure until somebody exits from the business or until the overabundance limit wiped out by industry development (Porter M. E., 1980, p. 341).
The high range of technological development can push away new players and increase the barriers to entering, the risk increases with lack of knowledge. The aggregation service or product creates a harder entrance for a new player with limited access to these goods (Nalebuff, 2004). On the other hand, slow technological development will lead to moderate uptake of new technology and make the entrance undesirable (Harrigan K. , 1981). Market power can be gained from the patent, which provides finite entry during the finite period (Harrigan K. , 1983), (Lutz, C., Kemp, R. & Dijkstra, S., 2010). High desire to spend and brand loyalty can deter entry offered by incumbent through product differentiation (Karakaya & Stahl., 1989).
A long-run unevenness between the expense of entrance and expected benefits might be available in a few industries in light of the absence of acknowledgment of this by the possible entrant. This circumstance might happen in "backwater" or mysterious, businesses, which do not go to the consideration of numerous, built up firms. It is vital to understand that market powers will be conflicting with the achievement of the entering firm to some degree. Where the prospects for entrance are great because of disequilibrium, the business sector will be sending the same signs to others, who will be inclined to enter also. Along these lines, a choice to entering must convey with it some reasonable thought of why the contestant and not different firms will profit from disequilibrium. The early observation of disequilibrium usually helps to predict the interest of early entrance. Barriers must be created by an entrant to prevent rivals from imitation (Porter M. E., 1980, pp. 345-346).
20

2.9.2. Administrative barriers & obstacles
The dynamic limit pricing can create barriers to entering the market by reducing profitability, setting the price to the average cost of the most effective possible participant (Bain, 1956), (Gaskins, 1971). The setting of political relations and resources will support incumbents and create vulnerable entrants (Frynas, J.G, Mellahi, K, Pigman & G.A., 2006). The entrance cost can be increased and delayed due to administrative encumbrance created by external and internal bureaucracy barriers which make a significant increase to the transaction costs (Hall, 1992), (Karakaya, 2002), (Blees, J., Kemp, R., Maas, J. & Mosselman, M., 2003). The economies of scale can increase due to restricted governmental policies, entrance barriers created based on existing of the incumbents, capital requirement, and other barriers, which deter entry (Porter M. , 1985). The government support for the incumbents will create asymmetry in the cost of new entrance to the market compared to the incumbents (Karakaya, 2002). The administration decisions made by the government have a great effect on entrance barrier. Demsetz (1982) mentioned that lowering entrance barrier to market by government create better social welfare. In the long run, industry barriers can be affected by policy decisions, that define the important role of governmental administration (Blees, J., Kemp, R., Maas, J. & Mosselman, M., 2003). The governmental support and policy can be a motivation for new market entrants. Successful government policies create an environment-friendly market, which softer the market entrance for new players and structural barriers. A large number of entrance additionally connected with developments and expansions underway proficiency for the business overall (Friedman, P. & Taylor, B., 2011). Newmarket entrance and firms development create competitiveness in the market, which positively affect the social and economic welfare (Lutz, C., Kemp, R. & Dijkstra, S., 2010), (Prantl, 2012).
The governmental scientific categorization of innovation tools has been identifying by Edler and Georghiou (2007). More concentration has been on the supply side measures, including charge impetuses, government backing and financing for innovative work and open part examine, preparing programs, systems administration, and data dispersion support. In the late years, it has noticed that the market request is a prime motivator for innovation while no effect of public policies has noticed. Previous studies has demonstrated that people purchase power motivate innovation, makes considerably more prominent innovation motivating forces and in more ranges that the conventional measures, the R&D appropriations, for example, being a fundamentally more productive innovation jolt than any governmental sponsorships (Geroski P. A., 1995), (Edler & Georghiou, 2007), (Cullman, A., Schmidt-Ehmckey, J.& Zloszystiz, P. , 2012).
Friendly innovation environment basement created and more effective innovation development motivated and affected by public purchase power (Edler & Georghiou, 2007). Elder and Georghiou (2007) defined three effectiveness of public purchase power, innovation and competitiveness motivation and more market entrance, asymmetries between buyer and supplier create asymmetries between new entrants and incumbents, also increase innovation
21
level of new entrants, minimizing risk, increase knowledge and fast reaching economies of scale. Finally, deciphering market needs describing public demands.
Governmental policies motivate competitiveness between firms operating in the industry, which result in financial and social development in the operation area (Porter, M.& Kramer, M.R., 2011). Anti-trust policies divers against a particular measure, to the point of guarantee a level of rivalry in industry. The government have the ability to reduce and increase the barriers, equalization the asymmetries between new entrants and incumbents by e.g. control resources, equal access to distribution channels, reducing switching cost for customers by blocking extra switching can be created by incumbents (Blees, J., Kemp, R., Maas, J. & Mosselman, M., 2003). Steady government wakefulness is required as incumbent always can find a new way to prohibit new entrant to the market (Hermans, R., Kamien, M., Kulvik, M., Löffler, A.& Shalowitz, J., 2009). The entrance barriers influenced by (government, incumbent, entrants), the government can structure the barriers in the long term (Blees, J., Kemp, R., Maas, J. & Mosselman, M., 2003), (Friedman, P. & Taylor, B., 2011).
2.9.3. Market environment barrier & obstacle
The aggregate knowledge of the incumbent organization creates sustainable competitive advantage, experience and organizational capabilities through time very important providing advantage to new entrance (Spence A. , 1981), (Devinney, 1987), (Lieberman, 1987), (Hall, 1992), (Madhok, 1996), (Karakaya, 2002), (Lutz, C., Kemp, R. & Dijkstra, S., 2010). The control and access to strategic resources provide advantages to the incumbents compared with new market entrants, create higher barriers to enter the market (Grant, 1991), (Gaynor & H. Wilson, 1998), (Karakaya, 2002), (Blees, J., Kemp, R., Maas, J. & Mosselman, M., 2003). Government arrangements can confine or keep new contenders from entering commercial enterprises through authorizing prerequisites, limits on access to crude materials, contamination gauges, item testing regulations, examination laws, environmental standard. The incumbent has control over the distribution channels and can prevent new entrance reaching these channels with minor access to sales channels (Porter M. E., 1980), (Porter M. , 1985), (Robertson & Gatignon, 1991), (Karakaya, 2002).
The buyer inertia might prompt a kind of imposing business model circumstance rather than competition, constraining participant to spend intensely to beat the incumbents´ solid brand (Netter, 1983), (Krouse, 1984), (Gaynor & H. Wilson, 1998), (Karakaya, 2002), (Blees, J., Kemp, R., Maas, J. & Mosselman, M., 2003). Casual ambiguity can keep potential contestants from learning from incumbents and the business sector since it create difficulties to comprehend the connection in the middle of assets and competitive advantage (Reed & Defillippi, 1990), (Mosakowski, 1997), (McEvily, S.K., Das, S., McCabe, K., 2000), (Alvarez & Busenitz, 2001), (King & Zeithaml, 2001).
In numerous businesses, build up contenders control the intelligent channels of conveyance through long-standing connections. To convince conveyance channels to acknowledge another item, new participants regularly should give impetuses as value rebates,
22

advancements, and helpful publicizing. Such uses go about as a boundary by lessening the productivity of new participants (Porter M. E., 1980, p. 10). The cultural distance creates high exchange costs for foreign entrants because of various mentalities differentiation, inclinations and methods for doing things (Blees, J., Kemp, R., Maas, J. & Mosselman, M., 2003). Solid customer reliability for occupants´ brands can make an asymmetry of expenses between the incumbents and the entrants. Customer faithfulness can likewise be conveyed by incumbents to drive away possible entrants (Robertson & Gatignon, 1991), (De Ruyter, K., Bloemer, J. & Wetzels, M., 1998), (Karakaya, 2002). The incumbents have a level of restraining infrastructure control over their repeat buys because of the high exchanging costs, entrants would need to contribute vigorously to overcome such an obstruction (Farrell & Shapiro, 1988), (Klemperer, 1992), (Karakaya, 2002).
Incumbents have a level of restraining infrastructure control over their rehash buys because of high exchanging costs contestants would need to contribute vigorously to overcome such an obstruction. Incumbents can likewise profit by sharing of the organization brand between divisions (Schwartz & Thompson, 1986), (Veendorp, 1991).
Auxiliary types of plant under-use as an aftereffect of repeating interest or economies of scale will prompt over-supply to the business sector and drive the prices down, creating higher barriers to the market entrance (Spence A. , 1977), (Harrigan K. , 1983), (Lieberman, 1987). The exclusive deals with customers will postpone the possible sales. Mostly the customers make a purchase from the same supplier (Gaynor & H. Wilson, 1998). Potential incumbent by retaliation as both social affair sufficient response to conceivable contestant and conveying solidly about expected retaliatory activities can prevent new players from enter the business sector (Robertson & Gatignon, 1991), (Gatignon, H., Robbertson, T.& Fein, A., 1997), (Clark & Mongomery, 1998), (Gaynor & H. Wilson, 1998), (Karakaya, 2002). Bigger commitment and the additional investment required by a new entrant to compete with incumbent when vertical integration present in business model (Williamson, 1996). The incumbent wide product assortment to the customer makes barriers for new entrants’ products (Giraud-Héraud, Hammoudi & Mokrane, 2003).
2.9.4. Economical barrier & obstacle
High revenue gain by incumbents provides strength based on high-profit margins (Karakaya, 2002). The cost advantage of incumbents´ to new entrants´ high cost of manufacturing creates higher entry barriers (Bain, 1956), (Salop & Scheffman, 1983), (Gaynor & H. Wilson, 1998), (Karakaya, 2002). Porter set a balance between entrance cost and benefits, 1- New business entrance required investment cost, 2- Passing incumbent structural barriers required more investment, 3- The entry revenge is expected by incumbent, 4- Finally, that will pay off with more cash flows after the market entrance (Porter M. E., 1980, p. 341). Numerous capital-planning medications of the section choice disregard one or a greater amount of these components. For instance, time after time the budgetary investigation accepts the business costs and costs winning before section and measures just the obviously noticeable ventures important to the business. Overlooked are the most
23

inconspicuous expenses of overcoming basic passage boundaries. Likewise, a new section can raise the costs of rare supplies, hardware, or work, which implies that the entering firm should bear higher expenses (Porter M. E., 1980, p. 341).
Because assets specificity particular cannot sell, and changed over, high risk of losses can happen if fail occurs during market entrance (Williamson, 1996). Based on the apparent danger of financiers and investment danger, it is less demanding and less expensive for incumbents to gather financing than it is for new entrants (Dixit, 1980), (Porter M. E., 1980), (Demsetz, 1982), (Veendorp, 1991), (Kleijweg & Lever, 1996), (Karakaya, 2002). A more basic and less dangerous circumstance where market strengths do not nullify the engaging quality of entrance is an industry in which not all organizations confront the same entrance costs. Porter (1980) mentioned, “Overcome structural entry barriers into an industry more cheaply than most other potential entrants, or if it can expect less retaliation, a firm can reap above-average profits from entry”.
The capacity to overcome basic entrance obstructions more efficiently than other potential participants, for the most part, lays on the vicinity of benefits or aptitudes drawn from the contestant's current organizations or on developments that give a vital idea to entrance. In the event that numerous other potential participants have the same favorable circumstances, then these points of interest will most likely as of now reflected to decide at the advantages and expense of entrance (Porter M. E., 1980, pp. 347-348). Another economic barrier is the capital demand, as some market entrance required high capital resources and that create high barriers in intensive industries (Bain, 1956), (Eaton & Lipsey, 1980), (Porter M. E., 1980), (Harrigan K. , 1983), (Karakaya & Stahl., 1989), (Kleijweg & Lever, 1996), (Karakaya, 2002). The local incumbent has the cost advantages to the new foreign market entrance because of the high transaction costs of operating in foreign markets (Barkema, Bell & Pennings , 1996). The decrease of circulation and production cost per unit of yield prompts asymmetries of expenses. Incumbents can raise the supply to reduce prices under cost to create higher barriers for new entrants (Bain, 1956), (Modigliani, 1958), (Stigler, 1968), (Karakaya, 2002).
Economies of scale happen when the unit expense of an item decreases as generation volume increments. While existing rivals in an industry have accomplished economies of scale, it goes about as a hindrance by driving new contestants to either contend on a huge scale or acknowledge a cost weakness keeping in mind the end goal to contend on a little scale. There are likewise various other cost points of interest held by existing contenders that go about as obstructions to the market entrance when they cannot be copied by new entrants. Another kind of hindrance to market section happens when new participants are required to put substantial budgetary assets with a specific end goal to contend in an industry. For instance, certain commercial enterprises might require capital interests in inventories or generation offices. Capital prerequisites frame an especially solid boundary when the capital is required for hazardous ventures like innovative work (Porter M. E., 1980, pp. 9-10)
Marketing expenses are sunken expenses, and successful marketing needs a huge least scale. High common levels of marketing make the extra cost for new entrants that settled for
24
every level of yields. Strong incumbents have lower marketing expense per product because they have a scale of economies while entrant has higher expense per product. On the other hand, marketing reduce the customer product knowledge, new entrants need to spend more in marketing to be equal with incumbents product knowledge (Harrigan K. , 1983), (Karakaya & Stahl., 1989), (Gaynor & H. Wilson, 1998). Different responses of existing firms might acceleration in advertising exercises, exceptional advancements, and augmentation of guarantee terms, less demanding credit, and item quality upgrades. Plausibility is that an entrance will trigger a round of over the top limit extension in the business, especially if the new contestant comes in with more avant-garde offices than a few occupants have. Commercial enterprises contrast in their precariousness with respect to limit extension. Occupants will counter to a passage in the event that it pays to do as such in light of financial and non-economic contemplations (Porter M. E., 1980, p. 342). High marketing plans by incumbents might build client devotion and expansion client exchanging costs which make the market less alluring to be entered by new players because of the high cost to enter (Gatignon, H., Robbertson, T.& Fein, A., 1997), (Karakaya, 2002). Nonetheless, in a moderately developing market, this will be particularly unwelcome in light of the fact that it might include a drop in total deals, and lively countering is likely. In the event that the business sector is developing quickly, occupants can proceed solid budgetary execution despite the fact that a participant takes some piece of the overall industry, and limit included by the contestant is all the more immediately used without obliterating costs (Porter M. E., 1980, p. 343). The normal benefit of firms in an industry relies on upon the quality of the five focused strengths: competition, substitution, dealing force of suppliers and purchasers, and passage. The entrance goes about as parity in deciding industry benefits. In the event that an industry is steady, or in balance, the normal benefits of participants ought to simply mirror the tallness of auxiliary boundaries to passage and the real desires of contestants about countering. On the off chance that the expenses of the section did not counterbalance the above-normal returns, different firms would as of now have entered and driven benefits down to the level where the expenses of the entrance and the advantages of section scratch off. In this manner, it will occasionally pay to enter an industry in balance unless the firm has exceptional focal points market powers are grinding away that takes out the profits (Porter M. E., 1980, pp. 344-345).
The incumbents in the high concentrated industry can control the market prices and control the entrance barriers (Bain, 1956), (Karakaya, 2002). The incumbents increase the entrance risk by increasing costs both transactional and operational for a new entrant (Hochberg, Ljungqvist & Lu, 2010). A changing cost allows to a one-time cost that acquired by a purchaser as consequence of changing from one supplier's item to another's. A few cases of exchanging expenses incorporate retraining workers, obtaining bolster gear, enrolling specialized help, and overhauling items. High forcing to exchange costs shape a compelling entrance obstruction, new contestants, to give potential clients motivating forces to receive their items (Porter M. E., 1980, p. 10). Costs that cannot be recovered however are expected to enter the business sector can be a huge boundary to the passage, particularly if the required venture is huge (Gaynor & H. Wilson, 1998), (Karakaya, 2002). High exchange costs included in business sector trades particularly if there are numerous partners (Williamson &
25
Ghani, 2012). Porter (1980) suggested one of the following points could be the reasons for market entrance; the unbalance of industry, expected moderate or insufficient revenue from incumbent, lower entrance cost, special capacity by entrant to affect the industry structure, possible effect on entrant current business (Porter M. E., 1980, pp. 344-345). Porter (1980) mentioned that, cheaper solutions could follow for easier entrance. Following new technology, bigger production to gain larger scale of economies, more developed technology, and cooperate with the incumbent. Sacrifice the short run profits to win the market segment to the incumbents, better quality product or service for easier beat the product differentiation, targeting and finding new market segment, product marketing in new way, piggybacked distribution by using other business relationships to create distribution (Porter M. E., 1980, pp. 349-350).
26
Research methodology In this chapter, the research methodology utilized as a part of this study is presented
and the information accumulation techniques are reviewed.
3.1. Methodology
The definition of the methodology is an arrangement of strategies, tenets, or thoughts those are imperative in a science or craftsmanship: a specific methodology or set of techniques (Webster, 2011). This chapter describes the motivation behind this report, the Swedish sustainable energy market opportunities, and barriers for new actors. The aim of this research is to identify the barrier to Solar Swedish market and set a plan to overcome the barriers to entrance and future development.
Through the researcher literature review, various entrance boundaries discovered in different markets around the world. These barriers can restrain the firms’ entrance and future development. The definitions of barriers divided into four types, technology, and administration, environmental and economic barriers. These barriers were specified for solar companies in Sweden, and the barriers were mostly similar in most of the companies were interviewed. The exploration philosophy that researcher follow contains vital suspicions about the path in which the researcher see the world. The assumptions will be the foundation for the research where it can draw strategies and methods (Saunders, M, Lewis, P& Thornhill, A., 2009). The philosophical commitment is vital to be identified for economic researchers, more effect, and understanding on the investigation path based on selecting the research strategy (Johnson, P.& Clark, M., 2006). The concentration of certain obstacles in market entrance creates more knowledge development. Natural and business research is different, the differentiation in point of view between researchers on what ought to consider as adequate learning and nature of the social substance. This has raised the enthusiasm of specialist to convey to the per user theirs position in epistemological and additionally ontological thought as tended to beneath (Bryman & Bell., 2011, pp. 16-23).
The epistemological meaning knowledge, understanding, logos, it was used first by James Ferrier to describe the branch of philosophy concerned with the nature and scope of knowledge; it’s also related to the theory of knowledge which more concentrated on study the nature of the world, where the research is based on how we know, what we know, what knowledge? How do we gain it? How do we communicate it? What regarded as appropriate knowledge about the social world? Whether or natural science model is suitable for social world study? That explain why it has more focused on Knowledge Gathering process (Grix, 2004). In brief, it has referred to the study of knowledge and justified belief. “Based on researcher knowledge in renewable energy, and power production, the researcher epistemology existing to participate within research process.”
27
In fact epistemological related to the issue of answering the question of what is (or should be) regarded as acceptable knowledge in the field of research. Part of research question related to solar market future can answer based on epistemological concept.
The importance of regular association of epistemological position with that of social science confirmed by positivism (Bryman & Bell., 2011, p. 15), (Saunders, M, Lewis, P& Thornhill, A., 2009, p. 112). Positivism and interpretivism are the main two approached for epistemological. Is an epistemological position that supports the methods of the natural sciences and empirical testing in order to study the social reality and beyond (S.L., 2008, p. 16).
Positivism is generally a scientific approach that uses the methods that are highly organized, measurable and based on approaches taken by scientific researchers involved in researching the behaviors in the natural world. The researchers will not be involved with other in the research topic; instead, researchers will often use the observation and interviews as a method of obtaining information. Positivism is not equivalent to science and scientific, for that social science and natural science research or philosophy are not the same (Alan Bryman, Emma Bell, 2011, p. 16). Fisher (2007) mentioned, “Positivism holds that an accurate and value-free knowledge of things is possible. It holds out the possibility that human beings, their actions, and institutions can be studied as objectively as the natural world.” (Fisher, 2007, p. 17).
The researcher based on positivism situation follow an epistemological situation. A connection between characteristic sciences arranged ways to deal with sociology is conduct by the researcher. Testing of theories has conducted to participate in development and knowledge gain. The value-free science shall follow with identifying difference between personal belief, and scientific statements with the actual market contribution in this research (Alan Bryman, Emma Bell, 2011, pp. 16-19).
Weber (1947;88) in his definition explains that excellent researchers simply choose a research method that fits their purposes, and should avoid the external forces that have no meaning for those involved in the social action (Bryman & Bell., 2011, pp. 16-19). “The researcher has the knowledge in solar market and has his own opinion from personal observation to actual observation to solar market. The researcher based on positivism situation follows an epistemological situation.” A connection between characteristic sciences arranged ways to deal with sociology conducted by the researcher. Testing of theories has conducted to participate in development and knowledge gain.
3.2. Research Method
Bryman and Bell (2011) identified two types of research methods in business research, inductive and deductive methods. “Deductive theory represents the most common view of the nature of the relationship between theory and research. The researcher, on the basis of what is known about a particular domain and of theoretical considerations in
28
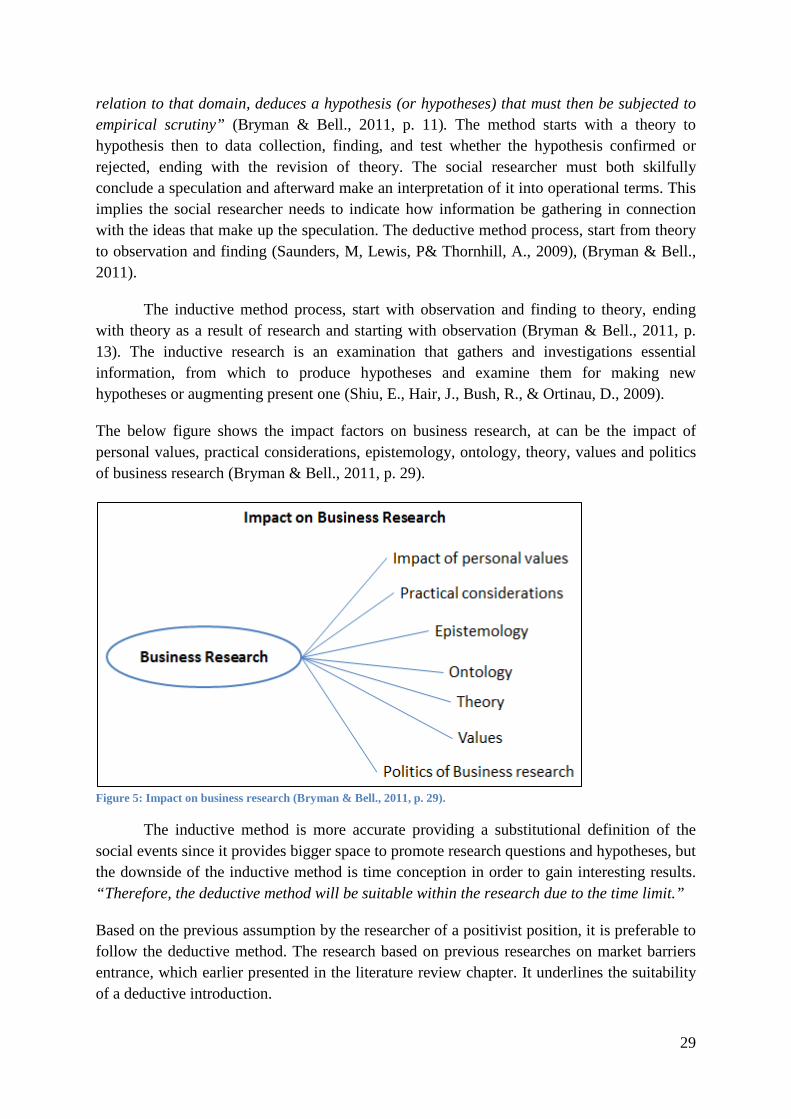
relation to that domain, deduces a hypothesis (or hypotheses) that must then be subjected to empirical scrutiny” (Bryman & Bell., 2011, p. 11). The method starts with a theory to hypothesis then to data collection, finding, and test whether the hypothesis confirmed or rejected, ending with the revision of theory. The social researcher must both skilfully conclude a speculation and afterward make an interpretation of it into operational terms. This implies the social researcher needs to indicate how information be gathering in connection with the ideas that make up the speculation. The deductive method process, start from theory to observation and finding (Saunders, M, Lewis, P& Thornhill, A., 2009), (Bryman & Bell., 2011).
The inductive method process, start with observation and finding to theory, ending with theory as a result of research and starting with observation (Bryman & Bell., 2011, p. 13). The inductive research is an examination that gathers and investigations essential information, from which to produce hypotheses and examine them for making new hypotheses or augmenting present one (Shiu, E., Hair, J., Bush, R., & Ortinau, D., 2009).
The below figure shows the impact factors on business research, at can be the impact of personal values, practical considerations, epistemology, ontology, theory, values and politics of business research (Bryman & Bell., 2011, p. 29).
Figure 5: Impact on business research (Bryman & Bell., 2011, p. 29).
The inductive method is more accurate providing a substitutional definition of the social events since it provides bigger space to promote research questions and hypotheses, but the downside of the inductive method is time conception in order to gain interesting results. “Therefore, the deductive method will be suitable within the research due to the time limit.”
Based on the previous assumption by the researcher of a positivist position, it is preferable to follow the deductive method. The research based on previous researches on market barriers entrance, which earlier presented in the literature review chapter. It underlines the suitability of a deductive introduction.
29

3.3. Data Collection
In any kind of academic research, data collection plays a prominent role to answer any kind of question and to find facts beyond the research. Quantitative and qualitative researchers are the two main methods of collecting data. The data collection process used in this research is the qualitative methods of analysis. The words emphasize call qualitative research (Bryman & Bell., 2011, p. 28). The qualitative method tends to concentrate on the gathering of point-by-point measure of the essential information from a relative specimen of subjects by monitoring conduct or asking questions (Shiu, E., Hair, J., Bush, R., & Ortinau, D., 2009, p. 173). For this purpose, a focused on the deductive approach planned. The deductive theory represents the specified view of the relationship between theory and research. The combination between inductive and deductive as a research approach, ontology, and epistemology, research hypothesis from a research perspective is called the strategy of the research (Bryman & Bell., 2011), (Saunders, M, Lewis, P& Thornhill, A., 2009).
A hypothesis deduced based on the amount of information available about the particular domain the hidden concepts within the hypothesis would decode into researchable entities. In order to deduce a hypothesis and decode it into researchable entities, a social scientist needs to specify that how the data is gathered in connection with concepts that make up the hypothesis. (Bryman & Bell, 2011, p. 11). This view of the role of theory in relation to research is very much the kind of role that Merton had in mind in connection with middle-range theory, which, he argued, “is principally used in sociology to guide empirical inquiry” (Merton 1967: 39). Theory and the hypothesis deduced from it come first and drive the process of gathering data.
Our topic of research is “The Swedish sustainable energy market: Opportunities and barriers for new actors”. Barriers and opportunities analyze shall be carried on for new actors entering the Swedish sustainable energy market, also identifying the barriers and obstacles related to the sustainable industry in Sweden. Initially, information gathering regarding the market and industry in general form then in details within Sweden, with relation to the current market and the promising future for solar power in Sweden, later literature analyze related to market entrance, market barriers, collaboration, and development.
General and details information collected in context to the main topic of the dissertation. In total, it provides benefits and support in the interest of the dissertation. Building base to the dissertation and following the structure to build a solid base, which provides a stable stand to achieve goals, data collection, is a persistent need in order to answer the research questions (Bryman & Bell., 2011). The researcher has designed specified related questions to be present, related to business administration, actual market and future predicted market.
30
3.4. Research design
Bryman and Bell (2011), defines the research design as “A research design relates to criteria that are employed when evaluating business research. It is, therefore, a framework for the generation of evidence that is suited both to a certain set of criteria and to the research question in which the investigator is interested.” (Bryman & Bell., 2011, p. 40). The research design is an incorporated explanation and avocation for the specialized choices included in arranging for research design (Blaikie, 2009, p. 15). The turning over of research questions into project defined as research design (Saunders, M, Lewis, P& Thornhill, A., 2009, p. 136). Bryman and Bell (2011) describe a different type of research design, the cross-sectional, experimental, comparative, and longitudinal and case study design (Bryman & Bell., 2011, p. 45).
The research design selected in this researcher will be a case study design as case study design in business and management as the case study goal is to concentrate on and legitimize the many-sided quality and specific nature from specified companies to get a better understanding of these companies (Siggelkow, 2007). A case study research can be, a single organization, single location, a person case study, or a single event (Bryman & Bell., 2011, pp. 59-60). The case study will be specifying on a certain subject of the researcher interest to get more information on the research consideration and process (Morris, T. and Wood, S., 1991). The case study also has the capability to create answers to the “Why, how and what” questions. That explains the reason behind renowned of a case study in exploratory research and explanatory. The techniques of collected data can be vary and could be a combination. Moreover, case study includes an observational examination of specific contemporary wonder inside of its genuine connection utilizing numerous origin of confirmation (Saunders, M, Lewis, P& Thornhill, A., 2009, p. 146). Two methods combination can create various types of data on the same subject (Denscombe, 2007).
“Based on the above explanation, the case study is in line with the research targets, the case studies investigates and review the barriers and obstacles to a new market or industry, the review on the solar market with identifying benefits and casualties within the solar market in Sweden.” The case study advantages are sought after the nearby association of the experts and manage genuine administration circumstances (Gibbert, M., Ruigrok, W. and Wicki, B., 2008). The questionnaire help collecting data that support and related to this research as secondary data support, helping identifying Swedish market entrance obstacles and future opportunities.
3.5. Information gathering method
The method of gathering information for this research divided into different stages. The data collection sequence started with identifying customer actually needs and opinion through questionnaire to customers, the customer response to questionnaire by mail or personal interview in person or through a phone call (Saunders, M, Lewis, P& Thornhill, A., 2009, p. 363). Total interview with 12 customers of three types of customers. The first type of
31
customers is the buyers, which already adopt the system, the second type is the thinker in adopting the system but still hesitate to take the decision, the final type is the rejected, which refuses to adopt the photovoltaic (PV) system.
From that point, the researcher identified the main obstacles and barrier for actual users, moving to the literature review of books, journal articles, doctoral dissertation, annual energy report, web sources, and report to identify the barriers types, different obstacles, and opportunity in Swedish solar market. From both types, the second stage started with a questionnaire to the firms operating and newly operating within the industry in Sweden, the questionnaire participation through personal interviews, phone interview, and mail.
The interview carried with firms operates in Sweden within the solar business. The interviewee is not reflecting the firm point of view but reflecting the interviewee opinion. Varmitek Energisystem and K-Utveckling recently started their photovoltaic department. While Rexel was in the market for a long time now, Nibe considered as big player in heat pump business in Sweden and over the globe, finally, PPAM operates in many locations over Sweden and has their own product.
3.6. Questionnaire design
The questionnaire structured and designed by the researcher based on the steps described earlier. The reason for the planned and organized survey was to get a reaction on what the analysts needs to document and guarantee inward legitimacy and in addition unwavering quality in the study (Saunders, M, Lewis, P& Thornhill, A., 2009, p. 371). The designed survey started with personal information within the solar market in Sweden by questioning the customers then relating these finding to the literature reviewed earlier then designing questionnaire to the firms operating in the Swedish market, the results of these steps result in achieving the research target.
The final questionnaire design based on four categories identified by the researcher, the first part was related to technological barriers, which include research and development in Sweden, manufacturing, low knowledge (both customers and employees), lack of expert. The second questionnaire part related to administrative barriers, which include low government support, unknown future support, government bureaucracy, low electricity prices and future electricity prices are unknown.
The third questionnaire part was related to market environment barriers, which include lack of competitions, buyer culture and customer logic. The last questionnaire part related to economic barriers, which include low sales, high initial cost, long payback time, and minimum import price.
The questionnaire has a limited number of the question due to researcher knowledge and experience in the field. However, the researcher aims to gain more details information to identify the solar energy barriers to the Swedish market. This will limit the research into these
32

four identified barriers, the researcher make sure all the observed items were included in this research, which connected into the questionnaire as well.
Finally, some interview conducted in Swedish language and translated into English or was mail interview. A researcher with consideration of explanation meaning, formal meaning, and grammar did which came back with limited, answers, interpretation of these interviews.
3.7. Interviews
The interview is the most widely employed method in qualitative research. Ethnography involves a substantial amount of interviewing which contributes to the widespread use of the interview. Qualitative interviews encapsulate two types of interviews, which called unstructured interview, and semi-structured interviews. (Bryman & Bell, 2011, p. 465). The method selected was the semi-structured interview for research topic “The Swedish sustainable energy market: Opportunities and barriers for new actors”. Interviews with the employees of solar companies in Sweden will be performing, asking questions related to the opportunities and fours identified barriers for the new entrants. A record for these interviews for consistent output, and make some more clarity. A semi-structured interview more controlled by the interviewer. Instead of a checklist, interviewers work from a script of prescribed questions, called an “interview guide” which sometimes has prompts that allow for limited flexibility. The interview guide allows the interviewer capability to follow new leads while also demonstrating that she or he is prepared and has the situation under control.
The interviewer will likely need to be able skilfully move between prescribed and unstructured questions in order to clarify responses or ask for elaboration if a participant seems to provide contradictory information. Thus, providing interview staff with training and practice beforehand is highly advisable. Semi-structured interviews are very useful tools for obtaining specific details about a topic that has already explored in unstructured interviews, or for comparing answers among a larger group of informants. This type of interview also works well in situations where the informant is accustomed to the efficient use of time, According to Bryman and Bell (2007, p. 465), the research process includes preparing for interviews, the transcription of interviews, analyzing transcripts, etc. It has also pointed out that no single interview stands alone in qualitative research. Qualitative research put more emphasis on greater generality in the formulation of initial research ideas and on interviewees’ own perspectives so approach tends to be much less structured. Qualitative interviewing is interested in the interviewee’s point of view and it is better for interviewers to remain aloof while seeking to extract information from the respondent. Going off at tangents is often encouraged in a qualitative interview to get insight into interviewee’s point of view. It is allow asking new questions by following up interviewee’s replies so the interview is more flexible (Bryman & Bell, 2011, pp. 466-467).
33
To start the interview, it is necessary to make a decision about which type of interview will use. Bryman & Bell (2011) “pointed out that unstructured interviewing approach be prefer when it is important to gain a genuine understanding of the worldviews of members of a social setting, or of people sharing common attributes. While semi-structured interviews are better to choose when there is a fairly clear focus or when more than one person is to carry out with the fieldwork or when doing multiple case study research” (Bryman & Bell, 2011, pp. 472-473). It is important to structure a request for an interview in a way, which can lead to a favorable response. A request for an interview might made by letter or telephone. Polite persistence is crucial and should always keep in mind. (Bryman & Bell, 2011, p. 473). To strengthen the dependability of research, a copy of the interview guide can provide to interest readers on request (Bryman & Bell, 2011, p. 473). Before interviewing, it is necessary to sample the interviewees. (Bryman & Bell, 2011, p. 489) Claim that lack of transparency is particularly apparent in relation to sampling. Issues of representativeness are less important in qualitative research since it aims to generate an in-depth analysis. Placing the restrictions may result in convenience samples (Bryman & Bell, 2011, p. 473).
3.8. Data Analysis
For the analysis of all the information gathered the researcher made the use of the multi-level approach. The researcher categorized most of the information gathered from both of the interviews, firstly interviews with customers and secondly interviews with firms, and then conducts the analysis for the availability of obstacles and barriers, and hurdles of barriers for the new contenders of the respective industry “sustainable energy sector.” After finalizing the analysis of these obstacles and barriers, the researcher proposes the implementation of the obstacles and barriers for the new contenders (actors) in the Swedish sustainable solar energy sector. Then these obstacles and barriers further decomposed into the four types of barriers and obstacles, and they all analyzed after this categorization. (Bryman & Bell, 2011).
34

Empirical Case Study The empirical data chapter will start by an overview of the country to identify the larger population areas with higher solar radiation and best potential customers. The market entrance is designated to Swedish solar market, the entrant must be aware of new market contain many aspects in order to be well prepared. The chapter describes the market development during the past few year based on actual number and report. It also includes clarification regarding the renewable power prices and support provided by the government including the total system cost support. Then it includes the five solar firms interviews, the researcher has clarified these interviews are reflecting the interviewee point of view and does not reflect the firm opinion.
4.1. Overview of Sweden
The kingdom of the Sweden is the fourth largest country in the European Union with area of 450295 Km2 and has a population that passed the 9.5 million mark in 2012. Sweden has a low population density with 21 inhabitants per km2, as the majority lives in Southern Sweden, Oresund region, along the western coast to central Bohuslan, in the valley of Lake Malaren and the capital city of Stockholm. Around 65% of Sweden, total land area is covered by forests and sparsely populated, with 15% of the territory being located north of the Arctic Circle (Lindahl J. , 2013). In 2011, Sweden ranked fifth among European OECD countries in terms of GDP per capita (USD 41242 per capital, PPP), after Luxembourg, Norway, Switzerland, and Denmark. In the 2008-2009 recessions, Sweden experienced a 7.5% decrease in its output but strongly recovered at the end of 2010, almost reaching pre-recession GDP levels. Sweden’s economy rebounded thanks to its strong monetary policies, exports, and structural reforms were undertaken in the aftermath of the banking crisis in the early 1990s (Lindahl J. , 2013, pp. 19-20).
Unlike many other OECD countries, in October 2012, Sweden was experiencing relatively favorable economic conditions, after the real GDP growth of 3.9% in 2011 and an estimated further 1.2% in 2012. Low grosses government debt levels and a 7.6% unemployment rate. Sweden’s very positive external trade balance was supported by its export-oriented industry, which contributed around 50% to the GDP, and was expected to support the country’s macroeconomic situation (Lindahl J. , 2013, pp. 19-20).
Sweden has leading engineering and manufacturing segments, such as motor vehicles, telecommunication, pharmaceuticals, industrial machines, precision equipment’s, chemical goods, home appliances, forestry, iron, and steel. The main challenge is to keep enhancing resilience and sustainable long-term growth in light of the persistent economic downturn and the impact on the Swedish export market (Lindahl J. , 2013, pp. 19-20). The development of energy policy rests with the central government, supported by several implementing national authorities and active local authorities. The county administrative boards, which represent the national government at the regional level, have an assignment from the government to
35
formulate regional energy and climate strategies in collaboration with regional actors (Lindahl J. , 2013).
Since 1995, the kingdom of Sweden has been the member state of the European Union. The EU framework sets legal requirements for the Swedish energy policy, In particular with regard to electricity and gas markets, energy efficiency, renewable energy, energy product taxation, state aid, and environment and GHG emission (Lindahl J. , 2013, pp. 19-20). Sweden cooperates closely with its Nordic neighbors including in the Nordic council of ministers and with other neighbors around the Baltic Sea region. On issues, such as the electricity market and infrastructure, in order to strengthen trade links between the Northern and the European internal energy market (Lindahl J. , 2013, pp. 19-20). However, 75 % of the Swedish workforce in the service sector, which count as the largest employer in the country (Kalin, 2012). Based on fast processing times and low bureaucracy in Sweden, make it very easy to start a new business in the most efficient country in the Nordic country.
Sweden is a global leader in renewable energy, environment technology, and Clean-tech. The country fully embraces green technologies and this area has a major business potential. Several hundred biogas plants provide electricity, heat, and fuel to Swedish cities. The goal is to reach a 50 percent share of renewable energy by 2020. Sweden is among the world's leaders within bioenergy use and technology. Moreover, Swedish research in photovoltaic technology is outstanding. In hybrid solar technology Swedish research and technologies are leading.
The market entrance can be a hard step to taken in Sweden based on well-developed industry, high quality and developed technology, non-stop product development, and high environmental awareness. Also, Swedish has high purchasing power and price awareness and customers used to get high-quality products and standard of living. Ethics and gender equalities are a strong orientation on the business-to-business market and the business to consumer. Entering the Swedish market required understanding business culture and commercial practices. An understanding is needed and no very wrong or right when it comes to business cultures. Business done differently following the Swedish way and that does not mean it is the right way to do business. (Kalin, 2012).
4.2. Swedish Solar Energy
Despite the fact of low solar radiation reached to Sweden, cold and dark winter, the potential is high to utilize solar power in Sweden, the potential is highly unused. By reduction of photovoltaics prices in recent years, more people attracted to install and invest in the technology. Since 2011, the annual expansion of photovoltaic cells connected to the grid in Sweden was more than double. If a comparison held between the solar energy with other renewable energy sources, a found that solar energy has a big opportunity to be, integrate directly into existing buildings, near the electrical demands by users. The normal Swedish villa roof can accommodate 5 times more energy than the household's total annual energy consumption. More people considering this solution to reduce the energy consumption
36
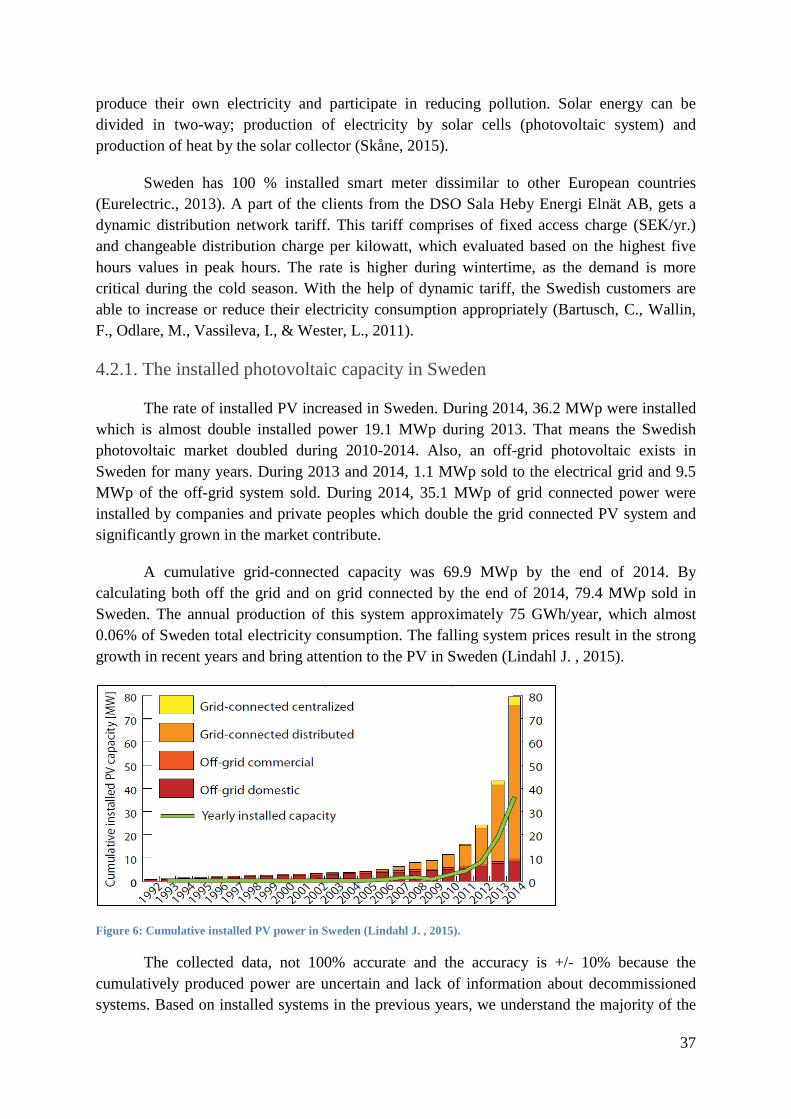
produce their own electricity and participate in reducing pollution. Solar energy can be divided in two-way; production of electricity by solar cells (photovoltaic system) and production of heat by the solar collector (Skåne, 2015).
Sweden has 100 % installed smart meter dissimilar to other European countries (Eurelectric., 2013). A part of the clients from the DSO Sala Heby Energi Elnät AB, gets a dynamic distribution network tariff. This tariff comprises of fixed access charge (SEK/yr.) and changeable distribution charge per kilowatt, which evaluated based on the highest five hours values in peak hours. The rate is higher during wintertime, as the demand is more critical during the cold season. With the help of dynamic tariff, the Swedish customers are able to increase or reduce their electricity consumption appropriately (Bartusch, C., Wallin, F., Odlare, M., Vassileva, I., & Wester, L., 2011).
4.2.1. The installed photovoltaic capacity in Sweden
The rate of installed PV increased in Sweden. During 2014, 36.2 MWp were installed which is almost double installed power 19.1 MWp during 2013. That means the Swedish photovoltaic market doubled during 2010-2014. Also, an off-grid photovoltaic exists in Sweden for many years. During 2013 and 2014, 1.1 MWp sold to the electrical grid and 9.5 MWp of the off-grid system sold. During 2014, 35.1 MWp of grid connected power were installed by companies and private peoples which double the grid connected PV system and significantly grown in the market contribute.
A cumulative grid-connected capacity was 69.9 MWp by the end of 2014. By calculating both off the grid and on grid connected by the end of 2014, 79.4 MWp sold in Sweden. The annual production of this system approximately 75 GWh/year, which almost 0.06% of Sweden total electricity consumption. The falling system prices result in the strong growth in recent years and bring attention to the PV in Sweden (Lindahl J. , 2015).
Figure 6: Cumulative installed PV power in Sweden (Lindahl J. , 2015).
The collected data, not 100% accurate and the accuracy is +/- 10% because the cumulatively produced power are uncertain and lack of information about decommissioned systems. Based on installed systems in the previous years, we understand the majority of the
37
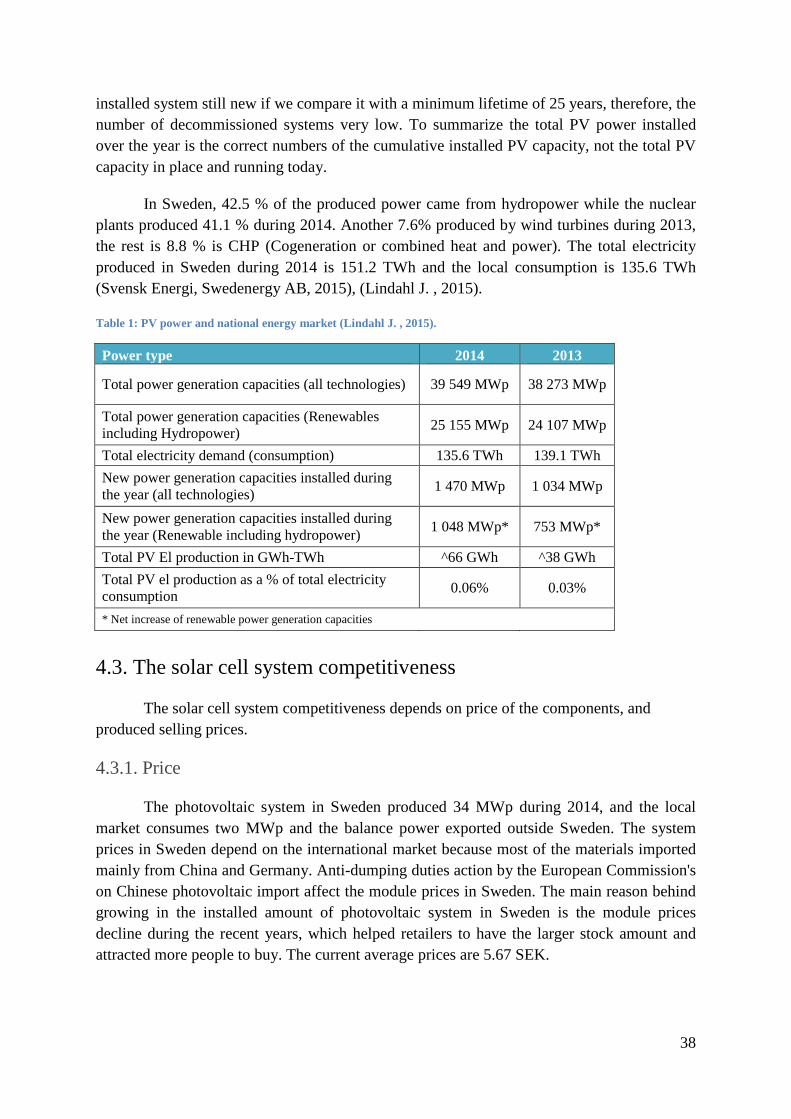
installed system still new if we compare it with a minimum lifetime of 25 years, therefore, the number of decommissioned systems very low. To summarize the total PV power installed over the year is the correct numbers of the cumulative installed PV capacity, not the total PV capacity in place and running today.
In Sweden, 42.5 % of the produced power came from hydropower while the nuclear plants produced 41.1 % during 2014. Another 7.6% produced by wind turbines during 2013, the rest is 8.8 % is CHP (Cogeneration or combined heat and power). The total electricity produced in Sweden during 2014 is 151.2 TWh and the local consumption is 135.6 TWh (Svensk Energi, Swedenergy AB, 2015), (Lindahl J. , 2015).
Table 1: PV power and national energy market (Lindahl J. , 2015).
Power type 2014 2013
Total power generation capacities (all technologies) 39 549 MWp 38 273 MWp
Total power generation capacities (Renewables including Hydropower) 25 155 MWp 24 107 MWp
Total electricity demand (consumption) 135.6 TWh 139.1 TWh New power generation capacities installed during the year (all technologies) 1 470 MWp 1 034 MWp
New power generation capacities installed during the year (Renewable including hydropower) 1 048 MWp* 753 MWp*
Total PV El production in GWh-TWh ^66 GWh ^38 GWh Total PV el production as a % of total electricity consumption 0.06% 0.03%
* Net increase of renewable power generation capacities
4.3. The solar cell system competitiveness
The solar cell system competitiveness depends on price of the components, and produced selling prices.
4.3.1. Price
The photovoltaic system in Sweden produced 34 MWp during 2014, and the local market consumes two MWp and the balance power exported outside Sweden. The system prices in Sweden depend on the international market because most of the materials imported mainly from China and Germany. Anti-dumping duties action by the European Commission's on Chinese photovoltaic import affect the module prices in Sweden. The main reason behind growing in the installed amount of photovoltaic system in Sweden is the module prices decline during the recent years, which helped retailers to have the larger stock amount and attracted more people to buy. The current average prices are 5.67 SEK.
38

Table 2: Module prices drop – SEK/Wp (Lindahl J. , 2015)
Year 2003 2004 2005 2006 2007 2008 2009 2010 2011 2012 2013 2014 Standard module prices:
70 70 70 65 63 61 50 27 19 14.2 9.7 8.15
Best price - - - - - - - - - - - - PV module price for concentration
- - - - - - - - - - - -
4.3.2. Prices of the system
The prices drop in photovoltaic panels support the price drop in complete system. The price of the system drop from 17 SEK/Wp (Excluding VAT) by the end of 2013, to 15 SEK/Wp by the end of 2014. In addition, an extrusive relation between the cost and the installed power as the price drop more when increasing the installed power, for example, the price could reach 13 SEK/Wp for system of 20 kWp.
Another reason, which reduces the labor, and cost margins is the growth of the market, which results in more order flow for the installation companies and makes the process simpler. In the same time, the competition increased during 2010 only 37 companies sold and installed the photovoltaic system in Sweden while the number increased to 126 Company by the end of 2014. In table 4 and figure 8 shows, the average price consideration of Swedish installer by the end of 2014, but it does not cover the overall pricing during 2014. Note the prices that the companies regard in figure 9 is typical for them and that the graph does not show the highest and lowest prices in Sweden.
Figure 7: Average typical prices for PV systems (Exl. VAT) (Lindahl J. , 2015).
39
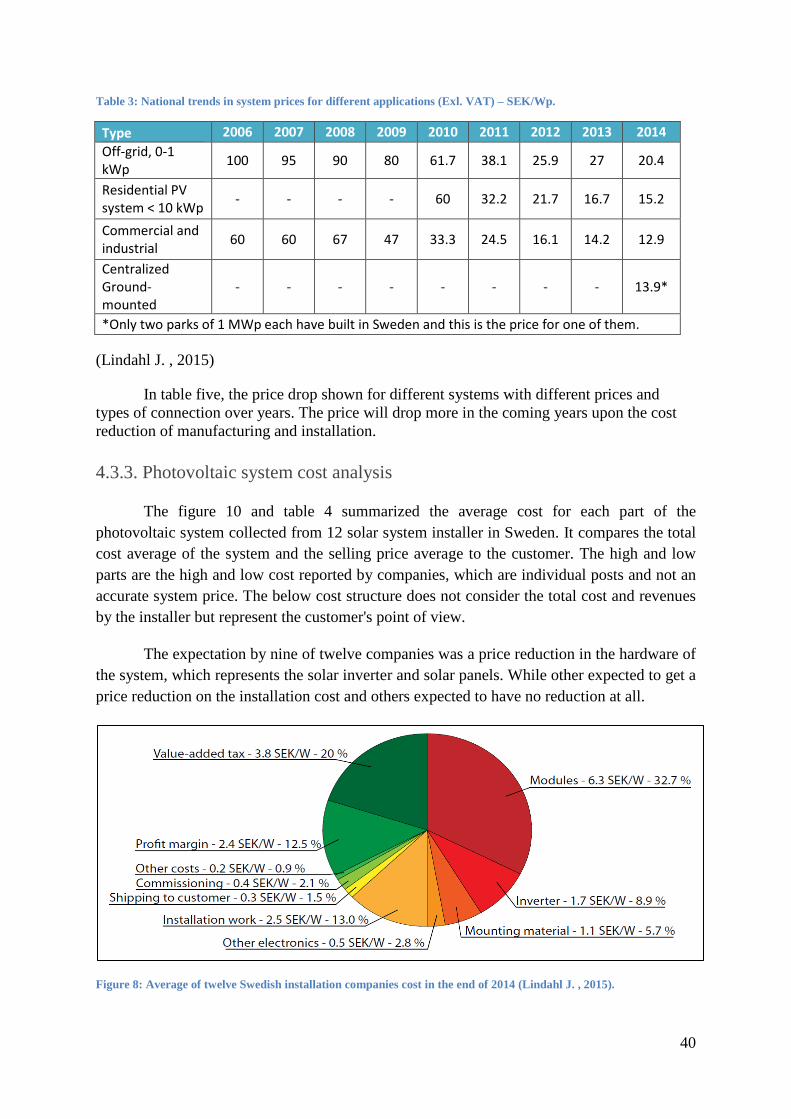
Table 3: National trends in system prices for different applications (Exl. VAT) – SEK/Wp.
Type 2006 2007 2008 2009 2010 2011 2012 2013 2014 Off-grid, 0-1 kWp 100 95 90 80 61.7 38.1 25.9 27 20.4
Residential PV system < 10 kWp - - - - 60 32.2 21.7 16.7 15.2
Commercial and industrial 60 60 67 47 33.3 24.5 16.1 14.2 12.9
Centralized Ground-mounted
- - - - - - - - 13.9*
*Only two parks of 1 MWp each have built in Sweden and this is the price for one of them.
(Lindahl J. , 2015)
In table five, the price drop shown for different systems with different prices and types of connection over years. The price will drop more in the coming years upon the cost reduction of manufacturing and installation.
4.3.3. Photovoltaic system cost analysis
The figure 10 and table 4 summarized the average cost for each part of the photovoltaic system collected from 12 solar system installer in Sweden. It compares the total cost average of the system and the selling price average to the customer. The high and low parts are the high and low cost reported by companies, which are individual posts and not an accurate system price. The below cost structure does not consider the total cost and revenues by the installer but represent the customer's point of view.
The expectation by nine of twelve companies was a price reduction in the hardware of the system, which represents the solar inverter and solar panels. While other expected to get a price reduction on the installation cost and others expected to have no reduction at all.
Figure 8: Average of twelve Swedish installation companies cost in the end of 2014 (Lindahl J. , 2015).
40

4.4. Monetary parameters and programs
It is hard to find standard payback calculation for the PV market in Sweden because the market still small and new, plus the un-similarity in solar radiation over Sweden. The average cost of capital for a PV system is around 5-7 % for companies while it is about 2-4 % for private owners.
4.4.1. Leasing schemes and third party ownership
Before 2015, no company offered PV leasing contracts while in 2015 an Eneo Solution AB made a cooperation agreement with utility company Umeå Energi, which they offer leasing contracts to tenants’ owners for public and commercial buildings (Lindahl J. , 2015). After 2015, many companies manage to offer the leasing contracts to the customers.
4.4.2. Cooperatives financed the photovoltaic
The high initial cost for PV system makes it hard to finance by cooperative plus the long payback time for the system cost. However in 2009 the first agreement in Sweden was established a small photovoltaic cooperative and Sala-Heby Energi AB (the local power utility), Solel i Sala & Heby ekonomiska förening.
The local utility company signed a contract to purchase the produced power by the first years from the small photovoltaic cooperative with the price of 3.21 SEK/kWh. Later in 2014, they start getting an average price of 0.341 SEK/kWh according to the Nord Pool spot price. By 2014, the Photovoltaic cooperative manages to install six systems, with a total output of 599 kWp. The PV cooperative has 226 members which they bought minimum one share for the price of 5 000 SEK, they agreed to invest the initial profit in expanding the production capacity and not before five years to distribute the profits between members. They manage to expand with more members from different parts of Sweden. During 2013 two more photovoltaic cooperatives were established, Åsbro Solel and Solel i Lindesberg ekonomisk förening. With the same share cost of 5000 SEK, both cooperatives started with a target of building first power plant by 2015 (Lindahl J. , 2015).
4.5. The power demand & power prices
Nord Pool Spot market, the Nordic electricity retailing marker control the physical electricity trading. The rainfall and snow melting controlled the electricity prices previously. The cheap production of hydropower controlled the electricity prices and the amount of needed power. The monthly electricity prices have some differences, which can notice during 2014 and that differences due the stable production from nuclear plants, global recession, and shorter winter period during 2014. The consumption power reduced during 2014 of 136 TWh when a comparison held between 2014 and with 2013 of 139 TWh, due to a higher temperature during 2014 that reduce The Nord pool spot prices in the same year.
41

During 2014, the lowest spot price was 0.005 SEK/KWh and the highest spot price was 0.954 SEK/kWh, the average Nord Pool Spot price was 0.269 SEK/kWh during 2014 and 0.329 SEK/kWh during 2013, which mean 18 % lower price in 2014. (Svensk Energi, Swedenergy AB, 2015).
Figure 9: Weekly price on the Nord Pool spot market in 2014 (Lindahl J. , 2013).
The highest demand of electricity in Sweden is during winter and varies between seasons. For that, season production seen and differences between demands and photovoltaics production, which showed in the above figure. While on a daily basis, the match is better since spot prices and spot prices are high during the middle of the day, as well in the summer time, the above figure shows that.
The Swedish National Grid (Svenska Kraftnät) divided into four bidding areas since November 2011. North of Sweden has more electrical production than consumption. Southern area of Sweden has more consumption than production, which made congestions and transmission problems in the national grid between high consumption areas and high production areas. The main idea of dividing Sweden into four areas to find out where it required expanding the electrical grid and where is high electrical production in order to supply the electricity to high demands areas and reduce lost power by long transmission. According to Nord Pool spot prices in 2014 were 0.290 SEK/kWh in Malmö (area 4), 0.288 SEK/kWh in Stockholm (Area 3), 0.286 in Sundsvall (area 2) and 0.286 SEK/kWh in Luleå (Area 1). The difference seems to be very small but that not affect the distribution of photovoltaic system over Sweden, the high demands areas with high population and better solar radiation.
Also, the distribution cost can be added to the total electricity cost which different between rural areas and urban's, which is not similar to taxation, subsidies, government regulation and electricity market structure. Electricity prices are a total of many components, based on the Nord Pool “Spot price of electricity plus energy tax plus the cost of green electricity certificate plus changing in grid charge plus fixed grid charge plus VAT and in some cases adding electricity surcharges and fixe trading fees.” The below figure clarify the end consumer price and shows the development of the lowest variable electricity price deals
42

offered by different utilities for a base case, the figure shows house in Stockholm area using district heating with annual consumption of 10 000 kWh/year and connected to Vattenfall grid. It shows the changing part of electricity price, which can make a difference for the micro producer when they install PV system and sell power to the grid.
Figure 10: Evolution of the lowest variable electricity price (Lindahl J. , 2015).
The above figure shows the evolution of the lowest variable electricity price offers for a typical house with district heating in Stockholm that has an annual electricity consumption of 10 000 kWh/year, a 16-ampere fuse and Vattenfall as the grid owner. The micro-producer can have more money from a tax deduction, more money from green electricity certificate. Also, the electricity price in figure 13 is the lowest and more amounts can achieve in most cases. The surplus electricity can achieve a higher value than consumed electricity.
4.6. The support
The government support the solar system adopters, the support including the installations cost and produced power supplied to the grid. The next paragraphs describe in details the support that provided to photovoltaic system.
4.6.1. The government financial assistance for PV program
The direct capital subsidy program introduced in 2006 to encourage investment in energy efficiency and transformation to renewable energy sources for public buildings. In 2006, a direct capital subsidy program introduced to stimulate investments in energy efficiency and conversion to renewable energy sources for public buildings. The program planned to stop many times but the government decided to extend the program until 2016 and planned a budget of 210 million SEK for period 2013-2016. Again, the government decided to increase the budget to follow increment of installed photovoltaic installed systems during last few years.
43
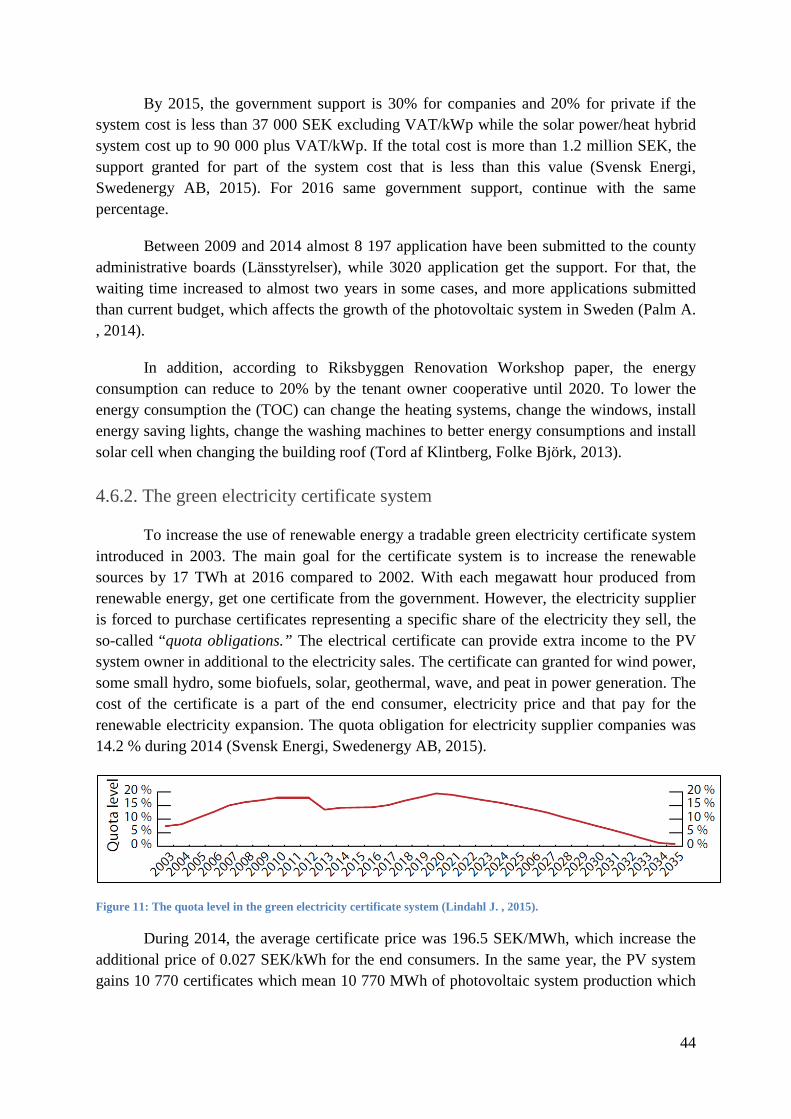
By 2015, the government support is 30% for companies and 20% for private if the system cost is less than 37 000 SEK excluding VAT/kWp while the solar power/heat hybrid system cost up to 90 000 plus VAT/kWp. If the total cost is more than 1.2 million SEK, the support granted for part of the system cost that is less than this value (Svensk Energi, Swedenergy AB, 2015). For 2016 same government support, continue with the same percentage.
Between 2009 and 2014 almost 8 197 application have been submitted to the county administrative boards (Länsstyrelser), while 3020 application get the support. For that, the waiting time increased to almost two years in some cases, and more applications submitted than current budget, which affects the growth of the photovoltaic system in Sweden (Palm A. , 2014).
In addition, according to Riksbyggen Renovation Workshop paper, the energy consumption can reduce to 20% by the tenant owner cooperative until 2020. To lower the energy consumption the (TOC) can change the heating systems, change the windows, install energy saving lights, change the washing machines to better energy consumptions and install solar cell when changing the building roof (Tord af Klintberg, Folke Björk, 2013).
4.6.2. The green electricity certificate system
To increase the use of renewable energy a tradable green electricity certificate system introduced in 2003. The main goal for the certificate system is to increase the renewable sources by 17 TWh at 2016 compared to 2002. With each megawatt hour produced from renewable energy, get one certificate from the government. However, the electricity supplier is forced to purchase certificates representing a specific share of the electricity they sell, the so-called “quota obligations.” The electrical certificate can provide extra income to the PV system owner in additional to the electricity sales. The certificate can granted for wind power, some small hydro, some biofuels, solar, geothermal, wave, and peat in power generation. The cost of the certificate is a part of the end consumer, electricity price and that pay for the renewable electricity expansion. The quota obligation for electricity supplier companies was 14.2 % during 2014 (Svensk Energi, Swedenergy AB, 2015).
Figure 11: The quota level in the green electricity certificate system (Lindahl J. , 2015).
During 2014, the average certificate price was 196.5 SEK/MWh, which increase the additional price of 0.027 SEK/kWh for the end consumers. In the same year, the PV system gains 10 770 certificates which mean 10 770 MWh of photovoltaic system production which
44
mean only fifth of PV produced electricity get certificates if the estimated production of 69.9 MWp x 900 kWh/kWp = 62 910 MWh from all grid-connected PV systems in Sweden.
Many reasons stand behind why PV system did not take advantage of the electrical certificate system, as many owners think the extra income will be very small and do not deserve the administrative burden. Also, it is hard to find a buyer for few certificates from micro-producers. Other reasons are the wrong placement of electrical meter between the building, the grid, which means only the surplus electricity, can get certificates, and the consumed power produced by PV system not received any certificate. For micro-producer, the extra cost for yearly measurement fee and the additional cost of the meter make the income in negative. The above explain the reasons behind the low amount of certificates issued, obviously only large PV producer getting certificates and that do not support the photovoltaic increment in Sweden.
4.6.3. Guarantees of origin
The (GO’s) guarantees of origin are electronic documents that guarantee the origin of the electricity and make it possible to energy customer to select electricity suppliers to depend on the energy source, the (GO’s) issued to all type of power generation. The (GO’s) launched by December 2010 which affect electricity supplier and producer, the electrical producer get (GO’s) from each one MWh they produce and sell it in open market. During 2014 7 944 (GO’s) issued for PV (SOURCE: The Swedish National Grid’s system for account management of certificates and guarantees of origin) (Lindahl J. , 2015).
4.7. Prosumers’ expansion measures
Many types of agreements can found in Sweden for PV systems, including net metering. The Swedish Tax Agency (Skatteverket) during 1 January 2015 clarifies the below details:
4.7.1. Tax
The Swedish tax agency provides tax assistance for surplus electricity fed into the grid. The extra power from (Photovoltaic, Wind, and Water) fed into network grid can earn tax reduction. An amount of 0.60 SEK/kWh, and a maximum of 18 000 SEK/year which, can collected by the income tax return once a year. The Tax Agency put a condition that no tax reduction for extra power more than power consumption if the consumption is 10 000 kWh/ year and the production was 12 000 kWh/year, for that Tax Agency do not pay for the extra 2 000 kWh/year. Also, the access point should not be over 100 amperes.
4.7.2. Register
To sell surplus electricity the owner must register for VAT and pay VAT of 25 % (Energimyndigheten, 2015).
45

4.7.3. Reduction
The reward program of ROT for the construction industry in Sweden in the form of tax credits. It is to collect for an upgrade and renovates existing residential buildings that are older than five years. Usually the ROT in 50 % of the labor cost with a maximum value of 50 000 SEK for PV system installation. The photovoltaic ROT estimated at 30 % of the total system cost including VAT according to Swedish Tax Agency. Since ROT, tax deduction is half of the labor cost then the total system reduction is 15 %, which is 5 % less than the direct capital deduction, but the advantage here is the fast process of receiving the money faster than waiting for 20 % from the direct capital subsidy.
4.7.4. Regulation
The European Union in 2010 adopted a building directive that requires all new buildings in EU to be zero energy buildings by 2020. That will motivate the market to install more photovoltaic systems and depend more on renewable sources of power. (Energimyndigheten, 2015).
4.8. PV in economy
The photovoltaic system have good place in Sweden market, based on business value and job opportunity provided in Swedish market.
4.8.1. Labour places
The bankruptcy of several companies decreased the number of Swedish labor places in PV module production industry. While more people selling the product in the Swedish market which increase the involvement from utility companies. The table 9 below provides estimated idea not an exact picture.
Table 4: Estimated PV-related labor places in 2014.
Market category Number of full-time job in 2014 PV module manufacturers 61 Manufacturers and suppliers of other components 65 R&D companies 122 System installers and retailers 279 Academic research 134 Electricity utility businesses and government 31 other 29 Total 721
(Lindahl J. , 2015).
46
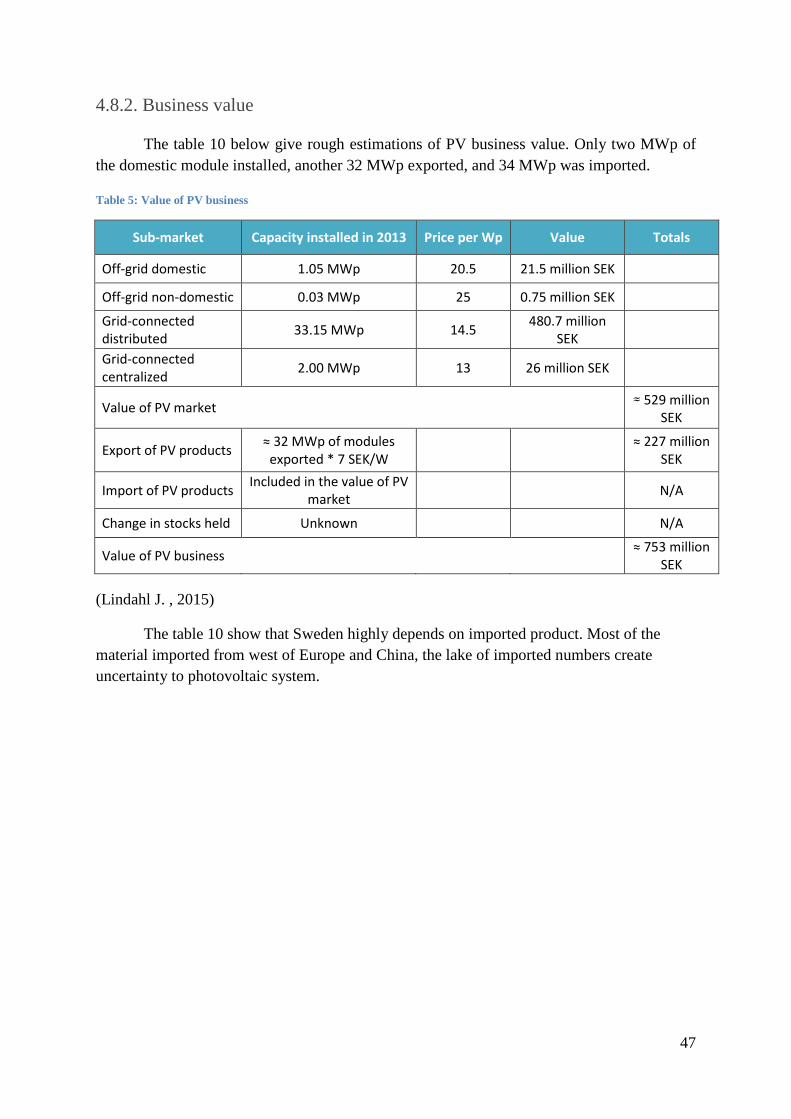
4.8.2. Business value
The table 10 below give rough estimations of PV business value. Only two MWp of the domestic module installed, another 32 MWp exported, and 34 MWp was imported.
Table 5: Value of PV business
Sub-market Capacity installed in 2013 Price per Wp Value Totals
Off-grid domestic 1.05 MWp 20.5 21.5 million SEK
Off-grid non-domestic 0.03 MWp 25 0.75 million SEK
Grid-connected distributed 33.15 MWp 14.5 480.7 million
SEK Grid-connected centralized 2.00 MWp 13 26 million SEK
Value of PV market ≈ 529 million SEK
Export of PV products ≈ 32 MWp of modules exported * 7 SEK/W
≈ 227 million SEK
Import of PV products Included in the value of PV market N/A
Change in stocks held Unknown N/A
Value of PV business ≈ 753 million SEK
(Lindahl J. , 2015)
The table 10 show that Sweden highly depends on imported product. Most of the material imported from west of Europe and China, the lake of imported numbers create uncertainty to photovoltaic system.
47
Empirical Finding In this chapter, the researcher will list the interviews with the Swedish solar firms.
The semi-structured interviews were with five solar firms operate mainly in southern of Sweden.
5.1. Interviews
The interviews performed in this research with Swedish solar firms, a semi-structure interview took place with these firms through a questionnaire, and the interviews were by mail or personal interviews or through a phone call. The first questionnaire approach was to three types of customers (accepted, rejected, hesitated) these three types of customers give a wide overview regarding the solar system in Sweden. The literature review and Energy Annual report the picture was completed and solid foundation created to design the final questionnaire to approach the five solar firms operating in Sweden. Four out of five interviewed firms were operating in Sweden with the different segment and move to solar in recent years, the previous operating field draws them into the solar market as they found new profitable segment. All firms operate in the Swedish solar market as traders, even the firm with the brand name of it is own import the product from another country. The interviewed firms have similarities in operating as traders but un-similarities can notice in firm size, location, and capabilities. The following interviewees describe the summary of questionnaires focusing on the research aim and research questions. The interview does not reflect the firms overview, but reflecting the interviewee opinion and answers depend on how interviewee observe things.
5.1.1. Varmitek Energisystem ab
Varmitek Energisystem ab, located in Helsingborg, started before 12 years selling, installing heat pumps and after sales services. Concentrate on making optimal use of natural sources, reducing greenhouse gas emissions reducing energy use. Varmitek supplies solar collectors, photovoltaic system, heat pump and exhaust air recovery system. Varmitek has own heat pump product. The firm has five employees, works as a trader in the Swedish market, purchasing the solar system material from Germany, Sweden, and rely on sub-contractors for mechanical and electrical installation. The firm targeting small and medium solar system projects, and the solar department was established two years back.
The following interview was with Måns Nielsen the owner & Vice President of Varmitek Energisystem ab.
The first two questions were about the information provided by the company to the customer and Varmitek providing information to educate the customer about the product and technology, Varmitek using “cheapest possible ways, social media, friends, old customers, newspaper, exhibition, self-research, and sales marketing.” The firm makes an effort to
48
motivate the customer to adopt the system by educating them and increase customer knowledge about the solar system.
The next question was the customer motivation to install the system and the interviewee answer was “the economical reason is the main motivation for the customer to adopt the system along with environmental thinking.” The customer thinking regarding the renewable energy is changing “it is turning now, from renewable Heat pump to Solar cells systems, but still different customers have different needs, for heating or electrical.” The customers’ demands changed as they predict high opportunity in solar cells system.
Referring to the technical problems in Swedish solar market to promote such technology and the interviewee, “the main problem in solar cell system in Sweden is the low electrical prices and the long payback time, also the complication in filling all the applications for electrical distribution, energy agency, and tax agency. In connection, the private owner has to declare and pay VAT for selling the electricity.” The main technical problem is the technical design programs complication and cost, to operate in the solar market it is compulsory to have such program in order to design and select the right material for the project and calculate the predicted future production.
The internal experience problem plays a big role in this market, as a lake for experiences can be the main obstacle in the solar business, which can cost a lot in both financial and growth. The interviewee comment was “when the business grows more and more projects wins it can make it easy to find the employees. But today it is hard to find installers for the solar cell system with right skills.”
The competition can affect both negatively and positively on the market, but the poor experience can result in a negative effect on the market “the low competence and poor experience can result in a wrong installed system in the market. It can create uncertainty to the customer and negative effect when cheap quotations with wrong equipment reach to the customer instead of more expensive quotation with correct engineered equipment.” The wrong design can create problems because the system lifetime is more than twenty-five years and the cost is high to change or replace any part, especially when it fixed on the house roof and the correction can be impossible. The interviewee thinks that his competitors are facing the same problems.
The solar resources affect the solar market in Sweden due to low solar radiation. The slow technical development also affects the solar market in Sweden as “many customers are waiting for better technologies with better prices to buy” the Swedish customers study any investment step in very careful way due to the high education level in the society and the Swedish are more likely to wait for prices to drop with better technology.
Varmitek design systems with average payback time between 8-10 years depend on the project size and design, and the average selling prices between 13-16 SEK/kWh.
49

The government support is low as Varmitek VD thinks, and little restrictive “maybe the governmental support can be small at the beginning and increase slowly in order to create the right support.” However, the interviewee thinks it will be better if the government make it easily to apply for solar system financial support, and remove the part of that private person has to sell electricity with VAT. It could be better if the government makes it only two applications one for the energy agency in Sweden and the other to the electrical network owner. To motivate the customer purchasing the solar cell system a financial agreement established with a bank, in order to cover the high system cost for the customer.
5.1.2. Nibe
Nibe is the second interviewed firm, the global group initiated in Småland many years back, the firm well known in the manufacturing market for commercial and private use. Enterprise and energy for working together, interests in item improvement and corporate acquisitions have prompted the huge development of the group, which led to the today success, and high sales of over SEK 13 billion. Nibe operates in North America, Europe, Australia, and Asia with more than 10,000 employees. Nibe listed on NASDAQ since 1997, Nibe manages each area with separate management and profits obligation.
The firm recently launched new solar department which mainly sales ready-made packages to Nibe installer and customers, the aim is to reduce the energy consumption cost and make profits of selling the produced power. Nibe wants the customer to combine both system heat pump and solar system, so the owner can reduce the heating cost by using Nibe product during wintertime and produce more electrical power during summer time. Also environmentally, the solar system can reduce the pollution and solar system segment can reinforce Nibe position in the market (Lucky Look, Tom Hargreaves, Micke Persson, Jerry Gladh, et, 2015). The interview was with Mr. Sven Hallbeck the Solar Product Manager at Nibe Energy System.
Referring to the first two question regarding the information provided to the customers, Nibe provides information through the usual sales marketing “direct marketing, sales representatives, homepage and so on” but Nibe also provides training program which shown significate results and popularities. The training program is a marketing tool and meant to educate and inspire the loyal customer base of heat pump installers.
The main reason behind buying the solar cell system is “Economical, environmental and technology” as the financial investment brings the customer attention. Other factors can motivate the Swedish customers to adopt the system such as environmental and the new technology.
The customers prefer the solar system than other renewable energy sources “Some customers think considering the wind power but they are getting quite a few” maybe that because the less complex procedures to adopt the solar system with shorter documentation handling time.
50
Technical problems can prevent the firm entering the market but after some time, the firm starts to learn how to pass these problems “in the beginning we had a lot of confusion and misunderstanding about rules and regulations. Mainly at the DNO: s”. The DNO: s is the Distribution Network Operator has rules and regulation regarding the cable size, the amount of power sent back to the network, certificates, and approval of inverters.
Nibe is a giant firm with a high rate of competition with rivals, and for that Nibe never face the problem of the lake of qualified competencies or experiences “We have had the competence we need all the way. The solid background in solar thermal solutions has shown to be really helpful” the firm easily managed to move from Solar Thermal system to Photovoltaic system based on knowledge and customer loyalty.
The low competence and poor experience have not really been a problem for Nibe solar department “But for the market, in general, I´ve seen some discouraging examples in bad technical solutions and sometimes bad economical guidance as well.” The negative feedback from customers with bad experiences in the solar system can hurt the general market and reduces the trust based on these bad experiences.
The most of the solar firms have faced or facing some obstacles promoting the technology in Sweden, but not anymore “The media hype the last few years had really help a lot” that increased the society awareness in green power and low CO emission.
The technology development in performance and cost affect the market or not, the fact that the performance is slowly getting better but the cost reductions have stabilized on a reasonable level, is making the market much more stable. “The customers are much less prone to wait for large cost reductions.” That could relate to the customer culture but also can connect to the magnificent price reduction during the last ten years.
There’s a myth that the solar radiation is too low here up in the north that still lingers in the background, but the more we educate and the more installations are getting installed the less of an issue it becomes. I would say it is not that big of a problem anymore.
Nibe average selling prices between 16 and 17 SEK/kWp including tax. However, Nibe selling solar system as packages and the installation with other technical details takes care by the installer.
“The governmental support effect on the business is vital driving the market but on another hand, the lack of funding has been the biggest bottleneck in the last few years.” The customer does not trust the governmental support due to the long handling time and the small calculated budget to get the financial support for installing the solar system as explained in the previous chapters. On the other Nibe provide the same financing solutions they provide for the heat pumps.
5.1.3. PPAM Solkraft
The third firm is PPAM Solkraft, supply and install a solar system to the different type of projects, residential, commercial, industrial, government i.e. the firm have the
51
capability to supply anything required by the customers. The PPAM staffs are highly qualified and the firm follows the strategy of stocking material in Sweden, which results in fast delivery and stylishly designed solar plant. The firm has a variety of products and solution, which fit all the requirement, also PPAM have their online calculation program and their own designed solar panels which were developed in Sweden but the manufacturing in China. The PPAM panels manufacture in China under PPAM brand name. The firm also has their own webshop for a buyer who like to install the system by them self. The firm established in 2002 and managed to get the Energy and climate prize 2012 by the governor of Östergötland. The firm has many offices around Sweden with a total number of more than 20 employees, the firm has it is own installation teams as well. The interview was with Mr. Henrik Fridholm the Technical sales and sales leader in Sweden.
The firm provides information about the solar system “through PPAM sales marketing, targeting the customers and through exhibitions to present them self to the potential customers.”
The main reason for adopt the solar system in the future economic potential behind adopting the system, and the environmental concern, due to the society awareness and the economic investment.
Since the solar system can be in small size, that give the advantage of easily adopt and installation and bring customer attention “Customers are interested in adopting the solar system since it is east to be installed on small house.” Also, almost service free system with long life cycle brings the customer attention more than another renewable system.
The technical problems are not a big issue to PPAM since the highly qualified teams working within the firm make the company come over these technical obstacles, Henrik mentioned “the people are used to do things same as they did yesterday” without consideration to the development.
The PPAM competitors are qualified and PPAM can train their new employees when required due to the highly trained staff working in that firm. The low competence and poor experience in the Swedish solar market affect the growth and make it very slow compared to other countries. For that, “The competitors operating in the same market are facing the same problems.”
Referring to the technology development, PPAM has the good developed solar technology, which counts as the solid foundation to operate in the market. “Today is expensive to NOT install a solar system.” which mean the cheap produced power from the system make it tangible to install the system.
The average payback time for PPAM solar system is between 11 years with 18 SEK/Wp on total installation including everything. In PPAM, we think the government support is humble if it is improved then “it is good to make the business grow faster, but it is
52

not very important since solar energy is economical.” Finally, the firm provides financing solution, to motivate the customers to adopt the solar system.
5.1.4 Rexel Energy Solution
Rexel Energy Solutions is the forth-interviewed firm. Rexel consider as one of the biggest players in the electrical material distribution and operate in 38 different countries. The main target of Rexel is to increase awareness of energy solution and energy efficient products. To develop solar business Rexel creates Rexel Energy Solutions, which highly expertise firm with leading product vendors. The firm targeting the solar market through web shop with a wide range of products from leading manufacturers suits all type of customers. The customer can select the desired material and Rexel responsibility to deliver the best quality material to the customer in short time. The interview was with Mr. Daniel Sjödin, the Sales-Account manager PV Specialists at Rexel Energy System.
Rexel Energy Solutions provide information to the customers mainly by web, but the firm provides information through all types including seminars, fairs, training, and media .i.e. the biggest task is customer education regarding the system, which increases the public awareness and supports the business model.
The reason behind adopting the system can be different and depends on who is the end customer “In Sweden we see more sales come from environmental reasons compared to other markets where the economy is a stronger driver” that based on public awareness in Sweden regarding renewable energy and the high rate of wealth population. The Rexel Energy Solutions customers think “Solar energy better than other renewable energy sources” based on the simplicity of the system and long life of more than 25 years.
The technical problems affect the market mainly “Low knowledge and complicated governmental regulations, and hard to understand” the governmental support is hard to understand as it is complicated with documentations and process. On the other hand, “Rexel is facing difficulties in finding competencies in the market” but Rexel hiring more people in their teams. The low competence and poor experience in solar system affecting the market development where the market moves slower because of that. For that, other competitors are facing the same problems in the solar market.
The technology development performance, and cost not highly affecting the solar market. “What really affecting the market is the low electricity price in Sweden” low prices increase the payback time and reduce the revenue of the installed system, the current electricity prices in Sweden is really low prices and it is impossible to be lower than this level, otherwise, the electricity will be for free. Rexel Energy Solutions, approach the customers by another way, if total installed system produce 10000 kWh/year and the self-consumption is 50% of that produced power then the customer can have 5000 kWh/year for the cost of 0.65 SEK kWh for the next 25 years.
53

Rexel Energy Solutions do not sell the product to the end customer, the business model oriented into wholesale only. For that, the firm does not concentrate on the final installed cost.
The governmental support is unclear “Different signals from the government was sent to the market” it is hard to understand what government really want to do and what is their plans for the solar market in Sweden. Finally, Rexel Energy Solutions provide financial solutions but with “Financial partners and installer partner” that will help the customers to adopt the system and increase solar system sales.
5.1.5. K-utveckling engineering ab
K-utveckling engineering ab is the fifth interviewed firm, Anders, and Peo “K-utveckling engineering ab creators” know of the great potential to get new perspectives and qualities for successful project management in nuclear industry. The firm started at 2003 in project management field, concentrating on three important things, first hiring qualified employees with integrity to work on their own and manage projects, the second point was never stops developing in the business model or within the employee's them self, third things was to always be honest and transparent in their business. Not just for its own sake, for our employees, clients', and public safety. That creates great value for the firm and let them expand their ability in all project phases. Based on the continued development vision, Last year K-utveckling create new Solar Energy department targeting all type of projects all over Sweden and managed to develop that department in short time, the firm operates in Sweden with direct sales and webshop sales. The interview was with Mr. Mutaz Alkisawni the business area manager – renewable energy at k-utveckling engineering.
The firm trying to approach the customers in an intelligent way provide seminars regarding solar system in general. Also, the firm provides information to the customers upon request of the end customer. The firm targeting customers through social media and google add words. The firm targeting the electrical installers “We provide basic technical information, data sheet, reference for more product documentation with a link with manufacturing to our home page” as they tried to make things simple and remove complication to the end customer.
The main motivation to adopt the system in Sweden is environmental and technical reasons on the first stage and economically on the second stage. The customer thinks differently based on lack of information “we got suggestions of combining solar thermal with photovoltaic system” these types of suggestions without deep study from customers or wondering if such solution can work or not. The customers are interested in the photovoltaic system but the lack of information still creating an obstacle.
The technical problems faced by the firm were targeting audience, the right customer if the homeowner or building management board or installer. For the homeowner then the technical obstacle shall the location-validity to install a solar system, without databases about location validity in Sweden for that mostly you have to do it manually targeting this
54

homeowner with good south oriented roofs. “We do a manual calculation or targeting houses owner in the whole area without checking orientation or direction” that help bring inquiries for the solar system and homeowner attention. The firm follows the same strategy with building management board while the installer contacts the firm for prices and technical support.
The firm faced some obstacle in experience while hiring the qualified employees, mainly in installation part, “because we design and calculate in house as we have good engineering background” the installers need to be trained as the system is new for them and it is hard to find qualified installers with reasonable prices and good capabilities. Another technical problem is the solar inverter supplied by global manufacturers does not include the Swedish limitation of voltage fluctuations and flicker impressed on the public low-voltage system standard. That mean the installer need to request the inverter manufacturing company to get the access into the inverter to change the limits of voltage changes to comply with Swedish voltage limitation and that matter take more time and effort. Mr. Mutaz explained “BS EN 6100-3-3 voltage flicker standard are not at Swedish standard within inverter, and previously we used to set the inverter at Denmark standard” the Swedish flicker standard are requested by the electrical grid operators (public low-voltage distribution system) for the systems product under 16 A per phase, 220-250 V line to neutral at 50Hz.
The low experience in solar system effects the market in Sweden as the customer decision making get affected by “Offers they got offer and ask for revised quotation and hesitate to purchase” that could be based on lack of standard product and availability of variety of products which create inconspicuous regarding the system which result in decision making. In addition, no proper computation from competitors as it happened when other competitors offer unreasonable offer because they do not understand the whole picture “of course they will get problems in future” but currently that affect the market in a bad way. The market still in learning stage and firms with low knowledge fall down fast.
Other competitors facing similar obstacles and barriers, each company passing these obstacles based on capabilities that firm having. The technical development affect the market as big part of customer decision based on the economic feasibility of the system and the system payback time “the system not very attractive but that cover with technology development with higher efficiency solar panel” on the other hand, the continuous development of solar panel efficiency and reduction of the cost help decision-making. That creates economic feasibility for the whole project.
As mentioned before the firm targeting all type of project, and current selling price for small and medium residential project are 12 to 14 SEK/Wp, while the price for medium to large commercial project between 11 to 13 SEK/Wp.
The governmental support is confusing some time, when it mention in economic feasibility and the feasibility study create uncertainty to the end customer. “No one know if the governmental support will continue to the end of this year and what is the waiting time and if they have enough money for everyone applied for the governmental support.” But in
55

personal contact with energy agency we knew they have enough budget for everyone applied this year and last year but the agency had some problems in recent years and that create uncertainty to the end customers.
At the end the firm recommends specific financial solutions from banks directly, we feel the Swedish customer feel more confidantes when he/she applies for a loan and understand the loan terms and conditions.
56

Research analysis and discussion In this chapter the researcher, introduce the analysis and discussion of research. Based
on literature review and interviews with five solar firms, the chapter ends with similarities and un-similarities to other industries.
6.1. Examination and discourse
This research paper concentrate on Swedish Solar Market barriers and obstacles, define them and analyze each one of them in a defined category. Analyzing the external and internal factor affecting the market barriers and obstacle, categories the market barriers and obstacles into four categories, technical, administrative, market environment and economical. The first research question shall answered by reviewing the overview of the industry in Sweden with in-depth analysis and based on the interview feedback, the second research questions shall analyzed based on literature and in-depth analysis for each firm separately with the help of the national report. The research objective was to determine today solar market status and set future strategy plan, defining today market obstacle and barriers and how new entrant can make a solar market entrance in Sweden. This objective in connection with research questions described in earlier chapters. The personal aim of this research to increase the awareness of the Swedish solar market obstacles and barriers, define them, have a clear view on Swedish solar market and the predicted solar market in Sweden.
The first research question: What is the predicted future for solar market in Sweden? In order to answer the research questions the researcher referring to the annual energy report and interviews.
The business entrance process starting with evaluating the market status and analysis the value outcome for market entrance, if the value outcome lower than the investment cost then more information need to be collected and studied again or ending the process (V. Auken, & E. Howard,, 1999). Sweden totally embraces green technologies and the business potential is high, the target of 2020 is to reach a 50 % production from renewable energy sources and solar systems are one of the main renewable sources. Also, Sweden considered as one of the leading in solar research and development. The annual solar implementation was more than double since 2011 with great future opportunities based on simplified system operation, low annual procedures, and long operation life, in total the opportunity created to integrate the system to premises next to the electrical demands. More people considering this solution to reduce the energy consumption, produce their own electricity, and participate in reducing pollution (Skåne, 2015). Sweden has 100 % installed smart meter dissimilar to other European countries (Eurelectric., 2013). The dynamic distribution charges affected by energy demands, the Swedish customers are able to increase or reduce their electricity consumption appropriately (Bartusch, C., Wallin, F., Odlare, M., Vassileva, I., & Wester, L., 2011). In 2014, 36.2 MWp of solar power were set up in Sweden which is double of 2013 amount, starting 2015, the aggregate introduced limit adds up to 79.4 MW. For 2013–2016, the
57

Swedish Energy Agency is putting SEK 123 million in an examination into solar technology. The installed solar power predicted to preserve the same level of development in the coming few years if the governmental support continues at the same level.
The solar panel price dropped almost 90% since 2003, the total system price dropped at a similar percentage, the system prices prediction to continue to drop in the coming year, maybe not at the same level but the minimum import price from China controls the market at some point. The minimum selling today prices almost 11 SEK/kWp, the selling price predicted to drop more due to highly competition between Swedish market big players, also the creation of new manufacturers with lower price product to enter the global market of solar business help in total installed system price reduction. Building new solar factories depends on the market demands if the demands increased or huge solar farm launched in Sweden, the chance increase to build a new factory and most of the cost can regain from one big project. That factory can create many jobs and competition advantage in Swedish solar market.
The payback time is quite long in Sweden due to low solar radiation, high system cost, and low electricity prices in Sweden. The electricity prices increasing by 2% per year and it is impossible to be lower than current cost otherwise, it will be free. This obstacle can be removed when electricity prices increased in the coming years, especially with the future plan of the Swedish government to shut down many nuclear plants. The high initial system cost can overcome with the financial solutions provided by banks; on the other hand, the investment is stable which required lower interested rates on the loans to motivate customers to adopt the system. If firms launched roof-leasing contracts with house owners, then more people will be motivated to install the system, but that solution can be risky at this level due the reasons explained earlier. The selling prices are cumulative price, electrical selling prices, tax reduction, certificate of origin, and electricity certificate. The current electricity selling prices are between 1.4-1.65 kWp/h depends on the electrical network prices. The cheap production of hydropower controlled the electricity prices and the amount of needed power.
On the other hand, electricity prices are a total of many components, based on the Nord Pool “Spot price of electricity plus energy tax plus the cost of green electricity certificate plus changing in grid charge plus fixed grid charge plus VAT and in some cases adding electricity surcharges and fixe trading fees.” On the other hand, the system owner needs to apply for tax reduction, certificate of origin, and electrical certificate, the owner has to declare and pay VAT for selling the electricity.
The government support for the solar system is 20 % of the total system cost for residential projects and 30 % for commercial projects. The Energy Agency pay that financial support, the agency stumbled in the previous year’s delivering the support to the system owners. The support planned to stop in few years but it always extended due highly desire of implementing the solar system and green power. The price uncertainty also connected to tax reduction, certificate of origin, and electrical certificate, as these prices not fixed prices, and changes due circumstances and that create the obvious obstacles.
58
The solar system creates a lot of jobs in the Swedish market, the numbers showed high increment in the recent years. The business value shows near value of imported and exported photovoltaic product, these numbers predicted to increase in the coming years.
The interview showed that the firms operating in solar market have similarities. The firms were operating in Sweden but with different activities and moved to solar business based on the opportunity. The customers’ lack of information creates obstacles, the firms trying to educate more regarding the solar system in different ways. The interview showed the economic and environmental are the main motivation to adopt the system by Swedish customers, increasing the economic benefits help to increase the system adopters.
The low experienced competitors create problems in Swedish solar market, based on wrong information provided to customers, which can decrease the competitor’s motivation. High cost came on system installation part as many firms still in early development stage and firms outsource the system installation to other installation firms. The current situation will change as these competitors learn by time and get experience. The Swedish customers waiting for the system prices to drop and higher efficiency panels to produce, more than that, a better understanding of the system is indispensable, and lower governmental bureaucracy is essential to develop the solar market in Sweden.
The second research question: How can entrant make a solar market entrance in Sweden? To answer the second research question the researcher will rely on theories, national reports, interviews, and will answer in the following paragraphs.
6.2. Diffusion of innovation
Roger (2003) contends that diffusion of innovation is the procedure of a development imparted over specific channels after some time among members in a social framework. The solar system diffused in Sweden based on the high-educated society regarding green power and environment. The solar system adoption is increasing almost the double each year and figures showed high system adoption rate the last ten years. The diffusion of solar system restricted by obstacle and barriers, these obstacles and barriers prevent the market development and growth. The diffusion of innovation depends on the following factors: time, communication channels, social system, and the innovation itself while the process depends on the economic capital. The time factor already exists in Swedish solar market as the system presented to the market since a long time and customers have some ideas about the earlier solar thermal system and society came to know the privilege of that system and power reduction can be gain from the solar thermal system. The photovoltaic system was developed and the adoption rate is increase and the last six years. However, the solar system needs more time to diffuse in Sweden and the time factor is an obstacle to solar diffusion in Sweden.
The next factor is communication channels and social system, the social media presented the system and explain the privilege of the solar system with explanations of the positive and negative side of the solar system but mostly was to encourage the society to
59
adopt renewable energy sources. The increment in system adopting helped to encourage the new customer to adopt the system as people became curious when they saw new installed solar system. The curiosity is main motivation factor to communication, people saw the new material, and people became curious, want to have a same new product or maybe better product. On the other hand, the social media did not present the solar system in specific, more explanation to the community can help the industry diffusion in Sweden, and low social media support to solar business can be an obstacle.
The solar system in Sweden still between early adopter and early majority according to Bell-Shape frequent curve, the system adopters are still low due to obstacles and barriers. The Bell-Shape frequent curve refers to the quantity of people embracing the system every year. The system adopters increasing almost the double during the previous few years, more adopters predicted in the future. The Cumulative S-Curve not at the same level of adoption, due to the S-Curve refers to cumulative data basis (Rogers E. , 2003, p. 243).
When applying the same curves to solar market, the same market level can identify for the same reasons, the market has new entrant trying to be adopters to the system even if their entrance was weak. The new entrant trying to enter the market in early stages, they do not miss the chance of lower market entrance barriers and obstacles. On another hand, the early majority start to create as big firms entering the market and few of them expand in the business. The diffusion of an innovation can be reduced because the uncertainty and role of information (Rogers E. , 2003, p. 244).
6.3. Diffusion Process
The diffusion process going through five steps in the same environment, within network communication over time to create the decision-making, the first step is knowledge and awareness regarding the solar system with limited information, as many customers at this level do not have deep knowledge in the photovoltaic system. The next step is persuasion when the customer starts to search more about the system using social media and scientific sources. The next stage is a decision, when the customer starts to evaluate the system and payback time, also can connect with other offers and solutions from another supplier, this stage is most difficult and results in accepting or reject the system. Next stage is implementation when customers distinguish the advantages and search for more information, the customer became more educated at this level. The final stage is confirmation, referring to the final decision of implementing the solar system or not (Rogers E. M., 1983, p. 272). Solar market obstacles and barriers connected to these stages mainly connected to information and knowledge in solar business. The obstacle can overpass by increasing the awareness and knowledge of social media tools and seminars, the solution can implement by firms targeting new customers in narrow concern. The more wide solution can implement by the government to increase the society awareness in the solar system, which can count as a barrier as the government must set a budget for awareness campaign or have awkwardness for supporting private firms due to a bigger commitment to society.
60

6.4. Business life cycle
The business life cycle starts from beginning stage and end by termination stage, going through stages of business life. The business life cycles are similar in industry but the organizations in the same market have differences in stages lifetime (Hisrich, R. D., Peters & M. P., 2002, p. 502). The sales development over time controls the stage length within the business life cycle. The identification and awareness of business life cycle are vital for firms’ management planning to make entrance actions. Firms’ management can overcome difficulties through the early business life cycle, individual’s adequate controls by business development and will expect to fulfill the different roles (Bartlett & Bukvić, 2001).
The life cycle of Swedish solar market still in growth stage. With sales increasing as shown in empirical data chapter, cost reduces for both solar panel and total system cost, small profits from selling the system in Sweden due to high competition, and high system cost, low profits related to small sales size, and four out of the five analysed firm are outsourcing the installing to other sub-contractors. These companies cannot hire the installation teams with permanent contracts to avoid risk. One of the four firms tried to overcome this obstacle by hiring installation team on hour bases when they have projects, two other firms tried to overcome this obstacle by selling the system without installation as they targeting installers or the customer can install the system by himself.
This stage can be between five to seven years from start-up stage (Audretsch D. B., 1995, p. 442). The competition in Sweden market is high with the slow development of system efficiency and low development in sales (Hisrich, R. D., Peters & M. P., 2002, p. 501). This level can identify as Rapid growth stage also, the new entrant face difficulties in this stage as many competitors in the market with increased sales level. More human resource required at this stage as more work need to be done in order to survive in the market (Audretsch D. B., 1995, p. 442). The obstacles in this stage to enter the market with the suitable human resource, hiring experts within solar technology and find a supportive supplier, suppliers need to be supportive in both technical and finical parts.
6.5. SWOT Analysis
Strength, weaknesses, opportunities and threats are the definition of SWOT. The instrument identifies the inner and outside factors affecting firms’ business model. The concept is vital for decision makers to define the tangible and intangible market benefits, supporting decision makers. Each firm will analyze separately, identifying strength and opportunity, weakness and threats. On another hand, opportunity and threats connected to the market.
6.5.1. Strength and Weakness
Strength and weakness related to firm internal capabilities, in the following paragraphs each firm will be analysed and explained.
61
1. Varmitek Energisystem ab
Varmitek Energisystem ab, operate in Helsingborg south of Sweden, the firm mainly sales and install a heating system. For that, Varmitek has the strength of wide customer database as they were operating since more than 12 years. The firms providing information and advertising through social media, newspaper, seminars, friends and old customers, the firm provide excellent service to their customers and that is the main motivating point for old customers to come back again. The firm sales heat pumps that reduce the energy consumption and solar system produce energy both are important to customers and related to economic privilege. The firm provides full support to customers within documentation and another governmental requirement.
The weakness, the firm has only five employees with one expert in solar department design. The firm has no installation team and usually outsource the installation part. The solar system design programs are expensive, at this point the firm has no capability to purchase expensive programs and waiting until the sales growth. The low electrical prices affecting the system sales and make longer payback time, the average payback time is 8-10 years with decrease with increasing the system size. The installation part outsourced due to slow market growth and difficulties to find experts in solar fields. The low solar radiation in Sweden reducing the system production and longer the payback time as well. Finally, the low governmental support considered as a weakness in the Swedish solar market.
2. Nibe
Nibe mainly works with heating and cooling systems, Nibe operates in North America, Europe, Australia, and Asia with more than 10,000 employees. Nibe listed on NASDAQ since 1997, Nibe manages each area with separate management and profits obligation.
The firm strength is the operation in different countries with 10000 employees over the world. The firms sell ready-made packages with three, six, and 9-kWp solar system, the installation part to be taken care by installer or customer himself. The firm aims to combine heat pump system with the solar system, the combination result in reducing electricity consumption and produce electricity at the same time, resulting in economic and environmental advantages. Due to large firm size and well-known brand name, the firm using it is own marketing team to introduce the solar system within Nibe products. In addition, Nibe using sales teams, the homepage for system marketing and providing information. Nibe customers think it is easier to adopt the solar system as a renewable source than other systems. The high competition with Nibe creates strength all the way and motivates them to work harder. The solid background in solar thermal solutions has shown to be helpful, knowledge and customer loyalty is great strength source for Nibe. Nibe provides same financing solutions they provide for the heat pump. Nibe is a large company, which make it easy to promote the product, and market introduction, the firm has the knowledge and customer loyalty. The firm see the future in education programs for installers, more programs
62
result in more installations are installed and less of an issue it becomes which will help the future sales. Finally, Nibe customers think it is easier to adopt the solar system as a renewable source rather than other renewable sources.
The weakness is Nibe trying to enter the market with ready-made solar packages that not matching all customers demand due to un-similarities of customer requirement and roof different design. The current selling price between 16-17 SEK/kWp, which considered high selling price.
3. PPAM Solkraft
PPAM Solkraft, the firm established in 2002 and operate all over Sweden, the firm specialized in a solar product only. The strength of PPAM is they supply and install their own solar panel made in China under PPAM name. PPAM work in different type of projects, residential, commercial, industrial, government i.e. The staff of PPAM is highly qualified and the firm follow the strategy of stocking material to reduce cost and fast delivery to customers. The firm has it is own online calculation program. The firm targeting another market segment, as they sell direct material to installer and customers through the web shop. PPAM has it is own installation team which reduce the cost and speed up the installation duration. The variety of firm operation location provides them the advantage of fast reaching the customer and covering different locations in Sweden. PPAM highly participating in exhibition and seminars to introduce the product and educate people about the solar system, with the help of highly qualified team the obstacles can easily remove. The main motivation to adopt the system is environmental and economical.
The weakness is the people are used to do things same as they did yesterday without consideration to the development. The low competence and poor experience in the Swedish solar market affect the growth and make it very slow compared to other countries. The payback time for the solar system is 11 years and average selling price is 18 SEK/kWp, on another hand low governmental support badly affect the market.
4. Rexel Energy Solutions
Rexel Energy Solutions is part of Rexel, which is the one of the biggest players in electrical material distribution. The strength, Rexel Energy Solutions is part of Rexel group, which operate in 38 different countries. The firm targeting the Swedish market through web shop with a wide range of product with fast delivery as the firm stocking the material in Sweden, which gives the privilege of lower prices, the firm targeting installer and direct buyers. Information provided to customers mainly through the web. Also, Rexel provides information through seminars, fairs, training, and media.
In Sweden, the environmental factor motivates the market more than economical, unlike other countries. More wealth population help to adopt the system, also long system life for more than 25 years.
63
The weakness, the firm targeting solar market in Sweden through web shop without technical support or calculation program, the firm targeting installers but not all installers have the ability to technical details and they need more help in that matter. Low knowledge and complicated governmental regulations affect the solar market in Sweden. The low electricity prices increase the payback time and reduce the revenue of the installed system. Rexel Energy Solutions do not sell the product to the end customer, the business model oriented into wholesale only. For that, the firm does not concentrate on the final installed cost.
5. K-utveckling engineering ab
K-utveckling engineering ab, the firm established in 2003 specialized in project management. The strength, the firm have the experience in project management and specialized in nuclear power management. The firm targeting all type of project and sales through direct sales and web shop. The firm using social media and google ass words, the firm targeting electrical installers by providing basic information and trying to make things simple. Environmental motivation is the first market motivation followed by an economical factor. The selling price for small and medium residential project is 12-14 SEK/Wp while the price for medium to large commercial project between 11-13 SEK/Wp.
The weakness, the customer thinks differently based on lack of information. The location validity to install solar system continued to be a problem in the solar system, without databases about location validity in Sweden. Lack of qualified employees in installation part and the high cost of good installer consider as an obstacle, hiring fresh people and train them can overcome this obstacle but that take time and efforts. Solar inverter supplied by global manufacturers does not include the Swedish limitation of voltage fluctuations and flicker impressed on the public low-voltage system standard. Other competitors offer unreasonable offer because they do not understand the whole picture “of course they will get problems in future” but currently that affect the market in a bad way. The governmental support sometimes is confusing when it mention in economic feasibility and the feasibility study create uncertainty to the end customer “No one knows if the governmental support will continue to the end of this year and what is the waiting time and if they have enough money for everyone applied for the governmental support.”
6.5.2. Opportunity and Threats
The market opportunity and threats have similarities and un-similarities between different firms operating in the market, the opportunity and threats related to the environment where the firm operate. Firms can share the opportunity as they operate in the same market, but the capabilities to take advantage of these opportunities related to firm capabilities, similar situation with threats.
The market opportunity is targeting the old customer list the companies offered services for them previously. Based on the high system cost, providing financial solutions can
64

motivate customers to adopt the system with long instalments plan. The governmental support still an issue to adopt the system, increasing the governmental support and set clear future plan for renewable energy in Sweden can support the industry growth, in connection to increase the electrical price and support it more to reduce the payback time for the system. Firms can target customers by providing full solution to reduce power consumption and produce electricity at the same time, the system produce more electricity during hot weather and combine the system consume lower power during cold weather will show benefits. High installation cost based on outsourcing that segment to other subcontractors, hiring in house installation team can reduce the cost, but that connected to market growth. Targeting all market segments, by selling directly to customer, installer and overseas sells, the firms will gain sales to all segments and gain profits.
The product is continuously developing, in mean of efficiency and quality, for that firm should keep updating their sources of products to provide better efficiency products, and in connection to reduce payback time by producing more electrical power. The environmental motivation more effective in Swedish culture, more than economical factor, based on wealthy and educated population. The low electrical price increasing the system payback time and reduce motivation, the prices increasing will assure the system tangibility and reduce payback time. Medium and big project mean bigger sales and more profits, such type of project will increase profits and support business development. Creating database for roofs in Sweden will support the system, since the system installed over roofs and existing of such data base will soften chances of getting more project and easier the process.
Market threats also related to environment, the low competitiveness between competitors create negative effect and lower motivating to market growth. The customers relay on solar firms to install and design the system, the poor experience of firms will create uncertainty to customers and make bad effect to product in general, in connection with solar thermal system as some customers had bad installations or products and still connecting solar thermal system to photovoltaic system. In result that will affect the photovoltaic system including the customer lack of experience within system. Firms today outsourcing operation to reduce the cost, which reduce the overhead cost but increase the total installation cost.
Sweden weather mostly cloudy and cold, with low solar radiation and cloudy day’s customer will not have confidant adopting the system. In similar, the fuzzy future support from government, always create uncertainty to customer adopting the system. The Swedish customer always want to wait until prices drop, that connected to fast price reduction during last few years and connected to the buyer culture. Bad financial solution make customer hesitate to adopt the system due to high initial cost. Firms usually outsourcing operating, but that will let subcontractor train and understand the system, then subcontractor can start doing business by their own, on other words that will reduce market entrance.
High competition between suppliers creates threats, as firms following price war to win projects, but that will reduce profits and increase risks. The unclear governmental funding and long waiting time to get the energy agency support with rumors spread about lack of funding or stopping the funding program also hardly effect the market for now and
65

future. Customer knowledge still a problem in photovoltaic technology in Sweden, customer usually do not have clear idea regarding system. Sweden insures human rights, providing good salary for everyone in Sweden, but the high labor cost create obstacle because it will increase high installation cost. Big confusion and misunderstanding about rules, and regulations. Mainly at the DNO: s (DNO: s is the Distribution Network Operator). High cost of design program consider as obstacle for solar firms. The government un-clear policy still creating big threats to the business, the government must create clear strategies with lower bureaucracy.
66
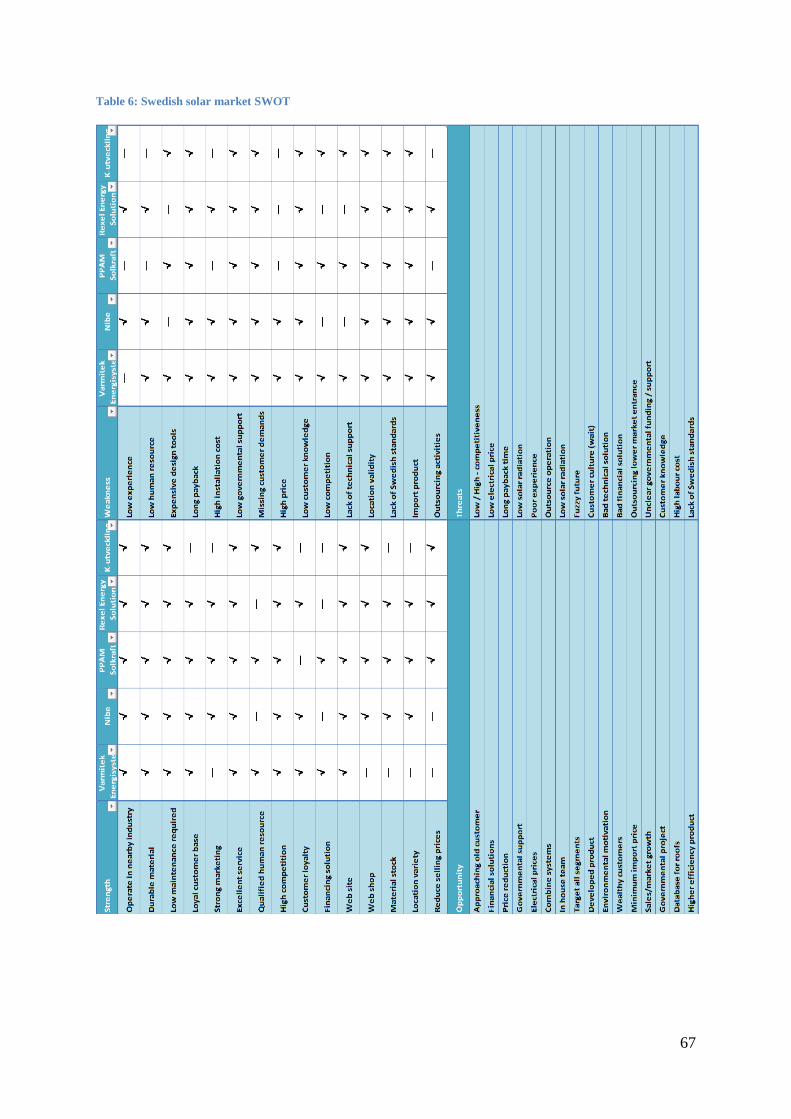
Table 6: Swedish solar market SWOT
67

The above table describe SWOT analysis, where strength and weakness related to solar firms while opportunity and threat related to market environment. The firms’ strength create solid ground to approach the market opportunities, the firms operating in nearby industry have the opportunity to approach old customers. Using the durable material give the confidant to more customers adopting the system, which result increasing sale and market growth. Low maintenance required reduce firms overhead cost, with less future problems to customer and firms, this strength will support the environmental motivation with the positive feedback from the old adopters. The strong marketing result in gaining bigger projects for privet and governmental sectors, targeting wealthy customers and increase knowledge and motivate customer to combine solar cell system with other system. Excellent service provided by firms will create good feedback from the customer, which will help the market growth and give the opportunity to hire more manpower, which will result in reducing risk and expensive due to remove the outsourcing activities. The qualified human resource give the opportunity to target different project types, since the Swedish roofs are different from other places and lack of technical database for Swedish roof, with proper team all solutions can be provided which result in market/sales growth. The competition still high at some point when it comes to price war, with the opportunity of reduce the prices in the future and product development that competition can be reduce in price matter. Customers in Sweden similar to any customer around the globe want excellent service and best prices, the loyal customer are strength for firms but total system cost create obstacle to adopt the system, for that financial solution is preferred by customer when firms targeting all market segments not only wealthy customers. The Web sites are the base for any marketing plan, but Web shop is preferred to target other customer segments and local firms. Stocking the material can be risky when no clear plans for future project but it provide great strength when it comes to cost and reduce prices, due to lower overhead cost. By the end firms, location variety gives the strength to cover wider customer areas in Sweden, and better product efficiency increase the opportunity for more power production and more system adoption in low solar radiation areas.
The connection between firms’ weaknesses and market threats are, the low experience in solar technology creates high competition between firms. The low number of human resource results in poor experience with the product, providing bad technical solution to customer that will affect future project. The system currently suffer from high payback time due to high cost of material, high installation cost, low government support and low electrical prices. With the threats of fuzzy governmental support, reducing the electricity price, high labor cost in Sweden and low solar radiation, these points will harm the market growth and create risks. Due to different roof style and design in Sweden, the firm miss the customer demands providing bad technical solutions or refuse to design systems to these customers. The customer knowledge is weakness because the customer does not understand the technical detail provided by different suppliers, and customer knowledge is threats when some suppliers provide cheap solutions harming the quality and system repetition to others. The low competitions between firms are weakness when it came to design the system, the designs is almost identical and no creativity solution can provide. Lack of technical support from some firms result increasing the total system cost, as customer rely on another firms to install the system that increase the total cost, and in some cases bad installation or limited design
68

can create bad results and missing power can provided by the system. Not all locations in Sweden are valid to install the solar system due to solar radiation, shade and other technical concerns. No clear Swedish standard until now related to firefighting regulation, electrical standard, and installation designs. The product mainly imported from abroad with limited material manufactured in Sweden, which increase the cost and create threats for future. Finally, outsourcing activities create threats as the technical knowledge moved from firms to other firms. Outsourcing lower the market entrance but create the threats of higher labor cost, which result in higher sales price.
6.6. Obstacles and barriers
An obstacle defines as object creates hardness to accomplish something, something you have to remove or pass, or something that stops the progress (Webster´s, 1994). “Barriers also can be defined as external and internal the firm, the three most important external barriers was 1- it is too easy to copy innovations, 2- government bureaucracy, 3- lack of government assistance, while the most important internal barriers were 1-lack of time, 2- inadequate research and development, design and testing within the firm, 3- inadequate financial means”. (Barth, 2004, p. 29). High obstacles can define as barriers since the firm not able to overcome those obstacles, holding back the firm development.
The following barriers are the main concentrated barriers in this study, based on previous barriers studies the following barrier have been identified based on four groups of barriers. The four groups of barriers & obstacles can internal or external barriers or tangible and intangible barriers, it can be a mix between internal, external barriers, tangible and intangible.
6.6.1. Technical barriers & obstacles
Going firms might confront limits on the rate at which they can grow. In any case, a firm ought not to enter another industry since it is in another industry. The analyzed firms are mostly in the Swedish market and enter similar market except one firm, which created to be solar firm from the beginning. Entering solar market at later stages can create barriers to this market while entering at the current stage of business can noted as the entrance with obstacles. These obstacles can bypass with suitable sources.
Expert in solar business is vital to market entrance. An obstacle can handled with selecting right people for the position at any firm. Fail to get the right people create barriers to solar market. It can create another barrier to competing with rivals. On another hand, hiring expert creates a costly obstacle. This obstacle can be a barrier with the absence of economy of scale. The technical lead creates a strong position in the market. In connection, the lack of technical information, create obstacles that increase the initial cost.
Research and development create obstacles in the absence of scale of economy, in-house manufacturing creates high market competition which none of the analyzed firms have
69

that capabilities expect one firm manufacture solar panel outside Sweden and import stock. Solar components in continuous development, the firm fail to follow that development by adopting new products and technologies face obstacles that turn into barriers. Solar companies always tried to provide different products than other competitors to overcome the similarities obstacles.
The solar market in Sweden have the obstacles of customer lack of information, the customer has no clear picture of the system, that obstacle can overcome by educating the audience. The un-ideal roof design in Sweden creates obstacles adopting the system, for that future architecture design should consider the solar system in designing the roofs. In connection, not all roofs in Sweden is optimum to install a solar system and that count as a barrier. Solar panel efficiency define the amount of power in usable while the majority of the solar panel in the market have an efficiency lower than 25%, higher solar panel efficiency cost a lot and that exhaust the total system cost. The reliability to adopt the system is low, due to long winter and unequal sunny hours during the year. However, the solar system generation is emission free but the solar panel manufacturing produces Nitrogen trifluoride which more harmful than carbon dioxide.
However, fall into educating audience to create barriers. The solar firms operating in Sweden generally are traders, importing most of the component from abroad, which consider obstacle. Lack of roof information base in Sweden is an obstacle. Each project must study manually. In connection the lack of standard roof design or material is an obstacle as well, each project need to calculate separately and that create a barrier from releasing standard solution to the Swedish solar market. On other hand, barriers must be created by an entrant to prevent rivals from imitation (Porter M. E., 1980, pp. 345-346).
6.6.2. Administrative barriers & obstacles
The governmental bureaucracy creates obstacles in the solar Swedish market, the government support not clear and the future as well. The customer desires more confident in the government support and plans, that obstacle can become barrier without the clear picture. The clear governmental support with higher financial support creates economic of scale. The minimum import price for Chinese product helps the European manufacturer to sell their products.
The government can help in audience awareness by creating campaigns to increase awareness and motivate buyers, this barrier can by overcome with the government help, but that will be hard since the government high responsibility. The future financial support government plans are not clear and that create obstacles, as the customer want to adopt the system but the plans are not clear. Low electricity price lowers the system adopting, increasing payback time which creating obstacle. Another administrative obstacle is in some areas the owner needs to get more approval from the municipality for installing the system became “the way it looks and if it’s ok with neighbours to install the system or not as they have certain design for the area and don’t want to change it and it can take until 6 weeks.”
70

6.6.3. Market environment barrier & obstacles
The market competition creates obstacles, as competitors start a price war to win the project, that reduces sales, and increase costs, which create an obstacle, can turn into serious barriers. To overcome this obstacle the firm need to import products and stock them in Sweden, but that required big investment capital, which is another obstacle, that obstacle, could overcome by the big market player, otherwise this obstacle count as a barrier for smaller firms. The Swedish customer culture is different, as the customer always want to wait until price drop and that is an obstacle. Low solar radiation lowers the system adopting, increasing payback time which creating obstacle. Customer loyalty is high to firms they are familiar with. Firms operate in the Swedish market for a long time. These firms can sell at higher prices due to the brand loyalty, in the connection that counts as an obstacle to new established or unknown firms. However, the customers had bad imagination regarding the solar thermal system in Sweden and connecting that fail to a photovoltaic system. Higher entrance cost required when solar firms’ stock products in Sweden, as they reduce the cost and that create obstacle can overcome with high investment capital. The customers consider the product as a high-risk solution, the system installation over roof create uncertainty to the customer, the uncertainty based on the possibility to damage the roof or the system capability to face the extraordinary weather in Sweden.
6.6.4. Economical barrier & obstacles
High initial cost creates obstacles for new system adopters, which obstacles can overcome with financial solutions provided by a bank or solar firms. In connection high initial cost required to create a solar firm in Sweden, that obstacle can be a barrier in many cases. Low electricity price and long payback time is part of economic obstacles can overcome as explained earlier. The current payback time between 9-12 years, which create an obstacle to adopting the system. The solar price was drop since the last ten-year and the installation cost as well and the solar component as well.
A current firm operating in Sweden have the privilege to reduce the selling price and competes with new entrants, the firm with it is own installation teams and stock products in Sweden have the cost privilege to another firm without these options, that create obstacles developed to be barriers to getting orders. Marketing expenses are sunken expenses, and successful marketing needs a huge least scale. Lower marketing expenses give strength to firms, using free and available tools help in that matter. Firms without cheap marketing tools have a higher cost, which counts as an obstacle. The high cost of design tools is an obstacle for market entrance. This obstacle can create a barrier with the lack of capital. The high cost of hiring experts both in design and installation count as an obstacle to the solar market. The government has a complicated procedure for users to sell electricity, and long waiting time to get the financial support from energy agency. That consider, as a barrier to the solar system and the government have to simplify the procedure and be faster in paying the financial support to users.
71

6.7. Similarities and un-similarities
The solar system has similarities with electrical car, but the electrical car manufacturer has problems with distance limitation. As port of technical and economical obstacles, the battery charge and prices, but TESLA cars, for example, have created the super charge station all over Europe with short time charging to pass the charging obstacles and reduce the car price by creating cheaper car (35,000USD) The third generation of TESLA cars. In connection, Tesla has plans to reduce the car cost and increase the supercharging stations numbers all over west Europe where they predict market growth. Other companies focused on combining the electrical engine with a petrol engine to avoid the battery limitations. The government supports the electrical car industry by remove taxes, free charging station, free parking.
The wind turbine has environmental obstacles and limited power output, the Siemens company create bigger wind turbine with 9 megawatt output capacity, the environmental obstacles companies started to install offshore wind turbines, another environmental problem created by power transfer from offshore to the land and companies created the DC generator output wind turbine to avoid the effect of the sea life, still more obstacles created by foundation and the development in that part still going to reduce that effect, noise problems was reduces by creating lower noise wind blades, but the shadow effect still a problem in that industry. In connection, high initial cost (economical obstacles) and long bureaucracy (Administrative obstacle) to get governmental approval still a big obstacle in that industry.
Solar thermal industry has environmental obstacle, as the system need special liquids, but environment-friendly liquids invented. The industry has high initial cost and long payback time, which count as existing technical barrier. Low knowledge and lack of information still count as an obstacle to adopting the solar thermal technology. Customers had a bad experience with the solar thermal system due to bad installation and low ambient temperature, that bad experience customers still connected to the photovoltaic system. The low government support count as the main obstacle to adopting the system, and existing of better solutions make the innovation less interesting to customers.
Photovoltaics industry can create remarkable jobs for those who desire to work in the renewable field. Increase the economy scale and helping the environment. The new entrant required high capital with experience in the solar field to enter the market, studying the market obstacle and barrier to avoid fail. Understanding the market is the key success for any business creation, choosing the right entrance time is important especially with promising industries. The business life cycle still in the beginning and the entrance barriers are lower in early stages. With right capabilities entrant can make the way to new market as described earlier. The firms with the right opportunity and strength can easily enter the market, develop avoiding obstacles and barriers by using internal capabilities, and use the market appropriateness to firms favor. In other meaning, the results are golden to the firm. The firms with weakness and environment threats can hardly survive in any market and a similar situation can prevent the firm from entering the market, create high barrier cannot bypass it.
72

Even with firms already in the market, a similar situation can prevent firm development and stop the operations.
73

Conclusion and Recommendation In this chapter the researcher, provide answers to research questions, describing the
market entrance barriers and obstacles, and the main four barriers and obstacles identified by the researcher. Finally, the chapter ends with a recommendation. Based on previous chapters, the researcher refers to literature, solar annual reports, and interviews. In this chapter, the researcher will answer the two research questions and define the obstacles and barriers to entering the Swedish solar market. Defining four types of market obstacles and barriers, and the chapter ends with a recommendation.
7.1 Research question one
RQ1: What is the predicted future for solar market in Sweden?
In order to answer the above research question the researcher will refer to annual energy reports, interviews, explaining the market opportunity and threats for the solar market future. The Swedish solar market potential is high especially the country support green technologies, the target to reach 50% of produced power from the renewable source. Also, Sweden considered as one of the leading in solar research and development, gate open for solar system manufacturing as well. The installation of solar cell system was more than double since 2011, the numbers predicted to be increase in coming years based on simplified system operation, low annual procedures, and long operation life, in total the opportunity created to integrate the system to premises next to the electrical demands. More users implementing the system to reduce energy consumption, generate their own electricity, and take part of reducing pollution (Skåne, 2015).
The Swedish Energy Agency set a budget of 123 Million SEK, between 2013-2016, to support the photovoltaic technology. The system installation quantity, prediction to continue on the same level based on the current situation for the coming few years, as the governmental support continues at the same level. However, the system adoption can tremendously increase if the government decide to increase the support in different aspects.
The price predicted to decrease due to continuously innovation in photovoltaic technology, increasing the efficiency, power production, and finding better solutions. On another hand, the installation cost will reduce due to increased installed systems in Sweden, installers became familiar with the system, and installers will find better and easier solutions to fastening the system especially when more projects will install. The installer will find a better solution to design the systems on Swedish roofs. Installer will get experience when facing obstacles with different roofs designs. The current selling prices between 11-17 SEK/kWp, depends on the system size, the prices relation with system size is vice versa, bigger system mean lower price in most cases. The low electrical prices are an obstacle to adopting the system, but the annual electricity price increase is 2%, the prices cannot be lower than current numbers, the electrical power prices increment will help to reduce the payback time by increase the annual profits from selling the electricity to the grid.
74
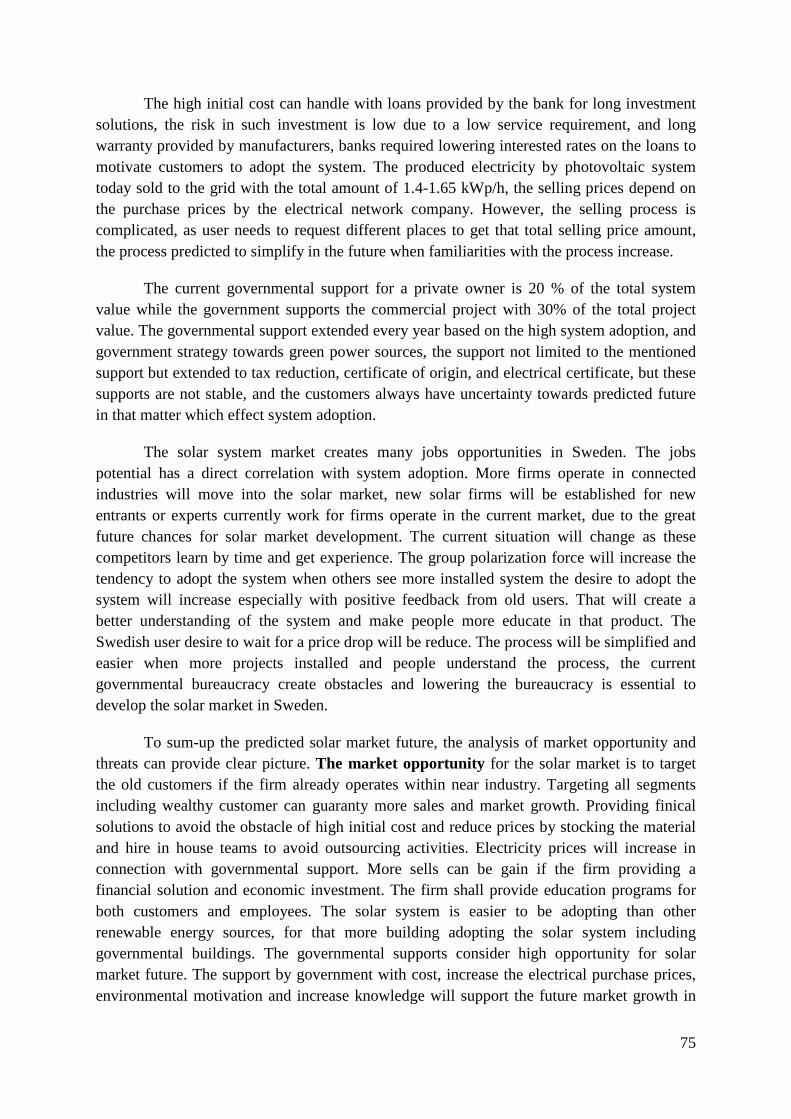
The high initial cost can handle with loans provided by the bank for long investment solutions, the risk in such investment is low due to a low service requirement, and long warranty provided by manufacturers, banks required lowering interested rates on the loans to motivate customers to adopt the system. The produced electricity by photovoltaic system today sold to the grid with the total amount of 1.4-1.65 kWp/h, the selling prices depend on the purchase prices by the electrical network company. However, the selling process is complicated, as user needs to request different places to get that total selling price amount, the process predicted to simplify in the future when familiarities with the process increase.
The current governmental support for a private owner is 20 % of the total system value while the government supports the commercial project with 30% of the total project value. The governmental support extended every year based on the high system adoption, and government strategy towards green power sources, the support not limited to the mentioned support but extended to tax reduction, certificate of origin, and electrical certificate, but these supports are not stable, and the customers always have uncertainty towards predicted future in that matter which effect system adoption.
The solar system market creates many jobs opportunities in Sweden. The jobs potential has a direct correlation with system adoption. More firms operate in connected industries will move into the solar market, new solar firms will be established for new entrants or experts currently work for firms operate in the current market, due to the great future chances for solar market development. The current situation will change as these competitors learn by time and get experience. The group polarization force will increase the tendency to adopt the system when others see more installed system the desire to adopt the system will increase especially with positive feedback from old users. That will create a better understanding of the system and make people more educate in that product. The Swedish user desire to wait for a price drop will be reduce. The process will be simplified and easier when more projects installed and people understand the process, the current governmental bureaucracy create obstacles and lowering the bureaucracy is essential to develop the solar market in Sweden.
To sum-up the predicted solar market future, the analysis of market opportunity and threats can provide clear picture. The market opportunity for the solar market is to target the old customers if the firm already operates within near industry. Targeting all segments including wealthy customer can guaranty more sales and market growth. Providing finical solutions to avoid the obstacle of high initial cost and reduce prices by stocking the material and hire in house teams to avoid outsourcing activities. Electricity prices will increase in connection with governmental support. More sells can be gain if the firm providing a financial solution and economic investment. The firm shall provide education programs for both customers and employees. The solar system is easier to be adopting than other renewable energy sources, for that more building adopting the solar system including governmental buildings. The governmental supports consider high opportunity for solar market future. The support by government with cost, increase the electrical purchase prices, environmental motivation and increase knowledge will support the future market growth in
75

both private and governmental projects. The solar system has long operation life with low service. The system became a lifestyle by wealthy people and people seeking long investment periods. The new entrant must target governmental projects as usually these projects are medium to large size, which will ensure the huge profits at the firm start that can cover most of the expenses, give a big push to firm entering the solar market. The system efficiency predicted to increase in the coming years. The minimum import price reduces the risk, but the developed product can increase the system efficiency and reduce the payback time. Finally, a database for Swedish roofs can make it easier to target the proper location for new installation.
The market threats are both high/low competition, as both have negative and positive effect on market growth. Firms at the beginning with limited financial capabilities must outsource part of the operation due to the high cost of hiring special teams for each task, while design must be in-house operation. The Swedish customer always wants to wait for prices to reduce, but if the customer decides to wait for another year before installing the system then he/she will lose the opportunity to produce and sell electricity for one more year. The future governmental support not clear includes the electricity future prices since the current prices are very low in Sweden. The unclear governmental support and electrical price still make concern to customers, especially when these customers have low knowledge about the system and the lack of Swedish standard to solar system as explained earlier. Bad technical solutions provided by unqualified competitors provide a bad image to customers, in connection to bad experiences the customers had with solar thermal technology in Sweden. Bad economic guidance is discouraging system adopting. The low number of sunny days around the year in Sweden also discouraging system adopting, higher efficiency system can avoid that obstacle. The system mostly imported from another country, system price and access available for almost all competitors, no Swedish manufacturer produce a competitive solar panel, for example, other firms decide to produce the product in another country and imported the produce to Sweden due to low manufacturing cost. New entrants can decide between two option either to stock the material in Sweden but that required high initial capital and increase risk, or to import the products according to actual demands, firm must update their price list because prices going up and down due to currency exchange rate differences and new modules supplied to market by manufacturers.
The low competence and poor experience in Swedish solar market affecting the market growth, plus high selling prices and high labour cost. Other firms started price competition and hardly gain profits from winning projects, the customer does not totally understand the system and some firms take advantage of that to sell the product.
7.2. Research question two
RQ2: How can entrant make a solar market entrance in Sweden?
In order to answer the above research question the researcher relies on theories, national reports, and interviews with firms operate in Swedish solar market. The diffusion of
76
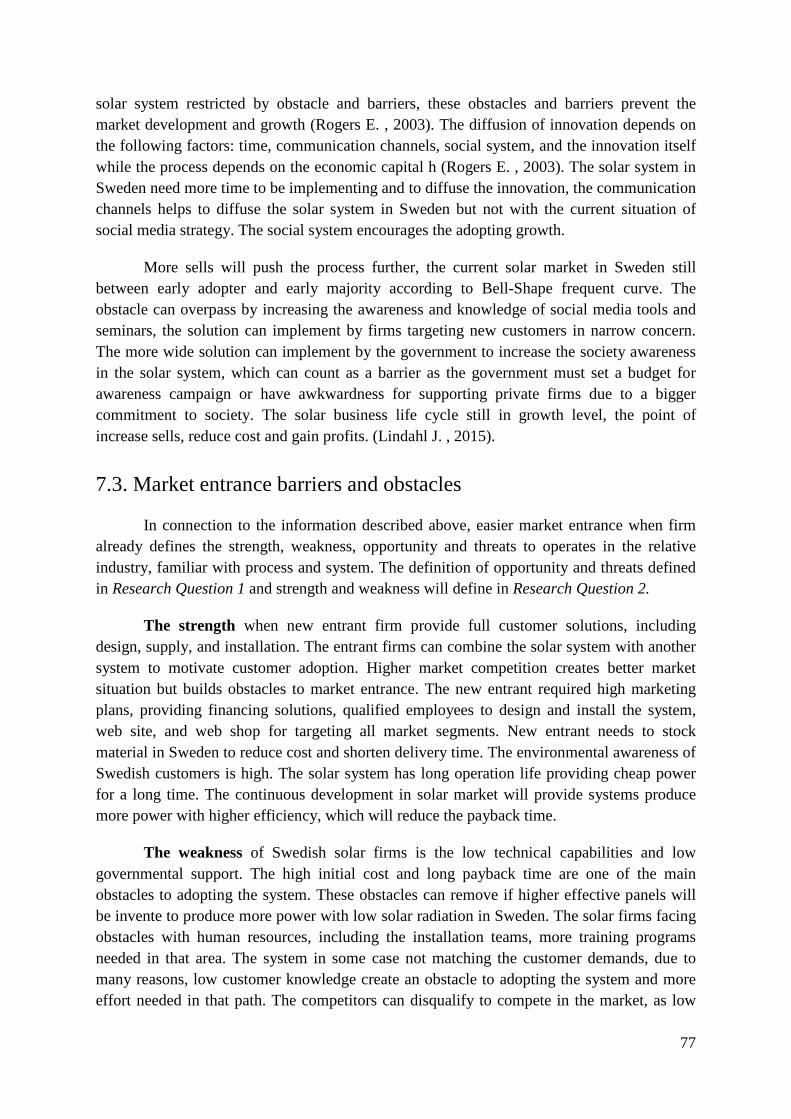
solar system restricted by obstacle and barriers, these obstacles and barriers prevent the market development and growth (Rogers E. , 2003). The diffusion of innovation depends on the following factors: time, communication channels, social system, and the innovation itself while the process depends on the economic capital h (Rogers E. , 2003). The solar system in Sweden need more time to be implementing and to diffuse the innovation, the communication channels helps to diffuse the solar system in Sweden but not with the current situation of social media strategy. The social system encourages the adopting growth.
More sells will push the process further, the current solar market in Sweden still between early adopter and early majority according to Bell-Shape frequent curve. The obstacle can overpass by increasing the awareness and knowledge of social media tools and seminars, the solution can implement by firms targeting new customers in narrow concern. The more wide solution can implement by the government to increase the society awareness in the solar system, which can count as a barrier as the government must set a budget for awareness campaign or have awkwardness for supporting private firms due to a bigger commitment to society. The solar business life cycle still in growth level, the point of increase sells, reduce cost and gain profits. (Lindahl J. , 2015).
7.3. Market entrance barriers and obstacles
In connection to the information described above, easier market entrance when firm already defines the strength, weakness, opportunity and threats to operates in the relative industry, familiar with process and system. The definition of opportunity and threats defined in Research Question 1 and strength and weakness will define in Research Question 2.
The strength when new entrant firm provide full customer solutions, including design, supply, and installation. The entrant firms can combine the solar system with another system to motivate customer adoption. Higher market competition creates better market situation but builds obstacles to market entrance. The new entrant required high marketing plans, providing financing solutions, qualified employees to design and install the system, web site, and web shop for targeting all market segments. New entrant needs to stock material in Sweden to reduce cost and shorten delivery time. The environmental awareness of Swedish customers is high. The solar system has long operation life providing cheap power for a long time. The continuous development in solar market will provide systems produce more power with higher efficiency, which will reduce the payback time.
The weakness of Swedish solar firms is the low technical capabilities and low governmental support. The high initial cost and long payback time are one of the main obstacles to adopting the system. These obstacles can remove if higher effective panels will be invente to produce more power with low solar radiation in Sweden. The solar firms facing obstacles with human resources, including the installation teams, more training programs needed in that area. The system in some case not matching the customer demands, due to many reasons, low customer knowledge create an obstacle to adopting the system and more effort needed in that path. The competitors can disqualify to compete in the market, as low
77

knowledge can continue to firms not only customers. Sweden did not set standards for voltage fluctuations and flicker for solar inverters, and each inverter needed to reprogram upon to network provider standards. The governmental bureaucracy is the main obstacles to selling the system, the procedure predicted to reduce when highly system adoption archives.
The empirical finding indicates that the character of the firms will force the firms to face different kind of obstacles and barriers, strengths and weaknesses. Varmitek Energisystem ab, sales and manufacture heat pumps, install solar thermal system, and have long list of loyal customers and the firm targeting old customer to sale the photovoltaic system. The firm import the material and outsource the installation to sub-contractors. Nibe the second analysed firm, sales the heat pump in Sweden and other countries around the world, the firm have great and famous brand name and use their brand name to sale the product, the firm provide limited range of product in certain sizes without consideration of different project requirements or design. The firm aim to combine the solar system with heat pump to reduce power consumption, installation, and design of the product carry by buyer or installer. The third analysed firm was PPAM Solkraft, the firm operate in many parts of Sweden with special installation teams, the firm manufacture it is own product in China, the firm have high competitive position in the market since the firm strength support the core competence. The forth-analysed firm was Rexel Energy Solution, the firm target the installer and privet customer through web-shop, Rexel has strong name in the market and operate in different places around the world since long time, the firm sale product without technical support into design and technical details. The last analysed firm was K-utveckling, the firm operate mainly in project management and consulting projects. The solar department quite new and the firm targeting all size of project based on the technical teams in the firm to design and install the system, the firm still new, finding their way into solar market in Sweden not easy task, the firm manage to sale and install many projects.
7.3.1. Green light to market
To make market entrance into Sweden, a connection between firm strength and market opportunities required to support the market entrance. Firm strength will open gate to take advantage of market opportunities. The firms operate in Sweden can approach old customers. Excellent service by firms can approach wealthy customers. Qualified human resource will guaranty in house team, providing solutions to combine the system with other systems. The qualified team can follow the fast development market. Strong marketing by firm will help targeting all market segments based on environmental aspects. System long life and low service provide the strength to adopt the system by wealthy/normal customer and increase governmental projects. Wide base of old customer with customer loyalty will guaranty sales and market growth. Firm with location variety and large stock will guaranty price competition and easily reach to customers. Increase governmental support and electrical prices will help market development in Sweden.
78

7.3.2. Red light to market
The red light points to market entrance are important for firm entering the solar market in Sweden. A connection between firm weakness and market threats required to avoid the market obstacles and barriers. Firm weakness will close gate especially if connection made to market threats. Firms should avoid such combination or avoid the weaknesses directly connection to market threats. Low experience and low number of human resource will support the threats of low experience and low competitiveness. Long payback time, low electrical prices, and low solar radiation are main weakness in Swedish solar market in connection with market threats of bad technical and lack of financial solutions. The expensive design tools and high installation cost consider weaknesses connected to threats of outsourcing operation. Low government support build fuzzy future picture to solar market. Not meeting customer demand connected to both customer and supplier knowledge. High selling price connected to high labour cost in Sweden and import the material from abroad. The uncertainty government support connected to unclear governmental future funding. Low marketing plans connected to threats of waiting customer to make decision and customer low knowledge.
In result, firms must use the firm strength to take advantage of market opportunity. While firm with weakness, should avoid market threats, or over pass them to lower market barrier entrance.
7.4. Type of barriers and obstacles
The four types of barriers and obstacles have similarities between categories and share commonality. The four types of identified barriers in this research can be external or internal, tangible and intangible barrier and obstacles. The technology easy to copy by others, the government bureaucracy, and lack of government support, is part of external barriers and obstacles. While internal barriers and obstacles are, lack of time, inadequate R&D, design, and testing within the firm, adequate financial means.
7.4.1. Technical obstacle and barriers
Firms operate in the market with nearby activity can move to solar market, the initiated requires hiring experts within the product which create high initial cost. The customers have limited information about the system, and un-ideal roof design is main problems to adopt the system. Importing the solar system components from abroad, and fail to adopt the most developed products are part of technical obstacles.
Supply one type of material hold the firm increase sells and win new projects. Lack of information regarding Swedish roofs, each project must study separately, cannot standardize the products based on un-similarities of roof designs. Low solar panel efficiency and low reliability to adopt the system.
79

7.4.2. Administrative barriers & obstacles
The research found that governmental bureaucracy, and unclear governmental support, lack of awareness campaigns from the government to educate and support the product are the main administrative barrier and obstacles. In addition, Low electricity price create obstacles, and in some areas, special building permit required to install the system.
7.4.3. Market environment barrier & obstacles
The competition in the solar market still lows despite the fact of existing of a price war between competitors. The customers wanted the price to drop, the customers noted to be loyal to famous brand names as the population looking for high-quality products. The Swedish weather has many cloudy days with low solar radiation and low electrical selling prices. The customers have bad previous experience with the solar thermal system and connect that to a photovoltaic system. The customers have uncertainty to adopt the system and install it on their roofs.
7.4.4. Economical barrier & obstacles
The high initial cost of adopting the system with low el price creates long payback time. It also connected to high installation cost. The expensive marketing cost in Sweden and the high cost of design tools create obstacles to adopting the system. In addition, hiring employees create high initial cost. The complicated electricity selling procedure and long waiting time to get the financial support from energy agency preventing customers from adopting the system and create obstacles.
7.4. Suggestions for further study
This research concentrate on the current market situation, more study need to make when the governmental policies changes and electricity prices increase. The research investigates the market obstacles and barriers in general, the suggestion for further research to include each four main categories in more depth study. The analysed firms represent small samples of Swedish solar firms operating in Sweden, each firm have special situation in the market since each firm has different size and sources. The five firms are different in different prospects, and the characteristic that make them distinctive from each other might affect the barriers and obstacles, for that more firms need to be analyse with consideration to size and sources. Further studies needed investigating the firm size on market growth.
The photovoltaic system share similarities with other renewable source, each source affect other sources of power in Sweden. For that, more studies need to investigate the effectiveness between renewable sources market growth. Obstacles and barriers can be vary depend on market and products changes in the future. The research neglected the firms’ size, concentrating on firm operating in the current market, identifying obstacles and barriers to market entrance.
80

81

BibliographyRobinson & McDougal. (2001). Entry barriers and new venture performance: a comparison
of universal and contingency approaches. Strategic Management Journal, Volume 22, pp. 659–685.
Al-Mimar, S. (2015). Integration of solar and wind power at Lillgrund wind farm. Halmstad: Halmstad University .
Alvarez & Busenitz. (2001). The entrepreneurship of resource-based theory. Journal of Management, vol. 27, 755-775.
Asikainen, K. (2012). Barriers to Entry in a Regulated Industry: Tackling Barriers to Entry with Limited Resources - The Entrant Perspective. Espoo, Finland: Aalto University.
Audretsch, D. (1995). Innovation and Industry Evolution. Cambridge: MIT Press. Audretsch, D. B. (1995). Innovation and industry evolution. London: Mit Press. Bain, J. (1956). Barriers to New Competition. Harvard University Press: Cambridge, MA. Barber, J., Metc.alfe, J. S. & Porteous, M. (1989). barriers to Growth in Small Firms.
London: Routledge. Barkema, Bell & Pennings . (1996). Foreign entry culture barriers and learning. Strategic
Management Journal, vol. 17, 151-166. Barney, J. (1991). Firm resources and sustained competitive advantage. Journal of
Management, pp. 99-120. Barth, H. (2004). “Barriers to growth and development in small firms” Doctoral Thesis.
Luleå: Luleå University of Technology. Bartlett & Bukvić. (2001, 06). Barriers to SME growth in Slovenia. MOST: Economic Policy
in Transitional Economies, pp. 177-195. Bartusch, C., Wallin, F., Odlare, M., Vassileva, I., & Wester, L. (2011, 06 013). Introducing a
demand-based electricity distribution tariff in the residential sector: Demand response and customer perception. Energy Policy, pp. 5008-5025.
Bhave, M. (1994). A Process Model of Entrepreneurial Venture Creation. Journal of Business Venturing, 9, 223-242.
Bird, B. (1992). The Operation of Intentions in Time: The Emergence of the New Venture. Entrepreneurship Theory and Practice, 17,1, 11-20.
Blaikie, N. (2009). Designing social research: The logic of anticipation. Polity. Blees, J., Kemp, R., Maas, J. & Mosselman, M. (2003). Barries to Entry Differences in
barriers to entry for SMEs and large enterprises, SCALES Research Report H200301. New York.
Bosworth & Jacobs. (1989). Managment attitudes, behavoir, abilities as barriers to growth. In Barber, J. et al. (eds.), Barriers to Growth in Small Firms. London: Routledge.
Box, C. T. (2015, 06 01). Chapter 3. Retrieved from Section 14. SWOT Analysis: Strengths, Weaknesses, Opportunities, and Threats: http://ctb.ku.edu/en
Bryman & Bell. (2011). Business research method. New York: Oxford University Press Inc. Bryman & Bell. (2011). Business research method. New York: Oxford University Press Inc. Clark & Mongomery. (1998). Deterrence Reputations and Competitive Cognition.
Management Science, vol. 44, no. 1 , 62-82.
82

Cook, K. J. (1994). The AMA Complete Guide to Strategic Planning for Small Business. NTC: Lincolnwood.
Cook, K. J. (1995). Cook, K. J. (1995). The AMA Complete Guide to Strategic Planning for Small Business. American Marketing Association,., pp. 1-38.
Cullman, A., Schmidt-Ehmckey, J.& Zloszystiz, P. . (2012). R&D efficiency and barriers to entry: a two stage semi-parametric DEA approach. Oxford Economic Papers, Vol. 63, 176-196.
De Ruyter, K., Bloemer, J. & Wetzels, M. (1998). On the relationship between perceived service quality, service loyalty and switching costs. International Journal of Service Industry Management, Vol. 9, No. 5, 436-453.
Demsetz, H. (1982). Barriers to Entry . American Economic Review, vol. 72, no. 1, 47-57. Denscombe, M. (2007). The Good Research Guide 3rd edn. Buckingham: Open University
Press. Devinney, T. (1987). Entry and Learning. Management Science, vol. 33, no. 6, 706-724. Dixit, A. (1980). The Role of Investment in Entry-Deterrence. Economic Journal, vol. 90, no.
357 , 95-106. E Hansen & K Allen. (1992). The Creating Corridor: Environmental Load and Pre-
Organization Information Processing. Entrepreneurship Theory and Practice 17, 1, 57-65.
Eaton & Lipsey. (1980). Exit barriers are entry barriers: the durability of capital as a barrier to entry. Bell Journal of Economics , 721-729.
Edler & Georghiou. (2007). Public Procurement and Innovation. Resurrecting the Demand Side, Research Policy, Vol. 36, 949-963.
Energimyndigheten. (2015, 10 21). Förnybart, Stöd till solceller. Retrieved from Energimyndigheten: https://www.energimyndigheten.se/fornybart/solenergi/stod-till-solceller/
Eurelectric. (2013). Network tariff structure for a smart energy system. Brussels.: www.eurelectric.org.
Farrell & Shapiro. (1988). Dynamic competition with switching costs. Rand Journal of Economics, vol. 19, no. 1, 123-137.
Fisher, C. (2007). Researching and Writting a Dissertation: A Guidebook for Business Students (2nd Edition ed.). Harlow: Pearson Education Limited.
Flamholtz, K. (1986). How to make the transition from an entrepreneurship to a professionally managed firm. San Francisco: Jossey- Bass Publishers.
Friedman, P. & Taylor, B. (2011). Barriers to Entry and Institutional Evolution. Bahamas: The Seasteading Institute.
Friedman, P.& Taylor, B. (2011). Barriers to Entry and Institutional Evolution-Working paper. Nassau: In Association of Private Enterprise Education Conference.
Frynas, J.G, Mellahi, K, Pigman & G.A. (2006). First Mover Advantages in International Business and Firm-specific Political Resources. Strategic Management Journal, Vol. 27, 321-345.
Gaskins, D. (1971). Dynamic limit-pricing: Optimal pricing under threat of entry. Journal of Economic Theory, vol. 2, 306-322.
83

Gatignon, H., Robbertson, T.& Fein, A. (1997). Incumbent defence strategies against new product entry. International Journal of Research in Marketing, vol. 14, 163-176.
Gaynor & H. Wilson. (1998). Change Consolidation and Competition in Health Care Markets. National Bureau of Economic Research, Working Paper 6701.
Gerlach & Wagner. (1994). Regional differences in small firm entry in manufacturing industries: Lower Saxony, 1979–1991†. Entrepreneurship & Regional Development, 6(1), 63-80.
Geroski, P. (1991). Market dynamics and entry. . Oxford, Oxfordshire, UK Cambridge, Massachusetts, USA: B. Blackwell Publishers.
Geroski, P. A. (1995). What do we know about entry? International Journal of Industrial Organization, 13(4), 421-440.
Geroski, P., Gilbert, R. & Jacquemin, A. (1990). Barriers to Entry and Strategic Competition. Fundamentals of Pure and Applied Economics 41, p. Harwood Academic Publishers GmbH.
Gibbert, M., Ruigrok, W. and Wicki, B. (2008). What passes as a rigorous case study? . Strategic Management Journal, 29 (13), 1465-1474.
Giraud-Héraud, Hammoudi & Mokrane. (2003). Multiproduct firm behaviour in a differentiated market. Canadian Journal of Economics, Vol. 36, 41–61.
Gollier, C. (1991). Wage Differentials, the Insider–Outsider Dilemma, and Entry-Deterrence. . Oxford Economic Papers, 43(3), 391-408.
Grant, R. (1991). The resource-based theory of competitive advantage: Implications for strategy formulation. California Management Review, 114-135.
Grix, J. (2004). The Foundations of Research. In J. Grix, Palgrave Study skills (p. 63). palgrave macmillan.
Hall, R. (1992). The Strategic Analysis of Intangible Resources. Strategic Management Journal, vol. 13, 135-144.
Han, J., N. Kim & H. Kim. (2001). Entry Barriers: A dull-, one- or two-edged sword for incumbents? Unravelling the paradox from a contingency. Journal of Marketing, Vol. 65, No., pp. 1-14.
Harrigan, K. (1981). Barriers to entry and competitive strategies. Strategic Management Journal, vol. 2, no. 4, 395-412.
Harrigan, K. (1983). Entry barriers in mature manufacturing industries. Advances in Strategic Management, vol. 2,, 67-97.
Hay, D.& Morris, D. (1991). Industrial Economics and Organization: Theory and Evidence. New York: Oxford University Press:.
Hermans, R., Kamien, M., Kulvik, M., Löffler, A.& Shalowitz, J. (2009). Hermans, Medical innovation and government intervention - Reconciling interest to create stakeholder value. Helsinki: Taloustieto Oy.
Hisrich, R. D., Peters & M. P. (2002). Entrepreneurship 4th ED. Irwin: McGraw Hill. Hochberg, Ljungqvist & Lu. (2010). Networking as a Barrier to Entry and the Competitive
Supply of Venture Capital. The Journal of Finance, vol. LXV, no. 3. Hofer, W.C & Charan, R. (1984). The Transition to Professional Management: Mission
Impossible. American Journal of Small Business, Vol. 4, no. 1, 1-12.
84

Hoppe, T. (2012, 09 26). Adoption of innovative energy systems in social housing: Lessons from eight large-scale renovation projects in The Netherlands. Energy Policy 2012, pp. 791-801.
Hoppe, T. (2012, 09 26). Adoption of innovative energy systems in social housing: Lessons from eight large-scale renovation projects in The Netherlands. Energy Policy 2012, pp. 791-801.
I. Kostakis & E. Sardianou. (2011, 07 02). Which factors affect the willingness of consumers to adopt renewable energies? Renewable Energy 2012, pp. 1-4.
J. Martinsson, L. J. Lundqvist & A. Sundström. (2011, 06 17). Energy saving in Swedish households. The (relative) importance of environmental attitudes. Energy Policy 2011, pp. 5182-5191.
Jager, W. (2005, 02 01). Stimulating the diffusion of photovoltaic systems: A behavioural perspective. Energy Policy, pp. 1935-1943.
Johnson, P.& Clark, M. (2006). Mapping the terrain: an overview of business and management research methodologies, Business and Management Research Methodologies. London: Sage.
Kalin, C. (2012, 06 02). Chamber Trade Sweden. Retrieved from The Swedish market: http://chambertradesweden.se/2012/06/02/the-swedish-market/
Karakaya & Stahl. (1989). Barriers to entry and market entry decisions in consumer and industrial goods markets. Journal of Marketing, Vol. 60, 87-102.
Karakaya, F. (2002). Barriers to Entry in Industrial Markets. Journal of Business and Industrial Marketing, Vol. 17, No. 5, 379-388.
King & Zeithaml. (2001). Competencies and Firm Performance: Examining the Causal Ambiguity Paradox. Strategic Management Journal, vol. 22, 75-99.
Kleijweg & Lever. (1996). Entry and Exit in Dutch Manufacturing Industries . Review of Industrial Organization, vol. 11, 375-382.
Klemperer, P. (1992). Competition When Consumers Have Switching Costs: An Overview. CEPR Discussion Paper Series 704 .
Krouse, C. (1984). Brand name as a barrier to entry: The ReaLemon case. Southern Economic Journal, vol. 51, 495-502.
Lieberman & Montgomery. (1998). Strategic Management Journal. Volume 9, Issue Special Issue: Strategy Content Research, pp. 41-58.
Lieberman, M. (1987). Excess Capacity as a Barrier to Entry: an Empirical Appraisal. Journal of Industrial Economics, vol. 4, 607-627.
Lindahl, J. (2013). National Survey Report of PV Power Applications in SWEDEN 2013. Uppsala: International Energy Agency.
Lindahl, J. (2013). National Survey Report of PV Power Applications in SWEDEN 2013. Uppsala: International Energy Agency.
Lindahl, J. (2015). National Survey Report of PV Power Applications in SWEDEN 2014. Uppsala: International Energy Agency.
Lucky Look, Tom Hargreaves, Micke Persson, Jerry Gladh, et. (2015). ANNUAL REPORT · 2015. Laholm: NIBE INDUSTRIER AB.
Lutz, C., Kemp, R. & Dijkstra, S. (2010). Perceptions regarding strategic and structural entry barriers. Small Business Economics, Vol. 35, 19-33.
85

Macpherson, A. & Holt, R. (2007). Knowledge, Learning and SME Growth: A Systematic Review of the Evidence. Research Policy, vol.36 (2), 172-192.
Madhok, A. (1996). Know-how, Experience and Competition related Considerations in Foreign Market Entry: an Exploratory Investigation. International Business Review, vol. 5, no. 4, 339-366.
McEvily, S.K., Das, S., McCabe, K. (2000). Avoiding Competence Substitution through Knowledge Sharing. Academy of Management Review, vol. 25, no. 2, 294-311.
McGee, J. (1989). Barriers to Growth: the Effects of Market Structure. In Barber, J. et al. (eds.), Barriers to Growth in Small Firms. Londen: Routledge.
Modigliani, F. (1958). New developments on the oligopoly front. The journal of political economy, 215-232.
Morris, T. and Wood, S. (1991). Testing the survey method: continuity and change in British industrial relations. Work Employment and Society, Vol. 5, No. 2, 259–282.
Mosakowski, E. (1997). Strategy Making under Causal Ambiguity: Conceptual Issues and Empirical Evidence. Organization Science, vol. 8, no. 4, 414-442.
Mullins, L. (2010). “Management and Organizational Behaviour” 9th Edition. Pearson Education.
Nalebuff, B. (2004). Bundling as an entry barrier. The Quarterly Journal of Economics, Vol. 119, No. 1, 159-187.
Netter, J. (1983). Political competition and advertising as a barrier to entry. Southern Economic Journal, vol. 50, 510-520.
Palm, A. (2014, 12 17). An emerging innovation system for deployment of building sited solar photovoltaics in Sweden. Environmental Innovation and Societal Transitions, p. 15.
Palm, J. (2013, 01 01). Energy Efficiency in Tenant–Owners' Residences: The Process of Going from Objective to Implementation. Housing Studies, pp. 57-73.
Pehrsson, A. (2009). Barriers to entry and market strategy: a literature review and a proposed model. European Business Review, Vol. 21, No.1 , 64-77.
Pihkala, T., Ylinenpää, H. & Vesalainen, J. (2002). Innovation barriers amongst clusters of European SMEs. International Journal of Entrepreneurship and Innovation Management, Vol. 2, Iss. 6; pp., pp. 520-536.
Policy, E. T. (2016). The European Union's Measures against dumped and subsidised imports of solar Panels from China. Brussels: European Commission.
Porter, M. (1985). Competitive advantage: Creating and sustaining superior performance. New York: The Free Press.
Porter, M. E. (1980). Competitive Strategy: Techniques for Analyzing Industries and Companies. Free Press.
Porter, M.& Kramer, M.R. (2011). Creating Shared Value. Harvard Business Review, vol. 89, 62-77.
Prabhu & Stewart. (2001). Signalling Strategies in Competitive Interaction: Building Reputations and Hiding the Truth. Journal of Marketing Research, vol. 38, 62-72.
Prantl, S. (2012). The impact of firm entry regulation on long-living entrants. Small Business Economics, Vol. 39 , 61-76.
86

R. Margolis & J. Zuboy. (2006). Nontechnical Barriers to Solar Energy Use Review of Recent Literature. Colorado: National Renewable Energy Laboratory.
Reed & Defillippi. (1990). Causal Ambiguity: Barriers to Imitation and Sustainable Competitive Advantage. Academy of Management Review, vol. 15, no. 1, 88-102.
Reijmer & van Noort. (1999). Location choice of SMEs (No. B199804). EIM Business and Policy Research.
Roberts, J. (1989). Perfectly and imperfectly competitive markets: In Allocation, Information and Markets. Palgrave Macmillan UK., 231-240.
Robertson & Gatignon. (1991). How innovators thwart new entrants into their market. Planning Review, vol. 19, 4-11.
Rogers, E. (2003). Diffusion of Innovations, 5th Edition. New York: Free Press of Glencoe. Rogers, E. M. (1962). Diffusion of innovations, 1st. New York: Free Press of Glencoe. Rogers, E. M. (1983). Diffusion of innovations, 3rd. New York: Free Press of Glencoe. Rothwell & Beesley. (1989). The importance of technology transfer. In Barber, J. et al.,
(eds.), Barriers to Growth in Small Firms. London: Routledge. S. Organ, G. Squires & D. G. Proverbs. (2013, 06 01). New research methods in identifying
motivations for energy efficiency refurbishment of owner-occupied homes. WIT Transactions on Ecology and The Environment., pp. 101-120.
S.L., G. (2008). Business Research Methods. Copenhagen: Ventus Publishing ApS. Salop & Scheffman. (1983). Raising rivals’ costs. American Economic Review, vol. 73, 267-
271. Saunders, M, Lewis, P& Thornhill, A. (2009). Research methods for business students, Fifth
edition. Harlow: Prentice Hall. Schmalensee, R. (1982). Product differentiation advantages of pioneering brands. American
Economic Review, vol. 72, no. 3, 350-371. Schwartz & Thompson. (1986). Divisionalization and entry deterrence. Quarterly Journal of
Economics, vol. 101, 307-321. Shiu, E., Hair, J., Bush, R., & Ortinau, D. (2009). Marketing Research. Berkshire: McGraw-
Hill. Siggelkow, N. (2007). Persuasion with Case Studies. Academy of Management Journal , 50
(1), 20-24. Skåne, S. R. (2015, 12 16). Om solenergi. Retrieved from Solar region:
http://solarregion.se/om-solenergi/ Spence, A. (1977). Entry Capacity Investment and Oligopolistic Pricing. Bell Journal of
Economics, vol. 8, no. 2, 534-544. Spence, A. (1981). The Learning Curve and Competition. Bell Journal of Economics, vol. 12,
no. 1, 49-70. Starr J & Fondas N. (1992). A Model of Entrepreneurial Socialization and Organizational
Formation. Entrepreneurship Theory and Practice, 67-76. Stigler, G. J. (1968). The organization of industry. Chicago: University of Chicago Press
Economics Books. Storey, D. J. (1994). Understanding the small business sector. Illinois: University of Illinois
at Urbana-Champaign's Academy for Entrepreneurial Leadership Historical Research Reference in Entrepreneurship.
87
Svensk Energi, Swedenergy AB. (2015). ELäret Verksamheten 2014. Stockholm: Svensk Energi.
T. Islam & N. Meade. (2012, 12 04). The impact of attribute preferences on adoption timing: The case of photovoltaic (PV) solar cells for household electricity generation. Energy Policy 2013, pp. 521-530.
T. Islam & N. Meade. (2013, 01 16). The impact of attribute preferences on adoption timing: The case of photovoltaic(pv) solar cells for household electricity generation. Energy Policy 2013, pp. 521-530.
Tidd & Bessant. (2013). Managing Innovation: Integrating Technological, Market and Organizational Change. West Sussex: John Wiley & Sons Ltd.
Tord af Klintberg, Folke Björk. (2013, Teknik, Miljö, Ekonomi samt Processutveckling.). Riksbyggens Renoveringsverkstad, Teknik, Miljö, Ekonomi samt Processutveckling. Stockholm: Riksbyggens, KTH.
UK, K. (2010, 01 01). Why expand to Sweden, Entering the market. Retrieved from Start up over seas: http://www.startupoverseas.co.uk/expanding-a-business-in-sweden/entering-the-market.html
V. Auken, & E. Howard,. (1999). Obstacles to business launch. Journal of Developmental Entrepreneurship, vol:4, no:2, 175-187.
Veendorp, E. (1991). Entry deterrence divisionalization and investment decisions. The Quarterly Journal of Economics, vol. 106, 297-307.
Wanare, D. R. S., & Mudiraj, A. R. (2014). Study the Importance of SWOT Analysis on ERP Implementation. International Journal of Management and Social Sciences Research, Vol 3, 33-36.
Webster, M. (2011, April 5). An Encyclopædia Britannica Company. Retrieved from Merriam Webster: http://www.merriam-webster.com/
Webster´s. (1994). New Encyclopaedic Dictionary. Germany: Könemann. Williamson & Ghani. (2012). Transaction cost economics and its uses in marketing. Journal
of the Academy of Marketing Science, vol. 40 , 74-85. Williamson, O. E. (1996). The mechanisms of governance. New York: Oxford University
Press. Yang, G. (1998). Barriers to entry and industrial performance in China. International Review
of Applied Economics, vol. 12, no.1, 39-51.
88
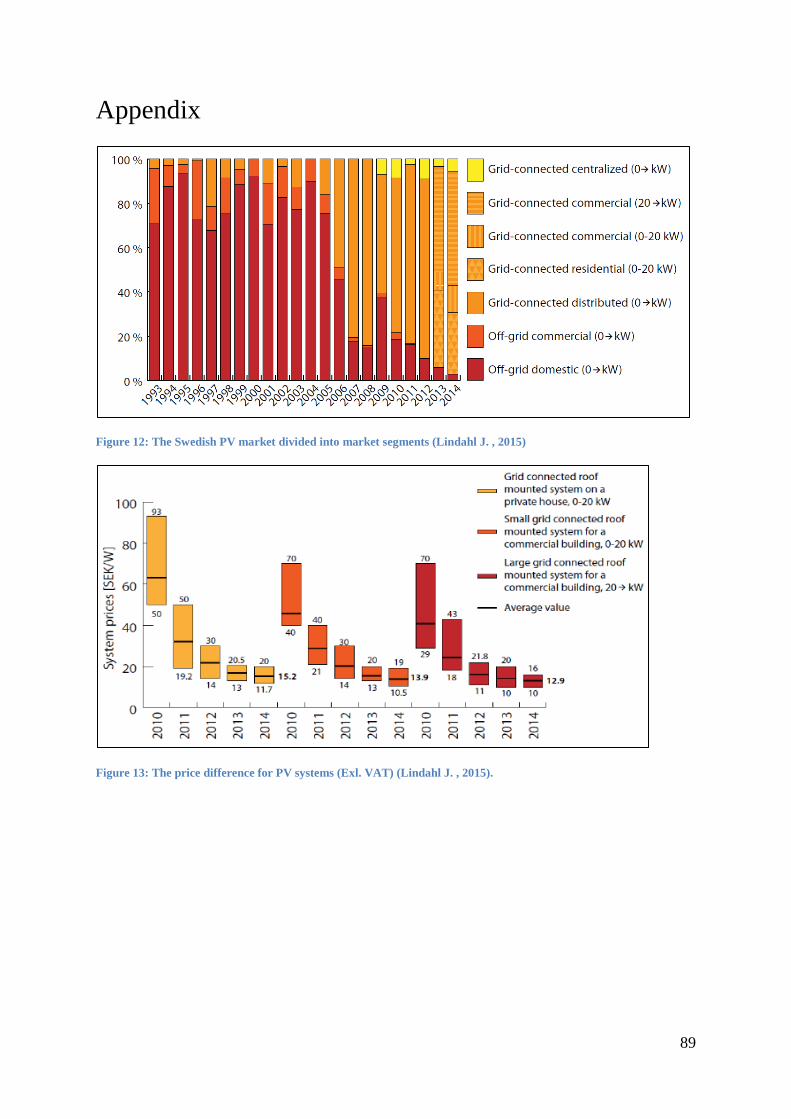
Appendix
Figure 12: The Swedish PV market divided into market segments (Lindahl J. , 2015)
Figure 13: The price difference for PV systems (Exl. VAT) (Lindahl J. , 2015).
89

Figure 14: Average daily spot price between 1/6 and 31/8 (Lindahl J. , 2013)
Figure 15: Evolution of the number of PV related labor places in Sweden (Lindahl J. , 2015).
Table 7: The cumulative installed PV power in 4 sub-markets (Lindahl J. , 2015)
Year Off-grid domestic
Off-grid domestic2
Grid-connected distributed
Grid-connected centralized Total
1992 0.59 0.21 0.01 0 0.80 1993 0.76 0.27 0.02 0 1.04 1994 1.02 0.29 0.02 0 1.34 1995 1.29 0.30 0.03 0 1.62 1996 1.45 0.36 0.03 0 1.85 1997 1.64 0.39 0.09 0 2.13 1998 1.82 0.43 0.11 0 2.37 1999 2.01 0.45 0.12 0 2.58 2000 2.22 0.47 0.12 0 2.81 2001 2.39 0.51 0.15 0 3.03
90

2002 2.60 0.54 0.16 0 3.30 2003 2.81 0.57 0.19 0 3.58 2004 3.07 0.60 0.19 0 3.87 2005 3.35 0.63 0.25 0 4.24 2006 3.63 0.67 0.56 0 4.85 2007 3.88 0.69 1.68 0 6.24 2008 4.13 0.70 3.08 0 7.91 2009 4.45 0.72 3.54 0.06 8.76 2010 4.95 0.80 5.41 0.29 11.45 2011 5.66 0.82 8.93 0.40 15.80 2012 6.47 0.83 15.65 1.14 24.08 2013 7.54 0.86 32.99 1.79 43.18 2014 8.58 0.89 66.14 3.79 79.40
Table 8: Turnkey Prices of typical applications (Exl. VAT) – SEK/Wp (Lindahl J. , 2015)
Category/Size Typical applications and brief details Current prices
Off-grid, up to 1kWp
A stand-alone PV system is a system that installed to generate electricity to a device or a household that not connected to the power grid. Typically modules or systems for small cottages, caravans, or boats.
25.5 SEK/Wp
Off-grid, >1 kWp
A stand-alone PV system is a system that installed to generate electricity to a device or a household that not connected to the public grid. Typically systems in combination with barriers for small cottages and vacation houses.
20.4 SEK/Wp
Grid-connected, roof mounted, up to 20 kWp (residential)
The system installed to produce electricity to grid-connected households. Typically roof mounted systems on villas and single-family homes
15.2 SEK/Wp
Grid-connected, roof mounted, up to 20 kWp (Commercial)
The system installed to produce electricity to grid-connected commercial buildings. Such as public buildings, agriculture barns, grocery stores etc.
13.9 SEK/Wp
Grid-connected, roof mounted, above 20 kWp (commercial)
The system installed to produce electricity to grid-connected industrial buildings. 12.9 SEK/Wp
Grid-connected, ground-mounted above 1 MWp
Power-generating PV system that works as a central power station. The electricity generated in this type of facility is not tied to a particular customer and the purpose is to produce electricity for sale.
13.7 SEK/Wp*
Other category existing in your country N/A
*Only two parks of 1MWp each has been built in Sweden, tend this is the prices for one of them.
91

Table 9: Cost breakdown of a residential PV system < 10 kWp – SEK/W
Cost category Average
(SEK/Wp) Low (SEK/Wp) High (SEK/Wp) Hardware
Module 6.26 4.90 14.00 Inverter 1.72 1.00 4.00
Mounting material 1.11 0.29 3.21 Other electronics (cables,
etc.) 0.54 0.04 3.00
Subtotal Hardware 9.63 Soft costs
Installation work 2.48 1.00 6.40
Shipping and travel expenses to customer 0.29 0.00 1.83
Permits and commissioning (i.e. Cost for electrician,
etc.) 0.39 0.00 3.60
Other costs 0.17 0.00 1.00 Profit margin 2.42 0.30 6.74
Subtotal Soft costs 5.75
Total (excluding VAT) 15.38
Average VAT 3.85
Total (Including VAT) 19.23
(Lindahl J. , 2015)
Table 10: Country overview
Retail electricity prices for a household 1.0-1.8 SEK/ kWp (including grid charges and taxed)
Retail electricity prices for a commercial company 1.0-1.5 SEK/ kWp (Including grid charges and taxes)
Retail electricity price for an industrial company 0.55-1.0 SEK/ kWp (including grid charges and taxes)
Population at the end of 2014 9 767 357
Country size (km²) 447 435 km² Average PV yield 800-1100 kWh/kWp
Name and marker share of major electric utilities
Electricity production
(2014)*
Share of grid
subscribers (2013)**
Number of retail customers (2013)***
Vattenfall 43% 35% 18% E.ON 17% 19% 13% Fortum 17% 17% 12%
92

(*) Elåret 2014, Svensk Energi (**) Statistics from The Swedish Energy Markets Inspectorates homepage (***) Data from Energimarknaden, a part of Svenska Nyhetsbrev 2014 (Lindahl J. , 2015)
Table 11: PV in the green electricity certificate system
Type 2012 2013 2014 Grid-connected PV power according to sales statistics 16.8 MWp 34.8 MWp 69.9 MWp
Accepted PV system in the certificate system. * 5.2 MWp 13.2 MWp 19.7 MWp
Issued certificates. ** 1 029 MWh 3 705 MWh 10 770 MWh Rough estimation (on the high side) of total PV production 15 120 MWh 31 320 MWh 62 910 MWh
Share of total installed PV power in the certificate system 30.90% 37.90% 28.20%
Rough estimation (on the low side of the share of PV produced electricity that obtained a certificate.
6.80% 11.80% 17.10%
(*&**)=The Swedish National Grid’s system for account management of certificates and guarantees of origin (Lindahl J. , 2015).
93

PO Box 823, SE-301 18 HalmstadPhone: +35 46 16 71 00E-mail: [email protected]
I studied mechanical engineering in Iraq, master in renewable energy and master in technical project management and business development at Halmstad University. I have background in energy and project management, I am eager to learn more to develop my capabilities.