the summer jobs outlook for teens in the u.s. summer jobs outlook for teens in the u.s. neeta fogg,...
TRANSCRIPT
The Summer Jobs Outlook for
Teens in the U.S.
Neeta Fogg, Paul Harrington,
and Ishwar Khatiwada
Center for Labor Markets and Policy
Drexel University
May 8, 2015
1
Contents Introduction ..................................................................................................................................... 2
Steeply Declining Teen Labor Force Participation and Employment Rates, 1999-2000 to 2013-
2014................................................................................................................................................. 3
Declining Teen Employment Opportunities in Summer Months Over the 1999-2000 to 2013-
2014 Period ..................................................................................................................................... 6
Who Worked in the Summer of 2013-2014? .................................................................................. 8
Do Teens Want to Work in Summer? ........................................................................................... 11
Projecting Summer 2015 Employment Outlook for Teens........................................................... 13
2
Introduction
After the Great Recession ended more than five years ago, several key economic and
labor market indicators have improved substantially. Since 2011 more than 10 million payroll
jobs have been created, the unemployment rate has fallen to 5% from its peak level of more than
9% in 2009 and 2010, and the real GDP has grown by more than $1 trillion. However, teens in
the nation are still facing tremendous difficulty in finding employment- both part-time, year-
round and during summer months when they enter the labor market in droves. Labor market
work experience helps teens accumulate human capital by exposing them to the world of work
where they learn essential job and career skills. Work experience provides young people with
career readiness skills including ‘soft skills’ such as desirable behavioral traits that employers
look for in entry-level workers and that are important across all occupations and careers in the
labor market. Work experience from labor market work provides teens with important
proficiencies and behavioral traits that are the building blocks of their adult labor market careers.
These proficiencies and behavioral traits are often acquired through working and osmosis-like
learning.
Early work experience allows young workers to develop these basic behaviors in a work
context—that is different than a home or school. Indeed, working in a job is most often the first
time that youngsters engage with adults around adult duties and responsibilities. The work
context makes them accountable to other adults around basic responsibilities associated with
being a productive employee—who is not a burden to their employer or co-workers and where
there are a variety of not-so-pleasant consequences when the teen does act in a way to become a
burden—like not showing up for work or doing a lousy job that a co-worker has to fix.
Early work experience also helps develop labor market savvy, it creates a record of
accomplishment - the work history and it helps make connections with employers and network
with other professionals at work that could help in future job search efforts. Early work
experience allows young workers to go beyond entry level jobs and gain experience in different
workplace settings and gain knowledge of specific occupational skills. With this more specific
work experience which comes quicker among those with early work experience, young workers
can gain exposure to different occupations which can be helpful in making career choices.
3
In addition to the beneficial work experience acquired from employment, employment
during summer when most teens are not in school keep them from engaging in risky behaviors,
particularly teens from low-income families from inner cities.
This research report assesses the summer labor market experiences of teens in current
decade and predicts 2015 summer employment rate for teenagers nationwide.1 The report begins
with an examination of the trends in annual labor force participation and employment to
population ratios of teens in the recent decade. Teen employment-population ratios over the
1999-2000 and 2013-2014 time period are compared with other adults in various age groups.
Following this section is a detailed examination of summer labor market experiences of teens in
various demographic and socio-economic groups in recent years and in 1999-2000 when the US
labor market was operating at its peak. Variations in summer 2013-2014 teen employment rates
by states are also examined. The last section of the report presents predicted employment rates of
teens in the summer of 2015.
Steeply Declining Teen Labor Force Participation and Employment
Rates, 1999-2000 to 2013-2014
The labor force participation rate of teens has been falling steadily and unprecedentedly
since 2000 after remaining 50 percent or higher in the decades of the 1970s, 1980s, and 1990s.
There are many schools of thought on the causes of such a sharp decline in teen labor force in the
recent decade. Academics, researchers, policy makers, and youth advocates often cite wide
ranging causes of teen labor force participation and employment decline such as structural
change in the economy, demographic change, displacement from older workers and new less-
educated immigrants, a weak labor market, and a steady rise in school enrollment both year
around and during summer when most teens work.2 The labor force participation rate of teens at
1 The projection is based on a method developed by Ishwar Khatiwada and Andrew Sum at the Northeastern
University Center for Labor Market Studies. 2 See: (i). Daniel Aaronson, Kyung-Hong Park, and Daniel Sullivan, “The Decline in Teen Labor Force
Participation”, Federal Reserve Bank of Chicago, Economic Perspectives, 2006. First Quarter, pp. 2-18; (ii). “What
Is Happening to Youth Employment Rates?” CBO Background Paper, Congressional Budget Office, November
2004. (iii). Christopher L. Smith, "Polarization, Immigration, Education: What's Behind the Dramatic Decline in
Youth Employment?" Federal Reserve, October 2011. (iv). Andrew Sum, Paul Harrington, and Ishwar Khatiwada ,
“The Impact of New Immigrants on Young Native-Born Workers, 2000-2005”, Center for Immigration Studies,
2006, www.cis.org/sites/cis.org/files/articles/2006/back806.html.
4
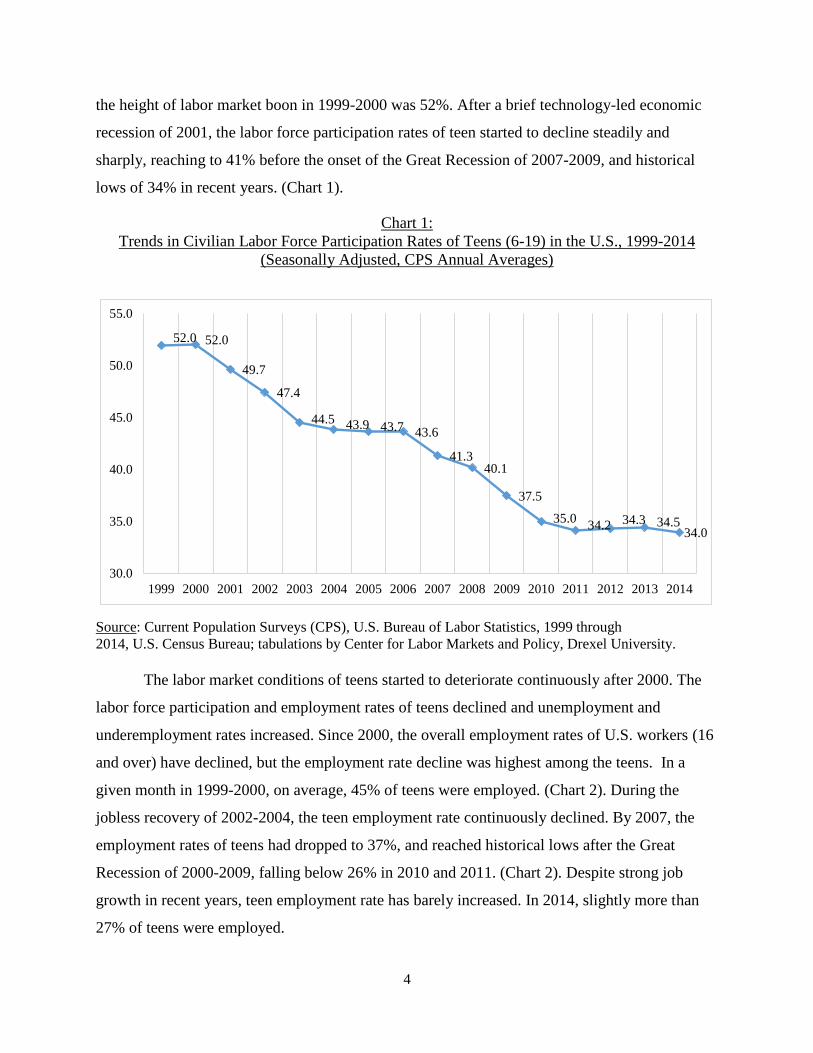
the height of labor market boon in 1999-2000 was 52%. After a brief technology-led economic
recession of 2001, the labor force participation rates of teen started to decline steadily and
sharply, reaching to 41% before the onset of the Great Recession of 2007-2009, and historical
lows of 34% in recent years. (Chart 1).
Chart 1:
Trends in Civilian Labor Force Participation Rates of Teens (6-19) in the U.S., 1999-2014
(Seasonally Adjusted, CPS Annual Averages)
Source: Current Population Surveys (CPS), U.S. Bureau of Labor Statistics, 1999 through
2014, U.S. Census Bureau; tabulations by Center for Labor Markets and Policy, Drexel University.
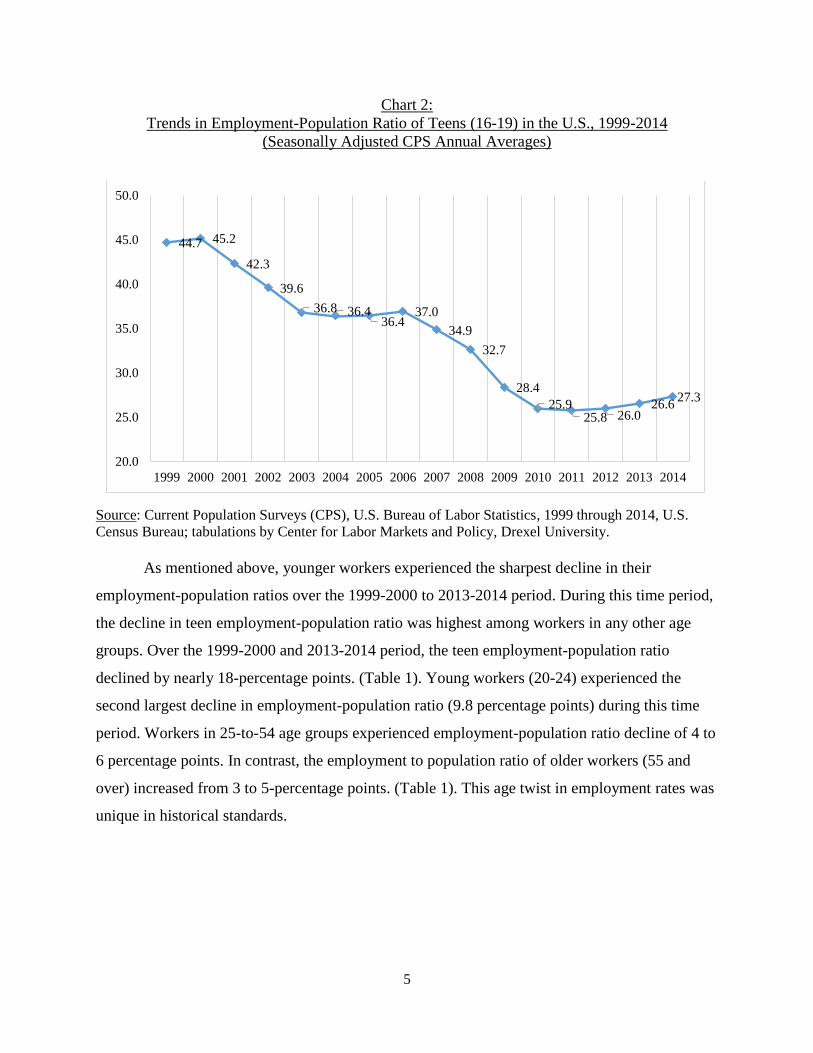
The labor market conditions of teens started to deteriorate continuously after 2000. The
labor force participation and employment rates of teens declined and unemployment and
underemployment rates increased. Since 2000, the overall employment rates of U.S. workers (16
and over) have declined, but the employment rate decline was highest among the teens. In a
given month in 1999-2000, on average, 45% of teens were employed. (Chart 2). During the
jobless recovery of 2002-2004, the teen employment rate continuously declined. By 2007, the
employment rates of teens had dropped to 37%, and reached historical lows after the Great
Recession of 2000-2009, falling below 26% in 2010 and 2011. (Chart 2). Despite strong job
growth in recent years, teen employment rate has barely increased. In 2014, slightly more than
27% of teens were employed.
52.0 52.0
49.7
47.4
44.5 43.9 43.7 43.6
41.340.1
37.5
35.034.2 34.3 34.5
34.0
30.0
35.0
40.0
45.0
50.0
55.0
1999 2000 2001 2002 2003 2004 2005 2006 2007 2008 2009 2010 2011 2012 2013 2014
5
Chart 2:
Trends in Employment-Population Ratio of Teens (16-19) in the U.S., 1999-2014
(Seasonally Adjusted CPS Annual Averages)
Source: Current Population Surveys (CPS), U.S. Bureau of Labor Statistics, 1999 through 2014, U.S.
Census Bureau; tabulations by Center for Labor Markets and Policy, Drexel University.
As mentioned above, younger workers experienced the sharpest decline in their
employment-population ratios over the 1999-2000 to 2013-2014 period. During this time period,
the decline in teen employment-population ratio was highest among workers in any other age
groups. Over the 1999-2000 and 2013-2014 period, the teen employment-population ratio
declined by nearly 18-percentage points. (Table 1). Young workers (20-24) experienced the
second largest decline in employment-population ratio (9.8 percentage points) during this time
period. Workers in 25-to-54 age groups experienced employment-population ratio decline of 4 to
6 percentage points. In contrast, the employment to population ratio of older workers (55 and
over) increased from 3 to 5-percentage points. (Table 1). This age twist in employment rates was
unique in historical standards.
44.7 45.2
42.3
39.6
36.8 36.436.4
37.0
34.9
32.7
28.4
25.925.8 26.0
26.627.3
20.0
25.0
30.0
35.0
40.0
45.0
50.0
1999 2000 2001 2002 2003 2004 2005 2006 2007 2008 2009 2010 2011 2012 2013 2014

6
Table 1:
Trends in Employment-Population Ratios of 16 and Older by Age Group, U.S.,
1999-2000 and 2013-2014 (CPS 2-Year Averages)
Age
Group 1999-2000 2013-2014
Absolute Change,
1999-2000 to
2013-2014
16-19 45.4 27.5 -17.9
20-24 71.9 62.1 -9.8
25-34 81.3 75.4 -5.9
35-44 82.3 77.8 -4.5
45-54 80.5 75.8 -4.7
55-64 58.0 61.4 3.4
65+ 12.6 18.1 5.4
Total 64.4 58.9 -5.5 Source: Current Population Surveys (CPS) public use data files, 1999 through
2014, U.S. Census Bureau; tabulations by Center for Labor Markets and Policy, Drexel University.
Declining Teen Employment Opportunities in Summer Months
Over the 1999-2000 to 2013-2014 Period
In summer months when schools are closed, teens aspire to work. For this reason,
historically, teens across the U.S. worked at higher rates during the summer. Summer jobs
provide teens with the exposure to the world work and help them develop occupational and soft
skills needed at work. Evidence show that jobless youth during summer month were more likely
than their employed peers to commit violent crimes, to be in risk of social isolation, and to get
involved in risky, deviant, delinquent, and violent behaviors.3 Evidence also revealed that
summer job program reduced violent crimes by African-American teens.4 It is a sad fact that
given such positive impacts of summer employment among teens, the summer job prospects
have diminished in the U.S. since the beginning of the decade. Not only fewer teens are working
year-round in recent years, but they are also working at historically lower rates during the
summer months. Nearly 52% of teens were employed in summer months of 1999-2000 when the
labor market was operating at its peak. By the summer of 2006-2007, employment-population
ratios of teens had plummeted to 42%. During and after the Great Recession of 2007-2009,
3 See: (i). Andrew Sum, Mykhaylo Trubskyy, and Walter McHugh, “The Summer Employment Experiences and the
Personal/Social Behaviors of Youth Violence Prevention Employment Program Participants and Those of a
Comparison Group”, Center for Labor Market Studies, Northeastern University, Prepared for Youth Violence
Prevention Funder Learning Collaborative, Boston, July 2013. 4 See: Sara B. Heller, "Summer jobs reduce violence among disadvantaged youth", Science, Vol 346, 5 December
2014; Gelber Alexander, Adam Isen, Judd B. Kessler, The Effects of Youth Employment: Evidence From New York
City Summer Youth Employment Program Lotteries, NBER Working Paper 20810, December 2014.
7
employment prospects for teens were historically low. In the summer months of 2010-2011, only
30.6% of teens were employed, the lowest rate ever for which teen employment data are
available. In the summer months of 2013-2014, the employment-population ratio of teens had
barely increased. Only 1 in 3 teens were employed in summer months of 2013-2014.
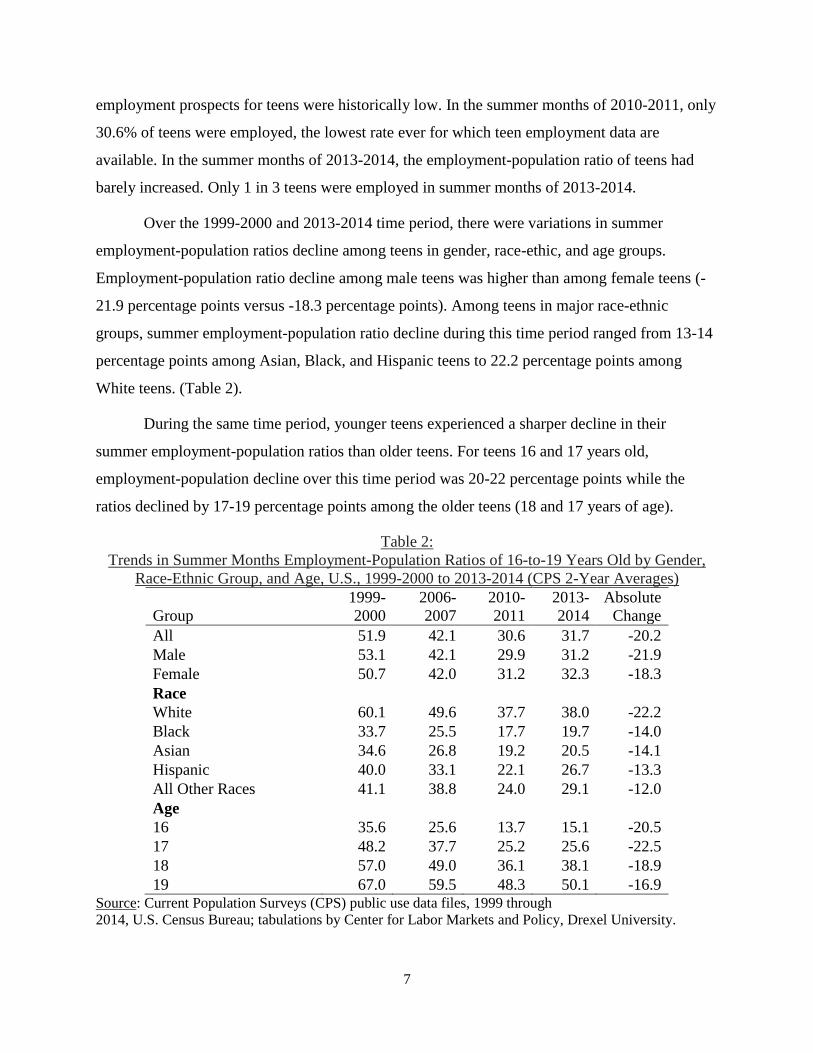
Over the 1999-2000 and 2013-2014 time period, there were variations in summer
employment-population ratios decline among teens in gender, race-ethic, and age groups.
Employment-population ratio decline among male teens was higher than among female teens (-
21.9 percentage points versus -18.3 percentage points). Among teens in major race-ethnic
groups, summer employment-population ratio decline during this time period ranged from 13-14
percentage points among Asian, Black, and Hispanic teens to 22.2 percentage points among
White teens. (Table 2).
During the same time period, younger teens experienced a sharper decline in their
summer employment-population ratios than older teens. For teens 16 and 17 years old,
employment-population decline over this time period was 20-22 percentage points while the
ratios declined by 17-19 percentage points among the older teens (18 and 17 years of age).
Table 2:
Trends in Summer Months Employment-Population Ratios of 16-to-19 Years Old by Gender,
Race-Ethnic Group, and Age, U.S., 1999-2000 to 2013-2014 (CPS 2-Year Averages)
Group
1999-
2000
2006-
2007
2010-
2011
2013-
2014
Absolute
Change
All 51.9 42.1 30.6 31.7 -20.2
Male 53.1 42.1 29.9 31.2 -21.9
Female 50.7 42.0 31.2 32.3 -18.3
Race
White 60.1 49.6 37.7 38.0 -22.2
Black 33.7 25.5 17.7 19.7 -14.0
Asian 34.6 26.8 19.2 20.5 -14.1
Hispanic 40.0 33.1 22.1 26.7 -13.3
All Other Races 41.1 38.8 24.0 29.1 -12.0
Age
16 35.6 25.6 13.7 15.1 -20.5
17 48.2 37.7 25.2 25.6 -22.5
18 57.0 49.0 36.1 38.1 -18.9
19 67.0 59.5 48.3 50.1 -16.9 Source: Current Population Surveys (CPS) public use data files, 1999 through
2014, U.S. Census Bureau; tabulations by Center for Labor Markets and Policy, Drexel University.
8
Who Worked in the Summer of 2013-2014?
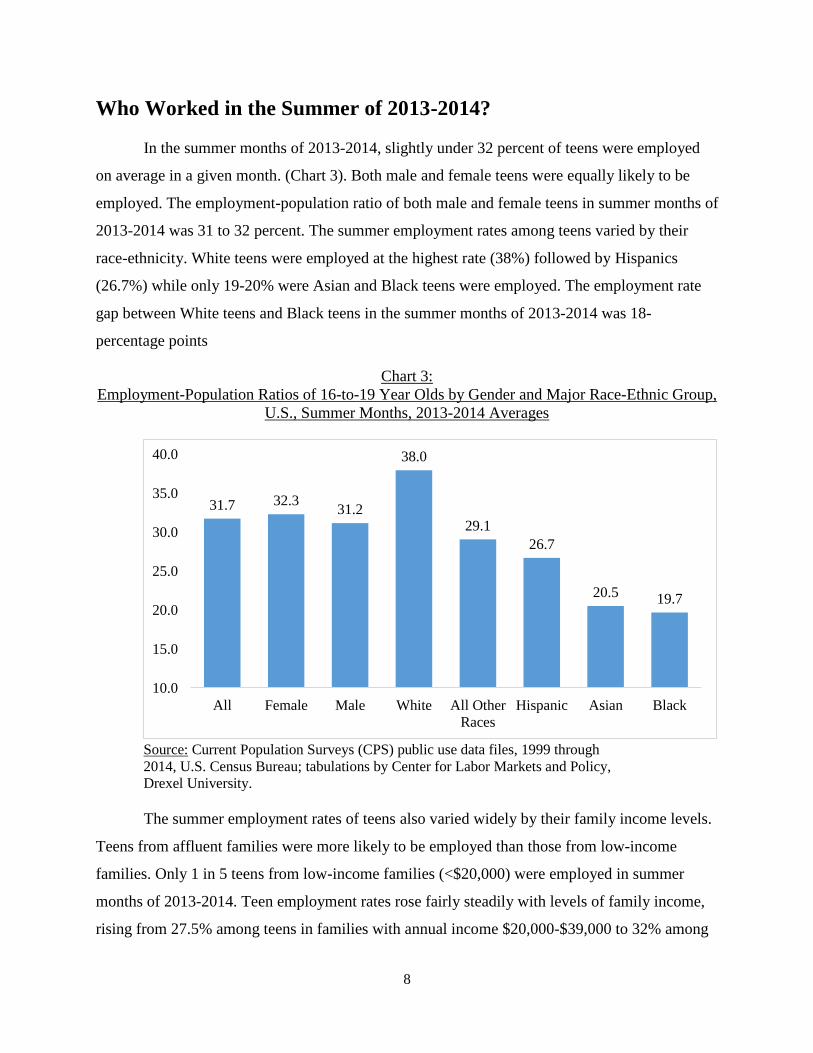
In the summer months of 2013-2014, slightly under 32 percent of teens were employed
on average in a given month. (Chart 3). Both male and female teens were equally likely to be
employed. The employment-population ratio of both male and female teens in summer months of
2013-2014 was 31 to 32 percent. The summer employment rates among teens varied by their
race-ethnicity. White teens were employed at the highest rate (38%) followed by Hispanics
(26.7%) while only 19-20% were Asian and Black teens were employed. The employment rate
gap between White teens and Black teens in the summer months of 2013-2014 was 18-
percentage points
Chart 3:
Employment-Population Ratios of 16-to-19 Year Olds by Gender and Major Race-Ethnic Group,
U.S., Summer Months, 2013-2014 Averages
Source: Current Population Surveys (CPS) public use data files, 1999 through
2014, U.S. Census Bureau; tabulations by Center for Labor Markets and Policy,
Drexel University.
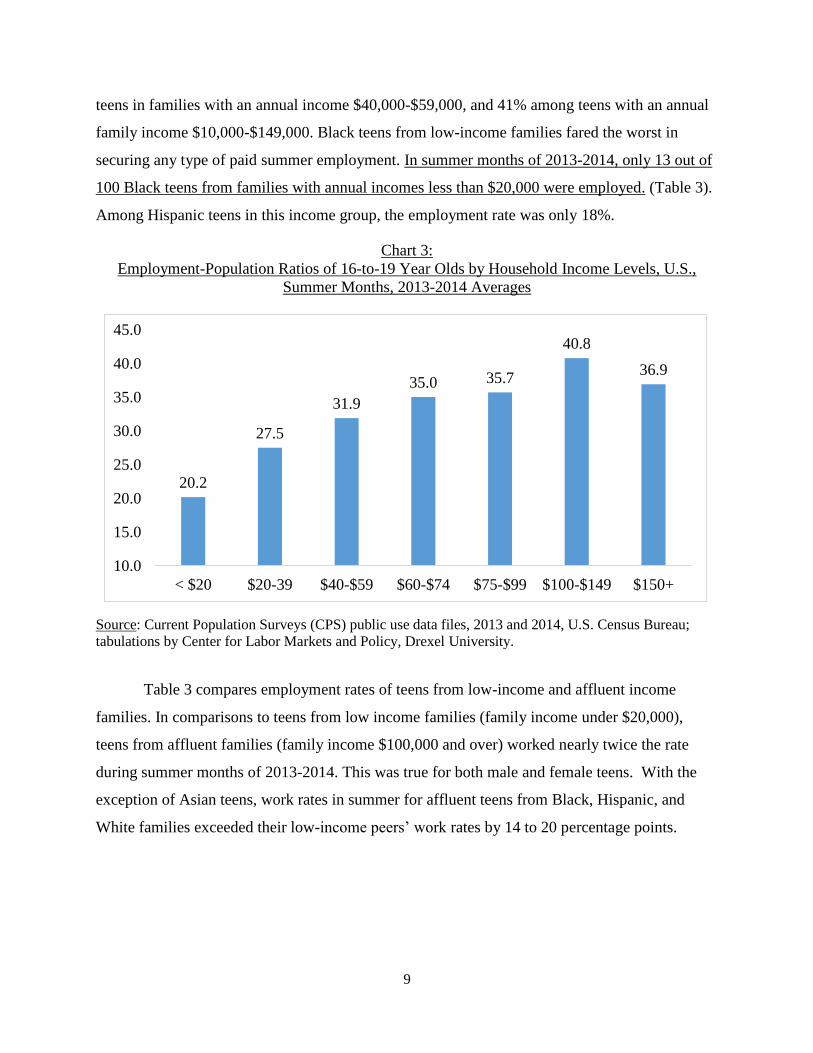
The summer employment rates of teens also varied widely by their family income levels.
Teens from affluent families were more likely to be employed than those from low-income
families. Only 1 in 5 teens from low-income families (<$20,000) were employed in summer
months of 2013-2014. Teen employment rates rose fairly steadily with levels of family income,
rising from 27.5% among teens in families with annual income $20,000-$39,000 to 32% among
31.7 32.331.2
38.0
29.1
26.7
20.5 19.7
10.0
15.0
20.0
25.0
30.0
35.0
40.0
All Female Male White All Other
Races
Hispanic Asian Black
9
teens in families with an annual income $40,000-$59,000, and 41% among teens with an annual
family income $10,000-$149,000. Black teens from low-income families fared the worst in
securing any type of paid summer employment. In summer months of 2013-2014, only 13 out of
100 Black teens from families with annual incomes less than $20,000 were employed. (Table 3).
Among Hispanic teens in this income group, the employment rate was only 18%.
Chart 3:
Employment-Population Ratios of 16-to-19 Year Olds by Household Income Levels, U.S.,
Summer Months, 2013-2014 Averages
Source: Current Population Surveys (CPS) public use data files, 2013 and 2014, U.S. Census Bureau;
tabulations by Center for Labor Markets and Policy, Drexel University.
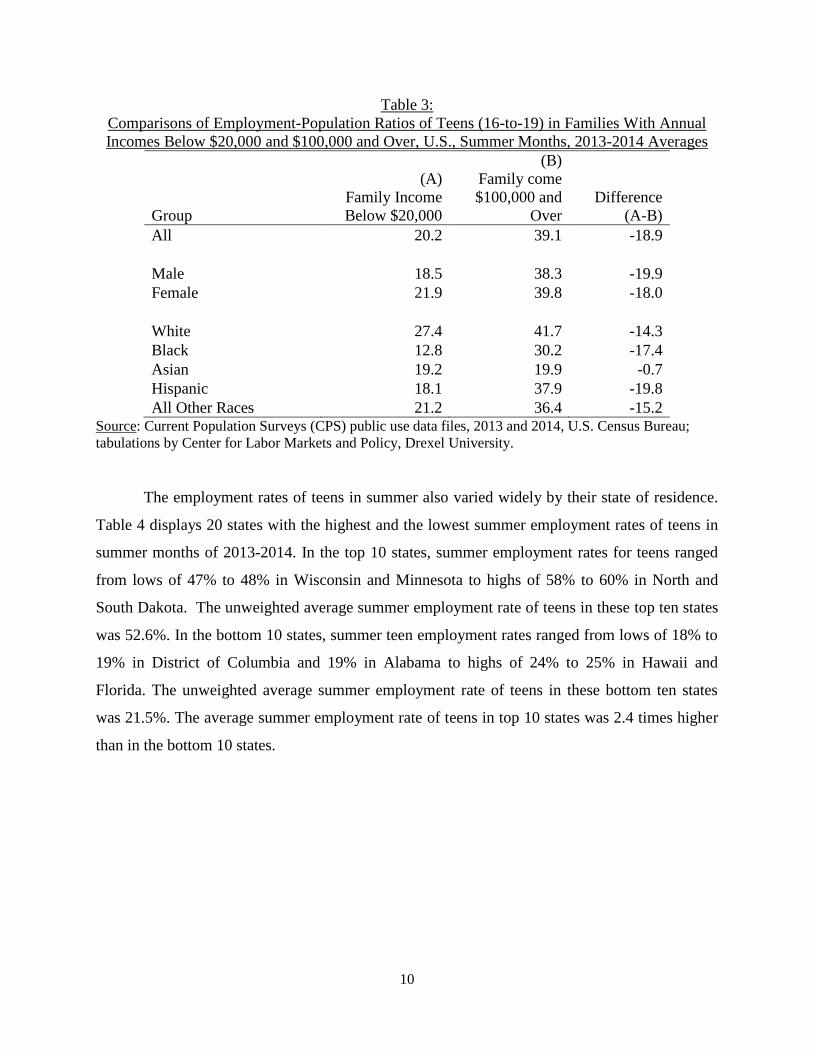
Table 3 compares employment rates of teens from low-income and affluent income
families. In comparisons to teens from low income families (family income under $20,000),
teens from affluent families (family income $100,000 and over) worked nearly twice the rate
during summer months of 2013-2014. This was true for both male and female teens. With the
exception of Asian teens, work rates in summer for affluent teens from Black, Hispanic, and
White families exceeded their low-income peers’ work rates by 14 to 20 percentage points.
20.2
27.5
31.9
35.0 35.7
40.8
36.9
10.0
15.0
20.0
25.0
30.0
35.0
40.0
45.0
< $20 $20-39 $40-$59 $60-$74 $75-$99 $100-$149 $150+
10
Table 3:
Comparisons of Employment-Population Ratios of Teens (16-to-19) in Families With Annual
Incomes Below $20,000 and $100,000 and Over, U.S., Summer Months, 2013-2014 Averages
Group
(A)
Family Income
Below $20,000
(B)
Family come
$100,000 and
Over
Difference
(A-B)
All 20.2 39.1 -18.9
Male 18.5 38.3 -19.9
Female 21.9 39.8 -18.0
White 27.4 41.7 -14.3
Black 12.8 30.2 -17.4
Asian 19.2 19.9 -0.7
Hispanic 18.1 37.9 -19.8
All Other Races 21.2 36.4 -15.2 Source: Current Population Surveys (CPS) public use data files, 2013 and 2014, U.S. Census Bureau;
tabulations by Center for Labor Markets and Policy, Drexel University.
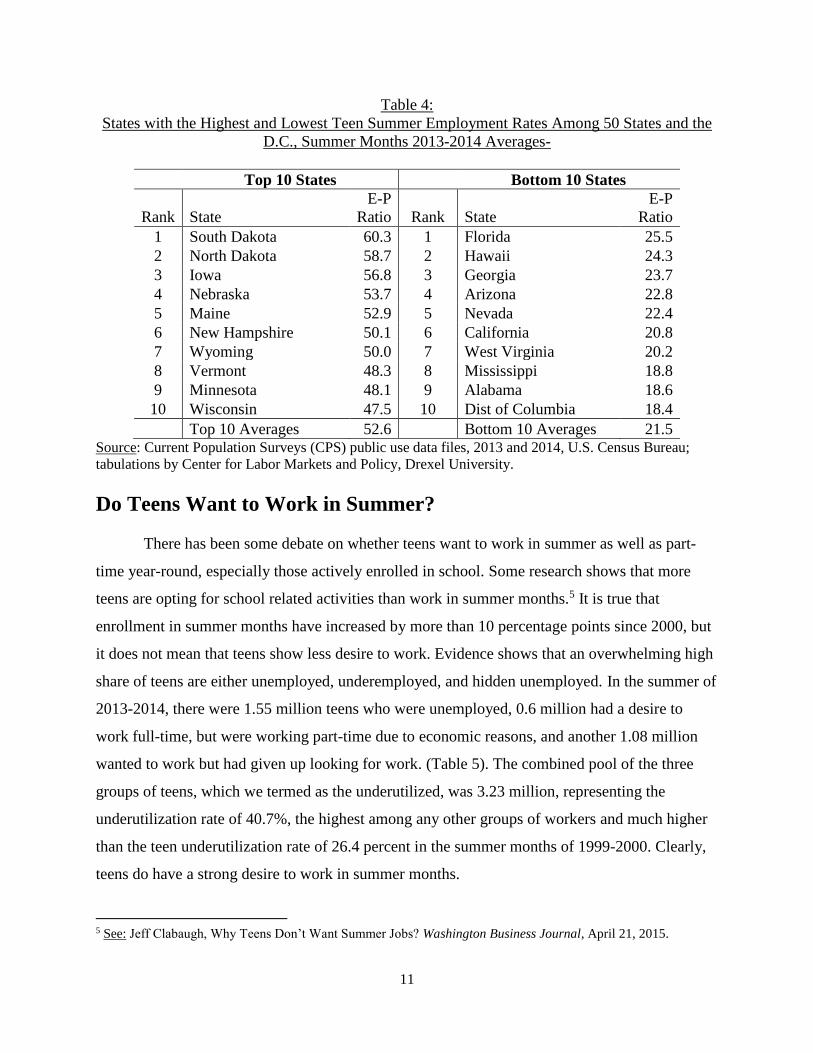
The employment rates of teens in summer also varied widely by their state of residence.
Table 4 displays 20 states with the highest and the lowest summer employment rates of teens in
summer months of 2013-2014. In the top 10 states, summer employment rates for teens ranged
from lows of 47% to 48% in Wisconsin and Minnesota to highs of 58% to 60% in North and
South Dakota. The unweighted average summer employment rate of teens in these top ten states
was 52.6%. In the bottom 10 states, summer teen employment rates ranged from lows of 18% to
19% in District of Columbia and 19% in Alabama to highs of 24% to 25% in Hawaii and
Florida. The unweighted average summer employment rate of teens in these bottom ten states
was 21.5%. The average summer employment rate of teens in top 10 states was 2.4 times higher
than in the bottom 10 states.
11
Table 4:
States with the Highest and Lowest Teen Summer Employment Rates Among 50 States and the
D.C., Summer Months 2013-2014 Averages-
Top 10 States
Bottom 10 States
Rank State
E-P
Ratio Rank State
E-P
Ratio
1 South Dakota 60.3 1 Florida 25.5
2 North Dakota 58.7 2 Hawaii 24.3
3 Iowa 56.8 3 Georgia 23.7
4 Nebraska 53.7 4 Arizona 22.8
5 Maine 52.9 5 Nevada 22.4
6 New Hampshire 50.1 6 California 20.8
7 Wyoming 50.0 7 West Virginia 20.2
8 Vermont 48.3 8 Mississippi 18.8
9 Minnesota 48.1 9 Alabama 18.6
10 Wisconsin 47.5 10 Dist of Columbia 18.4
Top 10 Averages 52.6
Bottom 10 Averages 21.5 Source: Current Population Surveys (CPS) public use data files, 2013 and 2014, U.S. Census Bureau;
tabulations by Center for Labor Markets and Policy, Drexel University.
Do Teens Want to Work in Summer?
There has been some debate on whether teens want to work in summer as well as part-
time year-round, especially those actively enrolled in school. Some research shows that more
teens are opting for school related activities than work in summer months.5 It is true that
enrollment in summer months have increased by more than 10 percentage points since 2000, but
it does not mean that teens show less desire to work. Evidence shows that an overwhelming high
share of teens are either unemployed, underemployed, and hidden unemployed. In the summer of
2013-2014, there were 1.55 million teens who were unemployed, 0.6 million had a desire to
work full-time, but were working part-time due to economic reasons, and another 1.08 million
wanted to work but had given up looking for work. (Table 5). The combined pool of the three
groups of teens, which we termed as the underutilized, was 3.23 million, representing the
underutilization rate of 40.7%, the highest among any other groups of workers and much higher
than the teen underutilization rate of 26.4 percent in the summer months of 1999-2000. Clearly,
teens do have a strong desire to work in summer months.
5 See: Jeff Clabaugh, Why Teens Don’t Want Summer Jobs? Washington Business Journal, April 21, 2015.
12
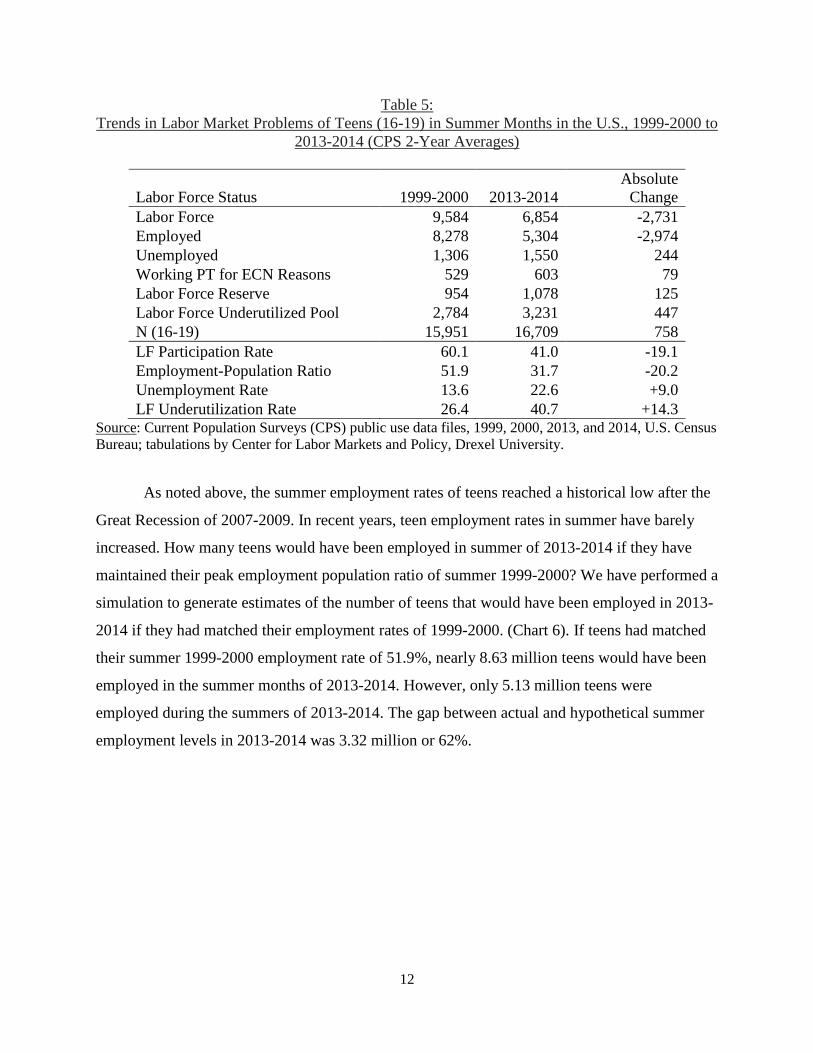
Table 5:
Trends in Labor Market Problems of Teens (16-19) in Summer Months in the U.S., 1999-2000 to
2013-2014 (CPS 2-Year Averages)
Labor Force Status 1999-2000 2013-2014
Absolute
Change
Labor Force 9,584 6,854 -2,731
Employed 8,278 5,304 -2,974
Unemployed 1,306 1,550 244
Working PT for ECN Reasons 529 603 79
Labor Force Reserve 954 1,078 125
Labor Force Underutilized Pool 2,784 3,231 447
N (16-19) 15,951 16,709 758
LF Participation Rate 60.1 41.0 -19.1
Employment-Population Ratio 51.9 31.7 -20.2
Unemployment Rate 13.6 22.6 +9.0
LF Underutilization Rate 26.4 40.7 +14.3 Source: Current Population Surveys (CPS) public use data files, 1999, 2000, 2013, and 2014, U.S. Census
Bureau; tabulations by Center for Labor Markets and Policy, Drexel University.
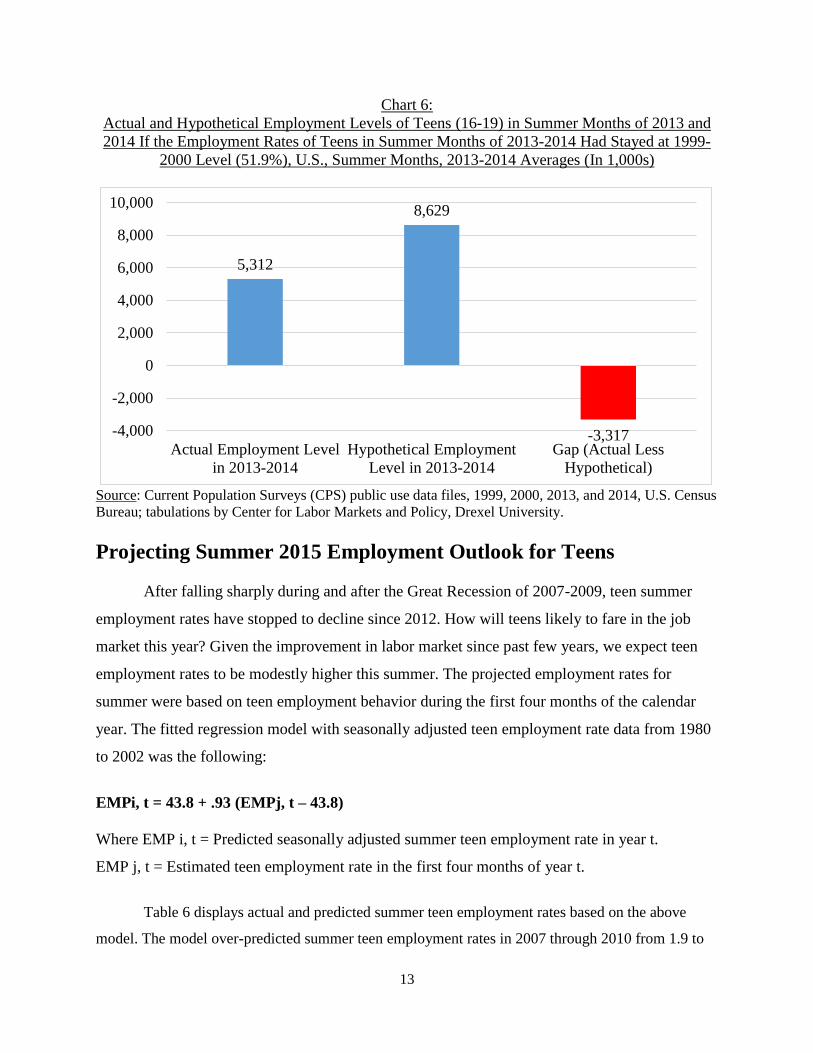
As noted above, the summer employment rates of teens reached a historical low after the
Great Recession of 2007-2009. In recent years, teen employment rates in summer have barely
increased. How many teens would have been employed in summer of 2013-2014 if they have
maintained their peak employment population ratio of summer 1999-2000? We have performed a
simulation to generate estimates of the number of teens that would have been employed in 2013-
2014 if they had matched their employment rates of 1999-2000. (Chart 6). If teens had matched
their summer 1999-2000 employment rate of 51.9%, nearly 8.63 million teens would have been
employed in the summer months of 2013-2014. However, only 5.13 million teens were
employed during the summers of 2013-2014. The gap between actual and hypothetical summer
employment levels in 2013-2014 was 3.32 million or 62%.
13
Chart 6:
Actual and Hypothetical Employment Levels of Teens (16-19) in Summer Months of 2013 and
2014 If the Employment Rates of Teens in Summer Months of 2013-2014 Had Stayed at 1999-
2000 Level (51.9%), U.S., Summer Months, 2013-2014 Averages (In 1,000s)
Source: Current Population Surveys (CPS) public use data files, 1999, 2000, 2013, and 2014, U.S. Census
Bureau; tabulations by Center for Labor Markets and Policy, Drexel University.
Projecting Summer 2015 Employment Outlook for Teens
After falling sharply during and after the Great Recession of 2007-2009, teen summer
employment rates have stopped to decline since 2012. How will teens likely to fare in the job
market this year? Given the improvement in labor market since past few years, we expect teen
employment rates to be modestly higher this summer. The projected employment rates for
summer were based on teen employment behavior during the first four months of the calendar
year. The fitted regression model with seasonally adjusted teen employment rate data from 1980
to 2002 was the following:
EMPi, t = 43.8 + .93 (EMPj, t – 43.8)
Where EMP i, t = Predicted seasonally adjusted summer teen employment rate in year t.
EMP j, t = Estimated teen employment rate in the first four months of year t.
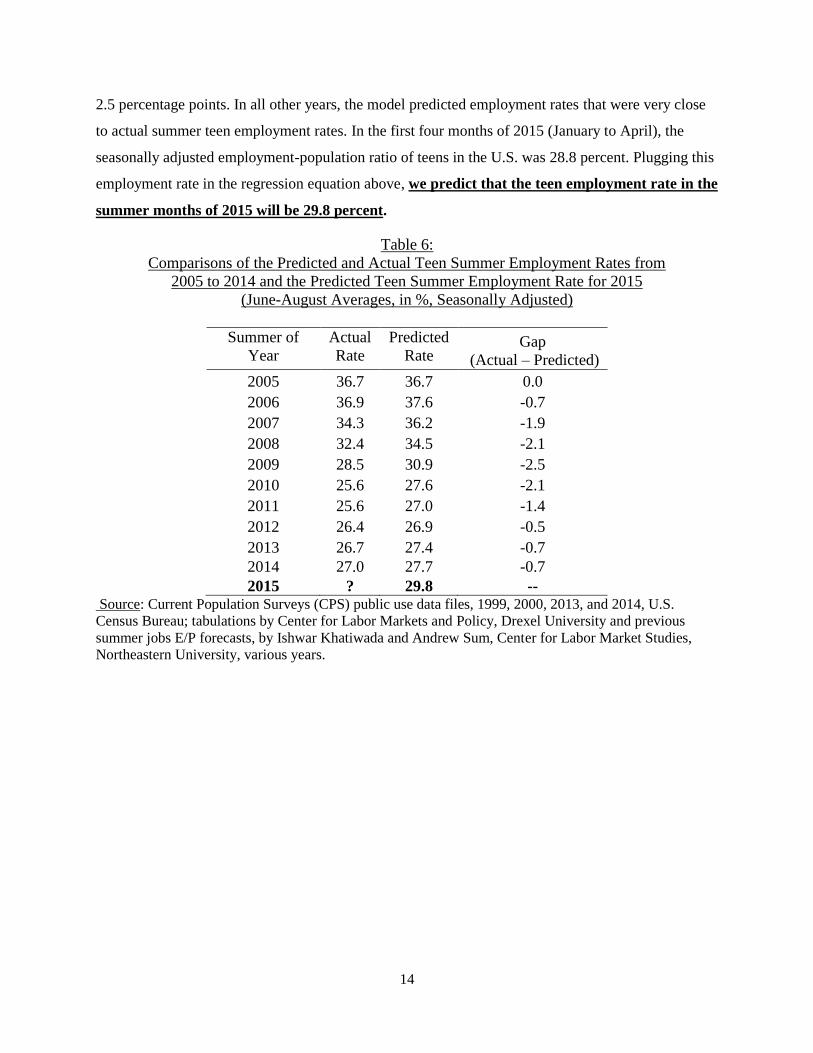
Table 6 displays actual and predicted summer teen employment rates based on the above
model. The model over-predicted summer teen employment rates in 2007 through 2010 from 1.9 to
5,312
8,629
-3,317-4,000
-2,000
0
2,000
4,000
6,000
8,000
10,000
Actual Employment Level
in 2013-2014
Hypothetical Employment
Level in 2013-2014
Gap (Actual Less
Hypothetical)
14
2.5 percentage points. In all other years, the model predicted employment rates that were very close
to actual summer teen employment rates. In the first four months of 2015 (January to April), the
seasonally adjusted employment-population ratio of teens in the U.S. was 28.8 percent. Plugging this
employment rate in the regression equation above, we predict that the teen employment rate in the
summer months of 2015 will be 29.8 percent.
Table 6:
Comparisons of the Predicted and Actual Teen Summer Employment Rates from
2005 to 2014 and the Predicted Teen Summer Employment Rate for 2015
(June-August Averages, in %, Seasonally Adjusted)
Summer of
Year
Actual
Rate
Predicted
Rate Gap
(Actual – Predicted)
2005 36.7 36.7 0.0
2006 36.9 37.6 -0.7
2007 34.3 36.2 -1.9
2008 32.4 34.5 -2.1
2009 28.5 30.9 -2.5
2010 25.6 27.6 -2.1
2011 25.6 27.0 -1.4
2012 26.4 26.9 -0.5
2013 26.7 27.4 -0.7
2014 27.0 27.7 -0.7
2015 ? 29.8 -- Source: Current Population Surveys (CPS) public use data files, 1999, 2000, 2013, and 2014, U.S.
Census Bureau; tabulations by Center for Labor Markets and Policy, Drexel University and previous
summer jobs E/P forecasts, by Ishwar Khatiwada and Andrew Sum, Center for Labor Market Studies,
Northeastern University, various years.