the subsistence harvest of harbor seals and sea lions by ... · the subsistence harvest of harbor...
TRANSCRIPT

Technical Paper No. 339
The Subsistence Harvest of Harbor Seals and Sea Lions by Alaska Natives in 2006
Alaska Department of Fish and Game, Division of Subsistence
and
Alaska Native Harbor Seal Commission
August 2008
Alaska Department of Fish and Game Division of Subsistence
Alaska Native Harbor Seal Commission

Symbols and Abbreviations The following symbols and abbreviations, and others approved for the Système International d'Unités (SI), are used without definition in the reports by the Division of Subsistence. All others, including deviations from definitions listed below, are noted in the text at first mention, as well as in the titles or footnotes of tables, and in figure or figure captions. Weights and measures (metric) centimeter cm deciliter dL gram g hectare ha kilogram kg kilometer km liter L meter m milliliter mL millimeter mm Weights and measures (English) cubic feet per second ft3/s foot ft gallon gal inch in mile mi nautical mile nmi ounce oz pound lb quart qt yard yd Time and temperature day d degrees Celsius °C degrees Fahrenheit °F degrees kelvin K hour h minute min second s Physics and chemistry all atomic symbols alternating current AC ampere A calorie cal direct current DC hertz Hz horsepower hp hydrogen ion activity (negative log of) pH parts per million ppm parts per thousand ppt, ‰ volts V watts W
General all commonly-accepted abbreviations
e.g., Mr., Mrs., AM, PM, etc. all commonly-accepted professional
titles e.g., Dr., Ph.D., R.N., etc. Alaska Administrative Code AAC at @ compass directions: east E north N south S west W copyright © corporate suffixes: Company Co. Corporation Corp. Incorporated Inc. Limited Ltd. District of Columbia D.C. et alii (and others) et al. et cetera (and so forth) etc. exempli gratia (for example) e.g. Federal Information Code FIC id est (that is) i.e. latitude or longitude lat. or long. monetary symbols (U.S.) $, ¢ months (tables and figures): first three
letters (Jan,...,Dec) registered trademark ® trademark ™ United States (adjective) U.S. United States of America (noun) USA U.S.C. United States Code U.S. state use two-letter abbreviations (e.g., AK, WA)
Measures (fisheries) fork length FL mideye-to-fork MEF mideye-to-tail-fork METF standard length SL total length TL Mathematics, statistics all standard mathematical signs, symbols
and abbreviations alternate hypothesis HA base of natural logarithm e catch per unit effort CPUE coefficient of variation CV common test statistics (F, t, χ2, etc.) confidence interval CI correlation coefficient (multiple) R correlation coefficient (simple) r covariance cov degree (angular ) ° degrees of freedom df expected value E greater than > greater than or equal to ≥ harvest per unit effort HPUE less than < less than or equal to ≤ logarithm (natural) ln logarithm (base 10) log logarithm (specify base) log2, etc. minute (angular) ' not significant NS null hypothesis HO percent % probability P probability of a type I error (rejection of the
null hypothesis when true) α probability of a type II error (acceptance of
the null hypothesis when false) β second (angular) " standard deviation SD standard error SE variance population Var sample var

The Subsistence Harvest of Harbor Seals and Sea Lions by Alaska Natives in 2006
Technical Paper No. 339
Robert J. Wolfe 1 James A. Fall 2 Monica Riedel 3
Contributors Statewide Project Coordinator and Southcentral Alaska and Kodiak Coordinator: Joni Bryant, Alaska Native Harbor Seal Commission
Project Research Coordinators: Ronald T. Stanek, Lisa Hutchinson-Scarbrough, and Michael F. Turek, Alaska Department of Fish and Game, Division of Subsistence Aleutian Island and Western Alaska Peninsula Coordinator: Peggy Osterback, Aleut Marine Mammal Commission
Bristol Bay and Alaska Peninsula Coordinator: Molly Chythlook, Bristol Bay Native Association
Southeast Regional Coordinator: Matthew Kookesh, Southeast Alaska Intertribal Fish and Wildlife Commission Data Analysis: David Koster, Brad Robbins, Heather Bishop, Chloe Dunlap, Carol Johnson, and River Ramuglia, Alaska Department of Fish and Game, Division of Subsistence
1 Primary Author, Robert J. Wolfe and Associates for the Alaska Native Harbor Seal Commission 2 Co-Principal Investigator, Alaska Department of Fish and Game, Division of Subsistence 3 Co-Principal Investigator, Executive Director, Alaska Native Harbor Seal Commission
Final Report for Year Fourteen
The Subsistence Harvest of Sea Lions and Harbor Seals by Alaska Natives, Harvest Assessment Program, 2006 (Award Number NA05NMF4391111)
Prepared for the National Marine Fisheries Service by the Alaska Native Harbor Seal Commission and the Alaska Department of Fish and Game, Division of Subsistence
Alaska Department of Fish and Game
Division of Subsistence Juneau, Alaska
August 2008
The Division of Subsistence Technical Paper series was established in 1979 and represents the most complete collection of information about customary and traditional uses of fish and wildlife resources in Alaska. The papers cover all regions of the state. Some papers were written in response to specific fish and game management issues. Others provide detailed, basic information on the subsistence uses of particular communities which pertain to a large number of scientific and policy questions.
Technical Paper series reports are available through the Alaska State Library and on the Internet: http://www.subsistence.adfg.state.ak.us. This publication has undergone editorial and professional review.
The Alaska Department of Fish and Game (ADF&G) administers all programs and activities free from discrimination based on race, color, national origin, age, sex, religion, marital status, pregnancy, parenthood, or disability. The department administers all programs and activities in compliance with Title VI of the Civil Rights Act of 1964, Section 504 of the Rehabilitation Act of 1973, Title II of the Americans with Disabilities Act (ADA) of 1990, the Age Discrimination Act of 1975, and Title IX of the Education Amendments of 1972. If you believe you have been discriminated against in any program, activity, or facility please write:
ADF&G ADA Coordinator, P.O. Box 115526, Juneau AK 99811-5526 U.S. Fish and Wildlife Service, 4040 N. Fairfax Drive, Suite 300 Webb, Arlington VA 22203 Office of Equal Opportunity, U.S. Department of the Interior, Washington DC 20240
The department’s ADA Coordinator can be reached via phone at the following numbers: (VOICE) 907-465-6077, (Statewide Telecommunication Device for the Deaf) 1-800-478-3648, (Juneau TDD) 907-465-3646, or (FAX) 907-465-6078
For information on alternative formats and questions on this publication, please contact: ADF&G Division of Subsistence at www.subsistence.state.ak.us.

ABSTRACT
This report describes the subsistence takes of harbor seals Phoca vitulina and Steller sea lions Eumetopias jubatus by Alaska Natives in 2006, including quantity, seasons, geographic distribution, and age and sex of the harvest. Information is summarized at the state, regional, and community levels and is compared with annual takes since 1992. The research was conducted by the Alaska Native Harbor Seal Commission and the Alaska Department of Fish and Game Division of Subsistence in cooperation with the Aleut Marine Mammal Commission, the Bristol Bay Native Association, and the Southeast Alaska Intertribal Fish and Wildlife Commission, under contract with the National Marine Fisheries Service. Information is available for 63 coastal communities, based on interviews with 1,277 households in 62 communities in this study, and a separate in-season monitoring program for sea lions by the Aleut Community of St. Paul Island. Local researchers conducted most of the household interviews as part of regional research networks. The project received generous support from leaders of a number of Native governments and associations.
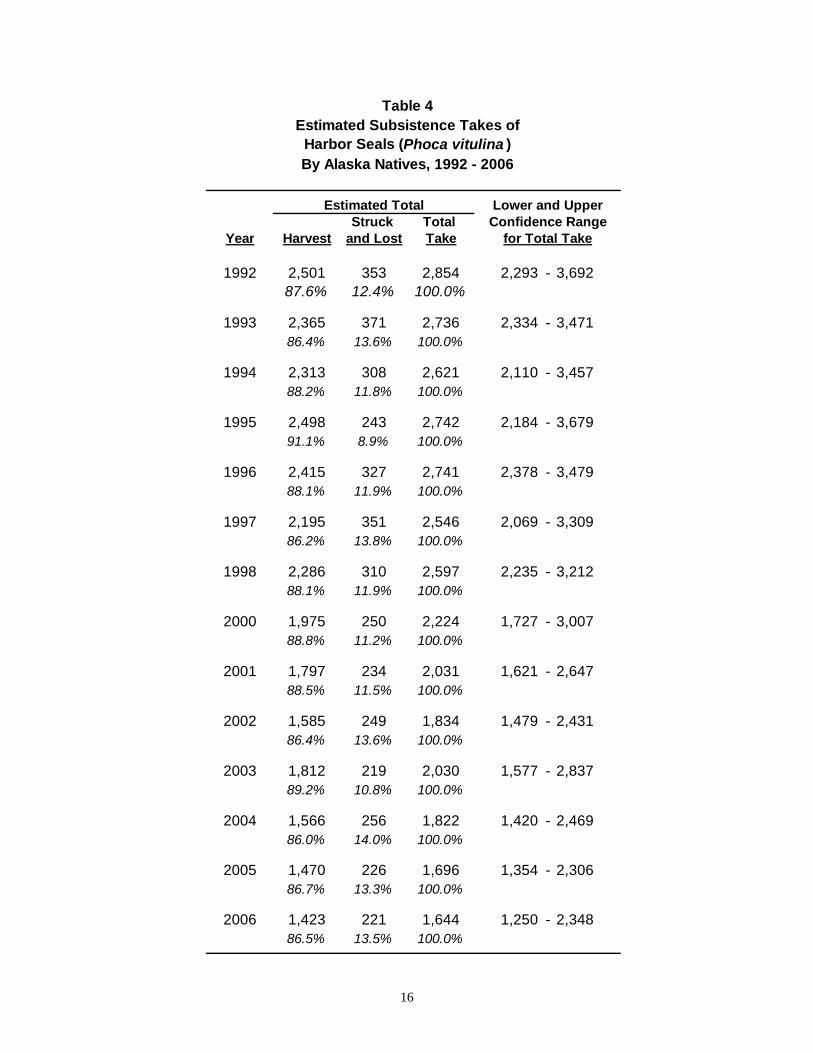
During 2006, the estimated subsistence take of harbor seals by Alaska Natives was 1,644 seals, with a 95% confidence range of between 1,250 and 2,348 seals. Of the take, 13.5% (221 seals) were struck and lost and 86.5% (1,423 seals) were harvested. The 2006 take of harbor seals came from the following stocks: Southeast Alaska stock (708 seals), Gulf of Alaska stock (848 seals), and Bering Sea stock (88 seals). Harbor seals were taken in 51 of 63 surveyed communities. Hunters reported taking males over females by 3.3 to one and adults (78.0%) over juveniles (19.5%) or pups (2.5%). The 2006 take of harbor seals (1,644 seals) was the lowest recorded since 1992: 2,854 (1992), 2,736 (1993), 2,621 (1994), 2,742 (1995), 2,741 (1996), 2,546 (1997), 2,597 (1998), 2,224 (2000), 2,031 (2001), 1,834 (2002), 2,030 (2003), 1,822 (2004), and 1,696 (2005). Declining takes of harbor seals are associated with fewer seal hunters, particularly in the Southeast Region.
During 2006, the estimated subsistence take of sea lions by Alaska Natives was
186 sea lions, with a 95% confidence range of between 125 and 289 sea lions. Of the take, 26.5% (49 sea lions) were struck and lost and 73.5% (137 sea lions) were harvested. Sea lions were taken in 15 of 63 surveyed communities. Hunters reported taking males over females by about 5.2 to one and adults (63.7%) over juveniles (36.3%) and pups (0.0%). Sea lion takes declined sharply from 1992 to 1995, with takes leveling off between 1996 and 2006: 549 (1992), 487 (1993), 416 (1994), 339 (1995), 186 (1996), 164 (1997), 178 (1998), 171 (2000), 198 (2001), 185 (2002), 212 (2003), 216 (2004), and 218 (2005). Declines in sea lion takes are associated with fewer hunters hunting sea lions, which in itself is probably linked to local sea lion scarcities.
i

ii
ACKNOWLEDGEMENTS
This project would not have been possible without tremendous local support in every community where we conducted the survey. We wish to thank each tribal council, city council, and all of the regional Native organizations that facilitated our work. Heartfelt thanks are owed to the many elders and local marine mammal experts who allowed us to interview them at length about their lifelong use and observations of sea lions and harbor seals. In addition, we are deeply indebted to the many hundreds of hunters who volunteered to report their subsistence harvests to locally-hired researchers. The thirty-eight local researchers who conducted household interviews deserve to be recognized individually for their high level of interest and work. We look forward to working with many again in the near future as the project moves into its fifteenth year: Anfesia Tutiakoff, Adak and Unalaska Rodrigo Amodo, Akhiok Antone Shelikoff, Akutan and Atka Harriet Silva, Angoon George Eleshansky, Chenega Bay Amy Skonberg, Chignik Bay Delissa Jones, Chignik Lagoon Irene Lind, Chignik Lake Jennifer Bennis, Clarks Point and
Levelock Bud Jansen, Cordova Nyna Fleury, Craig Helen Johnson, Dillingham Virgie Alto, Egegik and Pilot Point Carleen Hoblet, False Pass Diane Stickler, Haines Harlena Warford, Hoonah Nathan Soboleff, Juneau Henry Smith, Kake Rose Johnson, Ketchikan and Saxman Leff Kenezuroff, King Cove Mary Brown, King Salmon, Naknek and
South Naknek James Rowan, Klawock
Marlene Kenoyer, Larsen Bay Nick Tanape Sr., Nanwalek Ann Kyle, Nikolski Matilda Christiansen, Old Harbor Victoria Cornwell, Ouzinkie Royce Mattson, Pelican Andy Shangin and Mandy Yagie,
Perryville Byron Lyons, Petersburg Dimetre Tanape, Port Graham Greta Kosbruk, Port Heiden Jessica Ludvick, Sand Point Lillian Elvsass, Seldovia Keri Kompkoff, Tatitlek Elizabeth Myas, Togiak and Twin Hills Raymond Sensmeier, Yakutat
TABLE OF CONTENTS
SECTION ......................................................................................................PAGINATION INTRODUCTION............................................................................................................... 1 METHODOLOGY............................................................................................................. 6 THE SUBSISTENCE TAKE OF HARBOR SEALS IN 2006........................................... 15 Estimated Size of the Harbor Seal Take, 2006 ............................................................ 15 Geographic Distribution of Harbor Seal Takes.............................................................. 18 Seasonal Distribution of Harbor Seal Takes ................................................................ 19 Age and Sex Composition of Harbor Seal Harvests .................................................... 22 Hunter Assessments of Harbor Seal Population Trends............................................... 27 THE SUBSISTENCE TAKE OF SEA LIONS IN 2006.................................................... 29 Estimated Size of the Sea Lion Take, 2006................................................................. 29 Geographic Distribution of Sea Lion Takes.................................................................. 29 Seasonal Distribution of Sea Lion Takes ...................................................................... 34 Age and Sex Composition of Sea Lion Harvests .......................................................... 35 Hunter Assessments of Sea Lion Population Trends.................................................... 38 HUNTING PARTICIPATION AND EFFORT ................................................................... 40 DISCUSSION.................................................................................................................. 45 Harbor Seal Subsistence Trends, 1992 - 2006 ............................................................ 45 Sea Lion Subsistence Trends, 1992 - 2006 ................................................................. 70 REFERENCES................................................................................................................ 91 APPENDICES Appendix A. Survey Instrument...........................................................................A-1 - A-2 Appendix B. Subsistence Takes of Harbor Seal and Sea Lion by Region.................................................................................B-1 - B-18 Appendix C. Subsistence Takes of Harbor Seal and Sea Lion by Community ....................................................................... C-1 - C-126
iii

LIST OF TABLES AND FIGURES TABLE OR FIGURE......................................................................................PAGINATION Table 1. Community Organizations Contacted During the Project.................................... 8 Table 2. Sampling Methodology by Community, Harbor Seal and Sea Lion Surveys, 2006 ........................................................................................................... 10-11 Table 3. Sampling Methodology for Communities with Two Strata Designs, Harbor Seal and Sea Lion Surveys, 2006...................................................................... 12 Table 4. Estimated Subsistence Takes of Harbor Seals by Alaska Natives, 1992 - 2006 ..................................................................................... 16 Table 5. Regional Distribution of Subsistence Takes of Harbor Seals by Alaska Natives, 2006................................................................................................. 17 Table 6. Subsistence Harbor Seal Harvest, Take, and Use by Alaska Natives, 2006, With Confidence Intervals and Statistical Ranges, by Community ................. 20-21 Table 7. Age and Sex Composition of Harbor Seal Harvests by Alaska Natives, 2006................................................................................................. 25 Table 8. Age and Sex Composition of Harbor Seal Harvests by Alaska Natives by Region, 2006 ............................................................................... 26 Table 9. Local Harbor Seal Population Changes Compared to Five Years Ago, Hunters’ Assessments...................................................................... 28 Table 10. Estimated Subsistence Takes of Sea Lions by Alaska Natives, 1992 – 2006...................................................................................... 30 Table 11. Regional Distribution of Subsistence Takes of Sea Lions by Alaska Natives, 2006................................................................................................. 31 Table 12. Subsistence Sea Lion Harvest, Take, and Use by Alaska Natives, 2006, With Confidence Intervals and Statistical Ranges, by Community ................. 32-33 Table 13. Age and Sex Composition of Sea Lion Harvests by Alaska Natives, 2006................................................................................................. 36 Table 14. Age and Sex Composition of Sea Lion Harvests by Alaska Natives by Region, 2006 ............................................................................... 37 Table 15. Local Sea Lion Population Changes Compared to Five Years Ago, Hunters’ Assessments...................................................................... 39 Table 16. Alaska Native Households Hunting or Harvesting Harbor Seals or Sea Lions, 1992 - 2006......................................................................... 41 Table 17. Time and Effort Spent Hunting Harbor Seal in 2000 Compared with Five Years Ago, Hunters’ Assessments................................................. 44
iv

LIST OF TABLES AND FIGURES (CONTINUED)
TABLE OR FIGURE......................................................................................PAGINATION Table 18. Time and Effort Spent Hunting Sea Lions in 2000 Compared with Five Years Ago, Hunters’ Assessments................................................. 44 Table 19. Subsistence Harbor Seal Takes by Region, 1992 - 2006 .............................. 76 Table 20. Subsistence Sea Lion Takes by Region, 1992 - 2006 ................................... 77 Table 21. Subsistence Harbor Seal Takes by Alaska Natives by Eastern Gulf of Alaska Communities, 1992 - 2006 .............................................. 78-80 Table 22. Subsistence Harbor Seal Takes by Alaska Natives by Western Gulf-Bering Sea Communities, 1992 - 2006 .......................................... 81-83 Table 23. Subsistence Sea Lion Takes by Alaska Natives by Eastern Gulf of Alaska Communities, 1992 - 2006 .............................................. 84-86 Table 24. Subsistence Sea Lion Takes by Alaska Natives by Western Gulf-Bering Sea Communities, 1992 - 2006 .......................................... 87-89 Table 25. Harbor Seal Harvests by Strata for Communities with Two Strata Designs, 2006 ................................................................ 90 Table 26. Sea Lion Harvests by Strata for Communities with Two Strata Designs, 2006 ................................................................ 90 Fig. 1. Map of Study Area and Regions ........................................................................... 3 Fig. 2. General Distribution of Sea Lions in Alaska.......................................................... 4 Fig. 3. General Distribution of Harbor Seal and Spotted Seal in Alaska .......................... 5 Fig. 4. Seasonally Adjusted Takes of Harbor Seals and Sea Lions by Alaska Natives, 2006 ..................................................................................................... 23 Fig. 5. Mean Seasonally Adjusted Takes of Harbor Seals By Alaska Natives, 1992-1996, 1997-2001, and 2002-2006 .......................................... 24 Fig. 6. Mean Seasonally Adjusted Takes of Sea Lions By Alaska Natives, 1992-1996, 1997-2001, and 2002-2006........................................... 34 Fig. 7. Specialization in Harbor Seal and Sea Lion Takes: Percentage of Hunting Households by Percentage of Take, 2006......................................................... 42 Fig. 8. Trends in Numbers of Households Hunting Harbor Seals and Sea Lions, 1992 – 2006 ..................................................................... 42 Fig. 9. Estimated Subsistence Takes of Harbor Seals by Alaska Natives, 1992 – 2006 .......................................................................................... 47
v

LIST OF TABLES AND FIGURES (CONTINUED)
TABLE OR FIGURE......................................................................................PAGINATION Fig. 10. Estimated Subsistence Takes of Sea Lions by Alaska Natives, 1992 – 2006 .......................................................................................... 48 Fig. 11. Harbor Seal Take Trends by Harbor Seal Stock, 1992 - 2006 ..................................................................................... 48 Fig. 12. Harbor Seal Take Trends Reported by Alaska Native Hunters by Major Area, 1992-2006 ......................................................... 49 Fig. 13. Sea Lion Take Trends Reported by Alaska Native Hunters by Area, 1992-2006.................................................................... 50 Fig. 14. Harbor Seal Hunters and Success Rates, Hoonah, 1992 - 2006...................... 51 Fig. 15. Harbor Seal Hunters and Success Rates, Yakutat, 1992 - 2006 ...................... 51 Fig. 16. Harbor Seal Hunters and Success Rates, Sitka, 1992 - 2006 .......................... 52 Fig. 17. Harbor Seal Hunters and Success Rates, Tatitlek, 1992 - 2006....................... 52 Fig. 18. Harbor Seal Hunters and Success Rates, Nanwalek, 1992 - 2006 .................. 53 Fig. 19. Harbor Seal Hunters and Success Rates, Old Harbor, 1992 - 2006................. 53 Fig. 20. Change in Harbor Seal Harvests, North Pacific Rim Communities................... 55 Fig. 21. Change in Sea Lion Harvests, North Pacific Rim Communities........................ 56 Fig. 22. Change in Harbor Seal Harvests, Kodiak Island Communities......................... 57 Fig. 23. Change in Sea Lion Harvests, Kodiak Island Communities.............................. 58 Fig. 24. Percentage Annual Changes in Harvest, Struck and Lost, and Total Take, Harbor Seals, 1992 - 2006 ................................................... 59 Fig. 25. Percentage Annual Changes in Harvest, Struck and Lost, and Total Take, Sea Lions, 1992 - 2006 ........................................................ 59 Fig. 26. Sex Ratios (Males:Females) of Harbor Seal and Sea Lion Harvests Reported by Alaska Native Hunters, 1992 - 2006........................................... 63 Fig. 27. Age Structure (Pups, Juveniles, Adults) of Harbor Seal and Sea Lion Harvests Reported by Alaska Native Hunters, 1992 - 2006........................................... 63 Fig. 28. Percentage of Harbor Seal Harvests Reported as Male Seals by Hunters, 1992 - 2006.............................................................................. 64
vi
vii
LIST OF TABLES AND FIGURES (CONTINUED) TABLE OR FIGURE......................................................................................PAGINATION Fig. 29. Percentage of Harbor Seal Harvests Reported as Juvenile Seals by Hunters, 1992 - 2006 ........................................................................ 65 Fig. 30. Adult and Juvenile Harbor Seal Harvests by Month, January 1992 – December 2006, Southeast Alaska....................................................... 67 Fig. 31. Adult and Juvenile Harbor Seal Harvests by Month, January 1992 – December 2006, Kodiak Island Region................................................. 68 Fig. 32. Adult and Juvenile Harbor Seal Harvests by Month, January 1992 – December 2006, North Pacific Rim Region........................................... 69 Fig. 33. Sea Lion Hunters and Success Rates, Atka, 1992 - 2006........................................................................................................... 72 Fig. 34. Sea Lion Hunters and Success Rates, Old Harbor, 1992 - 2006 ................................................................................................ 72 Fig. 35. Sea Lion Hunters and Success Rates, Akutan, 1992 - 2006....................................................................................................... 73 Fig. 36. Sea Lion Hunters and Success Rates, Nanwalek, 1992 – 2006 .................................................................................................. 73

viii
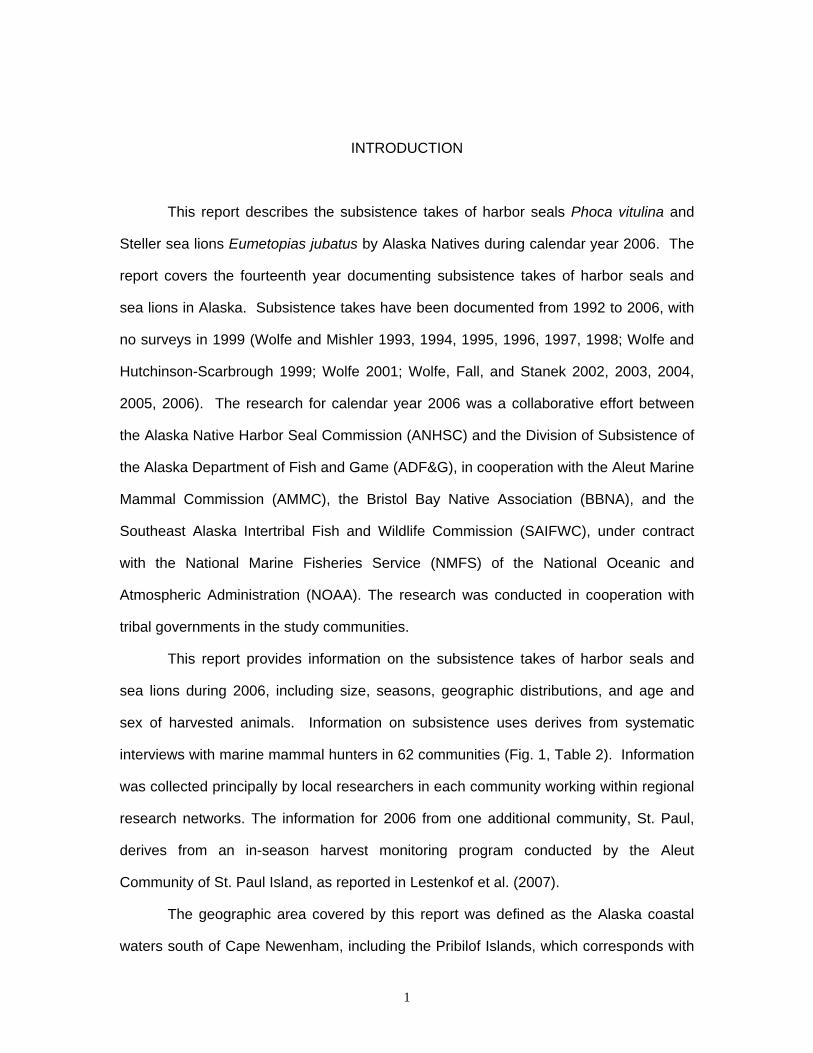
INTRODUCTION
This report describes the subsistence takes of harbor seals Phoca vitulina and
Steller sea lions Eumetopias jubatus by Alaska Natives during calendar year 2006. The
report covers the fourteenth year documenting subsistence takes of harbor seals and
sea lions in Alaska. Subsistence takes have been documented from 1992 to 2006, with
no surveys in 1999 (Wolfe and Mishler 1993, 1994, 1995, 1996, 1997, 1998; Wolfe and
Hutchinson-Scarbrough 1999; Wolfe 2001; Wolfe, Fall, and Stanek 2002, 2003, 2004,
2005, 2006). The research for calendar year 2006 was a collaborative effort between
the Alaska Native Harbor Seal Commission (ANHSC) and the Division of Subsistence of
the Alaska Department of Fish and Game (ADF&G), in cooperation with the Aleut Marine
Mammal Commission (AMMC), the Bristol Bay Native Association (BBNA), and the
Southeast Alaska Intertribal Fish and Wildlife Commission (SAIFWC), under contract
with the National Marine Fisheries Service (NMFS) of the National Oceanic and
Atmospheric Administration (NOAA). The research was conducted in cooperation with
tribal governments in the study communities.
This report provides information on the subsistence takes of harbor seals and
sea lions during 2006, including size, seasons, geographic distributions, and age and
sex of harvested animals. Information on subsistence uses derives from systematic
interviews with marine mammal hunters in 62 communities (Fig. 1, Table 2). Information
was collected principally by local researchers in each community working within regional
research networks. The information for 2006 from one additional community, St. Paul,
derives from an in-season harvest monitoring program conducted by the Aleut
Community of St. Paul Island, as reported in Lestenkof et al. (2007).
The geographic area covered by this report was defined as the Alaska coastal
waters south of Cape Newenham, including the Pribilof Islands, which corresponds with
1
the general distributions of harbor seals and sea lions in Alaska (Figs. 2 and 3, from
Burns et al. 1985). The use of harbor seals and sea lions by Alaska Natives for food and
raw materials has a long tradition in this part of Alaska, since before historic contact
through to the present. The Alaska Native groups using harbor seals include the Aleut
of the Aleutian Islands, the Alutiiq and Eyak of the Pacific Gulf coast, the Tlingit, Haida,
and Tsimshian of the Southeast archipelago, and the Yup'ik of Southwest Alaska. More
occasional use of harbor seals is made by the Dena'ina of Cook Inlet. The primary users
of sea lions are the Aleut of the Aleutian and Pribilof islands and the Alutiiq of certain
communities of Kodiak Island and the Gulf of Alaska. Sea lions are used more
occasionally by Tlingit, Haida, Tsimshian, and Yup'ik groups. Subsistence products
derived from harbor seals and sea lions by Alaska Natives include oil, meat, and skins,
as described in Wolfe and Mishler (1993).
This report is organized in several sections. The “Methodology” section
describes the methods used to collect information. Two sections (“The Subsistence
Take of Harbor Seals in 2006,” and “The Subsistence Take of Sea Lions in 2006”)
present information on the statewide takes of harbor seals and sea lions, summarized by
community and region. In the “Discussion” section are interpretations of the 2006 survey
year, including summaries of harvest patterns since 1992, derived from previous survey
years. Appendix A contains a copy of the survey instrument used in household
interviews with marine mammal hunters. Appendix B contains regional summaries of
the subsistence takes of harbor seals and sea lions. Appendix C contains materials on
the subsistence takes of harbor seals and sea lions by community.
2

3

Fig. 2. General distribution of sea lions Eumetopias jubatus in Alaska. (Source: Burns et al. 1985).
4

5

METHODOLOGY
This report includes information on the subsistence takes of harbor seals and sea
lions in 63 coastal communities (Table 2). Information for 62 communities was collected
in this project through interviews with persons in 1,277 Alaska Native households. In
addition, the report includes information about subsistence takes of sea lions by hunters
at St. Paul collected in-season through separate projects run by the Ecosystem
Conservation Office of the Aleut Community of St. Paul Island, as reported in Lestenkof
et al. 2007 (for 2006), Lestenkof and Zavadil 2006 (for 2005), and Zavadil et al. 2006 (for
2000–2004). (See also Lestenkof and Zavadil 2001; Lestenkof et al. 2003; and Zavadil
et al. 2003, 2004.) In the ADF&G study, respondents were asked to recall information
about their household's use of harbor seals and sea lions during the previous year. The
survey instrument administered in household interviews was similar to one used since
1992, developed in consultation with the Rural Alaska Community Action Program
(RurAL CAP) and the Indigenous People's Council for Marine Mammals (IPCoMM) (see
Appendix A). Hunters and household heads were asked to recall the numbers of harbor
seals and sea lions taken by household members during each month over the past year.
The survey contained questions that pertained to harvest numbers, struck and lost
animals, age of animals, and sex of animals. The survey also asked whether the
household used, harvested, received, or gave away harbor seals or sea lions during the
last year. Interviews were conducted by 38 local researchers hired and trained as part of
the project. A single survey was administered in January–March 2007 to cover the
period from January to December 2006.
The project was designed to be a collaborative effort with Alaska Native hunters
and organizations. During the first year of the study, a number of Native governments,
Native leaders, and associations with interests in harbor seals and sea lions
management were contacted to obtain suggestions about project design, including the
6
7
Alaska Federation of Natives (AFN), the Aleutians East Borough, Aleutian-Pribilof
Islands Association, BBNA, Central Council of Tlingit and Haida Indian Tribes of Alaska,
Cook Inlet Region, Inc., IPCoMM (meeting through RurAL CAP), Kodiak Area Native
Association, and the North Pacific Rim (now named Chugachmiut). RurAL CAP and
IPCoMM served as the formal technical oversight organizations for the first 5 years of
the project, through a subcontract with ADF&G. Since 1997, formal technical oversight
for the project has been provided by the ANHSC.
During 2006, the ANHSC received funding directly from NMFS and entered into a
cooperative agreement with ADF&G to jointly conduct the harvest assessment project.
The ANHSC provided a project coordinator and an analyst for writing the final report.
The ANHSC coordinated research activities in Prince William Sound, Cook Inlet, and
Kodiak Island. Research activities in other areas were coordinated by 3 regional Native
organizations: the Aleut Marine Mammal Commission (AMMC) for the Aleutian Islands
and western Alaska Peninsula areas; BBNA for the Bristol Bay and eastern Alaska
Peninsula areas; and SAIFWC for the Southeast region. ADF&G was responsible for
data analysis. Copies of this final report were provided to the Alaska Sea Otter and
Steller Sea Lion Commission (TASSC) by ADF&G.
As noted above, at St. Paul sea lion take information was collected by the Aleut
Community of St. Paul Island’s Ecosystem Conservation Office through a contract
between the Aleut Community and NMFS. The methodology and findings of that project
for 2006 are described in Lestenkof et al. 2007. Data from the Ecosystem Conservation
Office of the Aleut Community of St. Paul Island for other years are included in this
report based on published papers (see Lestenkof and Zavadil 2006 and Zavadil et al.
2006).

Table 1.
Community Organizations Contacted During the Project
Community Government/Organization Community Government/OrganizationAdak Aleut Marine Mammal Commission Larsen Bay Larsen Bay Tribal Council
Aleut Corporation City of Larsen BayAkhiok Akhiok Tribal Council Levelock Levelock Village Council
City of Akhiok Manokotak Manokotak Village CouncilAkutan Akutan Traditional Village Council Metlakatla Council Annette Islands Reserve
City of Akutan Metlakatla Indian CommunityAkutan Corporation Naknek Naknek Native Village Council
Aleknagik Aleknagik Traditional Council Nanwalek Nanwalek Traditional CouncilAnchorage Cook Inlet Tribal Council English Bay Corporation
Alaska Federation of Natives Nelson Lagoon Nelson Lagoon Village CouncilAngoon City of Angoon Newhalen Newhalen Traditional Council
Angoon Community Association Nikolski Nikolski IRA CouncilAtka Atka IRA Council Chaluka Corporation
City of Atka Old Harbor Old Harbor Tribal CouncilChenega Bay Chenega IRA Council City of Old HarborChignik Bay Chignik Bay Traditional Village Council Ouzinkie Ouzinkie Native CorporationChignik Lagoon Chignik Lagoon Traditional Village Council Ouzinkie Tribal CouncilChignik Lake Chignik Lake Traditional Village Council City of OuzinkieClark's Point Clark's Point Village Council Pelican Tlingit and Haida Indians of PelicanCordova Traditional Village of Eyak Pelican Community CouncilCraig Shaan-Seet, Inc. City of Pelican
City of Craig Perryville Perryville Traditional Village CouncilCraig Community Association Petersburg Petersburg Indian Association
Dillingham Curyung Tribal Council Pilot Point Pilot Point Traditional CouncilEgegik Egegik Traditional Council Port Graham Port Graham Village CouncilFalse Pass False Pas Tribal Council Port Graham Corporation
City of False Pass Port Heiden Port Heiden Native CouncilHaines Chilkat Indian Association Port Lions Port Lions Tribal CouncilHoonah Hoonah Indian Association City of Port Lions
Hoonah Traditional Council Saint George Saint George Traditional IRA CouncilHydaburg Haida Corporation Saint George Tanaq Corporation
Hydaburg Cooperative Association City of Saint GeorgeCity of Hydaburg Saint Paul Tribal Government of Saint Paul
Iliamna Iliamna Village Council City of Saint PaulIvanof Bay Ivanof Bay Traditional Village Council Sand Point Unga Tribal CouncilJuneau Tlingit and Haida Central Council Qagan Tayagugin Tribe of Sand Point
Sealaska City of Sand PointAuke Tribe Council Saxman Organized Village of SaxmanAlaska Native Brotherhood/Sisterhood City of SaxmanDouglas Indian Association Seldovia Seldovia Village Tribe
Kake Organized Village of Kake Seward Qutekcak Native TribeCity of Kake Sitka Sitka Tribe of Alaska
Karluk Karluk IRA Council Alaska Native BrotherhoodKenai Kenaitze Indian Tribe IRA South Naknek South Naknek Village Council
Cook Inlet Region, Inc. Tatitlek Tatitlek IRA CouncilKetchikan Ketchikan Indian Community Togiak Togiak Traditional CouncilKing Cove Agdaagux Tribe of King Cove Twin Hills Twin Hills Village Council
Belkofsky Village Council Tyonek Native Village of TyonekCity of King Cove Unalaska Qawalangin Tribal Council
King Salmon King Salmon Village Council Valdez Valdez Native AssociationKlawock Klawock Cooperative Association Wrangell Wrangell Cooperative Association
Klawock Heenya Corporation Yakutat Yakutat Tlingit TribeKlukwan Chilkat Indian Village Yak-Tat KwaanKodiak City Kodiak Tribal Council Alaska Native Brotherhood/
Kodiak Area Native Association Alaska Native Sisterhood
8

Support for the project was solicited from local Native governments or leaders of
local government entities for each community where surveys were conducted. During
the first project year, contacts were made with representatives of all the entities listed in
Table 1 and the project received support in the communities listed in Table 2. Many
local governments have been extremely helpful during the course of the project,
especially by identifying Native households, potential local researchers, and marine
mammal experts in the community to contact.
The project was designed to protect the identities of surveyed participants.
Marine mammal hunters and other respondents were informed that participation in
interviews was completely voluntary. Respondents were told that their identities would
be kept confidential in reports presenting the information. Permission to administer the
household harvest survey was asked of each individual respondent, face-to-face at the
person's home or during an initial phone contact. At this time, the purpose of the project
was described. If a person declined to participate in the study, the person was thanked
for his or her time and a survey was not conducted. Persons who were interviewed as
part of the harvest survey were not paid. Most marine mammal hunters generously
offered their assistance to the study.
As stated above, a network of locally-hired researchers supervised by the staff of
the ANHSC, AMMC, BBNA, and SAIFWC was used to collect information on
subsistence takes of sea lions and harbor seals during 2006. Newly-hired local
researchers received in-person training from regional organization staff, whereas local
researchers who successfully conducted surveys on previous rounds usually worked
with regional researchers through telephone, e-mail, fax, and the mail. Local
researchers performed such tasks as updating community lists of households and
hunters, implementing household sampling regimes, administering household surveys
9

10
Table 2Sampling Methodology By Community
Harbor Seal and Sea Lion Surveys, 2006
2000 U.S. Census Identified PercentageRegion and Estimated Native Type of Household Surveyed HouseholdsCommunity Population Design Universe1 Households Surveyed
1. SOUTHEASTAngoon 494 Chain Referral 37 37 100.0%Craig 432 Chain Referral 20 15 75.0%Haines 335 Chain Referral 13 11 84.6%Hoonah 597 Chain Referral 48 38 79.2%
** Hydaburg 342 Chain Referral 16 10 62.5%Juneau 5,084 Chain Referral 22 16 72.7%Kake 530 Chain Referral 35 32 91.4%Ketchikan 1,802 Chain Referral 13 9 69.2%Klawock 496 Chain Referral 29 25 86.2%
** Klukwan 123 Chain Referral 8 3 37.5%Pelican 42 Chain Referral 6 5 83.3%Petersburg 388 Chain Referral 30 30 100.0%Saxman 302 Chain Referral 14 10 71.4%
** Sitka 2,178 Chain Referral 65 64 98.5%** Wrangell 550 Chain Referral 10 6 60.0%
Yakutat 375 Chain Referral 45 40 88.9%Region Total 14,070 411 351 85.4%
2. NORTH PACIFIC RIMChenega Bay 67 Census 18 11 61.1%Cordova 368 Chain Referral 9 7 77.8%Nanwalek 165 Census 40 39 97.5%Port Graham 151 Census 53 27 50.9%Seldovia 66 Chain Referral 4 3 75.0%
** Seward 592 Chain Referral 13 6 46.2%Tatitlek 91 Census 20 15 75.0%
** Valdez 410 Chain Referral 6 2 33.3%Region Total 1,910 163 110 67.5%
3. UPPER KENAI-COOK INLET** Anchorage 26,995 Chain Referral 25 15 60.0%** Homer 371 Chain Referral 13 7 53.8%** Kenai 2120 Chain Referral 3 1 33.3%** Tyonek 184 Chain Referral 2 2 100.0%
Region Total 29,670 43 25 58.1%
4. KODIAK ISLANDAkhiok 75 Census 17 15 88.2%
** Karluk 26 Census 14 13 92.9%** Kodiak City 829 Chain Referral 17 11 64.7%
Larsen Bay 91 Census 35 19 54.3%Old Harbor 203 Census 67 63 94.0%Ouzinkie 197 Chain Referral 49 43 87.8%
** Port Lions 163 Chain Referral 11 3 27.3%Region Total 1,584 210 167 79.5%
1 For Chain Referral communities, the "Identified Household Universe" is smaller than the total number of Native households.

Table 2 (Continued)
Sampling Methodology by Community,Harbor Seal and Sea Lion Surveys, 2006
2000 U.S. Census Identified PercentageRegion and Estimated Native Type of Household Surveyed HouseholdsCommunity Population Design Universe Households Surveyed
5. SOUTH ALASKA PENINSULAChignik Bay 48 Census 23 16 69.6%Chignik Lagoon 85 Census 19 16 84.2%Chignik Lake 127 Census 25 17 68.0%False Pass 42 Census 13 13 100.0%Ivanof Bay 21 Census 2 2 100.0%King Cove 379 Chain Referral 14 13 92.9%Perryville 105 Census 31 26 83.9%Sand Point 421 Chain Referral 15 8 53.3%Region Total 1,228 142 111 78.2%
6. ALEUTIAN ISLANDSAdak 0 Chain Referral 3 3 100.0%
Akutan 117 Census 29 24 82.8%Atka 84 Census 24 12 50.0%Nikolski 27 Chain Referral 5 5 100.0%Unalaska 397 Chain Referral 18 10 55.6%Region Total 625 79 54 68.4%
7. PRIBILOF ISLANDS** St. George 140 Chain Referral 7 3 42.9%* St. Paul 460 Tribal Study N/A N/A N/A
Region Total 140 7 3 42.9%
8. SOUTH BRISTOL BAYEgegik 89 Census 27 27 100.0%King Salmon 133 Census 21 15 71.4%Levelock 116 Census 19 6 31.6%Naknek 319 Two Strata 89 46 51.7%Pilot Point 86 Census 15 5 33.3%Port Heiden 93 Census 27 25 92.6%South Naknek 115 Census 23 21 91.3%Region Total 951 221 145 65.6%
9. NORTH BRISTOL BAY** Aleknagik 187 Census 41 34 82.9%
Clark's Point 69 Census 23 18 78.3%Dillingham 1,503 Two Strata 76 67 88.2%
** Manokotak 378 Two Strata 78 68 87.2%Togiak 750 Two Strata 115 108 93.9%Twin Hills 65 Chain Referral 16 16 100.0%Region Total 2,952 349 311 89.1%
TOTAL 53,130 1,625 1,277 78.6%(Excl. Anchorage) (26,135) (1,600) (1,262) (78.9%)
* St. Paul's 2006 data from Lestenkof et al. (2007).** Data not available for 2006. Data reported for the most recent year for which data are available.
11

Table 3Sampling Methodology for Communities
With Two Strata Designs,Harbor Seal and Sea Lion Surveys, 2006
Number Sampled Percent Number Sampled Percent High Stratum High Stratum High Low Stratum Low Stratum Low
Community Households Households Stratum Households Households Stratum
illingham 22 13 59.1% 54 54 100.0%anokotak 32 31 96.9% 46 37 80.4%aknek 28 26 92.9% 61 20 32.8%ogiak 66 63 95.5% 49 45 91.8%
Total 148 133 89.9% 210 156 74.3%
DMNT
during the yearly cycle, data proofing of surveys and survey tracking forms, and mailing
surveys and tracking sheets for data entry and analysis. Regional researchers
performed such tasks as obtaining formal support for the project from Native
organizations, recruiting and selecting local hires, developing household sampling
regimes, training and supervising local researchers, proofing survey data, and consulting
local researchers to resolve data questions in preparation for data entry and analysis.
Entering data into a centralized database was done by ADF&G staff.
In 2006, 38 local researchers collected information in 46 communities. New
harvest information was not collected in 16 communities (Table 2) because effective
local surveyors were not secured and funding constraints did not allow for additional
work by regional researchers. In this report, data from the most recent survey cycle in
each community were used for estimates in the 16 unsurveyed communities, as noted in
Appendix C. Ivanof Bay was added as a survey community in 2006, after having no
year-round households from 2003 to 2005 (during that time, its hunters were included on
the Perryville household lists). As stated above, in recent years harvest information at
St. Paul has been collected under a program of the Aleut Community of St. Paul Island.
Harvest information for 2006 at St. Paul was taken from Lestenkof et al. (2007).
Households were selected using 3 main designs, depending upon the
community: census sampling, chain referral sampling, and 2-strata random sampling.
12

The type of design used for each community is shown in Table 2. Sampling designs and
expansion methods were similar to those used the first study year, as described in Wolfe
and Mishler (1993:17-19). Census sampling means all households with Alaska Natives
were identified for contact. For chain referral communities, the sampling universe
comprised all households with marine mammal hunters (based on past or potential
activities), as identified by key respondents and other surveyed hunters in the
community. In the 2-strata random design, the high stratum comprised hunting
households as identified by key respondents, and the low stratum comprised a random
draw of households from the remaining Alaska Native households in the community.
For communities with census or chain referral sampling, 78.0% of identified
households (988 of 1,267 households) were successfully contacted and interviewed.
For communities with 2-strata designs, 89.9% of high stratum households were
successfully contacted and interviewed (133 of 148 households), while 74.3% of low
stratum households were interviewed (156 of 210 households) (Tables 2 and 3). These
are relatively high sampling fractions for studies using survey methodologies that rely
upon voluntary participation by surveyed households. Overall, the level of cooperation
by households in the harvest survey was high in communities. The non-response rate
was due in large part to logistical problems in contacting households, rather than
refusals to participate.
In the appendices, the statistical analysis presents harvest data in 3 different
Tables for each community. In the first table, the unexpanded reported take is
presented for each community, representing actual animals reported killed by surveyed
hunters with no fractions of animals. The second table presents the combined estimated
expanded take for each stratum in the community. In this table, takes of surveyed
hunters are expanded to unsurveyed hunters within the stratum, using different methods
depending upon the household sampling design as described above. In this expansion,
the proportions of the seasonal takes of the surveyed households are preserved, so
13
takes with unknown months exist in the table. The expansion treats each community as
a separate sampling universe. Fractions of animals commonly result from the
expansion, which are rounded to the nearest tenth. The third table presents a
seasonally-adjusted expanded take: takes with unknown months are assigned to months
based on the proportion of the known take. The numbers in this third table form the
basis for the numbers in the report's narrative. In addition, details of the expansion for 2
strata communities are shown for harbor seal takes in Table 25 and for sea lion takes in
Table 26.
The calculation of the confidence range around the estimate followed the
methods for stratified samples in Cochran (1977:5.13, 5.15). In this process, the
unexpanded reported take (that is, the known take) was used as the lower range for a
community if it was higher than the statistically-calculated lower take estimate.
14

15
THE SUBSISTENCE TAKE OF HARBOR SEALS IN 2006
Estimated Size of the Harbor Seal Take, 2006
The estimated size of the total take of harbor seals by Alaska Natives in 2006 is
presented in Tables 4 and 5. In 2006, there were an estimated 1,644 harbor seals taken
by Alaska Natives for subsistence uses (with a 95% confidence range of between 1,250
and 2,248 animals) (Table 4). Of the 2006 subsistence take, 13.5% (221 harbor seals)
were struck and lost, and 86.5% (1,423 harbor seals) were harvested.
The total state estimate for harbor seals is necessarily somewhat indeterminate
because of species identification problems in the Bristol Bay area. As discussed in
Wolfe and Mishler (1993:61-69), in Bristol Bay there are areas with a seasonal
geographic overlap of harbor seals and spotted seals P. largha (see Fig. 3). Local
indigenous Yup'ik taxonomies categorize adults of the 2 Linnaean species as a single
type (issuriq) in this area, and categorize pups into 2 different types. Of the total North
Bristol Bay take, we classified 29 seals as P. vitulina and 170 seals as P. largha, based
on ecological features of the kill (degree of association with seasonal ice) (Appendix B,
Table 9). Of the animals classified as P. largha, 21.4% (30 animals) were reported
struck and lost, and 78.6% (140 animals) were harvested (Appendix B, Table 9). In
Table 4, we also assumed the entire South Bristol Bay take of 59 animals was P.
vitulina. Changing these assumptions will change the total statewide take estimate up or
down. As stated above, we believe the best estimate of the subsistence take in 2006 is
1,644 harbor seals, based on the assumptions above.
16
Table 4Estimated Subsistence Takes of
Harbor Seals (Phoca vitulina )By Alaska Natives, 1992 - 2006
Estimated Total Lower and UpperStruck Total Confidence Range
Year Harvest and Lost Take for Total Take
1992 2,501 353 2,854 2,293 - 3,69287.6% 12.4% 100.0%
1993 2,365 371 2,736 2,334 - 3,47186.4% 13.6% 100.0%
1994 2,313 308 2,621 2,110 - 3,45788.2% 11.8% 100.0%
1995 2,498 243 2,742 2,184 - 3,67991.1% 8.9% 100.0%
1996 2,415 327 2,741 2,378 - 3,47988.1% 11.9% 100.0%
1997 2,195 351 2,546 2,069 - 3,30986.2% 13.8% 100.0%
1998 2,286 310 2,597 2,235 - 3,21288.1% 11.9% 100.0%
2000 1,975 250 2,224 1,727 - 3,00788.8% 11.2% 100.0%
2001 1,797 234 2,031 1,621 - 2,64788.5% 11.5% 100.0%
2002 1,585 249 1,834 1,479 - 2,43186.4% 13.6% 100.0%
2003 1,812 219 2,030 1,577 - 2,83789.2% 10.8% 100.0%
2004 1,566 256 1,822 1,420 - 2,46986.0% 14.0% 100.0%
2005 1,470 226 1,696 1,354 - 2,30686.7% 13.3% 100.0%
2006 1,423 221 1,644 1,250 - 2,34886.5% 13.5% 100.0%
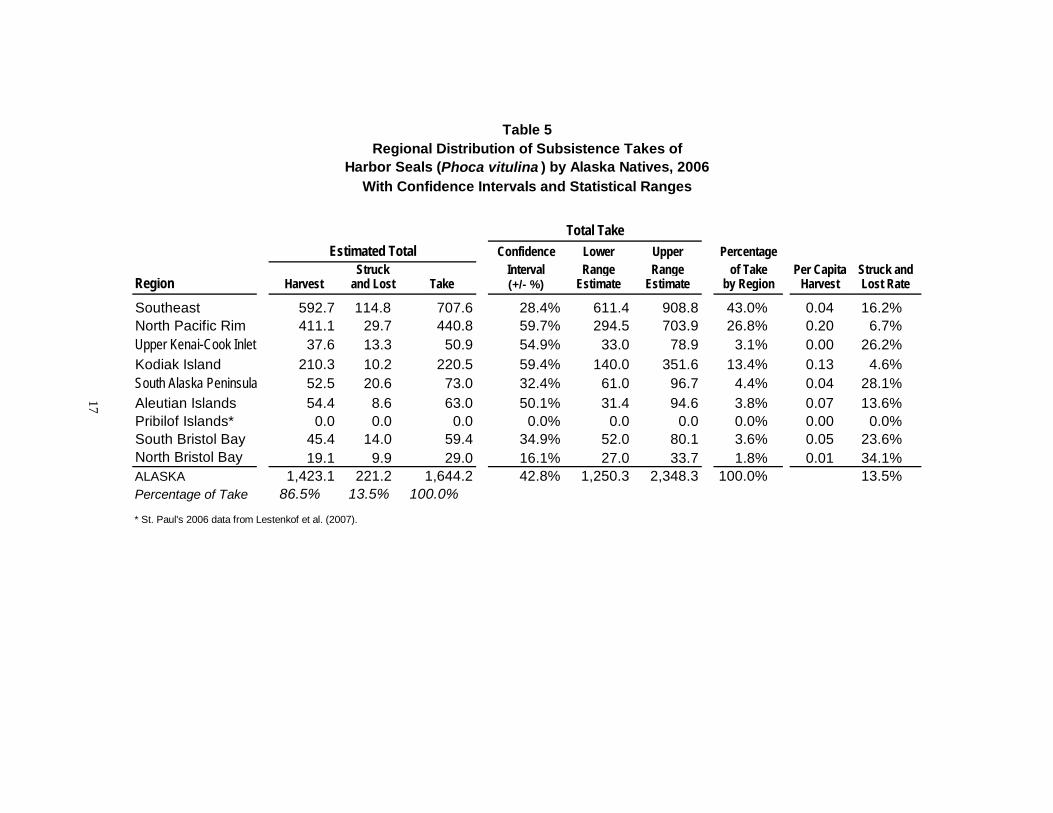
Table 5Regional Distribution of Subsistence Takes of
Harbor Seals (Phoca vitulina ) by Alaska Natives, 2006With Confidence Intervals and Statistical Ranges
Total TakeEstimated Total Confidence Lower Upper Percentage
Struck Interval Range Range of Take Per Capita Struck andRegion Harvest and Lost Take (+/- %) Estimate Estimate by Region Harvest Lost Rate
Southeast 592.7 114.8 707.6 28.4% 611.4 908.8 43.0% 0.04 16.2% North Pacific Rim 411.1 29.7 440.8 59.7% 294.5 703.9 26.8% 0.20 6.7% Upper Kenai-Cook Inlet 37.6 13.3 50.9 54.9% 33.0 78.9 3.1% 0.00 26.2% Kodiak Island 210.3 10.2 220.5 59.4% 140.0 351.6 13.4% 0.13 4.6% South Alaska Peninsula 52.5 20.6 73.0 32.4% 61.0 96.7 4.4% 0.04 28.1% Aleutian Islands 54.4 8.6 63.0 50.1% 31.4 94.6 3.8% 0.07 13.6% Pribilof Islands* 0.0 0.0 0.0 0.0% 0.0 0.0 0.0% 0.00 0.0% South Bristol Bay 45.4 14.0 59.4 34.9% 52.0 80.1 3.6% 0.05 23.6% North Bristol Bay 19.1 9.9 29.0 16.1% 27.0 33.7 1.8% 0.01 34.1% ALASKA 1,423.1 221.2 1,644.2 42.8% 1,250.3 2,348.3 100.0% 13.5% Percentage of Take 86.5% 13.5% 100.0%
* St. Paul's 2006 data from Lestenkof et al. (2007).
17
Geographic Distribution of Harbor Seal Takes
Table 5 shows the regional distribution of harbor seal takes by Alaska Natives in
2006. The largest takes in absolute numbers were by the Tlingit and Haida of the
Southeast region. About 43.0% (708 animals) of the statewide take of harbor seals were
taken by hunters in Southeast Alaska (Table 5). The regions ranked second and third
were the North Pacific Rim (441 seals, or 26.8% of the statewide take) and Kodiak
Island (221 seals, or 13.4%). The remainder of the statewide harbor seal take (275
animals, or 16.7%) was distributed among the other 6 regions.
The geographic distribution of harbor seal takes by community is shown in Table
6. Of the top 10 communities (in absolute numbers of harbor seals taken in 2006), 5
were in the Southeast region, 3 in the North Pacific Rim region, and 2 on the South
Alaska Peninsula. The 10 top ranking communities were Tatitlek (235 seals), Yakutat
(164 seals), Sitka (161 seals), Port Lions (77 seals), Valdez (69 seals), Hoonah (63
seals), Ouzinkie (58 seals), Angoon (54 seals), Port Graham (51 seals), and Juneau (50
seals). There were 11 communities with no reported harbor seals taken in 2006: Adak,
Aleknagik, Chignik Lagoon, Clark's Point, False Pass, Klukwan, Levelock, Seward,
South Naknek, St. George, and St. Paul (spotted seals were reported taken at Aleknagik
and Clark’s Point and the Ecosystem Conservation Office at St. Paul did not collect
harbor seal data).
Per capita harvests are the numbers of harbor seals harvested per Alaska Native
living in a community. It is an estimate of the amount harvested per person in an area,
controlling for differences in population size. The top 10 communities in terms of
harvests per capita in 2006 were Tatitlek (1.40 seals harvested per person), Karluk (.75),
Nikolski (.63), Port Lions (.47), Yakutat (.37), Port Graham (.34), Chenega Bay (.32),
Atka (.31), Perryville (.26), and Ouzinkie (.25). There was greater parity across regions
in per capita harvests compared with total community take (Table 6). Among the top 10
communities for per capita harvests, 3 were in the Kodiak Islands and North Pacific Rim,
18

19
2 in the Aleutian Islands, and one each in the Southeast Region and South Alaska
Peninsula.
Seasonal Distribution of Harbor Seal Takes
The seasonal distribution of the statewide harbor seal take in 2006 is depicted in
Figs. 4 and 5. Seals were taken during all months in 2006. Since 1992, the seasonal
patterning of harbor seal takes commonly has shown 2 distinct hunting peaks, one
during spring and a second during fall-early winter; as well as a low point in June (Fig.
5). The spring peak was nearly absent during 2006, with seal harvests building during
the year to peaks in November and December (Fig. 4). The disappearance of the spring
peak in seal takes is shown in Fig. 5. Overall, harbor seal hunting during 2006 was
toward the low range for each month compared with other years. Harbor seal takes in
January, May, and October were the lowest recorded for those months since surveys
began in 1992. Seasonal hunting patterns of each region and community are shown in
the tables and figures of Appendices B and C.

Table 6
Subsistence Harbor Seal Harvest, Take, and Use by Alaska Natives, 2006With Confidence Intervals and Statistical Ranges, by Community
Harbor Native Native Total TakeSeal Households Households Confidence Lower Upper
Harvest Harvesting Using Struck Total Interval Range RangePer Capita Harbor Seal Harbor Seal Harvest and Lost Take (+/- %) Estimate Estimate
SOUTHEAST ALASKA Angoon .09 48.6% 97.3% 46.0 8.0 54.0 0.0% 54.0 54.0Craig .00 6.7% 13.3% 1.3 0.0 1.3 98.0% 1.0 2.6Haines .01 9.1% 18.2% 4.7 0.0 4.7 76.9% 4.0 8.4Hoonah .09 26.3% 50.0% 55.6 7.6 63.2 46.1% 50.0 92.3*Hydaburg .04 40.0% 40.0% 14.4 0.0 14.4 54.3% 9.0 22.2Juneau .01 43.8% 81.3% 26.1 23.4 49.5 41.0% 36.0 69.8Kake .08 46.9% 100.0% 40.5 0.0 40.5 14.8% 37.0 46.5Ketchikan .02 33.3% 100.0% 37.6 0.0 37.6 83.1% 26.0 68.8Klawock .03 28.0% 36.0% 16.2 3.5 19.7 27.4% 17.0 25.1*Klukwan .00 0.0% 100.0% 0.0 0.0 0.0 0.0% 0.0 0.0Pelican .20 60.0% 80.0% 8.4 0.0 8.4 34.3% 7.0 11.3Petersburg .03 20.0% 100.0% 10.0 11.0 21.0 0.0% 21.0 21.0Saxman .07 50.0% 90.0% 20.2 0.0 20.2 39.9% 14.4 28.2*Sitka .06 53.1% 79.7% 141.2 19.3 160.5 8.9% 158.0 174.8*Wrangell .06 33.3% 33.3% 33.3 8.3 41.7 82.9% 25.0 76.2Yakutat .37 57.5% 97.5% 137.3 33.8 171.0 21.5% 152.0 207.7NORTH PACIFIC RIMChenega Bay .32 18.2% 90.9% 21.3 0.0 21.3 89.1% 13.0 40.2Cordova .08 85.7% 85.7% 30.9 2.6 33.4 20.8% 26.5 40.4Nanwalek .14 15.4% 100.0% 23.6 5.1 28.7 15.8% 28.0 33.2Port Graham .34 29.6% 100.0% 51.0 0.0 51.0 53.0% 26.0 78.1Seldovia .04 33.3% 100.0% 2.7 0.0 2.7 98.0% 2.0 5.3*Seward .00 0.0% 33.3% 0.0 0.0 0.0 0.0% 0.0 0.0Tatitlek 2.40 46.7% 100.0% 218.7 16.0 234.7 55.8% 176.0 365.7*Valdez .15 100.0% 100.0% 63.0 6.0 69.0 104.4% 23.0 141.0UPPER KENAI-COOK INLETAnchorage .00 33.3% 60.0% 25.0 13.3 38.3 59.5% 23.0 61.1Homer .02 28.6% 42.9% 5.6 0.0 5.6 92.4% 3.0 10.7Kenai .00 100.0% 100.0% 6.0 0.0 6.0 0.0% 6.0 6.0Tyonek .01 50.0% 100.0% 1.0 0.0 1.0 0.0% 1.0 1.0KODIAK ISLANDAkhiok .18 53.3% 100.0% 13.6 1.1 14.7 22.5% 13.0 18.1*Karluk .75 76.9% 76.9% 19.4 0.0 19.4 12.5% 18.0 21.8*Kodiak City .01 27.3% 54.5% 10.8 0.0 10.8 61.8% 7.0 17.5Larsen Bay .22 31.6% 57.9% 20.3 0.0 20.3 56.2% 11.0 31.7Old Harbor .10 17.5% 79.4% 20.2 0.0 20.2 15.1% 19.0 23.3Ouzinkie .25 41.9% 100.0% 49.0 9.1 58.1 16.9% 51.0 67.9*Port Lions .47 66.7% 100.0% 77.0 0.0 77.0 122.5% 21.0 171.4SOUTH ALASKA PENINSUL
AChignik Bay .00 12.5% 18.8% 4.3 1.4 5.8 83.8% 4.0 10.6Chignik Lagoon .00 0.0% 0.0% 0.0 0.0 0.0 0.0% 0.0 0.0Chignik Lake .00 0.0% 58.8% 0.0 2.9 2.9 110.9% 2.0 6.2False Pass .00 0.0% 0.0% 0.0 0.0 0.0 0.0% 0.0 0.0Ivanof Bay .14 100.0% 100.0% 3.0 0.0 3.0 0.0% 3.0 3.0King Cove .04 100.0% 100.0% 14.0 0.0 14.0 0.0% 14.0 14.0Perryville .26 42.3% 69.2% 27.4 14.3 41.7 24.7% 35.0 52.0Sand Point .01 12.5% 25.0% 3.8 1.9 5.6 93.9% 3.0 10.9PRIBILOF ISLANDSSt. George .00 0.0% 0.0% 0.0 0.0 0.0 0.0% 0.0 0.0**St. Paul .00 0.0% 0.0% 0.0 0.0 0.0 0.0% 0.0 0.0
20

Table 6 (Continued)
Subsistence Harbor Seal Harvest, Take, and Use by Alaska Natives, 2006With Confidence Intervals and Statistical Ranges, by Community
Harbor Native Native Total TakeSeal Households Households Confidence Lower Upper
Harvest Harvesting Using Struck Total Interval Range RangePer Capita Harbor Seal Harbor Seal Harvest and Lost Take (+/- %) Estimate Estimate
ALEUTIAN ISLANDS Adak .00 0.0% 0.0% 0.0 0.0 0.0 0.0% 0.0 0.0Akutan .02 4.2% 25.0% 2.4 0.0 2.4 81.4% 0.4 4.4Atka .31 41.7% 83.3% 26.0 4.0 30.0 58.1% 12.6 47.4Nikolski .63 100.0% 100.0% 17.0 1.0 18.0 0.0% 18.0 18.0Unalaska .02 20.0% 20.0% 9.0 3.6 12.6 96.6% 0.4 24.8SOUTH BRISTOL BAYEgegik .00 3.7% 11.1% 3.0 0.0 3.0 0.0% 3.0 3.0King Salmon .05 20.0% 33.3% 7.0 0.0 7.0 66.3% 5.0 11.6Levelock .00 0.0% 66.7% 0.0 0.0 0.0 0.0% 0.0 0.0Naknek .02 3.6% 26.8% 15.1 7.5 22.6 32.2% 21.0 29.9Pilot Point .03 20.0% 60.0% 3.0 0.0 3.0 160.0% 1.0 7.8Port Heiden .19 32.0% 48.0% 17.3 6.5 23.8 16.9% 22.0 27.8South Naknek .00 0.0% 4.8% 0.0 0.0 0.0 0.0% 0.0 0.0NORTH BRISTOL BAY*Aleknagik .00 20.6% 85.3% 0.0 0.0 0.0 0.0% 0.0 0.0Clark's Point .00 27.8% 77.8% 0.0 0.0 0.0 0.0% 0.0 0.0Dillingham .00 11.1% 74.1% 0.0 1.0 1.0 0.0% 1.0 0.0*Manokotak .02 45.1% 85.9% 6.6 8.9 15.5 24.1% 14.0 19.2Togiak .02 25.8% 58.2% 11.5 0.0 11.5 16.7% 11.0 13.5Twin Hills .02 18.8% 87.5% 1.0 0.0 1.0 0.0% 1.0 1.0
ALASKA TOTAL 1,423.1 221.2 1,644.2 42.8% 1,250.3 2,348.3
SPOTTED SEALS, NORTH BRISTOL BAY*** Aleknagik .05 20.6% 85.3% 9.6 7.2 16.9 30.1% 14.0 22.0Clark's Point .20 27.8% 77.8% 14.1 2.6 16.6 38.0% 13.0 22.9Dillingham .01 11.1% 74.1% 15.2 0.0 15.2 69.2% 9.0 25.8Manokotak .12 45.1% 85.9% 45.9 8.9 54.8 10.7% 49.0 60.7Togiak .07 25.8% 58.2% 50.9 7.4 58.3 12.1% 55.0 65.4Twin Hills .06 18.8% 87.5% 4.0 4.0 8.0 0.0% 8.0 8.0
TOTAL WITH OTHER SEALS 1,562.9 251.2 1,814.1 2.0 1,398.3 2,552.9
* Data not available for 2006. Data reported for the most recent year for which data are available.** St. Paul's 2006 data from Lestenkof et al. (2007).*** In North Bristol Bay, percentage of households harvesting and using Issuriq.
21

Age and Sex Composition of Harbor Seal Harvests
The estimated age and sex composition of the 2006 harbor seal harvests are
shown in Tables 7 and 8 by geographic region. Hunters reported harvesting male
harbor seals over female harbor seals by a ratio of about 3.3 to one (705 males to 215
females of harvests with reported sex). Hunters also reported harvesting substantially
more adult harbor seals (78.0%) than juveniles (19.5%) or pups (2.5%). Overall, adult
females (163 animals) comprised about 18.2% of the total harbor seal harvest whose
age and sex was reported in 2006. Hunters did not report the sex for 35.4% of the
harvest or the age for about 21.4% of the harvest. The age and sex are also unknown
for animals that were struck and lost. A further analysis of age and sex composition is
found in the “Discussion” section.
22

23
Figure 4
Seasonally Adjusted Takesof Harbor Seals and Sea Lions
By Alaska Natives, 2006
Jan Feb Mar Apr May Jun Jul Aug Sep Oct Nov DecHarbor Seal 81.0 95.2 140.6 105.5 71.2 106.9 124.4 152.8 170.7 162.9 221.2 211.9Percentage 4.9% 5.8% 8.6% 6.4% 4.3% 6.5% 7.6% 9.3% 10.4% 9.9% 13.5% 12.9%Cum. Percent 4.9% 10.7% 19.3% 25.7% 30.0% 36.5% 44.1% 53.4% 63.8% 73.7% 87.1% 100%
Jan Feb Mar Apr May Jun Jul Aug Sep Oct Nov DecSea Lion 19.5 31.7 26.0 4.8 11.7 10.9 3.0 6.8 10.2 22.2 27.9 11.4Percentage 10.5% 17.1% 14.0% 2.6% 6.3% 5.8% 1.6% 3.6% 5.5% 12.0% 15.0% 6.1%Cum. Percent 10.5% 27.5% 41.5% 44.1% 50.3% 56.2% 57.8% 61.4% 66.9% 78.9% 93.9% 100%
0
50
100
150
200
250
Jan Feb Mar Apr May Jun Jul Aug Sep Oct Nov Dec
Estim
ated
Num
ber T
aken
Harbor Seal Sea Lion

24
Figure 5Mean Seasonally Adjusted Takes of Harbor Seals
by Alaska Natives, 1992-1996, 1997-2001, and 2002-2006
0
50
100
150
200
250
300
350
Jan Feb Mar Apr May Jun Jul Aug Sep Oct Nov Dec
Num
ber T
aken
1992-1996 1997-2001 2002-2006

Table 7Age and Sex Composition of Harbor Seal Harvests
By Alaska Natives, 2006
UnknownMale Female Sex Total
Adult 584.3 162.8 125.0 872.1Row Percent 67.0% 18.7% 14.3% 100.0%Column Percent 82.9% 75.8% 24.8% 61.3%
Juvenile 92.7 51.0 73.8 217.5Row Percent 42.6% 23.4% 33.9% 100.0%Column Percent 13.2% 23.7% 14.7% 15.3%
Pup 4.6 1.0 22.7 28.3Row Percent 16.3% 3.7% 80.0% 100.0%Column Percent 0.7% 0.5% 4.5% 2.0%
Unknown Age 23.1 0.0 282.0 305.1Row Percent 7.6% 0.0% 92.4% 100.0%Column Percent 3.3% 0.0% 56.0% 21.4%
Total 704.7 214.9 503.5 1,423.1Row Percent 49.5% 15.1% 35.4% 100.0%Column Percent 100.0% 100.0% 100.0% 100.0%
25

Table 8
Age and Sex Composition of Harbor Seal HarvestsBy Alaska Natives by Region, 2006
UpperNorth Kenai- South South North
Pacific Cook Kodiak Alaska Aleutian Pribilof Bristol BristolAGE AND SEX Southeast Rim Inlet Island Peninsula Islands Islands Bay Bay Alaska
Adult Male 307.7 68.6 3.3 132.7 19.4 37.2 0.0 13.1 2.3 584.3Adult Female 89.6 18.1 0.0 30.3 11.0 2.8 0.0 9.9 1.0 162.8
Adult Unknown Sex 29.0 24.5 23.5 33.6 3.2 1.8 0.0 7.3 2.1 125.0Juvenile Male 65.6 5.2 0.0 5.5 8.2 4.8 0.0 0.0 3.3 92.7
Juvenile Female 28.1 11.6 0.0 1.1 6.0 0.0 0.0 4.2 0.0 51.0Juvenile Unknown Sex 14.5 44.1 3.7 1.1 1.2 1.8 0.0 0.0 7.3 73.8
Pup Male 2.0 0.0 0.0 1.5 0.0 0.0 0.0 0.0 1.0 4.6Pup Female 0.0 0.0 0.0 0.0 0.0 0.0 0.0 0.0 1.0 1.0
Pup Unknown Sex 3.0 18.6 0.0 0.0 0.0 0.0 0.0 0.0 1.0 22.7Male Unknown Age 23.1 0.0 0.0 0.0 0.0 0.0 0.0 0.0 0.0 23.1
Female Unknown Age 0.0 0.0 0.0 0.0 0.0 0.0 0.0 0.0 0.0 0.0Unknown Age and Sex 30.0 220.3 7.0 4.4 3.6 6.0 0.0 10.8 0.0 282.0
TOTAL 592.7 411.1 37.6 210.3 52.5 54.4 0.0 45.4 19.1 1,423.1
AGE ONLYAdult 426.3 111.2 26.9 196.6 33.6 41.8 0.0 30.4 5.4 872.1
Juvenile 108.3 61.0 3.7 7.7 15.3 6.6 0.0 4.2 10.6 217.5Pup 5.0 18.6 0.0 1.5 0.0 0.0 0.0 0.0 3.1 28.3
Unknown Age 53.1 220.3 7.0 4.4 3.6 6.0 0.0 10.8 0.0 305.1TOTAL 592.7 411.1 37.6 210.3 52.5 54.4 0.0 45.4 19.1 1,423.1
SEX ONLYMale 398.4 73.8 3.3 139.7 27.6 42.0 0.0 13.1 6.7 704.7
Female 117.8 29.7 0.0 31.4 17.0 2.8 0.0 14.1 2.1 214.9Unknown Sex 76.5 307.6 34.2 39.1 8.0 9.6 0.0 18.1 10.4 503.5
TOTAL 592.7 411.1 37.6 210.3 52.5 54.4 0.0 45.4 19.1 1,423.1
26

Hunter Assessments of Harbor Seal Population Trends
During 2000 and 2004, surveyed households were asked to make subjective
assessments of harbor seal population trends in their hunting areas. Households were
asked, “Compared to 5 years ago, has the harbor seal population where members of
your household have hunted ‘increased,’ ‘remained stable,’ ‘declined,’ ‘do not know,’ or
‘not applicable (do not hunt)’?” It is useful to display these subjective assessments of
local population trends, comparing 2000 with 1995, and comparing 2004 with 1999 (see
Table 9). Responses of “do not know” or “not applicable (do not hunt)” are removed in
this analysis.
In almost all regions, a portion of households reported that local harbor seal
populations had “increased,” “remained stable,” or “declined.” Comparing 2004 with
1999, a majority of hunters reported "increased" seal populations in Kodiak Island
(52.9%), South Bristol Bay (54.2%), and Upper Kenai-Cook Inlet (57.1%). "Stable seal
populations" was the most common assessment in all other regions except for the
Aleutian Islands, where one-half of the hunters reported that populations "declined."
Notable shifts in hunter assessments of trends between the 2 comparison periods are
apparent for the North Pacific Rim (from 60.0% "declined" to 60.7% "stable"), Kodiak
Island (from 18.7% "increased" to 52.9% "increased"), Southeast (from 10.1% "declined"
to 28.5% "declined"), and South Alaska Peninsula (from 55.8% "declined" to 69.2%
"stable"). Overall, based on hunter assessments of recent trends, harbor seal
populations in most regions were primarily judged to be "stable" or "increased," except
for the Aleutian Islands, where seal populations were assessed as "stable" or "declined."
27

Table 9Local Harbor Seal Population Changes
Compared to Five Years Ago, Hunters' Assessments
Comparing 2000 with 1995
Region IncreasedRemained
Stable Declined
Southeast Alaska 43.6% 46.3% 10.1%
North Pacific Rim 5.7% 34.3% 60.0%
Kodiak Island 18.7% 48.0% 33.3%
South Alaska Peninsula 19.5% 24.7% 55.8%
Aleutian Islands 23.1% 38.5% 38.5%
South Bristol Bay 60.0% 37.5% 2.5%
North Bristol Bay** 2.6% 38.9% 58.5%
Comparing 2004 with 1999
Region IncreasedRemained
Stable Declined
Southeast Alaska 29.9% 41.6% 28.5%
North Pacific Rim 17.9% 60.7% 21.4%
Upper Kenai - Cook Inlet 57.1% 42.9% 0.0%
Kodiak Island 52.9% 37.3% 9.8%
South Alaska Peninsula 15.4% 69.2% 15.4%
Aleutian Islands 0.0% 50.0% 50.0%
South Bristol Bay 54.2% 41.7% 4.2%
North Bristol Bay** 12.5% 59.4% 28.1%
** May refer primarily to spotted seals in the mixed harbor seal-spotted seal population.
28

THE SUBSISTENCE TAKE OF SEA LIONS IN 2006
Estimated Size of the Sea Lion Take, 2006
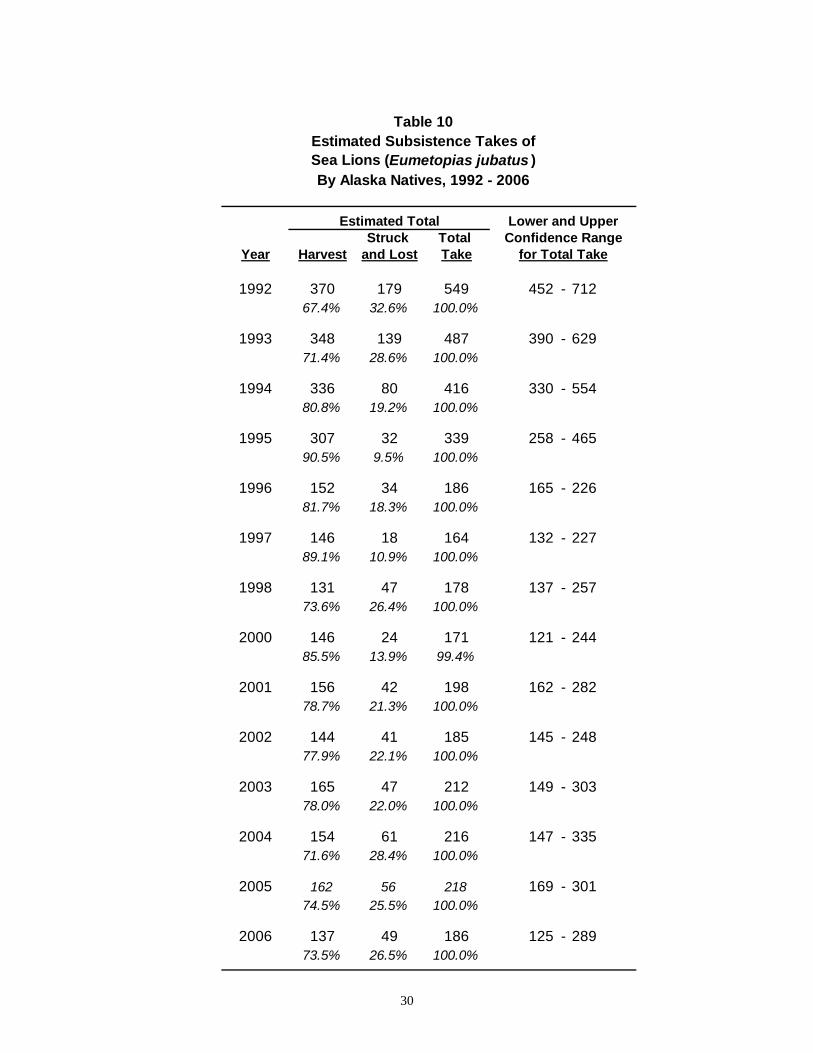
The estimated size of the total take of Steller sea lions by Alaska Natives in 2006
is presented in Tables 10 and 11. In 2006, there were an estimated 186 sea lions taken
by Alaska Natives for subsistence uses (with a 95% confidence range of between 125 to
289 animals) (Table 10). Of the 2006 subsistence take, 26.5% (49 sea lions) were
struck and lost, and 73.5% (137 sea lions) were harvested.
Geographic Distribution of Sea Lion Takes
Table 11 shows the regional distribution of sea lion takes in 2006 by Alaska
Natives. In 2006, the takes were split among 4 main regions: the Aleutian Islands (83
sea lions, or 44.5% of the total statewide take of sea lions), the Pribilof Islands (40 sea
lions, or 21.5%), the North Pacific Rim (25 sea lions, or 13.5%), and South Alaska
Peninsula (19 sea lions, or 10.0%). Other regions harvesting sea lions were the
Southeast region (13 sea lions, 6.7%) and Kodiak Island (7 sea lions, 3.8%) (Table 11).
The geographic distribution of sea lion takes by community is shown in Table 12.
In 2006, 15 of 62 surveyed communities reported taking sea lions. Eight communities
had takes of 5 or more sea lions in 2006. Seven more communities reported a take of
fewer than 5 sea lions each. The 6 top-ranking communities were Atka (66 sea lions),
St. Paul (26 sea lions), Tatitlek (24 sea lions), Unalaska (14 sea lions), St. George (14
sea lions), and King Cove (13 sea lions). These 6 communities accounted for 157 sea
lions, or 84.6% of the total Alaska take.
29
30
Table 10Estimated Subsistence Takes ofSea Lions (Eumetopias jubatus )By Alaska Natives, 1992 - 2006
Estimated Total Lower and UpperStruck Total Confidence Range
Year Harvest and Lost Take for Total Take
1992 370 179 549 452 - 71267.4% 32.6% 100.0%
1993 348 139 487 390 - 62971.4% 28.6% 100.0%
1994 336 80 416 330 - 55480.8% 19.2% 100.0%
1995 307 32 339 258 - 46590.5% 9.5% 100.0%
1996 152 34 186 165 - 22681.7% 18.3% 100.0%
1997 146 18 164 132 - 22789.1% 10.9% 100.0%
1998 131 47 178 137 - 25773.6% 26.4% 100.0%
2000 146 24 171 121 - 24485.5% 13.9% 99.4%
2001 156 42 198 162 - 28278.7% 21.3% 100.0%
2002 144 41 185 145 - 24877.9% 22.1% 100.0%
2003 165 47 212 149 - 30378.0% 22.0% 100.0%
2004 154 61 216 147 - 33571.6% 28.4% 100.0%
2005 162 56 218 169 - 30174.5% 25.5% 100.0%
2006 137 49 186 125 - 28973.5% 26.5% 100.0%
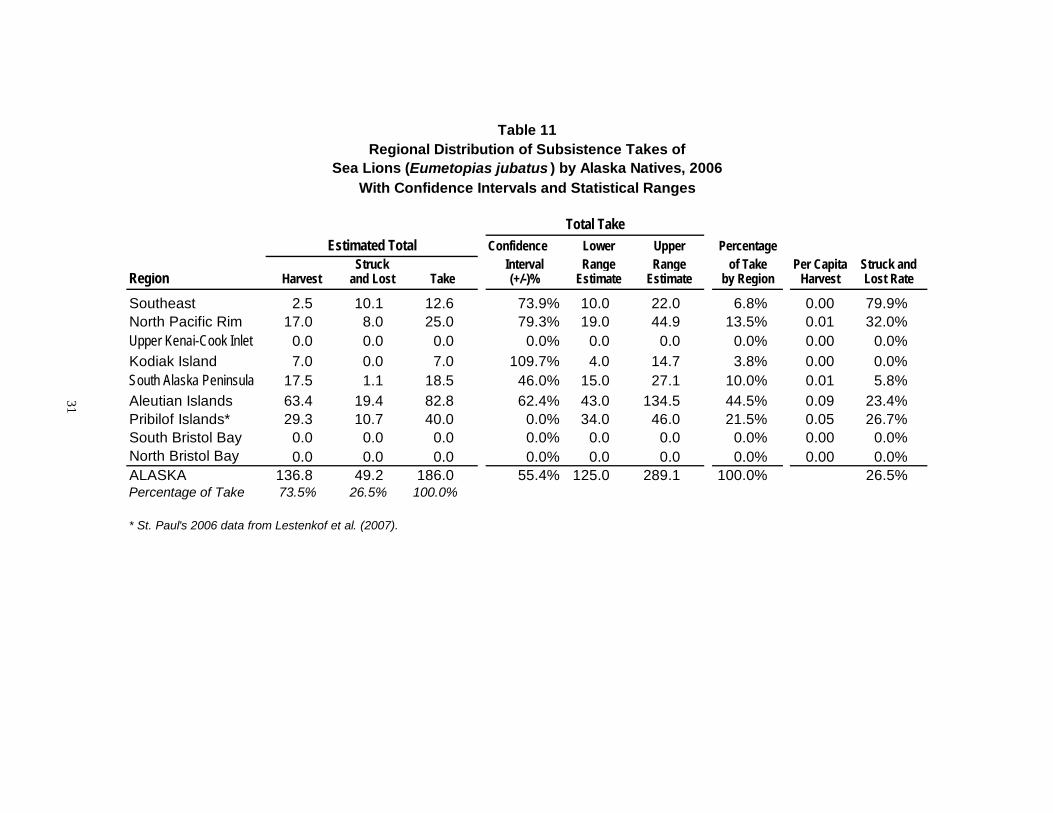
Table 11Regional Distribution of Subsistence Takes of
Sea Lions (Eumetopias jubatus ) by Alaska Natives, 2006With Confidence Intervals and Statistical Ranges
Total TakeEstimated Total Confidence Lower Upper Percentage
Struck Interval Range Range of Take Per Capita Struck andRegion Harvest and Lost Take (+/-)% Estimate Estimate by Region Harvest Lost Rate
Southeast 2.5 10.1 12.6 73.9% 10.0 22.0 6.8% 0.00 79.9% North Pacific Rim 17.0 8.0 25.0 79.3% 19.0 44.9 13.5% 0.01 32.0% Upper Kenai-Cook Inlet 0.0 0.0 0.0 0.0% 0.0 0.0 0.0% 0.00 0.0% Kodiak Island 7.0 0.0 7.0 109.7% 4.0 14.7 3.8% 0.00 0.0% South Alaska Peninsula 17.5 1.1 18.5 46.0% 15.0 27.1 10.0% 0.01 5.8% Aleutian Islands 63.4 19.4 82.8 62.4% 43.0 134.5 44.5% 0.09 23.4% Pribilof Islands* 29.3 10.7 40.0 0.0% 34.0 46.0 21.5% 0.05 26.7% South Bristol Bay 0.0 0.0 0.0 0.0% 0.0 0.0 0.0% 0.00 0.0% North Bristol Bay 0.0 0.0 0.0 0.0% 0.0 0.0 0.0% 0.00 0.0% ALASKA 136.8 49.2 186.0 55.4% 125.0 289.1 100.0% 26.5% Percentage of Take 73.5% 26.5% 100.0%
* St. Paul's 2006 data from Lestenkof et al. (2007).
31

32
Table 12Subsistence Sea Lion Harvest, Take, and Use by Alaska Natives, 2006
With Confidence Intervals and Statistical Ranges, by Community
Native Native Total TakeSea Lion Households Households Confidence Lower Upper Harvest Harvesting Using Struck Total Interval Range Range
Per Capita Sea Lion Sea Lion Harvest and Lost Take (+/- %) Estimate EstimateSOUTHEAST ALASKAAngoon .00 0.0% 0.0% 0.0 0.0 0.0 0.0% 0.0 0.0Craig .00 0.0% 0.0% 0.0 0.0 0.0 0.0% 0.0 0.0Haines .00 0.0% 0.0% 0.0 0.0 0.0 0.0% 0.0 0.0Hoonah .00 0.0% 0.0% 0.0 10.1 10.1 70.1% 8.0 17.2*Hydaburg .00 0.0% 0.0% 0.0 0.0 0.0 0.0% 0.0 0.0Juneau .00 6.3% 6.3% 1.4 0.0 1.38 102.4% 1.0 2.8Kake .00 0.0% 0.0% 0.0 0.0 0.0 0.0% 0.0 0.0Ketchikan .00 0.0% 0.0% 0.0 0.0 0.0 0.0% 0.0 0.0Klawock .00 4.0% 4.0% 1.2 0.0 1.16 72.8% 1.0 2.0*Klukwan .00 0.0% 0.0% 0.0 0.0 0.0 0.0% 0.0 0.0Pelican .00 0.0% 0.0% 0.0 0.0 0.0 0.0% 0.0 0.0Petersburg .00 0.0% 0.0% 0.0 0.0 0.0 0.0% 0.0 0.0Saxman .00 0.0% 0.0% 0.0 0.0 0.0 0.0% 0.0 0.0*Sitka .00 0.0% 0.0% 0.0 0.0 0.0 0.0% 0.0 0.0*Wrangell .00 0.0% 0.0% 0.0 0.0 0.0 0.0% 0.0 0.0Yakutat .00 0.0% 0.0% 0.0 0.0 0.0 0.0% 0.0 0.0NORTH PACIFIC RIMChenega Bay .00 0.0% 0.0% 0.0 0.0 0.0 0.0% 0.0 0.0Cordova .00 0.0% 0.0% 0.0 0.0 0.0 0.0% 0.0 0.0Nanwalek .01 2.6% 23.1% 1.0 0.0 1.0 31.0% 1.0 1.3Port Graham .00 0.0% 0.0% 0.0 0.0 0.0 0.0% 0.0 0.0Seldovia .00 0.0% 0.0% 0.0 0.0 0.0 0.0% 0.0 0.0*Seward .00 0.0% 0.0% 0.0 0.0 0.0 0.0% 0.0 0.0Tatitlek .18 13.3% 60.0% 16.0 8.0 24.0 81.4% 18.0 43.5*Valdez .00 0.0% 0.0% 0.0 0.0 0.0 0.0% 0.0 0.0UPPER KENAI-COOK INLET*Anchorage .00 0.0% 0.0% 0.0 0.0 0.0 0.0% 0.0 0.0*Homer .00 0.0% 0.0% 0.0 0.0 0.0 0.0% 0.0 0.0*Kenai .00 0.0% 0.0% 0.0 0.0 0.0 0.0% 0.0 0.0*Tyonek .00 0.0% 0.0% 0.0 0.0 0.0 0.0% 0.0 0.0KODIAK ISLANDAkhiok .03 13.3% 20.0% 2.3 0.0 2.3 45.8% 2.0 3.3*Karluk .00 0.0% 0.0% 0.0 0.0 0.0 0.0% 0.0 0.0*Kodiak City .00 0.0% 0.0% 0.0 0.0 0.0 0.0% 0.0 0.0Larsen Bay .00 0.0% 0.0% 0.0 0.0 0.0 0.0% 0.0 0.0Old Harbor .01 1.6% 30.2% 1.1 0.0 1.1 47.9% 1.0 1.6Ouzinkie .00 0.0% 0.0% 0.0 0.0 0.0 0.0% 0.0 0.0*Port Lions .02 33.3% 33.3% 3.7 0.0 3.7 167.1% 1.0 9.8SOUTH ALASKA PENINSULAChignik Bay .00 0.0% 0.0% 0.0 0.0 0.0 0.0% 0.0 0.0Chignik Lagoon .00 0.0% 0.0% 0.0 0.0 0.0 0.0% 0.0 0.0Chignik Lake .00 0.0% 0.0% 0.0 0.0 0.0 0.0% 0.0 0.0False Pass .00 0.0% 0.0% 0.0 0.0 0.0 0.0% 0.0 0.0Ivanof Bay .00 0.0% 0.0% 0.0 0.0 0.0 0.0% 0.0 0.0King Cove .03 84.6% 84.6% 11.8 1.1 12.9 7.8% 12.0 13.9Perryville .00 0.0% 0.0% 0.0 0.0 0.0 0.0% 0.0 0.0Sand Point .01 12.5% 12.5% 5.6 0.0 5.6 133.9% 3.0 13.2

33
Table 12 (Continued)Subsistence Sea Lion Harvest, Take, and Use by Alaska Natives, 2006
With Confidence Intervals and Statistical Ranges, by Community
Native Native Total TakeSea Lion Households Households Confidence Lower UpperHarvest Harvesting Using Struck Total Interval Range Range
Per Capita Sea Lion Sea Lion Harvest and Lost Take (+/- %) Estimate EstimateALEUTIAN ISLANDSAdak .00 0.0% 0.0% 0.0 0.0 0.0 0.0% 0.0 0.0Akutan .02 8.3% 54.2% 2.4 0.0 2.4 56.3% 2.0 3.8Atka .62 41.7% 100.0% 52.0 14.0 66.0 56.6% 33.0 103.3Nikolski .00 0.0% 0.0% 0.0 0.0 0.0 0.0% 0.0 0.0Unalaska .02 20.0% 20.0% 9.0 5.4 14.4 90.4% 8.0 27.4PRIBILOF ISLANDS*St. George .07 100.0% 100.0% 9.3 4.7 14.0 42.8% 8.0 20.0**St. Paul .04 N/A N/A 20.0 6.0 26.0 0.0 26.0 26.0SOUTH BRISTOL BAYEgegik .00 0.0% 0.0% 0.0 0.0 0.0 0.0% 0.0 0.0King Salmon .00 0.0% 0.0% 0.0 0.0 0.0 0.0% 0.0 0.0Levelock .00 0.0% 0.0% 0.0 0.0 0.0 0.0% 0.0 0.0Naknek .00 0.0% 0.0% 0.0 0.0 0.0 0.0% 0.0 0.0Pilot Point .00 0.0% 0.0% 0.0 0.0 0.0 0.0% 0.0 0.0Port Heiden .00 0.0% 0.0% 0.0 0.0 0.0 0.0% 0.0 0.0South Naknek .00 0.0% 0.0% 0.0 0.0 0.0 0.0% 0.0 0.0NORTH BRISTOL BAY*Aleknagik .00 0.0% 0.0% 0.0 0.0 0.0 0.0% 0.0 0.0Clark's Point .00 0.0% 0.0% 0.0 0.0 0.0 0.0% 0.0 0.0Dillingham .00 0.0% 0.0% 0.0 0.0 0.0 0.0% 0.0 0.0*Manokotak .00 0.0% 0.0% 0.0 0.0 0.0 0.0% 0.0 0.0Togiak .00 0.0% 0.0% 0.0 0.0 0.0 0.0% 0.0 0.0Twin Hills .00 0.0% 0.0% 0.0 0.0 0.0 0.0% 0.0 0.0
ALASKA TOTAL 136.8 49.2 186.0 55.4% 125.0 289.1
* Data not available for 2006. Data reported for the most recent year for which data are available.** St. Paul's 2006 data from Lestenkof et al. (2007).
Seasonal Distribution of Sea Lion Takes
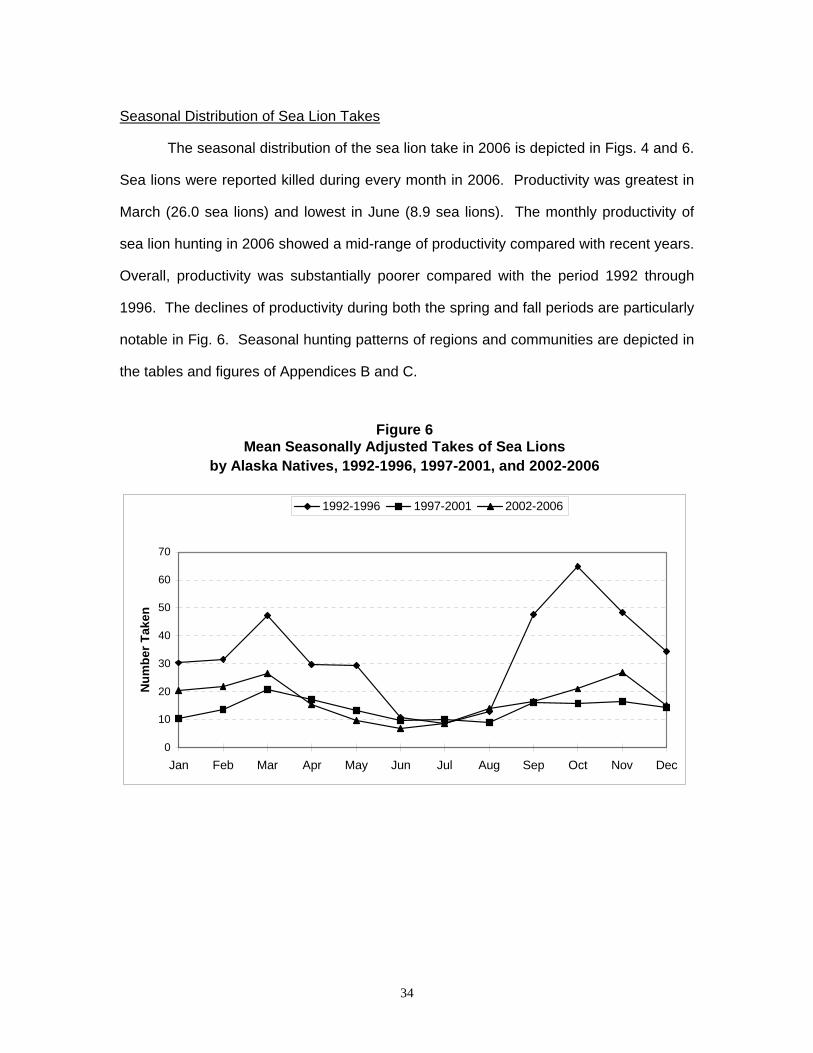
The seasonal distribution of the sea lion take in 2006 is depicted in Figs. 4 and 6.
Sea lions were reported killed during every month in 2006. Productivity was greatest in
March (26.0 sea lions) and lowest in June (8.9 sea lions). The monthly productivity of
sea lion hunting in 2006 showed a mid-range of productivity compared with recent years.
Overall, productivity was substantially poorer compared with the period 1992 through
1996. The declines of productivity during both the spring and fall periods are particularly
notable in Fig. 6. Seasonal hunting patterns of regions and communities are depicted in
the tables and figures of Appendices B and C.
Figure 6Mean Seasonally Adjusted Takes of Sea Lions
by Alaska Natives, 1992-1996, 1997-2001, and 2002-2006
0
10
20
30
40
50
60
70
Jan Feb Mar Apr May Jun Jul Aug Sep Oct Nov Dec
Num
ber T
aken
1992-1996 1997-2001 2002-2006
34
Age and Sex Composition of Sea Lion Harvests
The reported age and sex compositions of the 2006 sea lion harvests are shown
in Tables 13 and 14. Hunters reported harvesting male over female sea lions by a ratio
of about 5.2 to one (79.3 males to 15.3 females of animals with sex reported), above the
previous 5-year ratio of 2.7 to one (Fig. 26). In 2006, hunters reported taking more adult
sea lions (67.2 adults, 63.7% of the take with age reported) than juvenile sea lions (38.3
juveniles, 36.3%) and sea lion pups (0.0 pups, 0.0%). From 1992 to 1995, juvenile
harvests outnumbered adult harvests by at least 2 to one: 2.3 juveniles to one adult
(1992), 1.9 (1993), 2.2 (1994), and 2.0 (1995). Since 1996, the ratio of juveniles to
adults decreased substantially: 1.0 juvenile to one adult (1996), 1.4 (1997), 0.7 (1998),
1.0 (2000), and 0.9 (2001). Juvenile sea lion harvests were substantially less than adult
harvests for the first time in 2002 (0.5 to one), followed by ratios of 0.5 (2003), 0.7
(2004), 0.5 (2005), and 0.6 (2006). Adult females (13 animals) comprised about 14.0%
of the total harvest of sea lions of known age and sex in 2006. Hunters did not report
the sex for 30.8% of the harvest or the age for about 22.8% of the harvest. The age and
sex also are unknown for sea lions that were struck and lost by surveyed hunters.
35

Table 13Age and Sex Composition of Sea Lion Harvests
By Alaska Natives, 2006
UnknownMale Female Sex Total
Adult 46.7 13.3 7.4 67.3Row Percent 69.3% 19.7% 10.9% 100.0%Column Percent 58.8% 86.9% 17.4% 49.2%
Juvenile 32.7 2.0 3.7 38.3Row Percent 85.2% 5.2% 9.6% 100.0%Column Percent 41.2% 13.1% 8.7% 28.0%
Pup 0.0 0.0 0.0 0.0Row Percent 0.0% 0.0% 0.0% 0.0%Column Percent 0.0% 0.0% 0.0% 0.0%
Unknown Age 0.0 0.0 31.2 31.2Row Percent 0.0% 0.0% 100.0% 100.0%Column Percent 0.0% 0.0% 73.9% 22.8%
Total 79.3 15.3 42.2 136.8Row Percent 58.0% 11.2% 30.8% 100.0%Column Percent 100.0% 100.0% 100.0% 100.0%
36

Table 14Age and Sex Composition of Sea Lion Harvests
By Alaska Natives by Region, 2006
UpperNorth Kenai- South South North
Pacific Cook Kodiak Alaska Aleutian Pribilof Bristol BristolAGE AND SEX Southeast Rim Inlet Island Peninsula Islands Islands* Bay Bay Alaska
Adult Male 1.4 0.0 0.0 2.2 7.5 33.2 2.3 0.0 0.0 46.7Adult Female 0.0 1.0 0.0 1.1 4.3 6.8 0.0 0.0 0.0 13.3
Adult Unknown Sex 0.0 0.0 0.0 0.0 3.8 3.6 0.0 0.0 0.0 7.4Juvenile Male 0.0 0.0 0.0 3.7 0.0 4.0 25.0 0.0 0.0 32.7
Juvenile Female 0.0 0.0 0.0 0.0 0.0 0.0 2.0 0.0 0.0 2.0Juvenile Unknown Sex 0.0 0.0 0.0 0.0 1.9 1.8 0.0 0.0 0.0 3.7
Pup Male 0.0 0.0 0.0 0.0 0.0 0.0 0.0 0.0 0.0 0.0Pup Female 0.0 0.0 0.0 0.0 0.0 0.0 0.0 0.0 0.0 0.0
Pup Unknown Sex 0.0 0.0 0.0 0.0 0.0 0.0 0.0 0.0 0.0 0.0Male Unknown Age 0.0 0.0 0.0 0.0 0.0 0.0 0.0 0.0 0.0 0.0
Female Unknown Age 0.0 0.0 0.0 0.0 0.0 0.0 0.0 0.0 0.0 0.0Unknown Age and Sex 1.2 16.0 0.0 0.0 0.0 14.0 0.0 0.0 0.0 31.2
TOTAL 2.5 17.0 0.0 7.0 17.5 63.4 29.3 0.0 0.0 136.8
AGE ONLYAdult 1.4 1.0 0.0 3.3 15.6 43.6 2.3 0.0 0.0 67.3
Juvenile 0.0 0.0 0.0 3.7 1.9 5.8 27.0 0.0 0.0 38.3Pup 0.0 0.0 0.0 0.0 0.0 0.0 0.0 0.0 0.0 0.0
Unknown Age 1.2 16.0 0.0 0.0 0.0 14.0 0.0 0.0 0.0 31.2TOTAL 2.5 17.0 0.0 7.0 17.5 63.4 29.3 0.0 0.0 136.8
SEX ONLYMale 1.4 0.0 0.0 5.9 7.5 37.2 27.3 0.0 0.0 79.3
Female 0.0 1.0 0.0 1.1 4.3 6.8 2.0 0.0 0.0 15.3Unknown Sex 1.2 16.0 0.0 0.0 5.6 19.4 0.0 0.0 0.0 42.2
TOTAL 2.5 17.0 0.0 7.0 17.5 63.4 29.3 0.0 0.0 136.8
37

Hunter Assessments of Sea Lion Population Trends
During 2000 and 2004, surveyed households were asked to make subjective
assessments of sea lion population trends in their hunting areas. Households were
asked, “compared to 5 years ago, has the sea lion population where members of your
household have hunted ‘increased,’ ‘remained stable,’ ‘declined,’ ‘do not know,’ or ‘not
applicable (do not hunt)’?” It is useful to show these subjective assessments of
population trends, comparing 2000 with 1995, and comparing 2004 with 1999 (see Table
15). Responses of “do not know” or "not applicable (do not hunt)” are removed in this
analysis.
Comparing 2000 with 1995, a majority of households in all regions reported that
local sea lion populations had “declined” in household hunting areas. These subjective
assessments of population trends had substantially changed by 2004 in 3 regions.
Comparing 2004 with 1999, a majority of hunters judged sea lions populations to be
"increased" or "stable" in the Southeast, North Pacific Rim, and Kodiak Island regions.
In these 3 regions, 16.7% or less of hunters reported sea lion populations had "declined"
comparing 2004 with 1999. By contrast, in the South Alaska Peninsula, 66.7% of
hunters reported sea lion populations had "declined" comparing 2004 with 1999, similar
to the assessment comparing 2000 with 1995 (63.6% of hunters reported "declined"). In
the Aleutian Islands, one-half of surveyed hunters assessed that sea lion populations
had "declined" comparing 2004 with 1999, while one-half assessed populations as
"stable."
38
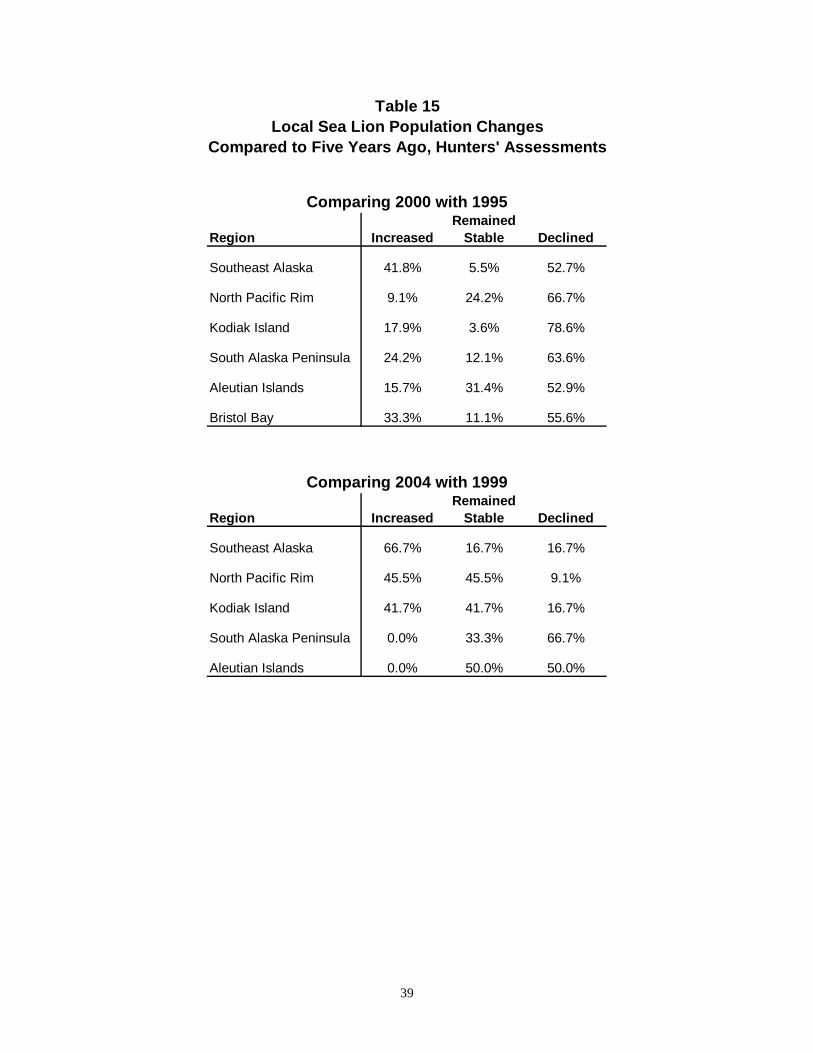
Table 15Local Sea Lion Population Changes
Compared to Five Years Ago, Hunters' Assessments
Comparing 2000 with 1995
Region IncreasedRemained
Stable Declined
Southeast Alaska 41.8% 5.5% 52.7%
North Pacific Rim 9.1% 24.2% 66.7%
Kodiak Island 17.9% 3.6% 78.6%
South Alaska Peninsula 24.2% 12.1% 63.6%
Aleutian Islands 15.7% 31.4% 52.9%
Bristol Bay 33.3% 11.1% 55.6%
Comparing 2004 with 1999
Region IncreasedRemained
Stable Declined
Southeast Alaska 66.7% 16.7% 16.7%
North Pacific Rim 45.5% 45.5% 9.1%
Kodiak Island 41.7% 41.7% 16.7%
South Alaska Peninsula 0.0% 33.3% 66.7%
Aleutian Islands 0.0% 50.0% 50.0%
39

HUNTING PARTICIPATION AND EFFORT
In the calendar year 2006, about 540 households hunted harbor seals and 57
households hunted sea lions (Table 16). Since 1992, there has been a substantial
decline in the numbers of hunters for harbor seals and for sea lions (Fig. 8). Based on
survey findings, the estimated numbers of households that reported at least one member
hunting harbor seals were 1,014 (1992), 854 (1993), 971 (1994), 805 (1995), 859
(1996), 738 (1997), 707 (1998), 745 (2000), 575 (2001), 600 (2002), 564 (2003), 535
(2004), and 517 (2005). The estimated number of households (excluding St. Paul) that
reported at least one member hunting sea lions was 135 (1992), 147 (1993), 154 (1994),
123 (1995), 95 (1996), 75 (1997), 76 (1998), 86 (2000), 98 (2001), 90 (2002), 97 (2003),
68 (2004), and 68 (2005).
The percentage of hunting households that reported hunting unsuccessfully for
harbor seals in 2006 was 14% , compared with 29% (1992), 25% (1993), 37% (1994),
26% (1995), 28% (1996), 20% (1997), 14% (1998), 17% (2000), 14% (2001), 17%
(2002), 20% (2003), 15% (2004), and 12% (2005). Therefore, seal hunter success rates
have slightly improved while the absolute number of hunters has fallen. The percentage
of unsuccessful hunting households for sea lions (excluding St. Paul) was 11% in 2006,
compared with 33% (1992), 41% (1993), 46% (1994), 26% (1995), 28% (1996), 18%
(1997), 28% (1998), 19% (2000), 20% (2001), 22% (2002 to 2004), and 18% (2005).
In the 2000 survey cycle, surveyed households were asked to make a subjective
assessment of their hunting effort in 2000 compared with 5 years before. Households
were asked, “compared to 5 years ago, does harbor seal hunting now take your
household ‘more time and effort,’ ‘about the same time and effort,’ ‘less time and effort,’
40

Table 16Alaska Native Households Hunting or Harvesting
Harbor Seals or Sea Lions, 1992 - 2006
HARBOR SEALS SEA LIONS *
YearHouseholds
HuntingHouseholds Harvesting
Success Rate
Households Hunting
Households Harvesting
Success Rate
1992 1,014 724 71% 135 91 67%1993 854 638 75% 147 86 59%1994 971 608 63% 154 84 54%1995 805 597 74% 123 92 74%1996 859 619 72% 95 68 72%1997 738 588 80% 75 62 82%1998 707 607 86% 76 54 72%2000 745 620 83% 86 70 81%2001 575 491 85% 98 78 80%2002 600 495 83% 90 70 78%2003 564 453 80% 97 76 78%2004 535 457 85% 98 76 78%2005 517 454 88% 68 56 82%2006 540 464 86% 57 51 89%
* Excludes St. Paul
41
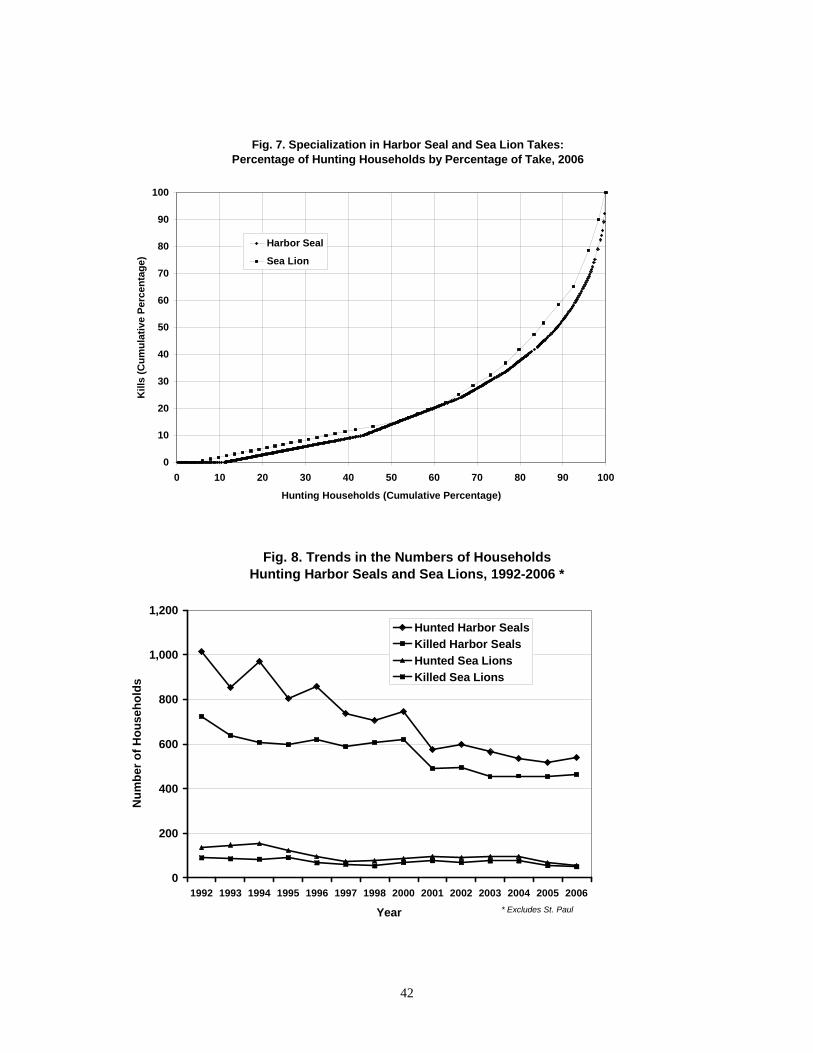
42
Fig. 7. Specialization in Harbor Seal and Sea Lion Takes:Percentage of Hunting Households by Percentage of Take, 2006
0
10
20
30
40
50
60
70
80
90
100
0 10 20 30 40 50 60 70 80 90 100
Hunting Households (Cumulative Percentage)
Kill
s (C
umul
ativ
e Pe
rcen
tage
)
Harbor Seal
Sea Lion
Fig. 8. Trends in the Numbers of HouseholdsHunting Harbor Seals and Sea Lions, 1992-2006 *
0
200
400
600
800
1,000
1,200
1992 1993 1994 1995 1996 1997 1998 2000 2001 2002 2003 2004 2005 2006
Year
Num
ber o
f Hou
seho
lds
Hunted Harbor SealsKilled Harbor SealsHunted Sea LionsKilled Sea Lions
* Excludes St. Paul
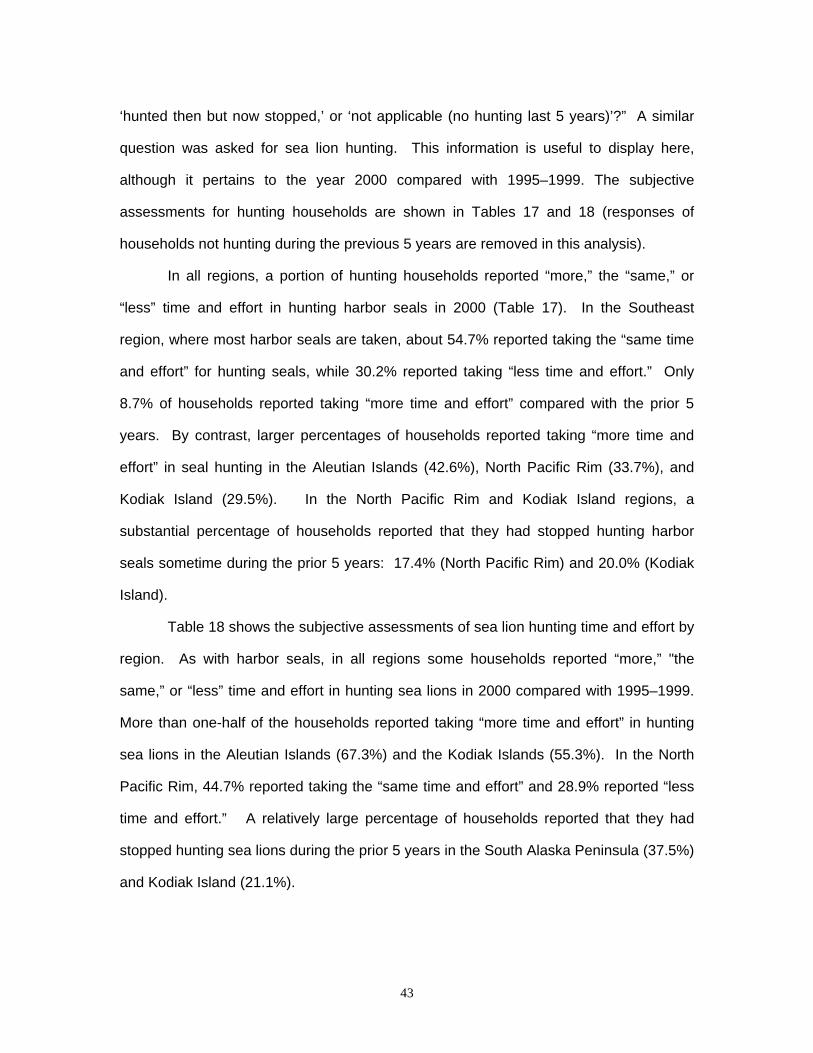
‘hunted then but now stopped,’ or ‘not applicable (no hunting last 5 years)’?” A similar
question was asked for sea lion hunting. This information is useful to display here,
although it pertains to the year 2000 compared with 1995–1999. The subjective
assessments for hunting households are shown in Tables 17 and 18 (responses of
households not hunting during the previous 5 years are removed in this analysis).
In all regions, a portion of hunting households reported “more,” the “same,” or
“less” time and effort in hunting harbor seals in 2000 (Table 17). In the Southeast
region, where most harbor seals are taken, about 54.7% reported taking the “same time
and effort” for hunting seals, while 30.2% reported taking “less time and effort.” Only
8.7% of households reported taking “more time and effort” compared with the prior 5
years. By contrast, larger percentages of households reported taking “more time and
effort” in seal hunting in the Aleutian Islands (42.6%), North Pacific Rim (33.7%), and
Kodiak Island (29.5%). In the North Pacific Rim and Kodiak Island regions, a
substantial percentage of households reported that they had stopped hunting harbor
seals sometime during the prior 5 years: 17.4% (North Pacific Rim) and 20.0% (Kodiak
Island).
Table 18 shows the subjective assessments of sea lion hunting time and effort by
region. As with harbor seals, in all regions some households reported “more,” "the
same,” or “less” time and effort in hunting sea lions in 2000 compared with 1995–1999.
More than one-half of the households reported taking “more time and effort” in hunting
sea lions in the Aleutian Islands (67.3%) and the Kodiak Islands (55.3%). In the North
Pacific Rim, 44.7% reported taking the “same time and effort” and 28.9% reported “less
time and effort.” A relatively large percentage of households reported that they had
stopped hunting sea lions during the prior 5 years in the South Alaska Peninsula (37.5%)
and Kodiak Island (21.1%).
43

44
RegionMore Time and Effort
Same Time and Effort
Less Time and Effort
Hunted Then but Have Stopped
Southeast Alaska 8.7% 54.7% 30.2% 6.4%
North Pacific Rim 33.7% 34.9% 14.0% 17.4%
Kodiak Island 29.5% 38.9% 11.6% 20.0%
South Alaska Peninsula 23.0% 31.1% 41.9% 4.1%
Aleutian Islands 42.6% 34.0% 23.4% 0.0%
South Bristol Bay 15.9% 52.3% 22.7% 9.1%
North Bristol Bay* 41.3% 37.7% 11.1% 9.8%* May refer primarily to spotted seals in North Bristol Bay's mixed harbor seal-spotted seal population.
RegionMore Time and Effort
Same Time and Effort
Less Time and Effort
Hunted Then but Have Stopped
North Pacific Rim 18.4% 44.7% 28.9% 7.9%
Kodiak Island 55.3% 21.1% 2.6% 21.1%
South Alaska Peninsula 12.5% 12.5% 37.5% 37.5%
Aleutian Islands 67.3% 21.2% 5.8% 5.8%
Time and Effort Spent Hunting Sea Lion in 2000Compared with Five Years Ago, Hunters' Assessments
Table 17Time and Effort Spent Hunting Harbor Seal in 2000
Compared with Five Years Ago, Hunters' Assessments
Table 18

Hunting harbor seals or sea lions is a relatively specialized subsistence activity in
Alaska communities. The large majority of Native households in the study's sampling
universe did not attempt to hunt harbor seals or sea lions. In 2006, 67% of surveyed
households did not hunt harbor seals and 97% did not hunt sea lions. Among hunters,
there also was substantial specialization in productivity (see Fig. 7). A relatively small
core of highly-productive hunters reported taking most of the subsistence kills during
2006, similar to previous years. About 30% of the hunters reported taking about 72%–
73% of all harbor seals and sea lions (Fig. 7). Highly-productive hunters commonly
distributed marine mammal products to other households through non-commercial
networks of sharing and trade.
DISCUSSION
Trends in the subsistence takes of harbor seals and sea lions have differed from
each other since 1992. At the statewide level, subsistence takes of harbor seals have
been declining since about 1995, while subsistence takes of sea lions have leveled off
after declining substantially during the early 1990s. The following section discusses
trends in more detail for each species, examining total take, age of harvest, and sex of
harvest broken out by region.
Harbor Seal Subsistence Trends, 1992-2006
At the statewide level, subsistence takes of harbor seals have been declining
since about 1995 (when 2,742 seals were taken) to a low in 2006 (1,644 seals), the
lowest take since surveys began in 1992 (Table 4, Fig. 9). Comparing consecutive
paired survey years since 1992, harbor seal takes have declined in 9 of the years,
increased in 3 of the years, and remained unchanged in one year (Fig. 24). This
indicates a declining trend in the annual subsistence takes of harbor seals in Alaska.
45

The total take of harbor seals in 2006 (1,644 seals) was 42.4% lower than takes in 1992
(2,854 seals) and 3.0% lower than takes in 2005 (1,696 seals) (Fig. 24). In terms of
seasons, the decreasing takes of harbor seals have been occurring across all the major
hunting periods (spring and fall-early winter) (see Fig. 5).
Harbor seal populations in Alaska are divided into 3 stocks for biological
assessment: the Southeast Alaska stock, the Gulf of Alaska stock, and the Bering Sea
stock. Harbor seal takes from the 3 stocks are shown in Fig. 11. Total annual takes
from the Southeast Alaska stock showed an overall decline of 57.5% from 1992 to 2006
(from 1,666 to 708 seals). Takes from the Gulf of Alaska stock in 2006 (848 seals) was
about 10.3% lower than the take in 1992 (946 seals), rebounding from a low of 688 seals
taken in 2002. Takes from the Bering Sea stock have declined from 243 seals in 1992
to 88 seals in 2006, a decrease of about 63.5%. Regional takes are shown in Fig. 12.
Annual harbor seal takes show the clearest downward trend in Southeast Alaska. While
harbor seal takes in the other regions also appear to be in a downward direction, the
trends are less clear than for the Southeast region.
The reasons for declining harbor seal takes are uncertain. Overall, it appears
that the decline in harbor seal harvests is associated with fewer seal hunters on a
statewide basis (Fig. 8, Table 16). Between-year fluctuations in harvests at the
community level are influenced in part by such local conditions as food needs, prey
availability, and personal circumstances of hunters. A closer examination of trends in 6
selected communities (Hoonah, Nanwalek, Old Harbor, Sitka, Tatitlek, and Yakutat)
allows for us to see the interplay of factors such as the numbers of hunters, hunting
success, and harvest rates in particular locations (Figs. 14-19). For example, at Hoonah
and Yakutat, 2 major harbor seal hunting communities (Figs. 14 and 15), there have
been fewer hunters and lower harvest rates per successful hunter in recent years,
resulting in declining numbers of seals harvested. At Sitka (Fig. 16) we found fewer
harbor seal hunters, but relatively stable harvest rates per successful hunter in recent
46

47
years, except for success rates in 2005. As shown in Fig. 17, seal hunting at Tatitlek
rebounded after 2002, which saw the lowest numbers of hunters, harvest rates, and seal
harvests since the start of surveys in 1992. At Old Harbor, harvests and hunters in 2006
were at their lowest points since 1992 (Fig. 19). No clear trends are evident in the
harvests, hunters, and harvest rates at Nanwalek (Fig. 18). These 6 case communities
suggest that a complex of local factors is influencing harvest patterns at the local level.
Figure 9.Estimated Subsistence Takes of Harbor Seals
by Alaska Natives, 1992 - 2006
2501
353
2854
2365
371
2736
308
2498
243
2742
327
351
2546
2286
310
2597
1797
234
2031
1585
249
1834
1812
219
2030
1566
256
1822
1470
226
1696
1423
221
1644
2313
2621 27
41
2415
2195
2224
250
1975
0
500
1,000
1,500
2,000
2,500
3,000
3,500
Harvest Struck and Lost
Total Take
Num
ber o
f Sea
ls
19921993199419951996199719982000200120022003200420052006

48
Figure 10.Estimated Subsistence Takes of Sea Lions
by Alaska Natives, 1992 - 2006
370
179
549
348
139
487
336
80
416
307
32
339
152
34
186
146
18
164
131
47
178
146
24
171
156
42
198
144
41
185
165
47
212
154
61
216
162
56
218
137
49
186
0
100
200
300
400
500
600
700
Harvest Struck and Lost
Total Take
Num
ber o
f Sea
Lio
ns19921993199419951996199719982000200120022003200420052006
Southeast Alaska Stock Gulf of Alaska Stock Bering Sea Stock
Harvest Struck and Lost Take Harvest Struck and
Lost Take Harvest Struck and Lost Take
1992 1,477 189 1,666 865 81 946 160 83 2431993 1,425 190 1,615 818 103 921 122 78 2001994 1,348 151 1,500 819 94 913 145 63 2081995 1,719 171 1,890 683 42 724 97 31 1271996 1,642 216 1,858 680 56 736 93 54 1481997 1,343 224 1,567 725 58 784 127 68 1951998 1,414 202 1,616 772 70 842 100 38 1382000 1,210 151 1,361 699 80 779 66 19 852001 1,020 156 1,176 716 56 772 62 22 842002 877 130 1,007 613 75 688 95 44 1402003 945 124 1,069 801 78 879 65 17 822004 743 102 845 747 110 858 76 43 1192005 546 89 634 861 97 958 64 40 1042006 593 115 708 766 82 848 65 24 88
Figure 11. Harbor Seal Take Trendsby Harbor Seal Stock, 1992 - 2006
0
200
400
600
800
1,000
1,200
1,400
1,600
1,800
2,000
92 94 96 98 01 03 05 93 95 97 00 02 04 06 92 94 96 98 01 03 05
Num
ber o
f Har
bor S
eals Struck and Lost
Harvest
Southeast Stock Gulf of Alaska Stock Bering Sea Stock

49
Figure 12. Harbor Seal Take Trends Reported byAlaska Native Hunters by Major Area, 1992 - 2006
0
200
400
600
800
1,000
1,200
1,400
1,600
1,800
2,000
92 94 96 98 01 03 05 93 95 97 00 02 04 06 92 94 96 98 01 03 05 93 95 97 00 02 04 06 92 94 96 98 01 03 05 93 95 97 00 02 04 06
Num
ber o
f Har
bor S
eals
.
Struck and Lost
Harvest
Aleutian IslandsSoutheast N Pacific Rim Kodiak Islands Bristol BayS AK Peninsula
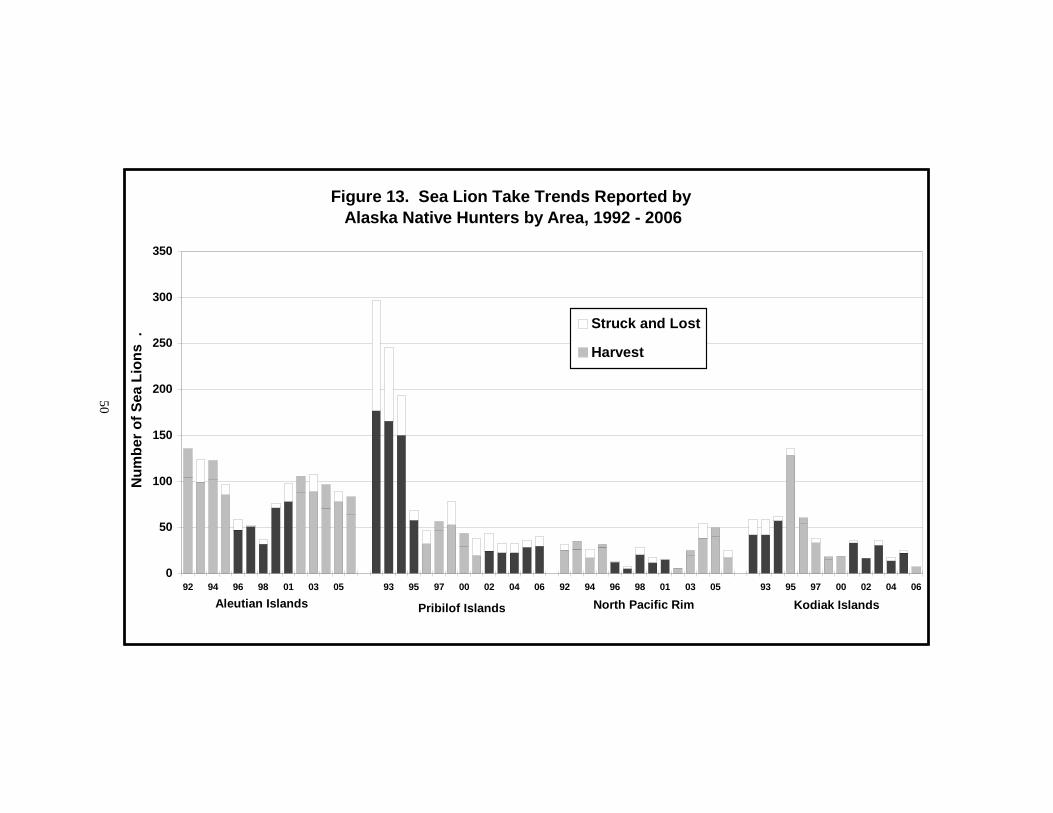
Figure 13. Sea Lion Take Trends Reported by Alaska Native Hunters by Area, 1992 - 2006
0
50
100
150
200
250
300
350
92 94 96 98 01 03 05 93 95 97 00 02 04 06 92 94 96 98 01 03 05 93 95 97 00 02 04 06
Num
ber o
f Sea
Lio
ns .
Struck and Lost
Harvest
Aleutian Islands Pribilof Islands North Pacific Rim Kodiak Islands
50

Fig. 14. Harbor Seal Hunters and Success Rates,Hoonah, 1992 - 2006
49
59 57
39 40
27 29 30
33
23 21 22 23
14
44
55
42
37 36
27 29 30 31
23
12
20 18
13
8.0
5.9
5.7
6.3 9.
9
5.3
5.9
5.0
4.6
4.2
4.5 5.4
2.9 4.4
0
10
20
30
40
50
60
70
1992
1993
1994
1995
1996
1997
1998
2000
2001
2002
2003
2004
2005
2006
Num
ber
Number ofHouseholds HuntingHarbor Seals
Number ofHouseholdsHarvesting HarborSealsMean Number ofHarbor SealsHarvested perSuccessful Household
Fig. 15. Harbor Seal Hunters and Success Rates,Yakutat, 1992 - 2006
36
39 39 39 40
54
41 40
36
30
42
27 25 27
24
36 37 36
40
50
40
38
35
27
34
22 22
26
10.2 15
.6
11.1 17
.0
15.9
9.9
7.2
5.1 6.0
4.0 7.
4
6.7
6.4
5.3
0
10
20
30
40
50
60
1992
1993
1994
1995
1996
1997
1998
2000
2001
2002
2003
2004
2005
2006
Num
ber
Number of HouseholdsHunting Harbor Seals
Number of HouseholdsHarvesting Harbor Seals
Mean Number of HarborSeals Harvested perSuccessful Household
51

Fig. 17. Harbor Seal Hunters and Success Rates,Tatitlek, 1992 - 2006
14
12 13
7
11 12
11
8
6
4
12
11 12
9
11
9 9
5
10
12
11
8
6
4
12
10 10
9
13.4
11.9
16.5
8.7 9.0
7.9
15.6
6.0
9.7
3.5
7.4 9.
0
13.3
23.4
0
5
10
15
20
25
1992
1993
1994
1995
1996
1997
1998
2000
2001
2002
2003
2004
2005
2006
Num
ber
Number of HouseholdsHunting Harbor Seals
Number of HouseholdsHarvesting Harbor Seals
Mean Number of HarborSeals Harvested perSuccessful Household
Fig. 16. Harbor Seal Hunters and Success Rates,Sitka, 1992 - 2006
38
67
63 63
70
50
37
31
36
13
3634
48
54
38
60
53
59
68
50
36
29
35
12
35
3.7
2.3
2.1
2.5
2.1
2.8 4.0
4.1
4.8
4.8 7.
7
4.1
2.0 4.1
0
10
20
30
40
50
60
70
80
1992
1993
1994
1995
1996
1997
1998
2000
2001
2002
2003
2004
2005
2006
Num
ber
Number of HouseholdsHunting Harbor Seals
Number of HouseholdsHarvesting HarborSeals
Mean Number ofHarbor SealsHarvested perSuccessful Household
52

Fig. 18. Harbor Seal Hunters and Success Rates,
Nanwalek, 1992 - 2006
10
14
10
13
9 9
7
10
7
9
10 10
6
12
8
11
8
10
5 5
7
10
7 8
9
7
5
6
3.7
3.1 3.6
2.3
4.2
3.8 4.3 5.
1 5.7
5.0
3.3 4.
1
3.8
3.8
0
2
4
6
8
10
12
14
16
1992
1993
1994
1995
1996
1997
1998
2000
2001
2002
2003
2004
2005
2006
Num
ber
Number of HouseholdsHunting Harbor Seals
Number of HouseholdsHarvesting Harbor Seals
Mean Number of HarborSeals Harvested perSuccessful Household
Fig. 19. Harbor Seal Hunters and Success Rates,Old Harbor, 1992 - 2006
26
36 37
43
40
32
34
25 24
21 22
18
15
12
21
33
28
39
32
30
23
18
24
21 22
17 15
12
4.2
2.1 3.0
2.9 3.5
2.7
2.4 3.2
3.0
1.9 3.1
2.3
2.5
1.7
05
1015202530354045
1992
1993
1994
1995
1996
1997
1998
2000
2001
2002
2003
2004
2005
2006
Num
ber
Number of HouseholdsHunting Harbor Seals
Number of HouseholdsHarvesting Harbor Seals
Mean Number of HarborSeals Harvested perSuccessful Household
53

For harvests in 2 regions, the North Pacific Rim and Kodiak Island, a longer time
series is available, shown as Figures 20 and 22 (struck and lost numbers are not
available prior to 1992, so these figures compare only harvest numbers). In the North
Pacific Rim, subsistence harvests of harbor seals have been substantially lower during
the most recent 10-year survey period compared with harvests recorded prior to 1989,
the year of the Exxon Valdez oil spill (Fig. 20). Families in Prince William Sound
reduced their subsistence activities the year of the spill because of the uncertainties of
the health and safety of consuming wild foods harvested from oiled areas. Subsistence
harvest levels showed signs of some recovery since the spill, particularly in Nanwalek
and Port Graham along Lower Cook Inlet. The 2006 survey at Tatitlek (219 seals) in
Prince William Sound recorded a rebound from 2002, the poorest seal harvest on record
in this community (13 seals). The other 3 communities had mid-range seal harvests in
2006. For Kodiak Island villages, the 199 seals harvested in 2006 were substantially
fewer than those recorded a decade before (478 seals in 1982) (Fig. 22). In this area,
harbor seal harvests appear to have been in decline during the 1980s, followed by
increases again during the 1990s at Old Harbor and Ouzinkie. In other Kodiak Island
communities, harvests have remained low and variable during the 1990s.
The longer time series represented by the North Pacific Rim and Kodiak Island
areas provide a cautionary note about interpreting trends in subsistence patterns
described since 1992, the start of the most recent survey series. Reported harbor seal
harvests were substantially higher a decade earlier in the North Pacific Rim and Kodiak
Island areas. The pattern of use documented for 1992–2006 in those areas may
represent observations at relatively low points of longer-term harvest cycles. The longer
time series above may better represent the potential ranges of subsistence takes in
these areas. Should resource population conditions return to those during the 1980s,
subsistence harvests of harbor seals might increase as well.
54
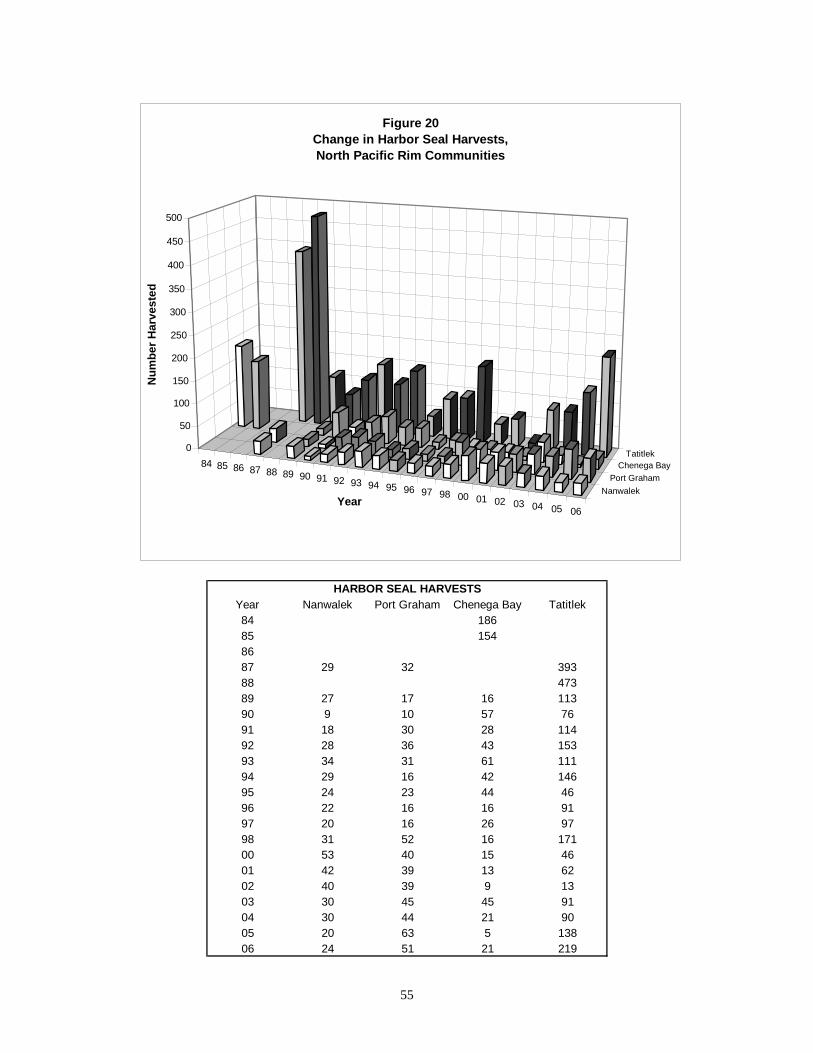
55
HARBOR SEAL HARVESTSYear Nanwalek Port Graham Chenega Bay Tatitlek84 18685 1548687 29 32 39388 47389 27 17 16 11390 9 10 57 7691 18 30 28 11492 28 36 43 15393 34 31 61 11194 29 16 42 14695 24 23 44 4696 22 16 16 9197 20 16 26 9798 31 52 16 17100 53 40 15 4601 42 39 13 6202 40 39 9 1303 30 45 45 9104 30 44 21 9005 20 63 5 13806 24 51 21 219
84 85 86 87 88 89 90 91 92 93 94 95 96 97 98 00 01 02 03 04 05 06
NanwalekPort Graham
Chenega BayTatitlek0
50
100
150
200
250
300
350
400
450
500
Num
ber H
arve
sted
Year
Figure 20Change in Harbor Seal Harvests,North Pacific Rim Communities

SEA LION HARVESTSYear Nanwalek Port Graham Chenega Bay Tatitlek84 1585 278687 8 2 2188 2789 2 3 2 1890 2 0 1 291 0 4 6 992 6 4 7 893 9 1 11 494 1 0 7 995 9 10 7 396 4 1 2 597 0 0 0 398 2 1 0 1500 6 2 0 201 4 0 1 602 2 0 0 003 3 1 0 1204 2 7 0 2605 1 0 0 3906 1 0 0 16
84 85 86 87 88 89 90 91 92 93 94 95 96 97 98 00 01 02 03 04 05 06
NanwalekPort Graham
Chenega BayTatitlek0
5
10
15
20
25
30
35
40
Num
ber H
arve
sted
Year
Figure 21Change in Sea Lion Harvests,
North Pacific Rim Communities
56

HARBOR SEAL HARVESTSPort Lions Karluk Akhiok Larsen Bay Ouzinkie Old Harbor
82 13 66 89 56 96 15886 28 24 6 10 67 12789 2 7 13 26 34 4590 8 27 2691 1 17 24 4692 37 17 20 7 22 8793 26 10 13 8 41 6894 8 8 15 13 33 8495 2 28 5 11 56 11296 4 15 12 15 17 11497 5 19 8 10 55 8098 6 11 7 2 82 5500 6 20 18 19 43 5901 9 8 7 9 33 7102 13 8 6 3 63 4003 13 4 5 3 49 6704 21 3 4 13 73 3805 77 19 7 17 137 3806 77 19 14 20 49 20
82 86 89 90 91 92 93 94 95 96 97 98 00 01 02 03 04 05 06
Port LionsKarluk
AkhiokLarsen Bay
OuzinkieOld Harbor
0
20
40
60
80
100
120
140
160
Num
ber H
arve
sted
Year
Figure 22Change in Harbor Seal Harvests,
Kodiak Island Communities
57

SEA LION HARVESTSPort Lions Karluk Akhiok Larsen Bay Ouzinkie Old Harbor
82 8 27 54 36 11 9686 3 7 6 0 13 17389 0 0 9 6 0 2290 0 9 391 0 1 0 1792 1 0 3 1 3 3393 4 0 0 0 5 3294 0 0 3 2 4 4695 0 0 1 2 16 10796 0 0 6 0 0 4597 1 0 7 0 0 2398 1 0 3 0 0 1000 0 0 3 0 0 1301 0 0 1 0 3 2602 0 0 0 0 5 903 0 0 3 0 0 2804 1 0 1 0 3 805 4 0 0 0 0 1806 4 0 2 0 0 1
82 86 89 90 91 92 93 94 95 96 97 98 00 01 02 03 04 05 06
Port LionsKarluk
AkhiokLarsen Bay
OuzinkieOld Harbor
0
20
40
60
80
100
120
140
160
180
Num
ber H
arve
sted
Year
Figure 23Change in Sea Lion Harvests,Kodiak Island Communities
58
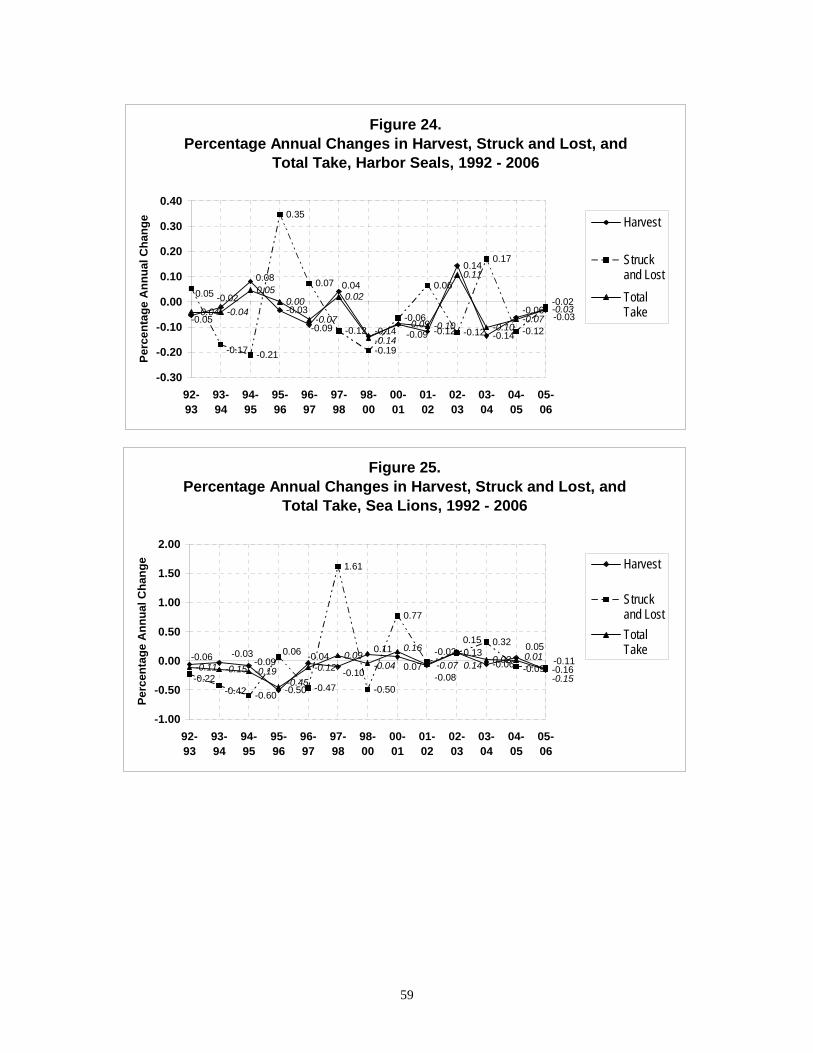
Figure 24.
Percentage Annual Changes in Harvest, Struck and Lost, and Total Take, Harbor Seals, 1992 - 2006
-0.03
-0.12
0.14
-0.14
-0.21
0.35
0.07
-0.12
-0.19
-0.06
0.06
-0.12
0.17
-0.12
-0.04 -0.04
0.050.00
-0.07
0.02
-0.10
0.11
-0.10-0.03
-0.09
-0.02
-0.05
0.08
-0.09
0.04
-0.14
-0.06-0.02
0.05
-0.17
-0.03-0.09
-0.14
-0.07
-0.30
-0.20
-0.10
0.00
0.10
0.20
0.30
0.40
92-93
93-94
94-95
95-96
96-97
97-98
98-00
00-01
01-02
02-03
03-04
04-05
05-06
Perc
enta
ge A
nnua
l Cha
nge Harvest
Struck and LostTotalTake
Figure 25.Percentage Annual Changes in Harvest, Struck and Lost, and
Total Take, Sea Lions, 1992 - 2006
-0.50
-0.06 -0.16
-0.60-0.47
1.61
-0.50
0.77
0.32
-0.11 -0.15 -0.19 -0.120.09 0.02
0.050.15
-0.080.07
-0.03-0.06 -0.09 -0.04
-0.10
0.11-0.11
-0.09
0.06 0.13-0.02
-0.22-0.42
-0.15
0.010.14
-0.45
-0.07
0.16
-0.04
-1.00
-0.50
0.00
0.50
1.00
1.50
2.00
92-93
93-94
94-95
95-96
96-97
97-98
98-00
00-01
01-02
02-03
03-04
04-05
05-06
Perc
enta
ge A
nnua
l Cha
nge Harvest
Struck and LostTotalTake
59

In contrast with the declining takes of harbor seals from 1992 to 2006, there has
been remarkable consistency in the reported age and sex composition of the statewide
harbor seal harvest. Figures 26 and 27 compare statewide patterns in the age and sex
composition of the subsistence harvests of harbor seals since 1992. At the statewide
level, hunters consistently have reported harvesting more male than female harbor seals
each year. Considering kills of known sex for harbor seals, male-to-female sex ratios
have been similar across survey years 1992–2005, ranging from 2.0 to 2.6 males to one
female. The ratio of 3.3 males to one female in 2006 was a substantial increase from
previous years (Fig. 26). At the statewide level, age composition has been similar
between years (Fig. 27): hunters continued to report harvesting primarily adult harbor
seals (77%–85% of the annual harvest), with smaller proportions of juvenile seals (10%–
22%) and pups (1%–5%).
Figures 28 and 29 compare age and sex compositions of harbor seal harvests at
the regional level. There is considerable similarity between regions and years for harbor
seal sex composition (Fig. 28). Counting harvested animals whose sex was reported
between 1992 and 2006, all regions showed more male seals to female seals harvested:
Southeast (68% males), North Pacific Rim (70% males), Kodiak Island (74% males),
South Alaska Peninsula (77% males), Aleutian Islands (71% males), and North and
South Bristol Bay (71% males). A number of factors probably contribute to the
predominance of males over females in the subsistence harvest of harbor seals across
regions and years, as discussed in Wolfe and Mishler (1998). The higher number of
males harvested likely reflects the greater availability of males in the groups of animals
hunted due to 2 factors: sex segregation in seal groups, and female seals being more
elusive than male seals when disturbed in a group, presenting comparatively fewer or
more difficult targets (see Wolfe and Mishler 1998:60-61; Wolfe et al 1999).
The age composition of the subsistence harvest of harbor seals varies
substantially between regions and presents a more complex picture than sex ratios (Fig.
60

29). Since 1992, hunters have been asked to classify the seal harvest into 3 categories:
“pups,” “juveniles,” and “adults.” Probably most hunters answer this question using size
and behavior as main indicators, so that the smallest seals with their mothers are
classified as “pups,” small-sized seals are classified as “juveniles,” and medium-to-large
seals are classified as “adults.” The hunters’ category of “juveniles” probably primarily
includes yearlings (6–17.9 months), which are about 30% of adult weight, and perhaps
include some 2-year-old seals (18–29.9 months) and 3-year-old seals (30–41.9 months),
which have gained on average about 50% of adult weight (Bigg 1969:21; Pitcher and
Caulkins 1979:30).
Based on hunter reports, the percentages of juveniles in the harvest differed
substantially between regions during 1992–2006 (Fig. 29). Of all the seals harvested
during 1992–2006 in the Southeast Region, only 10% were reported to be juvenile seals.
Bristol Bay seal harvests also had a relatively low juvenile composition of 16%. Other
regions had greater proportions of juvenile seals in their annual harvests, including
South Alaska Peninsula (22%), Kodiak Islands (24%), North Pacific Rim (28%), and the
Aleutian Islands (40%). These age patterns possibly reflect differences in the age
compositions of seal populations accessible to hunters, perhaps due to different
population structures in each region. The older ages of harvested seals in the Southeast
region may reflect relatively larger and more stable seal populations with proportionately
larger older age classes in the population, while the younger ages of seals harvested in
other regions may reflect populations which are rebuilding, with proportionately larger
young age classes.
As shown in Fig. 29, the reported age compositions of the seal harvests have
seen substantial between-year changes for some regions. In recent years, the
proportions of juvenile seals have fallen substantially in the Kodiak Islands. In the
Southeast region, the proportion of juvenile harvests has been increasing, from 7%
(2002) to 21% (2006). In the North Pacific Rim and Aleutian Islands, the juvenile
61

62
proportions fell markedly in 1998, but rose again in 2000 to the relatively higher levels of
previous years.
The reasons for these dramatic single-year changes in age composition are not
known. If the age composition of the harvest reflects the age structures of local seal
populations, which is speculation at this time, then at least 2 potential explanations
present themselves. One interpretation might be that low juvenile harvests on particular
years may reflect a relatively low production of young seals in a region during spring and
summer. If this is the case, the juvenile proportion in the annual harvest may be an
index of annual biological productivity of a local population. However, a second
interpretation of the age composition data may relate the juvenile proportion to aging
cohorts. A relatively high production of young seals during a particular year may create
a relatively large cohort of young seals on a particular year. In another year or two,
harvested seals from this aging cohort will likely be classified primarily as “adults” by
hunters. Under this second interpretation, a decrease of juveniles on a particular year
may be due to a greater number of available new adults in a local population rather than
due to a change in the production of young seals.
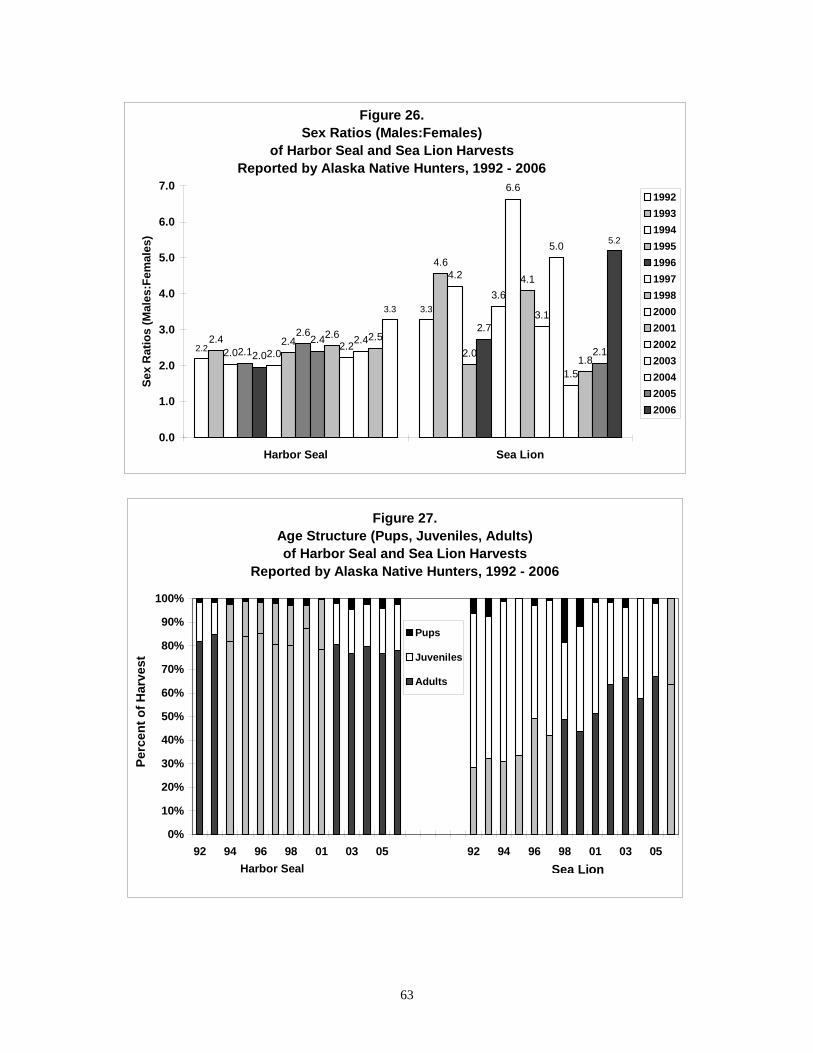
Figure 26.
Sex Ratios (Males:Females)of Harbor Seal and Sea Lion Harvests
Reported by Alaska Native Hunters, 1992 - 2006
2.2
3.3
2.4
4.6
2.0
4.2
2.1 2.02.0
2.7
2.0
3.6
2.4
6.6
2.6
4.1
2.4
3.1
2.6
5.0
2.2
1.5
2.4
1.8
2.52.1
3.3
5.2
0.0
1.0
2.0
3.0
4.0
5.0
6.0
7.0
Harbor Seal Sea Lion
Sex
Rat
ios
(Mal
es:F
emal
es)
19921993199419951996199719982000200120022003200420052006
Figure 27.Age Structure (Pups, Juveniles, Adults)of Harbor Seal and Sea Lion Harvests
Reported by Alaska Native Hunters, 1992 - 2006
0%
10%
20%
30%
40%
50%
60%
70%
80%
90%
100%
92 94 96 98 01 03 05 92 94 96 98 01 03 05
Perc
ent o
f Har
vest
Pups
Juveniles
Adults
Harbor Seal Sea Lion
63

Figure 28. Percentage of Harbor Seal Harvests Reported as Male Seals by Hunters, 1992 - 2006
69%
64%
64% 69
%
57%
87%
69%
78%
66%
73% 76
%
88%
66%
66%
59%
72%
85%
66%
66%
62%
94%
73%
73% 75
%
64% 70
% 73%
72%
81%
80%
66%
76%
63%
62%
70%
69%
68% 74
%
73%
72%
70%
68%71
%
71%
85%
72%
59%
79%
65%
86%
84%
78%
69%
69%71
%
84%
66% 72
%
58%
79%
66%
78%
74%
66%
92%
78%
71%
80%
53%
65%
75%
92%
71% 75
%
59% 65
%
81% 84
%
77% 81
%
93%
79%
58% 64
%68%
74%
71%
70%
71%
77%
0%
10%
20%
30%
40%
50%
60%
70%
80%
90%
100%
Southeast Kodiak Island
Aleutian Islands
North Pacific Rim
Bristol Bay South Alaska
Peninsula
Perc
enta
ge M
ale
Seal
s
1992 1993 1994 1995 1996 1997 1998 2000 2001 2002 2003 2004 2005 2006 1992-06
64

Figure 29. Percentage of Harbor Seal Harvests Reported as Juvenile Seals by Hunters, 1992 - 2006
11%
11%
10%
21%
32%
52%
6%
12%
24%
20%
40% 43
%
8% 9%
23% 25
%
39% 42
%
7%
21%
39%
18%
52%
23%
6%
15% 17
%
37%
23%
77%
9%
12%
27%
34% 36
%
37%
8%
23%
11% 13
%
12% 16
%
14%
10%
4%
34%
13%
39%
13%
13% 15%
36%
22%
55%
7%
11%
27% 31
% 36%
55%
11%
32%
26%
32%
30% 34
%
15% 18
%
14%
30%
7%
30%
17% 20
%
25%
33%
5%
33%
20%
28% 31
%
32%
4%
14%
10%
16%
22%
28%
24%
40%
0%
10%
20%
30%
40%
50%
60%
70%
80%
90%
Southeast Bristol Bay South Alaska
Peninsula
North Pacific Rim
Kodiak Island
Aleutian Islands
Perc
enta
ge J
uven
ile S
eals
199219931994199519961997199820002001200220032004200520061992-06
65

It is beyond the scope of this research to test for the likelihood of these or other
potential explanations. However, the changes in age composition over time in 3 regions
are illustrated in Figures 30 to 32, which present adult and juvenile harbor seal harvests
by month from January 1992 to December 2006 for the Southeast, Kodiak Island, and
North Pacific Rim regions (no data are available for 1999). This time series does not
arbitrarily divide years between December 31 and January 1, as in Fig. 29, but allows for
a combination of the calendar years to better visualize trends. A comparison of the
Southeast harvest (Fig. 30) with the Kodiak harvest (Fig. 31) clearly illustrates the
difference in the proportion of juveniles in the harvests: in Southeast Alaska, juveniles
show more consistency as a low part of the harvest, compared with Kodiak Island,
where as many juveniles are taken as adults in some years. The Kodiak Island harvest
time series (Fig. 31) shows relatively low juvenile harvests relative to adults for certain
time periods: July 1996–June 1997, November 1997–December 1998, January 2000–
December 2000, and July 2004–December 2006. In the neighboring North Pacific Rim
(see Fig. 31), juvenile harvests were high relative to adults in July 1996–1997, low from
January 1998 to December, and high from January to October 2000. In the Southeast
series, the proportion of juveniles, while low, has been increasing since about 2000 (see
Fig. 29). Such complex patterning of the age composition of harbor seal harvests may
be related to annual changes in seal productivity and age class structures in local seal
populations.
66

Fig. 30. Adult and Juvenile Harbor Seal Harvests by Month,
January 1992 - December 2006, Southeast Alaska
0
20
40
60
80
100
120
140
160
180
200
JAN
92
JUL
92
JAN
93
JUL
93
JAN
94
JUL
94
JAN
95
JUL
95
JAN
96
JUL
96
JAN
97
JUL
97
JAN
98
JUL
98
JAN
00
JUL
00
JAN
01
JUL
01
JAN
02
JUL
02
JAN
03
JUL
03
JAN
04
JUL
04
JAN
05
JUL
05
JAN
06
JUL
06
Harvest by Month
Seal
s H
arve
sted
AdultsJuveniles
67

Fig. 31. Adult and Juvenile Harbor Seal Harvests by Month,
January 1992 - December 2006, Kodiak Island Region
0
5
10
15
20
25
30
35
40
45
50
JAN
92
JUL
92
JAN
93
JUL
93
JAN
94
JUL
94
JAN
95
JUL
95
JAN
96
JUL
96
JAN
97
JUL
97
JAN
98
JUL
98
JAN
00
JUL
00
JAN
01
JUL
01
JAN
02
JUL
02
JAN
03
JUL
03
JAN
04
JUL
04
JAN
05
JUL
05
JAN
06
JUL
06
Harvest by Month
Seal
s H
arve
sted
AdultsJuveniles
68

Fig. 32. Adult and Juvenile Harbor Seal Harvests by Month,January 1992 - December 2006, North Pacific Rim Region
-5
5
15
25
35
45
55
65
75
JAN
92
JUL
92
JAN
93
JUL
93
JAN
94
JUL
94
JAN
95
JUL
95
JAN
96
JUL
96
JAN
97
JUL
97
JAN
98
JUL
98
JAN
00
JUL
00
JAN
01
JUL
01
JAN
02
JUL
02
JAN
03
JUL
03
JAN
04
JUL
04
JAN
05
JUL
05
JAN
06
JUL
06
Harvest by Month
Seal
s H
arve
sted
AdultsJuveniles
69

Sea Lion Subsistence Trends, 1992–2006
Total subsistence takes of sea lions by Alaska Natives sharply declined from
1992 to 1995, with takes leveling off between 1996 and 2006 (Fig 10). The lowest
recorded sea lion takes (164 animals) occurred in 1997. The subsistence take of 186
sea lions in 2006 was 34% of the subsistence take in 1992 (549 animals).
At the regional level, the total of 40 sea lions reported taken by hunters on the
Pribilof Islands was similar to the average take since 1996 (44 sea lions), though
substantially fewer than reported in 1992 (297 animals) (Fig. 13). The sea lion take in
the Aleutian Islands area increased to 83 animals in 2006 from a low of 37 animals in
1998, but was below the total of 135 animals taken in 1992. In Kodiak Island areas, the
sea lion take in 2006 (7 animals) was the lowest recorded since surveys began in 1992
(Fig. 13).
In the North Pacific Rim and Kodiak Island regions, longer time series are
available (see Figs. 21 and 23). Documented sea lion harvests in Tatitlek and Chenega
Bay ranged as high as 27 animals in each place during the 1980s. In 2006, no sea lions
were reported harvested in Chenega Bay, while 16 were harvested at Tatitlek (Fig. 21).
Harvests at Nanwalek and Port Graham show substantial yearly variation (from one to
19 animals). Only one sea lion was harvested between the 2 communities in 2006. On
Kodiak Island, sea lion harvests declined substantially during the 1980s – 232 (1982),
202 (1986) and 37 (1989) – but rebounded again to 126 in 1995 because of increased
harvests at Old Harbor and Ouzinkie. Kodiak Island harvests were 7 sea lions in 2006,
with none reported for 3 of 6 villages (Fig. 23). The longer time series indicate that sea
lion harvests have been declining in the North Pacific Rim and Kodiak Island areas, with
the declines commencing during the 1980s for Kodiak Island communities.
Declines in sea lion takes documented over the last 7 years appear to be
associated with drops in hunter numbers, as illustrated in Fig. 8. Sea lion hunters
(excluding St. Paul) fell from a 5-year average of 131 hunters (1992–1996) to 57 hunters
70

(2006). The number of successful sea lion hunters fell from a 5-year average of 84
hunters (1992–1996) to 51 hunters (2006). However, the success rate of those hunters
(89%) was an all time high (Table 16). As with seal hunting, there are probably a variety
of local factors related to the year-to-year changes in the number of households hunting
sea lions in particular communities, including seasonal hunting conditions, local food
needs, and personal circumstances of hunters.
Figure 33 illustrates trends at Atka, one of the few communities in the state
reporting increased sea lion harvests in recent years. As shown in Fig. 33, the numbers
of households hunting sea lions at Atka increased from 8 to 19 households from 1992 to
2003, and the numbers of households successfully harvesting sea lions increased from
6 to 18 households. The number of hunting households then fell to 10 households in
2006. Success rates for households show no clear trends: since 1992, annual mean
harvests per household have ranged from 2.0 to 7.1 sea lions per successful hunter at
Atka. Recent sea lion harvests of 55 animals in 2005 and 52 animals in 2006 were
greater than the 5-year average of 28 animals reported during 1994–1998.
Hunting patterns at Old Harbor display somewhat different trends (Fig. 34). At
Old Harbor, there were increasing numbers of households hunting sea lions from 1992
to 1995 (from 21 households to 43 households), followed by a decrease to 12
households by 1997. In 2006 there was one successful sea lion hunter at Old Harbor,
harvesting one animal. Harvest rates per successful hunter have ranged from 1.0 to 2.6
animals since 1992.
At Akutan, the numbers of households successfully harvesting sea lions have
ranged between 2 and 7 since 1992 (Fig. 35). Mean harvests per successful hunter
have ranged from 1.0 to 5.5 sea lions. Sea lion harvests in 2006 (2 animals) and
success rates (1.0 animals per successful hunter) were the lowest on record. At
Nanwalek, the numbers of households successfully harvesting sea lions have ranged
between one and 5 since 1992 (Fig. 36). Mean harvests per successful hunter have
71
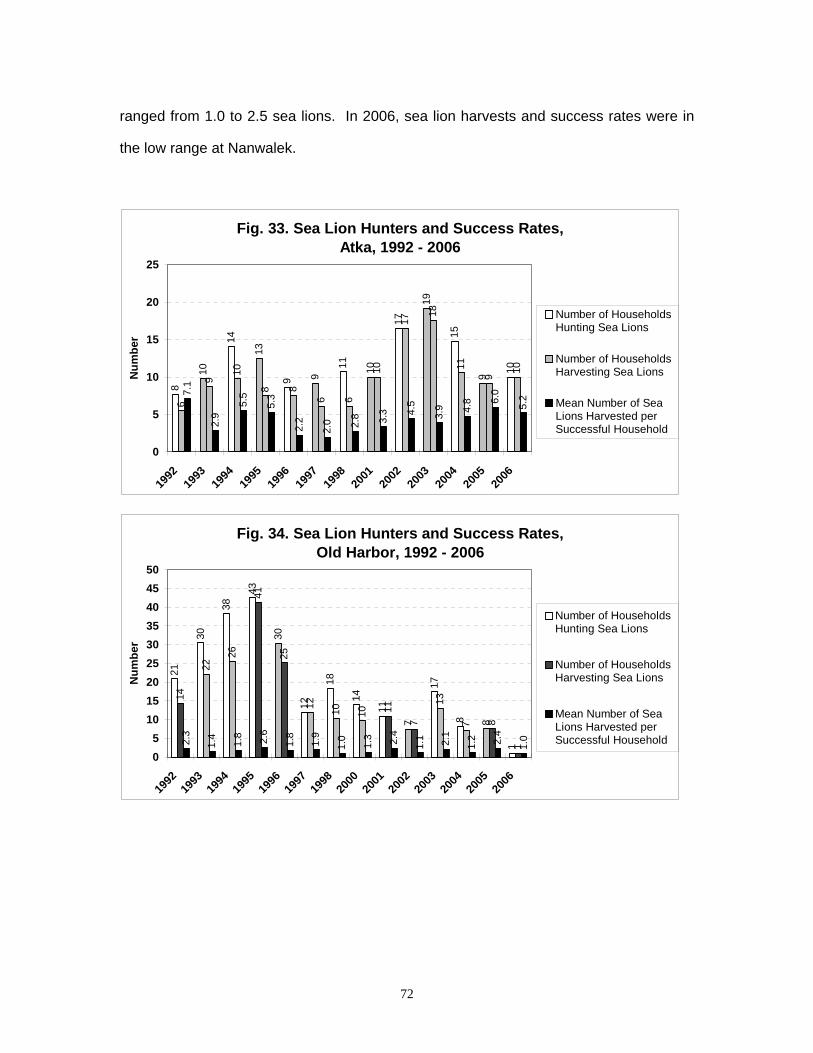
72
ranged from 1.0 to 2.5 sea lions. In 2006, sea lion harvests and success rates were in
the low range at Nanwalek.
Fig. 33. Sea Lion Hunters and Success Rates,Atka, 1992 - 2006
8
10
14
13
9 9
11 10
17
19
15
9 10
6
9
10
8 8
6 6
10
17
18
11
9 10
7.1
2.9
5.5
5.3
2.2
2.0 2.8 3.3 4.
5
3.9 4.
8 6.0
5.2
0
5
10
15
20
25
1992
1993
1994
1995
1996
1997
1998
2001
2002
2003
2004
2005
2006
Num
ber
Number of HouseholdsHunting Sea Lions
Number of HouseholdsHarvesting Sea Lions
Mean Number of SeaLions Harvested perSuccessful Household
Fig. 34. Sea Lion Hunters and Success Rates,Old Harbor, 1992 - 2006
21
30
38
43
30
12
18
14
11
7
17
8 8
1
14
22
26
41
25
12 10 10 11
7
13
7 8
12.3
1.4
1.8 2.6
1.8
1.9
1.0
1.3 2.4
1.1 2.1
1.2 2.4
1.0
05
101520253035404550
1992
1993
1994
1995
1996
1997
1998
2000
2001
2002
2003
2004
2005
2006
Num
ber
Number of HouseholdsHunting Sea Lions
Number of HouseholdsHarvesting Sea Lions
Mean Number of SeaLions Harvested perSuccessful Household
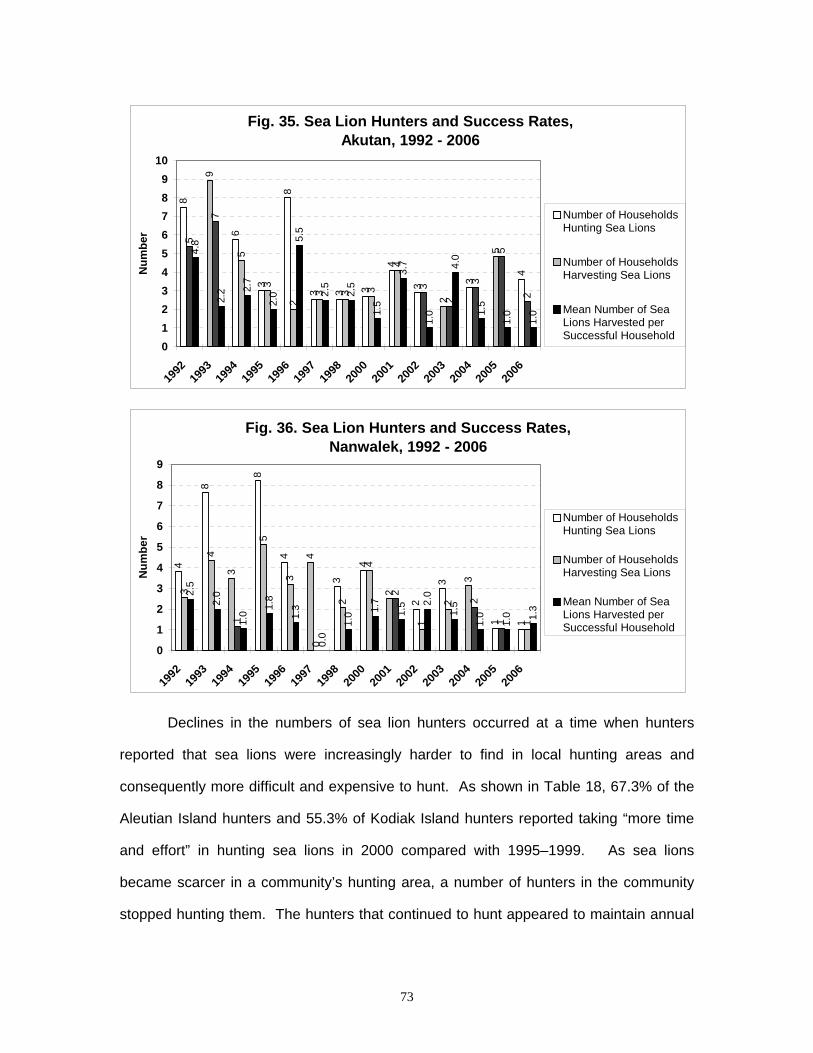
Fig. 35. Sea Lion Hunters and Success Rates,Akutan, 1992 - 2006
8
9
6
3
8
3 3 3
4
3
2
3
5
4
5
7
5
3
2
3 3 3
4
3
2
3
5
2
4.8
2.2 2.
7
2.0
5.5
2.5
2.5
1.5
3.7
1.0
4.0
1.5
1.0
1.0
0123456789
10
1992
1993
1994
1995
1996
1997
1998
2000
2001
2002
2003
2004
2005
2006
Num
ber
Number of HouseholdsHunting Sea Lions
Number of HouseholdsHarvesting Sea Lions
Mean Number of SeaLions Harvested perSuccessful Household
Fig. 36. Sea Lion Hunters and Success Rates,Nanwalek, 1992 - 2006
4
8
3
8
4 4
3
4
2
2
3 3
1 1
3
4
1
5
3
0
2
4
2
1
2 2
1 1
2.5
2.0
1.0
1.8
1.3
0.0
1.0 1.
7
1.5 2.
0
1.5
1.0
1.0 1.
3
0
1
2
3
4
5
6
7
8
9
1992
1993
1994
1995
1996
1997
1998
2000
2001
2002
2003
2004
2005
2006
Num
ber
Number of HouseholdsHunting Sea Lions
Number of HouseholdsHarvesting Sea Lions
Mean Number of SeaLions Harvested perSuccessful Household
Declines in the numbers of sea lion hunters occurred at a time when hunters
reported that sea lions were increasingly harder to find in local hunting areas and
consequently more difficult and expensive to hunt. As shown in Table 18, 67.3% of the
Aleutian Island hunters and 55.3% of Kodiak Island hunters reported taking “more time
and effort” in hunting sea lions in 2000 compared with 1995–1999. As sea lions
became scarcer in a community’s hunting area, a number of hunters in the community
stopped hunting them. The hunters that continued to hunt appeared to maintain annual
73

74
harvest rates similar to past years, but the hunters had to invest more time and effort in
pursuit of the sea lions harvested.
In addition to these factors, it is quite likely that some sea lion hunters chose to
reduce their hunting activity because of perceived problems with sea lion populations.
Hunters commonly are astute observers of the condition and health of local sea lion
stocks. Some portion of the decline in hunting effort during the early to mid-1990s
probably reflected hunters choosing not to hunt in order to help conserve sea lion
populations. The constrictive effects of these factors on sea lion harvests appear to
have run their course. After 1997, the numbers of sea lion hunters and sea lion takes
have leveled off. During the most recent 5 survey years, the numbers of successful sea
lion hunters have shown more consistency, ranging between 51 and 76 hunters.
Similarly, sea lion takes during the most recent 10 survey years have ranged between
185 and 218 animals. All together, the information from surveyed hunters indicates
stabilization and perhaps even a slight increase in the takes of sea lions over the last
several years for the state as a whole.

Table 19Subsistence Harbor Seal Takes by Alaska Natives by Region, 1992 - 2006*
HarvestStruck
and Lost Take HarvestStruck
and Lost Take HarvestStruck
and Lost Take HarvestStruck
and Lost Take HarvestStruck
and Lost TakeRegionSoutheast Alaska 1,476.8 189.5 1,666.2 1,425.0 190.0 1,615.0 1,348.5 151.4 1,499.9 1,719.1 170.9 1,890.0 1,641.6 216.3 1,857.8North Pacific Rim 377.6 33.4 411.0 412.3 38.5 450.8 411.2 56.8 468.0 252.1 11.7 263.9 289.0 22.1 311.1U. Kenai-Cook Inlet 51.6 0.0 51.6 49.2 5.6 54.8 16.2 0.0 16.2 3.7 0.0 3.7 64.3 8.8 73.1Kodiak Island 225.5 13.1 238.6 171.7 20.1 191.8 168.2 3.6 171.7 223.0 9.2 232.2 185.2 4.9 190.1S. AK Peninsula 115.5 13.1 128.6 100.0 23.1 123.1 98.6 11.1 109.8 117.0 11.1 128.0 86.3 5.0 91.3Aleutian Islands 94.3 21.4 115.7 85.0 15.4 100.4 124.9 22.6 147.5 86.9 9.7 96.6 55.0 15.2 70.2Pribilof Islands 2.3 1.2 3.5 2.3 1.2 3.5 7.3 0.0 7.3 2.5 0.0 2.5 0.0 0.0 0.0South Bristol Bay 99.0 68.6 167.6 73.6 57.3 130.9 121.6 59.3 180.9 68.3 28.3 96.6 63.8 44.2 108.0North Bristol Bay 58.4 13.2 71.6 46.1 20.0 66.1 16.2 3.3 19.5 25.9 2.4 28.3 29.6 10.0 39.6Alaska Total 2,501.0 353.4 2,854.4 2,365.3 371.1 2,736.4 2,312.8 308.0 2,620.8 2,498.5 243.3 2,741.8 2,414.7 326.6 2,741.3
RegionSoutheast Alaska 1,343.4 224.1 1,567.4 1,414.0 202.4 1,616.4 1,209.7 151.4 1,361.1 1,019.9 155.9 1,175.7 877.0 129.8 1,006.8North Pacific Rim 295.0 12.8 307.7 393.5 41.4 434.9 289.9 29.8 319.7 279.9 20.1 300.0 251.9 35.2 287.1U. Kenai-Cook Inlet 101.7 8.8 110.5 79.2 13.5 92.7 79.2 13.5 92.7 91.2 2.7 93.9 75.2 8.0 83.2Kodiak Island 189.8 18.3 208.2 174.0 3.7 177.7 185.9 7.3 193.2 155.6 4.8 160.4 152.1 10.2 162.3S. AK Peninsula 68.3 12.1 80.4 79.9 7.5 87.4 65.4 18.4 83.8 68.7 16.3 85.1 70.0 19.4 89.4Aleutian Islands 70.5 6.3 76.9 45.8 3.8 49.6 79.0 10.5 89.5 120.1 12.5 132.6 63.4 2.4 65.9Pribilof Islands 0.0 0.0 0.0 4.6 0.0 4.6 0.0 0.0 0.0 0.0 1.0 1.0 0.0 0.0 0.0South Bristol Bay 107.8 66.3 174.1 62.2 34.3 96.5 55.4 17.6 73.0 52.9 19.8 72.7 79.7 36.8 116.6North Bristol Bay 18.8 2.1 20.9 33.2 3.6 36.8 10.4 1.1 11.6 8.8 1.2 10.0 15.5 7.4 23.0Alaska Total 2,195.3 350.8 2,546.2 2,286.4 310.3 2,596.7 1,974.8 249.6 2,224.4 1,797.1 234.3 2,031.4 1,585.0 249.2 1,834.2
RegionSoutheast Alaska 945.1 123.7 1,068.8 743.0 102.3 845.3 545.5 88.7 634.2 592.7 114.8 707.6North Pacific Rim 348.8 25.3 374.1 322.7 43.2 365.9 347.4 47.8 395.2 411.1 29.7 440.8U. Kenai-Cook Inlet 90.8 15.0 105.8 56.6 13.4 69.9 37.6 13.3 50.9 37.6 13.3 50.9Kodiak Island 172.7 13.0 185.6 172.2 15.7 188.0 305.1 10.6 315.7 210.3 10.2 220.5S. AK Peninsula 91.1 13.5 104.5 77.9 10.1 88.0 66.8 8.5 75.3 52.5 20.6 73.0Aleutian Islands 97.7 11.4 109.1 118.0 28.0 146.0 103.7 17.1 120.8 54.4 8.6 63.0Pribilof Islands 0.0 0.0 0.0 0.0 0.0 0.0 0.0 0.0 0.0 0.0 0.0 0.0South Bristol Bay 35.6 15.3 50.9 58.5 31.2 89.6 40.3 30.8 71.1 45.4 14.0 59.4North Bristol Bay 29.8 1.4 31.2 17.6 11.7 29.3 23.9 8.9 32.7 19.1 9.9 29.0Alaska Total 1,811.6 218.5 2,030.1 1,566.4 255.6 1,822.0 1,470.3 225.6 1,695.9 1,423.1 221.2 1,644.2
* Surveys not completed for study year 1999
2002
19961995
2001
2005 2006
1994
20001997 1998
2003 2004
1992 1993
75

Table 20Subsistence Sea Lion Takes by Alaska Natives by Region, 1992 - 2006*
HarvestStruck
and Lost Take HarvestStruck
and Lost Take HarvestStruck
and Lost Take HarvestStruck
and Lost Take HarvestStruck
and Lost TakeRegionSoutheast Alaska 5.2 1.3 6.4 0.0 1.1 1.1 3.5 1.1 4.6 0.0 0.0 0.0 0.0 0.0 0.0North Pacific Rim 25.1 6.5 31.5 26.2 8.7 34.9 16.6 9.7 26.3 28.4 3.0 31.4 12.4 1.1 13.5U. Kenai-Cook Inlet 5.7 3.8 9.5 7.8 3.3 11.1 1.4 0.0 1.4 0.0 0.0 0.0 3.3 0.0 3.3Kodiak Island 41.5 16.3 57.8 41.5 16.9 58.4 57.1 4.2 61.3 127.9 7.7 135.7 53.9 6.3 60.2S. AK Peninsula 2.4 0.0 2.4 4.6 1.2 5.7 4.6 1.1 5.7 8.1 0.0 8.1 3.7 1.3 5.0Aleutian Islands 104.3 30.9 135.2 99.0 24.8 123.8 101.8 20.5 122.3 85.0 11.1 96.1 46.5 11.3 57.9Pribilof Islands** 176.6 120.2 296.8 165.4 80.0 245.4 149.8 43.5 193.3 57.6 10.3 67.9 32.2 14.2 46.4South Bristol Bay 0.0 0.0 0.0 0.0 0.0 0.0 0.0 0.0 0.0 0.0 0.0 0.0 0.0 0.0 0.0North Bristol Bay 7.8 0.0 7.8 3.3 3.3 6.5 1.2 0.0 1.2 0.0 0.0 0.0 0.0 0.0 0.0Alaska Total 368.5 178.9 547.4 347.8 139.3 487.1 336.0 80.1 416.1 307.1 32.1 339.2 152.1 34.1 186.2
RegionSoutheast Alaska 0.0 0.0 0.0 3.3 4.4 7.6 2.3 0.0 2.3 0.0 0.0 0.0 7.0 0.0 7.0North Pacific Rim 4.5 1.4 5.8 20.0 8.5 28.5 11.7 5.0 16.7 14.7 0.0 14.7 5.5 0.0 5.5U. Kenai-Cook Inlet 0.0 0.0 0.0 0.0 0.0 0.0 0.0 0.0 0.0 1.3 0.0 1.3 0.0 0.0 0.0Kodiak Island 33.3 4.9 38.2 14.5 3.3 17.8 18.5 0.0 18.5 32.8 2.2 35.0 16.1 0.0 16.1S. AK Peninsula 8.3 0.0 8.3 9.2 0.0 9.2 13.8 0.0 13.8 10.2 1.4 11.6 3.9 4.2 8.1Aleutian Islands 50.7 1.3 51.9 31.6 5.5 37.0 71.2 4.8 76.0 78.1 19.6 97.7 87.4 17.7 105.1Pribilof Islands** 45.5 10.4 55.9 52.7 25.4 78.1 29.1 14.2 43.3 19.0 19.0 38.0 24.0 19.0 43.0South Bristol Bay 0.0 0.0 0.0 0.0 0.0 0.0 0.0 0.0 0.0 0.0 0.0 0.0 0.0 0.0 0.0North Bristol Bay 3.6 0.0 3.6 0.0 0.0 0.0 0.0 0.0 0.0 0.0 0.0 0.0 0.0 0.0 0.0Alaska Total 145.7 17.9 163.7 131.2 47.0 178.2 146.6 24.0 170.6 156.2 42.2 198.4 143.9 40.9 184.7
RegionSoutheast Alaska 2.3 4.6 6.9 4.6 7.2 11.8 0.0 19.0 19.0 2.5 10.1 12.6North Pacific Rim 19.1 5.6 24.7 38.0 15.8 53.9 40.1 9.1 49.2 17.0 8.0 25.0U. Kenai-Cook Inlet 0.0 0.0 0.0 0.0 0.0 0.0 0.0 0.0 0.0 0.0 0.0 0.0Kodiak Island 30.3 5.7 36.0 13.5 3.5 17.0 21.9 3.2 25.1 7.0 0.0 7.0S. AK Peninsula 2.5 2.4 5.0 3.9 0.0 3.9 4.2 0.0 4.2 17.5 1.1 18.5Aleutian Islands 88.5 18.5 107.0 70.9 25.1 96.0 77.7 10.6 88.3 63.4 19.4 82.8Pribilof Islands** 22.3 9.7 32.0 22.3 9.7 32.0 18.3 13.7 32.0 29.3 10.7 40.0South Bristol Bay 0.0 0.0 0.0 0.0 0.0 0.0 0.0 0.0 0.0 0.0 0.0 0.0North Bristol Bay 0.0 0.0 0.0 1.2 0.0 1.2 0.0 0.0 0.0 0.0 0.0 0.0Alaska Total 165.0 46.5 211.5 154.4 61.4 215.7 162.2 55.6 217.8 136.8 49.2 186.0
* Surveys not completed for study year 1999** St. Paul's 2000 - 2006 data from Zavadil et al. (2006), Lestenkof and Zavadil (2006), and Lestenkof et al. (2007).
1992
2003 2004
1997 1998
1993
2000
1994
2005
1995
2006
1996
20022001
76

C
HarvestStruck
and Lost Take HarvestStruck
and Lost Take HarvestStruck
and Lost Take HarvestStruck
and Lost Take
ommunitySOUTHEAST ALASKAAng
oon 125.1 28.9 154.0 56.6 9.9 66.5 66.9 21.1 88.0 80.9 9.7 90.6Craig 74.2 0.0 74.2 51.1 9.8 60.9 42.7 6.6 49.3 69.4 13.6 83.1
aines 30.5 7.9 38.4 23.0 2.3 25.3 39.3 2.2 41.5 24.0 9.0 33.0oonah 350.2 24.8 375.0 324.4 35.8 360.2 240.7 15.0 255.8 236.6 19.7 256.3
Hydaburg 30.0 2.1 32.1 14.0 0.0 14.0 10.0 0.0 10.0 6.5 0.0 6.5uneau 122.6 7.6 130.2 59.0 21.6 80.6 78.6 13.5 92.1 42.9 1.3 44.2
Kake 173.9 12.3 186.2 100.8 15.2 115.9 99.3 7.4 106.6 72.0 1.5 73.5chikan 90.2 6.5 96.8 42.4 2.9 45.3 31.4 0.0 31.4 46.4 0.0 46.4
awock 39.0 1.4 40.3 39.8 0.0 39.8 71.1 0.0 71.1 263.8 0.0 263.8Klukwan 8.0 2.0 10.0 1.2 0.0 1.2 3.8 1.3 5.0 35.2 6.4 41.6
ican 8.3 1.4 9.7 5.3 1.1 6.4 4.4 1.1 5.6 13.5 0.0 13.5Petersburg 22.4 2.6 25.0 4.5 4.5 9.0 15.2 1.3 16.4 13.6 1.1 14.7
man 22.2 1.2 23.5 5.6 0.0 5.6 16.5 0.0 16.5 15.9 0.0 15.9tka 124.7 21.4 146.1 109.3 20.6 129.9 110.5 20.1 130.6 93.8 6.3 100.0
Wrangell 6.0 8.0 14.0 19.5 9.0 28.5 101.0 27.0 128.0 89.3 22.8 112.0akutat 248.0 61.3 309.3 568.4 57.4 625.8 417.1 35.0 452.1 615.5 79.6 695.1
NORTH PACIFIC RIM
henega Bay 42.6 2.3 44.9 60.8 2.2 63.0 42.0 3.9 45.9 44.4 1.6 46.0ordova 103.8 8.8 112.5 147.4 5.5 152.9 135.8 9.1 144.9 83.4 2.0 85.4
Nanwalek 27.9 0.0 27.9 33.9 3.2 37.1 29.0 4.6 33.7 23.6 0.0 23.6t Graham 36.2 4.7 40.8 30.6 3.2 33.7 15.5 5.2 20.7 23.0 0.0 23.0
Seldovia 12.4 0.0 12.4 7.9 4.9 12.8 8.0 0.0 8.0 4.0 0.0 4.0eward 2.0 0.0 2.0 0.0 0.0 0.0 5.0 0.0 5.0 10.9 5.5 16.4atitlek 152.9 17.7 170.6 110.8 15.5 126.4 145.9 30.9 176.8 46.1 2.6 48.7
Valdez 0.0 0.0 0.0 21.0 4.0 25.0 30.0 3.0 33.0 16.8 0.0 16.8PPER KENAI-COOK
INLET
horage 17.1 0.0 17.1 24.4 5.6 30.0 4.2 0.0 4.2 3.7 0.0 3.7omer -- -- -- 4.8 0.0 4.8 12.0 0.0 12.0 0.0 0.0 0.0
Kenai 33.3 0.0 33.3 20.0 0.0 20.0 -- -- -- -- -- -yonek 1.1 0.0 1.1 -- -- -- -- -- -- -- -- --
DIAK ISLAND
Akhiok 20.0 3.0 23.0 13.3 0.0 13.3 14.5 0.0 14.5 5.0 0.0 5.0luk 16.5 1.5 18.0 10.0 1.3 11.3 7.5 0.0 7.5 28.1 6.8 34.9
Kodiak City 36.9 0.0 36.9 6.0 1.0 7.0 7.6 0.0 7.6 8.8 0.0 8.8sen Bay 6.5 0.0 6.5 7.7 5.5 13.2 13.4 2.2 15.7 11.0 0.0 11.0
d Harbor 86.8 5.3 92.1 67.6 2.7 70.3 83.7 1.3 85.0 112.0 2.4 114.4Ouzinkie 21.8 1.1 23.0 41.2 8.7 49.8 33.4 0.0 33.4 56.1 0.0 56.1
t Lions 36.9 2.2 39.1 26.0 1.0 27.0 8.0 0.0 8.0 2.0 0.0 2.0
By Eastern Gulf of Alaska Communities, 1992 - 2006
1992 1993 1994 1995
Table 21Subsistence Harbor Seal Takes by Alaska Natives
HH
J
KetKl
Pel
SaxSi
Y
CC
Por
ST
U
AncH
-TKO
Kar
LarOl
Por
77

CS
Table 21 (Continued)Subsistence Harbor Seal Takes by Alaska Natives
By Eastern Gulf of Alaska Communities, 1992 - 2006
HarvestStruck
and Lost Take HarvestStruck
and Lost Take HarvestStruck
and Lost Take HarvestStruck
and Lost Take HarvestStruck
and Lost TakeommunityOUTHEAST ALASKA
Angoon 71.0 2.0 73.0 51.0 7.1 58.1 53.0 2.0 55.0 64.3 6.1 70.4 85.0 5.2 90.2raig 48.2 8.0 56.3 62.0 7.5 69.5 52.7 5.2 57.9 35.0 3.0 38.0 54.0 4.0 58.0aines 41.1 3.4 44.6 36.8 10.5 47.3 30.7 10.6 41.3 17.5 0.0 17.5 19.3 1.1 20.4
Hoonah 359.7 48.6 408.3 143.8 9.9 153.8 169.7 19.8 189.6 147.9 16.0 163.9 143.4 13.2 156.7ydaburg 15.0 0.0 15.0 11.5 0.0 11.5 14.4 0.0 14.4 14.4 0.0 14.4 14.4 0.0 14.4uneau 32.8 1.3 34.1 99.0 0.0 99.0 90.4 15.3 105.7 59.9 3.5 63.4 29.9 1.6 31.5
Kake 86.4 0.0 86.4 68.4 7.6 76.0 123.0 6.1 129.1 101.7 3.6 105.3 85.6 10.7 96.4chikan 25.0 0.0 25.0 27.4 4.3 31.8 26.7 0.0 26.7 111.7 0.0 111.7 12.7 0.0 12.7
awock 69.8 0.0 69.8 94.0 0.0 94.0 83.0 0.0 83.0 67.1 0.0 67.1 71.5 0.0 71.5Klukwan 6.3 0.0 6.3 1.1 0.0 1.1 10.5 0.0 10.5 18.0 0.0 18.0 0.0 0.0 0.0Pelican 15.4 0.0 15.4 14.5 0.0 14.5 15.8 2.4 18.2 7.5 0.0 7.5 9.0 0.0 9.0Petersburg 19.5 2.4 21.9 11.8 4.3 16.2 23.9 9.3 33.2 20.7 7.2 27.9 16.0 22.0 38.0Saxman 4.9 0.0 4.9 11.0 0.0 11.0 19.6 0.0 19.6 45.6 1.9 47.5 12.9 0.0 12.9Sitka 126.8 4.1 130.9 150.6 3.7 154.3 237.6 29.4 267.0 276.8 41.1 317.8 241.3 32.8 274.1Wrangell 79.3 22.2 101.5 68.8 29.2 98.0 174.0 30.0 204.0 28.5 12.0 40.5 16.0 29.0 45.0Yakutat 640.3 124.1 764.5 491.5 139.9 631.5 289.0 72.3 361.3 193.3 56.8 250.1 208.8 36.2 245.0NORTH PACIFIC RIMChenega Bay 16.0 3.0 19.0 25.7 0.0 25.7 15.6 0.0 15.6 15.0 0.0 15.0 13.0 0.0 13.0Cordova 122.2 8.6 130.8 120.8 0.0 120.8 79.1 9.3 88.3 87.8 14.0 101.8 102.7 5.8 108.5Nanwalek 22.4 0.0 22.4 20.2 0.0 20.2 30.9 1.0 31.9 52.9 3.9 56.8 42.3 1.2 43.5Port Graham 15.5 2.2 17.7 15.8 3.2 19.0 52.3 3.6 55.9 40.2 1.7 41.9 39.4 8.3 47.6Seldovia 3.0 0.0 3.0 2.8 2.8 5.5 3.0 0.0 3.0 2.0 0.0 2.0 3.0 0.0 3.0Seward 5.6 0.0 5.6 0.0 0.0 0.0 0.0 0.0 0.0 4.0 0.0 4.0 0.0 0.0 0.0Tatitlek 90.8 3.8 94.6 97.2 6.8 104.0 171.1 19.2 190.2 46.3 1.9 48.2 61.6 4.7 66.3Valdez 13.5 4.5 18.0 12.5 0.0 12.5 41.7 8.3 50.0 41.7 8.3 50.0 18.0 0.0 18.0UPPER KENAI-COOK INLETAnchorage 28.9 6.2 35.1 23.6 1.2 24.8 43.8 7.5 51.3 43.8 7.5 51.3 45.3 2.7 48.0Homer 10.5 1.5 12.0 41.1 2.6 43.7 22.8 6.0 28.8 22.8 6.0 28.8 21.0 0.0 21.0Kenai 22.9 1.1 24.0 35.0 5.0 40.0 12.6 0.0 12.6 12.6 0.0 12.6 24.9 0.0 24.9Tyonek 2.0 0.0 2.0 2.0 0.0 2.0 0.0 0.0 0.0 0.0 0.0 0.0 0.0 0.0 0.0KODIAK ISLANDAkhiok 12.0 1.0 13.0 7.9 0.0 7.9 7.3 0.0 7.3 17.6 0.0 17.6 7.2 0.0 7.2Karluk 15.1 0.0 15.1 19.0 0.0 19.0 11.0 0.0 11.0 19.5 1.5 21.0 8.3 0.0 8.3Kodiak City 9.0 0.0 9.0 13.0 0.0 13.0 11.0 0.0 11.0 21.6 4.8 26.4 17.5 0.0 17.5Larsen Bay 15.0 0.0 15.0 9.8 4.2 13.9 1.7 0.0 1.7 18.6 0.0 18.6 9.0 1.1 10.2Old Harbor 113.5 1.3 114.8 80.0 4.8 84.8 55.1 1.1 56.2 59.1 0.0 59.1 71.3 0.0 71.3Ouzinkie 16.7 2.6 19.3 55.2 9.4 64.6 82.0 2.5 84.5 43.0 1.0 44.0 33.4 2.6 36.0Port Lions 4.0 0.0 4.0 5.0 0.0 5.0 6.0 0.0 6.0 6.4 0.0 6.4 8.8 1.1 9.9
1996 1997 1998 20012000
CH
HJ
KetKl
78

CSO
Table 21 (Continued)Subsistence Harbor Seal Takes by Alaska Natives
By Eastern Gulf of Alaska Communities, 1992 - 2006
HarvestStruck
and Lost Take HarvestStruck
and Lost Take HarvestStruck
and Lost Take HarvestStruck
and Lost Take HarvestStruck
and Lost Takeommunity 2004 2005
UTHEAST ALASKAAngoon 72.7 2.2 74.9 54.9 0.0 54.9 47.4 3.2 50.5 57.5 6.2 63.7 46.0 8.0 54.0
raig 38.9 5.7 44.6 28.0 6.0 34.0 29.7 5.5 35.2 26.0 3.0 29.0 1.3 0.0 1.3aines 19.6 26.2 45.8 12.0 0.0 12.0 7.0 0.0 7.0 2.0 0.0 2.0 4.7 0.0 4.7
Hoonah 96.4 6.0 102.4 52.2 10.4 62.6 106.2 9.0 115.2 53.0 11.0 64.0 55.6 7.6 63.2ydaburg 14.4 0.0 14.4 14.4 0.0 14.4 14.4 0.0 14.4 14.4 0.0 14.4 14.4 0.0 14.4uneau 17.2 1.4 18.7 30.3 24.8 55.0 13.6 9.1 22.7 8.0 1.0 9.0 26.1 23.4 49.5
Kasaan 98.2 10.6 108.7 52.1 0.0 52.1 96.2 0.0 96.2 47.6 4.6 52.3 40.5 0.0 40.5tchikan 123.5 1.2 124.6 78.0 0.0 78.0 60.0 5.0 65.0 73.1 0.0 73.1 37.6 0.0 37.6
awock 24.0 0.0 24.0 59.8 0.0 59.8 29.2 7.6 36.8 20.0 2.0 22.0 16.2 3.5 19.7Klukwan 0.0 0.0 0.0 0.0 0.0 0.0 0.0 0.0 0.0 0.0 0.0 0.0 0.0 0.0 0.0Pelican 1.8 0.0 1.8 1.8 0.0 1.8 1.8 0.0 1.8 10.5 0.0 10.5 8.4 0.0 8.4Petersburg 45.0 18.0 63.0 9.6 7.2 16.8 10.3 8.3 18.6 30.0 22.0 52.0 10.0 11.0 21.0Saxman 25.5 3.0 28.5 12.0 0.0 12.0 5.0 0.0 5.0 6.8 5.5 12.3 20.2 0.0 20.2Sitka 169.7 19.3 189.0 220.4 5.2 225.6 141.2 19.3 160.5 23.0 1.0 24.0 141.2 19.3 160.5Wrangell 20.0 9.0 29.0 68.0 18.7 86.7 33.3 8.3 41.7 33.3 8.3 41.7 33.3 8.3 41.7Yakutat 110.3 27.2 137.5 251.7 51.5 303.2 147.7 27.1 174.8 140.2 24.1 164.3 137.3 33.8 171.0NORTH PACIFIC RIMChenega Bay 9.3 1.2 10.5 44.9 14.6 59.5 21.1 1.1 22.2 4.9 0.0 4.9 21.3 0.0 21.3Cordova 102.7 5.8 108.5 77.7 2.7 80.5 77.7 2.7 80.5 57.0 9.0 66.0 30.9 2.6 33.4Nanwalek 40.0 12.0 52.0 30.0 3.0 33.0 30.2 12.5 42.7 20.3 6.4 26.7 23.6 5.1 28.7Port Graham 39.4 8.3 47.6 45.0 0.0 45.0 44.4 2.8 47.2 63.5 8.5 71.9 51.0 0.0 51.0Seldovia 0.0 0.0 0.0 0.0 0.0 0.0 1.0 1.0 2.0 1.0 1.0 2.0 2.7 0.0 2.7Seward 3.5 0.0 3.5 0.0 0.0 0.0 0.0 0.0 0.0 0.0 0.0 0.0 0.0 0.0 0.0Tatitlek 13.1 1.9 14.9 91.1 0.0 91.1 90.2 23.1 113.3 137.8 16.9 154.7 218.7 16.0 234.7Valdez 44.0 6.0 50.0 60.0 5.0 65.0 58.0 0.0 58.0 63.0 6.0 69.0 63.0 6.0 69.0UPPER KENAI-COOK INLETAnchorage 39.8 8.0 47.7 55.0 15.0 70.0 46.8 13.4 60.2 25.0 13.3 38.3 25.0 13.3 38.3Homer 23.5 0.0 23.5 10.8 0.0 10.8 3.7 0.0 3.7 5.6 0.0 5.6 5.6 0.0 5.6Kenai 9.0 0.0 9.0 20.0 0.0 20.0 6.0 0.0 6.0 6.0 0.0 6.0 6.0 0.0 6.0Tyonek 3.0 0.0 3.0 5.0 0.0 5.0 0.0 0.0 0.0 1.0 0.0 1.0 1.0 0.0 1.0KODIAK ISLANDAkhiok 6.3 0.0 6.3 5.5 0.0 5.5 4.2 1.4 5.6 6.9 0.0 6.9 13.6 1.1 14.7Karluk 8.3 0.0 8.3 4.3 0.0 4.3 3.1 0.0 3.1 19.4 0.0 19.4 19.4 0.0 19.4Kodiak City 17.5 0.0 17.5 32.0 6.0 38.0 21.0 4.5 25.5 10.8 0.0 10.8 10.8 0.0 10.8Larsen Bay 3.3 0.0 3.3 2.5 0.0 2.5 12.5 0.0 12.5 17.0 0.0 17.0 20.3 0.0 20.3Old Harbor 40.5 0.0 40.5 66.7 2.9 69.6 37.8 5.9 43.7 37.5 1.1 38.6 20.2 0.0 20.2Ouzinkie 63.4 10.2 73.6 48.8 4.1 52.8 73.0 3.9 76.9 136.6 9.5 146.1 49.0 9.1 58.1Port Lions 13.0 0.0 13.0 12.9 0.0 12.9 20.6 0.0 20.6 77.0 0.0 77.0 77.0 0.0 77.0
200620032002
CH
HJ
KeKl
79
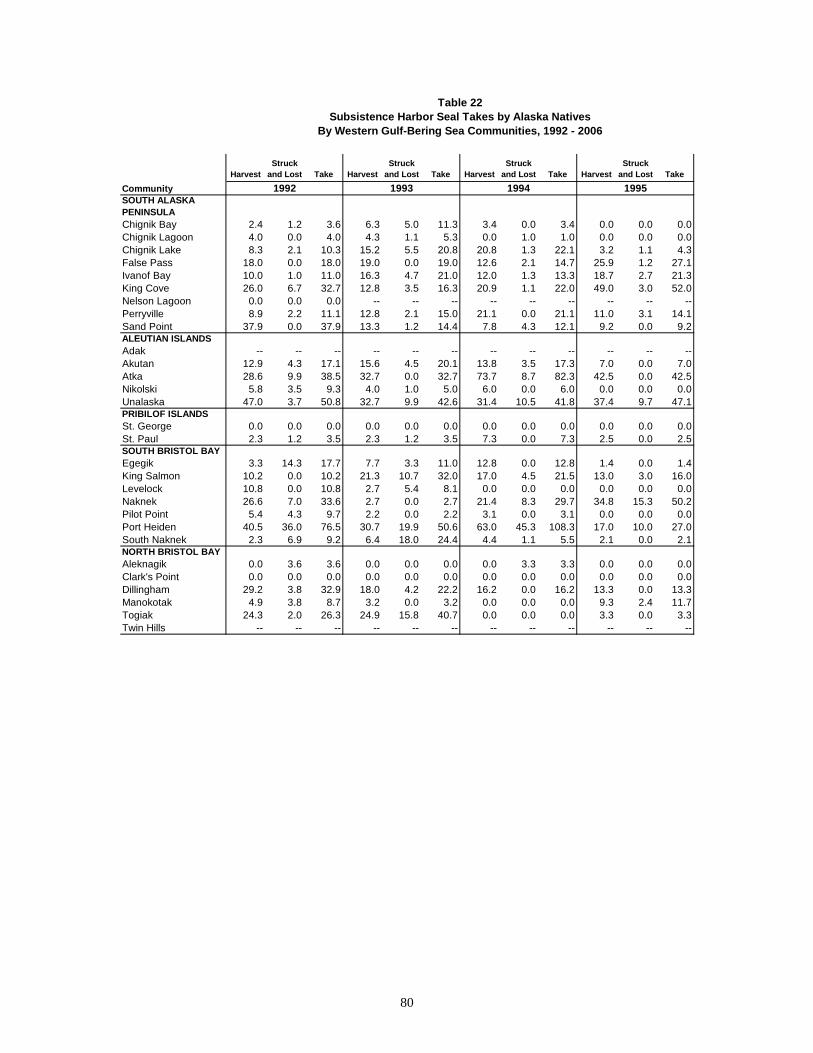
HarvestStruck
and Lost Take HarvestStruck
and Lost Take HarvestStruck
and Lost Take HarvestStruck
and Lost Take
ommunitySOUTH ALASKA
NSULAChignik Bay 2.4 1.2 3.6 6.3 5.0 11.3 3.4 0.0 3.4 0.0 0.0 0.0
hignik Lagoon 4.0 0.0 4.0 4.3 1.1 5.3 0.0 1.0 1.0 0.0 0.0 0.0hignik Lake 8.3 2.1 10.3 15.2 5.5 20.8 20.8 1.3 22.1 3.2 1.1 4.3
False Pass 18.0 0.0 18.0 19.0 0.0 19.0 12.6 2.1 14.7 25.9 1.2 27.1anof Bay 10.0 1.0 11.0 16.3 4.7 21.0 12.0 1.3 13.3 18.7 2.7 21.3
King Cove 26.0 6.7 32.7 12.8 3.5 16.3 20.9 1.1 22.0 49.0 3.0 52.0elson Lagoon 0.0 0.0 0.0 -- -- -- -- -- -- -- -- --
ryville 8.9 2.2 11.1 12.8 2.1 15.0 21.1 0.0 21.1 11.0 3.1 14.1Sand Point 37.9 0.0 37.9 13.3 1.2 14.4 7.8 4.3 12.1 9.2 0.0 9.2
EUTIAN ISLANDS
Adak -- -- -- -- -- -- -- -- -- -- -- --utan 12.9 4.3 17.1 15.6 4.5 20.1 13.8 3.5 17.3 7.0 0.0 7.0ka 28.6 9.9 38.5 32.7 0.0 32.7 73.7 8.7 82.3 42.5 0.0 42.5
Nikolski 5.8 3.5 9.3 4.0 1.0 5.0 6.0 0.0 6.0 0.0 0.0 0nalaska 47.0 3.7 50.8 32.7 9.9 42.6 31.4 10.5 41.8 37.4 9.7 47.1
PRIBILOF ISLANDSorge 0.0 0.0 0.0 0.0 0.0 0.0 0.0 0.0 0.0 0.0 0.0 0.0ul 2.3 1.2 3.5 2.3 1.2 3.5 7.3 0.0 7.3 2.5 0.0 2.5
SOUTH BRISTOL BAYgik 3.3 14.3 17.7 7.7 3.3 11.0 12.8 0.0 12.8 1.4 0.0 1.4
ng Salmon 10.2 0.0 10.2 21.3 10.7 32.0 17.0 4.5 21.5 13.0 3.0 16.0Levelock 10.8 0.0 10.8 2.7 5.4 8.1 0.0 0.0 0.0 0.0 0.0 0.0
aknek 26.6 7.0 33.6 2.7 0.0 2.7 21.4 8.3 29.7 34.8 15.3 50.2Pilot Point 5.4 4.3 9.7 2.2 0.0 2.2 3.1 0.0 3.1 0.0 0.0 0.0
t Heiden 40.5 36.0 76.5 30.7 19.9 50.6 63.0 45.3 108.3 17.0 10.0 27.0th Naknek 2.3 6.9 9.2 6.4 18.0 24.4 4.4 1.1 5.5 2.1 0.0 2.1
NORTH BRISTOL BAY
eknagik 0.0 3.6 3.6 0.0 0.0 0.0 0.0 3.3 3.3 0.0 0.0 0.0Clark's Point 0.0 0.0 0.0 0.0 0.0 0.0 0.0 0.0 0.0 0.0 0.0 0.0
illingham 29.2 3.8 32.9 18.0 4.2 22.2 16.2 0.0 16.2 13.3 0.0 13.3anokotak 4.9 3.8 8.7 3.2 0.0 3.2 0.0 0.0 0.0 9.3 2.4 11.7
Togiak 24.3 2.0 26.3 24.9 15.8 40.7 0.0 0.0 0.0 3.3 0.0 3.3win Hills -- -- -- -- -- -- -- -- -- -- -- -
By Western Gulf-Bering Sea Communities, 1992 - 2006
1992 1993 1994 1995
Table 22Subsistence Harbor Seal Takes by Alaska Natives
C
PENI
CC
Iv
NPer
AL
AkAt
.0
-
U
St. GeSt. Pa
EgeKi
N
PorSou
Al
DM
T
80

CSO
CC
FIv
NP
AA
AtN
PSt
SOEgegi
LevN
PorSout
AlC
MT
Table 22 (Continued)Subsistence Harbor Seal Takes by Alaska Natives
By Western Gulf-Bering Sea Communities, 1992 - 2006
HarvestStruck
and Lost Take HarvestStruck
and Lost Take HarvestStruck
and Lost Take HarvestStruck
and Lost Take HarvestStruck
and Lost Takeommunity
UTH ALASKA PENINSULA
hignik Bay 1.0 0.0 1.0 0.0 0.0 0.0 0.0 0.0 0.0 0.0 0.0 0.0 0.0 0.0 0.0hignik Lagoon 0.0 0.0 0.0 1.3 1.3 2.7 0.0 0.0 0.0 1.2 0.0 1.2 1.1 0.0 1.1
Chignik Lake 3.5 0.0 3.5 2.2 1.1 3.3 1.9 0.0 1.9 3.3 0.0 3.3 1.3 1.3 2.6alse Pass 13.9 0.0 13.9 8.0 0.0 8.0 17.8 1.3 19.1 2.5 1.2 3.7 2.5 1.2 3.7anof Bay 13.2 0.0 13.2 9.0 1.8 10.8 9.0 1.8 10.8 3.2 0.0 3.2 7.0 1.4 8.4
King Cove 14.0 5.0 19.0 16.9 2.1 19.1 18.2 0.0 18.2 19.3 2.1 21.4 22.0 4.0 26.0elson Lagoon -- -- -- -- -- -- -- -- -- -- -- -- -- -- --erryville 20.5 0.0 20.5 21.7 5.7 27.4 21.0 4.4 25.4 21.0 15.0 36.0 24.0 6.9 30.9
Sand Point 20.2 0.0 20.2 9.1 0.0 9.1 12.0 0.0 12.0 15.0 0.0 15.0 10.9 1.6 12.4LEUTIAN ISLANDSdak -- -- -- -- -- -- -- -- -- -- -- -- -- -- --
Akutan 8.0 7.0 15.0 14.0 3.8 17.8 14.0 3.8 17.8 25.7 5.4 31.1 13.6 2.7 16.4ka 22.7 2.2 24.8 26.0 1.5 27.5 16.8 0.0 16.8 16.8 0.0 16.8 63.3 6.7 70.0ikolski 4.0 1.0 5.0 4.0 1.0 5.0 2.2 0.0 2.2 2.2 0.0 2.2 5.3 0.0 5.3
Unalaska 20.3 5.1 25.4 26.5 0.0 26.5 12.7 0.0 12.7 34.3 5.1 39.4 37.8 3.2 41.0RIBILOF ISLANDS. George 0.0 0.0 0.0 0.0 0.0 0.0 0.0 0.0 0.0 0.0 0.0 0.0 0.0 1.0 1.0
St. Paul 0.0 0.0 0.0 0.0 0.0 0.0 4.6 0.0 4.6 0.0 0.0 0.0 0.0 0.0 0.0UTH BRISTOL BAY
k 2.8 0.0 2.8 1.6 0.0 1.6 0.0 0.0 0.0 4.0 3.0 7.0 6.3 1.0 7.3King Salmon 9.5 2.4 11.9 9.7 0.0 9.7 5.2 0.0 5.2 3.3 9.8 13.0 8.5 6.1 14.6
elock 0.0 0.0 0.0 0.0 0.0 0.0 0.0 0.0 0.0 2.8 0.0 2.8 0.0 0.0 0.0aknek 16.2 7.5 23.7 24.8 6.5 31.2 15.7 7.8 23.5 16.3 0.0 16.3 15.1 4.3 19.4
Pilot Point 0.0 0.0 0.0 0.0 0.0 0.0 0.0 0.0 0.0 5.3 2.1 7.4 2.0 2.0 4.0t Heiden 34.3 34.3 68.6 69.2 50.0 119.2 36.1 18.6 54.7 19.6 0.0 19.6 10.1 3.4 13.4h Naknek 1.0 0.0 1.0 2.5 9.8 12.3 5.2 7.9 13.1 4.1 2.7 6.8 11.0 3.0 14.0
NORTH BRISTOL BAYeknagik 0.0 0.0 0.0 1.2 0.0 1.2 3.1 0.0 3.1 2.5 0.0 2.5 0.0 1.2 1.2lark's Point 0.0 0.0 0.0 1.3 0.0 1.3 1.3 0.0 1.3 0.0 0.0 0.0 0.0 0.0 0.0
Dillingham 0.0 0.0 0.0 1.2 0.0 1.2 8.5 0.0 8.5 0.0 0.0 0.0 0.0 0.0 0.0anokotak 2.4 3.6 6.0 0.0 0.0 0.0 4.0 0.0 4.0 1.2 0.0 1.2 3.5 0.0 3.5ogiak 3.9 0.0 3.9 6.7 0.0 6.7 14.1 1.4 15.5 5.1 1.1 6.3 5.3 0.0 5.3
Twin Hills 23.3 6.5 29.8 8.4 2.1 10.5 2.2 2.2 4.4 1.6 0.0 1.6 0.0 0.0 0.0
1996 20011997 1998 2000
81

Table 22 (Continued)
Subsistence Harbor Seal Takes by Alaska NativesBy Western Gulf-Bering Sea Communities, 1992 - 2006
HarvestStruck
and Lost Take HarvestStruck
and Lost Take HarvestStruck
and Lost Take HarvestStruck
and Lost Take HarvestStruck
and Lost TakeCommunitySOUTH ALASKA PENINSULAChignik Bay 1.3 0.0 1.3 2.8 0.0 2.8 0.0 0.0 0.0 0.0 0.0 0.0 4.3 1.4 5.8Chignik Lagoon 0.0 0.0 0.0 0.0 0.0 0.0 0.0 0.0 0.0 0.0 0.0 0.0 0.0 0.0 0.0Chignik Lake 2.9 0.0 2.9 8.9 3.0 11.8 1.1 0.0 1.1 3.6 1.2 4.8 0.0 2.9 2.9False Pass 2.5 0.0 2.5 2.8 0.0 2.8 6.7 3.3 10.0 5.7 0.0 5.7 0.0 0.0 0.0Ivanof Bay 7.0 1.4 8.4 -- -- -- 2.8 0.0 2.8 -- -- -- 3.0 0.0 3.0King Cove 7.5 3.0 10.5 11.0 4.4 15.4 32.3 0.0 32.3 21.5 0.0 21.5 14.0 0.0 14.0Nelson Lagoon -- -- -- -- -- -- 20.0 5.6 25.6 -- -- -- -- -- --Perryville 33.8 15.0 48.8 51.3 6.1 57.4 15.0 1.3 16.3 21.0 6.0 27.0 27.4 14.3 41.7Sand Point 15.0 0.0 15.0 14.3 0.0 14.3 0.0 0.0 0.0 15.0 1.3 16.3 3.8 1.9 5.6ALEUTIAN ISLANDSAdak -- -- -- 4.0 1.0 5.0 0.0 0.0 0.0 12.0 0.0 12.0 0.0 0.0 0.0Akutan 10.2 0.0 10.2 10.8 4.3 15.2 9.5 1.6 11.1 8.5 2.4 10.9 2.4 0.0 2.4Atka 36.0 0.0 36.0 57.6 1.6 59.2 73.9 16.9 90.8 47.2 9.1 56.4 26.0 4.0 30.0Nikolski 3.0 1.0 4.0 11.0 3.0 14.0 6.0 1.0 7.0 6.0 1.0 7.0 17.0 1.0 18.0Unalaska 14.3 1.4 15.7 14.3 1.4 15.7 28.6 8.6 37.1 30.0 4.5 34.5 9.0 3.6 12.6PRIBILOF ISLANDSSt. George 0.0 0.0 0.0 0.0 0.0 0.0 0.0 0.0 0.0 0.0 0.0 0.0 0.0 0.0 0.0St. Paul 0.0 0.0 0.0 0.0 0.0 0.0 0.0 0.0 0.0 0.0 0.0 0.0 0.0 0.0 0.0SOUTH BRISTOL BAYEgegik 2.2 1.1 3.2 4.0 1.0 5.0 1.0 1.0 2.1 1.1 2.1 3.2 3.0 0.0 3.0King Salmon 2.9 0.0 2.9 7.3 6.1 13.4 5.0 3.3 8.3 0.0 0.0 0.0 7.0 0.0 7.0Levelock 0.0 0.0 0.0 0.0 0.0 0.0 0.0 0.0 0.0 2.7 0.0 2.7 0.0 0.0 0.0Naknek 26.2 12.5 38.7 10.5 0.0 10.5 15.2 3.8 19.0 6.2 0.0 6.2 15.1 7.5 22.6Pilot Point 2.0 2.0 4.0 2.7 2.7 5.3 1.9 5.6 7.4 0.0 0.0 0.0 3.0 0.0 3.0Port Heiden 30.4 18.3 48.7 10.0 5.6 15.6 20.0 13.0 33.0 13.0 19.5 32.5 17.3 6.5 23.8South Naknek 16.0 3.0 19.0 1.1 0.0 1.1 15.4 4.4 19.8 17.3 9.2 26.5 0.0 0.0 0.0NORTH BRISTOL BAYAleknagik 0.0 2.2 2.2 0.0 0.0 0.0 0.0 0.0 0.0 0.0 0.0 0.0 0.0 0.0 0.0Clark's Point 0.0 0.0 0.0 0.0 0.0 0.0 0.0 0.0 0.0 2.8 0.0 2.8 0.0 0.0 0.0Dillingham 0.0 0.0 0.0 0.0 0.0 0.0 0.0 0.0 0.0 1.3 0.0 1.3 0.0 1.0 1.0Manokotak 0.0 0.0 0.0 2.2 0.0 2.2 4.0 0.0 4.0 6.6 8.9 15.5 6.6 8.9 15.5Togiak 13.9 3.6 17.4 22.0 0.0 22.0 6.9 9.7 16.6 10.8 0.0 10.8 11.5 0.0 11.5Twin Hills 1.7 1.7 3.3 5.6 1.4 7.0 6.8 1.9 8.8 2.5 0.0 2.5 1.0 0.0 1.0
200620032002 20052004
82

Harvest
Struckand Lost Take Harvest
Struckand Lost Take Harvest
Struckand Lost Take Harvest
Struckand Lost Take
CommunitySOUTHEAST ALASKAAngoon 0.0 0.0 0.0 0.0 0.0 0.0 0.0 0.0 0.0 0.0 0.0 0Craig 0.0 0.0 0.0 0.0 0.0 0.0 0.0 0.0 0.0 0.0 0.0 0.0Haines 0.0 0.0 0.0 0.0 0.0 0.0 0.0 0.0 0.0 0.0 0.0 0.0Hoonah 0.0 0.0 0.0 0.0 0.0 0.0 0.0 0.0 0.0 0.0 0.0 0.0Hydaburg 0.0 0.0 0.0 0.0 0.0 0.0 0.0 0.0 0.0 0.0 0.0 0.0Juneau 0.0 0.0 0.0 0.0 0.0 0.0 1.1 0.0 1.1 0.0 0.0 0Kake 0.0 0.0 0.0 0.0 0.0 0.0 1.2 0.0 1.2 0.0 0.0 0Ketchikan 0.0 0.0 0.0 0.0 0.0 0.0 0.0 0.0 0.0 0.0 0.0 0.0Klawock 1.4 0.0 1.4 0.0 0.0 0.0 0.0 0.0 0.0 0.0 0.0 0.0Klukwan 0.0 0.0 0.0 0.0 0.0 0.0 0.0 0.0 0.0 0.0 0.0 0.0Pelican 0.0 0.0 0.0 0.0 0.0 0.0 0.0 0.0 0.0 0.0 0.0 0.0Petersburg 0.0 0.0 0.0 0.0 0.0 0.0 0.0 0.0 0.0 0.0 0.0 0.0Saxman 0.0 0.0 0.0 0.0 0.0 0.0 0.0 0.0 0.0 0.0 0.0 0Sitka 3.8 1.3 5.0 0.0 1.1 1.1 1.1 1.1 2.2 0.0 0.0 0.0Wrangell 0.0 0.0 0.0 0.0 0.0 0.0 0.0 0.0 0.0 0.0 0.0 0.0Yakutat 0.0 0.0 0.0 0.0 0.0 0.0 0.0 0.0 0.0 0.0 0.0 0.0NORTH PACIFIC RIM
Chenega Bay 6.9 1.2 8.1 11.1 6.6 17.7 6.6 0.0 6.6 6.6 0.0 6.6Cordova 0.0 0.0 0.0 1.5 0.0 1.5 0.0 0.0 0.0 0.0 1.0 1.0Nanwalek 6.3 0.0 6.3 8.5 1.1 9.5 1.2 2.3 3.5 9.2 0.0 9.2Port Graham 3.5 1.2 4.7 1.1 0.0 1.1 0.0 0.0 0.0 10.0 2.0 12.0Seldovia 0.0 0.0 0.0 0.0 0.0 0.0 0.0 0.0 0.0 0.0 0.0 0.0Seward 0.0 0.0 0.0 0.0 0.0 0.0 0.0 0.0 0.0 0.0 0.0 0.0Tatitlek 8.3 4.2 12.5 4.1 1.0 5.2 8.8 7.4 16.2 2.6 0.0 2.6Valdez 0.0 0.0 0.0 0.0 0.0 0.0 0.0 0.0 0.0 0.0 0.0 0.0UPPER KENAI-COOK INLET
Anchorage 5.7 3.8 9.5 7.8 3.3 11.1 1.4 0.0 1.4 0.0 0.0 0.0Homer -- -- -- 0.0 0.0 0.0 0.0 0.0 0.0 0.0 0.0 0.0Kenai 0.0 0.0 0.0 0.0 0.0 0.0 -- -- -- -- -- -Tyonek 0.0 0.0 0.0 -- -- -- -- -- -- -- -- --KODIAK ISLAND
Akhiok 3.0 1.0 4.0 0.0 0.0 0.0 3.2 0.0 3.2 1.0 1.0 2Karluk 0.0 0.0 0.0 0.0 0.0 0.0 0.0 0.0 0.0 0.0 0.0 0.0Kodiak City 0.0 0.0 0.0 0.0 12.7 12.7 1.1 0.0 1.1 2.2 0.0 2.2Larsen Bay 1.1 0.0 1.1 0.0 0.0 0.0 2.2 0.0 2.2 2.0 1.0 3.0Old Harbor 32.9 13.2 46.1 32.1 1.0 33.2 46.2 1.3 47.5 107.1 5.7 112.9Ouzinkie 3.4 0.0 3.4 5.4 2.2 7.6 4.4 2.9 7.3 15.6 0.0 15.6Port Lions 1.1 2.2 3.3 4.0 1.0 5.0 0.0 0.0 0.0 0.0 0.0 0.0
Table 23Subsistence Sea Lion Takes by Alaska Natives
By Eastern Gulf of Alaska Communities, 1992 - 2006
1992 1993 1994 1995
.0
.0
.0
.0
-
.0
83

Table 23 (Continued)
Subsistence Sea Lion Takes by Alaska NativesBy Eastern Gulf of Alaska Communities, 1992 - 2006
HarvestStruck
and Lost Take HarvestStruck
and Lost Take HarvestStruck
and Lost Take HarvestStruck
and Lost Take HarvestStruck
and Lost TakeCommunitySOUTHEAST ALASKAAngoon 0.0 0.0 0.0 0.0 0.0 0.0 0.0 0.0 0.0 1.0 0.0 1.0 0.0 0.0 0.0Craig 0.0 0.0 0.0 0.0 0.0 0.0 0.0 0.0 0.0 0.0 0.0 0.0 0.0 0.0 0.0Haines 0.0 0.0 0.0 0.0 0.0 0.0 0.0 0.0 0.0 0.0 0.0 0.0 0.0 0.0 0.0Hoonah 0.0 0.0 0.0 0.0 0.0 0.0 0.0 0.0 0.0 0.0 0.0 0.0 0.0 0.0 0.0Hydaburg 0.0 0.0 0.0 0.0 0.0 0.0 0.0 0.0 0.0 0.0 0.0 0.0 0.0 0.0 0.0Juneau 0.0 0.0 0.0 0.0 0.0 0.0 0.0 0.0 0.0 0.0 0.0 0.0 0.0 0.0 0.0Kake 0.0 0.0 0.0 0.0 0.0 0.0 0.0 0.0 0.0 0.0 0.0 0.0 0.0 0.0 0.0Ketchikan 0.0 0.0 0.0 0.0 0.0 0.0 0.0 0.0 0.0 0.0 0.0 0.0 0.0 0.0 0.0Klawock 0.0 0.0 0.0 0.0 0.0 0.0 0.0 0.0 0.0 1.3 0.0 1.3 0.0 0.0 0.0Klukwan 0.0 0.0 0.0 0.0 0.0 0.0 0.0 0.0 0.0 0.0 0.0 0.0 0.0 0.0 0.0Pelican 0.0 0.0 0.0 0.0 0.0 0.0 0.0 0.0 0.0 0.0 0.0 0.0 0.0 0.0 0.0Petersburg 0.0 0.0 0.0 0.0 0.0 0.0 0.0 0.0 0.0 0.0 0.0 0.0 0.0 0.0 0.0Saxman 0.0 0.0 0.0 0.0 0.0 0.0 0.0 0.0 0.0 0.0 0.0 0.0 0.0 0.0 0.0Sitka 0.0 0.0 0.0 0.0 0.0 0.0 3.3 4.4 7.6 0.0 0.0 0.0 0.0 0.0 0.0Wrangell 0.0 0.0 0.0 0.0 0.0 0.0 0.0 0.0 0.0 0.0 0.0 0.0 0.0 0.0 0.0Yakutat 0.0 0.0 0.0 0.0 0.0 0.0 0.0 0.0 0.0 0.0 0.0 0.0 0.0 0.0 0.0NORTH PACIFIC RIMChenega Bay 2.0 0.0 2.0 0.0 0.0 0.0 0.0 0.0 0.0 0.0 0.0 0.0 1.2 0.0 1.2Cordova 0.0 0.0 0.0 0.0 0.0 0.0 0.0 0.0 0.0 0.0 0.0 0.0 3.5 0.0 3.5Nanwalek 4.3 1.1 5.3 0.0 0.0 0.0 2.1 0.0 2.1 6.5 0.0 6.5 3.7 0.0 3.7Port Graham 1.1 0.0 1.1 0.0 0.0 0.0 1.2 0.0 1.2 1.7 3.4 5.0 0.0 0.0 0.0Seldovia 0.0 0.0 0.0 1.7 0.0 1.7 0.0 0.0 0.0 0.0 0.0 0.0 0.0 0.0 0.0Seward 0.0 0.0 0.0 0.0 0.0 0.0 0.0 0.0 0.0 0.0 0.0 0.0 0.0 0.0 0.0Tatitlek 5.0 0.0 5.0 2.7 1.4 4.1 15.1 6.8 21.9 1.9 0.0 1.9 6.3 0.0 6.3Valdez 0.0 0.0 0.0 0.0 0.0 0.0 1.7 1.7 3.3 1.7 1.7 3.3 0.0 0.0 0.0UPPER KENAI-COOK INLETAnchorage 1.0 0.0 1.0 0.0 0.0 0.0 0.0 0.0 0.0 0.0 0.0 0.0 1.3 0.0 1.3Homer 0.0 0.0 0.0 0.0 0.0 0.0 0.0 0.0 0.0 0.0 0.0 0.0 0.0 0.0 0.0Kenai 2.3 0.0 2.3 0.0 0.0 0.0 0.0 0.0 0.0 0.0 0.0 0.0 0.0 0.0 0.0Tyonek 0.0 0.0 0.0 0.0 0.0 0.0 0.0 0.0 0.0 0.0 0.0 0.0 0.0 0.0 0.0KODIAK ISLANDAkhiok 6.0 1.0 7.0 6.6 1.3 7.9 3.1 0.0 3.1 3.2 0.0 3.2 1.4 0.0 1.4Karluk 0.0 0.0 0.0 0.0 0.0 0.0 0.0 0.0 0.0 0.0 0.0 0.0 0.0 0.0 0.0Kodiak City 3.0 0.0 3.0 3.0 0.0 3.0 0.0 1.0 1.0 2.4 0.0 2.4 2.5 0.0 2.5Larsen Bay 0.0 0.0 0.0 0.0 0.0 0.0 0.0 0.0 0.0 0.0 0.0 0.0 0.0 0.0 0.0Old Harbor 44.9 5.3 50.2 22.7 3.6 26.3 10.3 2.3 12.6 12.9 0.0 12.9 26.3 2.2 28.5Ouzinkie 0.0 0.0 0.0 0.0 0.0 0.0 0.0 0.0 0.0 0.0 0.0 0.0 2.6 0.0 2.6Port Lions 0.0 0.0 0.0 1.0 0.0 1.0 1.0 0.0 1.0 0.0 0.0 0.0 0.0 0.0 0.0
1996 1997 1998 2000 2001
84
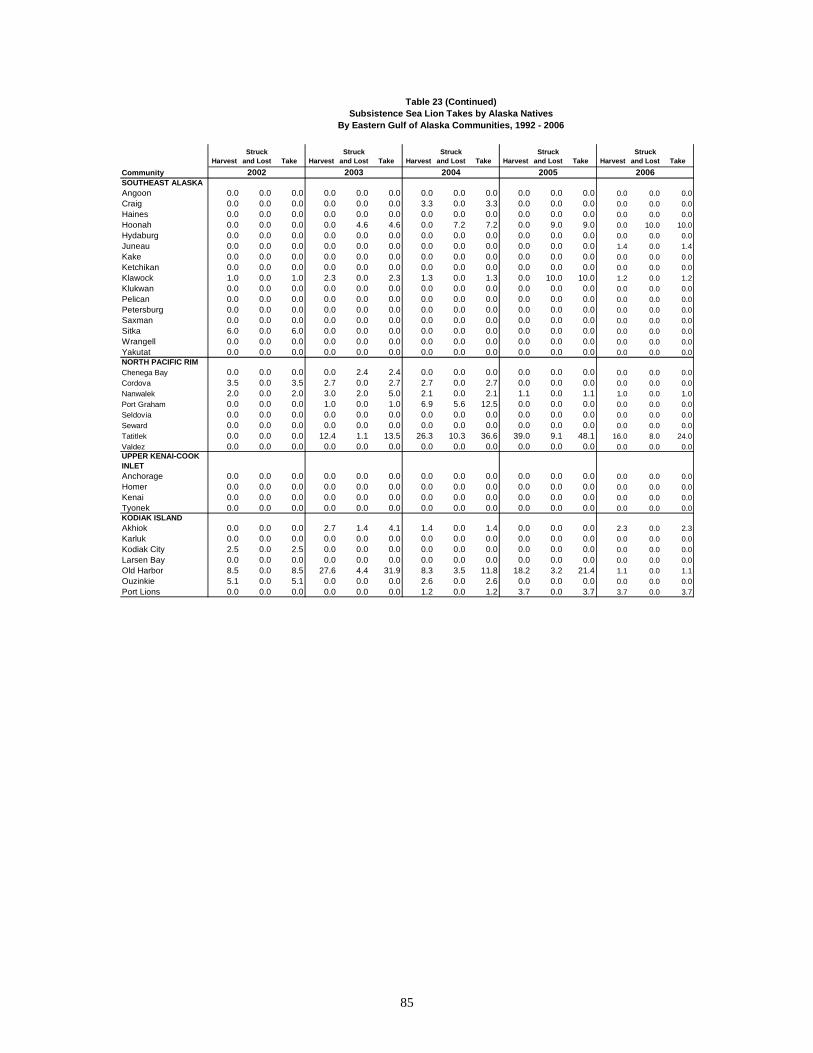
Table 23 (Continued)Subsistence Sea Lion Takes by Alaska Natives
By Eastern Gulf of Alaska Communities, 1992 - 2006
HarvestStruck
and Lost Take HarvestStruck
and Lost Take HarvestStruck
and Lost Take HarvestStruck
and Lost Take HarvestStruck
and Lost Takemmunity
OUTHEAST ALASK
CoS AAngoon 0.0 0.0 0.0 0.0 0.0 0.0 0.0 0.0 0.0 0.0 0.0 0.0 0.0 0.0 0.0
raig 0.0 0.0 0.0 0.0 0.0 0.0 3.3 0.0 3.3 0.0 0.0 0.0 0.0 0.0 0.0aines 0.0 0.0 0.0 0.0 0.0 0.0 0.0 0.0 0.0 0.0 0.0 0.0 0.0 0.0 0.0
Hoonah 0.0 0.0 0.0 0.0 4.6 4.6 0.0 7.2 7.2 0.0 9.0 9.0 0.0 10.0 10.0ydaburg 0.0 0.0 0.0 0.0 0.0 0.0 0.0 0.0 0.0 0.0 0.0 0.0 0.0 0.0 0.0neau 0.0 0.0 0.0 0.0 0.0 0.0 0.0 0.0 0.0 0.0 0.0 0.0 1.4 0.0 1.4
Kake 0.0 0.0 0.0 0.0 0.0 0.0 0.0 0.0 0.0 0.0 0.0 0.0 0.0 0.0 0.0tchikan 0.0 0.0 0.0 0.0 0.0 0.0 0.0 0.0 0.0 0.0 0.0 0.0 0.0 0.0 0.0
lawock 1.0 0.0 1.0 2.3 0.0 2.3 1.3 0.0 1.3 0.0 10.0 10.0 1.2 0.0 1.2Klukwan 0.0 0.0 0.0 0.0 0.0 0.0 0.0 0.0 0.0 0.0 0.0 0.0 0.0 0.0 0.0
elican 0.0 0.0 0.0 0.0 0.0 0.0 0.0 0.0 0.0 0.0 0.0 0.0 0.0 0.0 0.0tersburg 0.0 0.0 0.0 0.0 0.0 0.0 0.0 0.0 0.0 0.0 0.0 0.0 0.0 0.0 0.0
Saxman 0.0 0.0 0.0 0.0 0.0 0.0 0.0 0.0 0.0 0.0 0.0 0.0 0.0 0.0 0.0tka 6.0 0.0 6.0 0.0 0.0 0.0 0.0 0.0 0.0 0.0 0.0 0.0 0.0 0.0 0.0rangell 0.0 0.0 0.0 0.0 0.0 0.0 0.0 0.0 0.0 0.0 0.0 0.0 0.0 0.0 0.0
Yakutat 0.0 0.0 0.0 0.0 0.0 0.0 0.0 0.0 0.0 0.0 0.0 0.0 0.0 0.0 0.0RTH PACIFIC RIMenega Bay 0.0 0.0 0.0 0.0 2.4 2.4 0.0 0.0 0.0 0.0 0.0 0.0 0.0 0.0 0.0
Cordova 3.5 0.0 3.5 2.7 0.0 2.7 2.7 0.0 2.7 0.0 0.0 0.0 0.0 0.0 0.0nwalek 2.0 0.0 2.0 3.0 2.0 5.0 2.1 0.0 2.1 1.1 0.0 1.1 1.0 0.0 1.0
Graham 0.0 0.0 0.0 1.0 0.0 1.0 6.9 5.6 12.5 0.0 0.0 0.0 0.0 0.0 0.0Seldovia 0.0 0.0 0.0 0.0 0.0 0.0 0.0 0.0 0.0 0.0 0.0 0.0 0.0 0.0 0.0
ard 0.0 0.0 0.0 0.0 0.0 0.0 0.0 0.0 0.0 0.0 0.0 0.0 0.0 0.0 0.0titlek 0.0 0.0 0.0 12.4 1.1 13.5 26.3 10.3 36.6 39.0 9.1 48.1 16.0 8.0 24.0
Valdez 0.0 0.0 0.0 0.0 0.0 0.0 0.0 0.0 0.0 0.0 0.0 0.0 0.0 0.0 0.0UPPER KENAI-COOK
LETnchorage 0.0 0.0 0.0 0.0 0.0 0.0 0.0 0.0 0.0 0.0 0.0 0.0 0.0 0.0 0.0
Homer 0.0 0.0 0.0 0.0 0.0 0.0 0.0 0.0 0.0 0.0 0.0 0.0 0.0 0.0 0.0enai 0.0 0.0 0.0 0.0 0.0 0.0 0.0 0.0 0.0 0.0 0.0 0.0 0.0 0.0 0.0yonek 0.0 0.0 0.0 0.0 0.0 0.0 0.0 0.0 0.0 0.0 0.0 0.0 0.0 0.0 0.0
KODIAK ISLANDkhiok 0.0 0.0 0.0 2.7 1.4 4.1 1.4 0.0 1.4 0.0 0.0 0.0 2.3 0.0 2.3arluk 0.0 0.0 0.0 0.0 0.0 0.0 0.0 0.0 0.0 0.0 0.0 0.0 0.0 0.0 0.0
Kodiak City 2.5 0.0 2.5 0.0 0.0 0.0 0.0 0.0 0.0 0.0 0.0 0.0 0.0 0.0 0.0rsen Bay 0.0 0.0 0.0 0.0 0.0 0.0 0.0 0.0 0.0 0.0 0.0 0.0 0.0 0.0 0.0d Harbor 8.5 0.0 8.5 27.6 4.4 31.9 8.3 3.5 11.8 18.2 3.2 21.4 1.1 0.0 1.1
Ouzinkie 5.1 0.0 5.1 0.0 0.0 0.0 2.6 0.0 2.6 0.0 0.0 0.0 0.0 0.0 0.0rt Lions 0.0 0.0 0.0 0.0 0.0 0.0 1.2 0.0 1.2 3.7 0.0 3.7 3.7 0.0 3.7
20062002 200520042003
CH
HJu
KeK
PPe
SiW
NOCh
NaPort
SewTa
INA
KT
AK
LaOl
Po
85

HarvestStruck
and Lost Take HarvestStruck
and Lost Take HarvestStruck
and Lost Take HarvestStruck
and Lost Take
ommunitySOUTH ALASKA
NSULAChignik Bay 0.0 0.0 0.0 0.0 0.0 0.0 0.0 0.0 0.0 0.0 0.0 0.0
hignik Lagoon 0.0 0.0 0.0 1.1 0.0 1.1 0.0 0.0 0.0 0.0 0.0 0.0hignik Lake 0.0 0.0 0.0 0.0 0.0 0.0 0.0 0.0 0.0 0.0 0.0 0.0
False Pass 0.0 0.0 0.0 0.0 0.0 0.0 0.0 0.0 0.0 0.0 0.0 0.0anof Bay 0.0 0.0 0.0 2.3 1.2 3.5 0.0 0.0 0.0 0.0 0.0 0.0
King Cove 1.3 0.0 1.3 1.2 0.0 1.2 3.2 1.1 4.3 5.0 0.0 5.0ryville 1.1 0.0 1.1 0.0 0.0 0.0 1.4 0.0 1.4 3.1 0.0 3.1d Point 0.0 0.0 0.0 0.0 0.0 0.0 0.0 0.0 0.0 0.0 0.0 0.0
ALEUTIAN ISLANDS dak -- -- -- -- -- -- -- -- -- -- -- --
utan 25.7 4.3 30.0 14.5 8.9 23.4 12.7 3.5 16.2 6.0 0.0 6.0ka 28.6 9.9 38.5 25.1 0.0 25.1 45.5 8.7 54.2 40.0 0.0 40.0ikolski 8.2 0.0 8.2 6.0 0.0 6.0 0.0 0.0 0.0 0.0 0.0 0
Unalaska 41.8 16.7 58.5 53.4 15.9 69.3 43.6 8.4 51.9 39.0 11.1 50.1RIBILOF ISLANDS. George 14.9 55.0 69.9 3.7 14.8 18.6 2.8 17.1 19.9 4.0 4.0 8.0
St. Paul * 161.7 65.2 226.8 161.7 65.2 226.8 147.0 26.4 173.4 53.6 6.3 59.9UTH BRISTOL BAY
Egegik 0.0 0.0 0.0 0.0 0.0 0.0 0.0 0.0 0.0 0.0 0.0 0.0ng Salmon 0.0 0.0 0.0 0.0 0.0 0.0 0.0 0.0 0.0 0.0 0.0 0.0
elock 0.0 0.0 0.0 0.0 0.0 0.0 0.0 0.0 0.0 0.0 0.0 0.0Naknek 0.0 0.0 0.0 0.0 0.0 0.0 0.0 0.0 0.0 0.0 0.0 0
lot Point 0.0 0.0 0.0 0.0 0.0 0.0 0.0 0.0 0.0 0.0 0.0 0.0Port Heiden 0.0 0.0 0.0 0.0 0.0 0.0 0.0 0.0 0.0 0.0 0.0 0.0
outh Naknek 0.0 0.0 0.0 0.0 0.0 0.0 0.0 0.0 0.0 0.0 0.0 0.0ORTH BRISTOL BAY
Aleknagik 0.0 0.0 0.0 0.0 0.0 0.0 0.0 0.0 0.0 0.0 0.0 0.0lark's Point 0.0 0.0 0.0 0.0 0.0 0.0 0.0 0.0 0.0 0.0 0.0 0.0
Dillingham 0.0 0.0 0.0 0.0 0.0 0.0 0.0 0.0 0.0 0.0 0.0 0anokotak 3.9 0.0 3.9 0.0 0.0 0.0 0.0 0.0 0.0 0.0 0.0 0ogiak 3.9 0.0 3.9 3.3 3.3 6.5 1.2 0.0 1.2 0.0 0.0 0
Twin Hills -- -- -- -- -- -- -- -- -- -- -- -t. Paul's 2000 - 2006 data from Zavadil et al. (2006), Lestenkof and Zavadil (2006), and Lestenkof et al. (2007).
By Western Gulf-Bering Sea Communities, 1992 - 2006
Table 24Subsistence Sea Lion Takes by Alaska Natives
1992 1993 1994 1995
C
PENI
CC
Iv
PerSan
AAkAtN .0
.0
.0
.0
.0-
PSt
SO
KiLev
Pi
SN
C
MT
* S
86

87
Table 24 (Continued)Subsistence Sea Lion Takes by Alaska Natives
By Western Gulf-Bering Sea Communities, 1992 - 2006
HarvestStruck
and Lost Take HarvestStruck
and Lost Take HarvestStruck
and Lost Take HarvestStruck
and Lost Take HarvestStruck
and Lost TakeCommunitySOUTH ALASKA PENINSULAChignik Bay 0.0 0.0 0.0 0.0 0.0 0.0 0.0 0.0 0.0 0.0 0.0 0.0 0.0 0.0 0.0Chignik Lagoon 0.0 0.0 0.0 0.0 0.0 0.0 0.0 0.0 0.0 0.0 0.0 0.0 0.0 0.0 0.0Chignik Lake 0.0 0.0 0.0 0.0 0.0 0.0 0.0 0.0 0.0 0.0 0.0 0.0 0.0 0.0 0.0False Pass 0.0 0.0 0.0 0.0 0.0 0.0 0.0 0.0 0.0 0.0 0.0 0.0 0.0 0.0 0.0Ivanof Bay 2.4 0.0 2.4 1.8 0.0 1.8 1.8 0.0 1.8 0.0 0.0 0.0 1.4 1.4 2.8King Cove 0.0 0.0 0.0 4.2 0.0 4.2 4.3 0.0 4.3 4.3 0.0 4.3 3.0 0.0 3.0Perryville 1.3 1.3 2.6 2.3 0.0 2.3 1.1 0.0 1.1 4.5 0.0 4.5 1.1 0.0 1.1Sand Point 0.0 0.0 0.0 0.0 0.0 0.0 2.0 0.0 2.0 5.0 0.0 5.0 4.7 0.0 4.7ALEUTIAN ISLANDSAdak -- -- -- -- -- -- -- -- -- -- -- -- -- -- --Akutan 11.0 5.0 16.0 6.4 0.0 6.4 6.4 0.0 6.4 4.1 1.4 5.4 15.0 2.7 17.7Atka 17.3 0.0 17.3 12.2 0.0 12.2 16.8 0.0 16.8 16.8 0.0 16.8 33.3 11.7 45.0Nikolski 3.0 0.0 3.0 3.0 0.0 3.0 1.1 0.0 1.1 1.1 0.0 1.1 6.7 0.0 6.7Unalaska 15.2 6.3 21.6 29.1 1.3 30.3 7.3 5.5 12.7 49.2 3.4 52.6 23.1 5.3 28.4PRIBILOF ISLANDSSt. George 4.0 4.0 8.0 19.6 8.1 27.7 11.8 8.5 20.3 11.8 8.5 20.3 7.0 7.0 14.0St. Paul * 28.2 10.2 38.4 25.9 2.3 28.2 41.0 16.9 57.8 17.3 5.7 23.0 12.0 12.0 24.0SOUTH BRISTOL BAYEgegik 0.0 0.0 0.0 0.0 0.0 0.0 0.0 0.0 0.0 0.0 0.0 0.0 0.0 0.0 0.0King Salmon 0.0 0.0 0.0 0.0 0.0 0.0 0.0 0.0 0.0 0.0 0.0 0.0 0.0 0.0 0.0Levelock 0.0 0.0 0.0 0.0 0.0 0.0 0.0 0.0 0.0 0.0 0.0 0.0 0.0 0.0 0.0Naknek 0.0 0.0 0.0 0.0 0.0 0.0 0.0 0.0 0.0 0.0 0.0 0.0 0.0 0.0 0.0Pilot Point 0.0 0.0 0.0 0.0 0.0 0.0 0.0 0.0 0.0 0.0 0.0 0.0 0.0 0.0 0.0Port Heiden 0.0 0.0 0.0 0.0 0.0 0.0 0.0 0.0 0.0 0.0 0.0 0.0 0.0 0.0 0.0South Naknek 0.0 0.0 0.0 0.0 0.0 0.0 0.0 0.0 0.0 0.0 0.0 0.0 0.0 0.0 0.0NORTH BRISTOL BAYAleknagik 0.0 0.0 0.0 0.0 0.0 0.0 0.0 0.0 0.0 0.0 0.0 0.0 0.0 0.0 0.0Clark's Point 0.0 0.0 0.0 0.0 0.0 0.0 0.0 0.0 0.0 0.0 0.0 0.0 0.0 0.0 0.0Dillingham 0.0 0.0 0.0 0.0 0.0 0.0 0.0 0.0 0.0 0.0 0.0 0.0 0.0 0.0 0.0Manokotak 0.0 0.0 0.0 0.0 0.0 0.0 0.0 0.0 0.0 0.0 0.0 0.0 0.0 0.0 0.0Togiak 0.0 0.0 0.0 3.6 0.0 3.6 0.0 0.0 0.0 0.0 0.0 0.0 0.0 0.0 0.0Twin Hills 0.0 0.0 0.0 0.0 0.0 0.0 0.0 0.0 0.0 0.0 0.0 0.0 0.0 0.0 0.0* St. Paul's 2000 - 2006 data from Zavadil et al. (2006), Lestenkof and Zavadil (2006), and Lestenkof et al. (2007).
1996 1997 1998 2000 2001
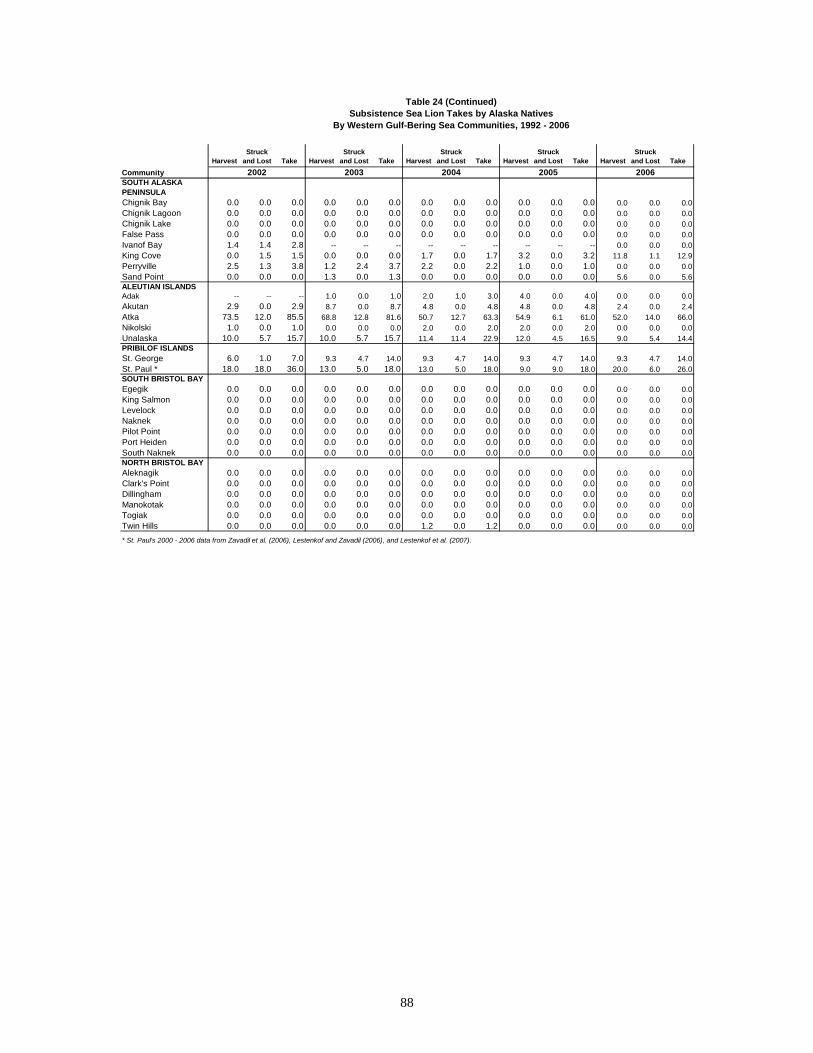
88
Table 24 (Continued)Subsistence Sea Lion Takes by Alaska Natives
By Western Gulf-Bering Sea Communities, 1992 - 2006
HarvestStruck
and Lost Take HarvestStruck
and Lost Take HarvestStruck
and Lost Take HarvestStruck
and Lost Take HarvestStruck
and Lost TakeCommunity 2005SOUTH ALASKA PENINSULAChignik Bay 0.0 0.0 0.0 0.0 0.0 0.0 0.0 0.0 0.0 0.0 0.0 0.0 0.0 0.0 0.0Chignik Lagoon 0.0 0.0 0.0 0.0 0.0 0.0 0.0 0.0 0.0 0.0 0.0 0.0 0.0 0.0 0.0Chignik Lake 0.0 0.0 0.0 0.0 0.0 0.0 0.0 0.0 0.0 0.0 0.0 0.0 0.0 0.0 0.0False Pass 0.0 0.0 0.0 0.0 0.0 0.0 0.0 0.0 0.0 0.0 0.0 0.0 0.0 0.0 0.0Ivanof Bay 1.4 1.4 2.8 -- -- -- -- -- -- -- -- -- 0.0 0.0 0.0King Cove 0.0 1.5 1.5 0.0 0.0 0.0 1.7 0.0 1.7 3.2 0.0 3.2 11.8 1.1 12.9Perryville 2.5 1.3 3.8 1.2 2.4 3.7 2.2 0.0 2.2 1.0 0.0 1.0 0.0 0.0 0.0Sand Point 0.0 0.0 0.0 1.3 0.0 1.3 0.0 0.0 0.0 0.0 0.0 0.0 5.6 0.0 5.6ALEUTIAN ISLANDSAdak -- -- -- 1.0 0.0 1.0 2.0 1.0 3.0 4.0 0.0 4.0 0.0 0.0 0.0Akutan 2.9 0.0 2.9 8.7 0.0 8.7 4.8 0.0 4.8 4.8 0.0 4.8 2.4 0.0 2.4Atka 73.5 12.0 85.5 68.8 12.8 81.6 50.7 12.7 63.3 54.9 6.1 61.0 52.0 14.0 66.0Nikolski 1.0 0.0 1.0 0.0 0.0 0.0 2.0 0.0 2.0 2.0 0.0 2.0 0.0 0.0 0.0Unalaska 10.0 5.7 15.7 10.0 5.7 15.7 11.4 11.4 22.9 12.0 4.5 16.5 9.0 5.4 14.4PRIBILOF ISLANDSSt. George 6.0 1.0 7.0 9.3 4.7 14.0 9.3 4.7 14.0 9.3 4.7 14.0 9.3 4.7 14.0St. Paul * 18.0 18.0 36.0 13.0 5.0 18.0 13.0 5.0 18.0 9.0 9.0 18.0 20.0 6.0 26.0SOUTH BRISTOL BAYEgegik 0.0 0.0 0.0 0.0 0.0 0.0 0.0 0.0 0.0 0.0 0.0 0.0 0.0 0.0 0.0King Salmon 0.0 0.0 0.0 0.0 0.0 0.0 0.0 0.0 0.0 0.0 0.0 0.0 0.0 0.0 0.0Levelock 0.0 0.0 0.0 0.0 0.0 0.0 0.0 0.0 0.0 0.0 0.0 0.0 0.0 0.0 0.0Naknek 0.0 0.0 0.0 0.0 0.0 0.0 0.0 0.0 0.0 0.0 0.0 0.0 0.0 0.0 0.0Pilot Point 0.0 0.0 0.0 0.0 0.0 0.0 0.0 0.0 0.0 0.0 0.0 0.0 0.0 0.0 0.0Port Heiden 0.0 0.0 0.0 0.0 0.0 0.0 0.0 0.0 0.0 0.0 0.0 0.0 0.0 0.0 0.0South Naknek 0.0 0.0 0.0 0.0 0.0 0.0 0.0 0.0 0.0 0.0 0.0 0.0 0.0 0.0 0.0NORTH BRISTOL BAYAleknagik 0.0 0.0 0.0 0.0 0.0 0.0 0.0 0.0 0.0 0.0 0.0 0.0 0.0 0.0 0.0Clark's Point 0.0 0.0 0.0 0.0 0.0 0.0 0.0 0.0 0.0 0.0 0.0 0.0 0.0 0.0 0.0Dillingham 0.0 0.0 0.0 0.0 0.0 0.0 0.0 0.0 0.0 0.0 0.0 0.0 0.0 0.0 0.0Manokotak 0.0 0.0 0.0 0.0 0.0 0.0 0.0 0.0 0.0 0.0 0.0 0.0 0.0 0.0 0.0Togiak 0.0 0.0 0.0 0.0 0.0 0.0 0.0 0.0 0.0 0.0 0.0 0.0 0.0 0.0 0.0Twin Hills 0.0 0.0 0.0 0.0 0.0 0.0 1.2 0.0 1.2 0.0 0.0 0.0 0.0 0.0 0.0
* St. Paul's 2000 - 2006 data from Zavadil et al. (2006), Lestenkof and Zavadil (2006), and Lestenkof et al. (2007).
2006200420032002

Table 25
Seal Harvests by Strata for Communities With Two Strata Designs, 2006
Community HarvestStruck and
Lost Take HarvestStruck and
Lost TakeDillingham high stratum 9 0 9 15.2 0.0 15.2
low stratum 0 1 1 0.0 1.0 1.0Manokotak high stratum 28 10 38 28.9 10.3 39.2
low stratum 19 6 25 23.6 7.5 31.1Naknek high stratum 14 7 21 15.1 7.5 22.6
low stratum 0 0 0 0.0 0.0 0.0Togiak high stratum 43 6 49 45.0 6.3 51.3
low stratum 16 1 17 17.4 1.1 18.5
Table 26Sea Lion Harvests by Strata
for Communities With Two Strata Designs, 2006
Community HarvestStruck and
Lost Take HarvestStruck and
Lost TakeDillingham high stratum 0 0 0 0.0 0.0 0.0
low stratum 0 0 0 0.0 0.0 0.0Manokotak high stratum 0 0 0 0.0 0.0 0.0
low stratum 0 0 0 0.0 0.0 0.0Naknek high stratum 0 0 0 0.0 0.0 0.0
low stratum 0 0 0 0.0 0.0 0.0Togiak high stratum 0 0 0 0.0 0.0 0.0
low stratum 0 0 0 0.0 0.0 0.0
Reported by Sample Expanded
Reported by Sample Expanded
89

REFERENCES Bigg, M. A. 1969. The harbour seal in British Columbia. Research Bulletin No. 172,
Fisheries Research Board of Canada, Ottawa. Burns, J. J., K. J. Frost, and L. F. Lowry, editors. 1985. Marine mammal species
accounts. Game Technical Bulletin No. 7, Alaska Department of Fish and Game, Juneau.
Cochran, W. G. 1977 Sampling techniques. Third Edition. John Wiley and Sons, New
York. Lestenkof, A. D. and P. A. Zavadil. 2001. 1999–2000 Steller sea lion subsistence
hunting report. Ecosystem Conservation Office, Tribal Government, Aleut Community of St. Paul Island, Alaska.
Lestenkof, A. D. and P. A. Zavadil. 2006. 2005 subsistence harvest of Steller sea lions
on St. Paul Island, memorandum for the record. August 31, 2006 letter to Michael T. Williams, National Oceanic and Atmospheric Administration from Ecosystem Conservation Office, Tribal Government, Aleut Community of St. Paul Island, Alaska.
Lestenkof, A. D., P. A. Zavadil, and D. J. Jones. 2007. 2006 subsistence harvest of
Steller sea lions on St. Paul Island: memorandum for the record. April 11, 2007, letter to Michael T. Williams, National Oceanic and Atmospheric Administration from Ecosystem Conservation Office, . Tribal Government, Aleut Community of St. Paul Island, Alaska.
Lestenkof, A. D., P. A. Zavadil, and M. T. Williams. 2003. The subsistence harvest of
Steller sea lions on St. Paul Island in 2001. Annual report provided to the National Marine Fisheries Service under contract NA16FX1420. National Marine Mammal Laboratory, Seattle, Washington.
Pitcher, K W. and D. G. Calkins. 1979. Biology of the harbor seal, Phoca vitulina
richardsi, in the Gulf of Alaska. Outer Continental Shelf Environmental Assessment Program, Bureau of Land Management, U.S. Department of the Interior, Anchorage.
Wolfe, R. J. 2001. The subsistence harvest of harbor seals and sea lions by Alaska
Natives in 2000. Alaska Department of Fish and Game Division of Subsistence Technical Paper No. 266, Juneau.
Wolfe, R. J., J. A. Fall, and R. T. Stanek. 2002. The subsistence harvest of harbor
seals and sea lions by Alaska Natives in 2001. Alaska Department of Fish and Game Division of Subsistence Technical Paper No. 273, Juneau.
Wolfe, R. J., J. A. Fall, and R. T. Stanek. 2003. The subsistence harvest of harbor
seals and sea lions by Alaska Natives in 2002. Alaska Department of Fish and Game Division of Subsistence Technical Paper No. 277, Juneau.
Wolfe, R. J., J. A. Fall, and R. T. Stanek. 2004. The subsistence harvest of harbor seal
and sea lion by Alaska Natives in 2003. Alaska Department of Fish and Game Division of Subsistence Technical Paper No. 291, Juneau.
90

Wolfe, R. J., J. A. Fall, and R. T. Stanek. 2005. The subsistence harvest of harbor
seals and sea lions by Alaska Natives in 2004. Alaska Department of Fish and Game Division of Subsistence Technical Paper No. 303, Juneau.
Wolfe, R. J., J. A. Fall, and R. T. Stanek. 2006. The subsistence harvest of harbor
seals and sea lions by Alaska Natives in 2005. Alaska Department of Fish and Game Division of Subsistence Technical Paper No. 319, Juneau.
Wolfe, R. J. and C. Mishler. 1993. The subsistence harvest of harbor seal and sea lion
by Alaska Natives in 1992. Alaska Department of Fish and Game Division of Subsistence Technical Paper No. 229, Juneau.
Wolfe, R. J. and C. Mishler. 1994. The subsistence harvest of harbor seal and sea lion
by Alaska Natives in 1993. Alaska Department of Fish and Game Division of Subsistence Technical Paper No. 233, Juneau.
Wolfe, R. J. and C. Mishler. 1995. The subsistence harvest of harbor seal and sea lion
by Alaska Natives in 1994. Alaska Department of Fish and Game Division of Subsistence Technical Paper No. 236, Juneau.
Wolfe, R. J. and C. Mishler. 1996. The subsistence harvest of harbor seal and sea lion
by Alaska Natives in 1995. Alaska Department of Fish and Game Division of Subsistence Technical Paper No. 238, Juneau.
Wolfe, R. J. and C. Mishler. 1997. The subsistence harvest of harbor seal and sea lion
by Alaska Natives in 1996. Alaska Department of Fish and Game Division of Subsistence Technical Paper No. 241, Juneau.
Wolfe, R. J. and C. Mishler. 1998. The subsistence harvest of harbor seal and sea lion
by Alaska Natives in 1997. Alaska Department of Fish and Game Division of Subsistence Technical Paper No. 246, Juneau.
Wolfe, R. J. and L. B. Hutchinson-Scarbrough. 1999. The subsistence harvest of harbor
seal and sea lion by Alaska Natives in 1998. Alaska Department of Fish and Game Division of Subsistence Technical Paper No. 250, Juneau.
Wolfe, R. J., M. Kookesh, A. W. Paige, C. Scott, M. Smith, M. Turek, and C. J.
Utermohle. 1999 Survey methodologies and reported sex compositions of harbor seal harvests of Alaska Natives, 1995–1997. Alaska Department of Fish and Game Division of Subsistence Technical Paper No. 254, Juneau.
Zavadil, P. A., A. D. Lestenkof, M. T. Williams, and S. A. MacLean. 2003. The
subsistence harvest of Steller sea lions on St. Paul Island in 2002. Unpublished report available from the Aleut Community of St. Paul Island, Alaska.
Zavadil, P. A., A. D. Lestenkof, D. Jones, P. G. Tetoff, and M. T. Williams. 2004. The
subsistence harvest of Steller sea lions on St. Paul Island in 2003. Unpublished report available from the Aleut Community of St. Paul Island, Alaska.
Zavadil, P. A., D. Jones, A. D. Lestenkof, P. G. Tetoff, and B. W. Robson. 2006. The
subsistence harvest of Steller sea lions on St. Paul Island in 2004. Unpublished report available from the Aleut Community of St. Paul Island, Alaska.
91

92
APPENDIX A
SURVEY INSTRUMENT USED IN HOUSEHOLD INTERVIEWS, 2006

HARBOR SEAL Are any members of your household Alaska Natives? Yes (___) No (___) If No, thank you for your cooperation. This survey is relevant to Native households.
If yes, how many people lived in your household in 2005? (_____) CHECK IF APPROPRIATE No Contact (_____)
Hunting location: If you hunted outside your region, where did you hunt? (____________________________________)DID YOU OR MEMBERS OF YOUR HOUSEHOLD HUNT OR USE HARBOR SEALS IN 2005? Yes ____ No ____ DID YOUR HOUSEHOLD HUNT/USE SEA LIONS IN 2005?
No ____, Thank you Yes ____, Go to Sea lion form
During 2005, did you or your household: Yes No1. Use harbor seals (meat, hides, or oil)?. . . . . . . . . . . . . . . . . . . 2. Hunt harbor seals? . . . . . . . . . . . . . . . . . . . . . . . . . . . . .3. Kill and retrieve harbor seals? . . . . . . . . . . . . . . . . . . . . . . . 4. Receive harbor seals from other households or communities?5. Give away harbor seals to other households or communities?
IF YES TO QUESTION 2 OR 3 ABOVE, GO TO QUESTION 6. IF NO, COMPLETE SEA LION SURVEY.6. How many harbor seals did your household kill and retrieve? [Enter in total box.]7. In which months were they killed and retrieved? How many in (January, etc.)? [Enter the numbers by month.]
HARBOR SEAL JANUARY FEBRUARY MARCH APRIL MAY JUNE JULY AUGUST SEPTEMBER OCTOBER NOVEMBER DECEMBER UNKNOWN TOTAL
TOTAL8. Of the harbor seals killed and retrieved in (January, etc.), how many were male, female, and how many were pups, juveniles, or adults?
[Enter the numbers by month.]HARBOR SEAL (Detail) JANUARY FEBRUARY MARCH APRIL MAY JUNE JULY AUGUST SEPTEMBER OCTOBER NOVEMBER DECEMBER UNKNOWN TOTAL
MALEADULT FEMALE
UNKNOWNMALE
JUVENILE FEMALEUNKNOWN
MALEPUP FEMALE
UNKNOWNUNKNOWN MALEAGE FEMALE
UNKNOWNDuring 2005, 9. How many harbor seal were struck and lost by your household? [Enter number in total box.]
10. In which months were they struck and lost? [Enter numbers by month.]
HARBOR SEAL JANUARY FEBRUARY MARCH APRIL MAY JUNE JULY AUGUST SEPTEMBER OCTOBER NOVEMBER DECEMBER UNKNOWN TOTAL
STRUCK AND LOST
Community: ____________________(_______) HHID: (______) List: Hunter Random Interviewer: __________ Date: ______
Alaska Native Harbor Seal Commission 354-0554 ADF&G, Division of Subsistence 267-2362 Aleut Marine Mammal Commission 581-5324
(IF YES TO HARBOR SEALS, COMPLETE THE FOLLOWING QUESTIONS:)
2005 MARINE MAMMAL SURVEY
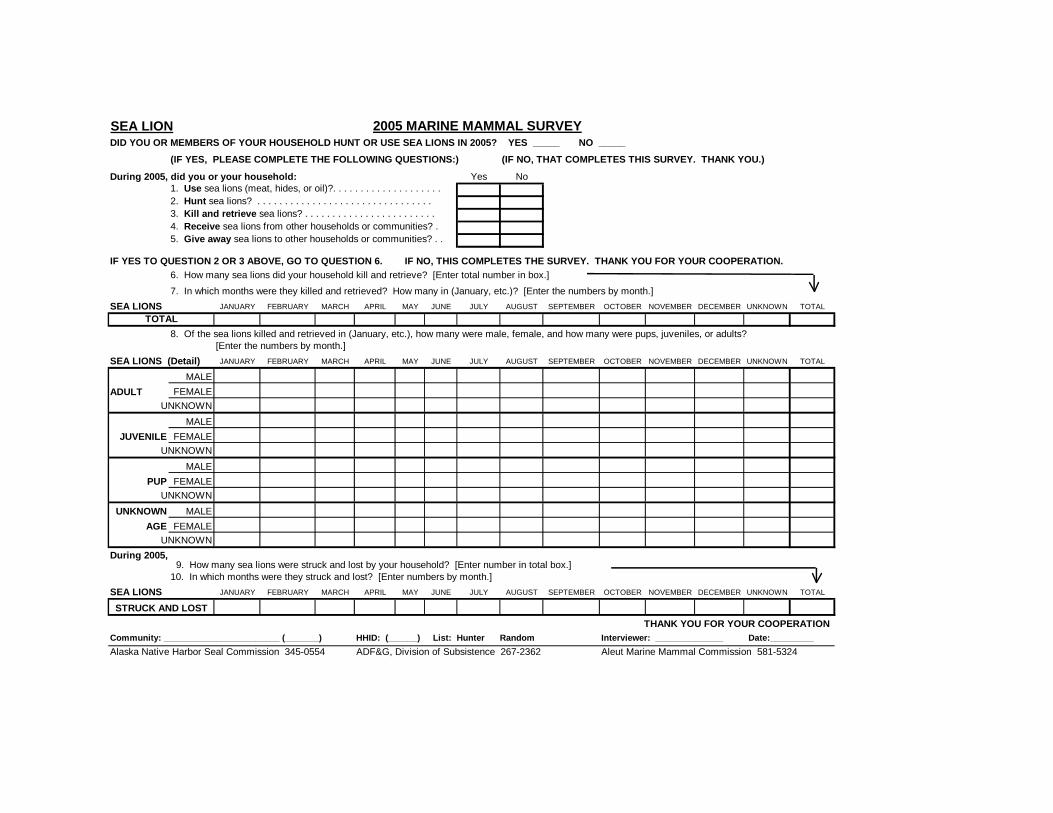
SEA LIONDID YOU OR MEMBERS OF YOUR HOUSEHOLD HUNT OR USE SEA LIONS IN 2005? YES _____ NO _____
(IF YES, PLEASE COMPLETE THE FOLLOWING QUESTIONS:) (IF NO, THAT COMPLETES THIS SURVEY. THANK YOU.)
During 2005, did you or your household: Yes No1. Use sea lions (meat, hides, or oil)?. . . . . . . . . . . . . . . . . . . .2. Hunt sea lions? . . . . . . . . . . . . . . . . . . . . . . . . . . . . . . . . 3. Kill and retrieve sea lions? . . . . . . . . . . . . . . . . . . . . . . . .4. Receive sea lions from other households or communities? .5. Give away sea lions to other households or communities? . .
IF YES TO QUESTION 2 OR 3 ABOVE, GO TO QUESTION 6. IF NO, THIS COMPLETES THE SURVEY. THANK YOU FOR YOUR COOPERATION.6. How many sea lions did your household kill and retrieve? [Enter total number in box.]
7. In which months were they killed and retrieved? How many in (January, etc.)? [Enter the numbers by month.]SEA LIONS JANUARY FEBRUARY MARCH APRIL MAY JUNE JULY AUGUST SEPTEMBER OCTOBER NOVEMBER DECEMBER UNKNOWN TOTAL
TOTAL8. Of the sea lions killed and retrieved in (January, etc.), how many were male, female, and how many were pups, juveniles, or adults?
[Enter the numbers by month.]SEA LIONS (Detail) JANUARY FEBRUARY MARCH APRIL MAY JUNE JULY AUGUST SEPTEMBER OCTOBER NOVEMBER DECEMBER UNKNOWN TOTAL
MALEADULT FEMALE
UNKNOWNMALE
JUVENILE FEMALEUNKNOWN
MALEPUP FEMALE
UNKNOWNUNKNOWN MALE
AGE FEMALEUNKNOWN
During 2005, 9. How many sea lions were struck and lost by your household? [Enter number in total box.]10. In which months were they struck and lost? [Enter numbers by month.]
SEA LIONS JANUARY FEBRUARY MARCH APRIL MAY JUNE JULY AUGUST SEPTEMBER OCTOBER NOVEMBER DECEMBER UNKNOWN TOTAL
STRUCK AND LOSTTHANK YOU FOR YOUR COOPERATION
Community: ________________________ (_______) HHID: (______) List: Hunter Random Interviewer: ______________ Date:_________Alaska Native Harbor Seal Commission 345-0554 ADF&G, Division of Subsistence 267-2362 Aleut Marine Mammal Commission 581-5324
2005 MARINE MAMMAL SURVEY

APPENDIX B
SUBSISTENCE TAKES OF HARBOR SEAL AND SEA LION
BY REGION
1-2 SOUTHEAST ALASKA 3-4 NORTH PACIFIC RIM 5-6 UPPER KENAI - COOK INLET 7-8 KODIAK ISLAND 9-10 SOUTH ALASKA PENINSULA 11-12 ALEUTIAN ISLANDS 13-14 PRIBILOF ISLANDS 15-16 SOUTH BRISTOL BAY 17-18 NORTH BRISTOL BAY


Table 1. SEA LION AND HARBOR SEAL HARVESTS: SOUTHEAST ALASKA, 2006
SAMPLING DESIGN: TotalCHAIN REFERRAL Total Referred Households 411
Surveyed Households 351Sampling Fraction 85.4%
Sample Household Members 1064Estimated Household Members 1239.4
2000 U.S. Census Estimated Native Population 14070
HARVEST AND USE INFORMATION
Percentage of Native Households: Estimated Community Harvest Sea Harbor and Take (Expanded): Sea Harbor
Lion Seal Lion SealUsed N/A N/A Total Number Harvested 2.5 592.7
Hunted N/A N/A Total Number Struck and Lost 10.1 114.8Harvested N/A N/A Total Number Taken 12.6 707.6Received N/A N/A
Gave Away N/A N/A Number Harvested Per Capita 0.00 0.04
SEA LION HARVEST BY MONTH UnknownJan Feb Mar Apr May Jun Jul Aug Sep Oct Nov Dec Month Total
REPORTED HARVEST AND TAKE BY SAMPLED HOUSEHOLDS (UNEXPANDED)Harvest 0 0 0 1 0 0 0 0 1 0 0 0 0 2Struck & Lost 0 0 0 0 0 0 0 0 0 3 3 0 2 8Total Take 0 0 0 1 0 0 0 0 1 3 3 0 2 10ESTIMATED HARVEST AND TAKE BY COMMUNITY (EXPANDED)Harvest 0.0 0.0 0.0 1.2 0.0 0.0 0.0 0.0 1.4 0.0 0.0 0.0 0.0 2.5Struck & Lost 0.0 0.0 0.0 0.0 0.0 0.0 0.0 0.0 0.0 3.8 3.8 0.0 2.5 10.1Total Take 0.0 0.0 0.0 1.2 0.0 0.0 0.0 0.0 1.4 3.8 3.8 0.0 2.5 12.6ESTIMATED SEASONALLY ADJUSTED HARVEST AND TAKE BY COMMUNITY (EXPANDED)Harvest 0.0 0.0 0.0 1.2 0.0 0.0 0.0 0.0 1.4 0.0 0.0 0.0 2.5Struck & Lost 0.0 0.0 0.0 0.0 0.0 0.0 0.0 0.0 0.0 5.1 5.1 0.0 10.1Total Take 0.0 0.0 0.0 1.2 0.0 0.0 0.0 0.0 1.4 5.1 5.1 0.0 12.6Total Take (%) 0.0% 0.0% 0.0% 9.2% 0.0% 0.0% 0.0% 0.0% 10.9% 40.0% 40.0% 0.0% 100%Cum. Take 0.0 0.0 0.0 1.2 1.2 1.2 1.2 1.2 2.5 7.6 12.6 12.6Cum. Take (%) 0.0% 0.0% 0.0% 9.2% 9.2% 9.2% 9.2% 9.2% 20.1% 60.0% 100.0% 100.0%
HARBOR SEAL HARVEST BY MONTH UnknownJan Feb Mar Apr May Jun Jul Aug Sep Oct Nov Dec Month Total
REPORTED HARVEST AND TAKE BY SAMPLED HOUSEHOLDS (UNEXPANDED)Harvest 21 35 63 52 13 26 26 32 37 69 83 52 3 512Struck & Lost 2 3 13 6 3 7 7 12 4 8 13 17 4 99Total Take 23 38 76 58 16 33 33 44 41 77 96 69 7 611ESTIMATED HARVEST AND TAKE BY COMMUNITY (EXPANDED)Harvest 23.0 38.8 72.8 59.4 14.9 29.0 30.1 35.7 41.7 83.0 99.3 60.2 5.0 592.7Struck & Lost 2.0 3.0 17.4 6.8 3.3 7.9 8.3 15.5 4.5 8.6 13.7 19.8 4.1 114.8Total Take 25.1 41.8 90.2 66.2 18.2 36.9 38.4 51.2 46.2 91.5 112.9 80.0 9.0 707.6ESTIMATED SEASONALLY ADJUSTED HARVEST AND TAKE BY COMMUNITY (EXPANDED)Harvest 23.0 39.2 73.2 59.8 14.9 29.0 30.1 35.7 41.9 84.4 100.9 60.7 592.7Struck & Lost 2.6 3.9 17.4 7.0 3.3 7.9 8.3 15.5 4.5 9.6 14.2 20.6 114.8Total Take 25.6 43.0 90.6 66.9 18.2 36.9 38.4 51.2 46.5 94.0 115.1 81.3 707.6Total Take (%) 3.6% 6.1% 12.8% 9.5% 2.6% 5.2% 5.4% 7.2% 6.6% 13.3% 16.3% 11.5% 100%Cum. Take 25.6 68.6 159.2 226.1 244.3 281.2 319.6 370.7 417.2 511.2 626.3 707.6Cum. Take (%) 3.6% 9.7% 22.5% 32.0% 34.5% 39.7% 45.2% 52.4% 59.0% 72.3% 88.5% 100.0% SOURCE: SAIFWC Household Surveys, 2007.
B-1
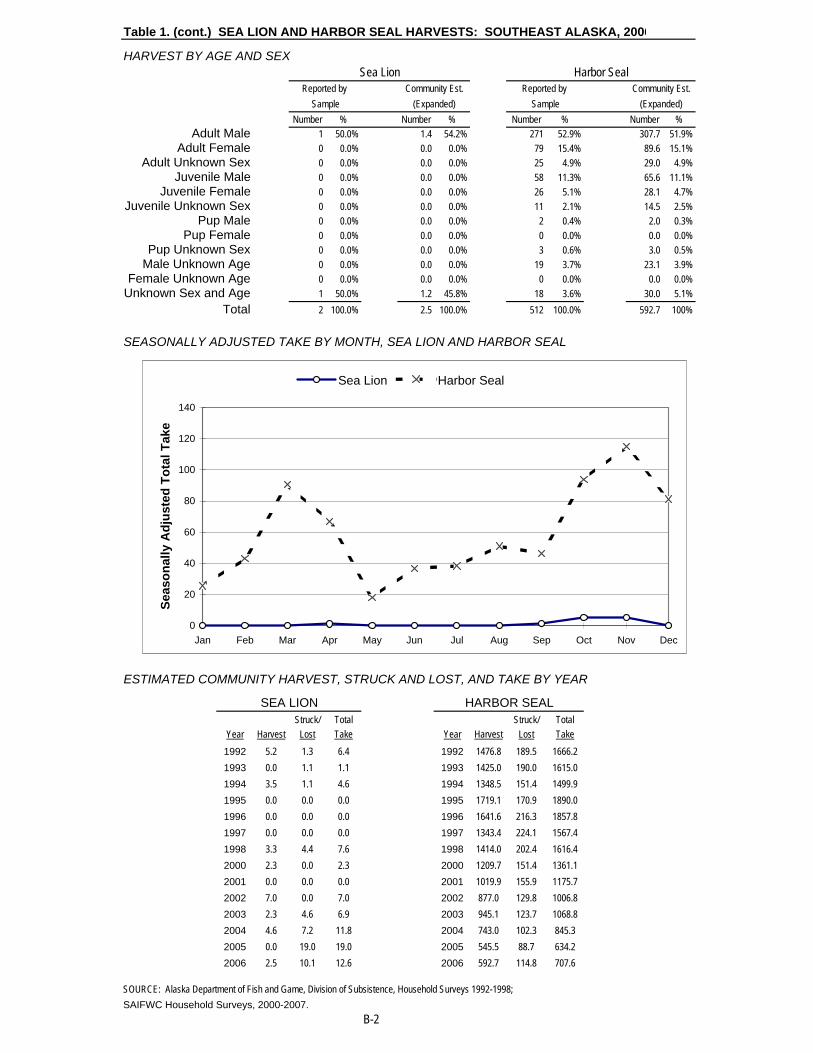
Table 1. (cont.) SEA LION AND HARBOR SEAL HARVESTS: SOUTHEAST ALASKA, 2006
HARVEST BY AGE AND SEXSea Lion Harbor Seal
Reported by Community Est. Reported by Community Est.Sample (Expanded) Sample (Expanded)
Number % Number % Number % Number %Adult Male 1 50.0% 1.4 54.2% 271 52.9% 307.7 51.9%
Adult Female 0 0.0% 0.0 0.0% 79 15.4% 89.6 15.1%Adult Unknown Sex 0 0.0% 0.0 0.0% 25 4.9% 29.0 4.9%
Juvenile Male 0 0.0% 0.0 0.0% 58 11.3% 65.6 11.1%Juvenile Female 0 0.0% 0.0 0.0% 26 5.1% 28.1 4.7%
Juvenile Unknown Sex 0 0.0% 0.0 0.0% 11 2.1% 14.5 2.5%Pup Male 0 0.0% 0.0 0.0% 2 0.4% 2.0 0.3%
Pup Female 0 0.0% 0.0 0.0% 0 0.0% 0.0 0.0%Pup Unknown Sex 0 0.0% 0.0 0.0% 3 0.6% 3.0 0.5%
Male Unknown Age 0 0.0% 0.0 0.0% 19 3.7% 23.1 3.9%Female Unknown Age 0 0.0% 0.0 0.0% 0 0.0% 0.0 0.0%
Unknown Sex and Age 1 50.0% 1.2 45.8% 18 3.6% 30.0 5.1%Total 2 100.0% 2.5 100.0% 512 100.0% 592.7 100%
SEASONALLY ADJUSTED TAKE BY MONTH, SEA LION AND HARBOR SEAL
ESTIMATED COMMUNITY HARVEST, STRUCK AND LOST, AND TAKE BY YEAR
SEA LION HARBOR SEALStruck/ Total Struck/ Total
Year Harvest Lost Take Year Harvest Lost Take1992 5.2 1.3 6.4 1992 1476.8 189.5 1666.21993 0.0 1.1 1.1 1993 1425.0 190.0 1615.01994 3.5 1.1 4.6 1994 1348.5 151.4 1499.91995 0.0 0.0 0.0 1995 1719.1 170.9 1890.01996 0.0 0.0 0.0 1996 1641.6 216.3 1857.81997 0.0 0.0 0.0 1997 1343.4 224.1 1567.41998 3.3 4.4 7.6 1998 1414.0 202.4 1616.42000 2.3 0.0 2.3 2000 1209.7 151.4 1361.12001 0.0 0.0 0.0 2001 1019.9 155.9 1175.72002 7.0 0.0 7.0 2002 877.0 129.8 1006.82003 2.3 4.6 6.9 2003 945.1 123.7 1068.82004 4.6 7.2 11.8 2004 743.0 102.3 845.32005 0.0 19.0 19.0 2005 545.5 88.7 634.22006 2.5 10.1 12.6 2006 592.7 114.8 707.6
SOURCE: Alaska Department of Fish and Game, Division of Subsistence, Household Surveys 1992-1998;SAIFWC Household Surveys, 2000-2007.
B-2
0
20
40
60
80
100
120
140
Jan Feb Mar Apr May Jun Jul Aug Sep Oct Nov Dec
Seas
onal
ly A
djus
ted
Tota
l Tak
e
Sea Lion Harbor Seal

Table 2. SEA LION AND HARBOR SEAL HARVESTS: NORTH PACIFIC RIM, 2006
SAMPLING DESIGN: Active Other TotalMIXED Total Household Universe 32 131 163
Surveyed Households 18 92 110Sampling Fraction 56.3% 70.2% 67.5%
Sample Household Members 48 294 342Estimated Household Members 88.1 391.2 479.3
2000 U.S. Census Estimated Native Population --- --- 2094HARVEST AND USE INFORMATION
Percentage of Native Households: Estimated Community Harvest Sea Harbor and Take (Expanded): Sea Harbor
Lion Seal Lion SealUsed N/A N/A Total Number Harvested 17.0 411.1
Hunted N/A N/A Total Number Struck and Lost 8.0 29.7Harvested N/A N/A Total Number Taken 25.0 440.8Received N/A N/A
Gave Away N/A N/A Number Harvested Per Capita 0.01 0.20
SEA LION HARVEST BY MONTH UnknownJan Feb Mar Apr May Jun Jul Aug Sep Oct Nov Dec Month Total
REPORTED HARVEST AND TAKE BY SAMPLED HOUSEHOLDS (UNEXPANDED)Harvest 2 2 2 0 0 0 0 0 0 2 3 0 2 13Struck & Lost 0 3 2 1 0 0 0 0 0 0 0 0 0 6Total Take 2 5 4 1 0 0 0 0 0 2 3 0 2 19ESTIMATED HARVEST AND TAKE BY COMMUNITY (EXPANDED)Harvest 2.7 2.7 2.7 0.0 0.0 0.0 0.0 0.0 0.0 2.7 3.7 0.0 2.7 17.0Struck & Lost 0.0 4.0 2.7 1.3 0.0 0.0 0.0 0.0 0.0 0.0 0.0 0.0 0.0 8.0Total Take 2.7 6.7 5.3 1.3 0.0 0.0 0.0 0.0 0.0 2.7 3.7 0.0 2.7 25.0ESTIMATED SEASONALLY ADJUSTED HARVEST AND TAKE BY COMMUNITY (EXPANDED)Harvest 3.2 3.2 3.2 0.0 0.0 0.0 0.0 0.0 0.0 3.2 4.2 0.0 17.0Struck & Lost 0.0 4.0 2.7 1.3 0.0 0.0 0.0 0.0 0.0 0.0 0.0 0.0 8.0Total Take 3.2 7.2 5.9 1.3 0.0 0.0 0.0 0.0 0.0 3.2 4.2 0.0 25.0Total Take (%) 12.8% 28.8% 23.4% 5.3% 0.0% 0.0% 0.0% 0.0% 0.0% 12.8% 16.9% 0.0% 100%Cum. Take 3.2 10.4 16.3 17.6 17.6 17.6 17.6 17.6 17.6 20.8 25.0 25.0Cum. Take (%) 12.8% 41.6% 65.0% 70.3% 70.3% 70.3% 70.3% 70.3% 70.3% 83.1% 100.0% 100.0%
HARBOR SEAL HARVEST BY MONTH UnknownJan Feb Mar Apr May Jun Jul Aug Sep Oct Nov Dec Month Total
REPORTED HARVEST AND TAKE BY SAMPLED HOUSEHOLDS (UNEXPANDED)Harvest 19 17 13 12 11 24 33 23 28 10 11 33 39 273Struck & Lost 1 1 0 0 1 4 4 3 4 0 1 2 0 21Total Take 20 18 13 12 12 28 37 26 32 10 12 35 39 294ESTIMATED HARVEST AND TAKE BY COMMUNITY (EXPANDED)Harvest 26.4 22.4 17.1 17.2 15.3 33.0 47.3 34.7 37.4 14.6 14.7 79.0 52.0 411.1Struck & Lost 1.3 1.3 0.0 0.0 1.3 4.4 4.7 4.0 5.2 0.0 1.3 6.0 0.0 29.7Total Take 27.7 23.7 17.1 17.2 16.6 37.4 52.0 38.7 42.7 14.6 16.0 85.0 52.0 440.8ESTIMATED SEASONALLY ADJUSTED HARVEST AND TAKE BY COMMUNITY (EXPANDED)Harvest 31.3 27.0 20.4 21.0 19.5 38.0 52.7 39.3 41.6 17.9 19.2 83.2 411.1Struck & Lost 1.3 1.3 0.0 0.0 1.3 4.4 4.7 4.0 5.2 0.0 1.3 6.0 29.7Total Take 32.7 28.3 20.4 21.0 20.8 42.4 57.4 43.3 46.8 17.9 20.6 89.2 440.8Total Take (%) 7.4% 6.4% 4.6% 4.8% 4.7% 9.6% 13.0% 9.8% 10.6% 4.1% 4.7% 20.2% 100%Cum. Take 32.7 61.0 81.4 102.4 123.2 165.6 223.0 266.3 313.1 331.1 351.6 440.8Cum. Take (%) 7.4% 13.8% 18.5% 23.2% 27.9% 37.6% 50.6% 60.4% 71.0% 75.1% 79.8% 100.0% SOURCE: ANHSC Household Surveys, 2007.
B-3
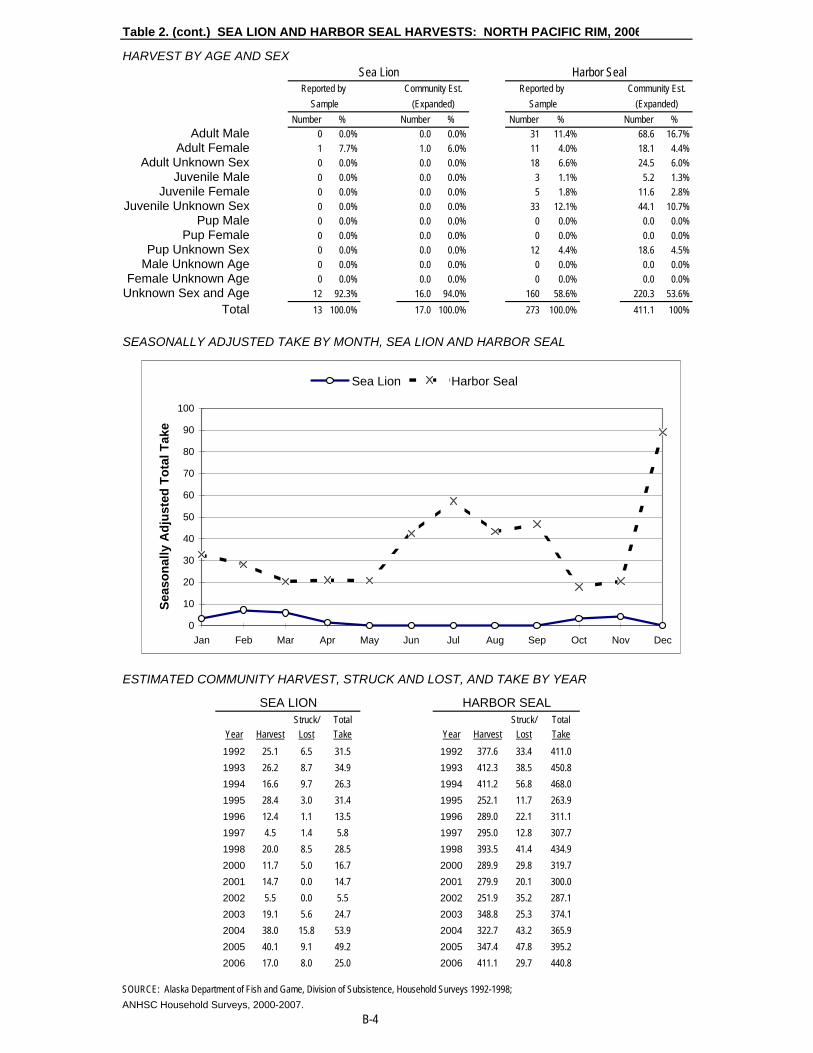
Table 2. (cont.) SEA LION AND HARBOR SEAL HARVESTS: NORTH PACIFIC RIM, 2006
HARVEST BY AGE AND SEXSea Lion Harbor Seal
Reported by Community Est. Reported by Community Est.Sample (Expanded) Sample (Expanded)
Number % Number % Number % Number %Adult Male 0 0.0% 0.0 0.0% 31 11.4% 68.6 16.7%
Adult Female 1 7.7% 1.0 6.0% 11 4.0% 18.1 4.4%Adult Unknown Sex 0 0.0% 0.0 0.0% 18 6.6% 24.5 6.0%
Juvenile Male 0 0.0% 0.0 0.0% 3 1.1% 5.2 1.3%Juvenile Female 0 0.0% 0.0 0.0% 5 1.8% 11.6 2.8%
Juvenile Unknown Sex 0 0.0% 0.0 0.0% 33 12.1% 44.1 10.7%Pup Male 0 0.0% 0.0 0.0% 0 0.0% 0.0 0.0%
Pup Female 0 0.0% 0.0 0.0% 0 0.0% 0.0 0.0%Pup Unknown Sex 0 0.0% 0.0 0.0% 12 4.4% 18.6 4.5%
Male Unknown Age 0 0.0% 0.0 0.0% 0 0.0% 0.0 0.0%Female Unknown Age 0 0.0% 0.0 0.0% 0 0.0% 0.0 0.0%
Unknown Sex and Age 12 92.3% 16.0 94.0% 160 58.6% 220.3 53.6%Total 13 100.0% 17.0 100.0% 273 100.0% 411.1 100%
SEASONALLY ADJUSTED TAKE BY MONTH, SEA LION AND HARBOR SEAL
ESTIMATED COMMUNITY HARVEST, STRUCK AND LOST, AND TAKE BY YEAR
SEA LION HARBOR SEALStruck/ Total Struck/ Total
Year Harvest Lost Take Year Harvest Lost Take1992 25.1 6.5 31.5 1992 377.6 33.4 411.01993 26.2 8.7 34.9 1993 412.3 38.5 450.81994 16.6 9.7 26.3 1994 411.2 56.8 468.01995 28.4 3.0 31.4 1995 252.1 11.7 263.91996 12.4 1.1 13.5 1996 289.0 22.1 311.11997 4.5 1.4 5.8 1997 295.0 12.8 307.71998 20.0 8.5 28.5 1998 393.5 41.4 434.92000 11.7 5.0 16.7 2000 289.9 29.8 319.72001 14.7 0.0 14.7 2001 279.9 20.1 300.02002 5.5 0.0 5.5 2002 251.9 35.2 287.12003 19.1 5.6 24.7 2003 348.8 25.3 374.12004 38.0 15.8 53.9 2004 322.7 43.2 365.92005 40.1 9.1 49.2 2005 347.4 47.8 395.22006 17.0 8.0 25.0 2006 411.1 29.7 440.8
SOURCE: Alaska Department of Fish and Game, Division of Subsistence, Household Surveys 1992-1998;ANHSC Household Surveys, 2000-2007.
B-4
0
10
20
30
40
50
60
70
80
90
100
Jan Feb Mar Apr May Jun Jul Aug Sep Oct Nov Dec
Seas
onal
ly A
djus
ted
Tota
l Tak
e
Sea Lion Harbor Seal

Table 3. SEA LION AND HARBOR SEAL HARVESTS: UPPER KENAI-COOK INLET, 2006
SAMPLING DESIGN: TotalCHAIN REFERRAL Total Referred Households 43
Surveyed Households 25Sampling Fraction 58.1%
Sample Household Members 76Estimated Household Members 132.2
2000 U.S. Census Estimated Native Population 29486 HARVEST AND USE INFORMATION
Percentage of Native Households: Estimated Community Harvest Sea Harbor and Take (Expanded): Sea Harbor
Lion Seal Lion SealUsed N/A N/A Total Number Harvested 0.0 37.6
Hunted N/A N/A Total Number Struck and Lost 0.0 13.3Harvested N/A N/A Total Number Taken 0.0 50.9Received N/A N/A
Gave Away N/A N/A Number Harvested Per Capita 0.00 0.00
SEA LION HARVEST BY MONTH UnknownJan Feb Mar Apr May Jun Jul Aug Sep Oct Nov Dec Month Total
REPORTED HARVEST AND TAKE BY SAMPLED HOUSEHOLDS (UNEXPANDED)Harvest 0 0 0 0 0 0 0 0 0 0 0 0 0 0Struck & Lost 0 0 0 0 0 0 0 0 0 0 0 0 0 0Total Take 0 0 0 0 0 0 0 0 0 0 0 0 0 0ESTIMATED HARVEST AND TAKE BY COMMUNITY (EXPANDED)Harvest 0.0 0.0 0.0 0.0 0.0 0.0 0.0 0.0 0.0 0.0 0.0 0.0 0.0 0.0Struck & Lost 0.0 0.0 0.0 0.0 0.0 0.0 0.0 0.0 0.0 0.0 0.0 0.0 0.0 0.0Total Take 0.0 0.0 0.0 0.0 0.0 0.0 0.0 0.0 0.0 0.0 0.0 0.0 0.0 0.0ESTIMATED SEASONALLY ADJUSTED HARVEST AND TAKE BY COMMUNITY (EXPANDED)Harvest 0.0 0.0 0.0 0.0 0.0 0.0 0.0 0.0 0.0 0.0 0.0 0.0 0.0Struck & Lost 0.0 0.0 0.0 0.0 0.0 0.0 0.0 0.0 0.0 0.0 0.0 0.0 0.0Total Take 0.0 0.0 0.0 0.0 0.0 0.0 0.0 0.0 0.0 0.0 0.0 0.0 0.0Total Take (%) --- --- --- --- --- --- --- --- --- --- --- --- ---Cum. Take 0.0 0.0 0.0 0.0 0.0 0.0 0.0 0.0 0.0 0.0 0.0 0.0Cum. Take (%) --- --- --- --- --- --- --- --- --- --- --- ---
HARBOR SEAL HARVEST BY MONTH UnknownJan Feb Mar Apr May Jun Jul Aug Sep Oct Nov Dec Month Total
REPORTED HARVEST AND TAKE BY SAMPLED HOUSEHOLDS (UNEXPANDED)Harvest 0 0 0 0 1 0 4 1 1 1 2 0 11 21Struck & Lost 0 0 3 0 0 0 0 0 0 0 2 0 3 8Total Take 0 0 3 0 1 0 4 1 1 1 4 0 14 29ESTIMATED HARVEST AND TAKE BY COMMUNITY (EXPANDED)Harvest 0.0 0.0 0.0 0.0 1.7 0.0 6.7 1.9 1.9 1.9 3.3 0.0 20.3 37.6Struck & Lost 0.0 0.0 5.0 0.0 0.0 0.0 0.0 0.0 0.0 0.0 3.3 0.0 5.0 13.3Total Take 0.0 0.0 5.0 0.0 1.7 0.0 6.7 1.9 1.9 1.9 6.7 0.0 25.3 50.9ESTIMATED SEASONALLY ADJUSTED HARVEST AND TAKE BY COMMUNITY (EXPANDED)Harvest 0.6 0.6 0.6 0.6 4.2 0.6 14.9 2.4 2.4 2.4 7.7 0.6 37.6Struck & Lost 0.0 0.0 8.0 0.0 0.0 0.0 0.0 0.0 0.0 0.0 5.3 0.0 13.3Total Take 0.6 0.6 8.6 0.6 4.2 0.6 14.9 2.4 2.4 2.4 13.1 0.6 50.9Total Take (%) 1.1% 1.1% 16.9% 1.1% 8.2% 1.1% 29.2% 4.8% 4.8% 4.8% 25.7% 1.1% 100%Cum. Take 0.6 1.2 9.8 10.3 14.5 15.1 29.9 32.4 34.8 37.3 50.3 50.9Cum. Take (%) 1.1% 2.3% 19.2% 20.3% 28.5% 29.6% 58.8% 63.6% 68.4% 73.2% 98.9% 100.0% SOURCE: ANHSC Household Surveys, (Numbers based on 2005 harvest estimates).
B-5

Table 3. (cont.) SEA LION AND HARBOR SEAL HARVESTS: UPPER KENAI-COOK INLET, 2006
HARVEST BY AGE AND SEXSea Lion Harbor Seal
Reported by Community Est. Reported by Community Est.Sample (Expanded) Sample (Expanded)
Number % Number % Number % Number %Adult Male 0 --- 0.0 --- 2 9.5% 3.3 8.9%
Adult Female 0 --- 0.0 --- 0 0.0% 0.0 0.0%Adult Unknown Sex 0 --- 0.0 --- 14 66.7% 23.5 62.6%
Juvenile Male 0 --- 0.0 --- 0 0.0% 0.0 0.0%Juvenile Female 0 --- 0.0 --- 0 0.0% 0.0 0.0%
Juvenile Unknown Sex 0 --- 0.0 --- 2 9.5% 3.7 9.9%Pup Male 0 --- 0.0 --- 0 0.0% 0.0 0.0%
Pup Female 0 --- 0.0 --- 0 0.0% 0.0 0.0%Pup Unknown Sex 0 --- 0.0 --- 0 0.0% 0.0 0.0%
Male Unknown Age 0 --- 0.0 --- 0 0.0% 0.0 0.0%Female Unknown Age 0 --- 0.0 --- 0 0.0% 0.0 0.0%
Unknown Sex and Age 0 --- 0.0 --- 3 14.3% 7.0 18.6%Total 0 --- 0.0 --- 21 100.0% 37.6 100%
SEASONALLY ADJUSTED TAKE BY MONTH, SEA LION AND HARBOR SEAL
ESTIMATED COMMUNITY HARVEST, STRUCK AND LOST, AND TAKE BY YEAR
SEA LION HARBOR SEALStruck/ Total Struck/ Total
Year Harvest Lost Take Year Harvest Lost Take1992 5.7 3.8 9.5 1992 51.6 0.0 51.61993 7.8 3.3 11.1 1993 49.2 5.6 54.81994 1.4 0.0 1.4 1994 16.2 0.0 16.21995 0.0 0.0 0.0 1995 3.7 0.0 3.71996 3.3 0.0 3.3 1996 64.3 8.8 73.11997 0.0 0.0 0.0 1997 101.7 8.8 110.51998 0.0 0.0 0.0 1998 79.2 13.5 92.72000 0.0 0.0 0.0 2000 79.2 13.5 92.72001 1.3 0.0 1.3 2001 91.2 2.7 93.92002 0.0 0.0 0.0 2002 75.2 8.0 83.22003 0.0 0.0 0.0 2003 90.8 15.0 105.82004 0.0 0.0 0.0 2004 56.6 13.4 69.92005 0.0 0.0 0.0 2005 37.6 13.3 50.92006 0.0 0.0 0.0 2006 37.6 13.3 50.9
SOURCE: Alaska Department of Fish and Game, Division of Subsistence, Household Surveys 1992-1998;ANHSC Household Surveys, 2000-2006 (Numbers based on 2005 harvest estimates).
B-6
0
2
4
6
8
10
12
14
16
Jan Feb Mar Apr May Jun Jul Aug Sep Oct Nov Dec
Seas
onal
ly A
djus
ted
Tota
l Tak
e
Sea Lion Harbor Seal

Table 4. SEA LION AND HARBOR SEAL HARVESTS: KODIAK ISLAND, 2006
SAMPLING DESIGN: Active Other TotalMIXED Total Household Universe 77 133 210
Surveyed Households 57 110 167Sampling Fraction 74.0% 82.7% 79.5%
Sample Household Members 179 291 470Estimated Household Members 250.6 347.9 598.6
2000 U.S. Census Estimated Native Population --- --- 1584HARVEST AND USE INFORMATION
Percentage of Native Households: Estimated Community Harvest Sea Harbor and Take (Expanded): Sea Harbor
Lion Seal Lion SealUsed N/A N/A Total Number Harvested 7.0 210.3
Hunted N/A N/A Total Number Struck and Lost 0.0 10.2Harvested N/A N/A Total Number Taken 7.0 220.5Received N/A N/A
Gave Away N/A N/A Number Harvested Per Capita 0.00 0.13
SEA LION HARVEST BY MONTH UnknownJan Feb Mar Apr May Jun Jul Aug Sep Oct Nov Dec Month Total
REPORTED HARVEST AND TAKE BY SAMPLED HOUSEHOLDS (UNEXPANDED)Harvest 1 0 0 0 0 0 0 0 0 1 0 2 0 4Struck & Lost 0 0 0 0 0 0 0 0 0 0 0 0 0 0Total Take 1 0 0 0 0 0 0 0 0 1 0 2 0 4ESTIMATED HARVEST AND TAKE BY COMMUNITY (EXPANDED)Harvest 3.7 0.0 0.0 0.0 0.0 0.0 0.0 0.0 0.0 1.1 0.0 2.3 0.0 7.0Struck & Lost 0.0 0.0 0.0 0.0 0.0 0.0 0.0 0.0 0.0 0.0 0.0 0.0 0.0 0.0Total Take 3.7 0.0 0.0 0.0 0.0 0.0 0.0 0.0 0.0 1.1 0.0 2.3 0.0 7.0ESTIMATED SEASONALLY ADJUSTED HARVEST AND TAKE BY COMMUNITY (EXPANDED)Harvest 3.7 0.0 0.0 0.0 0.0 0.0 0.0 0.0 0.0 1.1 0.0 2.3 7.0Struck & Lost 0.0 0.0 0.0 0.0 0.0 0.0 0.0 0.0 0.0 0.0 0.0 0.0 0.0Total Take 3.7 0.0 0.0 0.0 0.0 0.0 0.0 0.0 0.0 1.1 0.0 2.3 7.0Total Take (%) 52.4% 0.0% 0.0% 0.0% 0.0% 0.0% 0.0% 0.0% 0.0% 15.2% 0.0% 32.4% 100%Cum. Take 3.7 3.7 3.7 3.7 3.7 3.7 3.7 3.7 3.7 4.7 4.7 7.0Cum. Take (%) 52.4% 52.4% 52.4% 52.4% 52.4% 52.4% 52.4% 52.4% 52.4% 67.6% 67.6% 100.0%
HARBOR SEAL HARVEST BY MONTH UnknownJan Feb Mar Apr May Jun Jul Aug Sep Oct Nov Dec Month Total
REPORTED HARVEST AND TAKE BY SAMPLED HOUSEHOLDS (UNEXPANDED)Harvest 7 4 7 5 3 5 3 9 24 21 28 15 0 131Struck & Lost 1 0 0 0 0 0 0 0 2 3 2 1 0 9Total Take 8 4 7 5 3 5 3 9 26 24 30 16 0 140ESTIMATED HARVEST AND TAKE BY COMMUNITY (EXPANDED)Harvest 12.5 7.0 11.8 8.2 5.9 11.4 3.3 13.4 35.6 30.4 44.7 25.8 0.0 210.3Struck & Lost 1.1 0.0 0.0 0.0 0.0 0.0 0.0 0.0 2.3 3.4 2.3 1.1 0.0 10.2Total Take 13.7 7.0 11.8 8.2 5.9 11.4 3.3 13.4 37.9 33.9 47.0 27.0 0.0 220.5ESTIMATED SEASONALLY ADJUSTED HARVEST AND TAKE BY COMMUNITY (EXPANDED)Harvest 12.5 7.0 11.8 8.2 5.9 11.4 3.3 13.4 35.6 30.4 44.7 25.8 210.3Struck & Lost 1.1 0.0 0.0 0.0 0.0 0.0 0.0 0.0 2.3 3.4 2.3 1.1 10.2Total Take 13.7 7.0 11.8 8.2 5.9 11.4 3.3 13.4 37.9 33.9 47.0 27.0 220.5Total Take (%) 6.2% 3.2% 5.4% 3.7% 2.7% 5.2% 1.5% 6.1% 17.2% 15.4% 21.3% 12.2% 100%Cum. Take 13.7 20.7 32.5 40.8 46.7 58.1 61.4 74.8 112.7 146.6 193.5 220.5Cum. Take (%) 6.2% 9.4% 14.8% 18.5% 21.2% 26.3% 27.9% 33.9% 51.1% 66.5% 87.8% 100.0% SOURCE: ANHSC Household Surveys, 2007.
B-7

Table 4. (cont.) SEA LION AND HARBOR SEAL HARVESTS: KODIAK ISLAND, 2006
HARVEST BY AGE AND SEXSea Lion Harbor Seal
Reported by Community Est. Reported by Community Est.Sample (Expanded) Sample (Expanded)
Number % Number % Number % Number %Adult Male 2 50.0% 2.2 31.4% 70 53.4% 132.7 63.1%
Adult Female 1 25.0% 1.1 16.2% 20 15.3% 30.3 14.4%Adult Unknown Sex 0 0.0% 0.0 0.0% 29 22.1% 33.6 16.0%
Juvenile Male 1 25.0% 3.7 52.4% 5 3.8% 5.5 2.6%Juvenile Female 0 0.0% 0.0 0.0% 1 0.8% 1.1 0.5%
Juvenile Unknown Sex 0 0.0% 0.0 0.0% 1 0.8% 1.1 0.5%Pup Male 0 0.0% 0.0 0.0% 1 0.8% 1.5 0.7%
Pup Female 0 0.0% 0.0 0.0% 0 0.0% 0.0 0.0%Pup Unknown Sex 0 0.0% 0.0 0.0% 0 0.0% 0.0 0.0%
Male Unknown Age 0 0.0% 0.0 0.0% 0 0.0% 0.0 0.0%Female Unknown Age 0 0.0% 0.0 0.0% 0 0.0% 0.0 0.0%
Unknown Sex and Age 0 0.0% 0.0 0.0% 4 3.1% 4.4 2.1%Total 4 100.0% 7.0 100.0% 131 100.0% 210.3 100%
SEASONALLY ADJUSTED TAKE BY MONTH, SEA LION AND HARBOR SEAL
ESTIMATED COMMUNITY HARVEST, STRUCK AND LOST, AND TAKE BY YEAR
SEA LION HARBOR SEALStruck/ Total Struck/ Total
Year Harvest Lost Take Year Harvest Lost Take1992 41.5 16.3 57.8 1992 225.5 13.1 238.61993 41.5 16.9 58.4 1993 171.7 20.1 191.81994 57.1 4.2 61.3 1994 168.2 3.6 171.71995 127.9 7.7 135.7 1995 223.0 9.2 232.21996 53.9 6.3 60.2 1996 185.2 4.9 190.11997 33.3 4.9 38.2 1997 189.8 18.3 208.21998 14.5 3.3 17.8 1998 174.0 3.7 177.72000 18.5 0.0 18.5 2000 185.9 7.3 193.22001 32.8 2.2 35.0 2001 155.6 4.8 160.42002 16.1 0.0 16.1 2002 152.1 10.2 162.32003 30.3 5.7 36.0 2003 172.7 13.0 185.62004 13.5 3.5 17.0 2004 172.2 15.7 188.02005 21.9 3.2 25.1 2005 305.1 10.6 315.72006 7.0 0.0 7.0 2006 210.3 10.2 220.5
SOURCE: Alaska Department of Fish and Game, Division of Subsistence, Household Surveys 1992-1998;ANHSC Household Surveys, 2000- 2007.
B-8
0
5
10
15
20
25
30
35
40
45
50
Jan Feb Mar Apr May Jun Jul Aug Sep Oct Nov Dec
Seas
onal
ly A
djus
ted
Tota
l Tak
e
Sea Lion Harbor Seal
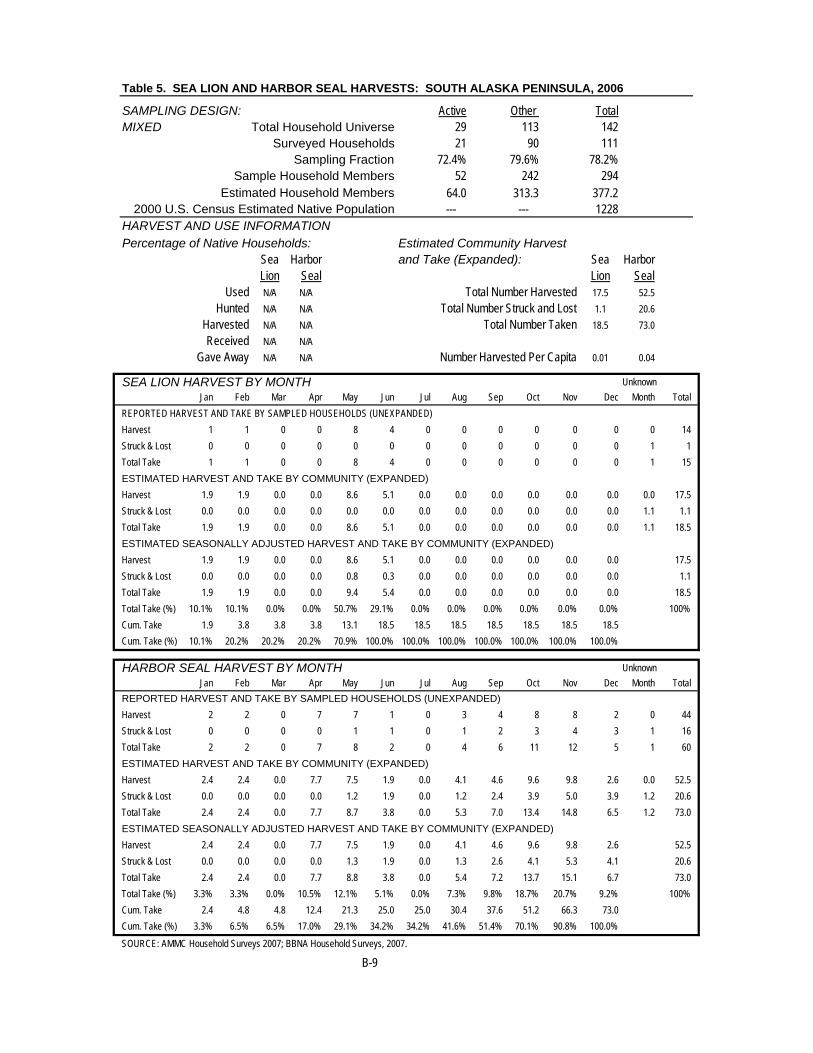
Table 5. SEA LION AND HARBOR SEAL HARVESTS: SOUTH ALASKA PENINSULA, 2006
SAMPLING DESIGN: Active Other TotalMIXED Total Household Universe 29 113 142
Surveyed Households 21 90 111Sampling Fraction 72.4% 79.6% 78.2%
Sample Household Members 52 242 294Estimated Household Members 64.0 313.3 377.2
2000 U.S. Census Estimated Native Population --- --- 1228HARVEST AND USE INFORMATION
Percentage of Native Households: Estimated Community Harvest Sea Harbor and Take (Expanded): Sea Harbor
Lion Seal Lion SealUsed N/A N/A Total Number Harvested 17.5 52.5
Hunted N/A N/A Total Number Struck and Lost 1.1 20.6Harvested N/A N/A Total Number Taken 18.5 73.0Received N/A N/A
Gave Away N/A N/A Number Harvested Per Capita 0.01 0.04
SEA LION HARVEST BY MONTH UnknownJan Feb Mar Apr May Jun Jul Aug Sep Oct Nov Dec Month Total
REPORTED HARVEST AND TAKE BY SAMPLED HOUSEHOLDS (UNEXPANDED)Harvest 1 1 0 0 8 4 0 0 0 0 0 0 0 14Struck & Lost 0 0 0 0 0 0 0 0 0 0 0 0 1 1Total Take 1 1 0 0 8 4 0 0 0 0 0 0 1 15ESTIMATED HARVEST AND TAKE BY COMMUNITY (EXPANDED)Harvest 1.9 1.9 0.0 0.0 8.6 5.1 0.0 0.0 0.0 0.0 0.0 0.0 0.0 17.5Struck & Lost 0.0 0.0 0.0 0.0 0.0 0.0 0.0 0.0 0.0 0.0 0.0 0.0 1.1 1.1Total Take 1.9 1.9 0.0 0.0 8.6 5.1 0.0 0.0 0.0 0.0 0.0 0.0 1.1 18.5ESTIMATED SEASONALLY ADJUSTED HARVEST AND TAKE BY COMMUNITY (EXPANDED)Harvest 1.9 1.9 0.0 0.0 8.6 5.1 0.0 0.0 0.0 0.0 0.0 0.0 17.5Struck & Lost 0.0 0.0 0.0 0.0 0.8 0.3 0.0 0.0 0.0 0.0 0.0 0.0 1.1Total Take 1.9 1.9 0.0 0.0 9.4 5.4 0.0 0.0 0.0 0.0 0.0 0.0 18.5Total Take (%) 10.1% 10.1% 0.0% 0.0% 50.7% 29.1% 0.0% 0.0% 0.0% 0.0% 0.0% 0.0% 100%Cum. Take 1.9 3.8 3.8 3.8 13.1 18.5 18.5 18.5 18.5 18.5 18.5 18.5Cum. Take (%) 10.1% 20.2% 20.2% 20.2% 70.9% 100.0% 100.0% 100.0% 100.0% 100.0% 100.0% 100.0%
HARBOR SEAL HARVEST BY MONTH UnknownJan Feb Mar Apr May Jun Jul Aug Sep Oct Nov Dec Month Total
REPORTED HARVEST AND TAKE BY SAMPLED HOUSEHOLDS (UNEXPANDED)Harvest 2 2 0 7 7 1 0 3 4 8 8 2 0 44Struck & Lost 0 0 0 0 1 1 0 1 2 3 4 3 1 16Total Take 2 2 0 7 8 2 0 4 6 11 12 5 1 60ESTIMATED HARVEST AND TAKE BY COMMUNITY (EXPANDED)Harvest 2.4 2.4 0.0 7.7 7.5 1.9 0.0 4.1 4.6 9.6 9.8 2.6 0.0 52.5Struck & Lost 0.0 0.0 0.0 0.0 1.2 1.9 0.0 1.2 2.4 3.9 5.0 3.9 1.2 20.6Total Take 2.4 2.4 0.0 7.7 8.7 3.8 0.0 5.3 7.0 13.4 14.8 6.5 1.2 73.0ESTIMATED SEASONALLY ADJUSTED HARVEST AND TAKE BY COMMUNITY (EXPANDED)Harvest 2.4 2.4 0.0 7.7 7.5 1.9 0.0 4.1 4.6 9.6 9.8 2.6 52.5Struck & Lost 0.0 0.0 0.0 0.0 1.3 1.9 0.0 1.3 2.6 4.1 5.3 4.1 20.6Total Take 2.4 2.4 0.0 7.7 8.8 3.8 0.0 5.4 7.2 13.7 15.1 6.7 73.0Total Take (%) 3.3% 3.3% 0.0% 10.5% 12.1% 5.1% 0.0% 7.3% 9.8% 18.7% 20.7% 9.2% 100%Cum. Take 2.4 4.8 4.8 12.4 21.3 25.0 25.0 30.4 37.6 51.2 66.3 73.0Cum. Take (%) 3.3% 6.5% 6.5% 17.0% 29.1% 34.2% 34.2% 41.6% 51.4% 70.1% 90.8% 100.0% SOURCE: AMMC Household Surveys 2007; BBNA Household Surveys, 2007.
B-9

Table 5. (cont.) SEA LION AND HARBOR SEAL HARVESTS: SOUTH ALASKA PENINSULA, 2006
HARVEST BY AGE AND SEXSea Lion Harbor Seal
Reported by Community Est. Reported by Community Est.Sample (Expanded) Sample (Expanded)
Number % Number % Number % Number %Adult Male 7 50.0% 7.5 43.1% 15 34.1% 19.4 37.0%
Adult Female 4 28.6% 4.3 24.7% 10 22.7% 11.0 21.0%Adult Unknown Sex 2 14.3% 3.8 21.5% 3 6.8% 3.2 6.1%
Juvenile Male 0 0.0% 0.0 0.0% 7 15.9% 8.2 15.5%Juvenile Female 0 0.0% 0.0 0.0% 5 11.4% 6.0 11.4%
Juvenile Unknown Sex 1 7.1% 1.9 10.7% 1 2.3% 1.2 2.3%Pup Male 0 0.0% 0.0 0.0% 0 0.0% 0.0 0.0%
Pup Female 0 0.0% 0.0 0.0% 0 0.0% 0.0 0.0%Pup Unknown Sex 0 0.0% 0.0 0.0% 0 0.0% 0.0 0.0%
Male Unknown Age 0 0.0% 0.0 0.0% 0 0.0% 0.0 0.0%Female Unknown Age 0 0.0% 0.0 0.0% 0 0.0% 0.0 0.0%
Unknown Sex and Age 0 0.0% 0.0 0.0% 3 6.8% 3.6 6.8%Total 14 100.0% 17.5 100.0% 44 100.0% 52.5 100%
SEASONALLY ADJUSTED TAKE BY MONTH, SEA LION AND HARBOR SEAL
ESTIMATED COMMUNITY HARVEST, STRUCK AND LOST, AND TAKE BY YEAR
SEA LION HARBOR SEALStruck/ Total Struck/ Total
Year Harvest Lost Take Year Harvest Lost Take1992 2.4 0.0 2.4 1992 115.5 13.1 128.61993 4.6 1.2 5.7 1993 100.0 23.1 123.11994 4.6 1.1 5.7 1994 98.6 11.1 109.81995 0.0 8.1 8.1 1995 117.0 11.1 128.01996 3.7 1.3 5.0 1996 86.3 5.0 91.31997 8.3 0.0 8.3 1997 68.3 12.1 80.41998 9.2 0.0 9.2 1998 79.9 7.5 87.42000 13.8 0.0 13.8 2000 65.4 18.4 83.82001 10.2 1.4 11.6 2001 68.7 16.3 85.12002 3.9 4.2 8.1 2002 70.0 19.4 89.42003 2.5 2.4 5.0 2003 91.1 13.5 104.52004 3.9 0.0 3.9 2004 77.9 10.1 88.02005 4.2 0.0 4.2 2005 66.8 8.5 75.32006 17.5 1.1 18.5 2006 52.5 20.6 73.0
SOURCE: Alaska Department of Fish and Game, Division of Subsistence, Household Surveys 1992-1998; AMMC Household Surveys; BBNA Household Surveys, 2000-2007.
B-10
0
2
4
6
8
10
12
14
16
Jan Feb Mar Apr May Jun Jul Aug Sep Oct Nov Dec
Seas
onal
ly A
djus
ted
Tota
l Tak
e
Sea Lion Harbor Seal

Table 6. SEA LION AND HARBOR SEAL HARVESTS: ALEUTIAN ISLANDS, 2006
SAMPLING DESIGN: Active Other TotalMIXED Total Household Universe 26 53 79
Surveyed Households 18 36 54Sampling Fraction 69.2% 67.9% 68.4%
Sample Household Members 45 78 123Estimated Household Members 69.0 114.8 183.8
2000 U.S. Census Estimated Native Population --- --- 743HARVEST AND USE INFORMATION
Percentage of Native Households: Estimated Community Harvest Sea Harbor and Take (Expanded): Sea Harbor
Lion Seal Lion SealUsed N/A N/A Total Number Harvested 63.4 54.4
Hunted N/A N/A Total Number Struck and Lost 19.4 8.6Harvested N/A N/A Total Number Taken 82.8 63.0Received N/A N/A
Gave Away N/A N/A Number Harvested Per Capita 0.09 0.07
SEA LION HARVEST BY MONTH UnknownJan Feb Mar Apr May Jun Jul Aug Sep Oct Nov Dec Month Total
REPORTED HARVEST AND TAKE BY SAMPLED HOUSEHOLDS (UNEXPANDED)Harvest 3 4 3 1 1 2 1 3 2 3 4 2 4 33Struck & Lost 0 2 0 0 0 0 1 0 0 1 2 2 2 10Total Take 3 6 3 1 1 2 2 3 2 4 6 4 6 43ESTIMATED HARVEST AND TAKE BY COMMUNITY (EXPANDED)Harvest 6.0 8.0 6.0 2.0 2.0 3.2 1.2 5.6 3.6 6.0 8.0 4.0 7.8 63.4Struck & Lost 0.0 3.8 0.0 0.0 0.0 0.0 1.8 0.0 0.0 2.0 4.0 3.8 4.0 19.4Total Take 6.0 11.8 6.0 2.0 2.0 3.2 3.0 5.6 3.6 8.0 12.0 7.8 11.8 82.8ESTIMATED SEASONALLY ADJUSTED HARVEST AND TAKE BY COMMUNITY (EXPANDED)Harvest 6.8 9.0 6.8 2.3 2.3 3.5 1.2 6.8 4.5 6.8 9.0 4.5 63.4Struck & Lost 0.0 4.6 0.0 0.0 0.0 0.0 1.8 0.0 0.0 2.8 5.6 4.6 19.4Total Take 6.8 13.6 6.8 2.3 2.3 3.5 3.0 6.8 4.5 9.6 14.6 9.1 82.8Total Take (%) 8.2% 16.5% 8.2% 2.7% 2.7% 4.2% 3.6% 8.2% 5.4% 11.6% 17.7% 11.0% 100%Cum. Take 6.8 20.4 27.2 29.5 31.7 35.2 38.2 45.0 49.5 59.1 73.7 82.8Cum. Take (%) 8.2% 24.7% 32.9% 35.6% 38.3% 42.5% 46.1% 54.3% 59.7% 71.3% 89.0% 100.0%
HARBOR SEAL HARVEST BY MONTH UnknownJan Feb Mar Apr May Jun Jul Aug Sep Oct Nov Dec Month Total
REPORTED HARVEST AND TAKE BY SAMPLED HOUSEHOLDS (UNEXPANDED)Harvest 3 4 5 1 0 0 1 8 1 1 2 3 8 37Struck & Lost 0 0 0 0 0 0 0 1 0 0 0 1 3 5Total Take 3 4 5 1 0 0 1 9 1 1 2 4 11 42ESTIMATED HARVEST AND TAKE BY COMMUNITY (EXPANDED)Harvest 4.6 6.8 6.0 1.2 0.0 0.0 1.0 8.8 1.8 1.0 4.0 3.2 16.0 54.4Struck & Lost 0.0 0.0 0.0 0.0 0.0 0.0 0.0 1.0 0.0 0.0 0.0 2.0 5.6 8.6Total Take 4.6 6.8 6.0 1.2 0.0 0.0 1.0 9.8 1.8 1.0 4.0 5.2 21.6 63.0ESTIMATED SEASONALLY ADJUSTED HARVEST AND TAKE BY COMMUNITY (EXPANDED)Harvest 4.6 13.2 9.2 1.2 0.0 0.0 1.0 8.8 1.8 1.0 10.4 3.2 54.4Struck & Lost 1.4 0.7 0.0 0.0 0.0 0.0 0.0 1.7 0.7 0.0 0.0 4.0 8.6Total Take 6.0 13.9 9.2 1.2 0.0 0.0 1.0 10.5 2.5 1.0 10.4 7.2 63.0Total Take (%) 9.6% 22.1% 14.6% 1.9% 0.0% 0.0% 1.6% 16.7% 4.0% 1.6% 16.5% 11.4% 100%Cum. Take 6.0 20.0 29.2 30.4 30.4 30.4 31.4 41.9 44.4 45.4 55.8 63.0Cum. Take (%) 9.6% 31.7% 46.3% 48.2% 48.2% 48.2% 49.8% 66.5% 70.5% 72.1% 88.6% 100.0% SOURCE: AMMC Household Surveys, 2007.
B-11

Table 6. (cont.) SEA LION AND HARBOR SEAL HARVESTS: ALEUTIAN ISLANDS, 2006
HARVEST BY AGE AND SEXSea Lion Harbor Seal
Reported by Community Est. Reported by Community Est.Sample (Expanded) Sample (Expanded)
Number % Number % Number % Number %Adult Male 17 51.5% 33.2 52.4% 25 67.6% 37.2 68.4%
Adult Female 4 12.1% 6.8 10.7% 2 5.4% 2.8 5.1%Adult Unknown Sex 2 6.1% 3.6 5.7% 1 2.7% 1.8 3.3%
Juvenile Male 2 6.1% 4.0 6.3% 3 8.1% 4.8 8.8%Juvenile Female 0 0.0% 0.0 0.0% 0 0.0% 0.0 0.0%
Juvenile Unknown Sex 1 3.0% 1.8 2.8% 1 2.7% 1.8 3.3%Pup Male 0 0.0% 0.0 0.0% 0 0.0% 0.0 0.0%
Pup Female 0 0.0% 0.0 0.0% 0 0.0% 0.0 0.0%Pup Unknown Sex 0 0.0% 0.0 0.0% 0 0.0% 0.0 0.0%
Male Unknown Age 0 0.0% 0.0 0.0% 0 0.0% 0.0 0.0%Female Unknown Age 0 0.0% 0.0 0.0% 0 0.0% 0.0 0.0%
Unknown Sex and Age 7 21.2% 14.0 22.1% 5 13.5% 6.0 11.0%Total 33 100.0% 63.4 100.0% 37 100.0% 54.4 100%
SEASONALLY ADJUSTED TAKE BY MONTH, SEA LION AND HARBOR SEAL
ESTIMATED COMMUNITY HARVEST, STRUCK AND LOST, AND TAKE BY YEAR
SEA LION HARBOR SEALStruck/ Total Struck/ Total
Year Harvest Lost Take Year Harvest Lost Take1992 104.3 30.9 135.2 1992 94.3 21.4 115.71993 99.0 24.8 123.8 1993 85.0 15.4 100.41994 101.8 20.5 122.3 1994 124.9 22.6 147.51995 85.0 11.1 96.1 1995 86.9 9.7 96.61996 46.5 11.3 57.9 1996 55.0 15.2 70.21997 50.7 1.3 51.9 1997 70.5 6.3 76.91998 31.6 5.5 37.0 1998 45.8 3.8 49.62000 71.2 4.8 76.0 2000 79.0 10.5 89.52001 78.1 19.6 97.7 2001 120.1 12.5 132.62002 87.4 17.7 105.1 2002 63.4 2.4 65.92003 88.5 18.5 107.0 2003 97.7 11.4 109.12004 70.9 25.1 96.0 2004 118.0 28.0 146.02005 77.7 10.6 88.3 2005 103.7 17.1 120.82006 63.4 19.4 82.8 2006 54.4 8.6 63.0
SOURCE: Alaska Department of Fish and Game, Division of Subsistence, Household Surveys 1992-1998;AMMC Household Surveys, 2000-2007.
B-12
0
2
4
6
8
10
12
14
16
Jan Feb Mar Apr May Jun Jul Aug Sep Oct Nov Dec
Seas
onal
ly A
djus
ted
Tota
l Tak
e
Sea Lion Harbor Seal

Table 7. SEA LION AND HARBOR SEAL HARVESTS: PRIBILOF ISLANDS, 2006
SAMPLING DESIGN: Active Other TotalMIXED Total Household Universe N/A N/A N/A
Surveyed Households N/A N/A N/ASampling Fraction N/A N/A N/A
Sample Household Members N/A N/A N/AEstimated Household Members N/A N/A N/A
2000 U.S. Census Estimated Native Population --- --- 600HARVEST AND USE INFORMATION
Percentage of Native Households: Estimated Community Harvest Sea Harbor and Take (Expanded): Sea Harbor
Lion Seal Lion SealUsed N/A N/A Total Number Harvested 29.3 N/A
Hunted N/A N/A Total Number Struck and Lost 10.7 N/AHarvested N/A N/A Total Number Taken 40.0 N/AReceived N/A N/A
Gave Away N/A N/A Number Harvested Per Capita 0.05 N/A
SEA LION HARVEST BY MONTH UnknownJan Feb Mar Apr May Jun Jul Aug Sep Oct Nov Dec Month Total
REPORTED HARVEST AND TAKE BY SAMPLED HOUSEHOLDS (UNEXPANDED)Harvest 0 0 3 0 0 0 0 0 1 0 0 0 20 24Struck & Lost 0 0 1 0 0 0 0 0 0 1 0 0 6 8Total Take 0 0 4 0 0 0 0 0 1 1 0 0 26 32ESTIMATED HARVEST AND TAKE BY COMMUNITY (EXPANDED)Harvest 0.0 0.0 7.0 0.0 0.0 0.0 0.0 0.0 2.3 0.0 0.0 0.0 20.0 29.3Struck & Lost 0.0 0.0 2.3 0.0 0.0 0.0 0.0 0.0 0.0 2.3 0.0 0.0 6.0 10.7Total Take 0.0 0.0 9.3 0.0 0.0 0.0 0.0 0.0 2.3 2.3 0.0 0.0 26.0 39.9ESTIMATED SEASONALLY ADJUSTED HARVEST AND TAKE BY COMMUNITY (EXPANDED)Harvest 0.0 0.0 7.0 0.0 0.0 0.0 0.0 0.0 2.3 0.0 0.0 0.0 20.0 20.0Struck & Lost 0.0 0.0 2.3 0.0 0.0 0.0 0.0 0.0 0.0 2.3 0.0 0.0 6.0 10.6Total Take 0.0 0.0 9.3 0.0 0.0 0.0 0.0 0.0 2.3 2.3 0.0 0.0 26.0 39.9Total Take (%) 0.0% 0.0% 23.3% 0.0% 0.0% 0.0% 0.0% 0.0% 5.8% 5.8% 0.0% 0.0% 35%
Cum. Take 0.0 0.0 9.3 9.3 9.3 9.3 9.3 9.3 11.6 13.9 13.9 13.9 Cum. Take (%) 0.0% 0.0% 66.9% 66.9% 66.9% 66.9% 66.9% 66.9% 83.5% 100.0% 100.0% 100.0%
HARBOR SEAL HARVEST BY MONTH UnknownJan Feb Mar Apr May Jun Jul Aug Sep Oct Nov Dec Month Total
REPORTED HARVEST AND TAKE BY SAMPLED HOUSEHOLDS (UNEXPANDED)Harvest N/A N/A N/A N/A N/A N/A N/A N/A N/A N/A N/A N/A N/A N/AStruck & Lost N/A N/A N/A N/A N/A N/A N/A N/A N/A N/A N/A N/A N/A N/ATotal Take N/A N/A N/A N/A N/A N/A N/A N/A N/A N/A N/A N/A N/A N/AESTIMATED HARVEST AND TAKE BY COMMUNITY (EXPANDED)Harvest N/A N/A N/A N/A N/A N/A N/A N/A N/A N/A N/A N/A N/A N/AStruck & Lost N/A N/A N/A N/A N/A N/A N/A N/A N/A N/A N/A N/A N/A N/ATotal Take N/A N/A N/A N/A N/A N/A N/A N/A N/A N/A N/A N/A N/A N/AESTIMATED SEASONALLY ADJUSTED HARVEST AND TAKE BY COMMUNITY (EXPANDED)Harvest N/A N/A N/A N/A N/A N/A N/A N/A N/A N/A N/A N/A N/A N/AStruck & Lost N/A N/A N/A N/A N/A N/A N/A N/A N/A N/A N/A N/A N/A N/ATotal Take N/A N/A N/A N/A N/A N/A N/A N/A N/A N/A N/A N/A N/A N/ATotal Take (%)Cum. TakeCum. Take (%)
B-13
SOURCE: Alaska Department of Fish and Game, Division of Subsistence, Subsistence Study and Monitor System for Sea Lions and Harbor Seals in Alaska with the exception of St. Paul Sea Lion: Zavadil, P.A., A. D. Lestenkof, M. T. Williams, and S. A. MacLean. 2004. The subsistence harvest of Steller sea lions on St. Paul Island in 2003. Note: Pribilof Islands harvests are based on 2003 Survey Estimates

Table 7. (cont.) SEA LION AND HARBOR SEAL HARVESTS: PRIBILOF ISLANDS, 2006HARVEST BY AGE AND SEX
Sea Lion Harbor SealReported by Community Est. Reported by Community Est.
Sample (Expanded) Sample (Expanded)Number % Number % Number % Number %
Adult Male 1 4.2% 2.3 7.8% N/A --- N/A ---Adult Female 0 0.0% 0.0 0.0% N/A --- N/A ---
Adult Unknown Sex 0 0.0% 0.0 0.0% N/A --- N/A ---Juvenile Male 21 87.5% 25.0 85.3% N/A --- N/A ---
Juvenile Female 2 8.3% 2.0 6.8% N/A --- N/A ---Juvenile Unknown Sex 0 0.0% 0.0 0.0% N/A --- N/A ---
Pup Male 0 0.0% 0.0 0.0% N/A --- N/A ---Pup Female 0 0.0% 0.0 0.0% N/A --- N/A ---
Pup Unknown Sex 0 0.0% 0.0 0.0% N/A --- N/A ---Male Unknown Age 0 0.0% 0.0 0.0% N/A --- N/A ---
Female Unknown Age 0 0.0% 0.0 0.0% N/A --- N/A ---Unknown Sex and Age 0 0.0% 0.0 0.0% N/A --- N/A ---
Total 24 100.0% 29.3 100.0% N/A --- N/A ---
SEASONALLY ADJUSTED TAKE BY MONTH, SEA LION AND HARBOR SEAL
ESTIMATED COMMUNITY HARVEST, STRUCK AND LOST, AND TAKE BY YEAR
SEA LION HARBOR SEALStruck/ Total Struck/ Total
Year Harvest Lost Take Year Harvest Lost Take1992 176.6 120.2 296.8 1992 2.3 1.2 3.51993 165.4 80.0 245.4 1993 2.3 1.2 3.51994 149.8 43.5 193.3 1994 7.3 0.0 7.31995 57.6 10.3 67.9 1995 2.5 0.0 2.51996 32.2 14.2 46.4 1996 0.0 0.0 0.01997 45.5 10.4 55.9 1997 0.0 0.0 0.01998 52.7 25.4 78.1 1998 4.6 0.0 4.62000 29.1 14.2 43.3 2000 N/A N/A N/A2001 19.0 19.0 38.0 2001 N/A N/A N/A2002 24.0 19.0 43.0 2002 N/A N/A N/A2003 22.3 9.7 32.0 2003 N/A N/A N/A2004 22.3 9.7 32.0 2004 N/A N/A N/A2005 28.3 7.7 35.0 2005 N/A N/A N/A2006 29.3 10.7 39.9 2006 N/A N/A N/A
B-14
SOURCE: 1992-1998 Alaska Department of Fish and Game, Division of Subsistence, Hosehold Surveys; 2000-2004 Zavadil et al, 2006; 2005 Lestenkof and Zavadil, 2006; 2006 Lestenkof et al., 2007.
0
1
2
3
4
5
6
7
8
9
10
Jan Feb Mar Apr May Jun Jul Aug Sep Oct Nov Dec
Seas
onal
ly A
djus
ted
Tota
l Tak
e
Sea Lion Harbor Seal

Table 8. SEA LION AND HARBOR SEAL HARVESTS: SOUTH BRISTOL BAY, 2006
SAMPLING DESIGN: Active Other TotalMIXED Total Household Universe 28 193 221
Surveyed Households 26 119 145Sampling Fraction 92.9% 61.7% 65.6%
Sample Household Members 57 327 384Estimated Household Members 61.4 558.5 619.9
2000 U.S. Census Estimated Native Population --- --- 951HARVEST AND USE INFORMATION Percentage of Native Households: Estimated Community Harvest
Sea Harbor and Take (Expanded): Sea HarborLion Seal Lion Seal
Used N/A N/A Total Number Harvested 0.0 45.4Hunted N/A N/A Total Number Struck and Lost 0.0 14.0
Harvested N/A N/A Total Number Taken 0.0 59.4Received N/A N/A
Gave Away N/A N/A Number Harvested Per Capita 0.00 0.05
SEA LION HARVEST BY MONTH UnknownJan Feb Mar Apr May Jun Jul Aug Sep Oct Nov Dec Month Total
REPORTED HARVEST AND TAKE BY SAMPLED HOUSEHOLDS (UNEXPANDED)Harvest 0 0 0 0 0 0 0 0 0 0 0 0 0 0Struck & Lost 0 0 0 0 0 0 0 0 0 0 0 0 0 0Total Take 0 0 0 0 0 0 0 0 0 0 0 0 0 0ESTIMATED HARVEST AND TAKE BY COMMUNITY (EXPANDED)Harvest 0.0 0.0 0.0 0.0 0.0 0.0 0.0 0.0 0.0 0.0 0.0 0.0 0.0 0.0Struck & Lost 0.0 0.0 0.0 0.0 0.0 0.0 0.0 0.0 0.0 0.0 0.0 0.0 0.0 0.0Total Take 0.0 0.0 0.0 0.0 0.0 0.0 0.0 0.0 0.0 0.0 0.0 0.0 0.0 0.0ESTIMATED SEASONALLY ADJUSTED HARVEST AND TAKE BY COMMUNITY (EXPANDED)Harvest 0.0 0.0 0.0 0.0 0.0 0.0 0.0 0.0 0.0 0.0 0.0 0.0 0.0Struck & Lost 0.0 0.0 0.0 0.0 0.0 0.0 0.0 0.0 0.0 0.0 0.0 0.0 0.0Total Take 0.0 0.0 0.0 0.0 0.0 0.0 0.0 0.0 0.0 0.0 0.0 0.0 0.0Total Take (%) --- --- --- --- --- --- --- --- --- --- --- --- ---Cum. Take 0.0 0.0 0.0 0.0 0.0 0.0 0.0 0.0 0.0 0.0 0.0 0.0Cum. Take (%) --- --- --- --- --- --- --- --- --- --- --- ---
HARBOR SEAL HARVEST BY MONTH UnknownJan Feb Mar Apr May Jun Jul Aug Sep Oct Nov Dec Month Total
REPORTED HARVEST AND TAKE BY SAMPLED HOUSEHOLDS (UNEXPANDED)Harvest 0 0 0 0 12 5 4 13 5 0 0 0 0 39Struck & Lost 0 0 0 0 0 5 2 4 2 0 0 0 0 13Total Take 0 0 0 0 12 10 6 17 7 0 0 0 0 52ESTIMATED HARVEST AND TAKE BY COMMUNITY (EXPANDED)Harvest 0.0 0.0 0.0 0.0 13.3 5.4 4.1 16.9 5.7 0.0 0.0 0.0 0.0 45.4Struck & Lost 0.0 0.0 0.0 0.0 0.0 5.4 2.2 4.3 2.2 0.0 0.0 0.0 0.0 14.0Total Take 0.0 0.0 0.0 0.0 13.3 10.8 6.2 21.2 7.9 0.0 0.0 0.0 0.0 59.4ESTIMATED SEASONALLY ADJUSTED HARVEST AND TAKE BY COMMUNITY (EXPANDED)Harvest 0.0 0.0 0.0 0.0 13.3 5.4 4.1 16.9 5.7 0.0 0.0 0.0 45.4Struck & Lost 0.0 0.0 0.0 0.0 0.0 5.4 2.2 4.3 2.2 0.0 0.0 0.0 14.0Total Take 0.0 0.0 0.0 0.0 13.3 10.8 6.2 21.2 7.9 0.0 0.0 0.0 59.4Total Take (%) 0.0% 0.0% 0.0% 0.0% 22.3% 18.2% 10.5% 35.7% 13.2% 0.0% 0.0% 0.0% 100%Cum. Take 0.0 0.0 0.0 0.0 13.3 24.0 30.3 51.5 59.4 59.4 59.4 59.4Cum. Take (%) 0.0% 0.0% 0.0% 0.0% 22.3% 40.5% 51.0% 86.8% 100.0% 100.0% 100.0% 100.0% SOURCE: BBNA Household Surveys, 2007.
B-15

Table 8. (cont.) SEA LION AND HARBOR SEAL HARVESTS: SOUTH BRISTOL BAY, 2006
HARVEST BY AGE AND SEXSea Lion Harbor Seal
Reported by Community Est. Reported by Community Est.Sample (Expanded) Sample (Expanded)
Number % Number % Number % Number %Adult Male 0 --- 0.0 --- 12 30.8% 13.1 28.9%
Adult Female 0 --- 0.0 --- 9 23.1% 9.9 21.9%Adult Unknown Sex 0 --- 0.0 --- 5 12.8% 7.3 16.1%
Juvenile Male 0 --- 0.0 --- 0 0.0% 0.0 0.0%Juvenile Female 0 --- 0.0 --- 3 7.7% 4.2 9.3%
Juvenile Unknown Sex 0 --- 0.0 --- 0 0.0% 0.0 0.0%Pup Male 0 --- 0.0 --- 0 0.0% 0.0 0.0%
Pup Female 0 --- 0.0 --- 0 0.0% 0.0 0.0%Pup Unknown Sex 0 --- 0.0 --- 0 0.0% 0.0 0.0%
Male Unknown Age 0 --- 0.0 --- 0 0.0% 0.0 0.0%Female Unknown Age 0 --- 0.0 --- 0 0.0% 0.0 0.0%
Unknown Sex and Age 0 --- 0.0 --- 10 25.6% 10.8 23.8%Total 0 --- 0.0 --- 39 100.0% 45.4 100%
SEASONALLY ADJUSTED TAKE BY MONTH, SEA LION AND HARBOR SEAL
ESTIMATED COMMUNITY HARVEST, STRUCK AND LOST, AND TAKE BY YEAR
SEA LION HARBOR SEALStruck/ Total Struck/ Total
Year Harvest Lost Take Year Harvest Lost Take1992 0.0 0.0 0.0 1992 99.0 68.6 167.61993 0.0 0.0 0.0 1993 73.6 57.3 130.91994 0.0 0.0 0.0 1994 121.6 59.3 180.91995 0.0 0.0 0.0 1995 68.3 28.3 96.61996 0.0 0.0 0.0 1996 63.8 44.2 108.01997 0.0 0.0 0.0 1997 107.8 66.3 174.11998 0.0 0.0 0.0 1998 62.2 34.3 96.52000 0.0 0.0 0.0 2000 55.4 17.6 73.02001 0.0 0.0 0.0 2001 52.9 19.8 72.72002 0.0 0.0 0.0 2002 79.7 36.8 116.62003 0.0 0.0 0.0 2003 35.6 15.3 50.92004 0.0 0.0 0.0 2004 58.5 31.2 89.62005 0.0 0.0 0.0 2005 40.3 30.8 71.12006 0.0 0.0 0.0 2006 45.4 14.0 59.4
SOURCE: Alaska Department of Fish and Game, Division of Subsistence, Household Surveys 1992-1998;BBNA Household Surveys, 2000-2007.
B-16
0
5
10
15
20
25
Jan Feb Mar Apr May Jun Jul Aug Sep Oct Nov Dec
Seas
onal
ly A
djus
ted
Tota
l Tak
e
Sea Lion Harbor Seal
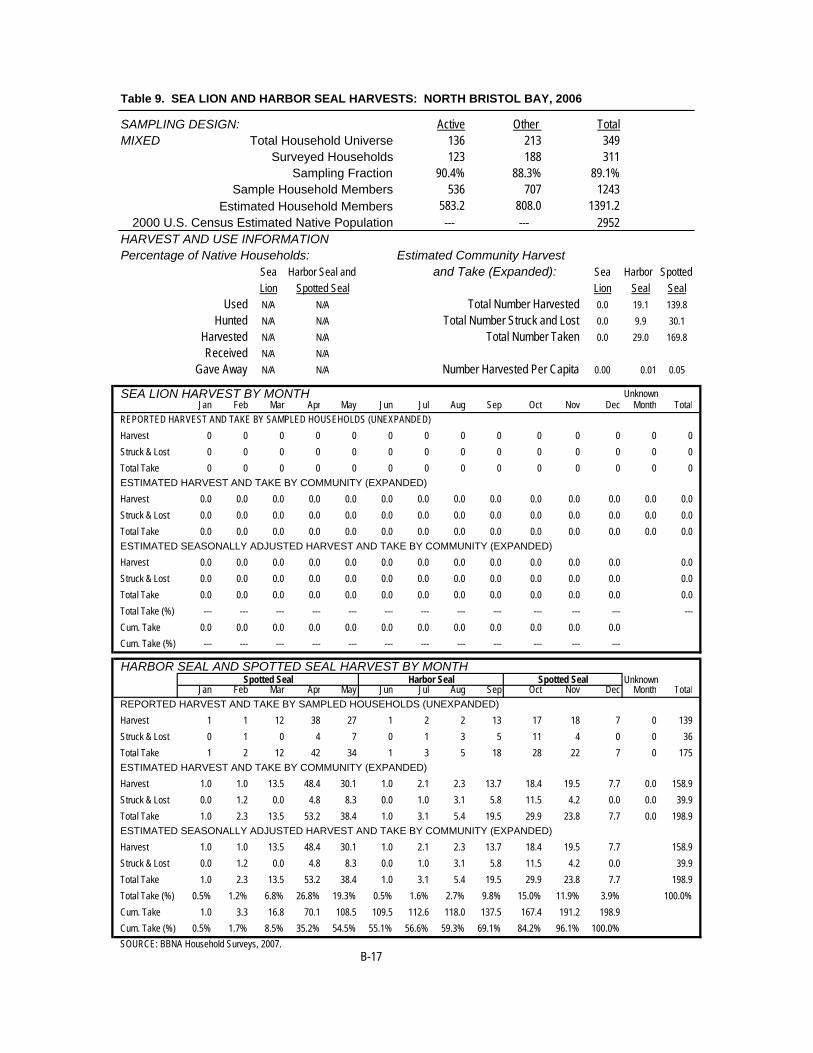
Table 9. SEA LION AND HARBOR SEAL HARVESTS: NORTH BRISTOL BAY, 2006
SAMPLING DESIGN: Active Other TotalMIXED Total Household Universe 136 213 349
Surveyed Households 123 188 311Sampling Fraction 90.4% 88.3% 89.1%
Sample Household Members 536 707 1243Estimated Household Members 583.2 808.0 1391.2
2000 U.S. Census Estimated Native Population --- --- 2952HARVEST AND USE INFORMATION Percentage of Native Households: Estimated Community Harvest
Sea Harbor Seal and and Take (Expanded): Sea Harbor SpottedLion Spotted Seal Lion Seal Seal
Used N/A N/A Total Number Harvested 0.0 19.1 139.8Hunted N/A N/A Total Number Struck and Lost 0.0 9.9 30.1
Harvested N/A N/A Total Number Taken 0.0 29.0 169.8Received N/A N/A
Gave Away N/A N/A Number Harvested Per Capita 0.00 0.01 0.05
SEA LION HARVEST BY MONTH UnknownJan Feb Mar Apr May Jun Jul Aug Sep Oct Nov Dec Month Total
REPORTED HARVEST AND TAKE BY SAMPLED HOUSEHOLDS (UNEXPANDED)Harvest 0 0 0 0 0 0 0 0 0 0 0 0 0 0Struck & Lost 0 0 0 0 0 0 0 0 0 0 0 0 0 0Total Take 0 0 0 0 0 0 0 0 0 0 0 0 0 0ESTIMATED HARVEST AND TAKE BY COMMUNITY (EXPANDED)Harvest 0.0 0.0 0.0 0.0 0.0 0.0 0.0 0.0 0.0 0.0 0.0 0.0 0.0 0.0Struck & Lost 0.0 0.0 0.0 0.0 0.0 0.0 0.0 0.0 0.0 0.0 0.0 0.0 0.0 0.0Total Take 0.0 0.0 0.0 0.0 0.0 0.0 0.0 0.0 0.0 0.0 0.0 0.0 0.0 0.0ESTIMATED SEASONALLY ADJUSTED HARVEST AND TAKE BY COMMUNITY (EXPANDED)Harvest 0.0 0.0 0.0 0.0 0.0 0.0 0.0 0.0 0.0 0.0 0.0 0.0 0.0Struck & Lost 0.0 0.0 0.0 0.0 0.0 0.0 0.0 0.0 0.0 0.0 0.0 0.0 0.0Total Take 0.0 0.0 0.0 0.0 0.0 0.0 0.0 0.0 0.0 0.0 0.0 0.0 0.0Total Take (%) --- --- --- --- --- --- --- --- --- --- --- --- ---Cum. Take 0.0 0.0 0.0 0.0 0.0 0.0 0.0 0.0 0.0 0.0 0.0 0.0Cum. Take (%) --- --- --- --- --- --- --- --- --- --- --- ---
HARBOR SEAL AND SPOTTED SEAL HARVEST BY MONTHSpotted Seal Harbor Seal Spotted Seal Unknown
Jan Feb Mar Apr May Jun Jul Aug Sep Oct Nov Dec Month TotalREPORTED HARVEST AND TAKE BY SAMPLED HOUSEHOLDS (UNEXPANDED)Harvest 1 1 12 38 27 1 2 2 13 17 18 7 0 139Struck & Lost 0 1 0 4 7 0 1 3 5 11 4 0 0 36Total Take 1 2 12 42 34 1 3 5 18 28 22 7 0 175ESTIMATED HARVEST AND TAKE BY COMMUNITY (EXPANDED)Harvest 1.0 1.0 13.5 48.4 30.1 1.0 2.1 2.3 13.7 18.4 19.5 7.7 0.0 158.9Struck & Lost 0.0 1.2 0.0 4.8 8.3 0.0 1.0 3.1 5.8 11.5 4.2 0.0 0.0 39.9Total Take 1.0 2.3 13.5 53.2 38.4 1.0 3.1 5.4 19.5 29.9 23.8 7.7 0.0 198.9ESTIMATED SEASONALLY ADJUSTED HARVEST AND TAKE BY COMMUNITY (EXPANDED)Harvest 1.0 1.0 13.5 48.4 30.1 1.0 2.1 2.3 13.7 18.4 19.5 7.7 158.9Struck & Lost 0.0 1.2 0.0 4.8 8.3 0.0 1.0 3.1 5.8 11.5 4.2 0.0 39.9Total Take 1.0 2.3 13.5 53.2 38.4 1.0 3.1 5.4 19.5 29.9 23.8 7.7 198.9Total Take (%) 0.5% 1.2% 6.8% 26.8% 19.3% 0.5% 1.6% 2.7% 9.8% 15.0% 11.9% 3.9% 100.0%Cum. Take 1.0 3.3 16.8 70.1 108.5 109.5 112.6 118.0 137.5 167.4 191.2 198.9Cum. Take (%) 0.5% 1.7% 8.5% 35.2% 54.5% 55.1% 56.6% 59.3% 69.1% 84.2% 96.1% 100.0% SOURCE: BBNA Household Surveys, 2007.
B-17

Table 9. (cont.) SEA LION AND HARBOR SEAL HARVESTS: NORTH BRISTOL BAY, 2006
HARVEST BY AGE AND SEXSea Lion Harbor Seal Spotted Seal
Reported by Community Est. Reported by Community Est. Reported by Community Est.Sample (Expanded) Sample* (Expanded) Sample* (Expanded)
Number % Number % Number % Number % Number % Number %Adult Male 0 --- 0.0 --- 2 11.1% 2.3 12.0% 15 12.4% 18.6 13.3%
Adult Female 0 --- 0.0 --- 1 5.6% 1.0 5.4% 3 2.5% 4.0 2.9%Adult Unknown Sex 0 --- 0.0 --- 2 11.1% 2.1 10.8% 33 27.3% 36.9 26.4%
Juvenile Male 0 --- 0.0 --- 3 16.7% 3.3 17.4% 10 8.3% 10.9 7.8%Juvenile Female 0 --- 0.0 --- 0 0.0% 0.0 0.0% 8 6.6% 8.5 6.1%
Juvenile Unknown Sex 0 --- 0.0 --- 7 38.9% 7.3 38.0% 18 14.9% 18.9 13.5%Pup Male 0 --- 0.0 --- 1 5.6% 1.0 5.5% 3 2.5% 3.5 2.5%
Pup Female 0 --- 0.0 --- 1 5.6% 1.0 5.5% 1 0.8% 1.1 0.8%Pup Unknown Sex 0 --- 0.0 --- 1 5.6% 1.0 5.5% 9 7.4% 9.7 6.9%
Male Unknown Age 0 --- 0.0 --- 0 0.0% 0.0 0.0% 2 1.7% 2.6 1.8%Female Unknown Age 0 --- 0.0 --- 0 0.0% 0.0 0.0% 1 0.8% 1.0 0.7%
Unknown Sex and Age 0 --- 0.0 --- 0 0.0% 0.0 0.0% 18 14.9% 24.2 17.3%Total 0 --- 0.0 --- 18 100.0% 19.1 100.0% 121 100.0% 139.8 100%
* Harvest in unknown months is not included in the sample harvest, but is included in the community estimate column.
SEASONALLY ADJUSTED TAKE BY MONTH, SEA LION, HARBOR SEAL, AND SPOTTED SEAL
ESTIMATED COMMUNITY HARVEST, STRUCK AND LOST, AND TAKE BY YEAR
SEA LION HARBOR SEAL SPOTTED SEALStruck/ Total Struck/ Total Struck/ Total
Year Harvest Lost Take Year Harvest Lost Take Year Harvest Lost Take1992 7.8 0.0 7.8 1992 58.4 13.2 71.6 1992 364.1 72.5 436.61993 3.3 3.3 6.5 1993 46.1 20.0 66.1 1993 215.1 49.1 264.11994 1.2 0.0 1.2 1994 16.2 3.3 19.5 1994 226.5 42.9 269.51995 0.0 0.0 0.0 1995 25.9 2.4 28.3 1995 163.7 33.5 197.21996 0.0 0.0 0.0 1996 29.6 10.0 39.6 1996 202.1 25.0 227.11997 3.6 0.0 3.6 1997 18.8 2.1 20.9 1997 133.6 16.6 150.21998 0.0 0.0 0.0 1998 33.2 3.6 36.8 1998 145.9 25.4 171.32000 0.0 0.0 0.0 2000 10.4 1.1 11.6 2000 217.0 40.4 257.52001 0.0 0.0 0.0 2001 8.8 1.2 10.0 2001 105.9 20.8 126.62002 0.0 0.0 0.0 2002 15.5 7.4 23.0 2002 184.5 44.6 229.12003 0.0 0.0 0.0 2003 29.8 1.4 31.2 2003 52.3 10.0 62.32004 1.2 0.0 1.2 2004 17.6 11.7 29.3 2004 123.8 46.5 170.42005 0.0 0.0 0.0 2005 23.9 8.9 32.7 2005 170.5 30.7 201.22006 0.0 0.0 0.0 2006 19.1 9.9 29.0 2006 139.8 30.1 169.8
SOURCE: Alaska Department of Fish and Game, Division of Subsistence, Household Surveys 1992-1998;BBNA Household Surveys, 2000-2007.
B-18
0
10
20
30
40
50
60
Jan Feb Mar Apr May Jun Jul Aug Sep Oct Nov Dec
Seas
onal
ly A
djus
ted
Tota
l Tak
e
Sea Lion Harbor Seal Spotted Seal

APPENDIX C
SUBSISTENCE TAKES OF HARBOR SEAL AND SEA LION
BY COMMUNITY
SOUTHEAST ALASKA 1-2 Angoon 3-4 Craig 5-6 Haines 7-8 Hoonah 9-10 Hydaburg 11-12 Juneau 13-14 Kake 15-16 Ketchikan 17-18 Klawock 19-20 Klukwan 21-22 Pelican 23-24 Petersburg 25-26 Saxman 27-28 Sitka 29-30 Wrangell 31-32 Yakutat NORTH PACIFIC RIM 33-34 Chenega Bay 35-36 Cordova 37-38 Nanwalek 39-40 Port Graham 41-42 Seldovia 43-44 Seward 45-46 Tatitlek 47-48 Valdez UPPER KENAI-COOK INLET 49-50 Anchorage 51-52 Homer 53-54 Kenai 55-56 Tyonek KODIAK ISLAND 57-58 Akhiok 59-60 Karluk 61-62 Kodiak City 63-64 Larsen Bay 65-66 Old Harbor 67-68 Ouzinkie 69-70 Port Lions
SOUTH ALASKA PENINSULA
71-72 Chignik Bay 73-74 Chignik Lagoon 75-76 Chignik Lake 77-78 False Pass 79-80 Ivanof Bay 81-82 King Cove 83-84 Perryville 85-86 Sand Point
ALEUTIAN ISLANDS
87-88 Adak 89-90 Akutan 91-92 Atka 93-94 Nikolski 95-96 Unalaska
PRIBILOF ISLANDS
97-98 St. George 99-100 St. Paul SOUTH BRISTOL BAY
101-102 Egegik 103-104 King Salmon 105-106 Levelock 107-108 Naknek 109-110 Pilot Point 111-112 Port Heiden 113-114 South Naknek
NORTH BRISTOL BAY
115-116 Aleknagik 117-118 Clark's Point 119-120 Dillingham 121-122 Manokotak 123-124 Togiak 125-126 Twin Hills

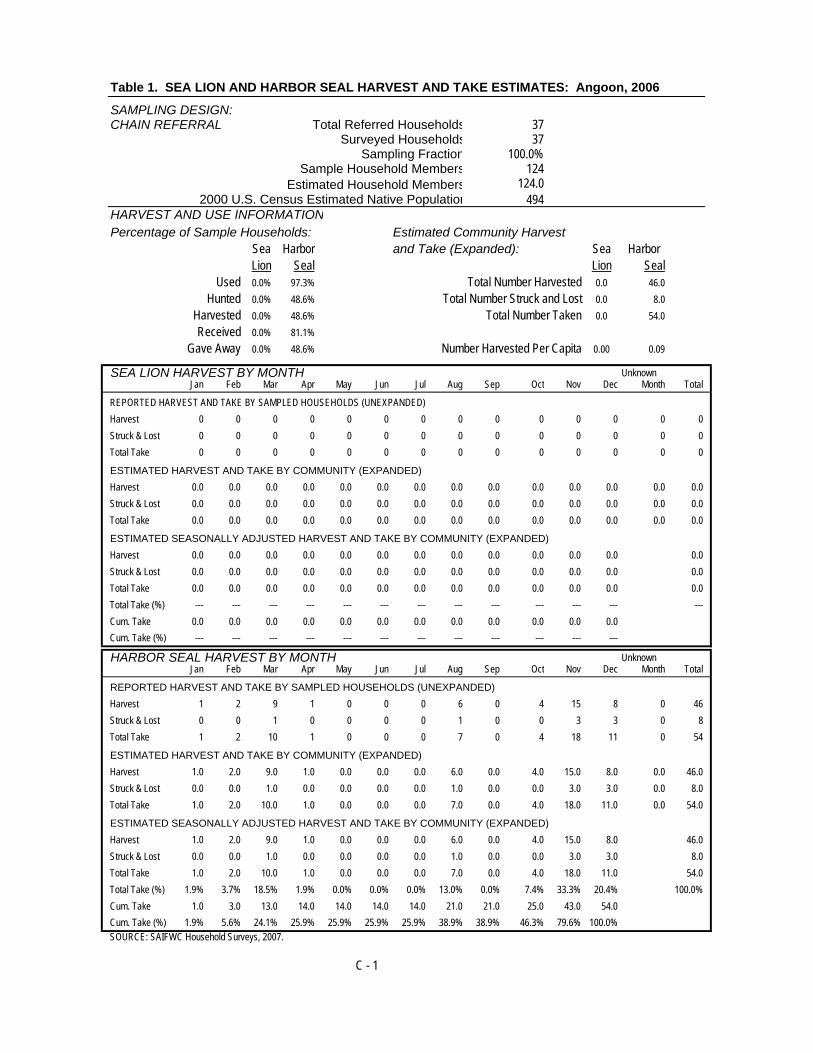
Table 1. SEA LION AND HARBOR SEAL HARVEST AND TAKE ESTIMATES: Angoon, 2006
SAMPLING DESIGN: CHAIN REFERRAL Total Referred Households 37
Surveyed Households 37Sampling Fraction 100.0%
Sample Household Members 124Estimated Household Members 124.0
2000 U.S. Census Estimated Native Population 494HARVEST AND USE INFORMATION
Percentage of Sample Households: Estimated Community Harvest Sea Harbor and Take (Expanded): Sea Harbor
Lion Seal Lion SealUsed 0.0% 97.3% Total Number Harvested 0.0 46.0
Hunted 0.0% 48.6% Total Number Struck and Lost 0.0 8.0Harvested 0.0% 48.6% Total Number Taken 0.0 54.0Received 0.0% 81.1%
Gave Away 0.0% 48.6% Number Harvested Per Capita 0.00 0.09
SEA LION HARVEST BY MONTH UnknownJan Feb Mar Apr May Jun Jul Aug Sep Oct Nov Dec Month Total
REPORTED HARVEST AND TAKE BY SAMPLED HOUSEHOLDS (UNEXPANDED)Harvest 0 0 0 0 0 0 0 0 0 0 0 0 0 0Struck & Lost 0 0 0 0 0 0 0 0 0 0 0 0 0 0Total Take 0 0 0 0 0 0 0 0 0 0 0 0 0 0
ESTIMATED HARVEST AND TAKE BY COMMUNITY (EXPANDED)Harvest 0.0 0.0 0.0 0.0 0.0 0.0 0.0 0.0 0.0 0.0 0.0 0.0 0.0 0.0Struck & Lost 0.0 0.0 0.0 0.0 0.0 0.0 0.0 0.0 0.0 0.0 0.0 0.0 0.0 0.0Total Take 0.0 0.0 0.0 0.0 0.0 0.0 0.0 0.0 0.0 0.0 0.0 0.0 0.0 0.0
ESTIMATED SEASONALLY ADJUSTED HARVEST AND TAKE BY COMMUNITY (EXPANDED)Harvest 0.0 0.0 0.0 0.0 0.0 0.0 0.0 0.0 0.0 0.0 0.0 0.0 0.0Struck & Lost 0.0 0.0 0.0 0.0 0.0 0.0 0.0 0.0 0.0 0.0 0.0 0.0 0.0Total Take 0.0 0.0 0.0 0.0 0.0 0.0 0.0 0.0 0.0 0.0 0.0 0.0 0.0Total Take (%) --- --- --- --- --- --- --- --- --- --- --- --- ---Cum. Take 0.0 0.0 0.0 0.0 0.0 0.0 0.0 0.0 0.0 0.0 0.0 0.0Cum. Take (%) --- --- --- --- --- --- --- --- --- --- --- ---
HARBOR SEAL HARVEST BY MONTH UnknownJan Feb Mar Apr May Jun Jul Aug Sep Oct Nov Dec Month Total
REPORTED HARVEST AND TAKE BY SAMPLED HOUSEHOLDS (UNEXPANDED)Harvest 1 2 9 1 0 0 0 6 0 4 15 8 0 46Struck & Lost 0 0 1 0 0 0 0 1 0 0 3 3 0 8Total Take 1 2 10 1 0 0 0 7 0 4 18 11 0 54
ESTIMATED HARVEST AND TAKE BY COMMUNITY (EXPANDED)Harvest 1.0 2.0 9.0 1.0 0.0 0.0 0.0 6.0 0.0 4.0 15.0 8.0 0.0 46.0Struck & Lost 0.0 0.0 1.0 0.0 0.0 0.0 0.0 1.0 0.0 0.0 3.0 3.0 0.0 8.0Total Take 1.0 2.0 10.0 1.0 0.0 0.0 0.0 7.0 0.0 4.0 18.0 11.0 0.0 54.0
ESTIMATED SEASONALLY ADJUSTED HARVEST AND TAKE BY COMMUNITY (EXPANDED)Harvest 1.0 2.0 9.0 1.0 0.0 0.0 0.0 6.0 0.0 4.0 15.0 8.0 46.0Struck & Lost 0.0 0.0 1.0 0.0 0.0 0.0 0.0 1.0 0.0 0.0 3.0 3.0 8.0Total Take 1.0 2.0 10.0 1.0 0.0 0.0 0.0 7.0 0.0 4.0 18.0 11.0 54.0Total Take (%) 1.9% 3.7% 18.5% 1.9% 0.0% 0.0% 0.0% 13.0% 0.0% 7.4% 33.3% 20.4% 100.0%Cum. Take 1.0 3.0 13.0 14.0 14.0 14.0 14.0 21.0 21.0 25.0 43.0 54.0Cum. Take (%) 1.9% 5.6% 24.1% 25.9% 25.9% 25.9% 25.9% 38.9% 38.9% 46.3% 79.6% 100.0% SOURCE: SAIFWC Household Surveys, 2007.
C - 1

Table 1. (cont.) SEA LION & HARBOR SEAL HARVEST ESTIMATES: Angoon, 2006
HARVEST BY AGE AND SEXSea Lion Harbor Seal
Reported by Community Est. Reported by Community Est.Sample (Expanded) Sample (Expanded)
Number % Number % Number % Number %Adult Male 0 --- 0.0 --- 26 56.5% 26.0 56.5%
Adult Female 0 --- 0.0 --- 1 2.2% 1.0 2.2%Adult Unknown Sex 0 --- 0.0 --- 8 17.4% 8.0 17.4%
Juvenile Male 0 --- 0.0 --- 2 4.3% 2.0 4.3%Juvenile Female 0 --- 0.0 --- 2 4.3% 2.0 4.3%
Juvenile Unknown Sex 0 --- 0.0 --- 0 0.0% 0.0 0.0%Pup Male 0 --- 0.0 --- 1 2.2% 1.0 2.2%
Pup Female 0 --- 0.0 --- 0 0.0% 0.0 0.0%Pup Unknown Sex 0 --- 0.0 --- 3 6.5% 3.0 6.5%
Male Unknown Age 0 --- 0.0 --- 3 6.5% 3.0 6.5%Female Unknown Age 0 --- 0.0 --- 0 0.0% 0.0 0.0%Unknown Sex and Age 0 --- 0.0 --- 0 0.0% 0.0 0.0%
Total 0 --- 0.0 --- 46 100.0% 46.0 100.0%
SEASONALLY ADJUSTED TAKE BY MONTH, SEA LION AND HARBOR SEAL
ESTIMATED COMMUNITY HARVEST, STRUCK AND LOST, AND TAKE BY YEAR
SEA LION HARBOR SEALStruck/ Total Struck/ Total
Year Harvest Lost Take Year Harvest Lost Take
1992 0.0 0.0 0.0 1992 125.1 28.9 154.01993 0.0 0.0 0.0 1993 56.6 9.9 66.51994 0.0 0.0 0.0 1994 66.9 21.1 88.01995 0.0 0.0 0.0 1995 80.9 9.7 90.61996 0.0 0.0 0.0 1996 71.0 2.0 73.01997 0.0 0.0 0.0 1997 51.0 7.1 58.11998 0.0 0.0 0.0 1998 53.0 2.0 55.02000 1.0 0.0 1.0 2000 64.3 6.1 70.42001 0.0 0.0 0.0 2001 85.0 5.2 90.22002 0.0 0.0 0.0 2002 72.7 2.2 74.92003 0.0 0.0 0.0 2003 54.9 0.0 54.92004 0.0 0.0 0.0 2004 47.4 3.2 50.52005 0.0 0.0 0.0 2005 57.5 6.2 63.72006 0.0 0.0 0.0 2006 46.0 8.0 54.0
SOURCE: Alaska Department of Fish and Game, Division of Subsistence, Household Surveys 1992-1998;SAIFWC Household Surveys, 2000-2007.
C - 2
0
2
4
6
8
10
12
14
16
18
20
Jan Feb Mar Apr May Jun Jul Aug Sep Oct Nov Dec
Seas
onal
ly A
djus
ted
Tota
l Tak
e
Sea Lion Harbor Seal

Table 2. SEA LION AND HARBOR SEAL HARVEST AND TAKE ESTIMATES: Craig, 2006
SAMPLING DESIGN: CHAIN REFERRAL Total Referred Households 20
Surveyed Households 15Sampling Fraction
Sample Household Members 32Estimated Household Members 42.7
2000 U.S. Census Estimated Native Population 432HARVEST AND USE INFORMATION
Percentage of Sample Households: Estimated Community Harvest Sea Harbor and Take (Expanded): Sea Harbor
Lion Seal Lion SealUsed 0.0% 13.3% Total Number Harvested 0.0 1.3
Hunted 0.0% 6.7% Total Number Struck and Lost 0.0 0.0Harvested 0.0% 6.7% Total Number Taken 0.0 1.3Received 0.0% 6.7%
Gave Away 0.0% 6.7% Number Harvested Per Capita 0.00 0.00
SEA LION HARVEST BY MONTH UnknownJan Feb Mar Apr May Jun Jul Aug Sep Oct Nov Dec Month Total
REPORTED HARVEST AND TAKE BY SAMPLED HOUSEHOLDS (UNEXPANDED)Harvest 0 0 0 0 0 0 0 0 0 0 0 0 0 0Struck & Lost 0 0 0 0 0 0 0 0 0 0 0 0 0 0Total Take 0 0 0 0 0 0 0 0 0 0 0 0 0 0
ESTIMATED HARVEST AND TAKE BY COMMUNITY (EXPANDED)Harvest 0.0 0.0 0.0 0.0 0.0 0.0 0.0 0.0 0.0 0.0 0.0 0.0 0.0 0.0Struck & Lost 0.0 0.0 0.0 0.0 0.0 0.0 0.0 0.0 0.0 0.0 0.0 0.0 0.0 0.0Total Take 0.0 0.0 0.0 0.0 0.0 0.0 0.0 0.0 0.0 0.0 0.0 0.0 0.0 0.0
ESTIMATED SEASONALLY ADJUSTED HARVEST AND TAKE BY COMMUNITY (EXPANDED)Harvest 0.0 0.0 0.0 0.0 0.0 0.0 0.0 0.0 0.0 0.0 0.0 0.0 0.0Struck & Lost 0.0 0.0 0.0 0.0 0.0 0.0 0.0 0.0 0.0 0.0 0.0 0.0 0.0Total Take 0.0 0.0 0.0 0.0 0.0 0.0 0.0 0.0 0.0 0.0 0.0 0.0 0.0Total Take (%) --- --- --- --- --- --- --- --- --- --- --- --- ---Cum. Take 0.0 0.0 0.0 0.0 0.0 0.0 0.0 0.0 0.0 0.0 0.0 0.0Cum. Take (%) --- --- --- --- --- --- --- --- --- --- --- ---
HARBOR SEAL HARVEST BY MONTH UnknownJan Feb Mar Apr May Jun Jul Aug Sep Oct Nov Dec Month Total
REPORTED HARVEST AND TAKE BY SAMPLED HOUSEHOLDS (UNEXPANDED)Harvest 0 0 0 1 0 0 0 0 0 0 0 0 0 1Struck & Lost 0 0 0 0 0 0 0 0 0 0 0 0 0 0Total Take 0 0 0 1 0 0 0 0 0 0 0 0 0 1
ESTIMATED HARVEST AND TAKE BY COMMUNITY (EXPANDED)Harvest 0.0 0.0 0.0 1.3 0.0 0.0 0.0 0.0 0.0 0.0 0.0 0.0 0.0 1.3Struck & Lost 0.0 0.0 0.0 0.0 0.0 0.0 0.0 0.0 0.0 0.0 0.0 0.0 0.0 0.0Total Take 0.0 0.0 0.0 1.3 0.0 0.0 0.0 0.0 0.0 0.0 0.0 0.0 0.0 1.3
ESTIMATED SEASONALLY ADJUSTED HARVEST AND TAKE BY COMMUNITY (EXPANDED)Harvest 0.0 0.0 0.0 1.3 0.0 0.0 0.0 0.0 0.0 0.0 0.0 0.0 1.3Struck & Lost 0.0 0.0 0.0 0.0 0.0 0.0 0.0 0.0 0.0 0.0 0.0 0.0 0.0Total Take 0.0 0.0 0.0 1.3 0.0 0.0 0.0 0.0 0.0 0.0 0.0 0.0 1.3Total Take (%) 0.0% 0.0% 0.0% 100.0% 0.0% 0.0% 0.0% 0.0% 0.0% 0.0% 0.0% 0.0% 100.0%Cum. Take 0.0 0.0 0.0 1.3 1.3 1.3 1.3 1.3 1.3 1.3 1.3 1.3Cum. Take (%) 0.0% 0.0% 0.0% 100.0% 100.0% 100.0% 100.0% 100.0% 100.0% 100.0% 100.0% 100.0% SOURCE: SAIFWC Household Surveys, 2007.
C - 3
75.0%

Table 2. (cont.) SEA LION & HARBOR SEAL HARVEST ESTIMATES: Craig, 2006
HARVEST BY AGE AND SEXSea Lion Harbor Seal
Reported by Community Est. Reported by Community Est.Sample (Expanded) Sample (Expanded)
Number % Number % Number % Number %Adult Male 0 --- 0.0 --- 1 100.0% 1.3 100.0%
Adult Female 0 --- 0.0 --- 0 0.0% 0.0 0.0%Adult Unknown Sex 0 --- 0.0 --- 0 0.0% 0.0 0.0%
Juvenile Male 0 --- 0.0 --- 0 0.0% 0.0 0.0%Juvenile Female 0 --- 0.0 --- 0 0.0% 0.0 0.0%
Juvenile Unknown Sex 0 --- 0.0 --- 0 0.0% 0.0 0.0%Pup Male 0 --- 0.0 --- 0 0.0% 0.0 0.0%
Pup Female 0 --- 0.0 --- 0 0.0% 0.0 0.0%Pup Unknown Sex 0 --- 0.0 --- 0 0.0% 0.0 0.0%
Male Unknown Age 0 --- 0.0 --- 0 0.0% 0.0 0.0%Female Unknown Age 0 --- 0.0 --- 0 0.0% 0.0 0.0%Unknown Sex and Age 0 --- 0.0 --- 0 0.0% 0.0 0.0%
Total 0 --- 0.0 --- 1 100.0% 1.3 100.0%
SEASONALLY ADJUSTED TAKE BY MONTH, SEA LION AND HARBOR SEAL
ESTIMATED COMMUNITY HARVEST, STRUCK AND LOST, AND TAKE BY YEAR
SEA LION HARBOR SEALStruck/ Total Struck/ Total
Year Harvest Lost Take Year Harvest Lost Take
1992 0.0 0.0 0.0 1992 74.2 0.0 74.21993 0.0 0.0 0.0 1993 51.1 9.8 60.91994 0.0 0.0 0.0 1994 42.7 6.6 49.31995 0.0 0.0 0.0 1995 69.4 13.6 83.11996 0.0 0.0 0.0 1996 48.2 8.0 56.31997 0.0 0.0 0.0 1997 62.0 7.5 69.51998 0.0 0.0 0.0 1998 52.7 5.2 57.92000 0.0 0.0 0.0 2000 35.0 3.0 38.02001 0.0 0.0 0.0 2001 54.0 4.0 58.02002 0.0 0.0 0.0 2002 38.9 5.7 44.62003 0.0 0.0 0.0 2003 28.0 6.0 34.02004 3.3 0.0 3.3 2004 29.7 5.5 35.22005 0.0 0.0 0.0 2005 26.0 3.0 29.02006 0.0 0.0 0.0 2006 1.3 0.0 1.3
SOURCE: Alaska Department of Fish and Game, Division of Subsistence, Household Surveys 1992-1998; SAIFWC Household Surveys, 2000-2007.
C - 4
0
1
2
Jan Feb Mar Apr May Jun Jul Aug Sep Oct Nov Dec
Seas
onal
ly A
djus
ted
Tota
l Tak
e
Sea Lion Harbor Seal

Table 3. SEA LION AND HARBOR SEAL HARVEST AND TAKE ESTIMATES: Haines, 2006
SAMPLING DESIGN: CHAIN REFERRAL Total Referred Households 13
Surveyed Households 11Sampling Fraction 84.6%
Sample Household Members 29Estimated Household Members 34.3
2000 U.S. Census Estimated Native Population 335HARVEST AND USE INFORMATION
Percentage of Sample Households: Estimated Community Harvest Sea Harbor and Take (Expanded): Sea Harbor
Lion Seal Lion SealUsed 0.0% 18.2% Total Number Harvested 0.0 4.7
Hunted 0.0% 9.1% Total Number Struck and Lost 0.0 0.0Harvested 0.0% 9.1% Total Number Taken 0.0 4.7Received 0.0% 9.1%
Gave Away 0.0% 9.1% Number Harvested Per Capita 0.00 0.01
SEA LION HARVEST BY MONTH UnknownJan Feb Mar Apr May Jun Jul Aug Sep Oct Nov Dec Month Total
REPORTED HARVEST AND TAKE BY SAMPLED HOUSEHOLDS (UNEXPANDED)Harvest 0 0 0 0 0 0 0 0 0 0 0 0 0 0Struck & Lost 0 0 0 0 0 0 0 0 0 0 0 0 0 0Total Take 0 0 0 0 0 0 0 0 0 0 0 0 0 0
ESTIMATED HARVEST AND TAKE BY COMMUNITY (EXPANDED)Harvest 0.0 0.0 0.0 0.0 0.0 0.0 0.0 0.0 0.0 0.0 0.0 0.0 0.0 0.0Struck & Lost 0.0 0.0 0.0 0.0 0.0 0.0 0.0 0.0 0.0 0.0 0.0 0.0 0.0 0.0Total Take 0.0 0.0 0.0 0.0 0.0 0.0 0.0 0.0 0.0 0.0 0.0 0.0 0.0 0.0
ESTIMATED SEASONALLY ADJUSTED HARVEST AND TAKE BY COMMUNITY (EXPANDED)Harvest 0.0 0.0 0.0 0.0 0.0 0.0 0.0 0.0 0.0 0.0 0.0 0.0 0.0Struck & Lost 0.0 0.0 0.0 0.0 0.0 0.0 0.0 0.0 0.0 0.0 0.0 0.0 0.0Total Take 0.0 0.0 0.0 0.0 0.0 0.0 0.0 0.0 0.0 0.0 0.0 0.0 0.0Total Take (%) --- --- --- --- --- --- --- --- --- --- --- --- ---Cum. Take 0.0 0.0 0.0 0.0 0.0 0.0 0.0 0.0 0.0 0.0 0.0 0.0Cum. Take (%) --- --- --- --- --- --- --- --- --- --- --- ---
HARBOR SEAL HARVEST BY MONTH UnknownJan Feb Mar Apr May Jun Jul Aug Sep Oct Nov Dec Month Total
REPORTED HARVEST AND TAKE BY SAMPLED HOUSEHOLDS (UNEXPANDED)Harvest 2 2 0 0 0 0 0 0 0 0 0 0 0 4Struck & Lost 0 0 0 0 0 0 0 0 0 0 0 0 0 0Total Take 2 2 0 0 0 0 0 0 0 0 0 0 0 4
ESTIMATED HARVEST AND TAKE BY COMMUNITY (EXPANDED)Harvest 2.4 2.4 0.0 0.0 0.0 0.0 0.0 0.0 0.0 0.0 0.0 0.0 0.0 4.7Struck & Lost 0.0 0.0 0.0 0.0 0.0 0.0 0.0 0.0 0.0 0.0 0.0 0.0 0.0 0.0Total Take 2.4 2.4 0.0 0.0 0.0 0.0 0.0 0.0 0.0 0.0 0.0 0.0 0.0 4.7
ESTIMATED SEASONALLY ADJUSTED HARVEST AND TAKE BY COMMUNITY (EXPANDED)Harvest 2.4 2.4 0.0 0.0 0.0 0.0 0.0 0.0 0.0 0.0 0.0 0.0 4.7Struck & Lost 0.0 0.0 0.0 0.0 0.0 0.0 0.0 0.0 0.0 0.0 0.0 0.0 0.0Total Take 2.4 2.4 0.0 0.0 0.0 0.0 0.0 0.0 0.0 0.0 0.0 0.0 4.7Total Take (%) 50.0% 50.0% 0.0% 0.0% 0.0% 0.0% 0.0% 0.0% 0.0% 0.0% 0.0% 0.0% 100.0%Cum. Take 2.4 4.7 4.7 4.7 4.7 4.7 4.7 4.7 4.7 4.7 4.7 4.7Cum. Take (%) 50.0% 100.0% 100.0% 100.0% 100.0% 100.0% 100.0% 100.0% 100.0% 100.0% 100.0% 100.0% SOURCE: SAIFWC Household Surveys, 2007.
C - 5

Table 3. (cont.) SEA LION & HARBOR SEAL HARVEST ESTIMATES: Haines, 2006
HARVEST BY AGE AND SEXSea Lion Harbor Seal
Reported by Community Est. Reported by Community Est.Sample (Expanded) Sample (Expanded)
Number % Number % Number % Number %Adult Male 0 --- 0.0 --- 2 50.0% 2.4 50.0%
Adult Female 0 --- 0.0 --- 2 50.0% 2.4 50.0%Adult Unknown Sex 0 --- 0.0 --- 0 0.0% 0.0 0.0%
Juvenile Male 0 --- 0.0 --- 0 0.0% 0.0 0.0%Juvenile Female 0 --- 0.0 --- 0 0.0% 0.0 0.0%
Juvenile Unknown Sex 0 --- 0.0 --- 0 0.0% 0.0 0.0%Pup Male 0 --- 0.0 --- 0 0.0% 0.0 0.0%
Pup Female 0 --- 0.0 --- 0 0.0% 0.0 0.0%Pup Unknown Sex 0 --- 0.0 --- 0 0.0% 0.0 0.0%
Male Unknown Age 0 --- 0.0 --- 0 0.0% 0.0 0.0%Female Unknown Age 0 --- 0.0 --- 0 0.0% 0.0 0.0%Unknown Sex and Age 0 --- 0.0 --- 0 0.0% 0.0 0.0%
Total 0 --- 0.0 --- 4 100.0% 4.7 100.0%
SEASONALLY ADJUSTED TAKE BY MONTH, SEA LION AND HARBOR SEAL
ESTIMATED COMMUNITY HARVEST, STRUCK AND LOST, AND TAKE BY YEAR
SEA LION HARBOR SEALStruck/ Total Struck/ Total
Year Harvest Lost Take Year Harvest Lost Take
1992 0.0 0.0 0.0 1992 30.5 7.9 38.41993 0.0 0.0 0.0 1993 23.0 2.3 25.31994 0.0 0.0 0.0 1994 39.3 2.2 41.51995 0.0 0.0 0.0 1995 24.0 9.0 33.01996 0.0 0.0 0.0 1996 41.1 3.4 44.61997 0.0 0.0 0.0 1997 36.8 10.5 47.31998 0.0 0.0 0.0 1998 30.7 10.6 41.32000 0.0 0.0 0.0 2000 17.5 0.0 17.52001 0.0 0.0 0.0 2001 19.3 1.1 20.42002 0.0 0.0 0.0 2002 19.6 26.2 45.82003 0.0 0.0 0.0 2003 12.0 0.0 12.02004 0.0 0.0 0.0 2004 7.0 0.0 7.02005 0.0 0.0 0.0 2005 2.0 0.0 2.02006 0.0 0.0 0.0 2006 4.7 0.0 4.7
SOURCE: Alaska Department of Fish and Game, Division of Subsistence, Household Surveys 1992-1998; SAIFWC Household Surveys, 2000-2007.
C - 6
0
1
2
3
Jan Feb Mar Apr May Jun Jul Aug Sep Oct Nov Dec
Seas
onal
ly A
djus
ted
Tota
l Tak
e
Sea Lion Harbor Seal

Table 4. SEA LION AND HARBOR SEAL HARVEST AND TAKE ESTIMATES: Hoonah, 2006
SAMPLING DESIGN: CHAIN REFERRAL Total Referred Households 48
Surveyed Households 38Sampling Fraction 79.2%
Sample Household Members 113Estimated Household Members 142.7
2000 U.S. Census Estimated Native Population 597HARVEST AND USE INFORMATION
Percentage of Sample Households: Estimated Community Harvest Sea Harbor and Take (Expanded): Sea Harbor
Lion Seal Lion SealUsed 0.0% 50.0% Total Number Harvested 0.0 55.6
Hunted 5.3% 28.9% Total Number Struck and Lost 10.1 7.6Harvested 0.0% 26.3% Total Number Taken 10.1 63.2Received 0.0% 42.1%
Gave Away 0.0% 23.7% Number Harvested Per Capita 0.00 0.09
SEA LION HARVEST BY MONTH UnknownJan Feb Mar Apr May Jun Jul Aug Sep Oct Nov Dec Month Total
REPORTED HARVEST AND TAKE BY SAMPLED HOUSEHOLDS (UNEXPANDED)Harvest 0 0 0 0 0 0 0 0 0 0 0 0 0 0Struck & Lost 0 0 0 0 0 0 0 0 0 3 3 0 2 8Total Take 0 0 0 0 0 0 0 0 0 3 3 0 2 8
ESTIMATED HARVEST AND TAKE BY COMMUNITY (EXPANDED)Harvest 0.0 0.0 0.0 0.0 0.0 0.0 0.0 0.0 0.0 0.0 0.0 0.0 0.0 0.0Struck & Lost 0.0 0.0 0.0 0.0 0.0 0.0 0.0 0.0 0.0 3.8 3.8 0.0 2.5 10.1Total Take 0.0 0.0 0.0 0.0 0.0 0.0 0.0 0.0 0.0 3.8 3.8 0.0 2.5 10.1
ESTIMATED SEASONALLY ADJUSTED HARVEST AND TAKE BY COMMUNITY (EXPANDED)Harvest 0.0 0.0 0.0 0.0 0.0 0.0 0.0 0.0 0.0 0.0 0.0 0.0 0.0Struck & Lost 0.0 0.0 0.0 0.0 0.0 0.0 0.0 0.0 0.0 5.1 5.1 0.0 10.1Total Take 0.0 0.0 0.0 0.0 0.0 0.0 0.0 0.0 0.0 5.1 5.1 0.0 10.1Total Take (%) 0.0% 0.0% 0.0% 0.0% 0.0% 0.0% 0.0% 0.0% 0.0% 50.0% 50.0% 0.0% 100.0%Cum. Take 0.0 0.0 0.0 0.0 0.0 0.0 0.0 0.0 0.0 5.1 10.1 10.1Cum. Take (%) 0.0% 0.0% 0.0% 0.0% 0.0% 0.0% 0.0% 0.0% 0.0% 50.0% 100.0% 100.0%
HARBOR SEAL HARVEST BY MONTH UnknownJan Feb Mar Apr May Jun Jul Aug Sep Oct Nov Dec Month Total
REPORTED HARVEST AND TAKE BY SAMPLED HOUSEHOLDS (UNEXPANDED)Harvest 2 2 2 3 2 3 4 5 6 10 3 2 0 44Struck & Lost 0 0 1 1 0 0 1 2 1 0 0 0 0 6Total Take 2 2 3 4 2 3 5 7 7 10 3 2 0 50
ESTIMATED HARVEST AND TAKE BY COMMUNITY (EXPANDED)Harvest 2.5 2.5 2.5 3.8 2.5 3.8 5.1 6.3 7.6 12.6 3.8 2.5 0.0 55.6Struck & Lost 0.0 0.0 1.3 1.3 0.0 0.0 1.3 2.5 1.3 0.0 0.0 0.0 0.0 7.6Total Take 2.5 2.5 3.8 5.1 2.5 3.8 6.3 8.8 8.8 12.6 3.8 2.5 0.0 63.2
ESTIMATED SEASONALLY ADJUSTED HARVEST AND TAKE BY COMMUNITY (EXPANDED)Harvest 2.5 2.5 2.5 3.8 2.5 3.8 5.1 6.3 7.6 12.6 3.8 2.5 55.6Struck & Lost 0.0 0.0 1.3 1.3 0.0 0.0 1.3 2.5 1.3 0.0 0.0 0.0 7.6Total Take 2.5 2.5 3.8 5.1 2.5 3.8 6.3 8.8 8.8 12.6 3.8 2.5 63.2Total Take (%) 4.0% 4.0% 6.0% 8.0% 4.0% 6.0% 10.0% 14.0% 14.0% 20.0% 6.0% 4.0% 100.0%Cum. Take 2.5 5.1 8.8 13.9 16.4 20.2 26.5 35.4 44.2 56.8 60.6 63.2Cum. Take (%) 4.0% 8.0% 14.0% 22.0% 26.0% 32.0% 42.0% 56.0% 70.0% 90.0% 96.0% 100.0% SOURCE: SAIFWC Household Surveys, 2007.
C - 7

Table 4. (cont.) SEA LION & HARBOR SEAL HARVEST ESTIMATES: Hoonah, 2006
HARVEST BY AGE AND SEXSea Lion Harbor Seal
Reported by Community Est. Reported by Community Est.Sample (Expanded) Sample (Expanded)
Number % Number % Number % Number %Adult Male 0 --- 0.0 --- 24 54.5% 30.3 54.5%
Adult Female 0 --- 0.0 --- 17 38.6% 21.5 38.6%Adult Unknown Sex 0 --- 0.0 --- 0 0.0% 0.0 0.0%
Juvenile Male 0 --- 0.0 --- 2 4.5% 2.5 4.5%Juvenile Female 0 --- 0.0 --- 1 2.3% 1.3 2.3%
Juvenile Unknown Sex 0 --- 0.0 --- 0 0.0% 0.0 0.0%Pup Male 0 --- 0.0 --- 0 0.0% 0.0 0.0%
Pup Female 0 --- 0.0 --- 0 0.0% 0.0 0.0%Pup Unknown Sex 0 --- 0.0 --- 0 0.0% 0.0 0.0%
Male Unknown Age 0 --- 0.0 --- 0 0.0% 0.0 0.0%Female Unknown Age 0 --- 0.0 --- 0 0.0% 0.0 0.0%Unknown Sex and Age 0 --- 0.0 --- 0 0.0% 0.0 0.0%
Total 0 --- 0.0 --- 44 100.0% 55.6 100.0%
SEASONALLY ADJUSTED TAKE BY MONTH, SEA LION AND HARBOR SEAL
ESTIMATED COMMUNITY HARVEST, STRUCK AND LOST, AND TAKE BY YEAR
SEA LION HARBOR SEALStruck/ Total Struck/ Total
Year Harvest Lost Take Year Harvest Lost Take
1992 0.0 0.0 0.0 1992 350.2 24.8 375.01993 0.0 0.0 0.0 1993 324.4 35.8 360.21994 0.0 0.0 0.0 1994 240.7 15.0 255.81995 0.0 0.0 0.0 1995 236.6 19.7 256.31996 0.0 0.0 0.0 1996 359.7 48.6 408.31997 0.0 0.0 0.0 1997 143.8 9.9 153.81998 0.0 0.0 0.0 1998 169.7 19.8 189.62000 0.0 0.0 0.0 2000 147.9 16.0 163.92001 0.0 0.0 0.0 2001 143.4 13.2 156.72002 0.0 0.0 0.0 2002 96.4 6.0 102.42003 0.0 4.6 4.6 2003 52.2 10.4 62.62004 0.0 7.2 7.2 2004 106.2 9.0 115.22005 0.0 9.0 9.0 2005 53.0 11.0 64.02006 0.0 10.1 10.1 2006 55.6 7.6 63.2
SOURCE: Alaska Department of Fish and Game, Division of Subsistence, Household Surveys 1992-1998; SAIFWC Household Surveys, 2000-2007.
C - 8
0
2
4
6
8
10
12
14
Jan Feb Mar Apr May Jun Jul Aug Sep Oct Nov Dec
Seas
onal
ly A
djus
ted
Tota
l Tak
e
Sea Lion Harbor Seal

Table 5. SEA LION AND HARBOR SEAL HARVEST AND TAKE ESTIMATES: Hydaburg, 2006
SAMPLING DESIGN: CHAIN REFERRAL Total Referred Households 16
Surveyed Households 10Sampling Fraction 62.5%
Sample Household Members 27Estimated Household Members 43.2
2000 U.S. Census Estimated Native Population 342HARVEST AND USE INFORMATION
Percentage of Sample Households: Estimated Community Harvest Sea Harbor and Take (Expanded): Sea Harbor
Lion Seal Lion SealUsed 0.0% 40.0% Total Number Harvested 0.0 14.4
Hunted 0.0% 40.0% Total Number Struck and Lost 0.0 0.0Harvested 0.0% 40.0% Total Number Taken 0.0 14.4Received 0.0% 0.0%
Gave Away 0.0% 20.0% Number Harvested Per Capita 0.00 0.04
SEA LION HARVEST BY MONTH UnknownJan Feb Mar Apr May Jun Jul Aug Sep Oct Nov Dec Month Total
REPORTED HARVEST AND TAKE BY SAMPLED HOUSEHOLDS (UNEXPANDED)Harvest 0 0 0 0 0 0 0 0 0 0 0 0 0 0Struck & Lost 0 0 0 0 0 0 0 0 0 0 0 0 0 0Total Take 0 0 0 0 0 0 0 0 0 0 0 0 0 0
ESTIMATED HARVEST AND TAKE BY COMMUNITY (EXPANDED)Harvest 0.0 0.0 0.0 0.0 0.0 0.0 0.0 0.0 0.0 0.0 0.0 0.0 0.0 0.0Struck & Lost 0.0 0.0 0.0 0.0 0.0 0.0 0.0 0.0 0.0 0.0 0.0 0.0 0.0 0.0Total Take 0.0 0.0 0.0 0.0 0.0 0.0 0.0 0.0 0.0 0.0 0.0 0.0 0.0 0.0
ESTIMATED SEASONALLY ADJUSTED HARVEST AND TAKE BY COMMUNITY (EXPANDED)Harvest 0.0 0.0 0.0 0.0 0.0 0.0 0.0 0.0 0.0 0.0 0.0 0.0 0.0Struck & Lost 0.0 0.0 0.0 0.0 0.0 0.0 0.0 0.0 0.0 0.0 0.0 0.0 0.0Total Take 0.0 0.0 0.0 0.0 0.0 0.0 0.0 0.0 0.0 0.0 0.0 0.0 0.0Total Take (%) --- --- --- --- --- --- --- --- --- --- --- --- ---Cum. Take 0.0 0.0 0.0 0.0 0.0 0.0 0.0 0.0 0.0 0.0 0.0 0.0Cum. Take (%) --- --- --- --- --- --- --- --- --- --- --- ---
HARBOR SEAL HARVEST BY MONTH UnknownJan Feb Mar Apr May Jun Jul Aug Sep Oct Nov Dec Month Total
REPORTED HARVEST AND TAKE BY SAMPLED HOUSEHOLDS (UNEXPANDED)Harvest 0 2 2 2 0 0 0 0 0 0 1 1 1 9Struck & Lost 0 0 0 0 0 0 0 0 0 0 0 0 0 0Total Take 0 2 2 2 0 0 0 0 0 0 1 1 1 9
ESTIMATED HARVEST AND TAKE BY COMMUNITY (EXPANDED)Harvest 0.0 3.2 3.2 3.2 0.0 0.0 0.0 0.0 0.0 0.0 1.6 1.6 1.6 14.4Struck & Lost 0.0 0.0 0.0 0.0 0.0 0.0 0.0 0.0 0.0 0.0 0.0 0.0 0.0 0.0Total Take 0.0 3.2 3.2 3.2 0.0 0.0 0.0 0.0 0.0 0.0 1.6 1.6 1.6 14.4
ESTIMATED SEASONALLY ADJUSTED HARVEST AND TAKE BY COMMUNITY (EXPANDED)Harvest 0.0 3.6 3.6 3.6 0.0 0.0 0.0 0.0 0.0 0.0 1.8 1.8 14.4Struck & Lost 0.0 0.0 0.0 0.0 0.0 0.0 0.0 0.0 0.0 0.0 0.0 0.0 0.0Total Take 0.0 3.6 3.6 3.6 0.0 0.0 0.0 0.0 0.0 0.0 1.8 1.8 14.4Total Take (%) 0.0% 25.0% 25.0% 25.0% 0.0% 0.0% 0.0% 0.0% 0.0% 0.0% 12.5% 12.5% 100.0%Cum. Take 0.0 3.6 7.2 10.8 10.8 10.8 10.8 10.8 10.8 10.8 12.6 14.4Cum. Take (%) 0.0% 25.0% 50.0% 75.0% 75.0% 75.0% 75.0% 75.0% 75.0% 75.0% 87.5% 100.0% SOURCE: Alaska Department of Fish and Game, Division of Subsistence, (Numbers based on 1998 survey estimates).
C - 9

Table 5. (cont.) SEA LION & HARBOR SEAL HARVEST ESTIMATES: Hydaburg, 2006
HARVEST BY AGE AND SEXSea Lion Harbor Seal
Reported by Community Est. Reported by Community Est.Sample (Expanded) Sample (Expanded)
Number % Number % Number % Number %Adult Male 0 --- 0.0 --- 4 44.4% 6.4 44.4%
Adult Female 0 --- 0.0 --- 3 33.3% 4.8 33.3%Adult Unknown Sex 0 --- 0.0 --- 0 0.0% 0.0 0.0%
Juvenile Male 0 --- 0.0 --- 2 22.2% 3.2 22.2%Juvenile Female 0 --- 0.0 --- 0 0.0% 0.0 0.0%
Juvenile Unknown Sex 0 --- 0.0 --- 0 0.0% 0.0 0.0%Pup Male 0 --- 0.0 --- 0 0.0% 0.0 0.0%
Pup Female 0 --- 0.0 --- 0 0.0% 0.0 0.0%Pup Unknown Sex 0 --- 0.0 --- 0 0.0% 0.0 0.0%
Male Unknown Age 0 --- 0.0 --- 0 0.0% 0.0 0.0%Female Unknown Age 0 --- 0.0 --- 0 0.0% 0.0 0.0%Unknown Sex and Age 0 --- 0.0 --- 0 0.0% 0.0 0.0%
Total 0 --- 0.0 --- 9 100.0% 14.4 100.0%
SEASONALLY ADJUSTED TAKE BY MONTH, SEA LION AND HARBOR SEAL
ESTIMATED COMMUNITY HARVEST, STRUCK AND LOST, AND TAKE BY YEAR
SEA LION HARBOR SEALStruck/ Total Struck/ Total
Year Harvest Lost Take Year Harvest Lost Take
1992 0.0 0.0 0.0 1992 30.0 2.1 32.11993 0.0 0.0 0.0 1993 14.0 0.0 14.01994 0.0 0.0 0.0 1994 10.0 0.0 10.01995 0.0 0.0 0.0 1995 6.5 0.0 6.51996 0.0 0.0 0.0 1996 15.0 0.0 15.01997 0.0 0.0 0.0 1997 11.5 0.0 11.51998 0.0 0.0 0.0 1998 14.4 0.0 14.42000 0.0 0.0 0.0 2000 14.4 0.0 14.42001 0.0 0.0 0.0 2001 14.4 0.0 14.42002 0.0 0.0 0.0 2002 14.4 0.0 14.42003 0.0 0.0 0.0 2003 14.4 0.0 14.42004 0.0 0.0 0.0 2004 14.4 0.0 14.42005 0.0 0.0 0.0 2005 14.4 0.0 14.42006 0.0 0.0 0.0 2006 14.4 0.0 14.4
SOURCE: Alaska Department of Fish and Game, Division of Subsistence, Household Surveys 1992-1998 (Numbers based on 1998 survey estimates).
C - 10
0
1
2
3
4
Jan Feb Mar Apr May Jun Jul Aug Sep Oct Nov Dec
Seas
onal
ly A
djus
ted
Tota
l Tak
e
Sea Lion Harbor Seal

Table 6. SEA LION AND HARBOR SEAL HARVEST AND TAKE ESTIMATES: Juneau, 2006
SAMPLING DESIGN: CHAIN REFERRAL Total Referred Households 22
Surveyed Households 16Sampling Fraction 72.7%
Sample Household Members 65Estimated Household Members 89.4
2000 U.S. Census Estimated Native Population 5084HARVEST AND USE INFORMATION
Percentage of Sample Households: Estimated Community Harvest Sea Harbor and Take (Expanded): Sea Harbor
Lion Seal Lion SealUsed 6.3% 81.3% Total Number Harvested 1.4 26.1
Hunted 6.3% 50.0% Total Number Struck and Lost 0.0 23.4Harvested 6.3% 43.8% Total Number Taken 1.4 49.5Received 0.0% 62.5%
Gave Away 6.3% 62.5% Number Harvested Per Capita 0.00 0.01
SEA LION HARVEST BY MONTH UnknownJan Feb Mar Apr May Jun Jul Aug Sep Oct Nov Dec Month Total
REPORTED HARVEST AND TAKE BY SAMPLED HOUSEHOLDS (UNEXPANDED)Harvest 0 0 0 0 0 0 0 0 1 0 0 0 0 1Struck & Lost 0 0 0 0 0 0 0 0 0 0 0 0 0 0Total Take 0 0 0 0 0 0 0 0 1 0 0 0 0 1
ESTIMATED HARVEST AND TAKE BY COMMUNITY (EXPANDED)Harvest 0.0 0.0 0.0 0.0 0.0 0.0 0.0 0.0 1.4 0.0 0.0 0.0 0.0 1.4Struck & Lost 0.0 0.0 0.0 0.0 0.0 0.0 0.0 0.0 0.0 0.0 0.0 0.0 0.0 0.0Total Take 0.0 0.0 0.0 0.0 0.0 0.0 0.0 0.0 1.4 0.0 0.0 0.0 0.0 1.4
ESTIMATED SEASONALLY ADJUSTED HARVEST AND TAKE BY COMMUNITY (EXPANDED)Harvest 0.0 0.0 0.0 0.0 0.0 0.0 0.0 0.0 1.4 0.0 0.0 0.0 1.4Struck & Lost 0.0 0.0 0.0 0.0 0.0 0.0 0.0 0.0 0.0 0.0 0.0 0.0 0.0Total Take 0.0 0.0 0.0 0.0 0.0 0.0 0.0 0.0 1.4 0.0 0.0 0.0 1.4Total Take (%) 0.0% 0.0% 0.0% 0.0% 0.0% 0.0% 0.0% 0.0% 100.0% 0.0% 0.0% 0.0% 100.0%Cum. Take 0.0 0.0 0.0 0.0 0.0 0.0 0.0 0.0 1.4 1.4 1.4 1.4Cum. Take (%) 0.0% 0.0% 0.0% 0.0% 0.0% 0.0% 0.0% 0.0% 100.0% 100.0% 100.0% 100.0%
HARBOR SEAL HARVEST BY MONTH UnknownJan Feb Mar Apr May Jun Jul Aug Sep Oct Nov Dec Month Total
REPORTED HARVEST AND TAKE BY SAMPLED HOUSEHOLDS (UNEXPANDED)Harvest 0 1 1 0 0 0 2 2 0 5 4 4 0 19Struck & Lost 0 0 0 0 0 0 1 8 0 1 0 7 0 17Total Take 0 1 1 0 0 0 3 10 0 6 4 11 0 36
ESTIMATED HARVEST AND TAKE BY COMMUNITY (EXPANDED)Harvest 0.0 1.4 1.4 0.0 0.0 0.0 2.8 2.8 0.0 6.9 5.5 5.5 0.0 26.1Struck & Lost 0.0 0.0 0.0 0.0 0.0 0.0 1.4 11.0 0.0 1.4 0.0 9.6 0.0 23.4Total Take 0.0 1.4 1.4 0.0 0.0 0.0 4.1 13.8 0.0 8.3 5.5 15.1 0.0 49.5
ESTIMATED SEASONALLY ADJUSTED HARVEST AND TAKE BY COMMUNITY (EXPANDED)Harvest 0.0 1.4 1.4 0.0 0.0 0.0 2.8 2.8 0.0 6.9 5.5 5.5 26.1Struck & Lost 0.0 0.0 0.0 0.0 0.0 0.0 1.4 11.0 0.0 1.4 0.0 9.6 23.4Total Take 0.0 1.4 1.4 0.0 0.0 0.0 4.1 13.8 0.0 8.3 5.5 15.1 49.5Total Take (%) 0.0% 2.8% 2.8% 0.0% 0.0% 0.0% 8.3% 27.8% 0.0% 16.7% 11.1% 30.6% 100.0%Cum. Take 0.0 1.4 2.8 2.8 2.8 2.8 6.9 20.6 20.6 28.9 34.4 49.5Cum. Take (%) 0.0% 2.8% 5.6% 5.6% 5.6% 5.6% 13.9% 41.7% 41.7% 58.3% 69.4% 100.0% SOURCE: SAIFWC Household Surveys, 2007.
C - 11
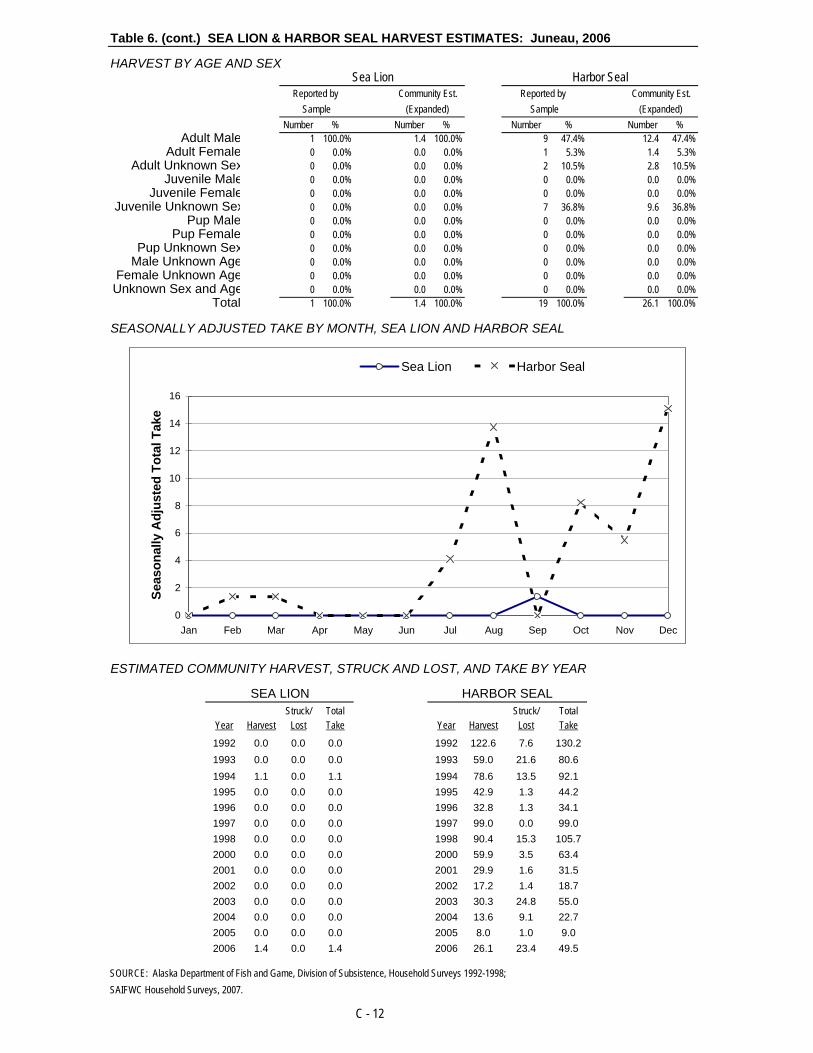
Table 6. (cont.) SEA LION & HARBOR SEAL HARVEST ESTIMATES: Juneau, 2006
HARVEST BY AGE AND SEXSea Lion Harbor Seal
Reported by Community Est. Reported by Community Est.Sample (Expanded) Sample (Expanded)
Number % Number % Number % Number %Adult Male 1 100.0% 1.4 100.0% 9 47.4% 12.4 47.4%
Adult Female 0 0.0% 0.0 0.0% 1 5.3% 1.4 5.3%Adult Unknown Sex 0 0.0% 0.0 0.0% 2 10.5% 2.8 10.5%
Juvenile Male 0 0.0% 0.0 0.0% 0 0.0% 0.0 0.0%Juvenile Female 0 0.0% 0.0 0.0% 0 0.0% 0.0 0.0%
Juvenile Unknown Sex 0 0.0% 0.0 0.0% 7 36.8% 9.6 36.8%Pup Male 0 0.0% 0.0 0.0% 0 0.0% 0.0 0.0%
Pup Female 0 0.0% 0.0 0.0% 0 0.0% 0.0 0.0%Pup Unknown Sex 0 0.0% 0.0 0.0% 0 0.0% 0.0 0.0%
Male Unknown Age 0 0.0% 0.0 0.0% 0 0.0% 0.0 0.0%Female Unknown Age 0 0.0% 0.0 0.0% 0 0.0% 0.0 0.0%Unknown Sex and Age 0 0.0% 0.0 0.0% 0 0.0% 0.0 0.0%
Total 1 100.0% 1.4 100.0% 19 100.0% 26.1 100.0%
SEASONALLY ADJUSTED TAKE BY MONTH, SEA LION AND HARBOR SEAL
ESTIMATED COMMUNITY HARVEST, STRUCK AND LOST, AND TAKE BY YEAR
SEA LION HARBOR SEALStruck/ Total Struck/ Total
Year Harvest Lost Take Year Harvest Lost Take
1992 0.0 0.0 0.0 1992 122.6 7.6 130.21993 0.0 0.0 0.0 1993 59.0 21.6 80.61994 1.1 0.0 1.1 1994 78.6 13.5 92.11995 0.0 0.0 0.0 1995 42.9 1.3 44.21996 0.0 0.0 0.0 1996 32.8 1.3 34.11997 0.0 0.0 0.0 1997 99.0 0.0 99.01998 0.0 0.0 0.0 1998 90.4 15.3 105.72000 0.0 0.0 0.0 2000 59.9 3.5 63.42001 0.0 0.0 0.0 2001 29.9 1.6 31.52002 0.0 0.0 0.0 2002 17.2 1.4 18.72003 0.0 0.0 0.0 2003 30.3 24.8 55.02004 0.0 0.0 0.0 2004 13.6 9.1 22.72005 0.0 0.0 0.0 2005 8.0 1.0 9.02006 1.4 0.0 1.4 2006 26.1 23.4 49.5
SOURCE: Alaska Department of Fish and Game, Division of Subsistence, Household Surveys 1992-1998;SAIFWC Household Surveys, 2007.
C - 12
0
2
4
6
8
10
12
14
16
Jan Feb Mar Apr May Jun Jul Aug Sep Oct Nov Dec
Seas
onal
ly A
djus
ted
Tota
l Tak
e
Sea Lion Harbor Seal

Table 7. SEA LION AND HARBOR SEAL HARVEST AND TAKE ESTIMATES: Kake, 2006
SAMPLING DESIGN: CHAIN REFERRAL Total Referred Households 35
Surveyed Households 32Sampling Fraction 91.4%
Sample Household Members 93Estimated Household Members 101.7
2000 U.S. Census Estimated Native Population 530HARVEST AND USE INFORMATION
Percentage of Sample Households: Estimated Community Harvest Sea Harbor and Take (Expanded): Sea Harbor
Lion Seal Lion SealUsed 0.0% 100.0% Total Number Harvested 0.0 40.5
Hunted 0.0% 50.0% Total Number Struck and Lost 0.0 0.0Harvested 0.0% 46.9% Total Number Taken 0.0 40.5Received 0.0% 59.4%
Gave Away 0.0% 40.6% Number Harvested Per Capita 0.00 0.08
SEA LION HARVEST BY MONTH UnknownJan Feb Mar Apr May Jun Jul Aug Sep Oct Nov Dec Month Total
REPORTED HARVEST AND TAKE BY SAMPLED HOUSEHOLDS (UNEXPANDED)Harvest 0 0 0 0 0 0 0 0 0 0 0 0 0 0Struck & Lost 0 0 0 0 0 0 0 0 0 0 0 0 0 0Total Take 0 0 0 0 0 0 0 0 0 0 0 0 0 0
ESTIMATED HARVEST AND TAKE BY COMMUNITY (EXPANDED)Harvest 0.0 0.0 0.0 0.0 0.0 0.0 0.0 0.0 0.0 0.0 0.0 0.0 0.0 0.0Struck & Lost 0.0 0.0 0.0 0.0 0.0 0.0 0.0 0.0 0.0 0.0 0.0 0.0 0.0 0.0Total Take 0.0 0.0 0.0 0.0 0.0 0.0 0.0 0.0 0.0 0.0 0.0 0.0 0.0 0.0
ESTIMATED SEASONALLY ADJUSTED HARVEST AND TAKE BY COMMUNITY (EXPANDED)Harvest 0.0 0.0 0.0 0.0 0.0 0.0 0.0 0.0 0.0 0.0 0.0 0.0 0.0Struck & Lost 0.0 0.0 0.0 0.0 0.0 0.0 0.0 0.0 0.0 0.0 0.0 0.0 0.0Total Take 0.0 0.0 0.0 0.0 0.0 0.0 0.0 0.0 0.0 0.0 0.0 0.0 0.0Total Take (%) --- --- --- --- --- --- --- --- --- --- --- --- ---Cum. Take 0.0 0.0 0.0 0.0 0.0 0.0 0.0 0.0 0.0 0.0 0.0 0.0Cum. Take (%) --- --- --- --- --- --- --- --- --- --- --- ---
HARBOR SEAL HARVEST BY MONTH UnknownJan Feb Mar Apr May Jun Jul Aug Sep Oct Nov Dec Month Total
REPORTED HARVEST AND TAKE BY SAMPLED HOUSEHOLDS (UNEXPANDED)Harvest 3 1 4 0 0 4 2 11 7 3 0 2 0 37Struck & Lost 0 0 0 0 0 0 0 0 0 0 0 0 0 0Total Take 3 1 4 0 0 4 2 11 7 3 0 2 0 37
ESTIMATED HARVEST AND TAKE BY COMMUNITY (EXPANDED)Harvest 3.3 1.1 4.4 0.0 0.0 4.4 2.2 12.0 7.7 3.3 0.0 2.2 0.0 40.5Struck & Lost 0.0 0.0 0.0 0.0 0.0 0.0 0.0 0.0 0.0 0.0 0.0 0.0 0.0 0.0Total Take 3.3 1.1 4.4 0.0 0.0 4.4 2.2 12.0 7.7 3.3 0.0 2.2 0.0 40.5
ESTIMATED SEASONALLY ADJUSTED HARVEST AND TAKE BY COMMUNITY (EXPANDED)Harvest 3.3 1.1 4.4 0.0 0.0 4.4 2.2 12.0 7.7 3.3 0.0 2.2 40.5Struck & Lost 0.0 0.0 0.0 0.0 0.0 0.0 0.0 0.0 0.0 0.0 0.0 0.0 0.0Total Take 3.3 1.1 4.4 0.0 0.0 4.4 2.2 12.0 7.7 3.3 0.0 2.2 40.5Total Take (%) 8.1% 2.7% 10.8% 0.0% 0.0% 10.8% 5.4% 29.7% 18.9% 8.1% 0.0% 5.4% 100.0%Cum. Take 3.3 4.4 8.8 8.8 8.8 13.1 15.3 27.3 35.0 38.3 38.3 40.5Cum. Take (%) 8.1% 10.8% 21.6% 21.6% 21.6% 32.4% 37.8% 67.6% 86.5% 94.6% 94.6% 100.0% SOURCE: SAIFWC Household Surveys, 2007.
C - 13

Table 7. (cont.) SEA LION & HARBOR SEAL HARVEST ESTIMATES: Kake, 2006
HARVEST BY AGE AND SEXSea Lion Harbor Seal
Reported by Community Est. Reported by Community Est.Sample (Expanded) Sample (Expanded)
Number % Number % Number % Number %Adult Male 0 --- 0.0 --- 37 100.0% 40.5 100.0%
Adult Female 0 --- 0.0 --- 0 0.0% 0.0 0.0%Adult Unknown Sex 0 --- 0.0 --- 0 0.0% 0.0 0.0%
Juvenile Male 0 --- 0.0 --- 0 0.0% 0.0 0.0%Juvenile Female 0 --- 0.0 --- 0 0.0% 0.0 0.0%
Juvenile Unknown Sex 0 --- 0.0 --- 0 0.0% 0.0 0.0%Pup Male 0 --- 0.0 --- 0 0.0% 0.0 0.0%
Pup Female 0 --- 0.0 --- 0 0.0% 0.0 0.0%Pup Unknown Sex 0 --- 0.0 --- 0 0.0% 0.0 0.0%
Male Unknown Age 0 --- 0.0 --- 0 0.0% 0.0 0.0%Female Unknown Age 0 --- 0.0 --- 0 0.0% 0.0 0.0%Unknown Sex and Age 0 --- 0.0 --- 0 0.0% 0.0 0.0%
Total 0 --- 0.0 --- 37 100.0% 40.5 100.0%
SEASONALLY ADJUSTED TAKE BY MONTH, SEA LION AND HARBOR SEAL
ESTIMATED COMMUNITY HARVEST, STRUCK AND LOST, AND TAKE BY YEAR
SEA LION HARBOR SEALStruck/ Total Struck/ Total
Year Harvest Lost Take Year Harvest Lost Take
1992 0.0 0.0 0.0 1992 173.9 12.3 186.21993 0.0 0.0 0.0 1993 100.8 15.2 115.91994 1.2 0.0 1.2 1994 99.3 7.4 106.61995 0.0 0.0 0.0 1995 72.0 1.5 73.51996 0.0 0.0 0.0 1996 86.4 0.0 86.41997 0.0 0.0 0.0 1997 68.4 7.6 76.01998 0.0 0.0 0.0 1998 123.0 6.1 129.12000 0.0 0.0 0.0 2000 101.7 3.6 105.32001 0.0 0.0 0.0 2001 85.6 10.7 96.42002 0.0 0.0 0.0 2002 98.2 10.6 108.72003 0.0 0.0 0.0 2003 52.1 0.0 52.12004 0.0 0.0 0.0 2004 96.2 0.0 96.22005 0.0 0.0 0.0 2005 47.6 4.6 52.32006 0.0 0.0 0.0 2006 40.5 0.0 40.5
SOURCE: Alaska Department of Fish and Game, Division of Subsistence, Household Surveys 1992-1998;SAIFWC Household Surveys, 2000-2007.
C - 14
0
2
4
6
8
10
12
14
Jan Feb Mar Apr May Jun Jul Aug Sep Oct Nov Dec
Seas
onal
ly A
djus
ted
Tota
l Tak
e
Sea Lion Harbor Seal

Table 8. SEA LION AND HARBOR SEAL HARVEST AND TAKE ESTIMATES: Ketchikan, 2006
SAMPLING DESIGN: CHAIN REFERRAL Total Referred Households 13
Surveyed Households 9Sampling Fraction 69.2%
Sample Household Members 24Estimated Household Members 34.7
2000 U.S. Census Estimated Native Population 1802HARVEST AND USE INFORMATION
Percentage of Sample Households: Estimated Community Harvest Sea Harbor and Take (Expanded): Sea Harbor
Lion Seal Lion SealUsed 0.0% 100.0% Total Number Harvested 0.0 37.6
Hunted 0.0% 44.4% Total Number Struck and Lost 0.0 0.0Harvested 0.0% 33.3% Total Number Taken 0.0 37.6Received 0.0% 66.7%
Gave Away 0.0% 11.1% Number Harvested Per Capita 0.00 0.02
SEA LION HARVEST BY MONTH UnknownJan Feb Mar Apr May Jun Jul Aug Sep Oct Nov Dec Month Total
REPORTED HARVEST AND TAKE BY SAMPLED HOUSEHOLDS (UNEXPANDED)Harvest 0 0 0 0 0 0 0 0 0 0 0 0 0 0Struck & Lost 0 0 0 0 0 0 0 0 0 0 0 0 0 0Total Take 0 0 0 0 0 0 0 0 0 0 0 0 0 0
ESTIMATED HARVEST AND TAKE BY COMMUNITY (EXPANDED)Harvest 0.0 0.0 0.0 0.0 0.0 0.0 0.0 0.0 0.0 0.0 0.0 0.0 0.0 0.0Struck & Lost 0.0 0.0 0.0 0.0 0.0 0.0 0.0 0.0 0.0 0.0 0.0 0.0 0.0 0.0Total Take 0.0 0.0 0.0 0.0 0.0 0.0 0.0 0.0 0.0 0.0 0.0 0.0 0.0 0.0
ESTIMATED SEASONALLY ADJUSTED HARVEST AND TAKE BY COMMUNITY (EXPANDED)Harvest 0.0 0.0 0.0 0.0 0.0 0.0 0.0 0.0 0.0 0.0 0.0 0.0 0.0Struck & Lost 0.0 0.0 0.0 0.0 0.0 0.0 0.0 0.0 0.0 0.0 0.0 0.0 0.0Total Take 0.0 0.0 0.0 0.0 0.0 0.0 0.0 0.0 0.0 0.0 0.0 0.0 0.0Total Take (%) --- --- --- --- --- --- --- --- --- --- --- --- ---Cum. Take 0.0 0.0 0.0 0.0 0.0 0.0 0.0 0.0 0.0 0.0 0.0 0.0Cum. Take (%) --- --- --- --- --- --- --- --- --- --- --- ---
HARBOR SEAL HARVEST BY MONTH UnknownJan Feb Mar Apr May Jun Jul Aug Sep Oct Nov Dec Month Total
REPORTED HARVEST AND TAKE BY SAMPLED HOUSEHOLDS (UNEXPANDED)Harvest 0 0 0 0 0 0 0 0 0 11 12 3 0 26Struck & Lost 0 0 0 0 0 0 0 0 0 0 0 0 0 0Total Take 0 0 0 0 0 0 0 0 0 11 12 3 0 26
ESTIMATED HARVEST AND TAKE BY COMMUNITY (EXPANDED)Harvest 0.0 0.0 0.0 0.0 0.0 0.0 0.0 0.0 0.0 15.9 17.3 4.3 0.0 37.6Struck & Lost 0.0 0.0 0.0 0.0 0.0 0.0 0.0 0.0 0.0 0.0 0.0 0.0 0.0 0.0Total Take 0.0 0.0 0.0 0.0 0.0 0.0 0.0 0.0 0.0 15.9 17.3 4.3 0.0 37.6
ESTIMATED SEASONALLY ADJUSTED HARVEST AND TAKE BY COMMUNITY (EXPANDED)Harvest 0.0 0.0 0.0 0.0 0.0 0.0 0.0 0.0 0.0 15.9 17.3 4.3 37.6Struck & Lost 0.0 0.0 0.0 0.0 0.0 0.0 0.0 0.0 0.0 0.0 0.0 0.0 0.0Total Take 0.0 0.0 0.0 0.0 0.0 0.0 0.0 0.0 0.0 15.9 17.3 4.3 37.6Total Take (%) 0.0% 0.0% 0.0% 0.0% 0.0% 0.0% 0.0% 0.0% 0.0% 42.3% 46.2% 11.5% 100.0%Cum. Take 0.0 0.0 0.0 0.0 0.0 0.0 0.0 0.0 0.0 15.9 33.2 37.6Cum. Take (%) 0.0% 0.0% 0.0% 0.0% 0.0% 0.0% 0.0% 0.0% 0.0% 42.3% 88.5% 100.0% SOURCE: SAIFWC Household Surveys, 2007.
C - 15

Table 8. (cont.) SEA LION & HARBOR SEAL HARVEST ESTIMATES: Ketchikan, 2006
HARVEST BY AGE AND SEXSea Lion Harbor Seal
Reported by Community Est. Reported by Community Est.Sample (Expanded) Sample (Expanded)
Number % Number % Number % Number %Adult Male 0 --- 0.0 --- 13 50.0% 18.8 50.0%
Adult Female 0 --- 0.0 --- 0 0.0% 0.0 0.0%Adult Unknown Sex 0 --- 0.0 --- 0 0.0% 0.0 0.0%
Juvenile Male 0 --- 0.0 --- 3 11.5% 4.3 11.5%Juvenile Female 0 --- 0.0 --- 0 0.0% 0.0 0.0%
Juvenile Unknown Sex 0 --- 0.0 --- 1 3.8% 1.4 3.8%Pup Male 0 --- 0.0 --- 0 0.0% 0.0 0.0%
Pup Female 0 --- 0.0 --- 0 0.0% 0.0 0.0%Pup Unknown Sex 0 --- 0.0 --- 0 0.0% 0.0 0.0%
Male Unknown Age 0 --- 0.0 --- 9 34.6% 13.0 34.6%Female Unknown Age 0 --- 0.0 --- 0 0.0% 0.0 0.0%Unknown Sex and Age 0 --- 0.0 --- 0 0.0% 0.0 0.0%
Total 0 --- 0.0 --- 26 100.0% 37.6 100.0%
SEASONALLY ADJUSTED TAKE BY MONTH, SEA LION AND HARBOR SEAL
ESTIMATED COMMUNITY HARVEST, STRUCK AND LOST, AND TAKE BY YEAR
SEA LION HARBOR SEALStruck/ Total Struck/ Total
Year Harvest Lost Take Year Harvest Lost Take
1992 0.0 0.0 0.0 1992 90.2 6.5 96.81993 0.0 0.0 0.0 1993 42.4 2.9 45.31994 0.0 0.0 0.0 1994 31.4 0.0 31.41995 0.0 0.0 0.0 1995 46.4 0.0 46.41996 0.0 0.0 0.0 1996 25.0 0.0 25.01997 0.0 0.0 0.0 1997 27.4 4.3 31.81998 0.0 0.0 0.0 1998 26.7 0.0 26.72000 0.0 0.0 0.0 2000 111.7 0.0 111.72001 0.0 0.0 0.0 2001 12.7 0.0 12.72002 0.0 0.0 0.0 2002 123.5 1.2 124.62003 0.0 0.0 0.0 2003 78.0 0.0 78.02004 0.0 0.0 0.0 2004 60.0 5.0 65.02005 0.0 0.0 0.0 2005 73.1 0.0 73.12006 0.0 0.0 0.0 2006 37.6 0.0 37.6
SOURCE: Alaska Department of Fish and Game, Division of Subsistence, Household Surveys 1992-1998;SAIFWC Household Surveys, 2000-2007.
C - 16
0
2
4
6
8
10
12
14
16
18
20
Jan Feb Mar Apr May Jun Jul Aug Sep Oct Nov Dec
Seas
onal
ly A
djus
ted
Tota
l Tak
e
Sea Lion Harbor Seal

Table 9. SEA LION AND HARBOR SEAL HARVEST AND TAKE ESTIMATES: Klawock, 2006
SAMPLING DESIGN: CHAIN REFERRAL Total Referred Households 29
Surveyed Households 25Sampling Fraction
Sample Household Members 72Estimated Household Members 83.5
2000 U.S. Census Estimated Native Population 496HARVEST AND USE INFORMATION
Percentage of Sample Households: Estimated Community Harvest Sea Harbor and Take (Expanded): Sea Harbor
Lion Seal Lion SealUsed 4.0% 36.0% Total Number Harvested 1.2 16.2
Hunted 4.0% 28.0% Total Number Struck and Lost 0.0 3.5Harvested 4.0% 28.0% Total Number Taken 1.2 19.7Received 0.0% 8.0%
Gave Away 4.0% 20.0% Number Harvested Per Capita 0.00 0.03
SEA LION HARVEST BY MONTH UnknownJan Feb Mar Apr May Jun Jul Aug Sep Oct Nov Dec Month Total
REPORTED HARVEST AND TAKE BY SAMPLED HOUSEHOLDS (UNEXPANDED)Harvest 0 0 0 1 0 0 0 0 0 0 0 0 0 1Struck & Lost 0 0 0 0 0 0 0 0 0 0 0 0 0 0Total Take 0 0 0 1 0 0 0 0 0 0 0 0 0 1
ESTIMATED HARVEST AND TAKE BY COMMUNITY (EXPANDED)Harvest 0.0 0.0 0.0 1.2 0.0 0.0 0.0 0.0 0.0 0.0 0.0 0.0 0.0 1.2Struck & Lost 0.0 0.0 0.0 0.0 0.0 0.0 0.0 0.0 0.0 0.0 0.0 0.0 0.0 0.0Total Take 0.0 0.0 0.0 1.2 0.0 0.0 0.0 0.0 0.0 0.0 0.0 0.0 0.0 1.2
ESTIMATED SEASONALLY ADJUSTED HARVEST AND TAKE BY COMMUNITY (EXPANDED)Harvest 0.0 0.0 0.0 1.2 0.0 0.0 0.0 0.0 0.0 0.0 0.0 0.0 1.2Struck & Lost 0.0 0.0 0.0 0.0 0.0 0.0 0.0 0.0 0.0 0.0 0.0 0.0 0.0Total Take 0.0 0.0 0.0 1.2 0.0 0.0 0.0 0.0 0.0 0.0 0.0 0.0 1.2Total Take (%) 0.0% 0.0% 0.0% 100.0% 0.0% 0.0% 0.0% 0.0% 0.0% 0.0% 0.0% 0.0% 100.0%Cum. Take 0.0 0.0 0.0 1.2 1.2 1.2 1.2 1.2 1.2 1.2 1.2 1.2Cum. Take (%) 0.0% 0.0% 0.0% 100.0% 100.0% 100.0% 100.0% 100.0% 100.0% 100.0% 100.0% 100.0%
HARBOR SEAL HARVEST BY MONTH UnknownJan Feb Mar Apr May Jun Jul Aug Sep Oct Nov Dec Month Total
REPORTED HARVEST AND TAKE BY SAMPLED HOUSEHOLDS (UNEXPANDED)Harvest 2 1 5 1 1 1 0 0 0 1 2 0 0 14Struck & Lost 0 0 2 0 0 0 0 0 0 0 1 0 0 3Total Take 2 1 7 1 1 1 0 0 0 1 3 0 0 17
ESTIMATED HARVEST AND TAKE BY COMMUNITY (EXPANDED)Harvest 2.3 1.2 5.8 1.2 1.2 1.2 0.0 0.0 0.0 1.2 2.3 0.0 0.0 16.2Struck & Lost 0.0 0.0 2.3 0.0 0.0 0.0 0.0 0.0 0.0 0.0 1.2 0.0 0.0 3.5Total Take 2.3 1.2 8.1 1.2 1.2 1.2 0.0 0.0 0.0 1.2 3.5 0.0 0.0 19.7
ESTIMATED SEASONALLY ADJUSTED HARVEST AND TAKE BY COMMUNITY (EXPANDED)Harvest 2.3 1.2 5.8 1.2 1.2 1.2 0.0 0.0 0.0 1.2 2.3 0.0 16.2Struck & Lost 0.0 0.0 2.3 0.0 0.0 0.0 0.0 0.0 0.0 0.0 1.2 0.0 3.5Total Take 2.3 1.2 8.1 1.2 1.2 1.2 0.0 0.0 0.0 1.2 3.5 0.0 19.7Total Take (%) 11.8% 5.9% 41.2% 5.9% 5.9% 5.9% 0.0% 0.0% 0.0% 5.9% 17.6% 0.0% 100.0%Cum. Take 2.3 3.5 11.6 12.8 13.9 15.1 15.1 15.1 15.1 16.2 19.7 19.7Cum. Take (%) 11.8% 17.6% 58.8% 64.7% 70.6% 76.5% 76.5% 76.5% 76.5% 82.4% 100.0% 100.0% SOURCE: SAIFWC Household Surveys, 2007.
C - 17
86.2%
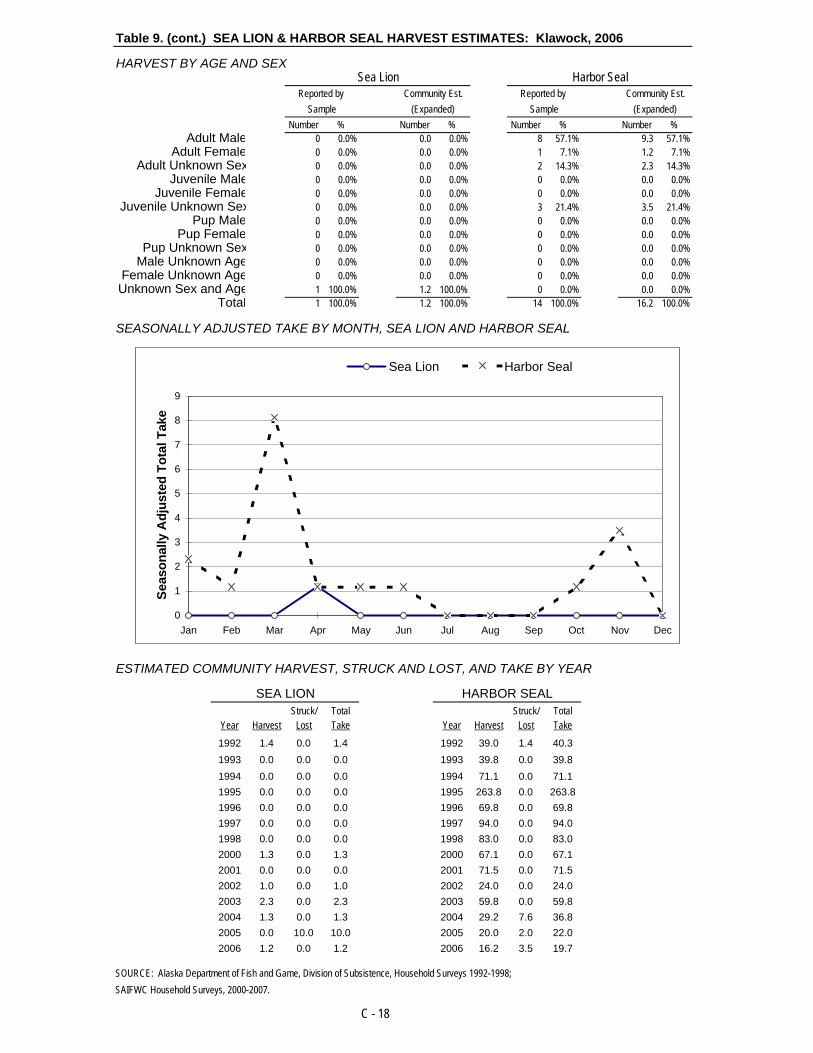
Table 9. (cont.) SEA LION & HARBOR SEAL HARVEST ESTIMATES: Klawock, 2006
HARVEST BY AGE AND SEXSea Lion Harbor Seal
Reported by Community Est. Reported by Community Est.Sample (Expanded) Sample (Expanded)
Number % Number % Number % Number %Adult Male 0 0.0% 0.0 0.0% 8 57.1% 9.3 57.1%
Adult Female 0 0.0% 0.0 0.0% 1 7.1% 1.2 7.1%Adult Unknown Sex 0 0.0% 0.0 0.0% 2 14.3% 2.3 14.3%
Juvenile Male 0 0.0% 0.0 0.0% 0 0.0% 0.0 0.0%Juvenile Female 0 0.0% 0.0 0.0% 0 0.0% 0.0 0.0%
Juvenile Unknown Sex 0 0.0% 0.0 0.0% 3 21.4% 3.5 21.4%Pup Male 0 0.0% 0.0 0.0% 0 0.0% 0.0 0.0%
Pup Female 0 0.0% 0.0 0.0% 0 0.0% 0.0 0.0%Pup Unknown Sex 0 0.0% 0.0 0.0% 0 0.0% 0.0 0.0%
Male Unknown Age 0 0.0% 0.0 0.0% 0 0.0% 0.0 0.0%Female Unknown Age 0 0.0% 0.0 0.0% 0 0.0% 0.0 0.0%Unknown Sex and Age 1 100.0% 1.2 100.0% 0 0.0% 0.0 0.0%
Total 1 100.0% 1.2 100.0% 14 100.0% 16.2 100.0%
SEASONALLY ADJUSTED TAKE BY MONTH, SEA LION AND HARBOR SEAL
ESTIMATED COMMUNITY HARVEST, STRUCK AND LOST, AND TAKE BY YEAR
SEA LION HARBOR SEALStruck/ Total Struck/ Total
Year Harvest Lost Take Year Harvest Lost Take
1992 1.4 0.0 1.4 1992 39.0 1.4 40.31993 0.0 0.0 0.0 1993 39.8 0.0 39.81994 0.0 0.0 0.0 1994 71.1 0.0 71.11995 0.0 0.0 0.0 1995 263.8 0.0 263.81996 0.0 0.0 0.0 1996 69.8 0.0 69.81997 0.0 0.0 0.0 1997 94.0 0.0 94.01998 0.0 0.0 0.0 1998 83.0 0.0 83.02000 1.3 0.0 1.3 2000 67.1 0.0 67.12001 0.0 0.0 0.0 2001 71.5 0.0 71.52002 1.0 0.0 1.0 2002 24.0 0.0 24.02003 2.3 0.0 2.3 2003 59.8 0.0 59.82004 1.3 0.0 1.3 2004 29.2 7.6 36.82005 0.0 10.0 10.0 2005 20.0 2.0 22.02006 1.2 0.0 1.2 2006 16.2 3.5 19.7
SOURCE: Alaska Department of Fish and Game, Division of Subsistence, Household Surveys 1992-1998;SAIFWC Household Surveys, 2000-2007.
C - 18
0
1
2
3
4
5
6
7
8
9
Jan Feb Mar Apr May Jun Jul Aug Sep Oct Nov Dec
Seas
onal
ly A
djus
ted
Tota
l Tak
e
Sea Lion Harbor Seal

Table 10. SEA LION AND HARBOR SEAL HARVEST AND TAKE ESTIMATES: Klukwan, 2006
SAMPLING DESIGN: CHAIN REFERRAL Total Referred Households 8
Surveyed Households 3Sampling Fraction 37.5%
Sample Household Members 9Estimated Household Members 24.0
2000 U.S. Census Estimated Native Population 123HARVEST AND USE INFORMATION
Percentage of Sample Households: Estimated Community Harvest Sea Harbor and Take (Expanded): Sea Harbor
Lion Seal Lion SealUsed 0.0% 100.0% Total Number Harvested 0.0 0.0
Hunted 0.0% 0.0% Total Number Struck and Lost 0.0 0.0Harvested 0.0% 0.0% Total Number Taken 0.0 0.0Received 0.0% 100.0%
Gave Away 0.0% 0.0% Number Harvested Per Capita 0.00 0.00
SEA LION HARVEST BY MONTH UnknownJan Feb Mar Apr May Jun Jul Aug Sep Oct Nov Dec Month Total
REPORTED HARVEST AND TAKE BY SAMPLED HOUSEHOLDS (UNEXPANDED)Harvest 0 0 0 0 0 0 0 0 0 0 0 0 0 0Struck & Lost 0 0 0 0 0 0 0 0 0 0 0 0 0 0Total Take 0 0 0 0 0 0 0 0 0 0 0 0 0 0
ESTIMATED HARVEST AND TAKE BY COMMUNITY (EXPANDED)Harvest 0.0 0.0 0.0 0.0 0.0 0.0 0.0 0.0 0.0 0.0 0.0 0.0 0.0 0.0Struck & Lost 0.0 0.0 0.0 0.0 0.0 0.0 0.0 0.0 0.0 0.0 0.0 0.0 0.0 0.0Total Take 0.0 0.0 0.0 0.0 0.0 0.0 0.0 0.0 0.0 0.0 0.0 0.0 0.0 0.0
ESTIMATED SEASONALLY ADJUSTED HARVEST AND TAKE BY COMMUNITY (EXPANDED)Harvest 0.0 0.0 0.0 0.0 0.0 0.0 0.0 0.0 0.0 0.0 0.0 0.0 0.0Struck & Lost 0.0 0.0 0.0 0.0 0.0 0.0 0.0 0.0 0.0 0.0 0.0 0.0 0.0Total Take 0.0 0.0 0.0 0.0 0.0 0.0 0.0 0.0 0.0 0.0 0.0 0.0 0.0Total Take (%) --- --- --- --- --- --- --- --- --- --- --- --- ---Cum. Take 0.0 0.0 0.0 0.0 0.0 0.0 0.0 0.0 0.0 0.0 0.0 0.0Cum. Take (%) --- --- --- --- --- --- --- --- --- --- --- ---
HARBOR SEAL HARVEST BY MONTH UnknownJan Feb Mar Apr May Jun Jul Aug Sep Oct Nov Dec Month Total
REPORTED HARVEST AND TAKE BY SAMPLED HOUSEHOLDS (UNEXPANDED)Harvest 0 0 0 0 0 0 0 0 0 0 0 0 0 0Struck & Lost 0 0 0 0 0 0 0 0 0 0 0 0 0 0Total Take 0 0 0 0 0 0 0 0 0 0 0 0 0 0
ESTIMATED HARVEST AND TAKE BY COMMUNITY (EXPANDED)Harvest 0.0 0.0 0.0 0.0 0.0 0.0 0.0 0.0 0.0 0.0 0.0 0.0 0.0 0.0Struck & Lost 0.0 0.0 0.0 0.0 0.0 0.0 0.0 0.0 0.0 0.0 0.0 0.0 0.0 0.0Total Take 0.0 0.0 0.0 0.0 0.0 0.0 0.0 0.0 0.0 0.0 0.0 0.0 0.0 0.0
ESTIMATED SEASONALLY ADJUSTED HARVEST AND TAKE BY COMMUNITY (EXPANDED)Harvest 0.0 0.0 0.0 0.0 0.0 0.0 0.0 0.0 0.0 0.0 0.0 0.0 0.0Struck & Lost 0.0 0.0 0.0 0.0 0.0 0.0 0.0 0.0 0.0 0.0 0.0 0.0 0.0Total Take 0.0 0.0 0.0 0.0 0.0 0.0 0.0 0.0 0.0 0.0 0.0 0.0 0.0Total Take (%) --- --- --- --- --- --- --- --- --- --- --- --- ---Cum. Take 0.0 0.0 0.0 0.0 0.0 0.0 0.0 0.0 0.0 0.0 0.0 0.0Cum. Take (%) --- --- --- --- --- --- --- --- --- --- --- --- SOURCE: SAIFWC Household Surveys, (Numbers based on 2000 survey estimates).
C - 19

Table 10. (cont.) SEA LION & HARBOR SEAL HARVEST ESTIMATES: Klukwan, 2006
HARVEST BY AGE AND SEXSea Lion Harbor Seal
Reported by Community Est. Reported by Community Est.Sample (Expanded) Sample (Expanded)
Number % Number % Number % Number %Adult Male 0 --- 0.0 --- 0 --- 0.0 ---
Adult Female 0 --- 0.0 --- 0 --- 0.0 ---Adult Unknown Sex 0 --- 0.0 --- 0 --- 0.0 ---
Juvenile Male 0 --- 0.0 --- 0 --- 0.0 ---Juvenile Female 0 --- 0.0 --- 0 --- 0.0 ---
Juvenile Unknown Sex 0 --- 0.0 --- 0 --- 0.0 ---Pup Male 0 --- 0.0 --- 0 --- 0.0 ---
Pup Female 0 --- 0.0 --- 0 --- 0.0 ---Pup Unknown Sex 0 --- 0.0 --- 0 --- 0.0 ---
Male Unknown Age 0 --- 0.0 --- 0 --- 0.0 ---Female Unknown Age 0 --- 0.0 --- 0 --- 0.0 ---Unknown Sex and Age 0 --- 0.0 --- 0 --- 0.0 ---
Total 0 --- 0.0 --- 0 --- 0.0 ---
SEASONALLY ADJUSTED TAKE BY MONTH, SEA LION AND HARBOR SEAL
ESTIMATED COMMUNITY HARVEST, STRUCK AND LOST, AND TAKE BY YEAR
SEA LION HARBOR SEALStruck/ Total Struck/ Total
Year Harvest Lost Take Year Harvest Lost Take
1992 0.0 0.0 0.0 1992 8.0 2.0 10.01993 0.0 0.0 0.0 1993 1.2 0.0 1.21994 0.0 0.0 0.0 1994 3.8 1.3 5.01995 0.0 0.0 0.0 1995 35.2 6.4 41.61996 0.0 0.0 0.0 1996 6.3 0.0 6.31997 0.0 0.0 0.0 1997 1.1 0.0 1.11998 0.0 0.0 0.0 1998 10.5 0.0 10.52000 0.0 0.0 0.0 2000 18.0 0.0 18.02001 0.0 0.0 0.0 2001 0.0 0.0 0.02002 0.0 0.0 0.0 2002 0.0 0.0 0.02003 0.0 0.0 0.0 2003 0.0 0.0 0.02004 0.0 0.0 0.0 2004 0.0 0.0 0.02005 0.0 0.0 0.0 2005 0.0 0.0 0.02006 0.0 0.0 0.0 2006 0.0 0.0 0.0
SOURCE: Alaska Department of Fish and Game, Division of Subsistence, Household Surveys 1992-1998;SAIFWC Household Surveys, 2000-2001 (Numbers based on 2000 survey estimates).
C - 20
0
1
Jan Feb Mar Apr May Jun Jul Aug Sep Oct Nov Dec
Seas
onal
ly A
djus
ted
Tota
l Tak
e
Sea Lion Harbor Seal

Table 11. SEA LION AND HARBOR SEAL HARVEST AND TAKE ESTIMATES: Pelican, 2006
SAMPLING DESIGN: TWO-STRATA Total Referred Households 6
Surveyed Households 5Sampling Fraction 83.3%
Sample Household Members 10Estimated Household Members 12.0
2000 U.S. Census Estimated Native Population 42HARVEST AND USE INFORMATION
Percentage of Sample Households: Estimated Community Harvest Sea Harbor and Take (Expanded): Sea Harbor
Lion Seal Lion SealUsed 0.0% 80.0% Total Number Harvested 0.0 8.4
Hunted 0.0% 60.0% Total Number Struck and Lost 0.0 0.0Harvested 0.0% 60.0% Total Number Taken 0.0 8.4Received 0.0% 20.0%
Gave Away 0.0% 40.0% Number Harvested Per Capita 0.00 0.20
SEA LION HARVEST BY MONTH UnknownJan Feb Mar Apr May Jun Jul Aug Sep Oct Nov Dec Month Total
REPORTED HARVEST AND TAKE BY SAMPLED HOUSEHOLDS (UNEXPANDED)Harvest 0 0 0 0 0 0 0 0 0 0 0 0 0 0Struck & Lost 0 0 0 0 0 0 0 0 0 0 0 0 0 0Total Take 0 0 0 0 0 0 0 0 0 0 0 0 0 0
ESTIMATED HARVEST AND TAKE BY COMMUNITY (EXPANDED)Harvest 0.0 0.0 0.0 0.0 0.0 0.0 0.0 0.0 0.0 0.0 0.0 0.0 0.0 0.0Struck & Lost 0.0 0.0 0.0 0.0 0.0 0.0 0.0 0.0 0.0 0.0 0.0 0.0 0.0 0.0Total Take 0.0 0.0 0.0 0.0 0.0 0.0 0.0 0.0 0.0 0.0 0.0 0.0 0.0 0.0
ESTIMATED SEASONALLY ADJUSTED HARVEST AND TAKE BY COMMUNITY (EXPANDED)Harvest 0.0 0.0 0.0 0.0 0.0 0.0 0.0 0.0 0.0 0.0 0.0 0.0 0.0Struck & Lost 0.0 0.0 0.0 0.0 0.0 0.0 0.0 0.0 0.0 0.0 0.0 0.0 0.0Total Take 0.0 0.0 0.0 0.0 0.0 0.0 0.0 0.0 0.0 0.0 0.0 0.0 0.0Total Take (%) --- --- --- --- --- --- --- --- --- --- --- --- ---Cum. Take 0.0 0.0 0.0 0.0 0.0 0.0 0.0 0.0 0.0 0.0 0.0 0.0Cum. Take (%) --- --- --- --- --- --- --- --- --- --- --- ---
HARBOR SEAL HARVEST BY MONTH UnknownJan Feb Mar Apr May Jun Jul Aug Sep Oct Nov Dec Month Total
REPORTED HARVEST AND TAKE BY SAMPLED HOUSEHOLDS (UNEXPANDED)Harvest 2 3 0 0 0 0 0 0 2 0 0 0 0 7Struck & Lost 0 0 0 0 0 0 0 0 0 0 0 0 0 0Total Take 2 3 0 0 0 0 0 0 2 0 0 0 0 7
ESTIMATED HARVEST AND TAKE BY COMMUNITY (EXPANDED)Harvest 2.4 3.6 0.0 0.0 0.0 0.0 0.0 0.0 2.4 0.0 0.0 0.0 0.0 8.4Struck & Lost 0.0 0.0 0.0 0.0 0.0 0.0 0.0 0.0 0.0 0.0 0.0 0.0 0.0 0.0Total Take 2.4 3.6 0.0 0.0 0.0 0.0 0.0 0.0 2.4 0.0 0.0 0.0 0.0 8.4
ESTIMATED SEASONALLY ADJUSTED HARVEST AND TAKE BY COMMUNITY (EXPANDED)Harvest 2.4 3.6 0.0 0.0 0.0 0.0 0.0 0.0 2.4 0.0 0.0 0.0 8.4Struck & Lost 0.0 0.0 0.0 0.0 0.0 0.0 0.0 0.0 0.0 0.0 0.0 0.0 0.0Total Take 2.4 3.6 0.0 0.0 0.0 0.0 0.0 0.0 2.4 0.0 0.0 0.0 8.4Total Take (%) 28.6% 42.9% 0.0% 0.0% 0.0% 0.0% 0.0% 0.0% 28.6% 0.0% 0.0% 0.0% 100.0%Cum. Take 2.4 6.0 6.0 6.0 6.0 6.0 6.0 6.0 8.4 8.4 8.4 8.4Cum. Take (%) 28.6% 71.4% 71.4% 71.4% 71.4% 71.4% 71.4% 71.4% 100.0% 100.0% 100.0% 100.0% SOURCE: SAIFWC Household Surveys, 2007.
C - 21

Table 11. (cont.) SEA LION & HARBOR SEAL HARVEST ESTIMATES: Pelican, 2006
HARVEST BY AGE AND SEXSea Lion Harbor Seal
Reported by Community Est. Reported by Community Est.Sample (Expanded) Sample (Expanded)
Number % Number % Number % Number %Adult Male 0 --- 0.0 --- 3 42.9% 3.6 42.9%
Adult Female 0 --- 0.0 --- 2 28.6% 2.4 28.6%Adult Unknown Sex 0 --- 0.0 --- 0 0.0% 0.0 0.0%
Juvenile Male 0 --- 0.0 --- 2 28.6% 2.4 28.6%Juvenile Female 0 --- 0.0 --- 0 0.0% 0.0 0.0%
Juvenile Unknown Sex 0 --- 0.0 --- 0 0.0% 0.0 0.0%Pup Male 0 --- 0.0 --- 0 0.0% 0.0 0.0%
Pup Female 0 --- 0.0 --- 0 0.0% 0.0 0.0%Pup Unknown Sex 0 --- 0.0 --- 0 0.0% 0.0 0.0%
Male Unknown Age 0 --- 0.0 --- 0 0.0% 0.0 0.0%Female Unknown Age 0 --- 0.0 --- 0 0.0% 0.0 0.0%Unknown Sex and Age 0 --- 0.0 --- 0 0.0% 0.0 0.0%
Total 0 --- 0.0 --- 7 100.0% 8.4 100.0%
SEASONALLY ADJUSTED TAKE BY MONTH, SEA LION AND HARBOR SEAL
ESTIMATED COMMUNITY HARVEST, STRUCK AND LOST, AND TAKE BY YEAR
SEA LION HARBOR SEALStruck/ Total Struck/ Total
Year Harvest Lost Take Year Harvest Lost Take
1992 0.0 0.0 0.0 1992 8.3 1.4 9.71993 0.0 0.0 0.0 1993 5.3 1.1 6.41994 0.0 0.0 0.0 1994 4.4 1.1 5.61995 0.0 0.0 0.0 1995 13.5 0.0 13.51996 0.0 0.0 0.0 1996 15.4 0.0 15.41997 0.0 0.0 0.0 1997 14.5 0.0 14.51998 0.0 0.0 0.0 1998 15.8 2.4 18.22000 0.0 0.0 0.0 2000 7.5 0.0 7.52001 0.0 0.0 0.0 2001 9.0 0.0 9.02002 0.0 0.0 0.0 2002 1.8 0.0 1.82003 0.0 0.0 0.0 2003 1.8 0.0 1.82004 0.0 0.0 0.0 2004 1.8 0.0 1.82005 0.0 0.0 0.0 2005 10.5 0.0 10.52006 0.0 0.0 0.0 2006 8.4 0.0 8.4
SOURCE: Alaska Department of Fish and Game, Division of Subsistence, Household Surveys 1992-1998;SAIFWC Household Surveys, 2000-2007.
C - 22
0
1
2
3
4
Jan Feb Mar Apr May Jun Jul Aug Sep Oct Nov Dec
Seas
onal
ly A
djus
ted
Tota
l Tak
e
Sea Lion Harbor Seal

Table 12. SEA LION AND HARBOR SEAL HARVEST AND TAKE ESTIMATES: Petersburg, 2006
SAMPLING DESIGN: CHAIN REFERRAL Total Referred Households 30
Surveyed Households 30Sampling Fraction
Sample Household Members 96Estimated Household Members 96.0
2000 U.S. Census Estimated Native Population 388HARVEST AND USE INFORMATION
Percentage of Sample Households: Estimated Community Harvest Sea Harbor and Take (Expanded): Sea Harbor
Lion Seal Lion SealUsed 0.0% 100.0% Total Number Harvested 0.0 10.0
Hunted 0.0% 40.0% Total Number Struck and Lost 0.0 11.0Harvested 0.0% 20.0% Total Number Taken 0.0 21.0Received 0.0% 83.3%
Gave Away 0.0% 66.7% Number Harvested Per Capita 0.00 0.03
SEA LION HARVEST BY MONTH UnknownJan Feb Mar Apr May Jun Jul Aug Sep Oct Nov Dec Month Total
REPORTED HARVEST AND TAKE BY SAMPLED HOUSEHOLDS (UNEXPANDED)Harvest 0 0 0 0 0 0 0 0 0 0 0 0 0 0Struck & Lost 0 0 0 0 0 0 0 0 0 0 0 0 0 0Total Take 0 0 0 0 0 0 0 0 0 0 0 0 0 0
ESTIMATED HARVEST AND TAKE BY COMMUNITY (EXPANDED)Harvest 0.0 0.0 0.0 0.0 0.0 0.0 0.0 0.0 0.0 0.0 0.0 0.0 0.0 0.0Struck & Lost 0.0 0.0 0.0 0.0 0.0 0.0 0.0 0.0 0.0 0.0 0.0 0.0 0.0 0.0Total Take 0.0 0.0 0.0 0.0 0.0 0.0 0.0 0.0 0.0 0.0 0.0 0.0 0.0 0.0
ESTIMATED SEASONALLY ADJUSTED HARVEST AND TAKE BY COMMUNITY (EXPANDED)Harvest 0.0 0.0 0.0 0.0 0.0 0.0 0.0 0.0 0.0 0.0 0.0 0.0 0.0Struck & Lost 0.0 0.0 0.0 0.0 0.0 0.0 0.0 0.0 0.0 0.0 0.0 0.0 0.0Total Take 0.0 0.0 0.0 0.0 0.0 0.0 0.0 0.0 0.0 0.0 0.0 0.0 0.0Total Take (%) --- --- --- --- --- --- --- --- --- --- --- --- ---Cum. Take 0.0 0.0 0.0 0.0 0.0 0.0 0.0 0.0 0.0 0.0 0.0 0.0Cum. Take (%) --- --- --- --- --- --- --- --- --- --- --- ---
HARBOR SEAL HARVEST BY MONTH UnknownJan Feb Mar Apr May Jun Jul Aug Sep Oct Nov Dec Month Total
REPORTED HARVEST AND TAKE BY SAMPLED HOUSEHOLDS (UNEXPANDED)Harvest 0 0 0 0 0 0 0 0 1 5 3 1 0 10Struck & Lost 0 0 0 0 1 0 0 1 1 2 3 3 0 11Total Take 0 0 0 0 1 0 0 1 2 7 6 4 0 21
ESTIMATED HARVEST AND TAKE BY COMMUNITY (EXPANDED)Harvest 0.0 0.0 0.0 0.0 0.0 0.0 0.0 0.0 1.0 5.0 3.0 1.0 0.0 10.0Struck & Lost 0.0 0.0 0.0 0.0 1.0 0.0 0.0 1.0 1.0 2.0 3.0 3.0 0.0 11.0Total Take 0.0 0.0 0.0 0.0 1.0 0.0 0.0 1.0 2.0 7.0 6.0 4.0 0.0 21.0
ESTIMATED SEASONALLY ADJUSTED HARVEST AND TAKE BY COMMUNITY (EXPANDED)Harvest 0.0 0.0 0.0 0.0 0.0 0.0 0.0 0.0 1.0 5.0 3.0 1.0 10.0Struck & Lost 0.0 0.0 0.0 0.0 1.0 0.0 0.0 1.0 1.0 2.0 3.0 3.0 11.0Total Take 0.0 0.0 0.0 0.0 1.0 0.0 0.0 1.0 2.0 7.0 6.0 4.0 21.0Total Take (%) 0.0% 0.0% 0.0% 0.0% 4.8% 0.0% 0.0% 4.8% 9.5% 33.3% 28.6% 19.0% 100.0%Cum. Take 0.0 0.0 0.0 0.0 1.0 1.0 1.0 2.0 4.0 11.0 17.0 21.0Cum. Take (%) 0.0% 0.0% 0.0% 0.0% 4.8% 4.8% 4.8% 9.5% 19.0% 52.4% 81.0% 100.0% SOURCE: SAIFWC Household Surveys, 2007.
C - 23
100.0%
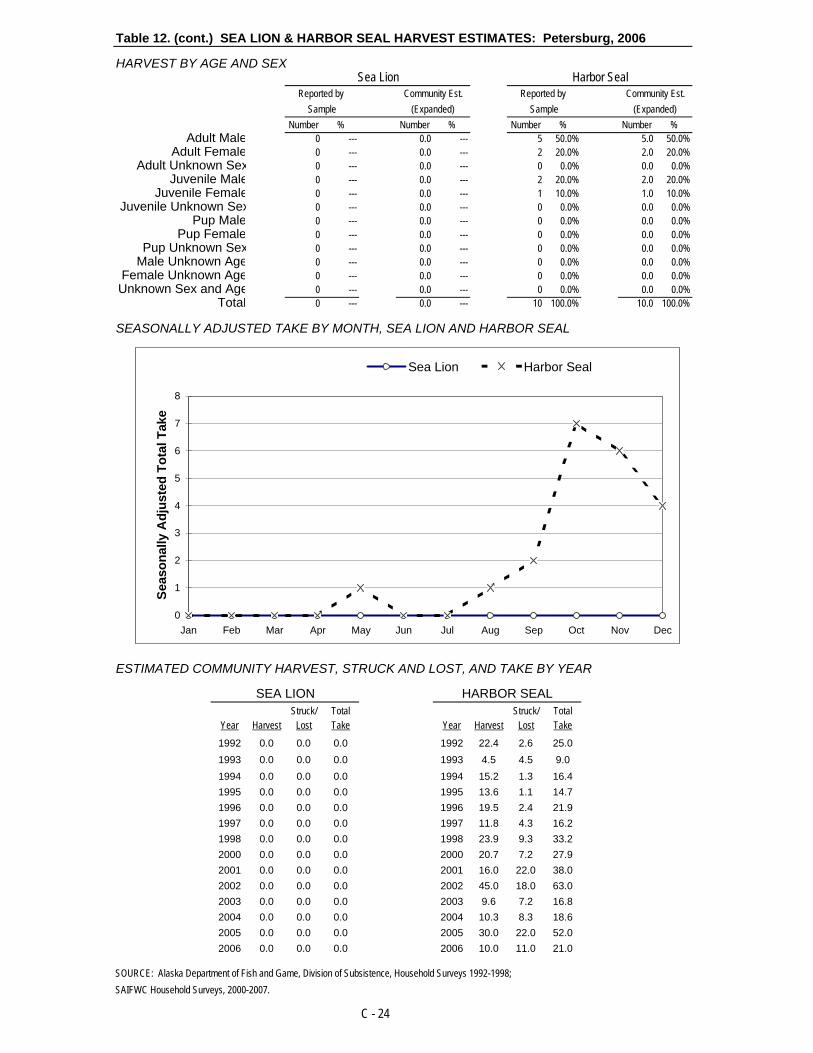
Table 12. (cont.) SEA LION & HARBOR SEAL HARVEST ESTIMATES: Petersburg, 2006
HARVEST BY AGE AND SEXSea Lion Harbor Seal
Reported by Community Est. Reported by Community Est.Sample (Expanded) Sample (Expanded)
Number % Number % Number % Number %Adult Male 0 --- 0.0 --- 5 50.0% 5.0 50.0%
Adult Female 0 --- 0.0 --- 2 20.0% 2.0 20.0%Adult Unknown Sex 0 --- 0.0 --- 0 0.0% 0.0 0.0%
Juvenile Male 0 --- 0.0 --- 2 20.0% 2.0 20.0%Juvenile Female 0 --- 0.0 --- 1 10.0% 1.0 10.0%
Juvenile Unknown Sex 0 --- 0.0 --- 0 0.0% 0.0 0.0%Pup Male 0 --- 0.0 --- 0 0.0% 0.0 0.0%
Pup Female 0 --- 0.0 --- 0 0.0% 0.0 0.0%Pup Unknown Sex 0 --- 0.0 --- 0 0.0% 0.0 0.0%
Male Unknown Age 0 --- 0.0 --- 0 0.0% 0.0 0.0%Female Unknown Age 0 --- 0.0 --- 0 0.0% 0.0 0.0%Unknown Sex and Age 0 --- 0.0 --- 0 0.0% 0.0 0.0%
Total 0 --- 0.0 --- 10 100.0% 10.0 100.0%
SEASONALLY ADJUSTED TAKE BY MONTH, SEA LION AND HARBOR SEAL
ESTIMATED COMMUNITY HARVEST, STRUCK AND LOST, AND TAKE BY YEAR
SEA LION HARBOR SEALStruck/ Total Struck/ Total
Year Harvest Lost Take Year Harvest Lost Take
1992 0.0 0.0 0.0 1992 22.4 2.6 25.01993 0.0 0.0 0.0 1993 4.5 4.5 9.01994 0.0 0.0 0.0 1994 15.2 1.3 16.41995 0.0 0.0 0.0 1995 13.6 1.1 14.71996 0.0 0.0 0.0 1996 19.5 2.4 21.91997 0.0 0.0 0.0 1997 11.8 4.3 16.21998 0.0 0.0 0.0 1998 23.9 9.3 33.22000 0.0 0.0 0.0 2000 20.7 7.2 27.92001 0.0 0.0 0.0 2001 16.0 22.0 38.02002 0.0 0.0 0.0 2002 45.0 18.0 63.02003 0.0 0.0 0.0 2003 9.6 7.2 16.82004 0.0 0.0 0.0 2004 10.3 8.3 18.62005 0.0 0.0 0.0 2005 30.0 22.0 52.02006 0.0 0.0 0.0 2006 10.0 11.0 21.0
SOURCE: Alaska Department of Fish and Game, Division of Subsistence, Household Surveys 1992-1998;SAIFWC Household Surveys, 2000-2007.
C - 24
0
1
2
3
4
5
6
7
8
Jan Feb Mar Apr May Jun Jul Aug Sep Oct Nov Dec
Seas
onal
ly A
djus
ted
Tota
l Tak
e
Sea Lion Harbor Seal

Table 13. SEA LION AND HARBOR SEAL HARVEST AND TAKE ESTIMATES: Saxman, 2006
SAMPLING DESIGN: CHAIN REFERRAL Total Referred Households 14
Surveyed Households 10Sampling Fraction 71.4%
Sample Household Members 37Estimated Household Members 51.8
2000 U.S. Census Estimated Native Population 302HARVEST AND USE INFORMATION
Percentage of Sample Households: Estimated Community Harvest Sea Harbor and Take (Expanded): Sea Harbor
Lion Seal Lion SealUsed 0.0% 90.0% Total Number Harvested 0.0 20.2
Hunted 0.0% 60.0% Total Number Struck and Lost 0.0 0.0Harvested 0.0% 50.0% Total Number Taken 0.0 20.2Received 0.0% 40.0%
Gave Away 0.0% 50.0% Number Harvested Per Capita 0.00 0.07
SEA LION HARVEST BY MONTH UnknownJan Feb Mar Apr May Jun Jul Aug Sep Oct Nov Dec Month Total
REPORTED HARVEST AND TAKE BY SAMPLED HOUSEHOLDS (UNEXPANDED)Harvest 0 0 0 0 0 0 0 0 0 0 0 0 0 0Struck & Lost 0 0 0 0 0 0 0 0 0 0 0 0 0 0Total Take 0 0 0 0 0 0 0 0 0 0 0 0 0 0
ESTIMATED HARVEST AND TAKE BY COMMUNITY (EXPANDED)Harvest 0.0 0.0 0.0 0.0 0.0 0.0 0.0 0.0 0.0 0.0 0.0 0.0 0.0 0.0Struck & Lost 0.0 0.0 0.0 0.0 0.0 0.0 0.0 0.0 0.0 0.0 0.0 0.0 0.0 0.0Total Take 0.0 0.0 0.0 0.0 0.0 0.0 0.0 0.0 0.0 0.0 0.0 0.0 0.0 0.0
ESTIMATED SEASONALLY ADJUSTED HARVEST AND TAKE BY COMMUNITY (EXPANDED)Harvest 0.0 0.0 0.0 0.0 0.0 0.0 0.0 0.0 0.0 0.0 0.0 0.0 0.0Struck & Lost 0.0 0.0 0.0 0.0 0.0 0.0 0.0 0.0 0.0 0.0 0.0 0.0 0.0Total Take 0.0 0.0 0.0 0.0 0.0 0.0 0.0 0.0 0.0 0.0 0.0 0.0 0.0Total Take (%) --- --- --- --- --- --- --- --- --- --- --- --- ---Cum. Take 0.0 0.0 0.0 0.0 0.0 0.0 0.0 0.0 0.0 0.0 0.0 0.0Cum. Take (%) --- --- --- --- --- --- --- --- --- --- --- ---
HARBOR SEAL HARVEST BY MONTH UnknownJan Feb Mar Apr May Jun Jul Aug Sep Oct Nov Dec Month Total
REPORTED HARVEST AND TAKE BY SAMPLED HOUSEHOLDS (UNEXPANDED)Harvest 0 0 0 0 0 0 0 0 1 5 5 1 2 14Struck & Lost 0 0 0 0 0 0 0 0 0 0 0 0 0 0Total Take 0 0 0 0 0 0 0 0 1 5 5 1 2 14
ESTIMATED HARVEST AND TAKE BY COMMUNITY (EXPANDED)Harvest 0.0 0.0 0.0 0.0 0.0 0.0 0.0 0.0 1.4 7.0 7.0 1.4 3.4 20.2Struck & Lost 0.0 0.0 0.0 0.0 0.0 0.0 0.0 0.0 0.0 0.0 0.0 0.0 0.0 0.0Total Take 0.0 0.0 0.0 0.0 0.0 0.0 0.0 0.0 1.4 7.0 7.0 1.4 3.4 20.2
ESTIMATED SEASONALLY ADJUSTED HARVEST AND TAKE BY COMMUNITY (EXPANDED)Harvest 0.0 0.0 0.0 0.0 0.0 0.0 0.0 0.0 1.7 8.4 8.4 1.7 20.2Struck & Lost 0.0 0.0 0.0 0.0 0.0 0.0 0.0 0.0 0.0 0.0 0.0 0.0 0.0Total Take 0.0 0.0 0.0 0.0 0.0 0.0 0.0 0.0 1.7 8.4 8.4 1.7 20.2Total Take (%) 0.0% 0.0% 0.0% 0.0% 0.0% 0.0% 0.0% 0.0% 8.3% 41.7% 41.7% 8.3% 100.0%Cum. Take 0.0 0.0 0.0 0.0 0.0 0.0 0.0 0.0 1.7 10.1 18.5 20.2Cum. Take (%) 0.0% 0.0% 0.0% 0.0% 0.0% 0.0% 0.0% 0.0% 8.3% 50.0% 91.7% 100.0% SOURCE: SAIFWC Household Surveys, 2007.
C - 25

Table 13. (cont.) SEA LION & HARBOR SEAL HARVEST ESTIMATES: Saxman, 2006
HARVEST BY AGE AND SEXSea Lion Harbor Seal
Reported by Community Est. Reported by Community Est.Sample (Expanded) Sample (Expanded)
Number % Number % Number % Number %Adult Male 0 --- 0.0 --- 6 41.7% 8.4 41.7%
Adult Female 0 --- 0.0 --- 0 0.0% 0.0 0.0%Adult Unknown Sex 0 --- 0.0 --- 5 34.7% 7.0 34.7%
Juvenile Male 0 --- 0.0 --- 1 6.9% 1.4 6.9%Juvenile Female 0 --- 0.0 --- 0 0.0% 0.0 0.0%
Juvenile Unknown Sex 0 --- 0.0 --- 0 0.0% 0.0 0.0%Pup Male 0 --- 0.0 --- 0 0.0% 0.0 0.0%
Pup Female 0 --- 0.0 --- 0 0.0% 0.0 0.0%Pup Unknown Sex 0 --- 0.0 --- 0 0.0% 0.0 0.0%
Male Unknown Age 0 --- 0.0 --- 0 0.0% 0.0 0.0%Female Unknown Age 0 --- 0.0 --- 0 0.0% 0.0 0.0%Unknown Sex and Age 0 --- 0.0 --- 2 16.7% 3.4 16.7%
Total 0 --- 0.0 --- 14 100.0% 20.2 100.0%
SEASONALLY ADJUSTED TAKE BY MONTH, SEA LION AND HARBOR SEAL
ESTIMATED COMMUNITY HARVEST, STRUCK AND LOST, AND TAKE BY YEAR
SEA LION HARBOR SEALStruck/ Total Struck/ Total
Year Harvest Lost Take Year Harvest Lost Take
1992 0.0 0.0 0.0 1992 22.2 1.2 23.51993 0.0 0.0 0.0 1993 5.6 0.0 5.61994 0.0 0.0 0.0 1994 16.5 0.0 16.51995 0.0 0.0 0.0 1995 15.9 0.0 15.91996 0.0 0.0 0.0 1996 4.9 0.0 4.91997 0.0 0.0 0.0 1997 11.0 0.0 11.01998 0.0 0.0 0.0 1998 19.6 0.0 19.62000 0.0 0.0 0.0 2000 45.6 1.9 47.52001 0.0 0.0 0.0 2001 12.9 0.0 12.92002 0.0 0.0 0.0 2002 25.5 3.0 28.52003 0.0 0.0 0.0 2003 12.0 0.0 12.02004 0.0 0.0 0.0 2004 5.0 0.0 5.02005 0.0 0.0 0.0 2005 6.8 5.5 12.32006 0.0 0.0 0.0 2006 20.2 0.0 20.2
SOURCE: Alaska Department of Fish and Game, Division of Subsistence, Household Surveys 1992-1998;SAIFWC Household Surveys, 2000-2007.
C - 26
0
1
2
3
4
5
6
7
8
9
Jan Feb Mar Apr May Jun Jul Aug Sep Oct Nov Dec
Seas
onal
ly A
djus
ted
Tota
l Tak
e
Sea Lion Harbor Seal

Table 14. SEA LION AND HARBOR SEAL HARVEST AND TAKE ESTIMATES: Sitka, 2006
SAMPLING DESIGN: CHAIN REFERRAL Total Referred Households 65
Surveyed Households 64Sampling Fraction 98.5%
Sample Household Members 209Estimated Household Members 211.8
2000 U.S. Census Estimated Native Population 2178HARVEST AND USE INFORMATION
Percentage of Sample Households: Estimated Community Harvest Sea Harbor and Take (Expanded): Sea Harbor
Lion Seal Lion SealUsed 0.0% 79.7% Total Number Harvested 0.0 141.2
Hunted 0.0% 54.7% Total Number Struck and Lost 0.0 19.3Harvested 0.0% 53.1% Total Number Taken 0.0 160.5Received 0.0% 26.6%
Gave Away 0.0% 62.5% Number Harvested Per Capita 0.00 0.06
SEA LION HARVEST BY MONTH UnknownJan Feb Mar Apr May Jun Jul Aug Sep Oct Nov Dec Month Total
REPORTED HARVEST AND TAKE BY SAMPLED HOUSEHOLDS (UNEXPANDED)Harvest 0 0 0 0 0 0 0 0 0 0 0 0 0 0Struck & Lost 0 0 0 0 0 0 0 0 0 0 0 0 0 0Total Take 0 0 0 0 0 0 0 0 0 0 0 0 0 0
ESTIMATED HARVEST AND TAKE BY COMMUNITY (EXPANDED)Harvest 0.0 0.0 0.0 0.0 0.0 0.0 0.0 0.0 0.0 0.0 0.0 0.0 0.0 0.0Struck & Lost 0.0 0.0 0.0 0.0 0.0 0.0 0.0 0.0 0.0 0.0 0.0 0.0 0.0 0.0Total Take 0.0 0.0 0.0 0.0 0.0 0.0 0.0 0.0 0.0 0.0 0.0 0.0 0.0 0.0
ESTIMATED SEASONALLY ADJUSTED HARVEST AND TAKE BY COMMUNITY (EXPANDED)Harvest 0.0 0.0 0.0 0.0 0.0 0.0 0.0 0.0 0.0 0.0 0.0 0.0 0.0Struck & Lost 0.0 0.0 0.0 0.0 0.0 0.0 0.0 0.0 0.0 0.0 0.0 0.0 0.0Total Take 0.0 0.0 0.0 0.0 0.0 0.0 0.0 0.0 0.0 0.0 0.0 0.0 0.0Total Take (%) --- --- --- --- --- --- --- --- --- --- --- --- ---Cum. Take 0.0 0.0 0.0 0.0 0.0 0.0 0.0 0.0 0.0 0.0 0.0 0.0Cum. Take (%) --- --- --- --- --- --- --- --- --- --- --- ---
HARBOR SEAL HARVEST BY MONTH UnknownJan Feb Mar Apr May Jun Jul Aug Sep Oct Nov Dec Month Total
REPORTED HARVEST AND TAKE BY SAMPLED HOUSEHOLDS (UNEXPANDED)Harvest 9 20 26 20 0 5 1 4 8 14 16 16 0 139Struck & Lost 2 3 0 1 0 0 0 0 0 4 2 3 4 19Total Take 11 23 26 21 0 5 1 4 8 18 18 19 4 158
ESTIMATED HARVEST AND TAKE BY COMMUNITY (EXPANDED)Harvest 9.1 20.3 26.4 20.3 0.0 5.1 1.0 4.1 8.1 14.2 16.3 16.3 0.0 141.2Struck & Lost 2.0 3.0 0.0 1.0 0.0 0.0 0.0 0.0 0.0 4.1 2.0 3.0 4.1 19.3Total Take 11.2 23.4 26.4 21.3 0.0 5.1 1.0 4.1 8.1 18.3 18.3 19.3 4.1 160.5
ESTIMATED SEASONALLY ADJUSTED HARVEST AND TAKE BY COMMUNITY (EXPANDED)Harvest 9.1 20.3 26.4 20.3 0.0 5.1 1.0 4.1 8.1 14.2 16.3 16.3 141.2Struck & Lost 2.6 3.9 0.0 1.3 0.0 0.0 0.0 0.0 0.0 5.1 2.6 3.9 19.3Total Take 11.7 24.2 26.4 21.6 0.0 5.1 1.0 4.1 8.1 19.4 18.8 20.1 160.5Total Take (%) 7.3% 15.1% 16.5% 13.5% 0.0% 3.2% 0.6% 2.5% 5.1% 12.1% 11.7% 12.5% 100.0%Cum. Take 11.7 35.9 62.3 83.9 83.9 89.0 90.0 94.0 102.2 121.5 140.4 160.5Cum. Take (%) 7.3% 22.4% 38.8% 52.3% 52.3% 55.4% 56.1% 58.6% 63.7% 75.7% 87.5% 100.0% SOURCE: SAIFWC Household Surveys, (Numbers based on 2005 survey estimates).
C - 27
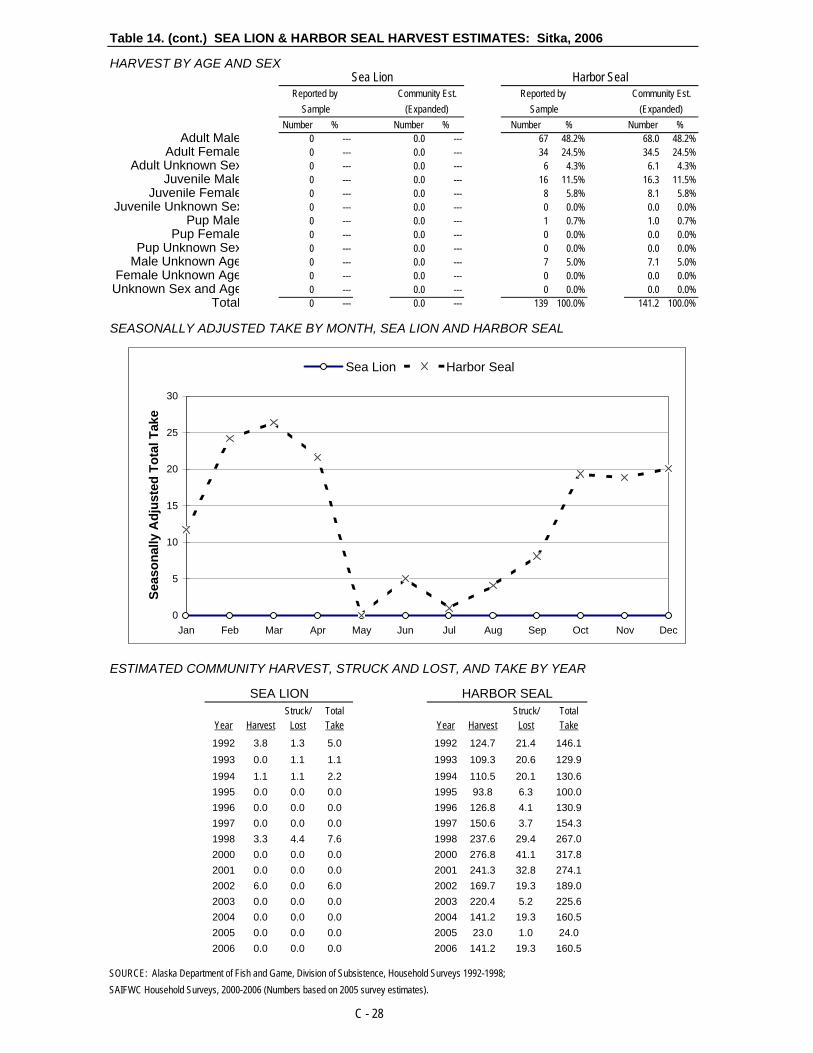
Table 14. (cont.) SEA LION & HARBOR SEAL HARVEST ESTIMATES: Sitka, 2006
HARVEST BY AGE AND SEXSea Lion Harbor Seal
Reported by Community Est. Reported by Community Est.Sample (Expanded) Sample (Expanded)
Number % Number % Number % Number %Adult Male 0 --- 0.0 --- 67 48.2% 68.0 48.2%
Adult Female 0 --- 0.0 --- 34 24.5% 34.5 24.5%Adult Unknown Sex 0 --- 0.0 --- 6 4.3% 6.1 4.3%
Juvenile Male 0 --- 0.0 --- 16 11.5% 16.3 11.5%Juvenile Female 0 --- 0.0 --- 8 5.8% 8.1 5.8%
Juvenile Unknown Sex 0 --- 0.0 --- 0 0.0% 0.0 0.0%Pup Male 0 --- 0.0 --- 1 0.7% 1.0 0.7%
Pup Female 0 --- 0.0 --- 0 0.0% 0.0 0.0%Pup Unknown Sex 0 --- 0.0 --- 0 0.0% 0.0 0.0%
Male Unknown Age 0 --- 0.0 --- 7 5.0% 7.1 5.0%Female Unknown Age 0 --- 0.0 --- 0 0.0% 0.0 0.0%Unknown Sex and Age 0 --- 0.0 --- 0 0.0% 0.0 0.0%
Total 0 --- 0.0 --- 139 100.0% 141.2 100.0%
SEASONALLY ADJUSTED TAKE BY MONTH, SEA LION AND HARBOR SEAL
ESTIMATED COMMUNITY HARVEST, STRUCK AND LOST, AND TAKE BY YEAR
SEA LION HARBOR SEALStruck/ Total Struck/ Total
Year Harvest Lost Take Year Harvest Lost Take
1992 3.8 1.3 5.0 1992 124.7 21.4 146.11993 0.0 1.1 1.1 1993 109.3 20.6 129.91994 1.1 1.1 2.2 1994 110.5 20.1 130.61995 0.0 0.0 0.0 1995 93.8 6.3 100.01996 0.0 0.0 0.0 1996 126.8 4.1 130.91997 0.0 0.0 0.0 1997 150.6 3.7 154.31998 3.3 4.4 7.6 1998 237.6 29.4 267.02000 0.0 0.0 0.0 2000 276.8 41.1 317.82001 0.0 0.0 0.0 2001 241.3 32.8 274.12002 6.0 0.0 6.0 2002 169.7 19.3 189.02003 0.0 0.0 0.0 2003 220.4 5.2 225.62004 0.0 0.0 0.0 2004 141.2 19.3 160.52005 0.0 0.0 0.0 2005 23.0 1.0 24.02006 0.0 0.0 0.0 2006 141.2 19.3 160.5
SOURCE: Alaska Department of Fish and Game, Division of Subsistence, Household Surveys 1992-1998;SAIFWC Household Surveys, 2000-2006 (Numbers based on 2005 survey estimates).
C - 28
0
5
10
15
20
25
30
Jan Feb Mar Apr May Jun Jul Aug Sep Oct Nov Dec
Seas
onal
ly A
djus
ted
Tota
l Tak
e
Sea Lion Harbor Seal

Table 15. SEA LION AND HARBOR SEAL HARVEST AND TAKE ESTIMATES: Wrangell, 2006
SAMPLING DESIGN: CHAIN REFERRAL Total Referred Households 10
Surveyed Households 6Sampling Fraction
Sample Household Members 15Estimated Household Members 25.0
2000 U.S. Census Estimated Native Population 550HARVEST AND USE INFORMATION
Percentage of Sample Households: Estimated Community Harvest Sea Harbor and Take (Expanded): Sea Harbor
Lion Seal Lion SealUsed 0.0% 33.3% Total Number Harvested 0.0 33.3
Hunted 0.0% 33.3% Total Number Struck and Lost 0.0 8.3Harvested 0.0% 33.3% Total Number Taken 0.0 41.7Received 0.0% 0.0%
Gave Away 0.0% 16.7% Number Harvested Per Capita 0.00 0.06
SEA LION HARVEST BY MONTH UnknownJan Feb Mar Apr May Jun Jul Aug Sep Oct Nov Dec Month Total
REPORTED HARVEST AND TAKE BY SAMPLED HOUSEHOLDS (UNEXPANDED)Harvest 0 0 0 0 0 0 0 0 0 0 0 0 0 0Struck & Lost 0 0 0 0 0 0 0 0 0 0 0 0 0 0Total Take 0 0 0 0 0 0 0 0 0 0 0 0 0 0
ESTIMATED HARVEST AND TAKE BY COMMUNITY (EXPANDED)Harvest 0.0 0.0 0.0 0.0 0.0 0.0 0.0 0.0 0.0 0.0 0.0 0.0 0.0 0.0Struck & Lost 0.0 0.0 0.0 0.0 0.0 0.0 0.0 0.0 0.0 0.0 0.0 0.0 0.0 0.0Total Take 0.0 0.0 0.0 0.0 0.0 0.0 0.0 0.0 0.0 0.0 0.0 0.0 0.0 0.0
ESTIMATED SEASONALLY ADJUSTED HARVEST AND TAKE BY COMMUNITY (EXPANDED)Harvest 0.0 0.0 0.0 0.0 0.0 0.0 0.0 0.0 0.0 0.0 0.0 0.0 0.0Struck & Lost 0.0 0.0 0.0 0.0 0.0 0.0 0.0 0.0 0.0 0.0 0.0 0.0 0.0Total Take 0.0 0.0 0.0 0.0 0.0 0.0 0.0 0.0 0.0 0.0 0.0 0.0 0.0Total Take (%) --- --- --- --- --- --- --- --- --- --- --- --- ---Cum. Take 0.0 0.0 0.0 0.0 0.0 0.0 0.0 0.0 0.0 0.0 0.0 0.0Cum. Take (%) --- --- --- --- --- --- --- --- --- --- --- ---
HARBOR SEAL HARVEST BY MONTH UnknownJan Feb Mar Apr May Jun Jul Aug Sep Oct Nov Dec Month Total
REPORTED HARVEST AND TAKE BY SAMPLED HOUSEHOLDS (UNEXPANDED)Harvest 0 0 8 3 0 0 0 0 0 1 5 3 0 20Struck & Lost 0 0 5 0 0 0 0 0 0 0 0 0 0 5Total Take 0 0 13 3 0 0 0 0 0 1 5 3 0 25
ESTIMATED HARVEST AND TAKE BY COMMUNITY (EXPANDED)Harvest 0.0 0.0 13.3 5.0 0.0 0.0 0.0 0.0 0.0 1.7 8.3 5.0 0.0 33.3Struck & Lost 0.0 0.0 8.3 0.0 0.0 0.0 0.0 0.0 0.0 0.0 0.0 0.0 0.0 8.3Total Take 0.0 0.0 21.7 5.0 0.0 0.0 0.0 0.0 0.0 1.7 8.3 5.0 0.0 41.7
ESTIMATED SEASONALLY ADJUSTED HARVEST AND TAKE BY COMMUNITY (EXPANDED)Harvest 0.0 0.0 13.3 5.0 0.0 0.0 0.0 0.0 0.0 1.7 8.3 5.0 33.3Struck & Lost 0.0 0.0 8.3 0.0 0.0 0.0 0.0 0.0 0.0 0.0 0.0 0.0 8.3Total Take 0.0 0.0 21.7 5.0 0.0 0.0 0.0 0.0 0.0 1.7 8.3 5.0 41.7Total Take (%) 0.0% 0.0% 52.0% 12.0% 0.0% 0.0% 0.0% 0.0% 0.0% 4.0% 20.0% 12.0% 100.0%Cum. Take 0.0 0.0 21.7 26.7 26.7 26.7 26.7 26.7 26.7 28.3 36.7 41.7Cum. Take (%) 0.0% 0.0% 52.0% 64.0% 64.0% 64.0% 64.0% 64.0% 64.0% 68.0% 88.0% 100.0% SOURCE: SAIFWC Household Surveys, (numbers based on 2004 estimates).
C - 29
60.0%

Table 15. (cont.) SEA LION & HARBOR SEAL HARVEST ESTIMATES: Wrangell, 2006
HARVEST BY AGE AND SEXSea Lion Harbor Seal
Reported by Community Est. Reported by Community Est.Sample (Expanded) Sample (Expanded)
Number % Number % Number % Number %Adult Male 0 --- 0.0 --- 2 10.0% 3.3 10.0%
Adult Female 0 --- 0.0 --- 1 5.0% 1.7 5.0%Adult Unknown Sex 0 --- 0.0 --- 1 5.0% 1.7 5.0%
Juvenile Male 0 --- 0.0 --- 0 0.0% 0.0 0.0%Juvenile Female 0 --- 0.0 --- 0 0.0% 0.0 0.0%
Juvenile Unknown Sex 0 --- 0.0 --- 0 0.0% 0.0 0.0%Pup Male 0 --- 0.0 --- 0 0.0% 0.0 0.0%
Pup Female 0 --- 0.0 --- 0 0.0% 0.0 0.0%Pup Unknown Sex 0 --- 0.0 --- 0 0.0% 0.0 0.0%
Male Unknown Age 0 --- 0.0 --- 0 0.0% 0.0 0.0%Female Unknown Age 0 --- 0.0 --- 0 0.0% 0.0 0.0%Unknown Sex and Age 0 --- 0.0 --- 16 80.0% 26.7 80.0%
Total 0 --- 0.0 --- 20 100.0% 33.3 100.0%
SEASONALLY ADJUSTED TAKE BY MONTH, SEA LION AND HARBOR SEAL
ESTIMATED COMMUNITY HARVEST, STRUCK AND LOST, AND TAKE BY YEAR
SEA LION HARBOR SEALStruck/ Total Struck/ Total
Year Harvest Lost Take Year Harvest Lost Take
1992 0.0 0.0 0.0 1992 6.0 8.0 14.01993 0.0 0.0 0.0 1993 19.5 9.0 28.51994 0.0 0.0 0.0 1994 101.0 27.0 128.01995 0.0 0.0 0.0 1995 89.3 22.8 112.01996 0.0 0.0 0.0 1996 79.3 22.2 101.51997 0.0 0.0 0.0 1997 68.8 29.2 98.01998 0.0 0.0 0.0 1998 174.0 30.0 204.02000 0.0 0.0 0.0 2000 28.5 12.0 40.52001 0.0 0.0 0.0 2001 16.0 29.0 45.02002 0.0 0.0 0.0 2002 20.0 9.0 29.02003 0.0 0.0 0.0 2003 68.0 18.7 86.72004 0.0 0.0 0.0 2004 33.3 8.3 41.72005 0.0 0.0 0.0 2005 33.3 8.3 41.72006 0.0 0.0 0.0 2006 33.3 8.3 41.7
SOURCE: Alaska Department of Fish and Game, Division of Subsistence, Household Surveys 1992-1998;SAIFWC Household Surveys, 2000-2005 (Numbers based on 2004 estimates).
C - 30
0
5
10
15
20
25
Jan Feb Mar Apr May Jun Jul Aug Sep Oct Nov Dec
Seas
onal
ly A
djus
ted
Tota
l Tak
e
Sea Lion Harbor Seal

Table 16. SEA LION AND HARBOR SEAL HARVEST AND TAKE ESTIMATES: Yakutat, 2006
SAMPLING DESIGN: CHAIN REFERRAL Total Referred Households 45
Surveyed Households 40Sampling Fraction 88.9%
Sample Household Members 109Estimated Household Members 122.6
2000 U.S. Census Estimated Native Population 375HARVEST AND USE INFORMATION
Percentage of Sample Households: Estimated Community Harvest Sea Harbor and Take (Expanded): Sea Harbor
Lion Seal Lion SealUsed 0.0% 97.5% Total Number Harvested 0.0 137.3
Hunted 0.0% 60.0% Total Number Struck and Lost 0.0 33.8Harvested 0.0% 57.5% Total Number Taken 0.0 171.0Received 0.0% 75.0%
Gave Away 0.0% 62.5% Number Harvested Per Capita 0.00 0.37
SEA LION HARVEST BY MONTH UnknownJan Feb Mar Apr May Jun Jul Aug Sep Oct Nov Dec Month Total
REPORTED HARVEST AND TAKE BY SAMPLED HOUSEHOLDS (UNEXPANDED)Harvest 0 0 0 0 0 0 0 0 0 0 0 0 0 0Struck & Lost 0 0 0 0 0 0 0 0 0 0 0 0 0 0Total Take 0 0 0 0 0 0 0 0 0 0 0 0 0 0
ESTIMATED HARVEST AND TAKE BY COMMUNITY (EXPANDED)Harvest 0.0 0.0 0.0 0.0 0.0 0.0 0.0 0.0 0.0 0.0 0.0 0.0 0.0 0.0Struck & Lost 0.0 0.0 0.0 0.0 0.0 0.0 0.0 0.0 0.0 0.0 0.0 0.0 0.0 0.0Total Take 0.0 0.0 0.0 0.0 0.0 0.0 0.0 0.0 0.0 0.0 0.0 0.0 0.0 0.0
ESTIMATED SEASONALLY ADJUSTED HARVEST AND TAKE BY COMMUNITY (EXPANDED)Harvest 0.0 0.0 0.0 0.0 0.0 0.0 0.0 0.0 0.0 0.0 0.0 0.0 0.0Struck & Lost 0.0 0.0 0.0 0.0 0.0 0.0 0.0 0.0 0.0 0.0 0.0 0.0 0.0Total Take 0.0 0.0 0.0 0.0 0.0 0.0 0.0 0.0 0.0 0.0 0.0 0.0 0.0Total Take (%) --- --- --- --- --- --- --- --- --- --- --- --- ---Cum. Take 0.0 0.0 0.0 0.0 0.0 0.0 0.0 0.0 0.0 0.0 0.0 0.0Cum. Take (%) --- --- --- --- --- --- --- --- --- --- --- ---
HARBOR SEAL HARVEST BY MONTH UnknownJan Feb Mar Apr May Jun Jul Aug Sep Oct Nov Dec Month Total
REPORTED HARVEST AND TAKE BY SAMPLED HOUSEHOLDS (UNEXPANDED)Harvest 0 1 6 21 10 13 17 4 12 10 17 11 0 122Struck & Lost 0 0 4 4 2 7 5 0 2 1 4 1 0 30Total Take 0 1 10 25 12 20 22 4 14 11 21 12 0 152
ESTIMATED HARVEST AND TAKE BY COMMUNITY (EXPANDED)Harvest 0.0 1.1 6.8 23.6 11.3 14.6 19.1 4.5 13.5 11.3 19.1 12.4 0.0 137.3Struck & Lost 0.0 0.0 4.5 4.5 2.3 7.9 5.6 0.0 2.3 1.1 4.5 1.1 0.0 33.8Total Take 0.0 1.1 11.3 28.1 13.5 22.5 24.8 4.5 15.8 12.4 23.6 13.5 0.0 171.0
ESTIMATED SEASONALLY ADJUSTED HARVEST AND TAKE BY COMMUNITY (EXPANDED)Harvest 0.0 1.1 6.8 23.6 11.3 14.6 19.1 4.5 13.5 11.3 19.1 12.4 137.3Struck & Lost 0.0 0.0 4.5 4.5 2.3 7.9 5.6 0.0 2.3 1.1 4.5 1.1 33.8Total Take 0.0 1.1 11.3 28.1 13.5 22.5 24.8 4.5 15.8 12.4 23.6 13.5 171.0Total Take (%) 0.0% 0.7% 6.6% 16.4% 7.9% 13.2% 14.5% 2.6% 9.2% 7.2% 13.8% 7.9% 100.0%Cum. Take 0.0 1.1 12.4 40.5 54.0 76.5 101.3 105.8 121.5 133.9 157.5 171.0Cum. Take (%) 0.0% 0.7% 7.2% 23.7% 31.6% 44.7% 59.2% 61.8% 71.1% 78.3% 92.1% 100.0% SOURCE: SAIFWC Household Surveys, 2007.
C - 31

Table 16. (cont.) SEA LION & HARBOR SEAL HARVEST ESTIMATES: Yakutat, 2006
HARVEST BY AGE AND SEXSea Lion Harbor Seal
Reported by Community Est. Reported by Community Est.Sample (Expanded) Sample (Expanded)
Number % Number % Number % Number %Adult Male 0 --- 0.0 --- 64 52.5% 72.0 52.5%
Adult Female 0 --- 0.0 --- 15 12.3% 16.9 12.3%Adult Unknown Sex 0 --- 0.0 --- 1 0.8% 1.1 0.8%
Juvenile Male 0 --- 0.0 --- 28 23.0% 31.5 23.0%Juvenile Female 0 --- 0.0 --- 14 11.5% 15.8 11.5%
Juvenile Unknown Sex 0 --- 0.0 --- 0 0.0% 0.0 0.0%Pup Male 0 --- 0.0 --- 0 0.0% 0.0 0.0%
Pup Female 0 --- 0.0 --- 0 0.0% 0.0 0.0%Pup Unknown Sex 0 --- 0.0 --- 0 0.0% 0.0 0.0%
Male Unknown Age 0 --- 0.0 --- 0 0.0% 0.0 0.0%Female Unknown Age 0 --- 0.0 --- 0 0.0% 0.0 0.0%Unknown Sex and Age 0 --- 0.0 --- 0 0.0% 0.0 0.0%
Total 0 --- 0.0 --- 122 100.0% 137.3 100.0%
SEASONALLY ADJUSTED TAKE BY MONTH, SEA LION AND HARBOR SEAL
ESTIMATED COMMUNITY HARVEST, STRUCK AND LOST, AND TAKE BY YEAR
SEA LION HARBOR SEALStruck/ Total Struck/ Total
Year Harvest Lost Take Year Harvest Lost Take
1992 0.0 0.0 0.0 1992 248.0 61.3 309.31993 0.0 0.0 0.0 1993 568.4 57.4 625.81994 0.0 0.0 0.0 1994 417.1 35.0 452.11995 0.0 0.0 0.0 1995 615.5 79.6 695.11996 0.0 0.0 0.0 1996 640.3 124.1 764.51997 0.0 0.0 0.0 1997 491.5 139.9 631.51998 0.0 0.0 0.0 1998 289.0 72.3 361.32000 0.0 0.0 0.0 2000 193.3 56.8 250.12001 0.0 0.0 0.0 2001 208.8 36.2 245.02002 0.0 0.0 0.0 2002 110.3 27.2 137.52003 0.0 0.0 0.0 2003 251.7 51.5 303.22004 0.0 0.0 0.0 2004 147.7 27.1 174.82005 0.0 0.0 0.0 2005 140.2 24.1 164.32006 0.0 0.0 0.0 2006 137.3 33.8 171.0
SOURCE: Alaska Department of Fish and Game, Division of Subsistence, Household Surveys 1992-1998;SAIFWC Household Surveys, 2000-2007.
C - 32
0
5
10
15
20
25
30
Jan Feb Mar Apr May Jun Jul Aug Sep Oct Nov Dec
Seas
onal
ly A
djus
ted
Tota
l Tak
e
Sea Lion Harbor Seal
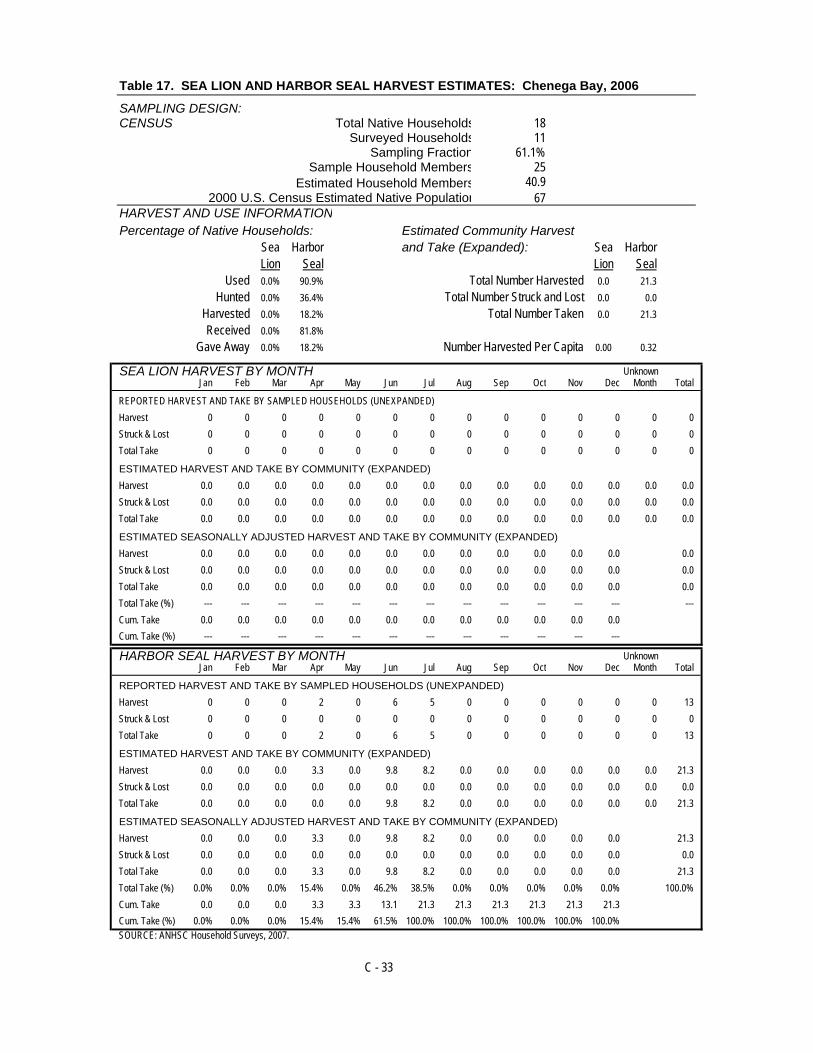
Table 17. SEA LION AND HARBOR SEAL HARVEST ESTIMATES: Chenega Bay, 2006
SAMPLING DESIGN: CENSUS Total Native Households 18
Surveyed Households 11Sampling Fraction 61.1%
Sample Household Members 25Estimated Household Members 40.9
2000 U.S. Census Estimated Native Population 67HARVEST AND USE INFORMATION
Percentage of Native Households: Estimated Community Harvest Sea Harbor and Take (Expanded): Sea Harbor
Lion Seal Lion SealUsed 0.0% 90.9% Total Number Harvested 0.0 21.3
Hunted 0.0% 36.4% Total Number Struck and Lost 0.0 0.0Harvested 0.0% 18.2% Total Number Taken 0.0 21.3Received 0.0% 81.8%
Gave Away 0.0% 18.2% Number Harvested Per Capita 0.00 0.32
SEA LION HARVEST BY MONTH UnknownJan Feb Mar Apr May Jun Jul Aug Sep Oct Nov Dec Month Total
REPORTED HARVEST AND TAKE BY SAMPLED HOUSEHOLDS (UNEXPANDED)Harvest 0 0 0 0 0 0 0 0 0 0 0 0 0 0Struck & Lost 0 0 0 0 0 0 0 0 0 0 0 0 0 0Total Take 0 0 0 0 0 0 0 0 0 0 0 0 0 0
ESTIMATED HARVEST AND TAKE BY COMMUNITY (EXPANDED)Harvest 0.0 0.0 0.0 0.0 0.0 0.0 0.0 0.0 0.0 0.0 0.0 0.0 0.0 0.0Struck & Lost 0.0 0.0 0.0 0.0 0.0 0.0 0.0 0.0 0.0 0.0 0.0 0.0 0.0 0.0Total Take 0.0 0.0 0.0 0.0 0.0 0.0 0.0 0.0 0.0 0.0 0.0 0.0 0.0 0.0
ESTIMATED SEASONALLY ADJUSTED HARVEST AND TAKE BY COMMUNITY (EXPANDED)Harvest 0.0 0.0 0.0 0.0 0.0 0.0 0.0 0.0 0.0 0.0 0.0 0.0 0.0Struck & Lost 0.0 0.0 0.0 0.0 0.0 0.0 0.0 0.0 0.0 0.0 0.0 0.0 0.0Total Take 0.0 0.0 0.0 0.0 0.0 0.0 0.0 0.0 0.0 0.0 0.0 0.0 0.0Total Take (%) --- --- --- --- --- --- --- --- --- --- --- --- ---Cum. Take 0.0 0.0 0.0 0.0 0.0 0.0 0.0 0.0 0.0 0.0 0.0 0.0Cum. Take (%) --- --- --- --- --- --- --- --- --- --- --- ---
HARBOR SEAL HARVEST BY MONTH UnknownJan Feb Mar Apr May Jun Jul Aug Sep Oct Nov Dec Month Total
REPORTED HARVEST AND TAKE BY SAMPLED HOUSEHOLDS (UNEXPANDED)Harvest 0 0 0 2 0 6 5 0 0 0 0 0 0 13Struck & Lost 0 0 0 0 0 0 0 0 0 0 0 0 0 0Total Take 0 0 0 2 0 6 5 0 0 0 0 0 0 13
ESTIMATED HARVEST AND TAKE BY COMMUNITY (EXPANDED)Harvest 0.0 0.0 0.0 3.3 0.0 9.8 8.2 0.0 0.0 0.0 0.0 0.0 0.0 21.3Struck & Lost 0.0 0.0 0.0 0.0 0.0 0.0 0.0 0.0 0.0 0.0 0.0 0.0 0.0 0.0Total Take 0.0 0.0 0.0 0.0 0.0 9.8 8.2 0.0 0.0 0.0 0.0 0.0 0.0 21.3
ESTIMATED SEASONALLY ADJUSTED HARVEST AND TAKE BY COMMUNITY (EXPANDED)Harvest 0.0 0.0 0.0 3.3 0.0 9.8 8.2 0.0 0.0 0.0 0.0 0.0 21.3Struck & Lost 0.0 0.0 0.0 0.0 0.0 0.0 0.0 0.0 0.0 0.0 0.0 0.0 0.0Total Take 0.0 0.0 0.0 3.3 0.0 9.8 8.2 0.0 0.0 0.0 0.0 0.0 21.3Total Take (%) 0.0% 0.0% 0.0% 15.4% 0.0% 46.2% 38.5% 0.0% 0.0% 0.0% 0.0% 0.0% 100.0%Cum. Take 0.0 0.0 0.0 3.3 3.3 13.1 21.3 21.3 21.3 21.3 21.3 21.3Cum. Take (%) 0.0% 0.0% 0.0% 15.4% 15.4% 61.5% 100.0% 100.0% 100.0% 100.0% 100.0% 100.0% SOURCE: ANHSC Household Surveys, 2007.
C - 33
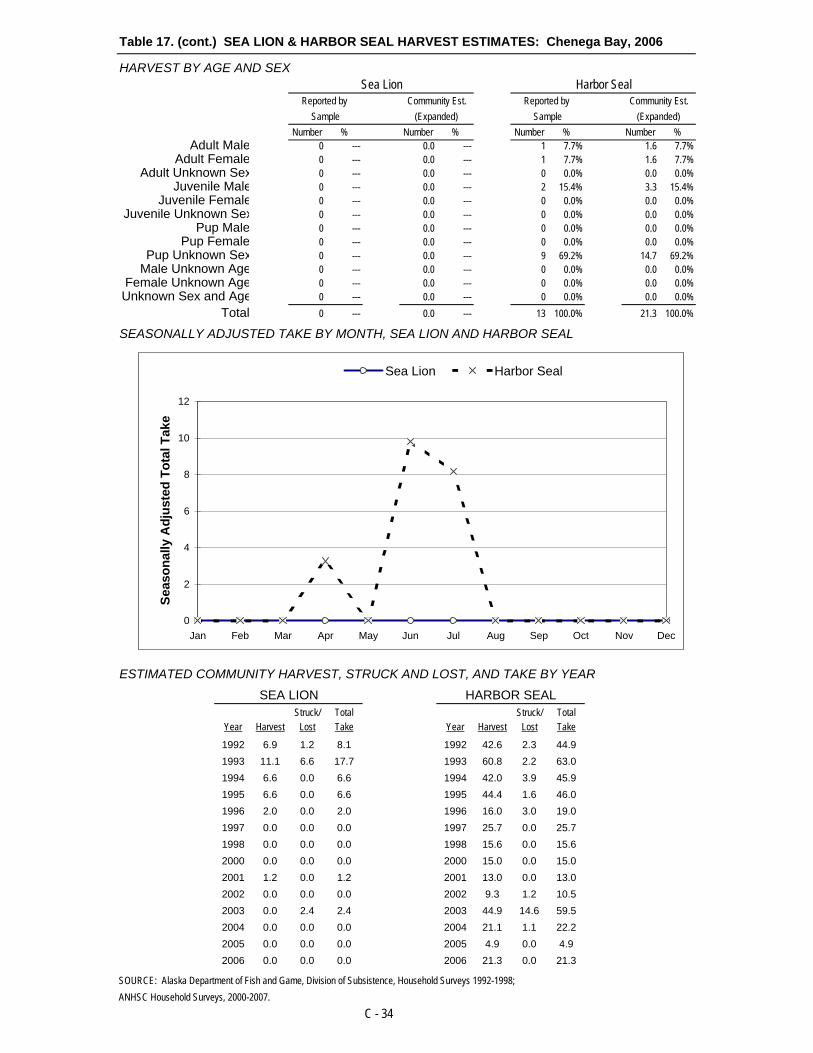
Table 17. (cont.) SEA LION & HARBOR SEAL HARVEST ESTIMATES: Chenega Bay, 2006
HARVEST BY AGE AND SEXSea Lion Harbor Seal
Reported by Community Est. Reported by Community Est.Sample (Expanded) Sample (Expanded)
Number % Number % Number % Number %Adult Male 0 --- 0.0 --- 1 7.7% 1.6 7.7%
Adult Female 0 --- 0.0 --- 1 7.7% 1.6 7.7%Adult Unknown Sex 0 --- 0.0 --- 0 0.0% 0.0 0.0%
Juvenile Male 0 --- 0.0 --- 2 15.4% 3.3 15.4%Juvenile Female 0 --- 0.0 --- 0 0.0% 0.0 0.0%
Juvenile Unknown Sex 0 --- 0.0 --- 0 0.0% 0.0 0.0%Pup Male 0 --- 0.0 --- 0 0.0% 0.0 0.0%
Pup Female 0 --- 0.0 --- 0 0.0% 0.0 0.0%Pup Unknown Sex 0 --- 0.0 --- 9 69.2% 14.7 69.2%
Male Unknown Age 0 --- 0.0 --- 0 0.0% 0.0 0.0%Female Unknown Age 0 --- 0.0 --- 0 0.0% 0.0 0.0%Unknown Sex and Age 0 --- 0.0 --- 0 0.0% 0.0 0.0%
Total 0 --- 0.0 --- 13 100.0% 21.3 100.0%
SEASONALLY ADJUSTED TAKE BY MONTH, SEA LION AND HARBOR SEAL
ESTIMATED COMMUNITY HARVEST, STRUCK AND LOST, AND TAKE BY YEARSEA LION HARBOR SEAL
Struck/ Total Struck/ TotalYear Harvest Lost Take Year Harvest Lost Take
1992 6.9 1.2 8.1 1992 42.6 2.3 44.91993 11.1 6.6 17.7 1993 60.8 2.2 63.01994 6.6 0.0 6.6 1994 42.0 3.9 45.91995 6.6 0.0 6.6 1995 44.4 1.6 46.01996 2.0 0.0 2.0 1996 16.0 3.0 19.01997 0.0 0.0 0.0 1997 25.7 0.0 25.71998 0.0 0.0 0.0 1998 15.6 0.0 15.62000 0.0 0.0 0.0 2000 15.0 0.0 15.02001 1.2 0.0 1.2 2001 13.0 0.0 13.02002 0.0 0.0 0.0 2002 9.3 1.2 10.52003 0.0 2.4 2.4 2003 44.9 14.6 59.52004 0.0 0.0 0.0 2004 21.1 1.1 22.22005 0.0 0.0 0.0 2005 4.9 0.0 4.92006 0.0 0.0 0.0 2006 21.3 0.0 21.3
SOURCE: Alaska Department of Fish and Game, Division of Subsistence, Household Surveys 1992-1998;ANHSC Household Surveys, 2000-2007.
C - 34
0
2
4
6
8
10
12
Jan Feb Mar Apr May Jun Jul Aug Sep Oct Nov Dec
Seas
onal
ly A
djus
ted
Tota
l Tak
e
Sea Lion Harbor Seal

Table 18. SEA LION AND HARBOR SEAL HARVEST ESTIMATES: Cordova, 2006
SAMPLING DESIGN: CHAIN REFERRAL Total Referred Households 9
Surveyed Households 7Sampling Fraction 77.8%
Sample Household Members 19Estimated Household Members 24.4
2000 U.S. Census Estimated Native Population 368HARVEST AND USE INFORMATION
Percentage of Native Households: Estimated Community Harvest Sea Harbor and Take (Expanded): Sea Harbor
Lion Seal Lion SealUsed 0.0% 85.7% Total Number Harvested 0.0 30.9
Hunted 0.0% 85.7% Total Number Struck and Lost 0.0 2.6Harvested 0.0% 85.7% Total Number Taken 0.0 33.4Received 0.0% 42.9%
Gave Away 0.0% 85.7% Number Harvested Per Capita 0.00 0.08
SEA LION HARVEST BY MONTH UnknownJan Feb Mar Apr May Jun Jul Aug Sep Oct Nov Dec Month Total
REPORTED HARVEST AND TAKE BY SAMPLED HOUSEHOLDS (UNEXPANDED)Harvest 0 0 0 0 0 0 0 0 0 0 0 0 0 0Struck & Lost 0 0 0 0 0 0 0 0 0 0 0 0 0 0Total Take 0 0 0 0 0 0 0 0 0 0 0 0 0 0
ESTIMATED HARVEST AND TAKE BY COMMUNITY (EXPANDED)Harvest 0.0 0.0 0.0 0.0 0.0 0.0 0.0 0.0 0.0 0.0 0.0 0.0 0.0 0.0Struck & Lost 0.0 0.0 0.0 0.0 0.0 0.0 0.0 0.0 0.0 0.0 0.0 0.0 0.0 0.0Total Take 0.0 0.0 0.0 0.0 0.0 0.0 0.0 0.0 0.0 0.0 0.0 0.0 0.0 0.0
ESTIMATED SEASONALLY ADJUSTED HARVEST AND TAKE BY COMMUNITY (EXPANDED)Harvest 0.0 0.0 0.0 0.0 0.0 0.0 0.0 0.0 0.0 0.0 0.0 0.0 0.0Struck & Lost 0.0 0.0 0.0 0.0 0.0 0.0 0.0 0.0 0.0 0.0 0.0 0.0 0.0Total Take 0.0 0.0 0.0 0.0 0.0 0.0 0.0 0.0 0.0 0.0 0.0 0.0 0.0Total Take (%) --- --- --- --- --- --- --- --- --- --- --- --- ---Cum. Take 0.0 0.0 0.0 0.0 0.0 0.0 0.0 0.0 0.0 0.0 0.0 0.0Cum. Take (%) --- --- --- --- --- --- --- --- --- --- --- ---
HARBOR SEAL HARVEST BY MONTH UnknownJan Feb Mar Apr May Jun Jul Aug Sep Oct Nov Dec Month Total
REPORTED HARVEST AND TAKE BY SAMPLED HOUSEHOLDS (UNEXPANDED)Harvest 5 6 5 0 0 4 3 1 0 0 0 0 0 24Struck & Lost 0 0 0 0 0 0 0 0 2 0 0 0 0 2Total Take 5 6 5 0 0 4 3 1 2 0 0 0 0 26
ESTIMATED HARVEST AND TAKE BY COMMUNITY (EXPANDED)Harvest 6.4 7.7 6.4 0.0 0.0 5.1 3.9 1.3 0.0 0.0 0.0 0.0 0.0 30.9Struck & Lost 0.0 0.0 0.0 0.0 0.0 0.0 0.0 0.0 2.6 0.0 0.0 0.0 0.0 2.6Total Take 6.4 7.7 6.4 0.0 0.0 5.1 3.9 1.3 2.6 0.0 0.0 0.0 0.0 33.4
ESTIMATED SEASONALLY ADJUSTED HARVEST AND TAKE BY COMMUNITY (EXPANDED)Harvest 6.4 7.7 6.4 0.0 0.0 5.1 3.9 1.3 0.0 0.0 0.0 0.0 30.9Struck & Lost 0.0 0.0 0.0 0.0 0.0 0.0 0.0 0.0 2.6 0.0 0.0 0.0 2.6Total Take 6.4 7.7 6.4 0.0 0.0 5.1 3.9 1.3 2.6 0.0 0.0 0.0 33.4Total Take (%) 19.2% 23.1% 19.2% 0.0% 0.0% 15.4% 11.5% 3.8% 7.7% 0.0% 0.0% 0.0% 100.0%Cum. Take 6.4 14.1 20.6 20.6 20.6 25.7 29.6 30.9 33.4 33.4 33.4 33.4Cum. Take (%) 19.2% 42.3% 61.5% 61.5% 61.5% 76.9% 88.5% 92.3% 100.0% 100.0% 100.0% 100.0% SOURCE: ANHSC Household Surveys, 2007.
C - 35

Table 18. (cont.) SEA LION & HARBOR SEAL HARVEST ESTIMATES: Cordova, 2006
HARVEST BY AGE AND SEXSea Lion Harbor Seal
Reported by Community Est. Reported by Community Est.Sample (Expanded) Sample (Expanded)
Number % Number % Number % Number %Adult Male 0 --- 0.0 --- 7 29.2% 9.0 29.2%
Adult Female 0 --- 0.0 --- 5 20.8% 6.4 20.8%Adult Unknown Sex 0 --- 0.0 --- 9 37.5% 11.6 37.5%
Juvenile Male 0 --- 0.0 --- 0 0.0% 0.0 0.0%Juvenile Female 0 --- 0.0 --- 1 4.2% 1.3 4.2%
Juvenile Unknown Sex 0 --- 0.0 --- 0 0.0% 0.0 0.0%Pup Male 0 --- 0.0 --- 0 0.0% 0.0 0.0%
Pup Female 0 --- 0.0 --- 0 0.0% 0.0 0.0%Pup Unknown Sex 0 --- 0.0 --- 2 8.3% 2.6 8.3%
Male Unknown Age 0 --- 0.0 --- 0 0.0% 0.0 0.0%Female Unknown Age 0 --- 0.0 --- 0 0.0% 0.0 0.0%Unknown Sex and Age 0 --- 0.0 --- 0 0.0% 0.0 0.0%
Total 0 --- 0.0 --- 24 100.0% 30.9 100.0%
SEASONALLY ADJUSTED TAKE BY MONTH, SEA LION AND HARBOR SEAL
ESTIMATED COMMUNITY HARVEST, STRUCK AND LOST, AND TAKE BY YEAR
SEA LION HARBOR SEALStruck/ Total Struck/ Total
Year Harvest Lost Take Year Harvest Lost Take1992 0.0 0.0 0.0 1992 103.8 8.8 112.51993 1.5 0.0 1.5 1993 147.4 5.5 152.91994 0.0 0.0 0.0 1994 135.8 9.1 144.91995 0.0 1.0 1.0 1995 83.4 2.0 85.41996 0.0 0.0 0.0 1996 122.2 8.6 130.81997 0.0 0.0 0.0 1997 120.8 0.0 120.81998 0.0 0.0 0.0 1998 79.1 9.3 88.32000 0.0 0.0 0.0 2000 87.8 14.0 101.82001 3.5 0.0 3.5 2001 102.7 5.8 108.52002 3.5 0.0 3.5 2002 102.7 5.8 108.52003 2.7 0.0 2.7 2003 77.7 2.7 80.52004 2.7 0.0 2.7 2004 77.7 2.7 80.52005 0.0 0.0 0.0 2005 57.0 9.0 66.02006 0.0 0.0 0.0 2006 30.9 2.6 33.4
SOURCE: Alaska Department of Fish and Game, Division of Subsistence, Household Surveys 1992-1998;ANHSC Household Surveys, 2000-2007.
C - 36
0
1
2
3
4
5
6
7
8
9
Jan Feb Mar Apr May Jun Jul Aug Sep Oct Nov Dec
Seas
onal
ly A
djus
ted
Tota
l Tak
e
Sea Lion Harbor Seal

Table 19. SEA LION AND HARBOR SEAL HARVEST ESTIMATES: Nanwalek, 2006
SAMPLING DESIGN: CENSUS Total Native Households 40
Surveyed Households 39Sampling Fraction
Sample Household Members 154Estimated Household Members 157.9
2000 U.S. Census Estimated Native Population 165HARVEST AND USE INFORMATION
Percentage of Native Households: Estimated Community Harvest Sea Harbor and Take (Expanded): Sea Harbor
Lion Seal Lion SealUsed 23.1% 100.0% Total Number Harvested 1.0 23.6
Hunted 2.6% 30.8% Total Number Struck and Lost 0.0 5.1Harvested 2.6% 15.4% Total Number Taken 1.0 28.7Received 20.5% 97.4%
Gave Away 12.8% 35.9% Number Harvested Per Capita 0.01 0.14
SEA LION HARVEST BY MONTH UnknownJan Feb Mar Apr May Jun Jul Aug Sep Oct Nov Dec Month Total
REPORTED HARVEST AND TAKE BY SAMPLED HOUSEHOLDS (UNEXPANDED)Harvest 0 0 0 0 0 0 0 0 0 0 1 0 0 1Struck & Lost 0 0 0 0 0 0 0 0 0 0 0 0 0 0Total Take 0 0 0 0 0 0 0 0 0 0 1 0 0 1
ESTIMATED HARVEST AND TAKE BY COMMUNITY (EXPANDED)Harvest 0.0 0.0 0.0 0.0 0.0 0.0 0.0 0.0 0.0 0.0 1.0 0.0 0.0 1.0Struck & Lost 0.0 0.0 0.0 0.0 0.0 0.0 0.0 0.0 0.0 0.0 0.0 0.0 0.0 0.0Total Take 0.0 0.0 0.0 0.0 0.0 0.0 0.0 0.0 0.0 0.0 1.0 0.0 0.0 1.0
ESTIMATED SEASONALLY ADJUSTED HARVEST AND TAKE BY COMMUNITY (EXPANDED)Harvest 0.0 0.0 0.0 0.0 0.0 0.0 0.0 0.0 0.0 0.0 1.0 0.0 1.0Struck & Lost 0.0 0.0 0.0 0.0 0.0 0.0 0.0 0.0 0.0 0.0 0.0 0.0 0.0Total Take 0.0 0.0 0.0 0.0 0.0 0.0 0.0 0.0 0.0 0.0 1.0 0.0 1.0Total Take (%) 0.0% 0.0% 0.0% 0.0% 0.0% 0.0% 0.0% 0.0% 0.0% 0.0% 100.0% 0.0% 100.0%Cum. Take 0.0 0.0 0.0 0.0 0.0 0.0 0.0 0.0 0.0 0.0 1.0 1.0Cum. Take (%) 0.0% 0.0% 0.0% 0.0% 0.0% 0.0% 0.0% 0.0% 0.0% 0.0% 100.0% 100.0%
HARBOR SEAL HARVEST BY MONTH UnknownJan Feb Mar Apr May Jun Jul Aug Sep Oct Nov Dec Month Total
REPORTED HARVEST AND TAKE BY SAMPLED HOUSEHOLDS (UNEXPANDED)Harvest 0 0 0 0 0 2 6 3 12 0 0 0 0 23Struck & Lost 0 0 0 0 0 3 2 0 0 0 0 0 0 5Total Take 0 0 0 0 0 5 8 3 12 0 0 0 0 28
ESTIMATED HARVEST AND TAKE BY COMMUNITY (EXPANDED)Harvest 0.0 0.0 0.0 0.0 0.0 2.1 6.2 3.1 12.3 0.0 0.0 0.0 0.0 23.6Struck & Lost 0.0 0.0 0.0 0.0 0.0 3.1 2.1 0.0 0.0 0.0 0.0 0.0 0.0 5.1Total Take 0.0 0.0 0.0 0.0 0.0 5.1 8.2 3.1 12.3 0.0 0.0 0.0 0.0 28.7
ESTIMATED SEASONALLY ADJUSTED HARVEST AND TAKE BY COMMUNITY (EXPANDED)Harvest 0.0 0.0 0.0 0.0 0.0 2.1 6.2 3.1 12.3 0.0 0.0 0.0 23.6Struck & Lost 0.0 0.0 0.0 0.0 0.0 3.1 2.1 0.0 0.0 0.0 0.0 0.0 5.1Total Take 0.0 0.0 0.0 0.0 0.0 5.1 8.2 3.1 12.3 0.0 0.0 0.0 28.7Total Take (%) 0.0% 0.0% 0.0% 0.0% 0.0% 17.9% 28.6% 10.7% 42.9% 0.0% 0.0% 0.0% 100.0%Cum. Take 0.0 0.0 0.0 0.0 0.0 5.1 13.3 16.4 28.7 28.7 28.7 28.7Cum. Take (%) 0.0% 0.0% 0.0% 0.0% 0.0% 17.9% 46.4% 57.1% 100.0% 100.0% 100.0% 100.0% SOURCE: ANHSC Household Surveys, 2007.
C - 37
97.5%

Table 19. (cont.) SEA LION & HARBOR SEAL HARVEST ESTIMATES: Nanwalek, 2006
HARVEST BY AGE AND SEXSea Lion Harbor Seal
Reported by Community Est. Reported by Community Est.Sample (Expanded) Sample (Expanded)
Number % Number % Number % Number %Adult Male 0 0.0% 0.0 0.0% 2 8.7% 2.1 8.7%
Adult Female 1 100.0% 1.0 100.0% 0 0.0% 0.0 0.0%Adult Unknown Sex 0 0.0% 0.0 0.0% 1 4.3% 1.0 4.3%
Juvenile Male 0 0.0% 0.0 0.0% 0 0.0% 0.0 0.0%Juvenile Female 0 0.0% 0.0 0.0% 0 0.0% 0.0 0.0%
Juvenile Unknown Sex 0 0.0% 0.0 0.0% 20 87.0% 20.5 87.0%Pup Male 0 0.0% 0.0 0.0% 0 0.0% 0.0 0.0%
Pup Female 0 0.0% 0.0 0.0% 0 0.0% 0.0 0.0%Pup Unknown Sex 0 0.0% 0.0 0.0% 0 0.0% 0.0 0.0%
Male Unknown Age 0 0.0% 0.0 0.0% 0 0.0% 0.0 0.0%Female Unknown Age 0 0.0% 0.0 0.0% 0 0.0% 0.0 0.0%Unknown Sex and Age 0 0.0% 0.0 0.0% 0 0.0% 0.0 0.0%
Total 1 100.0% 1.0 100.0% 23 100.0% 23.6 100.0%
SEASONALLY ADJUSTED TAKE BY MONTH, SEA LION AND HARBOR SEAL
ESTIMATED COMMUNITY HARVEST, STRUCK AND LOST, AND TAKE BY YEAR
SEA LION HARBOR SEALStruck/ Total Struck/ Total
Year Harvest Lost Take Year Harvest Lost Take
1992 6.3 0.0 6.3 1992 27.9 0.0 27.91993 8.5 1.1 9.5 1993 33.9 3.2 37.11994 1.2 2.3 3.5 1994 29.0 4.6 33.71995 9.2 0.0 9.2 1995 23.6 0.0 23.61996 4.3 1.1 5.3 1996 22.4 0.0 22.41997 0.0 0.0 0.0 1997 20.2 0.0 20.21998 2.1 0.0 2.1 1998 30.9 1.0 31.92000 6.5 0.0 6.5 2000 52.9 3.9 56.82001 3.7 0.0 3.7 2001 42.3 1.2 43.52002 2.0 0.0 2.0 2002 40.0 12.0 52.02003 3.0 2.0 5.0 2003 30.0 3.0 33.02004 2.1 0.0 2.1 2004 30.2 12.5 42.72005 1.1 0.0 1.1 2005 20.3 6.4 26.72006 1.0 0.0 1.0 2006 23.6 5.1 28.7
SOURCE: Alaska Department of Fish and Game, Division of Subsistence, Household Surveys 1992-1998;ANHSC Household Surveys, 2000-2007.
C - 38
0
2
4
6
8
10
12
14
Jan Feb Mar Apr May Jun Jul Aug Sep Oct Nov Dec
Seas
onal
ly A
djus
ted
Tota
l Tak
e
Sea Lion Harbor Seal

Table 20. SEA LION AND HARBOR SEAL HARVEST ESTIMATES: Port Graham, 2006
SAMPLING DESIGN: CENSUS Total Native Households 53
Surveyed Households 27Sampling Fraction 50.9%
Sample Household Members 62Estimated Household Members 121.7
2000 U.S. Census Estimated Native Population 151HARVEST AND USE INFORMATION
Percentage of Native Households: Estimated Community Harvest Sea Harbor and Take (Expanded): Sea Harbor
Lion Seal Lion SealUsed 0.0% 100.0% Total Number Harvested 0.0 51.0
Hunted 0.0% 29.6% Total Number Struck and Lost 0.0 0.0Harvested 0.0% 29.6% Total Number Taken 0.0 51.0Received 0.0% 92.6%
Gave Away 0.0% 81.5% Number Harvested Per Capita 0.00 0.34
SEA LION HARVEST BY MONTH UnknownJan Feb Mar Apr May Jun Jul Aug Sep Oct Nov Dec Month Total
REPORTED HARVEST AND TAKE BY SAMPLED HOUSEHOLDS (UNEXPANDED)Harvest 0 0 0 0 0 0 0 0 0 0 0 0 0 0Struck & Lost 0 0 0 0 0 0 0 0 0 0 0 0 0 0Total Take 0 0 0 0 0 0 0 0 0 0 0 0 0 0
ESTIMATED HARVEST AND TAKE BY COMMUNITY (EXPANDED)Harvest 0.0 0.0 0.0 0.0 0.0 0.0 0.0 0.0 0.0 0.0 0.0 0.0 0.0 0.0Struck & Lost 0.0 0.0 0.0 0.0 0.0 0.0 0.0 0.0 0.0 0.0 0.0 0.0 0.0 0.0Total Take 0.0 0.0 0.0 0.0 0.0 0.0 0.0 0.0 0.0 0.0 0.0 0.0 0.0 0.0
ESTIMATED SEASONALLY ADJUSTED HARVEST AND TAKE BY COMMUNITY (EXPANDED)Harvest 0.0 0.0 0.0 0.0 0.0 0.0 0.0 0.0 0.0 0.0 0.0 0.0 0.0Struck & Lost 0.0 0.0 0.0 0.0 0.0 0.0 0.0 0.0 0.0 0.0 0.0 0.0 0.0Total Take 0.0 0.0 0.0 0.0 0.0 0.0 0.0 0.0 0.0 0.0 0.0 0.0 0.0Total Take (%) --- --- --- --- --- --- --- --- --- --- --- --- ---Cum. Take 0.0 0.0 0.0 0.0 0.0 0.0 0.0 0.0 0.0 0.0 0.0 0.0Cum. Take (%) --- --- --- --- --- --- --- --- --- --- --- ---
HARBOR SEAL HARVEST BY MONTH UnknownJan Feb Mar Apr May Jun Jul Aug Sep Oct Nov Dec Month Total
REPORTED HARVEST AND TAKE BY SAMPLED HOUSEHOLDS (UNEXPANDED)Harvest 2 0 0 1 1 0 6 8 6 2 0 0 0 26Struck & Lost 0 0 0 0 0 0 0 0 0 0 0 0 0 0Total Take 2 0 0 1 1 0 6 8 6 2 0 0 0 26
ESTIMATED HARVEST AND TAKE BY COMMUNITY (EXPANDED)Harvest 3.9 0.0 0.0 2.0 2.0 0.0 11.8 15.7 11.8 3.9 0.0 0.0 0.0 51.0Struck & Lost 0.0 0.0 0.0 0.0 0.0 0.0 0.0 0.0 0.0 0.0 0.0 0.0 0.0 0.0Total Take 3.9 0.0 0.0 2.0 2.0 0.0 11.8 15.7 11.8 3.9 0.0 0.0 0.0 51.0
ESTIMATED SEASONALLY ADJUSTED HARVEST AND TAKE BY COMMUNITY (EXPANDED)Harvest 3.9 0.0 0.0 2.0 2.0 0.0 11.8 15.7 11.8 3.9 0.0 0.0 51.0Struck & Lost 0.0 0.0 0.0 0.0 0.0 0.0 0.0 0.0 0.0 0.0 0.0 0.0 0.0Total Take 3.9 0.0 0.0 2.0 2.0 0.0 11.8 15.7 11.8 3.9 0.0 0.0 51.0Total Take (%) 7.7% 0.0% 0.0% 3.8% 3.8% 0.0% 23.1% 30.8% 23.1% 7.7% 0.0% 0.0% 100.0%Cum. Take 3.9 3.9 3.9 5.9 7.9 7.9 19.6 35.3 47.1 51.0 51.0 51.0Cum. Take (%) 7.7% 7.7% 7.7% 11.5% 15.4% 15.4% 38.5% 69.2% 92.3% 100.0% 100.0% 100.0% SOURCE: ANHSC Household Surveys, 2007.
C - 39

Table 20. (cont.) SEA LION & HARBOR SEAL HARVEST ESTIMATES: Port Graham, 2006
HARVEST BY AGE AND SEXSea Lion Harbor Seal
Reported by Community Est. Reported by Community Est.Sample (Expanded) Sample (Expanded)
Number % Number % Number % Number %Adult Male 0 --- 0.0 --- 2 7.7% 3.9 7.7%
Adult Female 0 --- 0.0 --- 0 0.0% 0.0 0.0%Adult Unknown Sex 0 --- 0.0 --- 2 7.7% 3.9 7.7%
Juvenile Male 0 --- 0.0 --- 1 3.8% 2.0 3.8%Juvenile Female 0 --- 0.0 --- 0 0.0% 0.0 0.0%
Juvenile Unknown Sex 0 --- 0.0 --- 10 38.5% 19.6 38.5%Pup Male 0 --- 0.0 --- 0 0.0% 0.0 0.0%
Pup Female 0 --- 0.0 --- 0 0.0% 0.0 0.0%Pup Unknown Sex 0 --- 0.0 --- 0 0.0% 0.0 0.0%
Male Unknown Age 0 --- 0.0 --- 0 0.0% 0.0 0.0%Female Unknown Age 0 --- 0.0 --- 0 0.0% 0.0 0.0%Unknown Sex and Age 0 --- 0.0 --- 11 42.3% 21.6 42.3%
Total 0 --- 0.0 --- 26 100.0% 51.0 100.0%
SEASONALLY ADJUSTED TAKE BY MONTH, SEA LION AND HARBOR SEAL
ESTIMATED COMMUNITY HARVEST, STRUCK AND LOST, AND TAKE BY YEARSEA LION HARBOR SEAL
Struck/ Total Struck/ TotalYear Harvest Lost Take Year Harvest Lost Take
1992 3.5 1.2 4.7 1992 36.2 4.7 40.81993 1.1 0.0 1.1 1993 30.6 3.2 33.71994 0.0 0.0 0.0 1994 15.5 5.2 20.71995 10.0 2.0 12.0 1995 23.0 0.0 23.01996 1.1 0.0 1.1 1996 15.5 2.2 17.71997 0.0 0.0 0.0 1997 15.8 3.2 19.01998 1.2 0.0 1.2 1998 52.3 3.6 55.92000 1.7 3.4 5.0 2000 40.2 1.7 41.92001 0.0 0.0 0.0 2001 39.4 8.3 47.62002 0.0 0.0 0.0 2002 39.4 8.3 47.62003 1.0 0.0 1.0 2003 45.0 0.0 45.02004 6.9 5.6 12.5 2004 44.4 2.8 47.22005 0.0 0.0 0.0 2005 63.5 8.5 71.92006 0.0 0.0 0.0 2006 51.0 0.0 51.0
SOURCE: Alaska Department of Fish and Game, Division of Subsistence, Household Surveys 1992-1998;ANHSC Household Surveys, 2000-2007.
C - 40
0
2
4
6
8
10
12
14
16
18
Jan Feb Mar Apr May Jun Jul Aug Sep Oct Nov Dec
Seas
onal
ly A
djus
ted
Tota
l Tak
e
Sea Lion Harbor Seal

Table 21. SEA LION AND HARBOR SEAL HARVEST ESTIMATES: Seldovia, 2006
SAMPLING DESIGN: CHAIN REFERRAL Total Referred Households 4
Surveyed Households 3Sampling Fraction
Sample Household Members 5Estimated Household Members 6.7
2000 U.S. Census Estimated Native Population 66HARVEST AND USE INFORMATION
Percentage of Native Households: Estimated Community Harvest Sea Harbor and Take (Expanded): Sea Harbor
Lion Seal Lion SealUsed 0.0% 100.0% Total Number Harvested 0.0 2.7
Hunted 0.0% 33.3% Total Number Struck and Lost 0.0 0.0Harvested 0.0% 33.3% Total Number Taken 0.0 2.7Received 0.0% 100.0%
Gave Away 0.0% 33.3% Number Harvested Per Capita 0.00 0.04
SEA LION HARVEST BY MONTH UnknownJan Feb Mar Apr May Jun Jul Aug Sep Oct Nov Dec Month Total
REPORTED HARVEST AND TAKE BY SAMPLED HOUSEHOLDS (UNEXPANDED)Harvest 0 0 0 0 0 0 0 0 0 0 0 0 0 0Struck & Lost 0 0 0 0 0 0 0 0 0 0 0 0 0 0Total Take 0 0 0 0 0 0 0 0 0 0 0 0 0 0
ESTIMATED HARVEST AND TAKE BY COMMUNITY (EXPANDED)Harvest 0.0 0.0 0.0 0.0 0.0 0.0 0.0 0.0 0.0 0.0 0.0 0.0 0.0 0.0Struck & Lost 0.0 0.0 0.0 0.0 0.0 0.0 0.0 0.0 0.0 0.0 0.0 0.0 0.0 0.0Total Take 0.0 0.0 0.0 0.0 0.0 0.0 0.0 0.0 0.0 0.0 0.0 0.0 0.0 0.0
ESTIMATED SEASONALLY ADJUSTED HARVEST AND TAKE BY COMMUNITY (EXPANDED)Harvest 0.0 0.0 0.0 0.0 0.0 0.0 0.0 0.0 0.0 0.0 0.0 0.0 0.0Struck & Lost 0.0 0.0 0.0 0.0 0.0 0.0 0.0 0.0 0.0 0.0 0.0 0.0 0.0Total Take 0.0 0.0 0.0 0.0 0.0 0.0 0.0 0.0 0.0 0.0 0.0 0.0 0.0Total Take (%) --- --- --- --- --- --- --- --- --- --- --- --- ---Cum. Take 0.0 0.0 0.0 0.0 0.0 0.0 0.0 0.0 0.0 0.0 0.0 0.0Cum. Take (%) --- --- --- --- --- --- --- --- --- --- --- ---
HARBOR SEAL HARVEST BY MONTH UnknownJan Feb Mar Apr May Jun Jul Aug Sep Oct Nov Dec Month Total
REPORTED HARVEST AND TAKE BY SAMPLED HOUSEHOLDS (UNEXPANDED)Harvest 0 0 0 0 0 0 0 0 0 0 0 2 0 2Struck & Lost 0 0 0 0 0 0 0 0 0 0 0 0 0 0Total Take 0 0 0 0 0 0 0 0 0 0 0 2 0 2
ESTIMATED HARVEST AND TAKE BY COMMUNITY (EXPANDED)Harvest 0.0 0.0 0.0 0.0 0.0 0.0 0.0 0.0 0.0 0.0 0.0 2.7 0.0 2.7Struck & Lost 0.0 0.0 0.0 0.0 0.0 0.0 0.0 0.0 0.0 0.0 0.0 0.0 0.0 0.0Total Take 0.0 0.0 0.0 0.0 0.0 0.0 0.0 0.0 0.0 0.0 0.0 2.7 0.0 2.7
ESTIMATED SEASONALLY ADJUSTED HARVEST AND TAKE BY COMMUNITY (EXPANDED)Harvest 0.0 0.0 0.0 0.0 0.0 0.0 0.0 0.0 0.0 0.0 0.0 2.7 2.7Struck & Lost 0.0 0.0 0.0 0.0 0.0 0.0 0.0 0.0 0.0 0.0 0.0 0.0 0.0Total Take 0.0 0.0 0.0 0.0 0.0 0.0 0.0 0.0 0.0 0.0 0.0 2.7 2.7Total Take (%) 0.0% 0.0% 0.0% 0.0% 0.0% 0.0% 0.0% 0.0% 0.0% 0.0% 0.0% 100.0% 100.0%Cum. Take 0.0 0.0 0.0 0.0 0.0 0.0 0.0 0.0 0.0 0.0 0.0 2.7Cum. Take (%) 0.0% 0.0% 0.0% 0.0% 0.0% 0.0% 0.0% 0.0% 0.0% 0.0% 0.0% 100.0% SOURCE: ANHSC Household Surveys, 2007.
C - 41
75.0%

Table 21. (cont.) SEA LION & HARBOR SEAL HARVEST ESTIMATES: Seldovia, 2006
HARVEST BY AGE AND SEXSea Lion Harbor Seal
Reported by Community Est. Reported by Community Est.Sample (Expanded) Sample (Expanded)
Number % Number % Number % Number %Adult Male 0 --- 0.0 --- 2 100.0% 2.7 100.0%
Adult Female 0 --- 0.0 --- 0 0.0% 0.0 0.0%Adult Unknown Sex 0 --- 0.0 --- 0 0.0% 0.0 0.0%
Juvenile Male 0 --- 0.0 --- 0 0.0% 0.0 0.0%Juvenile Female 0 --- 0.0 --- 0 0.0% 0.0 0.0%
Juvenile Unknown Sex 0 --- 0.0 --- 0 0.0% 0.0 0.0%Pup Male 0 --- 0.0 --- 0 0.0% 0.0 0.0%
Pup Female 0 --- 0.0 --- 0 0.0% 0.0 0.0%Pup Unknown Sex 0 --- 0.0 --- 0 0.0% 0.0 0.0%
Male Unknown Age 0 --- 0.0 --- 0 0.0% 0.0 0.0%Female Unknown Age 0 --- 0.0 --- 0 0.0% 0.0 0.0%Unknown Sex and Age 0 --- 0.0 --- 0 0.0% 0.0 0.0%
Total 0 --- 0.0 --- 2 100.0% 2.7 100.0%
SEASONALLY ADJUSTED TAKE BY MONTH, SEA LION AND HARBOR SEAL
ESTIMATED COMMUNITY HARVEST, STRUCK AND LOST, AND TAKE BY YEAR
SEA LION HARBOR SEALStruck/ Total Struck/ Total
Year Harvest Lost Take Year Harvest Lost Take
1992 0.0 0.0 0.0 1992 12.4 0.0 12.41993 0.0 0.0 0.0 1993 7.9 4.9 12.81994 0.0 0.0 0.0 1994 8.0 0.0 8.01995 0.0 0.0 0.0 1995 4.0 0.0 4.01996 0.0 0.0 0.0 1996 3.0 0.0 3.01997 1.7 0.0 1.7 1997 2.8 2.8 5.51998 0.0 0.0 0.0 1998 3.0 0.0 3.02000 0.0 0.0 0.0 2000 2.0 0.0 2.02001 0.0 0.0 0.0 2001 3.0 0.0 3.02002 0.0 0.0 0.0 2002 0.0 0.0 0.02003 0.0 0.0 0.0 2003 0.0 0.0 0.02004 0.0 0.0 0.0 2004 1.0 1.0 2.02005 0.0 0.0 0.0 2005 1.0 1.0 2.02006 0.0 0.0 0.0 2006 2.7 0.0 2.7
SOURCE: Alaska Department of Fish and Game, Division of Subsistence, Household Surveys 1992-1998;ANHSC Household Surveys, 2000-2007.
C - 42
0
1
2
3
Jan Feb Mar Apr May Jun Jul Aug Sep Oct Nov Dec
Seas
onal
ly A
djus
ted
Tota
l Tak
e
Sea Lion Harbor Seal

Table 22. SEA LION AND HARBOR SEAL HARVEST ESTIMATES: Seward, 2006
SAMPLING DESIGN: CHAIN REFERRAL Total Native Households 13
Surveyed Households 6 Sampling Fraction
Sample Household Members 18Estimated Household Members 39.0
2000 U.S. Census Estimated Native Population 592HARVEST AND USE INFORMATION
Percentage of Sample Households: Estimated Community Harvest Sea Harbor and Take (Expanded): Sea Harbor
Lion Seal Lion SealUsed 0.0% 33.3% Total Number Harvested 0.0 0.0
Hunted 0.0% 0.0% Total Number Struck and Lost 0.0 0.0Harvested 0.0% 0.0% Total Number Taken 0.0 0.0Received 0.0% 33.3%
Gave Away 0.0% 16.7% Number Harvested Per Capita 0.00 0.00
SEA LION HARVEST BY MONTH UnknownJan Feb Mar Apr May Jun Jul Aug Sep Oct Nov Dec Month Total
REPORTED HARVEST AND TAKE BY SAMPLED HOUSEHOLDS (UNEXPANDED)Harvest 0 0 0 0 0 0 0 0 0 0 0 0 0 0Struck & Lost 0 0 0 0 0 0 0 0 0 0 0 0 0 0Total Take 0 0 0 0 0 0 0 0 0 0 0 0 0 0
ESTIMATED HARVEST AND TAKE BY COMMUNITY (EXPANDED)
Harvest 0.0 0.0 0.0 0.0 0.0 0.0 0.0 0.0 0.0 0.0 0.0 0.0 0.0 0.0Struck & Lost 0.0 0.0 0.0 0.0 0.0 0.0 0.0 0.0 0.0 0.0 0.0 0.0 0.0 0.0Total Take 0.0 0.0 0.0 0.0 0.0 0.0 0.0 0.0 0.0 0.0 0.0 0.0 0.0 0.0
ESTIMATED SEASONALLY ADJUSTED HARVEST AND TAKE BY COMMUNITY (EXPANDED)
Harvest 0.0 0.0 0.0 0.0 0.0 0.0 0.0 0.0 0.0 0.0 0.0 0.0 0.0Struck & Lost 0.0 0.0 0.0 0.0 0.0 0.0 0.0 0.0 0.0 0.0 0.0 0.0 0.0Total Take 0.0 0.0 0.0 0.0 0.0 0.0 0.0 0.0 0.0 0.0 0.0 0.0 0.0Total Take (%) --- --- --- --- --- --- --- --- --- --- --- --- ---Cum. Take 0.0 0.0 0.0 0.0 0.0 0.0 0.0 0.0 0.0 0.0 0.0 0.0Cum. Take (%) --- --- --- --- --- --- --- --- --- --- --- ---
HARBOR SEAL HARVEST BY MONTH UnknownJan Feb Mar Apr May Jun Jul Aug Sep Oct Nov Dec Month Total
REPORTED HARVEST AND TAKE BY SAMPLED HOUSEHOLDS (UNEXPANDED)
Harvest 0 0 0 0 0 0 0 0 0 0 0 0 0 0Struck & Lost 0 0 0 0 0 0 0 0 0 0 0 0 0 0Total Take 0 0 0 0 0 0 0 0 0 0 0 0 0 0
ESTIMATED HARVEST AND TAKE BY COMMUNITY (EXPANDED)
Harvest 0.0 0.0 0.0 0.0 0.0 0.0 0.0 0.0 0.0 0.0 0.0 0.0 0.0 0.0Struck & Lost 0.0 0.0 0.0 0.0 0.0 0.0 0.0 0.0 0.0 0.0 0.0 0.0 0.0 0.0Total Take 0.0 0.0 0.0 0.0 0.0 0.0 0.0 0.0 0.0 0.0 0.0 0.0 0.0 0.0
ESTIMATED SEASONALLY ADJUSTED HARVEST AND TAKE BY COMMUNITY (EXPANDED)
Harvest 0.0 0.0 0.0 0.0 0.0 0.0 0.0 0.0 0.0 0.0 0.0 0.0 0.0Struck & Lost 0.0 0.0 0.0 0.0 0.0 0.0 0.0 0.0 0.0 0.0 0.0 0.0 0.0Total Take 0.0 0.0 0.0 0.0 0.0 0.0 0.0 0.0 0.0 0.0 0.0 0.0 0.0Total Take (%) --- --- --- --- --- --- --- --- --- --- --- --- ---Cum. Take 0.0 0.0 0.0 0.0 0.0 0.0 0.0 0.0 0.0 0.0 0.0 0.0Cum. Take (%) --- --- --- --- --- --- --- --- --- --- --- --- SOURCE: ANHSC Household Surveys, (Numbers based on 2005 harvest estimates).
C - 43
46.2%
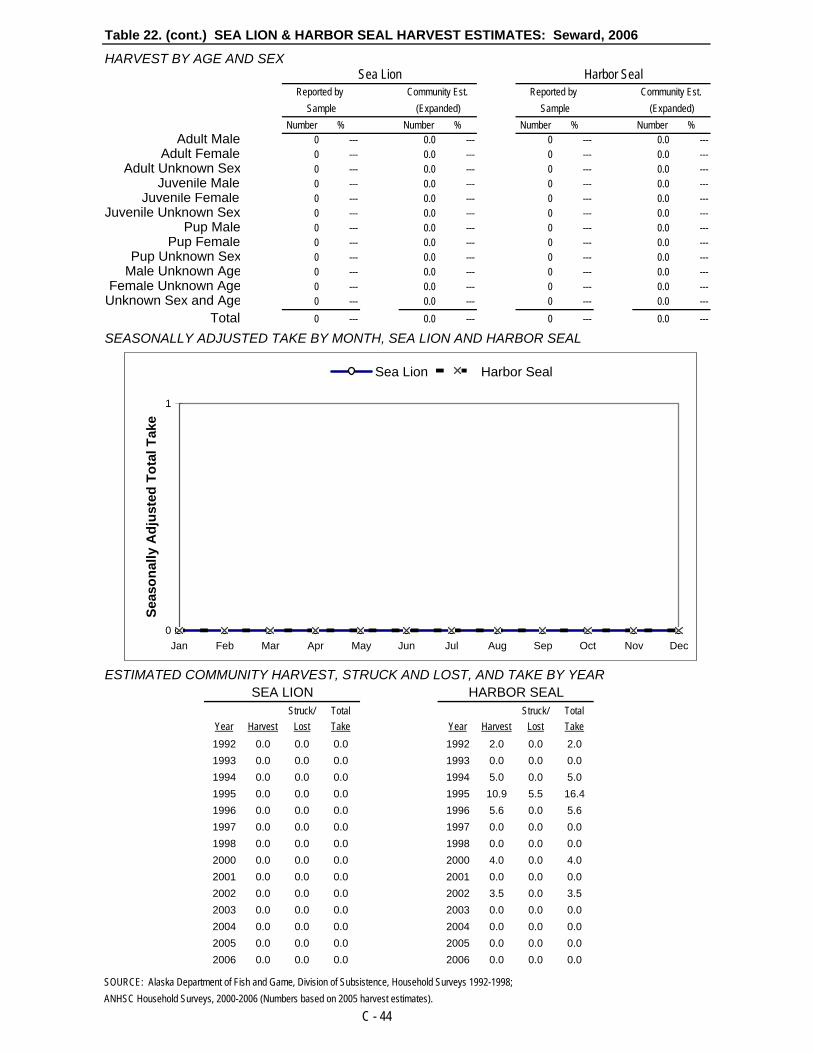
Table 22. (cont.) SEA LION & HARBOR SEAL HARVEST ESTIMATES: Seward, 2006
HARVEST BY AGE AND SEXSea Lion Harbor Seal
Reported by Community Est. Reported by Community Est.Sample (Expanded) Sample (Expanded)
Number % Number % Number % Number %Adult Male 0 --- 0.0 --- 0 --- 0.0 ---
Adult Female 0 --- 0.0 --- 0 --- 0.0 ---Adult Unknown Sex 0 --- 0.0 --- 0 --- 0.0 ---
Juvenile Male 0 --- 0.0 --- 0 --- 0.0 ---Juvenile Female 0 --- 0.0 --- 0 --- 0.0 ---
Juvenile Unknown Sex 0 --- 0.0 --- 0 --- 0.0 ---Pup Male 0 --- 0.0 --- 0 --- 0.0 ---
Pup Female 0 --- 0.0 --- 0 --- 0.0 ---Pup Unknown Sex 0 --- 0.0 --- 0 --- 0.0 ---
Male Unknown Age 0 --- 0.0 --- 0 --- 0.0 ---Female Unknown Age 0 --- 0.0 --- 0 --- 0.0 ---
Unknown Sex and Age 0 --- 0.0 --- 0 --- 0.0 ---Total 0 --- 0.0 --- 0 --- 0.0 ---
SEASONALLY ADJUSTED TAKE BY MONTH, SEA LION AND HARBOR SEAL
ESTIMATED COMMUNITY HARVEST, STRUCK AND LOST, AND TAKE BY YEARSEA LION HARBOR SEAL
Struck/ Total Struck/ TotalYear Harvest Lost Take Year Harvest Lost Take1992 0.0 0.0 0.0 1992 2.0 0.0 2.01993 0.0 0.0 0.0 1993 0.0 0.0 0.01994 0.0 0.0 0.0 1994 5.0 0.0 5.01995 0.0 0.0 0.0 1995 10.9 5.5 16.41996 0.0 0.0 0.0 1996 5.6 0.0 5.61997 0.0 0.0 0.0 1997 0.0 0.0 0.01998 0.0 0.0 0.0 1998 0.0 0.0 0.02000 0.0 0.0 0.0 2000 4.0 0.0 4.02001 0.0 0.0 0.0 2001 0.0 0.0 0.02002 0.0 0.0 0.0 2002 3.5 0.0 3.52003 0.0 0.0 0.0 2003 0.0 0.0 0.02004 0.0 0.0 0.0 2004 0.0 0.0 0.02005 0.0 0.0 0.0 2005 0.0 0.0 0.02006 0.0 0.0 0.0 2006 0.0 0.0 0.0
SOURCE: Alaska Department of Fish and Game, Division of Subsistence, Household Surveys 1992-1998;ANHSC Household Surveys, 2000-2006 (Numbers based on 2005 harvest estimates).
C - 44
0
1
Jan Feb Mar Apr May Jun Jul Aug Sep Oct Nov Dec
Seas
onal
ly A
djus
ted
Tota
l Tak
e
Sea Lion Harbor Seal

Table 23. SEA LION AND HARBOR SEAL HARVEST ESTIMATES: Tatitlek, 2006
SAMPLING DESIGN: CENSUS Total Native Households 20
Surveyed Households 15Sampling Fraction 75.0%
Sample Household Members 53Estimated Household Members 70.7
2000 U.S. Census Estimated Native Population 91HARVEST AND USE INFORMATION
Percentage of Native Households: Estimated Community Harvest Sea Harbor and Take (Expanded): Sea Harbor
Lion Seal Lion SealUsed 60.0% 100.0% Total Number Harvested 16.0 218.7
Hunted 20.0% 46.7% Total Number Struck and Lost 8.0 16.0Harvested 13.3% 46.7% Total Number Taken 24.0 234.7Received 46.7% 93.3%
Gave Away 40.0% 80.0% Number Harvested Per Capita 0.18 2.40
SEA LION HARVEST BY MONTH UnknownJan Feb Mar Apr May Jun Jul Aug Sep Oct Nov Dec Month Total
REPORTED HARVEST AND TAKE BY SAMPLED HOUSEHOLDS (UNEXPANDED)Harvest 2 2 2 0 0 0 0 0 0 2 2 0 2 12Struck & Lost 0 3 2 1 0 0 0 0 0 0 0 0 0 6Total Take 2 5 4 1 0 0 0 0 0 2 2 0 2 18
ESTIMATED HARVEST AND TAKE BY COMMUNITY (EXPANDED)Harvest 2.7 2.7 2.7 0.0 0.0 0.0 0.0 0.0 0.0 2.7 2.7 0.0 2.7 16.0Struck & Lost 0.0 4.0 2.7 1.3 0.0 0.0 0.0 0.0 0.0 0.0 0.0 0.0 0.0 8.0Total Take 2.7 6.7 5.3 0.0 0.0 0.0 0.0 0.0 0.0 2.7 2.7 0.0 2.7 24.0
ESTIMATED SEASONALLY ADJUSTED HARVEST AND TAKE BY COMMUNITY (EXPANDED)Harvest 3.2 3.2 3.2 0.0 0.0 0.0 0.0 0.0 0.0 3.2 3.2 0.0 16.0Struck & Lost 0.0 4.0 2.7 1.3 0.0 0.0 0.0 0.0 0.0 0.0 0.0 0.0 8.0Total Take 3.2 7.2 5.9 1.3 0.0 0.0 0.0 0.0 0.0 3.2 3.2 0.0 24.0Total Take (%) 13.3% 30.0% 24.4% 5.6% 0.0% 0.0% 0.0% 0.0% 0.0% 13.3% 13.3% 0.0% 100.0%Cum. Take 3.2 10.4 16.3 17.6 17.6 17.6 17.6 17.6 17.6 20.8 24.0 24.0Cum. Take (%) 13.3% 43.3% 67.8% 73.3% 73.3% 73.3% 73.3% 73.3% 73.3% 86.7% 100.0% 100.0%
HARBOR SEAL HARVEST BY MONTH UnknownJan Feb Mar Apr May Jun Jul Aug Sep Oct Nov Dec Month Total
REPORTED HARVEST AND TAKE BY SAMPLED HOUSEHOLDS (UNEXPANDED)Harvest 12 11 8 9 10 12 13 11 10 8 11 10 39 164Struck & Lost 1 1 0 0 1 1 2 3 2 0 1 0 0 12Total Take 13 12 8 9 11 13 15 14 12 8 12 10 39 176
ESTIMATED HARVEST AND TAKE BY COMMUNITY (EXPANDED)Harvest 16.0 14.7 10.7 12.0 13.3 16.0 17.3 14.7 13.3 10.7 14.7 13.3 52.0 218.7Struck & Lost 1.3 1.3 0.0 0.0 1.3 1.3 2.7 4.0 2.7 0.0 1.3 0.0 0.0 16.0Total Take 17.3 16.0 10.7 14.7 14.7 17.3 20.0 18.7 16.0 10.7 16.0 13.3 52.0 234.7
ESTIMATED SEASONALLY ADJUSTED HARVEST AND TAKE BY COMMUNITY (EXPANDED)Harvest 21.0 19.2 14.0 15.7 17.5 21.0 22.7 19.2 17.5 14.0 19.2 17.5 218.7Struck & Lost 1.3 1.3 0.0 0.0 1.3 1.3 2.7 4.0 2.7 0.0 1.3 0.0 16.0Total Take 22.3 20.6 14.0 15.7 18.8 22.3 25.4 23.2 20.2 14.0 20.6 17.5 234.7Total Take (%) 9.5% 8.8% 6.0% 6.7% 8.0% 9.5% 10.8% 9.9% 8.6% 6.0% 8.8% 7.5% 100.0%Cum. Take 22.3 42.9 56.9 72.6 91.5 113.8 139.2 162.4 182.6 196.6 217.2 234.7Cum. Take (%) 9.5% 18.3% 24.2% 31.0% 39.0% 48.5% 59.3% 69.2% 77.8% 83.8% 92.5% 100.0% SOURCE: ANHSC Household Surveys, 2007.
C - 45

Table 23. (cont.) SEA LION & HARBOR SEAL HARVEST ESTIMATES: Tatitlek, 2006
HARVEST BY AGE AND SEXSea Lion Harbor Seal
Reported by Community Est. Reported by Community Est.Sample (Expanded) Sample (Expanded)
Number % Number % Number % Number %Adult Male 0 0.0% 0.0 0.0% 1 0.6% 1.3 0.6%
Adult Female 0 0.0% 0.0 0.0% 3 1.8% 4.0 1.8%Adult Unknown Sex 0 0.0% 0.0 0.0% 6 3.7% 8.0 3.7%
Juvenile Male 0 0.0% 0.0 0.0% 0 0.0% 0.0 0.0%Juvenile Female 0 0.0% 0.0 0.0% 1 0.6% 1.3 0.6%
Juvenile Unknown Sex 0 0.0% 0.0 0.0% 3 1.8% 4.0 1.8%Pup Male 0 0.0% 0.0 0.0% 0 0.0% 0.0 0.0%
Pup Female 0 0.0% 0.0 0.0% 0 0.0% 0.0 0.0%Pup Unknown Sex 0 0.0% 0.0 0.0% 1 0.6% 1.3 0.6%
Male Unknown Age 0 0.0% 0.0 0.0% 0 0.0% 0.0 0.0%Female Unknown Age 0 0.0% 0.0 0.0% 0 0.0% 0.0 0.0%Unknown Sex and Age 12 100.0% 16.0 100.0% 149 90.9% 198.7 90.9%
Total 12 100.0% 16.0 100.0% 164 100.0% 218.7 100.0%
SEASONALLY ADJUSTED TAKE BY MONTH, SEA LION AND HARBOR SEAL
ESTIMATED COMMUNITY HARVEST, STRUCK AND LOST, AND TAKE BY YEAR
SEA LION HARBOR SEALStruck/ Total Struck/ Total
Year Harvest Lost Take Year Harvest Lost Take
1992 8.3 4.2 12.5 1992 152.9 17.7 170.61993 4.1 1.0 5.2 1993 110.8 15.5 126.41994 8.8 7.4 16.2 1994 145.9 30.9 176.81995 2.6 0.0 2.6 1995 46.1 2.6 48.71996 5.0 0.0 5.0 1996 90.8 3.8 94.61997 2.7 1.4 4.1 1997 97.2 6.8 104.01998 15.1 6.8 21.9 1998 171.1 19.2 190.22000 1.9 0.0 1.9 2000 46.3 1.9 48.22001 6.3 0.0 6.3 2001 61.6 4.7 66.32002 0.0 0.0 0.0 2002 13.1 1.9 14.92003 12.4 1.1 13.5 2003 91.1 0.0 91.12004 26.3 10.3 36.6 2004 90.2 23.1 113.32005 39.0 9.1 48.1 2005 137.8 16.9 154.72006 16.0 8.0 24.0 2006 218.7 16.0 234.7
SOURCE: Alaska Department of Fish and Game, Division of Subsistence, Household Surveys 1992-1998;ANHSC Household Surveys, 2000-2007.
C - 46
0
5
10
15
20
25
30
Jan Feb Mar Apr May Jun Jul Aug Sep Oct Nov Dec
Seas
onal
ly A
djus
ted
Tota
l Tak
e
Sea Lion Harbor Seal
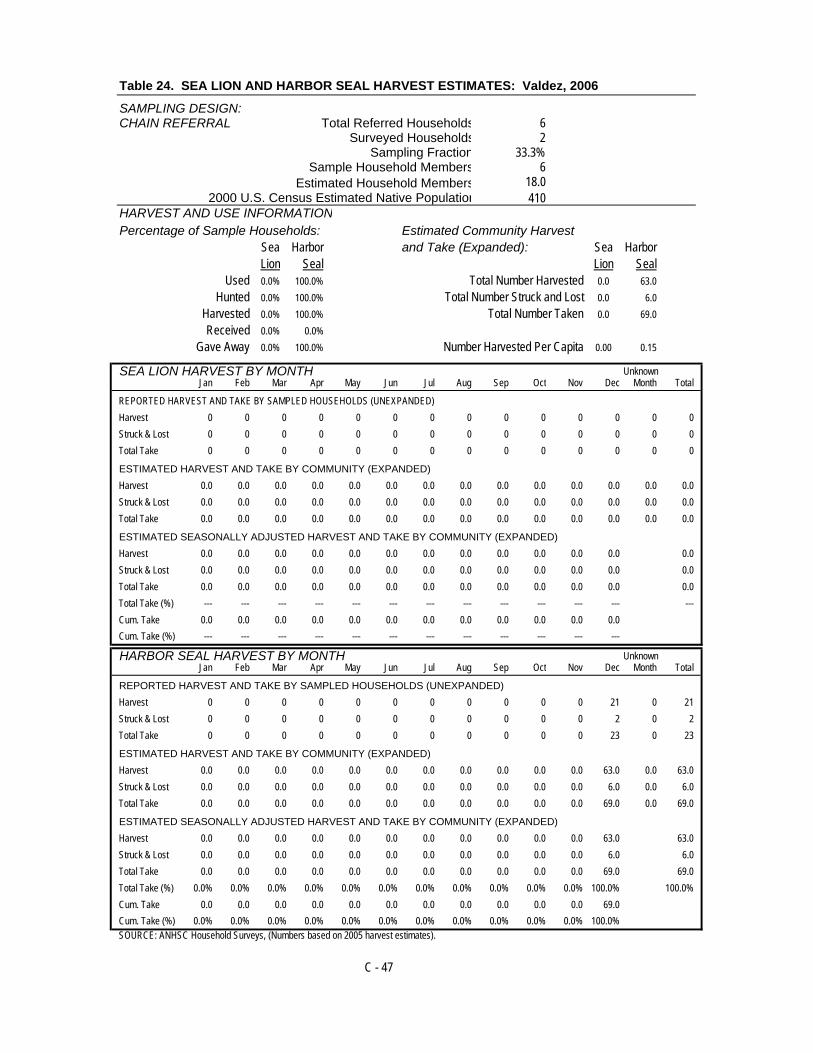
Table 24. SEA LION AND HARBOR SEAL HARVEST ESTIMATES: Valdez, 2006
SAMPLING DESIGN: CHAIN REFERRAL Total Referred Households 6
Surveyed Households 2Sampling Fraction 33.3%
Sample Household Members 6Estimated Household Members 18.0
2000 U.S. Census Estimated Native Population 410HARVEST AND USE INFORMATION
Percentage of Sample Households: Estimated Community Harvest Sea Harbor and Take (Expanded): Sea Harbor
Lion Seal Lion SealUsed 0.0% 100.0% Total Number Harvested 0.0 63.0
Hunted 0.0% 100.0% Total Number Struck and Lost 0.0 6.0Harvested 0.0% 100.0% Total Number Taken 0.0 69.0Received 0.0% 0.0%
Gave Away 0.0% 100.0% Number Harvested Per Capita 0.00 0.15
SEA LION HARVEST BY MONTH UnknownJan Feb Mar Apr May Jun Jul Aug Sep Oct Nov Dec Month Total
REPORTED HARVEST AND TAKE BY SAMPLED HOUSEHOLDS (UNEXPANDED)Harvest 0 0 0 0 0 0 0 0 0 0 0 0 0 0Struck & Lost 0 0 0 0 0 0 0 0 0 0 0 0 0 0Total Take 0 0 0 0 0 0 0 0 0 0 0 0 0 0
ESTIMATED HARVEST AND TAKE BY COMMUNITY (EXPANDED)Harvest 0.0 0.0 0.0 0.0 0.0 0.0 0.0 0.0 0.0 0.0 0.0 0.0 0.0 0.0Struck & Lost 0.0 0.0 0.0 0.0 0.0 0.0 0.0 0.0 0.0 0.0 0.0 0.0 0.0 0.0Total Take 0.0 0.0 0.0 0.0 0.0 0.0 0.0 0.0 0.0 0.0 0.0 0.0 0.0 0.0
ESTIMATED SEASONALLY ADJUSTED HARVEST AND TAKE BY COMMUNITY (EXPANDED)Harvest 0.0 0.0 0.0 0.0 0.0 0.0 0.0 0.0 0.0 0.0 0.0 0.0 0.0Struck & Lost 0.0 0.0 0.0 0.0 0.0 0.0 0.0 0.0 0.0 0.0 0.0 0.0 0.0Total Take 0.0 0.0 0.0 0.0 0.0 0.0 0.0 0.0 0.0 0.0 0.0 0.0 0.0Total Take (%) --- --- --- --- --- --- --- --- --- --- --- --- ---Cum. Take 0.0 0.0 0.0 0.0 0.0 0.0 0.0 0.0 0.0 0.0 0.0 0.0Cum. Take (%) --- --- --- --- --- --- --- --- --- --- --- ---
HARBOR SEAL HARVEST BY MONTH UnknownJan Feb Mar Apr May Jun Jul Aug Sep Oct Nov Dec Month Total
REPORTED HARVEST AND TAKE BY SAMPLED HOUSEHOLDS (UNEXPANDED)Harvest 0 0 0 0 0 0 0 0 0 0 0 21 0 21Struck & Lost 0 0 0 0 0 0 0 0 0 0 0 2 0 2Total Take 0 0 0 0 0 0 0 0 0 0 0 23 0 23
ESTIMATED HARVEST AND TAKE BY COMMUNITY (EXPANDED)Harvest 0.0 0.0 0.0 0.0 0.0 0.0 0.0 0.0 0.0 0.0 0.0 63.0 0.0 63.0Struck & Lost 0.0 0.0 0.0 0.0 0.0 0.0 0.0 0.0 0.0 0.0 0.0 6.0 0.0 6.0Total Take 0.0 0.0 0.0 0.0 0.0 0.0 0.0 0.0 0.0 0.0 0.0 69.0 0.0 69.0
ESTIMATED SEASONALLY ADJUSTED HARVEST AND TAKE BY COMMUNITY (EXPANDED)Harvest 0.0 0.0 0.0 0.0 0.0 0.0 0.0 0.0 0.0 0.0 0.0 63.0 63.0Struck & Lost 0.0 0.0 0.0 0.0 0.0 0.0 0.0 0.0 0.0 0.0 0.0 6.0 6.0Total Take 0.0 0.0 0.0 0.0 0.0 0.0 0.0 0.0 0.0 0.0 0.0 69.0 69.0Total Take (%) 0.0% 0.0% 0.0% 0.0% 0.0% 0.0% 0.0% 0.0% 0.0% 0.0% 0.0% 100.0% 100.0%Cum. Take 0.0 0.0 0.0 0.0 0.0 0.0 0.0 0.0 0.0 0.0 0.0 69.0Cum. Take (%) 0.0% 0.0% 0.0% 0.0% 0.0% 0.0% 0.0% 0.0% 0.0% 0.0% 0.0% 100.0% SOURCE: ANHSC Household Surveys, (Numbers based on 2005 harvest estimates).
C - 47
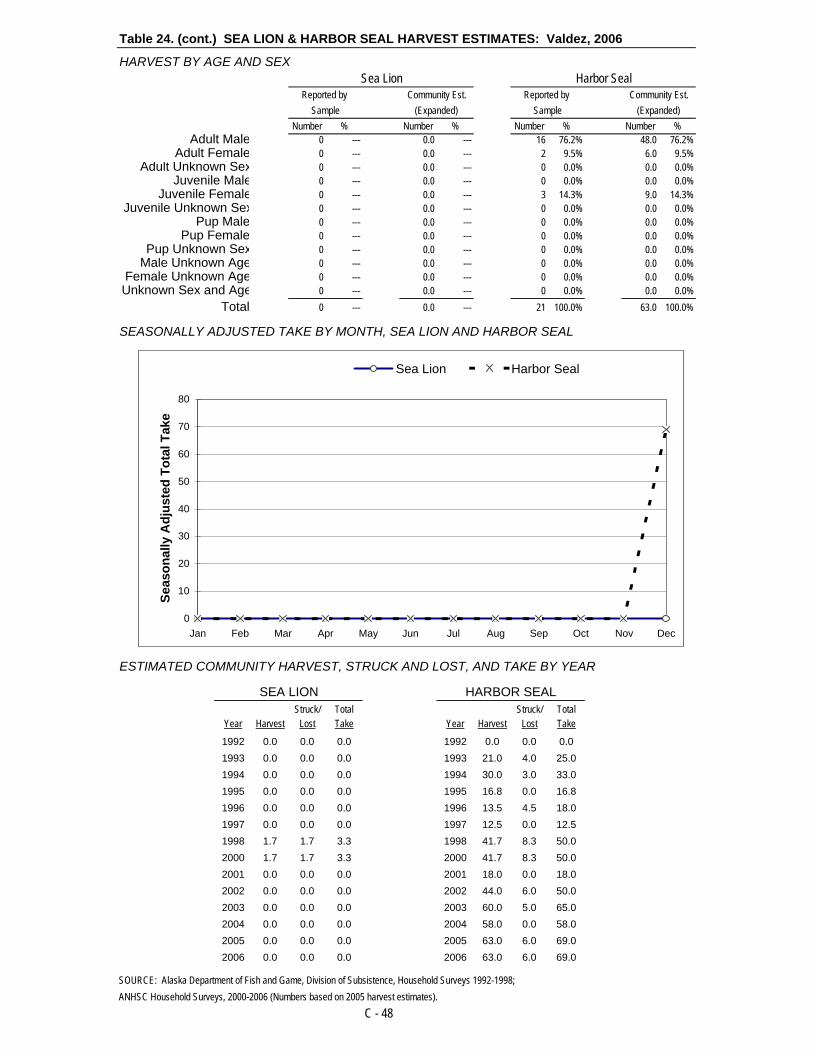
Table 24. (cont.) SEA LION & HARBOR SEAL HARVEST ESTIMATES: Valdez, 2006
HARVEST BY AGE AND SEXSea Lion Harbor Seal
Reported by Community Est. Reported by Community Est.Sample (Expanded) Sample (Expanded)
Number % Number % Number % Number %Adult Male 0 --- 0.0 --- 16 76.2% 48.0 76.2%
Adult Female 0 --- 0.0 --- 2 9.5% 6.0 9.5%Adult Unknown Sex 0 --- 0.0 --- 0 0.0% 0.0 0.0%
Juvenile Male 0 --- 0.0 --- 0 0.0% 0.0 0.0%Juvenile Female 0 --- 0.0 --- 3 14.3% 9.0 14.3%
Juvenile Unknown Sex 0 --- 0.0 --- 0 0.0% 0.0 0.0%Pup Male 0 --- 0.0 --- 0 0.0% 0.0 0.0%
Pup Female 0 --- 0.0 --- 0 0.0% 0.0 0.0%Pup Unknown Sex 0 --- 0.0 --- 0 0.0% 0.0 0.0%
Male Unknown Age 0 --- 0.0 --- 0 0.0% 0.0 0.0%Female Unknown Age 0 --- 0.0 --- 0 0.0% 0.0 0.0%Unknown Sex and Age 0 --- 0.0 --- 0 0.0% 0.0 0.0%
Total 0 --- 0.0 --- 21 100.0% 63.0 100.0%
SEASONALLY ADJUSTED TAKE BY MONTH, SEA LION AND HARBOR SEAL
ESTIMATED COMMUNITY HARVEST, STRUCK AND LOST, AND TAKE BY YEAR
SEA LION HARBOR SEALStruck/ Total Struck/ Total
Year Harvest Lost Take Year Harvest Lost Take
1992 0.0 0.0 0.0 1992 0.0 0.0 0.01993 0.0 0.0 0.0 1993 21.0 4.0 25.01994 0.0 0.0 0.0 1994 30.0 3.0 33.01995 0.0 0.0 0.0 1995 16.8 0.0 16.81996 0.0 0.0 0.0 1996 13.5 4.5 18.01997 0.0 0.0 0.0 1997 12.5 0.0 12.51998 1.7 1.7 3.3 1998 41.7 8.3 50.02000 1.7 1.7 3.3 2000 41.7 8.3 50.02001 0.0 0.0 0.0 2001 18.0 0.0 18.02002 0.0 0.0 0.0 2002 44.0 6.0 50.02003 0.0 0.0 0.0 2003 60.0 5.0 65.02004 0.0 0.0 0.0 2004 58.0 0.0 58.02005 0.0 0.0 0.0 2005 63.0 6.0 69.02006 0.0 0.0 0.0 2006 63.0 6.0 69.0
SOURCE: Alaska Department of Fish and Game, Division of Subsistence, Household Surveys 1992-1998;ANHSC Household Surveys, 2000-2006 (Numbers based on 2005 harvest estimates).
C - 48
0
10
20
30
40
50
60
70
80
Jan Feb Mar Apr May Jun Jul Aug Sep Oct Nov Dec
Seas
onal
ly A
djus
ted
Tota
l Tak
e
Sea Lion Harbor Seal

Table 25. SEA LION AND HARBOR SEAL HARVEST AND TAKE ESTIMATES: Anchorage, 2006
SAMPLING DESIGN: CHAIN REFERRAL Total Referred Households 25
Surveyed Households 15Sampling Fraction 60.0%
Sample Household Members 44Estimated Household Members 73.3
2000 U.S. Census Estimated Native Population 26995HARVEST AND USE INFORMATION
Percentage of Sample Households: Estimated Community Harvest Sea Harbor and Take (Expanded): Sea Harbor
Lion Seal Lion SealUsed 0.0% 60.0% Total Number Harvested 0.0 25.0
Hunted 0.0% 40.0% Total Number Struck and Lost 0.0 13.3Harvested 0.0% 33.3% Total Number Taken 0.0 38.3Received 0.0% 40.0%
Gave Away 0.0% 33.3% Number Harvested Per Capita 0.00 0.00
SEA LION HARVEST BY MONTH UnknownJan Feb Mar Apr May Jun Jul Aug Sep Oct Nov Dec Month Total
REPORTED HARVEST AND TAKE BY SAMPLED HOUSEHOLDS (UNEXPANDED)Harvest 0 0 0 0 0 0 0 0 0 0 0 0 0 0Struck & Lost 0 0 0 0 0 0 0 0 0 0 0 0 0 0Total Take 0 0 0 0 0 0 0 0 0 0 0 0 0 0
ESTIMATED HARVEST AND TAKE BY COMMUNITY (EXPANDED)Harvest 0.0 0.0 0.0 0.0 0.0 0.0 0.0 0.0 0.0 0.0 0.0 0.0 0.0 0.0Struck & Lost 0.0 0.0 0.0 0.0 0.0 0.0 0.0 0.0 0.0 0.0 0.0 0.0 0.0 0.0Total Take 0.0 0.0 0.0 0.0 0.0 0.0 0.0 0.0 0.0 0.0 0.0 0.0 0.0 0.0
ESTIMATED SEASONALLY ADJUSTED HARVEST AND TAKE BY COMMUNITY (EXPANDED)Harvest 0.0 0.0 0.0 0.0 0.0 0.0 0.0 0.0 0.0 0.0 0.0 0.0 0.0Struck & Lost 0.0 0.0 0.0 0.0 0.0 0.0 0.0 0.0 0.0 0.0 0.0 0.0 0.0Total Take 0.0 0.0 0.0 0.0 0.0 0.0 0.0 0.0 0.0 0.0 0.0 0.0 0.0Total Take (%) --- --- --- --- --- --- --- --- --- --- --- --- ---Cum. Take 0.0 0.0 0.0 0.0 0.0 0.0 0.0 0.0 0.0 0.0 0.0 0.0Cum. Take (%) --- --- --- --- --- --- --- --- --- --- --- ---
HARBOR SEAL HARVEST BY MONTH UnknownJan Feb Mar Apr May Jun Jul Aug Sep Oct Nov Dec Month Total
REPORTED HARVEST AND TAKE BY SAMPLED HOUSEHOLDS (UNEXPANDED)Harvest 0 0 0 0 1 0 4 0 0 0 2 0 8 15Struck & Lost 0 0 3 0 0 0 0 0 0 0 2 0 3 8Total Take 0 0 3 0 1 0 4 0 0 0 4 0 11 23
ESTIMATED HARVEST AND TAKE BY COMMUNITY (EXPANDED)Harvest 0.0 0.0 0.0 0.0 1.7 0.0 6.7 0.0 0.0 0.0 3.3 0.0 13.3 25.0Struck & Lost 0.0 0.0 5.0 0.0 0.0 0.0 0.0 0.0 0.0 0.0 3.3 0.0 5.0 13.3Total Take 0.0 0.0 5.0 1.7 1.7 0.0 6.7 0.0 0.0 0.0 6.7 0.0 18.3 38.3
ESTIMATED SEASONALLY ADJUSTED HARVEST AND TAKE BY COMMUNITY (EXPANDED)Harvest 0.0 0.0 0.0 0.0 3.6 0.0 14.3 0.0 0.0 0.0 7.1 0.0 25.0Struck & Lost 0.0 0.0 8.0 0.0 0.0 0.0 0.0 0.0 0.0 0.0 5.3 0.0 13.3Total Take 0.0 0.0 8.0 0.0 3.6 0.0 14.3 0.0 0.0 0.0 12.5 0.0 38.3Total Take (%) 0.0% 0.0% 20.9% 0.0% 9.3% 0.0% 37.3% 0.0% 0.0% 0.0% 32.5% 0.0% 100.0%Cum. Take 0.0 0.0 8.0 8.0 11.6 11.6 25.9 25.9 25.9 25.9 38.3 38.3Cum. Take (%) 0.0% 0.0% 20.9% 20.9% 30.2% 30.2% 67.5% 67.5% 67.5% 67.5% 100.0% 100.0% SOURCE: ANHSC Household Surveys, (Numbers based on 2005 harvest estimates).
C - 49

Table 25. (cont.) SEA LION & HARBOR SEAL HARVEST ESTIMATES: Anchorage, 2006
HARVEST BY AGE AND SEXSea Lion Harbor Seal
Reported by Community Est. Reported by Community Est.Sample (Expanded) Sample (Expanded)
Number % Number % Number % Number %Adult Male 0 --- 0.0 --- 2 13.3% 3.3 13.3%
Adult Female 0 --- 0.0 --- 0 0.0% 0.0 0.0%Adult Unknown Sex 0 --- 0.0 --- 13 86.7% 21.7 86.7%
Juvenile Male 0 --- 0.0 --- 0 0.0% 0.0 0.0%Juvenile Female 0 --- 0.0 --- 0 0.0% 0.0 0.0%
Juvenile Unknown Sex 0 --- 0.0 --- 0 0.0% 0.0 0.0%Pup Male 0 --- 0.0 --- 0 0.0% 0.0 0.0%
Pup Female 0 --- 0.0 --- 0 0.0% 0.0 0.0%Pup Unknown Sex 0 --- 0.0 --- 0 0.0% 0.0 0.0%
Male Unknown Age 0 --- 0.0 --- 0 0.0% 0.0 0.0%Female Unknown Age 0 --- 0.0 --- 0 0.0% 0.0 0.0%
Unknown Sex and Age 0 --- 0.0 --- 0 0.0% 0.0 0.0%Total 0 --- 0.0 --- 15 100.0% 25.0 100.0%
SEASONALLY ADJUSTED TAKE BY MONTH, SEA LION AND HARBOR SEAL
ESTIMATED COMMUNITY HARVEST, STRUCK AND LOST, AND TAKE BY YEAR
SEA LION HARBOR SEALStruck/ Total Struck/ Total
Year Harvest Lost Take Year Harvest Lost Take1992 5.7 3.8 9.5 1992 17.1 0.0 17.11993 7.8 3.3 11.1 1993 24.4 5.6 30.01994 1.4 0.0 1.4 1994 4.2 0.0 4.21995 0.0 0.0 0.0 1995 3.7 0.0 3.71996 1.0 0.0 1.0 1996 28.9 6.2 35.11997 0.0 0.0 0.0 1997 23.6 1.2 24.81998 0.0 0.0 0.0 1998 43.8 7.5 51.32000 0.0 0.0 0.0 2000 43.8 7.5 51.32001 1.3 0.0 1.3 2001 45.3 2.7 48.02002 0.0 0.0 0.0 2002 39.8 8.0 47.72003 0.0 0.0 0.0 2003 55.0 15.0 70.02004 0.0 0.0 0.0 2004 46.8 13.4 60.22005 0.0 0.0 0.0 2005 25.0 13.3 38.32006 0.0 0.0 0.0 2006 25.0 13.3 38.3
SOURCE: Alaska Department of Fish and Game, Division of Subsistence, Household Surveys 1992-1998;ANHSC Household Surveys, 2000-2006 (Numbers based on 2005 harvest estimates).
C - 50
0
2
4
6
8
10
12
14
16
Jan Feb Mar Apr May Jun Jul Aug Sep Oct Nov Dec
Seas
onal
ly A
djus
ted
Tota
l Tak
e
Sea Lion Harbor Seal

Table 26. SEA LION AND HARBOR SEAL HARVEST AND TAKE ESTIMATES: Homer, 2006
SAMPLING DESIGN: CHAIN REFERRAL Total Referred Households 13
Surveyed Households 7Sampling Fraction 53.8%
Sample Household Members 22Estimated Household Members 40.9
2000 U.S. Census Estimated Native Population 371HARVEST AND USE INFORMATION
Percentage of Sample Households: Estimated Community Harvest Sea Harbor and Take (Expanded): Sea Harbor
Lion Seal Lion SealUsed 0.0% 42.9% Total Number Harvested 0.0 5.6
Hunted 0.0% 28.6% Total Number Struck and Lost 0.0 0.0Harvested 0.0% 28.6% Total Number Taken 0.0 5.6Received 0.0% 28.6%
Gave Away 0.0% 28.6% Number Harvested Per Capita 0.00 0.02
SEA LION HARVEST BY MONTH UnknownJan Feb Mar Apr May Jun Jul Aug Sep Oct Nov Dec Month Total
REPORTED HARVEST AND TAKE BY SAMPLED HOUSEHOLDS (UNEXPANDED)Harvest 0 0 0 0 0 0 0 0 0 0 0 0 0 0Struck & Lost 0 0 0 0 0 0 0 0 0 0 0 0 0 0Total Take 0 0 0 0 0 0 0 0 0 0 0 0 0 0
ESTIMATED HARVEST AND TAKE BY COMMUNITY (EXPANDED)Harvest 0.0 0.0 0.0 0.0 0.0 0.0 0.0 0.0 0.0 0.0 0.0 0.0 0.0 0.0Struck & Lost 0.0 0.0 0.0 0.0 0.0 0.0 0.0 0.0 0.0 0.0 0.0 0.0 0.0 0.0Total Take 0.0 0.0 0.0 0.0 0.0 0.0 0.0 0.0 0.0 0.0 0.0 0.0 0.0 0.0
ESTIMATED SEASONALLY ADJUSTED HARVEST AND TAKE BY COMMUNITY (EXPANDED)Harvest 0.0 0.0 0.0 0.0 0.0 0.0 0.0 0.0 0.0 0.0 0.0 0.0 0.0Struck & Lost 0.0 0.0 0.0 0.0 0.0 0.0 0.0 0.0 0.0 0.0 0.0 0.0 0.0Total Take 0.0 0.0 0.0 0.0 0.0 0.0 0.0 0.0 0.0 0.0 0.0 0.0 0.0Total Take (%) --- --- --- --- --- --- --- --- --- --- --- --- ---Cum. Take 0.0 0.0 0.0 0.0 0.0 0.0 0.0 0.0 0.0 0.0 0.0 0.0Cum. Take (%) --- --- --- --- --- --- --- --- --- --- --- ---
HARBOR SEAL HARVEST BY MONTH UnknownJan Feb Mar Apr May Jun Jul Aug Sep Oct Nov Dec Month Total
REPORTED HARVEST AND TAKE BY SAMPLED HOUSEHOLDS (UNEXPANDED)Harvest 0 0 0 0 0 0 0 1 1 1 0 0 0 3Struck & Lost 0 0 0 0 0 0 0 0 0 0 0 0 0 0Total Take 0 0 0 0 0 0 0 1 1 1 0 0 0 3
ESTIMATED HARVEST AND TAKE BY COMMUNITY (EXPANDED)Harvest 0.0 0.0 0.0 0.0 0.0 0.0 0.0 1.9 1.9 1.9 0.0 0.0 0.0 5.6Struck & Lost 0.0 0.0 0.0 0.0 0.0 0.0 0.0 0.0 0.0 0.0 0.0 0.0 0.0 0.0Total Take 0.0 0.0 0.0 0.0 0.0 0.0 0.0 1.9 1.9 1.9 0.0 0.0 0.0 5.6
ESTIMATED SEASONALLY ADJUSTED HARVEST AND TAKE BY COMMUNITY (EXPANDED)Harvest 0.0 0.0 0.0 0.0 0.0 0.0 0.0 1.9 1.9 1.9 0.0 0.0 5.6Struck & Lost 0.0 0.0 0.0 0.0 0.0 0.0 0.0 0.0 0.0 0.0 0.0 0.0 0.0Total Take 0.0 0.0 0.0 0.0 0.0 0.0 0.0 1.9 1.9 1.9 0.0 0.0 5.6Total Take (%) 0.0% 0.0% 0.0% 0.0% 0.0% 0.0% 0.0% 33.3% 33.3% 33.3% 0.0% 0.0% 100.0%Cum. Take 0.0 0.0 0.0 0.0 0.0 0.0 0.0 1.9 3.7 5.6 5.6 5.6Cum. Take (%) 0.0% 0.0% 0.0% 0.0% 0.0% 0.0% 0.0% 33.3% 66.7% 100.0% 100.0% 100.0% SOURCE: ANHSC Household Surveys, (Numbers based on 2005 harvest estimates).
C - 51
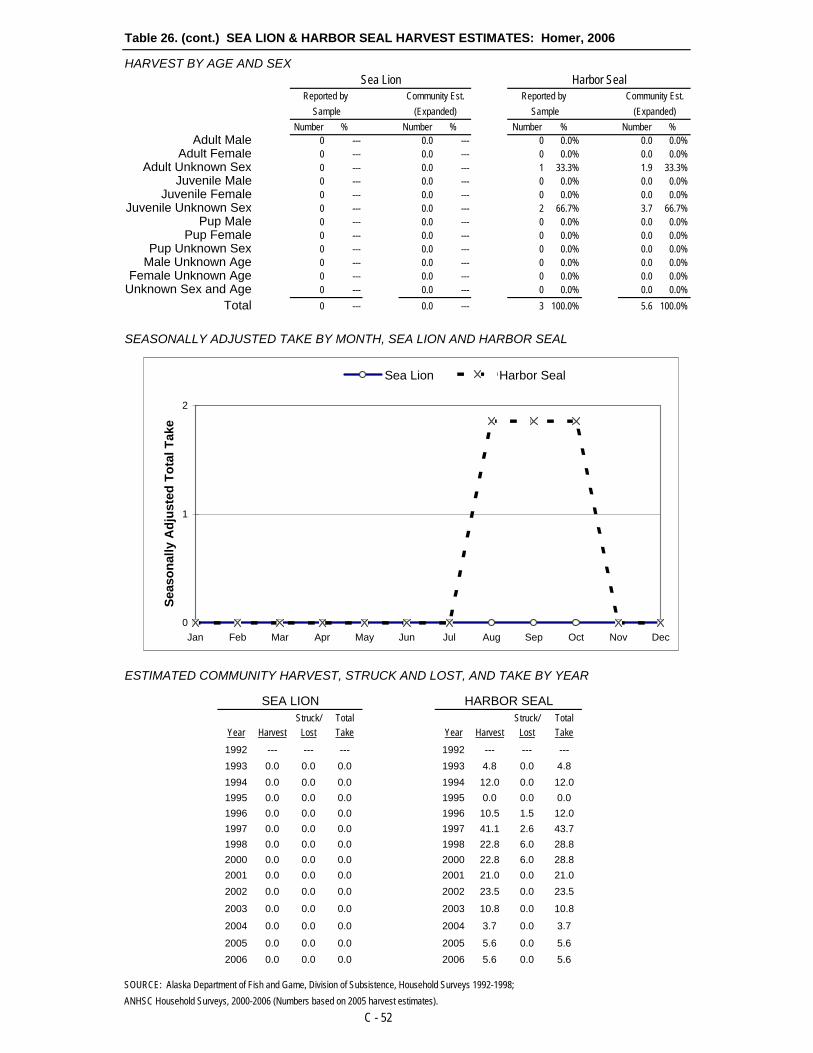
Table 26. (cont.) SEA LION & HARBOR SEAL HARVEST ESTIMATES: Homer, 2006
HARVEST BY AGE AND SEXSea Lion Harbor Seal
Reported by Community Est. Reported by Community Est.Sample (Expanded) Sample (Expanded)
Number % Number % Number % Number %Adult Male 0 --- 0.0 --- 0 0.0% 0.0 0.0%
Adult Female 0 --- 0.0 --- 0 0.0% 0.0 0.0%Adult Unknown Sex 0 --- 0.0 --- 1 33.3% 1.9 33.3%
Juvenile Male 0 --- 0.0 --- 0 0.0% 0.0 0.0%Juvenile Female 0 --- 0.0 --- 0 0.0% 0.0 0.0%
Juvenile Unknown Sex 0 --- 0.0 --- 2 66.7% 3.7 66.7%Pup Male 0 --- 0.0 --- 0 0.0% 0.0 0.0%
Pup Female 0 --- 0.0 --- 0 0.0% 0.0 0.0%Pup Unknown Sex 0 --- 0.0 --- 0 0.0% 0.0 0.0%
Male Unknown Age 0 --- 0.0 --- 0 0.0% 0.0 0.0%Female Unknown Age 0 --- 0.0 --- 0 0.0% 0.0 0.0%
Unknown Sex and Age 0 --- 0.0 --- 0 0.0% 0.0 0.0%Total 0 --- 0.0 --- 3 100.0% 5.6 100.0%
SEASONALLY ADJUSTED TAKE BY MONTH, SEA LION AND HARBOR SEAL
ESTIMATED COMMUNITY HARVEST, STRUCK AND LOST, AND TAKE BY YEAR
SEA LION HARBOR SEALStruck/ Total Struck/ Total
Year Harvest Lost Take Year Harvest Lost Take1992 --- --- --- 1992 --- --- ---1993 0.0 0.0 0.0 1993 4.8 0.0 4.81994 0.0 0.0 0.0 1994 12.0 0.0 12.01995 0.0 0.0 0.0 1995 0.0 0.0 0.01996 0.0 0.0 0.0 1996 10.5 1.5 12.01997 0.0 0.0 0.0 1997 41.1 2.6 43.71998 0.0 0.0 0.0 1998 22.8 6.0 28.82000 0.0 0.0 0.0 2000 22.8 6.0 28.82001 0.0 0.0 0.0 2001 21.0 0.0 21.02002 0.0 0.0 0.0 2002 23.5 0.0 23.5
2003 0.0 0.0 0.0 2003 10.8 0.0 10.8
2004 0.0 0.0 0.0 2004 3.7 0.0 3.7
2005 0.0 0.0 0.0 2005 5.6 0.0 5.62006 0.0 0.0 0.0 2006 5.6 0.0 5.6
SOURCE: Alaska Department of Fish and Game, Division of Subsistence, Household Surveys 1992-1998;ANHSC Household Surveys, 2000-2006 (Numbers based on 2005 harvest estimates).
C - 52
0
1
2
Jan Feb Mar Apr May Jun Jul Aug Sep Oct Nov Dec
Seas
onal
ly A
djus
ted
Tota
l Tak
e
Sea Lion Harbor Seal

Table 27. SEA LION AND HARBOR SEAL HARVEST AND TAKE ESTIMATES: Kenai, 2006
SAMPLING DESIGN: CHAIN REFERRAL Total Referred Households 3
Surveyed Households 1Sampling Fraction 33.3%
Sample Household Members 4Estimated Household Members 12.0
2000 U.S. Census Estimated Native Population 2120HARVEST AND USE INFORMATION
Percentage of Sample Households: Estimated Community Harvest Sea Harbor and Take (Expanded): Sea Harbor
Lion Seal Lion SealUsed 0.0% 100.0% Total Number Harvested 0.0 6.0
Hunted 0.0% 100.0% Total Number Struck and Lost 0.0 0.0Harvested 0.0% 100.0% Total Number Taken 0.0 6.0Received 0.0% 0.0%
Gave Away 0.0% 100.0% Number Harvested Per Capita 0.00 0.00
SEA LION HARVEST BY MONTH UnknownJan Feb Mar Apr May Jun Jul Aug Sep Oct Nov Dec Month Total
REPORTED HARVEST AND TAKE BY SAMPLED HOUSEHOLDS (UNEXPANDED)Harvest 0 0 0 0 0 0 0 0 0 0 0 0 0 0Struck & Lost 0 0 0 0 0 0 0 0 0 0 0 0 0 0Total Take 0 0 0 0 0 0 0 0 0 0 0 0 0 0
ESTIMATED HARVEST AND TAKE BY COMMUNITY (EXPANDED)Harvest 0.0 0.0 0.0 0.0 0.0 0.0 0.0 0.0 0.0 0.0 0.0 0.0 0.0 0.0Struck & Lost 0.0 0.0 0.0 0.0 0.0 0.0 0.0 0.0 0.0 0.0 0.0 0.0 0.0 0.0Total Take 0.0 0.0 0.0 0.0 0.0 0.0 0.0 0.0 0.0 0.0 0.0 0.0 0.0 0.0
ESTIMATED SEASONALLY ADJUSTED HARVEST AND TAKE BY COMMUNITY (EXPANDED)Harvest 0.0 0.0 0.0 0.0 0.0 0.0 0.0 0.0 0.0 0.0 0.0 0.0 0.0Struck & Lost 0.0 0.0 0.0 0.0 0.0 0.0 0.0 0.0 0.0 0.0 0.0 0.0 0.0Total Take 0.0 0.0 0.0 0.0 0.0 0.0 0.0 0.0 0.0 0.0 0.0 0.0 0.0Total Take (%) --- --- --- --- --- --- --- --- --- --- --- --- ---Cum. Take 0.0 0.0 0.0 0.0 0.0 0.0 0.0 0.0 0.0 0.0 0.0 0.0Cum. Take (%) --- --- --- --- --- --- --- --- --- --- --- ---
HARBOR SEAL HARVEST BY MONTH UnknownJan Feb Mar Apr May Jun Jul Aug Sep Oct Nov Dec Month Total
REPORTED HARVEST AND TAKE BY SAMPLED HOUSEHOLDS (UNEXPANDED)Harvest 0 0 0 0 0 0 0 0 0 0 0 0 2 2Struck & Lost 0 0 0 0 0 0 0 0 0 0 0 0 0 0Total Take 0 0 0 0 0 0 0 0 0 0 0 0 2 2
ESTIMATED HARVEST AND TAKE BY COMMUNITY (EXPANDED)Harvest 0.0 0.0 0.0 0.0 0.0 0.0 0.0 0.0 0.0 0.0 0.0 0.0 6.0 6.0Struck & Lost 0.0 0.0 0.0 0.0 0.0 0.0 0.0 0.0 0.0 0.0 0.0 0.0 0.0 0.0Total Take 0.0 0.0 0.0 0.0 0.0 0.0 0.0 0.0 0.0 0.0 0.0 0.0 6.0 6.0
ESTIMATED SEASONALLY ADJUSTED HARVEST AND TAKE BY COMMUNITY (EXPANDED)Harvest 0.5 0.5 0.5 0.5 0.5 0.5 0.5 0.5 0.5 0.5 0.5 0.5 6.0Struck & Lost 0.0 0.0 0.0 0.0 0.0 0.0 0.0 0.0 0.0 0.0 0.0 0.0 0.0Total Take 0.5 0.5 0.5 0.5 0.5 0.5 0.5 0.5 0.5 0.5 0.5 0.5 6.0Total Take (%) 8.3% 8.3% 8.3% 8.3% 8.3% 8.3% 8.3% 8.3% 8.3% 8.3% 8.3% 8.3% 100.0%Cum. Take 0.5 1.0 1.5 2.0 2.5 3.0 3.5 4.0 4.5 5.0 5.5 6.0Cum. Take (%) 8.3% 16.7% 25.0% 33.3% 41.7% 50.0% 58.3% 66.7% 75.0% 83.3% 91.7% 100.0% SOURCE: ANHSC Household Surveys, (Numbers based on 2005 harvest estimates).
C - 53

Table 27. (cont.) SEA LION & HARBOR SEAL HARVEST ESTIMATES: Kenai, 2006
HARVEST BY AGE AND SEXSea Lion Harbor Seal
Reported by Community Est. Reported by Community Est.Sample (Expanded) Sample (Expanded)
Number % Number % Number % Number %Adult Male 0 --- 0.0 --- 0 0.0% 0.0 0.0%
Adult Female 0 --- 0.0 --- 0 0.0% 0.0 0.0%Adult Unknown Sex 0 --- 0.0 --- 0 0.0% 0.0 0.0%
Juvenile Male 0 --- 0.0 --- 0 0.0% 0.0 0.0%Juvenile Female 0 --- 0.0 --- 0 0.0% 0.0 0.0%
Juvenile Unknown Sex 0 --- 0.0 --- 0 0.0% 0.0 0.0%Pup Male 0 --- 0.0 --- 0 0.0% 0.0 0.0%
Pup Female 0 --- 0.0 --- 0 0.0% 0.0 0.0%Pup Unknown Sex 0 --- 0.0 --- 0 0.0% 0.0 0.0%
Male Unknown Age 0 --- 0.0 --- 0 0.0% 0.0 0.0%Female Unknown Age 0 --- 0.0 --- 0 0.0% 0.0 0.0%
Unknown Sex and Age 0 --- 0.0 --- 2 100.0% 6.0 100.0%Total 0 --- 0.0 --- 2 100.0% 6.0 100.0%
SEASONALLY ADJUSTED TAKE BY MONTH, SEA LION AND HARBOR SEAL
ESTIMATED COMMUNITY HARVEST, STRUCK AND LOST, AND TAKE BY YEAR
SEA LION HARBOR SEALStruck/ Total Struck/ Total
Year Harvest Lost Take Year Harvest Lost Take1992 0.0 0.0 0.0 1992 33.3 0.0 33.31993 0.0 0.0 0.0 1993 20.0 0.0 20.01994 --- --- --- 1994 --- --- ---1995 --- --- --- 1995 --- --- ---1996 2.3 0.0 2.3 1996 22.9 1.1 24.01997 0.0 0.0 0.0 1997 35.0 5.0 40.01998 0.0 0.0 0.0 1998 12.6 0.0 12.62000 0.0 0.0 0.0 2000 12.6 0.0 12.62001 0.0 0.0 0.0 2001 24.9 0.0 24.92002 0.0 0.0 0.0 2002 9.0 0.0 9.02003 0.0 0.0 0.0 2003 20.0 0.0 20.02004 0.0 0.0 0.0 2004 6.0 0.0 6.02005 0.0 0.0 0.0 2005 6.0 0.0 6.02006 0.0 0.0 0.0 2006 6.0 0.0 6.0
SOURCE: Alaska Department of Fish and Game, Division of Subsistence, Household Surveys 1992-1998;ANHSC Household Surveys, 2000-2006 (Numbers based on 2005 harvest estimates).
C - 54
0
1
Jan Feb Mar Apr May Jun Jul Aug Sep Oct Nov Dec
Seas
onal
ly A
djus
ted
Tota
l Tak
e
Sea Lion Harbor Seal

Table 28. SEA LION AND HARBOR SEAL HARVEST AND TAKE ESTIMATES: Tyonek, 2006
SAMPLING DESIGN: CHAIN REFERRAL Total Referred Households 2
Surveyed Households 2Sampling Fraction 100.0%
Sample Household Members 6Estimated Household Members 6.0
2000 U.S. Census Estimated Native Population 184HARVEST AND USE INFORMATION
Percentage of Sample Households: Estimated Community Harvest Sea Harbor and Take (Expanded): Sea Harbor
Lion Seal Lion SealUsed 0.0% 100.0% Total Number Harvested 0.0 1.0
Hunted 0.0% 50.0% Total Number Struck and Lost 0.0 0.0Harvested 0.0% 50.0% Total Number Taken 0.0 1.0Received 0.0% 50.0%
Gave Away 0.0% 100.0% Number Harvested Per Capita 0.00 0.01
SEA LION HARVEST BY MONTH UnknownJan Feb Mar Apr May Jun Jul Aug Sep Oct Nov Dec Month Total
REPORTED HARVEST AND TAKE BY SAMPLED HOUSEHOLDS (UNEXPANDED)Harvest 0 0 0 0 0 0 0 0 0 0 0 0 0 0Struck & Lost 0 0 0 0 0 0 0 0 0 0 0 0 0 0Total Take 0 0 0 0 0 0 0 0 0 0 0 0 0 0
ESTIMATED HARVEST AND TAKE BY COMMUNITY (EXPANDED)Harvest 0.0 0.0 0.0 0.0 0.0 0.0 0.0 0.0 0.0 0.0 0.0 0.0 0.0 0.0Struck & Lost 0.0 0.0 0.0 0.0 0.0 0.0 0.0 0.0 0.0 0.0 0.0 0.0 0.0 0.0Total Take 0.0 0.0 0.0 0.0 0.0 0.0 0.0 0.0 0.0 0.0 0.0 0.0 0.0 0.0
ESTIMATED SEASONALLY ADJUSTED HARVEST AND TAKE BY COMMUNITY (EXPANDED)Harvest 0.0 0.0 0.0 0.0 0.0 0.0 0.0 0.0 0.0 0.0 0.0 0.0 0.0Struck & Lost 0.0 0.0 0.0 0.0 0.0 0.0 0.0 0.0 0.0 0.0 0.0 0.0 0.0Total Take 0.0 0.0 0.0 0.0 0.0 0.0 0.0 0.0 0.0 0.0 0.0 0.0 0.0Total Take (%) --- --- --- --- --- --- --- --- --- --- --- --- ---Cum. Take 0.0 0.0 0.0 0.0 0.0 0.0 0.0 0.0 0.0 0.0 0.0 0.0Cum. Take (%) --- --- --- --- --- --- --- --- --- --- --- ---
HARBOR SEAL HARVEST BY MONTH UnknownJan Feb Mar Apr May Jun Jul Aug Sep Oct Nov Dec Month Total
REPORTED HARVEST AND TAKE BY SAMPLED HOUSEHOLDS (UNEXPANDED)Harvest 0 0 0 0 0 0 0 0 0 0 0 0 1 1Struck & Lost 0 0 0 0 0 0 0 0 0 0 0 0 0 0Total Take 0 0 0 0 0 0 0 0 0 0 0 0 1 1
ESTIMATED HARVEST AND TAKE BY COMMUNITY (EXPANDED)Harvest 0.0 0.0 0.0 0.0 0.0 0.0 0.0 0.0 0.0 0.0 0.0 0.0 1.0 1.0Struck & Lost 0.0 0.0 0.0 0.0 0.0 0.0 0.0 0.0 0.0 0.0 0.0 0.0 0.0 0.0Total Take 0.0 0.0 0.0 0.0 0.0 0.0 0.0 0.0 0.0 0.0 0.0 0.0 1.0 1.0
ESTIMATED SEASONALLY ADJUSTED HARVEST AND TAKE BY COMMUNITY (EXPANDED)Harvest 0.1 0.1 0.1 0.1 0.1 0.1 0.1 0.1 0.1 0.1 0.1 0.1 1.0Struck & Lost 0.0 0.0 0.0 0.0 0.0 0.0 0.0 0.0 0.0 0.0 0.0 0.0 0.0Total Take 0.1 0.1 0.1 0.1 0.1 0.1 0.1 0.1 0.1 0.1 0.1 0.1 1.0Total Take (%) 8.3% 8.3% 8.3% 8.3% 8.3% 8.3% 8.3% 8.3% 8.3% 8.3% 8.3% 8.3% 100.0%Cum. Take 0.1 0.2 0.3 0.3 0.4 0.5 0.6 0.7 0.8 0.8 0.9 1.0Cum. Take (%) 8.3% 16.7% 25.0% 33.3% 41.7% 50.0% 58.3% 66.7% 75.0% 83.3% 91.7% 100.0% SOURCE: ANHSC Household Surveys, (Numbers based on 2005 harvest estimates).
C - 55

Table 28. (cont.) SEA LION & HARBOR SEAL HARVEST ESTIMATES: Tyonek, 2006
HARVEST BY AGE AND SEXSea Lion Harbor Seal
Reported by Community Est. Reported by Community Est.Sample (Expanded) Sample (Expanded)
Number % Number % Number % Number %Adult Male 0 --- 0.0 --- 0 0.0% 0.0 0.0%
Adult Female 0 --- 0.0 --- 0 0.0% 0.0 0.0%Adult Unknown Sex 0 --- 0.0 --- 0 0.0% 0.0 0.0%
Juvenile Male 0 --- 0.0 --- 0 0.0% 0.0 0.0%Juvenile Female 0 --- 0.0 --- 0 0.0% 0.0 0.0%
Juvenile Unknown Sex 0 --- 0.0 --- 0 0.0% 0.0 0.0%Pup Male 0 --- 0.0 --- 0 0.0% 0.0 0.0%
Pup Female 0 --- 0.0 --- 0 0.0% 0.0 0.0%Pup Unknown Sex 0 --- 0.0 --- 0 0.0% 0.0 0.0%
Male Unknown Age 0 --- 0.0 --- 0 0.0% 0.0 0.0%Female Unknown Age 0 --- 0.0 --- 0 0.0% 0.0 0.0%
Unknown Sex and Age 0 --- 0.0 --- 1 100.0% 1.0 100.0%Total 0 --- 0.0 --- 1 100.0% 1.0 100.0%
SEASONALLY ADJUSTED TAKE BY MONTH, SEA LION AND HARBOR SEAL
ESTIMATED COMMUNITY HARVEST, STRUCK AND LOST, AND TAKE BY YEAR
SEA LION HARBOR SEALStruck/ Total Struck/ Total
Year Harvest Lost Take Year Harvest Lost Take1992 0.0 0.0 0.0 1992 1.1 0.0 1.11993 --- --- --- 1993 --- --- ---1994 --- --- --- 1994 --- --- ---1995 --- --- --- 1995 --- --- ---1996 0.0 0.0 0.0 1996 2.0 0.0 2.01997 --- --- --- 1997 --- --- ---1998 0.0 0.0 0.0 1998 0.0 0.0 0.02000 0.0 0.0 0.0 2000 0.0 0.0 0.02001 0.0 0.0 0.0 2001 0.0 0.0 0.02002 0.0 0.0 0.0 2002 3.0 0.0 3.02003 0.0 0.0 0.0 2003 5.0 0.0 5.02004 0.0 0.0 0.0 2004 0.0 0.0 0.02005 0.0 0.0 0.0 2005 1.0 0.0 1.02006 0.0 0.0 0.0 2006 1.0 0.0 1.0
SOURCE: Alaska Department of Fish and Game, Division of Subsistence, Household Surveys 1992-1998;ANHSC Household Surveys, 2000-2006 (Numbers based on 2005 harvest estimates).
C - 56
0
1
Jan Feb Mar Apr May Jun Jul Aug Sep Oct Nov Dec
Sea Lion Harbor Seal

Table 29. SEA LION AND HARBOR SEAL HARVEST AND TAKE ESTIMATES: Akhiok, 2006
SAMPLING DESIGN: CENSUS Total Native Households 17
Surveyed Households 15Sampling Fraction 88.2%
Sample Household Members 42Estimated Household Members 47.6
2000 U.S. Census Estimated Native Population 75HARVEST AND USE INFORMATION
Percentage of Native Households: Estimated Community Harvest Sea Harbor and Take (Expanded): Sea Harbor
Lion Seal Lion SealUsed 20.0% 100.0% Total Number Harvested 2.3 13.6
Hunted 13.3% 53.3% Total Number Struck and Lost 0.0 1.1Harvested 13.3% 53.3% Total Number Taken 2.3 14.7Received 13.3% 93.3%
Gave Away 6.7% 66.7% Number Harvested Per Capita 0.03 0.18
SEA LION HARVEST BY MONTH UnknownJan Feb Mar Apr May Jun Jul Aug Sep Oct Nov Dec Month Total
REPORTED HARVEST AND TAKE BY SAMPLED HOUSEHOLDS (UNEXPANDED)Harvest 0 0 0 0 0 0 0 0 0 0 0 2 0 2Struck & Lost 0 0 0 0 0 0 0 0 0 0 0 0 0 0Total Take 0 0 0 0 0 0 0 0 0 0 0 2 0 2
ESTIMATED HARVEST AND TAKE BY COMMUNITY (EXPANDED)Harvest 0.0 0.0 0.0 0.0 0.0 0.0 0.0 0.0 0.0 0.0 0.0 2.3 0.0 2.3Struck & Lost 0.0 0.0 0.0 0.0 0.0 0.0 0.0 0.0 0.0 0.0 0.0 0.0 0.0 0.0Total Take 0.0 0.0 0.0 0.0 0.0 0.0 0.0 0.0 0.0 0.0 0.0 2.3 0.0 2.3
ESTIMATED SEASONALLY ADJUSTED HARVEST AND TAKE BY COMMUNITY (EXPANDED)Harvest 0.0 0.0 0.0 0.0 0.0 0.0 0.0 0.0 0.0 0.0 0.0 2.3 2.3Struck & Lost 0.0 0.0 0.0 0.0 0.0 0.0 0.0 0.0 0.0 0.0 0.0 0.0 0.0Total Take 0.0 0.0 0.0 0.0 0.0 0.0 0.0 0.0 0.0 0.0 0.0 2.3 2.3Total Take (%) 0.0% 0.0% 0.0% 0.0% 0.0% 0.0% 0.0% 0.0% 0.0% 0.0% 0.0% 100.0% 100.0%Cum. Take 0.0 0.0 0.0 0.0 0.0 0.0 0.0 0.0 0.0 0.0 0.0 2.3Cum. Take (%) 0.0% 0.0% 0.0% 0.0% 0.0% 0.0% 0.0% 0.0% 0.0% 0.0% 0.0% 100.0%
HARBOR SEAL HARVEST BY MONTH UnknownJan Feb Mar Apr May Jun Jul Aug Sep Oct Nov Dec Month Total
REPORTED HARVEST AND TAKE BY SAMPLED HOUSEHOLDS (UNEXPANDED)Harvest 0 0 0 0 0 0 0 0 2 1 7 2 0 12Struck & Lost 0 0 0 0 0 0 0 0 0 1 0 0 0 1Total Take 0 0 0 0 0 0 0 0 2 2 7 2 0 13
ESTIMATED HARVEST AND TAKE BY COMMUNITY (EXPANDED)Harvest 0.0 0.0 0.0 0.0 0.0 0.0 0.0 0.0 2.3 1.1 7.9 2.3 0.0 13.6Struck & Lost 0.0 0.0 0.0 0.0 0.0 0.0 0.0 0.0 0.0 1.1 0.0 0.0 0.0 1.1Total Take 0.0 0.0 0.0 0.0 0.0 0.0 0.0 0.0 2.3 2.3 7.9 2.3 0.0 14.7
ESTIMATED SEASONALLY ADJUSTED HARVEST AND TAKE BY COMMUNITY (EXPANDED)Harvest 0.0 0.0 0.0 0.0 0.0 0.0 0.0 0.0 2.3 1.1 7.9 2.3 13.6Struck & Lost 0.0 0.0 0.0 0.0 0.0 0.0 0.0 0.0 0.0 1.1 0.0 0.0 1.1Total Take 0.0 0.0 0.0 0.0 0.0 0.0 0.0 0.0 2.3 2.3 7.9 2.3 14.7Total Take (%) 0.0% 0.0% 0.0% 0.0% 0.0% 0.0% 0.0% 0.0% 15.4% 15.4% 53.8% 15.4% 100.0%Cum. Take 0.0 0.0 0.0 0.0 0.0 0.0 0.0 0.0 2.3 4.5 12.5 14.7Cum. Take (%) 0.0% 0.0% 0.0% 0.0% 0.0% 0.0% 0.0% 0.0% 15.4% 30.8% 84.6% 100.0% SOURCE: ANHSC Household Surveys, 2007.
C - 57
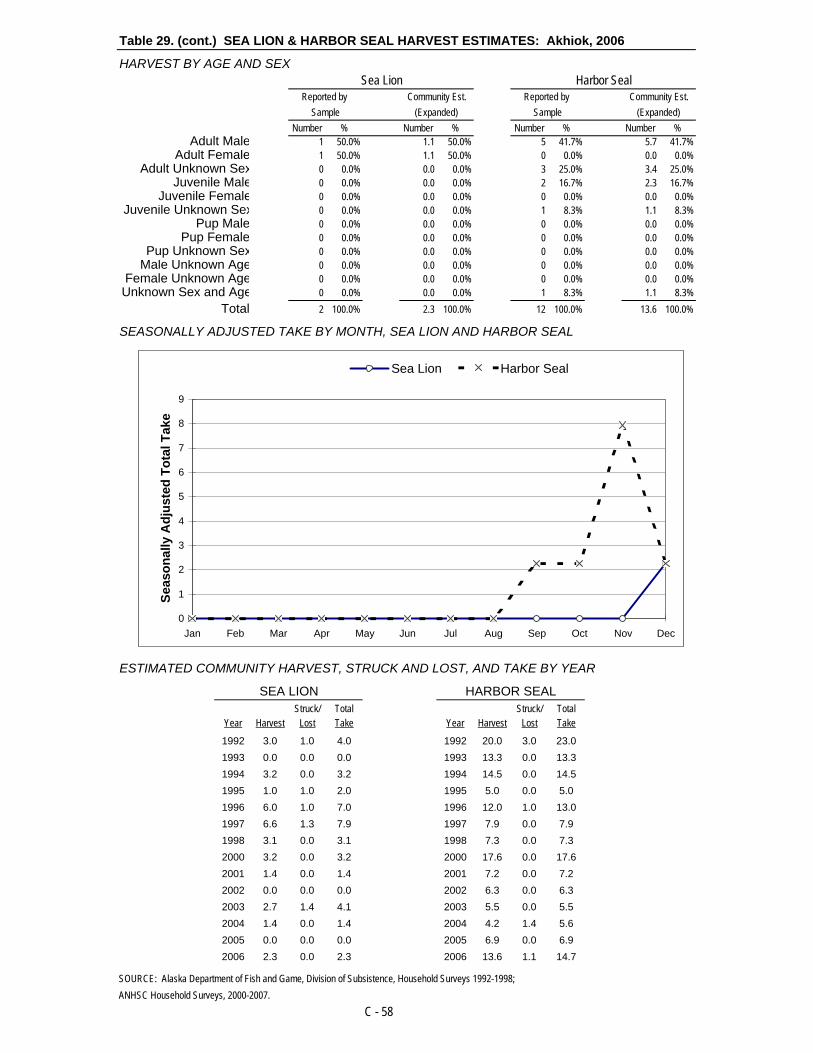
Table 29. (cont.) SEA LION & HARBOR SEAL HARVEST ESTIMATES: Akhiok, 2006
HARVEST BY AGE AND SEXSea Lion Harbor Seal
Reported by Community Est. Reported by Community Est.Sample (Expanded) Sample (Expanded)
Number % Number % Number % Number %Adult Male 1 50.0% 1.1 50.0% 5 41.7% 5.7 41.7%
Adult Female 1 50.0% 1.1 50.0% 0 0.0% 0.0 0.0%Adult Unknown Sex 0 0.0% 0.0 0.0% 3 25.0% 3.4 25.0%
Juvenile Male 0 0.0% 0.0 0.0% 2 16.7% 2.3 16.7%Juvenile Female 0 0.0% 0.0 0.0% 0 0.0% 0.0 0.0%
Juvenile Unknown Sex 0 0.0% 0.0 0.0% 1 8.3% 1.1 8.3%Pup Male 0 0.0% 0.0 0.0% 0 0.0% 0.0 0.0%
Pup Female 0 0.0% 0.0 0.0% 0 0.0% 0.0 0.0%Pup Unknown Sex 0 0.0% 0.0 0.0% 0 0.0% 0.0 0.0%
Male Unknown Age 0 0.0% 0.0 0.0% 0 0.0% 0.0 0.0%Female Unknown Age 0 0.0% 0.0 0.0% 0 0.0% 0.0 0.0%Unknown Sex and Age 0 0.0% 0.0 0.0% 1 8.3% 1.1 8.3%
Total 2 100.0% 2.3 100.0% 12 100.0% 13.6 100.0%
SEASONALLY ADJUSTED TAKE BY MONTH, SEA LION AND HARBOR SEAL
ESTIMATED COMMUNITY HARVEST, STRUCK AND LOST, AND TAKE BY YEAR
SEA LION HARBOR SEALStruck/ Total Struck/ Total
Year Harvest Lost Take Year Harvest Lost Take
1992 3.0 1.0 4.0 1992 20.0 3.0 23.01993 0.0 0.0 0.0 1993 13.3 0.0 13.31994 3.2 0.0 3.2 1994 14.5 0.0 14.51995 1.0 1.0 2.0 1995 5.0 0.0 5.01996 6.0 1.0 7.0 1996 12.0 1.0 13.01997 6.6 1.3 7.9 1997 7.9 0.0 7.91998 3.1 0.0 3.1 1998 7.3 0.0 7.32000 3.2 0.0 3.2 2000 17.6 0.0 17.62001 1.4 0.0 1.4 2001 7.2 0.0 7.22002 0.0 0.0 0.0 2002 6.3 0.0 6.32003 2.7 1.4 4.1 2003 5.5 0.0 5.52004 1.4 0.0 1.4 2004 4.2 1.4 5.62005 0.0 0.0 0.0 2005 6.9 0.0 6.92006 2.3 0.0 2.3 2006 13.6 1.1 14.7
SOURCE: Alaska Department of Fish and Game, Division of Subsistence, Household Surveys 1992-1998;ANHSC Household Surveys, 2000-2007.
C - 58
0
1
2
3
4
5
6
7
8
9
Jan Feb Mar Apr May Jun Jul Aug Sep Oct Nov Dec
Seas
onal
ly A
djus
ted
Tota
l Tak
e
Sea Lion Harbor Seal
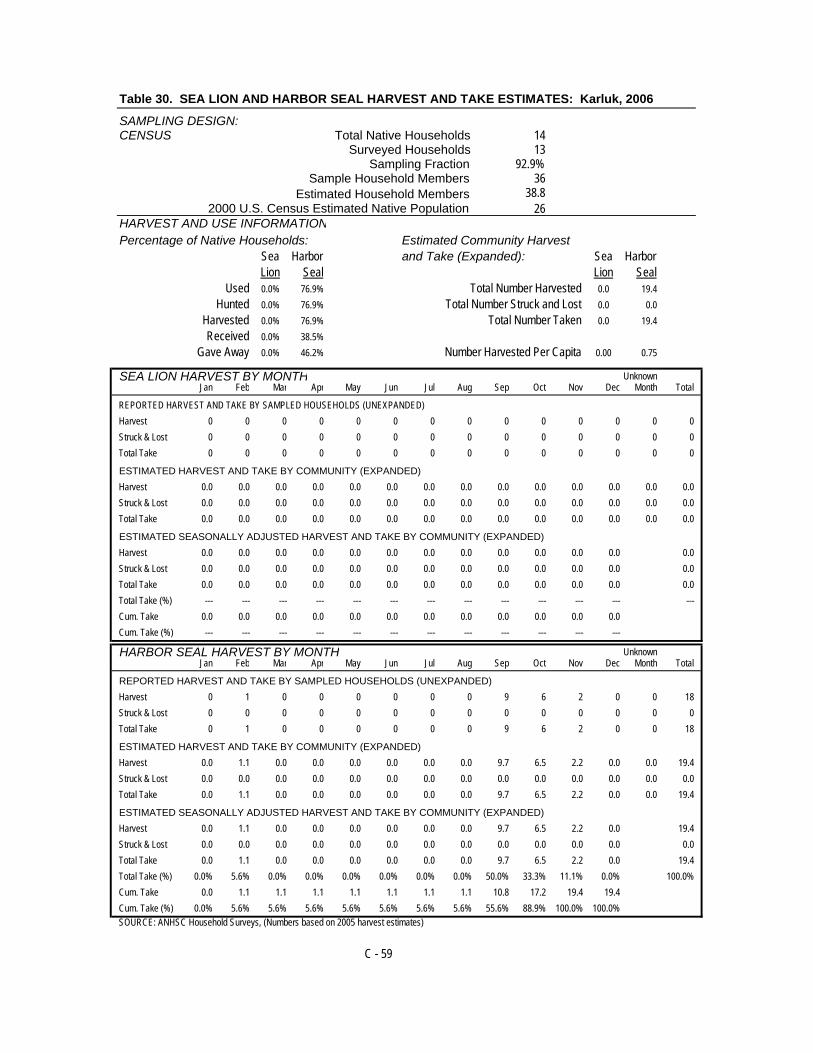
Table 30. SEA LION AND HARBOR SEAL HARVEST AND TAKE ESTIMATES: Karluk, 2006
SAMPLING DESIGN: CENSUS Total Native Households 14
Surveyed Households 13Sampling Fraction 92.9%
Sample Household Members 36Estimated Household Members 38.8
2000 U.S. Census Estimated Native Population 26HARVEST AND USE INFORMATION
Percentage of Native Households: Estimated Community Harvest Sea Harbor and Take (Expanded): Sea Harbor
Lion Seal Lion SealUsed 0.0% 76.9% Total Number Harvested 0.0 19.4
Hunted 0.0% 76.9% Total Number Struck and Lost 0.0 0.0Harvested 0.0% 76.9% Total Number Taken 0.0 19.4Received 0.0% 38.5%
Gave Away 0.0% 46.2% Number Harvested Per Capita 0.00 0.75
SEA LION HARVEST BY MONTH UnknownJan Feb Mar Apr May Jun Jul Aug Sep Oct Nov Dec Month Total
REPORTED HARVEST AND TAKE BY SAMPLED HOUSEHOLDS (UNEXPANDED)Harvest 0 0 0 0 0 0 0 0 0 0 0 0 0 0Struck & Lost 0 0 0 0 0 0 0 0 0 0 0 0 0 0Total Take 0 0 0 0 0 0 0 0 0 0 0 0 0 0
ESTIMATED HARVEST AND TAKE BY COMMUNITY (EXPANDED)Harvest 0.0 0.0 0.0 0.0 0.0 0.0 0.0 0.0 0.0 0.0 0.0 0.0 0.0 0.0Struck & Lost 0.0 0.0 0.0 0.0 0.0 0.0 0.0 0.0 0.0 0.0 0.0 0.0 0.0 0.0Total Take 0.0 0.0 0.0 0.0 0.0 0.0 0.0 0.0 0.0 0.0 0.0 0.0 0.0 0.0
ESTIMATED SEASONALLY ADJUSTED HARVEST AND TAKE BY COMMUNITY (EXPANDED)Harvest 0.0 0.0 0.0 0.0 0.0 0.0 0.0 0.0 0.0 0.0 0.0 0.0 0.0Struck & Lost 0.0 0.0 0.0 0.0 0.0 0.0 0.0 0.0 0.0 0.0 0.0 0.0 0.0Total Take 0.0 0.0 0.0 0.0 0.0 0.0 0.0 0.0 0.0 0.0 0.0 0.0 0.0Total Take (%) --- --- --- --- --- --- --- --- --- --- --- --- ---Cum. Take 0.0 0.0 0.0 0.0 0.0 0.0 0.0 0.0 0.0 0.0 0.0 0.0Cum. Take (%) --- --- --- --- --- --- --- --- --- --- --- ---
HARBOR SEAL HARVEST BY MONTH UnknownJan Feb Mar Apr May Jun Jul Aug Sep Oct Nov Dec Month Total
REPORTED HARVEST AND TAKE BY SAMPLED HOUSEHOLDS (UNEXPANDED)Harvest 0 1 0 0 0 0 0 0 9 6 2 0 0 18Struck & Lost 0 0 0 0 0 0 0 0 0 0 0 0 0 0Total Take 0 1 0 0 0 0 0 0 9 6 2 0 0 18
ESTIMATED HARVEST AND TAKE BY COMMUNITY (EXPANDED)Harvest 0.0 1.1 0.0 0.0 0.0 0.0 0.0 0.0 9.7 6.5 2.2 0.0 0.0 19.4Struck & Lost 0.0 0.0 0.0 0.0 0.0 0.0 0.0 0.0 0.0 0.0 0.0 0.0 0.0 0.0Total Take 0.0 1.1 0.0 0.0 0.0 0.0 0.0 0.0 9.7 6.5 2.2 0.0 0.0 19.4
ESTIMATED SEASONALLY ADJUSTED HARVEST AND TAKE BY COMMUNITY (EXPANDED)Harvest 0.0 1.1 0.0 0.0 0.0 0.0 0.0 0.0 9.7 6.5 2.2 0.0 19.4Struck & Lost 0.0 0.0 0.0 0.0 0.0 0.0 0.0 0.0 0.0 0.0 0.0 0.0 0.0Total Take 0.0 1.1 0.0 0.0 0.0 0.0 0.0 0.0 9.7 6.5 2.2 0.0 19.4Total Take (%) 0.0% 5.6% 0.0% 0.0% 0.0% 0.0% 0.0% 0.0% 50.0% 33.3% 11.1% 0.0% 100.0%Cum. Take 0.0 1.1 1.1 1.1 1.1 1.1 1.1 1.1 10.8 17.2 19.4 19.4Cum. Take (%) 0.0% 5.6% 5.6% 5.6% 5.6% 5.6% 5.6% 5.6% 55.6% 88.9% 100.0% 100.0% SOURCE: ANHSC Household Surveys, (Numbers based on 2005 harvest estimates)
C - 59
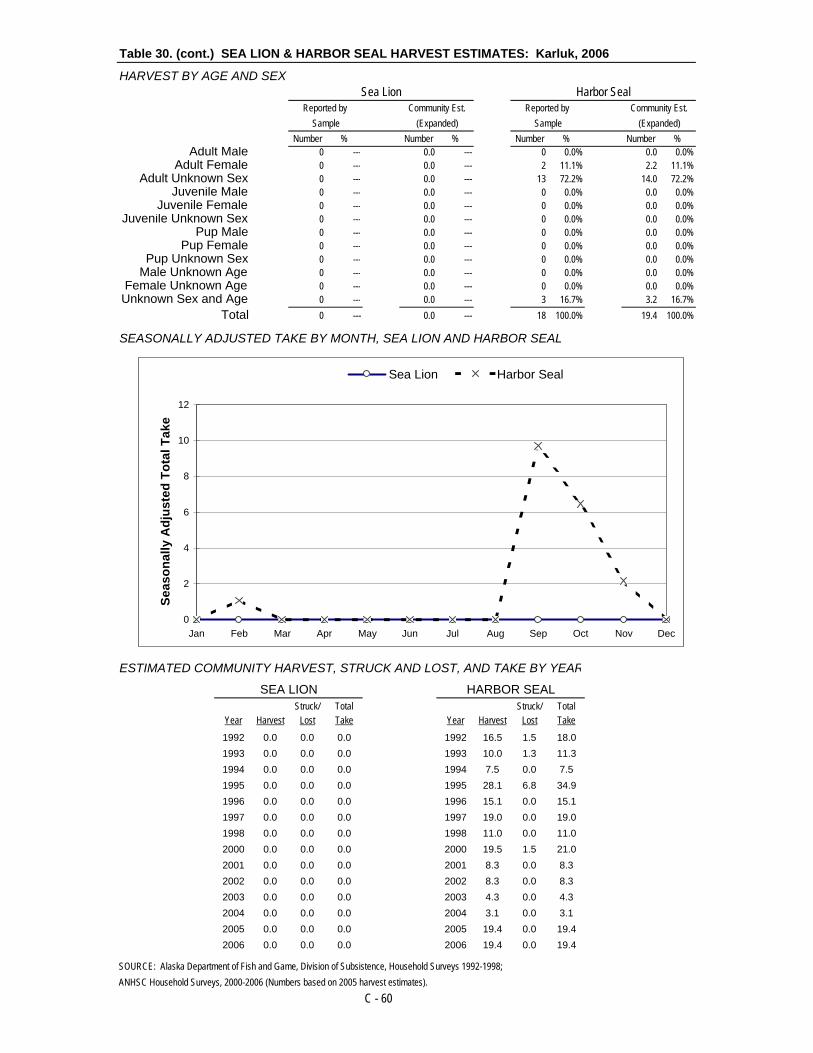
Table 30. (cont.) SEA LION & HARBOR SEAL HARVEST ESTIMATES: Karluk, 2006
HARVEST BY AGE AND SEXSea Lion Harbor Seal
Reported by Community Est. Reported by Community Est.Sample (Expanded) Sample (Expanded)
Number % Number % Number % Number %Adult Male 0 --- 0.0 --- 0 0.0% 0.0 0.0%
Adult Female 0 --- 0.0 --- 2 11.1% 2.2 11.1%Adult Unknown Sex 0 --- 0.0 --- 13 72.2% 14.0 72.2%
Juvenile Male 0 --- 0.0 --- 0 0.0% 0.0 0.0%Juvenile Female 0 --- 0.0 --- 0 0.0% 0.0 0.0%
Juvenile Unknown Sex 0 --- 0.0 --- 0 0.0% 0.0 0.0%Pup Male 0 --- 0.0 --- 0 0.0% 0.0 0.0%
Pup Female 0 --- 0.0 --- 0 0.0% 0.0 0.0%Pup Unknown Sex 0 --- 0.0 --- 0 0.0% 0.0 0.0%
Male Unknown Age 0 --- 0.0 --- 0 0.0% 0.0 0.0%Female Unknown Age 0 --- 0.0 --- 0 0.0% 0.0 0.0%
Unknown Sex and Age 0 --- 0.0 --- 3 16.7% 3.2 16.7%Total 0 --- 0.0 --- 18 100.0% 19.4 100.0%
SEASONALLY ADJUSTED TAKE BY MONTH, SEA LION AND HARBOR SEAL
ESTIMATED COMMUNITY HARVEST, STRUCK AND LOST, AND TAKE BY YEAR
SEA LION HARBOR SEALStruck/ Total Struck/ Total
Year Harvest Lost Take Year Harvest Lost Take
1992 0.0 0.0 0.0 1992 16.5 1.5 18.01993 0.0 0.0 0.0 1993 10.0 1.3 11.31994 0.0 0.0 0.0 1994 7.5 0.0 7.51995 0.0 0.0 0.0 1995 28.1 6.8 34.91996 0.0 0.0 0.0 1996 15.1 0.0 15.11997 0.0 0.0 0.0 1997 19.0 0.0 19.01998 0.0 0.0 0.0 1998 11.0 0.0 11.02000 0.0 0.0 0.0 2000 19.5 1.5 21.02001 0.0 0.0 0.0 2001 8.3 0.0 8.32002 0.0 0.0 0.0 2002 8.3 0.0 8.32003 0.0 0.0 0.0 2003 4.3 0.0 4.32004 0.0 0.0 0.0 2004 3.1 0.0 3.12005 0.0 0.0 0.0 2005 19.4 0.0 19.42006 0.0 0.0 0.0 2006 19.4 0.0 19.4
SOURCE: Alaska Department of Fish and Game, Division of Subsistence, Household Surveys 1992-1998;ANHSC Household Surveys, 2000-2006 (Numbers based on 2005 harvest estimates).
C - 60
0
2
4
6
8
10
12
Jan Feb Mar Apr May Jun Jul Aug Sep Oct Nov Dec
Seas
onal
ly A
djus
ted
Tota
l Tak
e
Sea Lion Harbor Seal

Table 31. SEA LION AND HARBOR SEAL HARVEST AND TAKE ESTIMATES: Kodiak City, 2006
SAMPLING DESIGN: CHAIN REFERRAL Total Referred Households 17
Surveyed Households 11Sampling Fraction 64.7%
Sample Household Members 34Estimated Household Members 52.5
2000 U.S. Census Estimated Native Population 829HARVEST AND USE INFORMATION
Percentage of Sample Households: Estimated Community Harvest Sea Harbor and Take (Expanded): Sea Harbor
Lion Seal Lion SealUsed 0.0% 54.5% Total Number Harvested 0.0 10.8
Hunted 0.0% 27.3% Total Number Struck and Lost 0.0 0.0Harvested 0.0% 27.3% Total Number Taken 0.0 10.8Received 0.0% 27.3%
Gave Away 0.0% 18.2% Number Harvested Per Capita 0.00 0.01
SEA LION HARVEST BY MONTH UnknownJan Feb Mar Apr May Jun Jul Aug Sep Oct Nov Dec Month Total
REPORTED HARVEST AND TAKE BY SAMPLED HOUSEHOLDS (UNEXPANDED)Harvest 0 0 0 0 0 0 0 0 0 0 0 0 0 0Struck & Lost 0 0 0 0 0 0 0 0 0 0 0 0 0 0Total Take 0 0 0 0 0 0 0 0 0 0 0 0 0 0
ESTIMATED HARVEST AND TAKE BY COMMUNITY (EXPANDED)Harvest 0.0 0.0 0.0 0.0 0.0 0.0 0.0 0.0 0.0 0.0 0.0 0.0 0.0 0.0Struck & Lost 0.0 0.0 0.0 0.0 0.0 0.0 0.0 0.0 0.0 0.0 0.0 0.0 0.0 0.0Total Take 0.0 0.0 0.0 0.0 0.0 0.0 0.0 0.0 0.0 0.0 0.0 0.0 0.0 0.0
ESTIMATED SEASONALLY ADJUSTED HARVEST AND TAKE BY COMMUNITY (EXPANDED)Harvest 0.0 0.0 0.0 0.0 0.0 0.0 0.0 0.0 0.0 0.0 0.0 0.0 0.0Struck & Lost 0.0 0.0 0.0 0.0 0.0 0.0 0.0 0.0 0.0 0.0 0.0 0.0 0.0Total Take 0.0 0.0 0.0 0.0 0.0 0.0 0.0 0.0 0.0 0.0 0.0 0.0 0.0Total Take (%) --- --- --- --- --- --- --- --- --- --- --- --- ---Cum. Take 0.0 0.0 0.0 0.0 0.0 0.0 0.0 0.0 0.0 0.0 0.0 0.0Cum. Take (%) --- --- --- --- --- --- --- --- --- --- --- ---
HARBOR SEAL HARVEST BY MONTH UnknownJan Feb Mar Apr May Jun Jul Aug Sep Oct Nov Dec Month Total
REPORTED HARVEST AND TAKE BY SAMPLED HOUSEHOLDS (UNEXPANDED)Harvest 0 0 0 0 0 0 0 2 2 3 0 0 0 7Struck & Lost 0 0 0 0 0 0 0 0 0 0 0 0 0 0Total Take 0 0 0 0 0 0 0 2 2 3 0 0 0 7
ESTIMATED HARVEST AND TAKE BY COMMUNITY (EXPANDED)Harvest 0.0 0.0 0.0 0.0 0.0 0.0 0.0 3.1 3.1 4.6 0.0 0.0 0.0 10.8Struck & Lost 0.0 0.0 0.0 0.0 0.0 0.0 0.0 0.0 0.0 0.0 0.0 0.0 0.0 0.0Total Take 0.0 0.0 0.0 0.0 0.0 0.0 0.0 3.1 3.1 4.6 0.0 0.0 0.0 10.8
ESTIMATED SEASONALLY ADJUSTED HARVEST AND TAKE BY COMMUNITY (EXPANDED)Harvest 0.0 0.0 0.0 0.0 0.0 0.0 0.0 3.1 3.1 4.6 0.0 0.0 10.8Struck & Lost 0.0 0.0 0.0 0.0 0.0 0.0 0.0 0.0 0.0 0.0 0.0 0.0 0.0Total Take 0.0 0.0 0.0 0.0 0.0 0.0 0.0 3.1 3.1 4.6 0.0 0.0 10.8Total Take (%) 0.0% 0.0% 0.0% 0.0% 0.0% 0.0% 0.0% 28.6% 28.6% 42.9% 0.0% 0.0% 100.0%Cum. Take 0.0 0.0 0.0 0.0 0.0 0.0 0.0 3.1 6.2 10.8 10.8 10.8Cum. Take (%) 0.0% 0.0% 0.0% 0.0% 0.0% 0.0% 0.0% 28.6% 57.1% 100.0% 100.0% 100.0% SOURCE: ANHSC Household Surveys, (Numbers based on 2005 harvest estimates)
C - 61

Table 31. (cont.) SEA LION & HARBOR SEAL HARVEST ESTIMATES: Kodiak City, 2006
HARVEST BY AGE AND SEXSea Lion Harbor Seal
Reported by Community Est. Reported by Community Est.Sample (Expanded) Sample (Expanded)
Number % Number % Number % Number %Adult Male 0 --- 0.0 --- 5 71.4% 7.7 71.4%
Adult Female 0 --- 0.0 --- 1 14.3% 1.5 14.3%Adult Unknown Sex 0 --- 0.0 --- 0 0.0% 0.0 0.0%
Juvenile Male 0 --- 0.0 --- 0 0.0% 0.0 0.0%Juvenile Female 0 --- 0.0 --- 0 0.0% 0.0 0.0%
Juvenile Unknown Sex 0 --- 0.0 --- 0 0.0% 0.0 0.0%Pup Male 0 --- 0.0 --- 1 14.3% 1.5 14.3%
Pup Female 0 --- 0.0 --- 0 0.0% 0.0 0.0%Pup Unknown Sex 0 --- 0.0 --- 0 0.0% 0.0 0.0%
Male Unknown Age 0 --- 0.0 --- 0 0.0% 0.0 0.0%Female Unknown Age 0 --- 0.0 --- 0 0.0% 0.0 0.0%
Unknown Sex and Age 0 --- 0.0 --- 0 0.0% 0.0 0.0%Total 0 --- 0.0 --- 7 100.0% 10.8 100.0%
SEASONALLY ADJUSTED TAKE BY MONTH, SEA LION AND HARBOR SEAL
ESTIMATED COMMUNITY HARVEST, STRUCK AND LOST, AND TAKE BY YEAR
SEA LION HARBOR SEALStruck/ Total Struck/ Total
Year Harvest Lost Take Year Harvest Lost Take
1992 0.0 0.0 0.0 1992 36.9 0.0 36.91993 0.0 12.7 12.7 1993 6.0 1.0 7.01994 1.1 0.0 1.1 1994 7.6 0.0 7.61995 2.2 0.0 2.2 1995 8.8 0.0 8.81996 3.0 0.0 3.0 1996 9.0 0.0 9.01997 3.0 0.0 3.0 1997 13.0 0.0 13.01998 0.0 1.0 1.0 1998 11.0 0.0 11.02000 2.4 0.0 2.4 2000 21.6 4.8 26.42001 2.5 0.0 2.5 2001 17.5 0.0 17.52002 2.5 0.0 2.5 2002 17.5 0.0 17.52003 0.0 0.0 0.0 2003 32.0 6.0 38.02004 0.0 0.0 0.0 2004 21.0 4.5 25.52005 0.0 0.0 0.0 2005 10.8 0.0 10.82006 0.0 0.0 0.0 2006 10.8 0.0 10.8
SOURCE: Alaska Department of Fish and Game, Division of Subsistence, Household Surveys 1992-1998;ANHSC Household Surveys, 2000-2006 (Numbers based on 2005 harvest estimates).
C - 62
0
1
2
3
4
5
Jan Feb Mar Apr May Jun Jul Aug Sep Oct Nov Dec
Seas
onal
ly A
djus
ted
Tota
l Tak
e
Sea Lion Harbor Seal

Table 32. SEA LION AND HARBOR SEAL HARVEST AND TAKE ESTIMATES: Larsen Bay, 2006
SAMPLING DESIGN: CENSUS Total Native Households 35
Surveyed Households 19Sampling Fraction 54.3%
Sample Household Members 45Estimated Household Members 82.9
2000 U.S. Census Estimated Native Population 91HARVEST AND USE INFORMATION
Percentage of Native Households: Estimated Community Harvest Sea Harbor and Take (Expanded): Sea Harbor
Lion Seal Lion SealUsed 0.0% 57.9% Total Number Harvested 0.0 20.3
Hunted 0.0% 31.6% Total Number Struck and Lost 0.0 0.0Harvested 0.0% 31.6% Total Number Taken 0.0 20.3Received 0.0% 36.8%
Gave Away 0.0% 36.8% Number Harvested Per Capita 0.00 0.22
SEA LION HARVEST BY MONTH UnknownJan Feb Mar Apr May Jun Jul Aug Sep Oct Nov Dec Month Total
REPORTED HARVEST AND TAKE BY SAMPLED HOUSEHOLDS (UNEXPANDED)Harvest 0 0 0 0 0 0 0 0 0 0 0 0 0 0Struck & Lost 0 0 0 0 0 0 0 0 0 0 0 0 0 0Total Take 0 0 0 0 0 0 0 0 0 0 0 0 0 0
ESTIMATED HARVEST AND TAKE BY COMMUNITY (EXPANDED)Harvest 0.0 0.0 0.0 0.0 0.0 0.0 0.0 0.0 0.0 0.0 0.0 0.0 0.0 0.0Struck & Lost 0.0 0.0 0.0 0.0 0.0 0.0 0.0 0.0 0.0 0.0 0.0 0.0 0.0 0.0Total Take 0.0 0.0 0.0 0.0 0.0 0.0 0.0 0.0 0.0 0.0 0.0 0.0 0.0 0.0
ESTIMATED SEASONALLY ADJUSTED HARVEST AND TAKE BY COMMUNITY (EXPANDED)Harvest 0.0 0.0 0.0 0.0 0.0 0.0 0.0 0.0 0.0 0.0 0.0 0.0 0.0Struck & Lost 0.0 0.0 0.0 0.0 0.0 0.0 0.0 0.0 0.0 0.0 0.0 0.0 0.0Total Take 0.0 0.0 0.0 0.0 0.0 0.0 0.0 0.0 0.0 0.0 0.0 0.0 0.0Total Take (%) --- --- --- --- --- --- --- --- --- --- --- --- ---Cum. Take 0.0 0.0 0.0 0.0 0.0 0.0 0.0 0.0 0.0 0.0 0.0 0.0Cum. Take (%) --- --- --- --- --- --- --- --- --- --- --- ---
HARBOR SEAL HARVEST BY MONTH UnknownJan Feb Mar Apr May Jun Jul Aug Sep Oct Nov Dec Month Total
REPORTED HARVEST AND TAKE BY SAMPLED HOUSEHOLDS (UNEXPANDED)Harvest 3 0 2 0 0 1 0 0 1 1 1 2 0 11Struck & Lost 0 0 0 0 0 0 0 0 0 0 0 0 0 0Total Take 3 0 2 0 0 1 0 0 1 1 1 2 0 11
ESTIMATED HARVEST AND TAKE BY COMMUNITY (EXPANDED)Harvest 5.5 0.0 3.7 0.0 0.0 1.8 0.0 0.0 1.8 1.8 1.8 3.7 0.0 20.3Struck & Lost 0.0 0.0 0.0 0.0 0.0 0.0 0.0 0.0 0.0 0.0 0.0 0.0 0.0 0.0Total Take 5.5 0.0 3.7 0.0 0.0 1.8 0.0 0.0 1.8 1.8 1.8 3.7 0.0 20.3
ESTIMATED SEASONALLY ADJUSTED HARVEST AND TAKE BY COMMUNITY (EXPANDED)Harvest 5.5 0.0 3.7 0.0 0.0 1.8 0.0 0.0 1.8 1.8 1.8 3.7 20.3Struck & Lost 0.0 0.0 0.0 0.0 0.0 0.0 0.0 0.0 0.0 0.0 0.0 0.0 0.0Total Take 5.5 0.0 3.7 0.0 0.0 1.8 0.0 0.0 1.8 1.8 1.8 3.7 20.3Total Take (%) 27.3% 0.0% 18.2% 0.0% 0.0% 9.1% 0.0% 0.0% 9.1% 9.1% 9.1% 18.2% 100.0%Cum. Take 5.5 5.5 9.2 9.2 9.2 11.1 11.1 11.1 12.9 14.7 16.6 20.3Cum. Take (%) 27.3% 27.3% 45.5% 45.5% 45.5% 54.5% 54.5% 54.5% 63.6% 72.7% 81.8% 100.0% SOURCE: ANHSC Household Surveys, 2007.
C - 63

Table 32. (cont.) SEA LION & HARBOR SEAL HARVEST ESTIMATES: Larsen Bay, 2006
HARVEST BY AGE AND SEXSea Lion Harbor Seal
Reported by Community Est. Reported by Community Est.Sample (Expanded) Sample (Expanded)
Number % Number % Number % Number %Adult Male 0 --- 0.0 --- 9 81.8% 16.6 81.8%
Adult Female 0 --- 0.0 --- 0 0.0% 0.0 0.0%Adult Unknown Sex 0 --- 0.0 --- 2 18.2% 3.7 18.2%
Juvenile Male 0 --- 0.0 --- 0 0.0% 0.0 0.0%Juvenile Female 0 --- 0.0 --- 0 0.0% 0.0 0.0%
Juvenile Unknown Sex 0 --- 0.0 --- 0 0.0% 0.0 0.0%Pup Male 0 --- 0.0 --- 0 0.0% 0.0 0.0%
Pup Female 0 --- 0.0 --- 0 0.0% 0.0 0.0%Pup Unknown Sex 0 --- 0.0 --- 0 0.0% 0.0 0.0%
Male Unknown Age 0 --- 0.0 --- 0 0.0% 0.0 0.0%Female Unknown Age 0 --- 0.0 --- 0 0.0% 0.0 0.0%Unknown Sex and Age 0 --- 0.0 --- 0 0.0% 0.0 0.0%
Total 0 --- 0.0 --- 11 100.0% 20.3 100.0%
SEASONALLY ADJUSTED TAKE BY MONTH, SEA LION AND HARBOR SEAL
ESTIMATED COMMUNITY HARVEST, STRUCK AND LOST, AND TAKE BY YEAR
SEA LION HARBOR SEALStruck/ Total Struck/ Total
Year Harvest Lost Take Year Harvest Lost Take
1992 1.1 0.0 1.1 1992 6.5 0.0 6.51993 0.0 0.0 0.0 1993 7.7 5.5 13.21994 2.2 0.0 2.2 1994 13.4 2.2 15.71995 2.0 1.0 3.0 1995 11.0 0.0 11.01996 0.0 0.0 0.0 1996 15.0 0.0 15.01997 0.0 0.0 0.0 1997 9.8 4.2 13.91998 0.0 0.0 0.0 1998 1.7 0.0 1.72000 0.0 0.0 0.0 2000 18.6 0.0 18.62001 0.0 0.0 0.0 2001 9.0 1.1 10.22002 0.0 0.0 0.0 2002 3.3 0.0 3.32003 0.0 0.0 0.0 2003 2.5 0.0 2.52004 0.0 0.0 0.0 2004 12.5 0.0 12.52005 0.0 0.0 0.0 2005 17.0 0.0 17.02006 0.0 0.0 0.0 2006 20.3 0.0 20.3
SOURCE: Alaska Department of Fish and Game, Division of Subsistence, Household Surveys 1992-1998;ANHSC Household Surveys, 2000-2007.
C - 64
0
1
2
3
4
5
6
Jan Feb Mar Apr May Jun Jul Aug Sep Oct Nov Dec
Seas
onal
ly A
djus
ted
Tota
l Tak
e
Sea Lion Harbor Seal
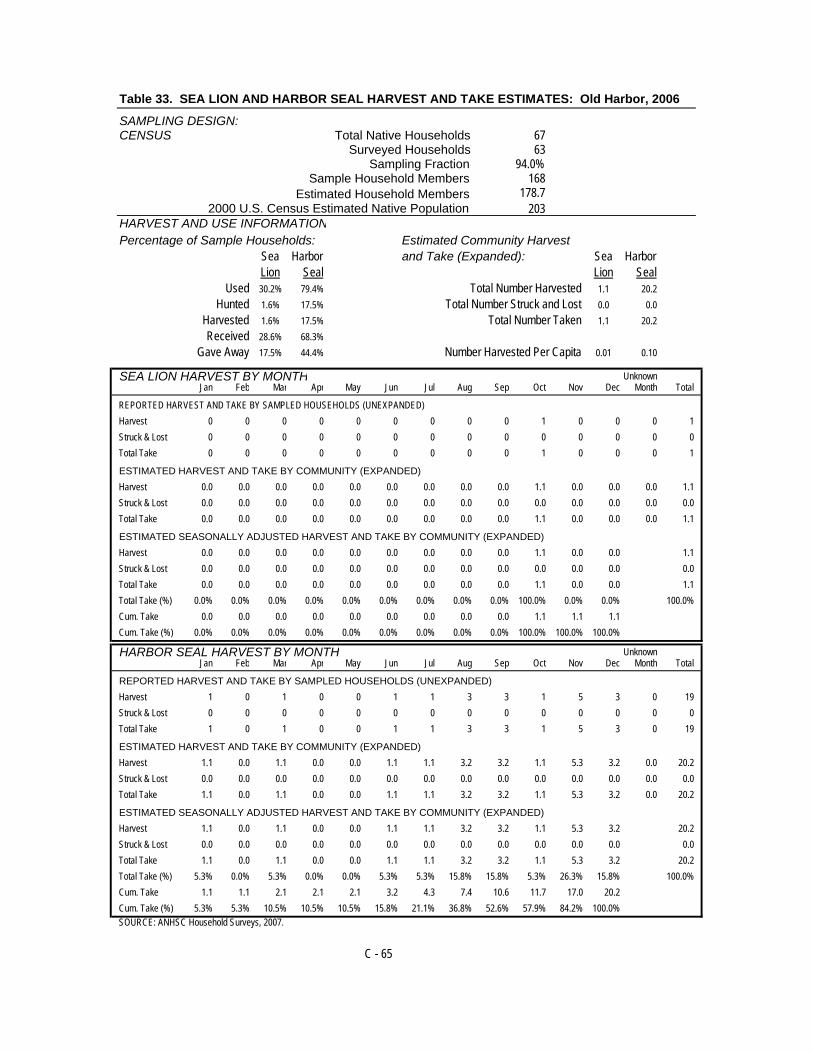
Table 33. SEA LION AND HARBOR SEAL HARVEST AND TAKE ESTIMATES: Old Harbor, 2006
SAMPLING DESIGN: CENSUS Total Native Households 67
Surveyed Households 63Sampling Fraction 94.0%
Sample Household Members 168Estimated Household Members 178.7
2000 U.S. Census Estimated Native Population 203HARVEST AND USE INFORMATION
Percentage of Sample Households: Estimated Community Harvest Sea Harbor and Take (Expanded): Sea Harbor
Lion Seal Lion SealUsed 30.2% 79.4% Total Number Harvested 1.1 20.2
Hunted 1.6% 17.5% Total Number Struck and Lost 0.0 0.0Harvested 1.6% 17.5% Total Number Taken 1.1 20.2Received 28.6% 68.3%
Gave Away 17.5% 44.4% Number Harvested Per Capita 0.01 0.10
SEA LION HARVEST BY MONTH UnknownJan Feb Mar Apr May Jun Jul Aug Sep Oct Nov Dec Month Total
REPORTED HARVEST AND TAKE BY SAMPLED HOUSEHOLDS (UNEXPANDED)Harvest 0 0 0 0 0 0 0 0 0 1 0 0 0 1Struck & Lost 0 0 0 0 0 0 0 0 0 0 0 0 0 0Total Take 0 0 0 0 0 0 0 0 0 1 0 0 0 1
ESTIMATED HARVEST AND TAKE BY COMMUNITY (EXPANDED)Harvest 0.0 0.0 0.0 0.0 0.0 0.0 0.0 0.0 0.0 1.1 0.0 0.0 0.0 1.1Struck & Lost 0.0 0.0 0.0 0.0 0.0 0.0 0.0 0.0 0.0 0.0 0.0 0.0 0.0 0.0Total Take 0.0 0.0 0.0 0.0 0.0 0.0 0.0 0.0 0.0 1.1 0.0 0.0 0.0 1.1
ESTIMATED SEASONALLY ADJUSTED HARVEST AND TAKE BY COMMUNITY (EXPANDED)Harvest 0.0 0.0 0.0 0.0 0.0 0.0 0.0 0.0 0.0 1.1 0.0 0.0 1.1Struck & Lost 0.0 0.0 0.0 0.0 0.0 0.0 0.0 0.0 0.0 0.0 0.0 0.0 0.0Total Take 0.0 0.0 0.0 0.0 0.0 0.0 0.0 0.0 0.0 1.1 0.0 0.0 1.1Total Take (%) 0.0% 0.0% 0.0% 0.0% 0.0% 0.0% 0.0% 0.0% 0.0% 100.0% 0.0% 0.0% 100.0%Cum. Take 0.0 0.0 0.0 0.0 0.0 0.0 0.0 0.0 0.0 1.1 1.1 1.1Cum. Take (%) 0.0% 0.0% 0.0% 0.0% 0.0% 0.0% 0.0% 0.0% 0.0% 100.0% 100.0% 100.0%
HARBOR SEAL HARVEST BY MONTH UnknownJan Feb Mar Apr May Jun Jul Aug Sep Oct Nov Dec Month Total
REPORTED HARVEST AND TAKE BY SAMPLED HOUSEHOLDS (UNEXPANDED)Harvest 1 0 1 0 0 1 1 3 3 1 5 3 0 19Struck & Lost 0 0 0 0 0 0 0 0 0 0 0 0 0 0Total Take 1 0 1 0 0 1 1 3 3 1 5 3 0 19
ESTIMATED HARVEST AND TAKE BY COMMUNITY (EXPANDED)Harvest 1.1 0.0 1.1 0.0 0.0 1.1 1.1 3.2 3.2 1.1 5.3 3.2 0.0 20.2Struck & Lost 0.0 0.0 0.0 0.0 0.0 0.0 0.0 0.0 0.0 0.0 0.0 0.0 0.0 0.0Total Take 1.1 0.0 1.1 0.0 0.0 1.1 1.1 3.2 3.2 1.1 5.3 3.2 0.0 20.2
ESTIMATED SEASONALLY ADJUSTED HARVEST AND TAKE BY COMMUNITY (EXPANDED)Harvest 1.1 0.0 1.1 0.0 0.0 1.1 1.1 3.2 3.2 1.1 5.3 3.2 20.2Struck & Lost 0.0 0.0 0.0 0.0 0.0 0.0 0.0 0.0 0.0 0.0 0.0 0.0 0.0Total Take 1.1 0.0 1.1 0.0 0.0 1.1 1.1 3.2 3.2 1.1 5.3 3.2 20.2Total Take (%) 5.3% 0.0% 5.3% 0.0% 0.0% 5.3% 5.3% 15.8% 15.8% 5.3% 26.3% 15.8% 100.0%Cum. Take 1.1 1.1 2.1 2.1 2.1 3.2 4.3 7.4 10.6 11.7 17.0 20.2Cum. Take (%) 5.3% 5.3% 10.5% 10.5% 10.5% 15.8% 21.1% 36.8% 52.6% 57.9% 84.2% 100.0% SOURCE: ANHSC Household Surveys, 2007.
C - 65

Table 33. (cont.) SEA LION & HARBOR SEAL HARVEST ESTIMATES: Old Harbor, 2006
HARVEST BY AGE AND SEXSea Lion Harbor Seal
Reported by Community Est. Reported by Community Est.Sample (Expanded) Sample (Expanded)
Number % Number % Number % Number %Adult Male 1 100.0% 1.1 100.0% 12 63.2% 12.8 63.2%
Adult Female 0 0.0% 0.0 0.0% 4 21.1% 4.3 21.1%Adult Unknown Sex 0 0.0% 0.0 0.0% 0 0.0% 0.0 0.0%
Juvenile Male 0 0.0% 0.0 0.0% 2 10.5% 2.1 10.5%Juvenile Female 0 0.0% 0.0 0.0% 1 5.3% 1.1 5.3%
Juvenile Unknown Sex 0 0.0% 0.0 0.0% 0 0.0% 0.0 0.0%Pup Male 0 0.0% 0.0 0.0% 0 0.0% 0.0 0.0%
Pup Female 0 0.0% 0.0 0.0% 0 0.0% 0.0 0.0%Pup Unknown Sex 0 0.0% 0.0 0.0% 0 0.0% 0.0 0.0%
Male Unknown Age 0 0.0% 0.0 0.0% 0 0.0% 0.0 0.0%Female Unknown Age 0 0.0% 0.0 0.0% 0 0.0% 0.0 0.0%
Unknown Sex and Age 0 0.0% 0.0 0.0% 0 0.0% 0.0 0.0%Total 1 100.0% 1.1 100.0% 19 100.0% 20.2 100.0%
SEASONALLY ADJUSTED TAKE BY MONTH, SEA LION AND HARBOR SEAL
ESTIMATED COMMUNITY HARVEST, STRUCK AND LOST, AND TAKE BY YEAR
SEA LION HARBOR SEALStruck/ Total Struck/ Total
Year Harvest Lost Take Year Harvest Lost Take
1992 32.9 13.2 46.1 1992 86.8 5.3 92.11993 32.1 1.0 33.2 1993 67.6 2.7 70.31994 46.2 1.3 47.5 1994 83.7 1.3 85.01995 107.1 5.7 112.9 1995 112.0 2.4 114.41996 44.9 5.3 50.2 1996 113.5 1.3 114.81997 22.7 3.6 26.3 1997 80.0 4.8 84.81998 10.3 2.3 12.6 1998 55.1 1.1 56.22000 12.9 0.0 12.9 2000 59.1 0.0 59.12001 26.3 2.2 28.5 2001 71.3 0.0 71.32002 8.5 0.0 8.5 2002 40.5 0.0 40.52003 27.6 4.4 31.9 2003 66.7 2.9 69.62004 8.3 3.5 11.8 2004 37.8 5.9 43.72005 18.2 3.2 21.4 2005 37.5 1.1 38.62006 1.1 0.0 1.1 2006 20.2 0.0 20.2
SOURCE: Alaska Department of Fish and Game, Division of Subsistence, Household Surveys 1992-1998;ANHSC Household Surveys, 2000-2007.
C - 66
0
1
2
3
4
5
6
Jan Feb Mar Apr May Jun Jul Aug Sep Oct Nov Dec
Seas
onal
ly A
djus
ted
Tota
l Tak
e
Sea Lion Harbor Seal

Table 34. SEA LION AND HARBOR SEAL HARVEST AND TAKE ESTIMATES: Ouzinkie, 2006
SAMPLING DESIGN: CHAIN REFERRAL Total Native Households 49
Surveyed Households 43Sampling Fraction 87.8%
Sample Household Members 132Estimated Household Members 150.4
2000 U.S. Census Estimated Native Population 197HARVEST AND USE INFORMATION
Percentage of Sample Households: Estimated Community Harvest Sea Harbor and Take (Expanded): Sea Harbor
Lion Seal Lion SealUsed 0.0% 100.0% Total Number Harvested 0.0 49.0
Hunted 0.0% 67.4% Total Number Struck and Lost 0.0 9.1Harvested 0.0% 41.9% Total Number Taken 0.0 58.1Received 0.0% 86.0%
Gave Away 0.0% 44.2% Number Harvested Per Capita 0.00 0.25
SEA LION HARVEST BY MONTH UnknownJan Feb Mar Apr May Jun Jul Aug Sep Oct Nov Dec Month Total
REPORTED HARVEST AND TAKE BY SAMPLED HOUSEHOLDS (UNEXPANDED)Harvest 0 0 0 0 0 0 0 0 0 0 0 0 0 0Struck & Lost 0 0 0 0 0 0 0 0 0 0 0 0 0 0Total Take 0 0 0 0 0 0 0 0 0 0 0 0 0 0
ESTIMATED HARVEST AND TAKE BY COMMUNITY (EXPANDED)Harvest 0.0 0.0 0.0 0.0 0.0 0.0 0.0 0.0 0.0 0.0 0.0 0.0 0.0 0.0Struck & Lost 0.0 0.0 0.0 0.0 0.0 0.0 0.0 0.0 0.0 0.0 0.0 0.0 0.0 0.0Total Take 0.0 0.0 0.0 0.0 0.0 0.0 0.0 0.0 0.0 0.0 0.0 0.0 0.0 0.0
ESTIMATED SEASONALLY ADJUSTED HARVEST AND TAKE BY COMMUNITY (EXPANDED)Harvest 0.0 0.0 0.0 0.0 0.0 0.0 0.0 0.0 0.0 0.0 0.0 0.0 0.0Struck & Lost 0.0 0.0 0.0 0.0 0.0 0.0 0.0 0.0 0.0 0.0 0.0 0.0 0.0Total Take 0.0 0.0 0.0 0.0 0.0 0.0 0.0 0.0 0.0 0.0 0.0 0.0 0.0Total Take (%) --- --- --- --- --- --- --- --- --- --- --- --- ---Cum. Take 0.0 0.0 0.0 0.0 0.0 0.0 0.0 0.0 0.0 0.0 0.0 0.0Cum. Take (%) --- --- --- --- --- --- --- --- --- --- --- ---
HARBOR SEAL HARVEST BY MONTH UnknownJan Feb Mar Apr May Jun Jul Aug Sep Oct Nov Dec Month Total
REPORTED HARVEST AND TAKE BY SAMPLED HOUSEHOLDS (UNEXPANDED)Harvest 2 2 3 4 2 1 2 3 4 7 8 5 0 43Struck & Lost 1 0 0 0 0 0 0 0 2 2 2 1 0 8Total Take 3 2 3 4 2 1 2 3 6 9 10 6 0 51
ESTIMATED HARVEST AND TAKE BY COMMUNITY (EXPANDED)Harvest 2.3 2.3 3.4 4.6 2.3 1.1 2.3 3.4 4.6 8.0 9.1 5.7 0.0 49.0Struck & Lost 1.1 0.0 0.0 0.0 0.0 0.0 0.0 0.0 2.3 2.3 2.3 1.1 0.0 9.1Total Take 3.4 2.3 3.4 4.6 2.3 1.1 2.3 3.4 6.8 10.3 11.4 6.8 0.0 58.1
ESTIMATED SEASONALLY ADJUSTED HARVEST AND TAKE BY COMMUNITY (EXPANDED)Harvest 2.3 2.3 3.4 4.6 2.3 1.1 2.3 3.4 4.6 8.0 9.1 5.7 49.0Struck & Lost 1.1 0.0 0.0 0.0 0.0 0.0 0.0 0.0 2.3 2.3 2.3 1.1 9.1Total Take 3.4 2.3 3.4 4.6 2.3 1.1 2.3 3.4 6.8 10.3 11.4 6.8 58.1Total Take (%) 5.9% 3.9% 5.9% 7.8% 3.9% 2.0% 3.9% 5.9% 11.8% 17.6% 19.6% 11.8% 100.0%Cum. Take 3.4 5.7 9.1 13.7 16.0 17.1 19.4 22.8 29.6 39.9 51.3 58.1Cum. Take (%) 5.9% 9.8% 15.7% 23.5% 27.5% 29.4% 33.3% 39.2% 51.0% 68.6% 88.2% 100.0% SOURCE: ANHSC Household Surveys, 2007.
C - 67

Table 34. (cont.) SEA LION & HARBOR SEAL HARVEST ESTIMATES: Ouzinkie, 2006
HARVEST BY AGE AND SEXSea Lion Harbor Seal
Reported by Community Est. Reported by Community Est.Sample (Expanded) Sample (Expanded)
Number % Number % Number % Number %Adult Male 0 --- 0.0 --- 21 48.8% 23.9 48.8%
Adult Female 0 --- 0.0 --- 10 23.3% 11.4 23.3%Adult Unknown Sex 0 --- 0.0 --- 11 25.6% 12.5 25.6%
Juvenile Male 0 --- 0.0 --- 1 2.3% 1.1 2.3%Juvenile Female 0 --- 0.0 --- 0 0.0% 0.0 0.0%
Juvenile Unknown Sex 0 --- 0.0 --- 0 0.0% 0.0 0.0%Pup Male 0 --- 0.0 --- 0 0.0% 0.0 0.0%
Pup Female 0 --- 0.0 --- 0 0.0% 0.0 0.0%Pup Unknown Sex 0 --- 0.0 --- 0 0.0% 0.0 0.0%
Male Unknown Age 0 --- 0.0 --- 0 0.0% 0.0 0.0%Female Unknown Age 0 --- 0.0 --- 0 0.0% 0.0 0.0%Unknown Sex and Age 0 --- 0.0 --- 0 0.0% 0.0 0.0%
Total 0 --- 0.0 --- 43 100.0% 49.0 100.0%
SEASONALLY ADJUSTED TAKE BY MONTH, SEA LION AND HARBOR SEAL
ESTIMATED COMMUNITY HARVEST, STRUCK AND LOST, AND TAKE BY YEARSEA LION HARBOR SEAL
Struck/ Total Struck/ TotalYear Harvest Lost Take Year Harvest Lost Take
1992 3.4 0.0 3.4 1992 21.8 1.1 23.01993 5.4 2.2 7.6 1993 41.2 8.7 49.81994 4.4 2.9 7.3 1994 33.4 0.0 33.41995 15.6 0.0 15.6 1995 56.1 0.0 56.11996 0.0 0.0 0.0 1996 16.7 2.6 19.31997 0.0 0.0 0.0 1997 55.2 9.4 64.61998 0.0 0.0 0.0 1998 82.0 2.5 84.52000 0.0 0.0 0.0 2000 43.0 1.0 44.02001 2.6 0.0 2.6 2001 33.4 2.6 36.02002 5.1 0.0 5.1 2002 63.4 10.2 73.62003 0.0 0.0 0.0 2003 48.8 4.1 52.82004 2.6 0.0 2.6 2004 73.0 3.9 76.92005 0.0 0.0 0.0 2005 136.6 9.5 146.12006 0.0 0.0 0.0 2006 49.0 9.1 58.1
SOURCE: Alaska Department of Fish and Game, Division of Subsistence, Household Surveys 1992-1998;ANHSC Household Surveys, 2000-2007.
C - 68
0
2
4
6
8
10
12
Jan Feb Mar Apr May Jun Jul Aug Sep Oct Nov Dec
Seas
onal
ly A
djus
ted
Tota
l Tak
e
Sea Lion Harbor Seal

Table 35. SEA LION AND HARBOR SEAL HARVEST AND TAKE ESTIMATES: Port Lions, 2006
SAMPLING DESIGN: CHAIN REFERRAL Total Referred Households 11
Surveyed Households 3Sampling Fraction
Sample Household Members 13Estimated Household Members 47.7
2000 U.S. Census Estimated Native Population 163HARVEST AND USE INFORMATION
Percentage of Sample Households: Estimated Community Harvest Sea Harbor and Take (Expanded): Sea Harbor
Lion Seal Lion SealUsed 33.3% 100.0% Total Number Harvested 3.7 77.0
Hunted 33.3% 66.7% Total Number Struck and Lost 0.0 0.0Harvested 33.3% 66.7% Total Number Taken 3.7 77.0Received 0.0% 66.7%
Gave Away 0.0% 66.7% Number Harvested Per Capita 0.02 0.47
SEA LION HARVEST BY MONTH UnknownJan Feb Mar Apr May Jun Jul Aug Sep Oct Nov Dec Month Total
REPORTED HARVEST AND TAKE BY SAMPLED HOUSEHOLDS (UNEXPANDED)Harvest 1 0 0 0 0 0 0 0 0 0 0 0 0 1Struck & Lost 0 0 0 0 0 0 0 0 0 0 0 0 0 0Total Take 1 0 0 0 0 0 0 0 0 0 0 0 0 1
ESTIMATED HARVEST AND TAKE BY COMMUNITY (EXPANDED)Harvest 3.7 0.0 0.0 0.0 0.0 0.0 0.0 0.0 0.0 0.0 0.0 0.0 0.0 3.7Struck & Lost 0.0 0.0 0.0 0.0 0.0 0.0 0.0 0.0 0.0 0.0 0.0 0.0 0.0 0.0Total Take 3.7 0.0 0.0 0.0 0.0 0.0 0.0 0.0 0.0 0.0 0.0 0.0 0.0 3.7
ESTIMATED SEASONALLY ADJUSTED HARVEST AND TAKE BY COMMUNITY (EXPANDED)Harvest 3.7 0.0 0.0 0.0 0.0 0.0 0.0 0.0 0.0 0.0 0.0 0.0 3.7Struck & Lost 0.0 0.0 0.0 0.0 0.0 0.0 0.0 0.0 0.0 0.0 0.0 0.0 0.0Total Take 3.7 0.0 0.0 0.0 0.0 0.0 0.0 0.0 0.0 0.0 0.0 0.0 3.7Total Take (%) 100.0% 0.0% 0.0% 0.0% 0.0% 0.0% 0.0% 0.0% 0.0% 0.0% 0.0% 0.0% 100.0%Cum. Take 3.7 3.7 3.7 3.7 3.7 3.7 3.7 3.7 3.7 3.7 3.7 3.7Cum. Take (%) 100.0% 100.0% 100.0% 100.0% 100.0% 100.0% 100.0% 100.0% 100.0% 100.0% 100.0% 100.0%
HARBOR SEAL HARVEST BY MONTH UnknownJan Feb Mar Apr May Jun Jul Aug Sep Oct Nov Dec Month Total
REPORTED HARVEST AND TAKE BY SAMPLED HOUSEHOLDS (UNEXPANDED)Harvest 1 1 1 1 1 2 0 1 3 2 5 3 0 21Struck & Lost 0 0 0 0 0 0 0 0 0 0 0 0 0 0Total Take 1 1 1 1 1 2 0 1 3 2 5 3 0 21
ESTIMATED HARVEST AND TAKE BY COMMUNITY (EXPANDED)Harvest 3.7 3.7 3.7 3.7 3.7 7.3 0.0 3.7 11.0 7.3 18.3 11.0 0.0 77.0Struck & Lost 0.0 0.0 0.0 0.0 0.0 0.0 0.0 0.0 0.0 0.0 0.0 0.0 0.0 0.0Total Take 3.7 3.7 3.7 3.7 3.7 7.3 0.0 3.7 11.0 7.3 18.3 11.0 0.0 77.0
ESTIMATED SEASONALLY ADJUSTED HARVEST AND TAKE BY COMMUNITY (EXPANDED)Harvest 3.7 3.7 3.7 3.7 3.7 7.3 0.0 3.7 11.0 7.3 18.3 11.0 77.0Struck & Lost 0.0 0.0 0.0 0.0 0.0 0.0 0.0 0.0 0.0 0.0 0.0 0.0 0.0Total Take 3.7 3.7 3.7 3.7 3.7 7.3 0.0 3.7 11.0 7.3 18.3 11.0 77.0Total Take (%) 4.8% 4.8% 4.8% 4.8% 4.8% 9.5% 0.0% 4.8% 14.3% 9.5% 23.8% 14.3% 100.0%Cum. Take 3.7 7.3 11.0 14.7 18.3 25.7 25.7 29.3 40.3 47.7 66.0 77.0Cum. Take (%) 4.8% 9.5% 14.3% 19.0% 23.8% 33.3% 33.3% 38.1% 52.4% 61.9% 85.7% 100.0% SOURCE: ANHSC Household Surveys, (Numbers based on 2005 harvest estimates).
C - 69
27.3%

Table 35. (cont.) SEA LION & HARBOR SEAL HARVEST ESTIMATES: Port Lions, 2006
HARVEST BY AGE AND SEXSea Lion Harbor Seal
Reported by Community Est. Reported by Community Est.Sample (Expanded) Sample (Expanded)
Number % Number % Number % Number %Adult Male 0 0.0% 0.0 0.0% 18 85.7% 66.0 85.7%
Adult Female 0 0.0% 0.0 0.0% 3 14.3% 11.0 14.3%Adult Unknown Sex 0 0.0% 0.0 0.0% 0 0.0% 0.0 0.0%
Juvenile Male 1 100.0% 3.7 100.0% 0 0.0% 0.0 0.0%Juvenile Female 0 0.0% 0.0 0.0% 0 0.0% 0.0 0.0%
Juvenile Unknown Sex 0 0.0% 0.0 0.0% 0 0.0% 0.0 0.0%Pup Male 0 0.0% 0.0 0.0% 0 0.0% 0.0 0.0%
Pup Female 0 0.0% 0.0 0.0% 0 0.0% 0.0 0.0%Pup Unknown Sex 0 0.0% 0.0 0.0% 0 0.0% 0.0 0.0%
Male Unknown Age 0 0.0% 0.0 0.0% 0 0.0% 0.0 0.0%Female Unknown Age 0 0.0% 0.0 0.0% 0 0.0% 0.0 0.0%Unknown Sex and Age 0 0.0% 0.0 0.0% 0 0.0% 0.0 0.0%
Total 1 100.0% 3.7 100.0% 21 100.0% 77.0 100.0%
SEASONALLY ADJUSTED TAKE BY MONTH, SEA LION AND HARBOR SEAL
ESTIMATED COMMUNITY HARVEST, STRUCK AND LOST, AND TAKE BY YEAR
SEA LION HARBOR SEALStruck/ Total Struck/ Total
Year Harvest Lost Take Year Harvest Lost Take
1992 1.1 2.2 3.3 1992 36.9 2.2 39.11993 4.0 1.0 5.0 1993 26.0 1.0 27.01994 0.0 0.0 0.0 1994 8.0 0.0 8.01995 0.0 0.0 0.0 1995 2.0 0.0 2.01996 0.0 0.0 0.0 1996 4.0 0.0 4.01997 1.0 0.0 1.0 1997 5.0 0.0 5.01998 1.0 0.0 1.0 1998 6.0 0.0 6.02000 0.0 0.0 0.0 2000 6.4 0.0 6.42001 0.0 0.0 0.0 2001 8.8 1.1 9.92002 0.0 0.0 0.0 2002 13.0 0.0 13.02003 0.0 0.0 0.0 2003 12.9 0.0 12.92004 1.2 0.0 1.2 2004 20.6 0.0 20.62005 3.7 0.0 3.7 2005 77.0 0.0 77.02006 3.7 0.0 3.7 2006 77.0 0.0 77.0
SOURCE: Alaska Department of Fish and Game, Division of Subsistence, Household Surveys 1992-1998;ANHSC Household Surveys, 2000-2006 (Numbers based on 2005 harvest estimates).
C - 70
0
2
4
6
8
10
12
14
16
18
20
Jan Feb Mar Apr May Jun Jul Aug Sep Oct Nov Dec
Seas
onal
ly A
djus
ted
Tota
l Tak
e
Sea Lion Harbor Seal

Table 36. SEA LION AND HARBOR SEAL HARVEST AND TAKE ESTIMATES: Chignik Bay, 2006
SAMPLING DESIGN: CENSUS Total Native Households 23
Surveyed Households 16Sampling Fraction 69.6%
Sample Household Members 39Estimated Household Members 56.1
2000 U.S. Census Estimated Native Population 48HARVEST AND USE INFORMATION
Percentage of Native Households: Estimated Community Harvest Sea Harbor and Take (Expanded): Sea Harbor
Lion Seal Lion SealUsed 0.0% 18.8% Total Number Harvested 0.0 4.3
Hunted 0.0% 12.5% Total Number Struck and Lost 0.0 1.4Harvested 0.0% 12.5% Total Number Taken 0.0 5.8Received 0.0% 12.5%
Gave Away 0.0% 6.3% Number Harvested Per Capita 0.00 0.09
SEA LION HARVEST BY MONTH UnknownJan Feb Mar Apr May Jun Jul Aug Sep Oct Nov Dec Month Total
REPORTED HARVEST AND TAKE BY SAMPLED HOUSEHOLDS (UNEXPANDED)Harvest 0 0 0 0 0 0 0 0 0 0 0 0 0 0Struck & Lost 0 0 0 0 0 0 0 0 0 0 0 0 0 0Total Take 0 0 0 0 0 0 0 0 0 0 0 0 0 0
ESTIMATED HARVEST AND TAKE BY COMMUNITY (EXPANDED)Harvest 0.0 0.0 0.0 0.0 0.0 0.0 0.0 0.0 0.0 0.0 0.0 0.0 0.0 0.0Struck & Lost 0.0 0.0 0.0 0.0 0.0 0.0 0.0 0.0 0.0 0.0 0.0 0.0 0.0 0.0Total Take 0.0 0.0 0.0 0.0 0.0 0.0 0.0 0.0 0.0 0.0 0.0 0.0 0.0 0.0
ESTIMATED SEASONALLY ADJUSTED HARVEST AND TAKE BY COMMUNITY (EXPANDED)Harvest 0.0 0.0 0.0 0.0 0.0 0.0 0.0 0.0 0.0 0.0 0.0 0.0 0.0Struck & Lost 0.0 0.0 0.0 0.0 0.0 0.0 0.0 0.0 0.0 0.0 0.0 0.0 0.0Total Take 0.0 0.0 0.0 0.0 0.0 0.0 0.0 0.0 0.0 0.0 0.0 0.0 0.0Total Take (%) --- --- --- --- --- --- --- --- --- --- --- --- ---Cum. Take 0.0 0.0 0.0 0.0 0.0 0.0 0.0 0.0 0.0 0.0 0.0 0.0Cum. Take (%) --- --- --- --- --- --- --- --- --- --- --- ---
HARBOR SEAL HARVEST BY MONTH UnknownJan Feb Mar Apr May Jun Jul Aug Sep Oct Nov Dec Month Total
REPORTED HARVEST AND TAKE BY SAMPLED HOUSEHOLDS (UNEXPANDED)Harvest 0 0 0 0 0 0 0 0 0 1 1 1 0 3Struck & Lost 0 0 0 0 0 0 0 0 0 0 1 0 0 1Total Take 0 0 0 0 0 0 0 0 0 1 2 1 0 4
ESTIMATED HARVEST AND TAKE BY COMMUNITY (EXPANDED)Harvest 0.0 0.0 0.0 0.0 0.0 0.0 0.0 0.0 0.0 1.4 1.4 1.4 0.0 4.3Struck & Lost 0.0 0.0 0.0 0.0 0.0 0.0 0.0 0.0 0.0 0.0 1.4 0.0 0.0 1.4Total Take 0.0 0.0 0.0 0.0 0.0 0.0 0.0 0.0 0.0 1.4 2.9 1.4 0.0 5.8
ESTIMATED SEASONALLY ADJUSTED HARVEST AND TAKE BY COMMUNITY (EXPANDED)Harvest 0.0 0.0 0.0 0.0 0.0 0.0 0.0 0.0 0.0 1.4 1.4 1.4 4.3Struck & Lost 0.0 0.0 0.0 0.0 0.0 0.0 0.0 0.0 0.0 0.0 1.4 0.0 1.4Total Take 0.0 0.0 0.0 0.0 0.0 0.0 0.0 0.0 0.0 1.4 2.9 1.4 5.8Total Take (%) 0.0% 0.0% 0.0% 0.0% 0.0% 0.0% 0.0% 0.0% 0.0% 25.0% 50.0% 25.0% 100.0%Cum. Take 0.0 0.0 0.0 0.0 0.0 0.0 0.0 0.0 0.0 1.4 4.3 5.8Cum. Take (%) 0.0% 0.0% 0.0% 0.0% 0.0% 0.0% 0.0% 0.0% 0.0% 25.0% 75.0% 100.0% SOURCE: BBNA Household Surveys, 2007.
C - 71

Table 36. (cont.) SEA LION & HARBOR SEAL HARVEST ESTIMATES: Chignik Bay, 2006
HARVEST BY AGE AND SEXSea Lion Harbor Seal
Reported by Community Est. Reported by Community Est.Sample (Expanded) Sample (Expanded)
Number % Number % Number % Number %Adult Male 0 --- 0.0 --- 3 100.0% 4.3 100.0%
Adult Female 0 --- 0.0 --- 0 0.0% 0.0 0.0%Adult Unknown Sex 0 --- 0.0 --- 0 0.0% 0.0 0.0%
Juvenile Male 0 --- 0.0 --- 0 0.0% 0.0 0.0%Juvenile Female 0 --- 0.0 --- 0 0.0% 0.0 0.0%
Juvenile Unknown Sex 0 --- 0.0 --- 0 0.0% 0.0 0.0%Pup Male 0 --- 0.0 --- 0 0.0% 0.0 0.0%
Pup Female 0 --- 0.0 --- 0 0.0% 0.0 0.0%Pup Unknown Sex 0 --- 0.0 --- 0 0.0% 0.0 0.0%
Male Unknown Age 0 --- 0.0 --- 0 0.0% 0.0 0.0%Female Unknown Age 0 --- 0.0 --- 0 0.0% 0.0 0.0%Unknown Sex and Age 0 --- 0.0 --- 0 0.0% 0.0 0.0%
Total 0 --- 0.0 --- 3 100.0% 4.3 100.0%
SEASONALLY ADJUSTED TAKE BY MONTH, SEA LION AND HARBOR SEAL
ESTIMATED COMMUNITY HARVEST, STRUCK AND LOST, AND TAKE BY YEAR
SEA LION HARBOR SEALStruck/ Total Struck/ Total
Year Harvest Lost Take Year Harvest Lost Take
1992 0.0 0.0 0.0 1992 2.4 1.2 3.61993 0.0 0.0 0.0 1993 6.3 5.0 11.31994 0.0 0.0 0.0 1994 3.4 0.0 3.41995 0.0 0.0 0.0 1995 0.0 0.0 0.01996 0.0 0.0 0.0 1996 1.0 0.0 1.01997 0.0 0.0 0.0 1997 0.0 0.0 0.01998 0.0 0.0 0.0 1998 0.0 0.0 0.02000 0.0 0.0 0.0 2000 0.0 0.0 0.02001 0.0 0.0 0.0 2001 0.0 0.0 0.02002 0.0 0.0 0.0 2002 1.3 0.0 1.32003 0.0 0.0 0.0 2003 2.8 0.0 2.82004 0.0 0.0 0.0 2004 0.0 0.0 0.02005 0.0 0.0 0.0 2005 0.0 0.0 0.02006 0.0 0.0 0.0 2006 4.3 1.4 5.8
SOURCE: Alaska Department of Fish and Game, Division of Subsistence, Household Surveys 1992-1998;BBNA Household Surveys, 2000-2007.
C - 72
0
1
2
3
4
Jan Feb Mar Apr May Jun Jul Aug Sep Oct Nov Dec
Seas
onal
ly A
djus
ted
Tota
l Tak
e
Sea Lion Harbor Seal

Table 37. SEA LION AND HARBOR SEAL HARVEST / TAKE ESTIMATES: Chignik Lagoon, 2006
SAMPLING DESIGN: CENSUS Total Native Households 19
Surveyed Households 16Sampling Fraction 84.2%
Sample Household Members 46Estimated Household Members 54.6
2000 U.S. Census Estimated Native Population 85HARVEST AND USE INFORMATION
Percentage of Native Households: Estimated Community Harvest Sea Harbor and Take (Expanded): Sea Harbor
Lion Seal Lion SealUsed 0.0% 0.0% Total Number Harvested 0.0 0.0
Hunted 0.0% 0.0% Total Number Struck and Lost 0.0 0.0Harvested 0.0% 0.0% Total Number Taken 0.0 0.0Received 0.0% 0.0%
Gave Away 0.0% 0.0% Number Harvested Per Capita 0.00 0.00
SEA LION HARVEST BY MONTH UnknownJan Feb Mar Apr May Jun Jul Aug Sep Oct Nov Dec Month Total
REPORTED HARVEST AND TAKE BY SAMPLED HOUSEHOLDS (UNEXPANDED)Harvest 0 0 0 0 0 0 0 0 0 0 0 0 0 0Struck & Lost 0 0 0 0 0 0 0 0 0 0 0 0 0 0Total Take 0 0 0 0 0 0 0 0 0 0 0 0 0 0
ESTIMATED HARVEST AND TAKE BY COMMUNITY (EXPANDED)Harvest 0.0 0.0 0.0 0.0 0.0 0.0 0.0 0.0 0.0 0.0 0.0 0.0 0.0 0.0Struck & Lost 0.0 0.0 0.0 0.0 0.0 0.0 0.0 0.0 0.0 0.0 0.0 0.0 0.0 0.0Total Take 0.0 0.0 0.0 0.0 0.0 0.0 0.0 0.0 0.0 0.0 0.0 0.0 0.0 0.0
ESTIMATED SEASONALLY ADJUSTED HARVEST AND TAKE BY COMMUNITY (EXPANDED)Harvest 0.0 0.0 0.0 0.0 0.0 0.0 0.0 0.0 0.0 0.0 0.0 0.0 0.0Struck & Lost 0.0 0.0 0.0 0.0 0.0 0.0 0.0 0.0 0.0 0.0 0.0 0.0 0.0Total Take 0.0 0.0 0.0 0.0 0.0 0.0 0.0 0.0 0.0 0.0 0.0 0.0 0.0Total Take (%) --- --- --- --- --- --- --- --- --- --- --- --- ---Cum. Take 0.0 0.0 0.0 0.0 0.0 0.0 0.0 0.0 0.0 0.0 0.0 0.0Cum. Take (%) --- --- --- --- --- --- --- --- --- --- --- ---
HARBOR SEAL HARVEST BY MONTH UnknownJan Feb Mar Apr May Jun Jul Aug Sep Oct Nov Dec Month Total
REPORTED HARVEST AND TAKE BY SAMPLED HOUSEHOLDS (UNEXPANDED)Harvest 0 0 0 0 0 0 0 0 0 0 0 0 0 0Struck & Lost 0 0 0 0 0 0 0 0 0 0 0 0 0 0Total Take 0 0 0 0 0 0 0 0 0 0 0 0 0 0
ESTIMATED HARVEST AND TAKE BY COMMUNITY (EXPANDED)Harvest 0.0 0.0 0.0 0.0 0.0 0.0 0.0 0.0 0.0 0.0 0.0 0.0 0.0 0.0Struck & Lost 0.0 0.0 0.0 0.0 0.0 0.0 0.0 0.0 0.0 0.0 0.0 0.0 0.0 0.0Total Take 0.0 0.0 0.0 0.0 0.0 0.0 0.0 0.0 0.0 0.0 0.0 0.0 0.0 0.0
ESTIMATED SEASONALLY ADJUSTED HARVEST AND TAKE BY COMMUNITY (EXPANDED)Harvest 0.0 0.0 0.0 0.0 0.0 0.0 0.0 0.0 0.0 0.0 0.0 0.0 0.0Struck & Lost 0.0 0.0 0.0 0.0 0.0 0.0 0.0 0.0 0.0 0.0 0.0 0.0 0.0Total Take 0.0 0.0 0.0 0.0 0.0 0.0 0.0 0.0 0.0 0.0 0.0 0.0 0.0Total Take (%) --- --- --- --- --- --- --- --- --- --- --- --- ---Cum. Take 0.0 0.0 0.0 0.0 0.0 0.0 0.0 0.0 0.0 0.0 0.0 0.0Cum. Take (%) --- --- --- --- --- --- --- --- --- --- --- --- SOURCE: BBNA Household Surveys, 2007.
C - 73

Table 37. (cont.) SEA LION & HARBOR SEAL HARVEST ESTIMATES: Chignik Lagoon, 2006
HARVEST BY AGE AND SEXSea Lion Harbor Seal
Reported by Community Est. Reported by Community Est.Sample (Expanded) Sample (Expanded)
Number % Number % Number % Number %Adult Male 0 --- 0.0 --- 0 --- 0.0 ---
Adult Female 0 --- 0.0 --- 0 --- 0.0 ---Adult Unknown Sex 0 --- 0.0 --- 0 --- 0.0 ---
Juvenile Male 0 --- 0.0 --- 0 --- 0.0 ---Juvenile Female 0 --- 0.0 --- 0 --- 0.0 ---
Juvenile Unknown Sex 0 --- 0.0 --- 0 --- 0.0 ---Pup Male 0 --- 0.0 --- 0 --- 0.0 ---
Pup Female 0 --- 0.0 --- 0 --- 0.0 ---Pup Unknown Sex 0 --- 0.0 --- 0 --- 0.0 ---
Male Unknown Age 0 --- 0.0 --- 0 --- 0.0 ---Female Unknown Age 0 --- 0.0 --- 0 --- 0.0 ---Unknown Sex and Age 0 --- 0.0 --- 0 --- 0.0 ---
Total 0 --- 0.0 --- 0 --- 0.0 ---
SEASONALLY ADJUSTED TAKE BY MONTH, SEA LION AND HARBOR SEAL
ESTIMATED COMMUNITY HARVEST, STRUCK AND LOST, AND TAKE BY YEAR
SEA LION HARBOR SEALStruck/ Total Struck/ Total
Year Harvest Lost Take Year Harvest Lost Take
1992 0.0 0.0 0.0 1992 4.0 0.0 4.01993 1.1 0.0 1.1 1993 4.3 1.1 5.31994 0.0 0.0 0.0 1994 0.0 1.0 1.01995 0.0 0.0 0.0 1995 0.0 0.0 0.01996 0.0 0.0 0.0 1996 0.0 0.0 0.01997 0.0 0.0 0.0 1997 1.3 1.3 2.71998 0.0 0.0 0.0 1998 0.0 0.0 0.02000 0.0 0.0 0.0 2000 1.2 0.0 1.22001 0.0 0.0 0.0 2001 1.1 0.0 1.12002 0.0 0.0 0.0 2002 0.0 0.0 0.02003 0.0 0.0 0.0 2003 0.0 0.0 0.02004 0.0 0.0 0.0 2004 1.1 0.0 1.12005 0.0 0.0 0.0 2005 0.0 0.0 0.02006 0.0 0.0 0.0 2006 0.0 0.0 0.0
SOURCE: Alaska Department of Fish and Game, Division of Subsistence, Household Surveys 1992-1998;BBNA Household Surveys, 2000-2007.
C - 74
0
1
Jan Feb Mar Apr May Jun Jul Aug Sep Oct Nov Dec
Seas
onal
ly A
djus
ted
Tota
l Tak
e
Sea Lion Harbor Seal

Table 38. SEA LION AND HARBOR SEAL HARVEST / TAKE ESTIMATES: Chignik Lake, 2006
SAMPLING DESIGN: CENSUS Total Native Households 25
Surveyed Households 17Sampling Fraction 68.0%
Sample Household Members 58Estimated Household Members 85.3
2000 U.S. Census Estimated Native Population 127HARVEST AND USE INFORMATION
Percentage of Native Households: Estimated Community Harvest Sea Harbor and Take (Expanded): Sea Harbor
Lion Seal Lion SealUsed 0.0% 58.8% Total Number Harvested 0.0 0.0
Hunted 0.0% 17.6% Total Number Struck and Lost 0.0 2.9Harvested 0.0% 0.0% Total Number Taken 0.0 2.9Received 0.0% 58.8%
Gave Away 0.0% 23.5% Number Harvested Per Capita 0.00 0.00
SEA LION HARVEST BY MONTH UnknownJan Feb Mar Apr May Jun Jul Aug Sep Oct Nov Dec Month Total
REPORTED HARVEST AND TAKE BY SAMPLED HOUSEHOLDS (UNEXPANDED)Harvest 0 0 0 0 0 0 0 0 0 0 0 0 0 0Struck & Lost 0 0 0 0 0 0 0 0 0 0 0 0 0 0Total Take 0 0 0 0 0 0 0 0 0 0 0 0 0 0
ESTIMATED HARVEST AND TAKE BY COMMUNITY (EXPANDED)Harvest 0.0 0.0 0.0 0.0 0.0 0.0 0.0 0.0 0.0 0.0 0.0 0.0 0.0 0.0Struck & Lost 0.0 0.0 0.0 0.0 0.0 0.0 0.0 0.0 0.0 0.0 0.0 0.0 0.0 0.0Total Take 0.0 0.0 0.0 0.0 0.0 0.0 0.0 0.0 0.0 0.0 0.0 0.0 0.0 0.0
ESTIMATED SEASONALLY ADJUSTED HARVEST AND TAKE BY COMMUNITY (EXPANDED)Harvest 0.0 0.0 0.0 0.0 0.0 0.0 0.0 0.0 0.0 0.0 0.0 0.0 0.0Struck & Lost 0.0 0.0 0.0 0.0 0.0 0.0 0.0 0.0 0.0 0.0 0.0 0.0 0.0Total Take 0.0 0.0 0.0 0.0 0.0 0.0 0.0 0.0 0.0 0.0 0.0 0.0 0.0Total Take (%) --- --- --- --- --- --- --- --- --- --- --- --- ---Cum. Take 0.0 0.0 0.0 0.0 0.0 0.0 0.0 0.0 0.0 0.0 0.0 0.0Cum. Take (%) --- --- --- --- --- --- --- --- --- --- --- ---
HARBOR SEAL HARVEST BY MONTH UnknownJan Feb Mar Apr May Jun Jul Aug Sep Oct Nov Dec Month Total
REPORTED HARVEST AND TAKE BY SAMPLED HOUSEHOLDS (UNEXPANDED)Harvest 0 0 0 0 0 0 0 0 0 0 0 0 0 0Struck & Lost 0 0 0 0 0 0 0 0 0 1 0 1 0 2Total Take 0 0 0 0 0 0 0 0 0 1 0 1 0 2
ESTIMATED HARVEST AND TAKE BY COMMUNITY (EXPANDED)Harvest 0.0 0.0 0.0 0.0 0.0 0.0 0.0 0.0 0.0 0.0 0.0 0.0 0.0 0.0Struck & Lost 0.0 0.0 0.0 0.0 0.0 0.0 0.0 0.0 0.0 1.5 0.0 1.5 0.0 2.9Total Take 0.0 0.0 0.0 0.0 0.0 0.0 0.0 0.0 0.0 1.5 0.0 1.5 0.0 2.9
ESTIMATED SEASONALLY ADJUSTED HARVEST AND TAKE BY COMMUNITY (EXPANDED)Harvest 0.0 0.0 0.0 0.0 0.0 0.0 0.0 0.0 0.0 0.0 0.0 0.0 0.0Struck & Lost 0.0 0.0 0.0 0.0 0.0 0.0 0.0 0.0 0.0 1.5 0.0 1.5 2.9Total Take 0.0 0.0 0.0 0.0 0.0 0.0 0.0 0.0 0.0 1.5 0.0 1.5 2.9Total Take (%) 0.0% 0.0% 0.0% 0.0% 0.0% 0.0% 0.0% 0.0% 0.0% 50.0% 0.0% 50.0% 100.0%Cum. Take 0.0 0.0 0.0 0.0 0.0 0.0 0.0 0.0 0.0 1.5 1.5 2.9Cum. Take (%) 0.0% 0.0% 0.0% 0.0% 0.0% 0.0% 0.0% 0.0% 0.0% 50.0% 50.0% 100.0% SOURCE: BBNA Household Surveys, 2007.
C - 75
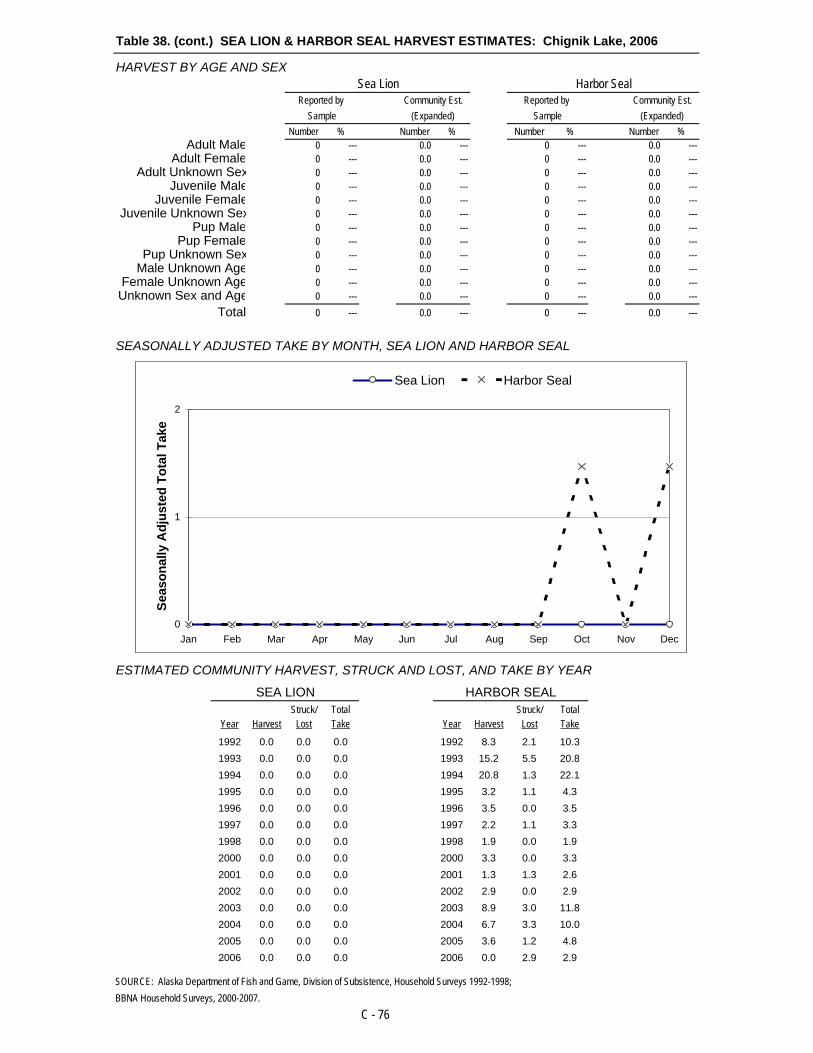
Table 38. (cont.) SEA LION & HARBOR SEAL HARVEST ESTIMATES: Chignik Lake, 2006
HARVEST BY AGE AND SEXSea Lion Harbor Seal
Reported by Community Est. Reported by Community Est.Sample (Expanded) Sample (Expanded)
Number % Number % Number % Number %Adult Male 0 --- 0.0 --- 0 --- 0.0 ---
Adult Female 0 --- 0.0 --- 0 --- 0.0 ---Adult Unknown Sex 0 --- 0.0 --- 0 --- 0.0 ---
Juvenile Male 0 --- 0.0 --- 0 --- 0.0 ---Juvenile Female 0 --- 0.0 --- 0 --- 0.0 ---
Juvenile Unknown Sex 0 --- 0.0 --- 0 --- 0.0 ---Pup Male 0 --- 0.0 --- 0 --- 0.0 ---
Pup Female 0 --- 0.0 --- 0 --- 0.0 ---Pup Unknown Sex 0 --- 0.0 --- 0 --- 0.0 ---
Male Unknown Age 0 --- 0.0 --- 0 --- 0.0 ---Female Unknown Age 0 --- 0.0 --- 0 --- 0.0 ---Unknown Sex and Age 0 --- 0.0 --- 0 --- 0.0 ---
Total 0 --- 0.0 --- 0 --- 0.0 ---
SEASONALLY ADJUSTED TAKE BY MONTH, SEA LION AND HARBOR SEAL
ESTIMATED COMMUNITY HARVEST, STRUCK AND LOST, AND TAKE BY YEAR
SEA LION HARBOR SEALStruck/ Total Struck/ Total
Year Harvest Lost Take Year Harvest Lost Take
1992 0.0 0.0 0.0 1992 8.3 2.1 10.31993 0.0 0.0 0.0 1993 15.2 5.5 20.81994 0.0 0.0 0.0 1994 20.8 1.3 22.11995 0.0 0.0 0.0 1995 3.2 1.1 4.31996 0.0 0.0 0.0 1996 3.5 0.0 3.51997 0.0 0.0 0.0 1997 2.2 1.1 3.31998 0.0 0.0 0.0 1998 1.9 0.0 1.92000 0.0 0.0 0.0 2000 3.3 0.0 3.32001 0.0 0.0 0.0 2001 1.3 1.3 2.62002 0.0 0.0 0.0 2002 2.9 0.0 2.92003 0.0 0.0 0.0 2003 8.9 3.0 11.82004 0.0 0.0 0.0 2004 6.7 3.3 10.02005 0.0 0.0 0.0 2005 3.6 1.2 4.82006 0.0 0.0 0.0 2006 0.0 2.9 2.9
SOURCE: Alaska Department of Fish and Game, Division of Subsistence, Household Surveys 1992-1998;BBNA Household Surveys, 2000-2007.
C - 76
0
1
2
Jan Feb Mar Apr May Jun Jul Aug Sep Oct Nov Dec
Seas
onal
ly A
djus
ted
Tota
l Tak
e
Sea Lion Harbor Seal
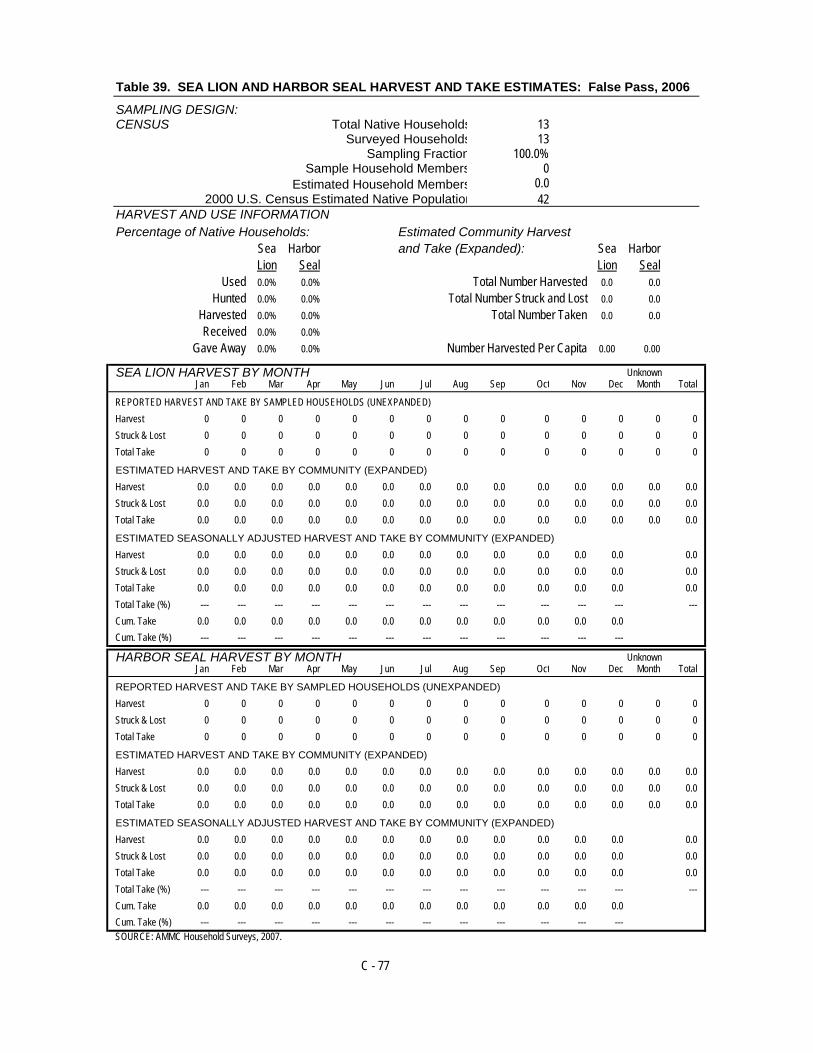
Table 39. SEA LION AND HARBOR SEAL HARVEST AND TAKE ESTIMATES: False Pass, 2006
SAMPLING DESIGN: CENSUS Total Native Households 13
Surveyed Households 13Sampling Fraction 100.0%
Sample Household Members 0Estimated Household Members 0.0
2000 U.S. Census Estimated Native Population 42HARVEST AND USE INFORMATION
Percentage of Native Households: Estimated Community Harvest Sea Harbor and Take (Expanded): Sea Harbor
Lion Seal Lion SealUsed 0.0% 0.0% Total Number Harvested 0.0 0.0
Hunted 0.0% 0.0% Total Number Struck and Lost 0.0 0.0Harvested 0.0% 0.0% Total Number Taken 0.0 0.0Received 0.0% 0.0%
Gave Away 0.0% 0.0% Number Harvested Per Capita 0.00 0.00
SEA LION HARVEST BY MONTH UnknownJan Feb Mar Apr May Jun Jul Aug Sep Oct Nov Dec Month Total
REPORTED HARVEST AND TAKE BY SAMPLED HOUSEHOLDS (UNEXPANDED)Harvest 0 0 0 0 0 0 0 0 0 0 0 0 0 0Struck & Lost 0 0 0 0 0 0 0 0 0 0 0 0 0 0Total Take 0 0 0 0 0 0 0 0 0 0 0 0 0 0
ESTIMATED HARVEST AND TAKE BY COMMUNITY (EXPANDED)Harvest 0.0 0.0 0.0 0.0 0.0 0.0 0.0 0.0 0.0 0.0 0.0 0.0 0.0 0.0Struck & Lost 0.0 0.0 0.0 0.0 0.0 0.0 0.0 0.0 0.0 0.0 0.0 0.0 0.0 0.0Total Take 0.0 0.0 0.0 0.0 0.0 0.0 0.0 0.0 0.0 0.0 0.0 0.0 0.0 0.0
ESTIMATED SEASONALLY ADJUSTED HARVEST AND TAKE BY COMMUNITY (EXPANDED)Harvest 0.0 0.0 0.0 0.0 0.0 0.0 0.0 0.0 0.0 0.0 0.0 0.0 0.0Struck & Lost 0.0 0.0 0.0 0.0 0.0 0.0 0.0 0.0 0.0 0.0 0.0 0.0 0.0Total Take 0.0 0.0 0.0 0.0 0.0 0.0 0.0 0.0 0.0 0.0 0.0 0.0 0.0Total Take (%) --- --- --- --- --- --- --- --- --- --- --- --- ---Cum. Take 0.0 0.0 0.0 0.0 0.0 0.0 0.0 0.0 0.0 0.0 0.0 0.0Cum. Take (%) --- --- --- --- --- --- --- --- --- --- --- ---
HARBOR SEAL HARVEST BY MONTH UnknownJan Feb Mar Apr May Jun Jul Aug Sep Oct Nov Dec Month Total
REPORTED HARVEST AND TAKE BY SAMPLED HOUSEHOLDS (UNEXPANDED)Harvest 0 0 0 0 0 0 0 0 0 0 0 0 0 0Struck & Lost 0 0 0 0 0 0 0 0 0 0 0 0 0 0Total Take 0 0 0 0 0 0 0 0 0 0 0 0 0 0
ESTIMATED HARVEST AND TAKE BY COMMUNITY (EXPANDED)Harvest 0.0 0.0 0.0 0.0 0.0 0.0 0.0 0.0 0.0 0.0 0.0 0.0 0.0 0.0Struck & Lost 0.0 0.0 0.0 0.0 0.0 0.0 0.0 0.0 0.0 0.0 0.0 0.0 0.0 0.0Total Take 0.0 0.0 0.0 0.0 0.0 0.0 0.0 0.0 0.0 0.0 0.0 0.0 0.0 0.0
ESTIMATED SEASONALLY ADJUSTED HARVEST AND TAKE BY COMMUNITY (EXPANDED)Harvest 0.0 0.0 0.0 0.0 0.0 0.0 0.0 0.0 0.0 0.0 0.0 0.0 0.0Struck & Lost 0.0 0.0 0.0 0.0 0.0 0.0 0.0 0.0 0.0 0.0 0.0 0.0 0.0Total Take 0.0 0.0 0.0 0.0 0.0 0.0 0.0 0.0 0.0 0.0 0.0 0.0 0.0Total Take (%) --- --- --- --- --- --- --- --- --- --- --- --- ---Cum. Take 0.0 0.0 0.0 0.0 0.0 0.0 0.0 0.0 0.0 0.0 0.0 0.0Cum. Take (%) --- --- --- --- --- --- --- --- --- --- --- --- SOURCE: AMMC Household Surveys, 2007.
C - 77

Table 39. (cont.) SEA LION & HARBOR SEAL HARVEST ESTIMATES: False Pass, 2006
HARVEST BY AGE AND SEXSea Lion Harbor Seal
Reported by Community Est. Reported by Community Est.Sample (Expanded) Sample (Expanded)
Number % Number % Number % Number %Adult Male 0 --- 0.0 --- 0 --- 0.0 ---
Adult Female 0 --- 0.0 --- 0 --- 0.0 ---Adult Unknown Sex 0 --- 0.0 --- 0 --- 0.0 ---
Juvenile Male 0 --- 0.0 --- 0 --- 0.0 ---Juvenile Female 0 --- 0.0 --- 0 --- 0.0 ---
Juvenile Unknown Sex 0 --- 0.0 --- 0 --- 0.0 ---Pup Male 0 --- 0.0 --- 0 --- 0.0 ---
Pup Female 0 --- 0.0 --- 0 --- 0.0 ---Pup Unknown Sex 0 --- 0.0 --- 0 --- 0.0 ---
Male Unknown Age 0 --- 0.0 --- 0 --- 0.0 ---Female Unknown Age 0 --- 0.0 --- 0 --- 0.0 ---Unknown Sex and Age 0 --- 0.0 --- 0 --- 0.0 ---
Total 0 --- 0.0 --- 0 --- 0.0 ---
SEASONALLY ADJUSTED TAKE BY MONTH, SEA LION AND HARBOR SEAL
ESTIMATED COMMUNITY HARVEST, STRUCK AND LOST, AND TAKE BY YEAR
SEA LION HARBOR SEALStruck/ Total Struck/ Total
Year Harvest Lost Take Year Harvest Lost Take
1992 0.0 0.0 0.0 1992 18.0 0.0 18.01993 0.0 0.0 0.0 1993 19.0 0.0 19.01994 0.0 0.0 0.0 1994 12.6 2.1 14.71995 0.0 0.0 0.0 1995 25.9 1.2 27.11996 0.0 0.0 0.0 1996 13.9 0.0 13.91997 0.0 0.0 0.0 1997 8.0 0.0 8.01998 0.0 0.0 0.0 1998 17.8 1.3 19.12000 0.0 0.0 0.0 2000 2.5 1.2 3.72001 0.0 0.0 0.0 2001 2.5 1.2 3.72002 0.0 0.0 0.0 2002 2.5 0.0 2.52003 0.0 0.0 0.0 2003 2.8 0.0 2.82004 0.0 0.0 0.0 2004 2.8 0.0 2.82005 0.0 0.0 0.0 2005 5.7 0.0 5.72006 0.0 0.0 0.0 2006 0.0 0.0 0.0
SOURCE: Alaska Department of Fish and Game, Division of Subsistence, Household Surveys 1992-1998;AMMC Household Surveys, 2000-2007.
C - 78
0
1
Jan Feb Mar Apr May Jun Jul Aug Sep Oct Nov Dec
Seas
onal
ly A
djus
ted
Tota
l Tak
e
Sea Lion Harbor Seal

Table 40. SEA LION AND HARBOR SEAL HARVEST AND TAKE ESTIMATES: Ivanof Bay, 2006
SAMPLING DESIGN: CENSUS Total Native Households 2
Surveyed Households 2Sampling Fraction 100.0%
Sample Household Members 4Estimated Household Members 4.0
2000 U.S. Census Estimated Native Population 21HARVEST AND USE INFORMATION
Percentage of Native Households: Estimated Community Harvest Sea Harbor and Take (Expanded): Sea Harbor
Lion Seal Lion SealUsed 0.0% 100.0% Total Number Harvested 0.0 3.0
Hunted 0.0% 100.0% Total Number Struck and Lost 0.0 0.0Harvested 0.0% 100.0% Total Number Taken 0.0 3.0Received 0.0% 0.0%
Gave Away 0.0% 100.0% Number Harvested Per Capita 0.00 0.14
SEA LION HARVEST BY MONTH UnknownJan Feb Mar Apr May Jun Jul Aug Sep Oct Nov Dec Month Total
REPORTED HARVEST AND TAKE BY SAMPLED HOUSEHOLDS (UNEXPANDED)Harvest 0 0 0 0 0 0 0 0 0 0 0 0 0 0Struck & Lost 0 0 0 0 0 0 0 0 0 0 0 0 0 0Total Take 0 0 0 0 0 0 0 0 0 0 0 0 0 0
ESTIMATED HARVEST AND TAKE BY COMMUNITY (EXPANDED)Harvest 0.0 0.0 0.0 0.0 0.0 0.0 0.0 0.0 0.0 0.0 0.0 0.0 0.0 0.0Struck & Lost 0.0 0.0 0.0 0.0 0.0 0.0 0.0 0.0 0.0 0.0 0.0 0.0 0.0 0.0Total Take 0.0 0.0 0.0 0.0 0.0 0.0 0.0 0.0 0.0 0.0 0.0 0.0 0.0 0.0
ESTIMATED SEASONALLY ADJUSTED HARVEST AND TAKE BY COMMUNITY (EXPANDED)Harvest 0.0 0.0 0.0 0.0 0.0 0.0 0.0 0.0 0.0 0.0 0.0 0.0 0.0Struck & Lost 0.0 0.0 0.0 0.0 0.0 0.0 0.0 0.0 0.0 0.0 0.0 0.0 0.0Total Take 0.0 0.0 0.0 0.0 0.0 0.0 0.0 0.0 0.0 0.0 0.0 0.0 0.0Total Take (%) --- --- --- --- --- --- --- --- --- --- --- --- ---Cum. Take 0.0 0.0 0.0 0.0 0.0 0.0 0.0 0.0 0.0 0.0 0.0 0.0Cum. Take (%) --- --- --- --- --- --- --- --- --- --- --- ---
HARBOR SEAL HARVEST BY MONTH UnknownJan Feb Mar Apr May Jun Jul Aug Sep Oct Nov Dec Month Total
REPORTED HARVEST AND TAKE BY SAMPLED HOUSEHOLDS (UNEXPANDED)Harvest 0 0 0 0 0 0 0 1 1 1 0 0 0 3Struck & Lost 0 0 0 0 0 0 0 0 0 0 0 0 0 0Total Take 0 0 0 0 0 0 0 1 1 1 0 0 0 3
ESTIMATED HARVEST AND TAKE BY COMMUNITY (EXPANDED)Harvest 0.0 0.0 0.0 0.0 0.0 0.0 0.0 1.0 1.0 1.0 0.0 0.0 0.0 3.0Struck & Lost 0.0 0.0 0.0 0.0 0.0 0.0 0.0 0.0 0.0 0.0 0.0 0.0 0.0 0.0Total Take 0.0 0.0 0.0 0.0 0.0 0.0 0.0 1.0 1.0 1.0 0.0 0.0 0.0 3.0
ESTIMATED SEASONALLY ADJUSTED HARVEST AND TAKE BY COMMUNITY (EXPANDED)Harvest 0.0 0.0 0.0 0.0 0.0 0.0 0.0 1.0 1.0 1.0 0.0 0.0 3.0Struck & Lost 0.0 0.0 0.0 0.0 0.0 0.0 0.0 0.0 0.0 0.0 0.0 0.0 0.0Total Take 0.0 0.0 0.0 0.0 0.0 0.0 0.0 1.0 1.0 1.0 0.0 0.0 3.0Total Take (%) 0.0% 0.0% 0.0% 0.0% 0.0% 0.0% 0.0% 33.3% 33.3% 33.3% 0.0% 0.0% 100.0%Cum. Take 0.0 0.0 0.0 0.0 0.0 0.0 0.0 1.0 2.0 3.0 3.0 3.0Cum. Take (%) 0.0% 0.0% 0.0% 0.0% 0.0% 0.0% 0.0% 33.3% 66.7% 100.0% 100.0% 100.0% SOURCE: BBNA Household Surveys, 2007.
C - 79

Table 40. (cont.) SEA LION & HARBOR SEAL HARVEST ESTIMATES: Ivanof Bay, 2006
HARVEST BY AGE AND SEXSea Lion Harbor Seal
Reported by Community Est. Reported by Community Est.Sample (Expanded) Sample (Expanded)
Number % Number % Number % Number %Adult Male 0 --- 0.0 --- 0 0.0% 0.0 0.0%
Adult Female 0 --- 0.0 --- 0 0.0% 0.0 0.0%Adult Unknown Sex 0 --- 0.0 --- 2 66.7% 2.0 66.7%
Juvenile Male 0 --- 0.0 --- 1 33.3% 1.0 33.3%Juvenile Female 0 --- 0.0 --- 0 0.0% 0.0 0.0%
Juvenile Unknown Sex 0 --- 0.0 --- 0 0.0% 0.0 0.0%Pup Male 0 --- 0.0 --- 0 0.0% 0.0 0.0%
Pup Female 0 --- 0.0 --- 0 0.0% 0.0 0.0%Pup Unknown Sex 0 --- 0.0 --- 0 0.0% 0.0 0.0%
Male Unknown Age 0 --- 0.0 --- 0 0.0% 0.0 0.0%Female Unknown Age 0 --- 0.0 --- 0 0.0% 0.0 0.0%Unknown Sex and Age 0 --- 0.0 --- 0 0.0% 0.0 0.0%
Total 0 --- 0.0 --- 3 100.0% 3.0 100.0%
SEASONALLY ADJUSTED TAKE BY MONTH, SEA LION AND HARBOR SEAL
ESTIMATED COMMUNITY HARVEST, STRUCK AND LOST, AND TAKE BY YEAR
SEA LION HARBOR SEALStruck/ Total Struck/ Total
Year Harvest Lost Take Year Harvest Lost Take
1992 0.0 0.0 0.0 1992 0.0 0.0 0.01993 0.0 0.0 0.0 1993 0.0 0.0 0.01994 0.0 0.0 0.0 1994 0.0 0.0 0.01995 0.0 0.0 0.0 1995 18.7 2.7 21.31996 2.4 0.0 2.4 1996 13.2 0.0 13.21997 1.8 0.0 1.8 1997 9.0 1.8 10.81998 1.8 0.0 1.8 1998 9.0 1.8 10.82000 0.0 0.0 0.0 2000 3.2 0.0 3.22001 1.4 1.4 2.8 2001 7.0 1.4 8.42002 1.4 1.4 2.8 2002 7.0 1.4 8.42003* 0.0 0.0 0.0 2003* 0.0 0.0 0.02004* 0.0 0.0 0.0 2004* 0.0 0.0 0.02005* 0.0 0.0 0.0 2005* 0.0 0.0 0.02006 0.0 0.0 0.0 2006 3.0 0.0 3.0
*From 2003-2005 there were no year round residents in Ivanof Bay.SOURCE: Alaska Department of Fish and Game, Division of Subsistence, Household Surveys 1992-1998;BBNA Household Surveys, 2000-2007.
C - 80
0
1
2
Jan Feb Mar Apr May Jun Jul Aug Sep Oct Nov Dec
Seas
onal
ly A
djus
ted
Tota
l Tak
e
Sea Lion Harbor Seal

Table 41. SEA LION AND HARBOR SEAL HARVEST AND TAKE ESTIMATES: King Cove, 2006
SAMPLING DESIGN: CHAIN REFERRAL Total Referred Households 14
Surveyed Households 13Sampling Fraction
Sample Household Members 42Estimated Household Members 45.2
2000 U.S. Census Estimated Native Population 379HARVEST AND USE INFORMATION
Percentage of Sample Households: Estimated Community Harvest Sea Harbor and Take (Expanded): Sea Harbor
Lion Seal Lion SealUsed 84.6% 100.0% Total Number Harvested 11.8 14.0
Hunted 84.6% 100.0% Total Number Struck and Lost 1.1 0.0Harvested 84.6% 100.0% Total Number Taken 12.9 14.0Received 84.6% 100.0%
Gave Away 84.6% 100.0% Number Harvested Per Capita 0.03 0.04
SEA LION HARVEST BY MONTH UnknownJan Feb Mar Apr May Jun Jul Aug Sep Oct Nov Dec Month Total
REPORTED HARVEST AND TAKE BY SAMPLED HOUSEHOLDS (UNEXPANDED)Harvest 0 0 0 0 8 3 0 0 0 0 0 0 0 11Struck & Lost 0 0 0 0 0 0 0 0 0 0 0 0 1 1Total Take 0 0 0 0 8 3 0 0 0 0 0 0 1 12
ESTIMATED HARVEST AND TAKE BY COMMUNITY (EXPANDED)Harvest 0.0 0.0 0.0 0.0 8.6 3.2 0.0 0.0 0.0 0.0 0.0 0.0 0.0 11.8Struck & Lost 0.0 0.0 0.0 0.0 0.0 0.0 0.0 0.0 0.0 0.0 0.0 0.0 1.1 1.1Total Take 0.0 0.0 0.0 0.0 8.6 3.2 0.0 0.0 0.0 0.0 0.0 0.0 1.1 12.9
ESTIMATED SEASONALLY ADJUSTED HARVEST AND TAKE BY COMMUNITY (EXPANDED)Harvest 0.0 0.0 0.0 0.0 8.6 3.2 0.0 0.0 0.0 0.0 0.0 0.0 11.8Struck & Lost 0.0 0.0 0.0 0.0 0.8 0.3 0.0 0.0 0.0 0.0 0.0 0.0 1.1Total Take 0.0 0.0 0.0 0.0 9.4 3.5 0.0 0.0 0.0 0.0 0.0 0.0 12.9Total Take (%) 0.0% 0.0% 0.0% 0.0% 72.7% 27.3% 0.0% 0.0% 0.0% 0.0% 0.0% 0.0% 100.0%Cum. Take 0.0 0.0 0.0 0.0 9.4 12.9 12.9 12.9 12.9 12.9 12.9 12.9Cum. Take (%) 0.0% 0.0% 0.0% 0.0% 72.7% 100.0% 100.0% 100.0% 100.0% 100.0% 100.0% 100.0%
HARBOR SEAL HARVEST BY MONTH UnknownJan Feb Mar Apr May Jun Jul Aug Sep Oct Nov Dec Month Total
REPORTED HARVEST AND TAKE BY SAMPLED HOUSEHOLDS (UNEXPANDED)Harvest 0 0 0 6 7 0 0 0 0 0 0 0 0 13Struck & Lost 0 0 0 0 0 0 0 0 0 0 0 0 0 0Total Take 0 0 0 6 7 0 0 0 0 0 0 0 0 13
ESTIMATED HARVEST AND TAKE BY COMMUNITY (EXPANDED)Harvest 0.0 0.0 0.0 6.5 7.5 0.0 0.0 0.0 0.0 0.0 0.0 0.0 0.0 14.0Struck & Lost 0.0 0.0 0.0 0.0 0.0 0.0 0.0 0.0 0.0 0.0 0.0 0.0 0.0 0.0Total Take 0.0 0.0 0.0 6.5 7.5 0.0 0.0 0.0 0.0 0.0 0.0 0.0 0.0 14.0
ESTIMATED SEASONALLY ADJUSTED HARVEST AND TAKE BY COMMUNITY (EXPANDED)Harvest 0.0 0.0 0.0 6.5 7.5 0.0 0.0 0.0 0.0 0.0 0.0 0.0 14.0Struck & Lost 0.0 0.0 0.0 0.0 0.0 0.0 0.0 0.0 0.0 0.0 0.0 0.0 0.0Total Take 0.0 0.0 0.0 6.5 7.5 0.0 0.0 0.0 0.0 0.0 0.0 0.0 14.0Total Take (%) 0.0% 0.0% 0.0% 46.2% 53.8% 0.0% 0.0% 0.0% 0.0% 0.0% 0.0% 0.0% 100.0%Cum. Take 0.0 0.0 0.0 6.5 14.0 14.0 14.0 14.0 14.0 14.0 14.0 14.0Cum. Take (%) 0.0% 0.0% 0.0% 46.2% 100.0% 100.0% 100.0% 100.0% 100.0% 100.0% 100.0% 100.0% SOURCE: AMMC Household Surveys, 2007.
C - 81
92.9%

Table 41. (cont.) SEA LION & HARBOR SEAL HARVEST ESTIMATES: King Cove, 2006
HARVEST BY AGE AND SEXSea Lion Harbor Seal
Reported by Community Est. Reported by Community Est.Sample (Expanded) Sample (Expanded)
Number % Number % Number % Number %Adult Male 7 63.6% 7.5 63.6% 5 38.5% 5.4 38.5%
Adult Female 4 36.4% 4.3 36.4% 8 61.5% 8.6 61.5%Adult Unknown Sex 0 0.0% 0.0 0.0% 0 0.0% 0.0 0.0%
Juvenile Male 0 0.0% 0.0 0.0% 0 0.0% 0.0 0.0%Juvenile Female 0 0.0% 0.0 0.0% 0 0.0% 0.0 0.0%
Juvenile Unknown Sex 0 0.0% 0.0 0.0% 0 0.0% 0.0 0.0%Pup Male 0 0.0% 0.0 0.0% 0 0.0% 0.0 0.0%
Pup Female 0 0.0% 0.0 0.0% 0 0.0% 0.0 0.0%Pup Unknown Sex 0 0.0% 0.0 0.0% 0 0.0% 0.0 0.0%
Male Unknown Age 0 0.0% 0.0 0.0% 0 0.0% 0.0 0.0%Female Unknown Age 0 0.0% 0.0 0.0% 0 0.0% 0.0 0.0%Unknown Sex and Age 0 0.0% 0.0 0.0% 0 0.0% 0.0 0.0%
Total 11 100.0% 11.8 100.0% 13 100.0% 14.0 100.0%
SEASONALLY ADJUSTED TAKE BY MONTH, SEA LION AND HARBOR SEAL
ESTIMATED COMMUNITY HARVEST, STRUCK AND LOST, AND TAKE BY YEAR
SEA LION HARBOR SEALStruck/ Total Struck/ Total
Year Harvest Lost Take Year Harvest Lost Take
1992 1.3 0.0 1.3 1992 26.0 6.7 32.71993 1.2 0.0 1.2 1993 12.8 3.5 16.31994 3.2 1.1 4.3 1994 20.9 1.1 22.01995 5.0 0.0 5.0 1995 49.0 3.0 52.01996 0.0 0.0 0.0 1996 14.0 5.0 19.01997 4.2 0.0 4.2 1997 16.9 2.1 19.11998 4.3 0.0 4.3 1998 18.2 0.0 18.22000 4.3 0.0 4.3 2000 19.3 2.1 21.42001 3.0 0.0 3.0 2001 22.0 4.0 26.02002 0.0 1.5 1.5 2002 7.5 3.0 10.52003 0.0 0.0 0.0 2003 11.0 4.4 15.42004 1.7 0.0 1.7 2004 32.3 0.0 32.32005 3.2 0.0 3.2 2005 21.5 0.0 21.52006 11.8 1.1 12.9 2006 14.0 0.0 14.0
SOURCE: Alaska Department of Fish and Game, Division of Subsistence, Household Surveys 1992-1998;AMMC Household Surveys, 2000-2007.
C - 82
0
1
2
3
4
5
6
7
8
9
10
Jan Feb Mar Apr May Jun Jul Aug Sep Oct Nov Dec
Sea Lion Harbor Seal

Table 42. SEA LION AND HARBOR SEAL HARVEST AND TAKE ESTIMATES: Perryville, 2006
SAMPLING DESIGN: CENSUS Total Native Households 31
Surveyed Households 26Sampling Fraction 83.9%
Sample Household Members 95Estimated Household Members 113.3
2000 U.S. Census Estimated Native Population 105HARVEST AND USE INFORMATION
Percentage of Native Households: Estimated Community Harvest Sea Harbor and Take (Expanded): Sea Harbor
Lion Seal Lion SealUsed 0.0% 69.2% Total Number Harvested 0.0 27.4
Hunted 3.8% 46.2% Total Number Struck and Lost 0.0 14.3Harvested 0.0% 42.3% Total Number Taken 0.0 41.7Received 0.0% 53.8%
Gave Away 0.0% 53.8% Number Harvested Per Capita 0.00 0.26
SEA LION HARVEST BY MONTH UnknownJan Feb Mar Apr May Jun Jul Aug Sep Oct Nov Dec Month Total
REPORTED HARVEST AND TAKE BY SAMPLED HOUSEHOLDS (UNEXPANDED)Harvest 0 0 0 0 0 0 0 0 0 0 0 0 0 0Struck & Lost 0 0 0 0 0 0 0 0 0 0 0 0 0 0Total Take 0 0 0 0 0 0 0 0 0 0 0 0 0 0
ESTIMATED HARVEST AND TAKE BY COMMUNITY (EXPANDED)Harvest 0.0 0.0 0.0 0.0 0.0 0.0 0.0 0.0 0.0 0.0 0.0 0.0 0.0 0.0Struck & Lost 0.0 0.0 0.0 0.0 0.0 0.0 0.0 0.0 0.0 0.0 0.0 0.0 0.0 0.0Total Take 0.0 0.0 0.0 0.0 0.0 0.0 0.0 0.0 0.0 0.0 0.0 0.0 0.0 0.0
ESTIMATED SEASONALLY ADJUSTED HARVEST AND TAKE BY COMMUNITY (EXPANDED)Harvest 0.0 0.0 0.0 0.0 0.0 0.0 0.0 0.0 0.0 0.0 0.0 0.0 0.0Struck & Lost 0.0 0.0 0.0 0.0 0.0 0.0 0.0 0.0 0.0 0.0 0.0 0.0 0.0Total Take 0.0 0.0 0.0 0.0 0.0 0.0 0.0 0.0 0.0 0.0 0.0 0.0 0.0Total Take (%) --- --- --- --- --- --- --- --- --- --- --- --- ---Cum. Take 0.0 0.0 0.0 0.0 0.0 0.0 0.0 0.0 0.0 0.0 0.0 0.0Cum. Take (%) --- --- --- --- --- --- --- --- --- --- --- ---
HARBOR SEAL HARVEST BY MONTH UnknownJan Feb Mar Apr May Jun Jul Aug Sep Oct Nov Dec Month Total
REPORTED HARVEST AND TAKE BY SAMPLED HOUSEHOLDS (UNEXPANDED)Harvest 2 2 0 1 0 0 0 1 3 6 7 1 0 23Struck & Lost 0 0 0 0 1 0 0 1 2 2 3 2 1 12Total Take 2 2 0 1 1 0 0 2 5 8 10 3 1 35
ESTIMATED HARVEST AND TAKE BY COMMUNITY (EXPANDED)Harvest 2.4 2.4 0.0 1.2 0.0 0.0 0.0 1.2 3.6 7.2 8.3 1.2 0.0 27.4Struck & Lost 0.0 0.0 0.0 0.0 1.2 0.0 0.0 1.2 2.4 2.4 3.6 2.4 1.2 14.3Total Take 2.4 2.4 0.0 1.2 1.2 0.0 0.0 2.4 6.0 9.5 11.9 3.6 1.2 41.7
ESTIMATED SEASONALLY ADJUSTED HARVEST AND TAKE BY COMMUNITY (EXPANDED)Harvest 2.4 2.4 0.0 1.2 0.0 0.0 0.0 1.2 3.6 7.2 8.3 1.2 27.4Struck & Lost 0.0 0.0 0.0 0.0 1.3 0.0 0.0 1.3 2.6 2.6 3.9 2.6 14.3Total Take 2.4 2.4 0.0 1.2 1.3 0.0 0.0 2.5 6.2 9.8 12.2 3.8 41.7Total Take (%) 5.7% 5.7% 0.0% 2.9% 3.1% 0.0% 0.0% 6.0% 14.8% 23.4% 29.4% 9.1% 100.0%Cum. Take 2.4 4.8 4.8 6.0 7.3 7.3 7.3 9.8 15.9 25.7 37.9 41.7Cum. Take (%) 5.7% 11.4% 11.4% 14.3% 17.4% 17.4% 17.4% 23.4% 38.2% 61.6% 90.9% 100.0% SOURCE: BBNA Household Surveys, 2007.
C - 83

Table 42. (cont.) SEA LION & HARBOR SEAL HARVEST ESTIMATES: Perryville, 2006
HARVEST BY AGE AND SEXSea Lion Harbor Seal
Reported by Community Est. Reported by Community Est.Sample (Expanded) Sample (Expanded)
Number % Number % Number % Number %Adult Male 0 --- 0.0 --- 5 21.7% 6.0 21.7%
Adult Female 0 --- 0.0 --- 2 8.7% 2.4 8.7%Adult Unknown Sex 0 --- 0.0 --- 1 4.3% 1.2 4.3%
Juvenile Male 0 --- 0.0 --- 6 26.1% 7.2 26.1%Juvenile Female 0 --- 0.0 --- 5 21.7% 6.0 21.7%
Juvenile Unknown Sex 0 --- 0.0 --- 1 4.3% 1.2 4.3%Pup Male 0 --- 0.0 --- 0 0.0% 0.0 0.0%
Pup Female 0 --- 0.0 --- 0 0.0% 0.0 0.0%Pup Unknown Sex 0 --- 0.0 --- 0 0.0% 0.0 0.0%
Male Unknown Age 0 --- 0.0 --- 0 0.0% 0.0 0.0%Female Unknown Age 0 --- 0.0 --- 0 0.0% 0.0 0.0%Unknown Sex and Age 0 --- 0.0 --- 3 13.0% 3.6 13.0%
Total 0 --- 0.0 --- 23 100.0% 27.4 100.0%
SEASONALLY ADJUSTED TAKE BY MONTH, SEA LION AND HARBOR SEAL
ESTIMATED COMMUNITY HARVEST, STRUCK AND LOST, AND TAKE BY YEAR
SEA LION HARBOR SEALStruck/ Total Struck/ Total
Year Harvest Lost Take Year Harvest Lost Take
1992 1.1 0.0 1.1 1992 8.9 2.2 11.11993 0.0 0.0 0.0 1993 12.8 2.1 15.01994 1.4 0.0 1.4 1994 21.1 0.0 21.11995 3.1 0.0 3.1 1995 11.0 3.1 14.11996 1.3 1.3 2.6 1996 20.5 0.0 20.51997 2.3 0.0 2.3 1997 21.7 5.7 27.41998 1.1 0.0 1.1 1998 21.0 4.4 25.42000 4.5 0.0 4.5 2000 21.0 15.0 36.02001 1.1 0.0 1.1 2001 24.0 6.9 30.92002 2.5 1.3 3.8 2002 33.8 15.0 48.82003 1.2 2.4 3.7 2003 51.3 6.1 57.42004 2.2 0.0 2.2 2004 20.0 5.6 25.62005 1.0 0.0 1.0 2005 21.0 6.0 27.02006 0.0 0.0 0.0 2006 27.4 14.3 41.7
SOURCE: Alaska Department of Fish and Game, Division of Subsistence, Household Surveys 1992-1998;BBNA Household Surveys, 2000-2007.
C - 84
0
2
4
6
8
10
12
14
Jan Feb Mar Apr May Jun Jul Aug Sep Oct Nov Dec
Seas
onal
ly A
djus
ted
Tota
l Tak
e
Sea Lion Harbor Seal

Table 43. SEA LION AND HARBOR SEAL HARVEST AND TAKE ESTIMATES: Sand Point, 2006
SAMPLING DESIGN: CHAIN REFERRAL Total Referred Households 15
Surveyed Households 8Sampling Fraction 53.3%
Sample Household Members 10Estimated Household Members 18.8
2000 U.S. Census Estimated Native Population 421HARVEST AND USE INFORMATION
Percentage of Sample Households: Estimated Community Harvest Sea Harbor and Take (Expanded): Sea Harbor
Lion Seal Lion SealUsed 12.5% 25.0% Total Number Harvested 5.6 3.8
Hunted 12.5% 25.0% Total Number Struck and Lost 0.0 1.9Harvested 12.5% 12.5% Total Number Taken 5.6 5.6Received 0.0% 12.5%
Gave Away 0.0% 25.0% Number Harvested Per Capita 0.01 0.01
SEA LION HARVEST BY MONTH UnknownJan Feb Mar Apr May Jun Jul Aug Sep Oct Nov Dec Month Total
REPORTED HARVEST AND TAKE BY SAMPLED HOUSEHOLDS (UNEXPANDED)Harvest 1 1 0 0 0 1 0 0 0 0 0 0 0 3Struck & Lost 0 0 0 0 0 0 0 0 0 0 0 0 0 0Total Take 1 1 0 0 0 1 0 0 0 0 0 0 0 3
ESTIMATED HARVEST AND TAKE BY COMMUNITY (EXPANDED)Harvest 1.9 1.9 0.0 0.0 0.0 1.9 0.0 0.0 0.0 0.0 0.0 0.0 0.0 5.6Struck & Lost 0.0 0.0 0.0 0.0 0.0 0.0 0.0 0.0 0.0 0.0 0.0 0.0 0.0 0.0Total Take 1.9 1.9 0.0 0.0 0.0 1.9 0.0 0.0 0.0 0.0 0.0 0.0 0.0 5.6
ESTIMATED SEASONALLY ADJUSTED HARVEST AND TAKE BY COMMUNITY (EXPANDED)Harvest 1.9 1.9 0.0 0.0 0.0 1.9 0.0 0.0 0.0 0.0 0.0 0.0 5.6Struck & Lost 0.0 0.0 0.0 0.0 0.0 0.0 0.0 0.0 0.0 0.0 0.0 0.0 0.0Total Take 1.9 1.9 0.0 0.0 0.0 1.9 0.0 0.0 0.0 0.0 0.0 0.0 5.6Total Take (%) 33.3% 33.3% 0.0% 0.0% 0.0% 33.3% 0.0% 0.0% 0.0% 0.0% 0.0% 0.0% 100.0%Cum. Take 1.9 3.8 3.8 3.8 3.8 5.6 5.6 5.6 5.6 5.6 5.6 5.6Cum. Take (%) 33.3% 66.7% 66.7% 66.7% 66.7% 100.0% 100.0% 100.0% 100.0% 100.0% 100.0% 100.0%
HARBOR SEAL HARVEST BY MONTH UnknownJan Feb Mar Apr May Jun Jul Aug Sep Oct Nov Dec Month Total
REPORTED HARVEST AND TAKE BY SAMPLED HOUSEHOLDS (UNEXPANDED)Harvest 0 0 0 0 0 1 0 1 0 0 0 0 0 2Struck & Lost 0 0 0 0 0 1 0 0 0 0 0 0 0 1Total Take 0 0 0 0 0 2 0 1 0 0 0 0 0 3
ESTIMATED HARVEST AND TAKE BY COMMUNITY (EXPANDED)Harvest 0.0 0.0 0.0 0.0 0.0 1.9 0.0 1.9 0.0 0.0 0.0 0.0 0.0 3.8Struck & Lost 0.0 0.0 0.0 0.0 0.0 1.9 0.0 0.0 0.0 0.0 0.0 0.0 0.0 1.9Total Take 0.0 0.0 0.0 0.0 0.0 3.8 0.0 1.9 0.0 0.0 0.0 0.0 0.0 5.6
ESTIMATED SEASONALLY ADJUSTED HARVEST AND TAKE BY COMMUNITY (EXPANDED)Harvest 0.0 0.0 0.0 0.0 0.0 1.9 0.0 1.9 0.0 0.0 0.0 0.0 3.8Struck & Lost 0.0 0.0 0.0 0.0 0.0 1.9 0.0 0.0 0.0 0.0 0.0 0.0 1.9Total Take 0.0 0.0 0.0 0.0 0.0 3.8 0.0 1.9 0.0 0.0 0.0 0.0 5.6Total Take (%) 0.0% 0.0% 0.0% 0.0% 0.0% 66.7% 0.0% 33.3% 0.0% 0.0% 0.0% 0.0% 100.0%Cum. Take 0.0 0.0 0.0 0.0 0.0 3.8 3.8 5.6 5.6 5.6 5.6 5.6Cum. Take (%) 0.0% 0.0% 0.0% 0.0% 0.0% 66.7% 66.7% 100.0% 100.0% 100.0% 100.0% 100.0% SOURCE: AMMC Household Surveys, 2007.
C - 85

Table 43. (cont.) SEA LION & HARBOR SEAL HARVEST ESTIMATES: Sand Point, 2006
HARVEST BY AGE AND SEXSea Lion Harbor Seal
Reported by Community Est. Reported by Community Est.Sample (Expanded) Sample (Expanded)
Number % Number % Number % Number %Adult Male 0 0.0% 0.0 0.0% 2 100.0% 3.8 100.0%
Adult Female 0 0.0% 0.0 0.0% 0 0.0% 0.0 0.0%Adult Unknown Sex 2 66.7% 3.8 66.7% 0 0.0% 0.0 0.0%
Juvenile Male 0 0.0% 0.0 0.0% 0 0.0% 0.0 0.0%Juvenile Female 0 0.0% 0.0 0.0% 0 0.0% 0.0 0.0%
Juvenile Unknown Sex 1 33.3% 1.9 33.3% 0 0.0% 0.0 0.0%Pup Male 0 0.0% 0.0 0.0% 0 0.0% 0.0 0.0%
Pup Female 0 0.0% 0.0 0.0% 0 0.0% 0.0 0.0%Pup Unknown Sex 0 0.0% 0.0 0.0% 0 0.0% 0.0 0.0%
Male Unknown Age 0 0.0% 0.0 0.0% 0 0.0% 0.0 0.0%Female Unknown Age 0 0.0% 0.0 0.0% 0 0.0% 0.0 0.0%Unknown Sex and Age 0 0.0% 0.0 0.0% 0 0.0% 0.0 0.0%
Total 3 100.0% 5.6 100.0% 2 100.0% 3.8 100.0%
SEASONALLY ADJUSTED TAKE BY MONTH, SEA LION AND HARBOR SEAL
ESTIMATED COMMUNITY HARVEST, STRUCK AND LOST, AND TAKE BY YEAR
SEA LION HARBOR SEALStruck/ Total Struck/ Total
Year Harvest Lost Take Year Harvest Lost Take
1992 0.0 0.0 0.0 1992 37.9 0.0 37.91993 0.0 0.0 0.0 1993 13.3 1.2 14.41994 0.0 0.0 0.0 1994 7.8 4.3 12.11995 0.0 0.0 0.0 1995 9.2 0.0 9.21996 0.0 0.0 0.0 1996 20.2 0.0 20.21997 0.0 0.0 0.0 1997 9.1 0.0 9.11998 2.0 0.0 2.0 1998 12.0 0.0 12.02000 5.0 0.0 5.0 2000 15.0 0.0 15.02001 4.7 0.0 4.7 2001 10.9 1.6 12.42002 0.0 0.0 0.0 2002 15.0 0.0 15.02003 1.3 0.0 1.3 2003 14.3 0.0 14.32004 0.0 0.0 0.0 2004 15.0 1.3 16.32005 0.0 0.0 0.0 2005 15.0 1.3 16.32006 5.6 0.0 5.6 2006 3.8 1.9 5.6
SOURCE: Alaska Department of Fish and Game, Division of Subsistence, Household Surveys 1992-1998;AMMC Household Surveys, 2000-2007.
C - 86
0
1
2
3
4
Jan Feb Mar Apr May Jun Jul Aug Sep Oct Nov Dec
Seas
onal
ly A
djus
ted
Tota
l Tak
e
Sea Lion Harbor Seal

Table 44. SEA LION AND HARBOR SEAL HARVEST AND TAKE ESTIMATES: Adak, 2006
SAMPLING DESIGN: CHAIN REFERRAL Total Referred Households 3
Surveyed Households 3Sampling Fraction
Sample Household Members 0Estimated Household Members 0.0
2000 U.S. Census Estimated Native Population 118HARVEST AND USE INFORMATION
Percentage of Native Households: Estimated Community Harvest Sea Harbor and Take (Expanded): Sea Harbor
Lion Seal Lion SealUsed 0.0% 0.0% Total Number Harvested 0.0 0.0
Hunted 0.0% 0.0% Total Number Struck and Lost 0.0 0.0Harvested 0.0% 0.0% Total Number Taken 0.0 0.0Received 0.0% 0.0%
Gave Away 0.0% 0.0% Number Harvested Per Capita 0.00 0.00
SEA LION HARVEST BY MONTH UnknownJan Feb Mar Apr May Jun Jul Aug Sep Oct Nov Dec Month Total
REPORTED HARVEST AND TAKE BY SAMPLED HOUSEHOLDS (UNEXPANDED)Harvest 0 0 0 0 0 0 0 0 0 0 0 0 0 0Struck & Lost 0 0 0 0 0 0 0 0 0 0 0 0 0 0Total Take 0 0 0 0 0 0 0 0 0 0 0 0 0 0
ESTIMATED HARVEST AND TAKE BY COMMUNITY (EXPANDED)
Harvest 0.0 0.0 0.0 0.0 0.0 0.0 0.0 0.0 0.0 0.0 0.0 0.0 0.0 0.0Struck & Lost 0.0 0.0 0.0 0.0 0.0 0.0 0.0 0.0 0.0 0.0 0.0 0.0 0.0 0.0Total Take 0.0 0.0 0.0 0.0 0.0 0.0 0.0 0.0 0.0 0.0 0.0 0.0 0.0 0.0
ESTIMATED SEASONALLY ADJUSTED HARVEST AND TAKE BY COMMUNITY (EXPANDED)
Harvest 0.0 0.0 0.0 0.0 0.0 0.0 0.0 0.0 0.0 0.0 0.0 0.0 0.0Struck & Lost 0.0 0.0 0.0 0.0 0.0 0.0 0.0 0.0 0.0 0.0 0.0 0.0 0.0Total Take 0.0 0.0 0.0 0.0 0.0 0.0 0.0 0.0 0.0 0.0 0.0 0.0 0.0Total Take (%) --- --- --- --- --- --- --- --- --- --- --- --- ---Cum. Take 0.0 0.0 0.0 0.0 0.0 0.0 0.0 0.0 0.0 0.0 0.0 0.0Cum. Take (%) --- --- --- --- --- --- --- --- --- --- --- ---
HARBOR SEAL HARVEST BY MONTH UnknownJan Feb Mar Apr May Jun Jul Aug Sep Oct Nov Dec Month Total
REPORTED HARVEST AND TAKE BY SAMPLED HOUSEHOLDS (UNEXPANDED)
Harvest 0 0 0 0 0 0 0 0 0 0 0 0 0 0Struck & Lost 0 0 0 0 0 0 0 0 0 0 0 0 0 0Total Take 0 0 0 0 0 0 0 0 0 0 0 0 0 0
ESTIMATED HARVEST AND TAKE BY COMMUNITY (EXPANDED)
Harvest 0.0 0.0 0.0 0.0 0.0 0.0 0.0 0.0 0.0 0.0 0.0 0.0 0.0 0.0Struck & Lost 0.0 0.0 0.0 0.0 0.0 0.0 0.0 0.0 0.0 0.0 0.0 0.0 0.0 0.0Total Take 0.0 0.0 0.0 0.0 0.0 0.0 0.0 0.0 0.0 0.0 0.0 0.0 0.0 0.0
ESTIMATED SEASONALLY ADJUSTED HARVEST AND TAKE BY COMMUNITY (EXPANDED)
Harvest 0.0 0.0 0.0 0.0 0.0 0.0 0.0 0.0 0.0 0.0 0.0 0.0 0.0Struck & Lost 0.0 0.0 0.0 0.0 0.0 0.0 0.0 0.0 0.0 0.0 0.0 0.0 0.0Total Take 0.0 0.0 0.0 0.0 0.0 0.0 0.0 0.0 0.0 0.0 0.0 0.0 0.0Total Take (%) --- --- --- --- --- --- --- --- --- --- --- --- ---Cum. Take 0.0 0.0 0.0 0.0 0.0 0.0 0.0 0.0 0.0 0.0 0.0 0.0Cum. Take (%) --- --- --- --- --- --- --- --- --- --- --- --- SOURCE: AMMC Household Surveys, 2007.
C - 87
100.0%

Table 44. (cont.) SEA LION & HARBOR SEAL HARVEST ESTIMATES: Adak, 2006
HARVEST BY AGE AND SEXSea Lion Harbor Seal
Reported by Community Est. Reported by Community Est.Sample (Expanded) Sample (Expanded)
Number % Number % Number % Number %Adult Male 0 --- 0.0 --- 0 --- 0.0 ---
Adult Female 0 --- 0.0 --- 0 --- 0.0 ---Adult Unknown Sex 0 --- 0.0 --- 0 --- 0.0 ---
Juvenile Male 0 --- 0.0 --- 0 --- 0.0 ---Juvenile Female 0 --- 0.0 --- 0 --- 0.0 ---
Juvenile Unknown Sex 0 --- 0.0 --- 0 --- 0.0 ---Pup Male 0 --- 0.0 --- 0 --- 0.0 ---
Pup Female 0 --- 0.0 --- 0 --- 0.0 ---Pup Unknown Sex 0 --- 0.0 --- 0 --- 0.0 ---
Male Unknown Age 0 --- 0.0 --- 0 --- 0.0 ---Female Unknown Age 0 --- 0.0 --- 0 --- 0.0 ---Unknown Sex and Age 0 --- 0.0 --- 0 --- 0.0 ---
Total 0 --- 0.0 --- 0 --- 0.0 ---
SEASONALLY ADJUSTED TAKE BY MONTH, SEA LION AND HARBOR SEAL
ESTIMATED COMMUNITY HARVEST, STRUCK AND LOST, AND TAKE BY YEARSEA LION HARBOR SEAL
Struck/ Total Struck/ TotalYear Harvest Lost Take Year Harvest Lost Take1992 --- --- --- 1992 --- --- ---1993 --- --- --- 1993 --- --- ---1994 --- --- --- 1994 --- --- ---1995 --- --- --- 1995 --- --- ---1996 --- --- --- 1996 --- --- ---1997 --- --- --- 1997 --- --- ---1998 --- --- --- 1998 --- --- ---2000 --- --- --- 2000 --- --- ---2001 --- --- --- 2001 --- --- ---2002 --- --- --- 2002 --- --- ---2003 1.0 0.0 1.0 2003 4.0 1.0 5.02004 2.0 1.0 3.0 2004 0.0 0.0 0.02005 4.0 0.0 4.0 2005 12.0 0.0 12.02006 0.0 0.0 0.0 2006 0.0 0.0 0.0
SOURCE: Alaska Department of Fish and Game, Division of Subsistence, Household Surveys 1992-1998;AMMC Household Surveys, 2007.
C - 88
0
1
Jan Feb Mar Apr May Jun Jul Aug Sep Oct Nov Dec
Seas
onal
ly A
djus
ted
Tota
l Tak
e
Sea Lion Harbor Seal
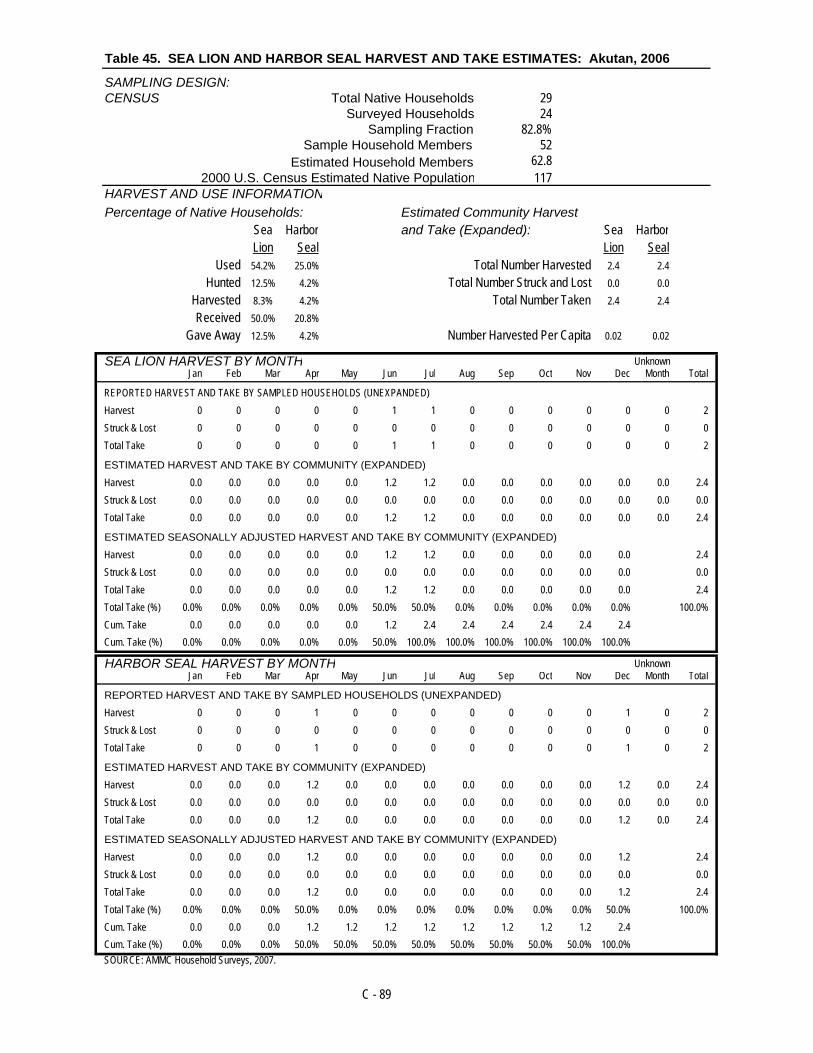
Table 45. SEA LION AND HARBOR SEAL HARVEST AND TAKE ESTIMATES: Akutan, 2006
SAMPLING DESIGN: CENSUS Total Native Households 29
Surveyed Households 24Sampling Fraction 82.8%
Sample Household Members 52Estimated Household Members 62.8
2000 U.S. Census Estimated Native Population 117HARVEST AND USE INFORMATION
Percentage of Native Households: Estimated Community Harvest Sea Harbor and Take (Expanded): Sea Harbor
Lion Seal Lion SealUsed 54.2% 25.0% Total Number Harvested 2.4 2.4
Hunted 12.5% 4.2% Total Number Struck and Lost 0.0 0.0Harvested 8.3% 4.2% Total Number Taken 2.4 2.4Received 50.0% 20.8%
Gave Away 12.5% 4.2% Number Harvested Per Capita 0.02 0.02
SEA LION HARVEST BY MONTH UnknownJan Feb Mar Apr May Jun Jul Aug Sep Oct Nov Dec Month Total
REPORTED HARVEST AND TAKE BY SAMPLED HOUSEHOLDS (UNEXPANDED)Harvest 0 0 0 0 0 1 1 0 0 0 0 0 0 2Struck & Lost 0 0 0 0 0 0 0 0 0 0 0 0 0 0Total Take 0 0 0 0 0 1 1 0 0 0 0 0 0 2
ESTIMATED HARVEST AND TAKE BY COMMUNITY (EXPANDED)
Harvest 0.0 0.0 0.0 0.0 0.0 1.2 1.2 0.0 0.0 0.0 0.0 0.0 0.0 2.4Struck & Lost 0.0 0.0 0.0 0.0 0.0 0.0 0.0 0.0 0.0 0.0 0.0 0.0 0.0 0.0Total Take 0.0 0.0 0.0 0.0 0.0 1.2 1.2 0.0 0.0 0.0 0.0 0.0 0.0 2.4
ESTIMATED SEASONALLY ADJUSTED HARVEST AND TAKE BY COMMUNITY (EXPANDED)
Harvest 0.0 0.0 0.0 0.0 0.0 1.2 1.2 0.0 0.0 0.0 0.0 0.0 2.4Struck & Lost 0.0 0.0 0.0 0.0 0.0 0.0 0.0 0.0 0.0 0.0 0.0 0.0 0.0Total Take 0.0 0.0 0.0 0.0 0.0 1.2 1.2 0.0 0.0 0.0 0.0 0.0 2.4Total Take (%) 0.0% 0.0% 0.0% 0.0% 0.0% 50.0% 50.0% 0.0% 0.0% 0.0% 0.0% 0.0% 100.0%Cum. Take 0.0 0.0 0.0 0.0 0.0 1.2 2.4 2.4 2.4 2.4 2.4 2.4Cum. Take (%) 0.0% 0.0% 0.0% 0.0% 0.0% 50.0% 100.0% 100.0% 100.0% 100.0% 100.0% 100.0%
HARBOR SEAL HARVEST BY MONTH UnknownJan Feb Mar Apr May Jun Jul Aug Sep Oct Nov Dec Month Total
REPORTED HARVEST AND TAKE BY SAMPLED HOUSEHOLDS (UNEXPANDED)
Harvest 0 0 0 1 0 0 0 0 0 0 0 1 0 2Struck & Lost 0 0 0 0 0 0 0 0 0 0 0 0 0 0Total Take 0 0 0 1 0 0 0 0 0 0 0 1 0 2
ESTIMATED HARVEST AND TAKE BY COMMUNITY (EXPANDED)
Harvest 0.0 0.0 0.0 1.2 0.0 0.0 0.0 0.0 0.0 0.0 0.0 1.2 0.0 2.4Struck & Lost 0.0 0.0 0.0 0.0 0.0 0.0 0.0 0.0 0.0 0.0 0.0 0.0 0.0 0.0Total Take 0.0 0.0 0.0 1.2 0.0 0.0 0.0 0.0 0.0 0.0 0.0 1.2 0.0 2.4
ESTIMATED SEASONALLY ADJUSTED HARVEST AND TAKE BY COMMUNITY (EXPANDED)
Harvest 0.0 0.0 0.0 1.2 0.0 0.0 0.0 0.0 0.0 0.0 0.0 1.2 2.4Struck & Lost 0.0 0.0 0.0 0.0 0.0 0.0 0.0 0.0 0.0 0.0 0.0 0.0 0.0Total Take 0.0 0.0 0.0 1.2 0.0 0.0 0.0 0.0 0.0 0.0 0.0 1.2 2.4Total Take (%) 0.0% 0.0% 0.0% 50.0% 0.0% 0.0% 0.0% 0.0% 0.0% 0.0% 0.0% 50.0% 100.0%Cum. Take 0.0 0.0 0.0 1.2 1.2 1.2 1.2 1.2 1.2 1.2 1.2 2.4Cum. Take (%) 0.0% 0.0% 0.0% 50.0% 50.0% 50.0% 50.0% 50.0% 50.0% 50.0% 50.0% 100.0% SOURCE: AMMC Household Surveys, 2007.
C - 89

Table 45. (cont.) SEA LION & HARBOR SEAL HARVEST ESTIMATES: Akutan, 2006
HARVEST BY AGE AND SEXSea Lion Harbor Seal
Reported by Community Est. Reported by Community Est.Sample (Expanded) Sample (Expanded)
Number % Number % Number % Number %Adult Male 1 50.0% 1.2 50.0% 2 100.0% 2.4 100.0%
Adult Female 1 50.0% 1.2 50.0% 0 0.0% 0.0 0.0%Adult Unknown Sex 0 0.0% 0.0 0.0% 0 0.0% 0.0 0.0%
Juvenile Male 0 0.0% 0.0 0.0% 0 0.0% 0.0 0.0%Juvenile Female 0 0.0% 0.0 0.0% 0 0.0% 0.0 0.0%
Juvenile Unknown Sex 0 0.0% 0.0 0.0% 0 0.0% 0.0 0.0%Pup Male 0 0.0% 0.0 0.0% 0 0.0% 0.0 0.0%
Pup Female 0 0.0% 0.0 0.0% 0 0.0% 0.0 0.0%Pup Unknown Sex 0 0.0% 0.0 0.0% 0 0.0% 0.0 0.0%
Male Unknown Age 0 0.0% 0.0 0.0% 0 0.0% 0.0 0.0%Female Unknown Age 0 0.0% 0.0 0.0% 0 0.0% 0.0 0.0%Unknown Sex and Age 0 0.0% 0.0 0.0% 0 0.0% 0.0 0.0%
Total 2 100.0% 2.4 100.0% 2 100.0% 2.4 100.0%
SEASONALLY ADJUSTED TAKE BY MONTH, SEA LION AND HARBOR SEAL
ESTIMATED COMMUNITY HARVEST, STRUCK AND LOST, AND TAKE BY YEARSEA LION HARBOR SEAL
Struck/ Total Struck/ TotalYear Harvest Lost Take Year Harvest Lost Take1992 25.7 4.3 30.0 1992 12.9 4.3 17.11993 14.5 8.9 23.4 1993 15.6 4.5 20.11994 12.7 3.5 16.2 1994 13.8 3.5 17.31995 6.0 0.0 6.0 1995 7.0 0.0 7.01996 11.0 5.0 16.0 1996 8.0 7.0 15.01997 6.4 0.0 6.4 1997 14.0 3.8 17.81998 6.4 0.0 6.4 1998 14.0 3.8 17.82000 4.1 1.4 5.4 2000 25.7 5.4 31.12001 15.0 2.7 17.7 2001 13.6 2.7 16.42002 2.9 0.0 2.9 2002 10.2 0.0 10.22003 8.7 0.0 8.7 2003 10.8 4.3 15.22004 4.8 0.0 4.8 2004 9.5 1.6 11.12005 4.8 0.0 4.8 2005 8.5 2.4 10.92006 2.4 0.0 2.4 2006 2.4 0.0 2.4
SOURCE: Alaska Department of Fish and Game, Division of Subsistence, Household Surveys 1992-1998;AMMC Household Surveys, 2007.
C - 90
0
1
2
Jan Feb Mar Apr May Jun Jul Aug Sep Oct Nov Dec
Seas
onal
ly A
djus
ted
Tota
l Tak
e
Sea Lion Harbor Seal

Table 46. SEA LION AND HARBOR SEAL HARVEST AND TAKE ESTIMATES: Atka, 2006
SAMPLING DESIGN: CENSUS Total Native Households 24
Surveyed Households 12Sampling Fraction 50.0%
Sample Household Members 26Estimated Household Members 52.0
2000 U.S. Census Estimated Native Population 84HARVEST AND USE INFORMATION
Percentage of Native Households: Estimated Community Harvest Sea Harbor and Take (Expanded): Sea Harbor
Lion Seal Lion SealUsed 100.0% 83.3% Total Number Harvested 52.0 26.0
Hunted 41.7% 50.0% Total Number Struck and Lost 14.0 4.0Harvested 41.7% 41.7% Total Number Taken 66.0 30.0Received 91.7% 83.3%
Gave Away 66.7% 58.3% Number Harvested Per Capita 0.62 0.31
SEA LION HARVEST BY MONTH UnknownJan Feb Mar Apr May Jun Jul Aug Sep Oct Nov Dec Month Total
REPORTED HARVEST AND TAKE BY SAMPLED HOUSEHOLDS (UNEXPANDED)Harvest 3 4 3 1 1 1 0 1 0 3 4 2 3 26Struck & Lost 0 1 0 0 0 0 0 0 0 1 2 1 2 7Total Take 3 5 3 1 1 1 0 1 0 4 6 3 5 33
ESTIMATED HARVEST AND TAKE BY COMMUNITY (EXPANDED)Harvest 6.0 8.0 6.0 2.0 2.0 2.0 0.0 2.0 0.0 6.0 8.0 4.0 6.0 52.0Struck & Lost 0.0 2.0 0.0 0.0 0.0 0.0 0.0 0.0 0.0 2.0 4.0 2.0 4.0 14.0Total Take 6.0 10.0 6.0 2.0 2.0 2.0 0.0 2.0 0.0 8.0 12.0 6.0 10.0 66.0
ESTIMATED SEASONALLY ADJUSTED HARVEST AND TAKE BY COMMUNITY (EXPANDED)Harvest 6.8 9.0 6.8 2.3 2.3 2.3 0.0 2.3 0.0 6.8 9.0 4.5 52.0Struck & Lost 0.0 2.8 0.0 0.0 0.0 0.0 0.0 0.0 0.0 2.8 5.6 2.8 14.0Total Take 6.8 11.8 6.8 2.3 2.3 2.3 0.0 2.3 0.0 9.6 14.6 7.3 66.0Total Take (%) 10.3% 17.9% 10.3% 3.4% 3.4% 3.4% 0.0% 3.4% 0.0% 14.5% 22.2% 11.1% 100.0%Cum. Take 6.8 18.6 25.4 27.7 29.9 32.2 32.2 34.5 34.5 44.0 58.7 66.0Cum. Take (%) 10.3% 28.2% 38.5% 41.9% 45.3% 48.8% 48.8% 52.2% 52.2% 66.7% 88.9% 100.0%
HARBOR SEAL HARVEST BY MONTH UnknownJan Feb Mar Apr May Jun Jul Aug Sep Oct Nov Dec Month Total
REPORTED HARVEST AND TAKE BY SAMPLED HOUSEHOLDS (UNEXPANDED)Harvest 0 2 1 0 0 0 0 0 0 0 2 0 8 13Struck & Lost 0 0 0 0 0 0 0 0 0 0 0 1 1 2Total Take 0 2 1 0 0 0 0 0 0 0 2 1 9 15
ESTIMATED HARVEST AND TAKE BY COMMUNITY (EXPANDED)Harvest 0.0 4.0 2.0 0.0 0.0 0.0 0.0 0.0 0.0 0.0 4.0 0.0 16.0 26.0Struck & Lost 0.0 0.0 0.0 0.0 0.0 0.0 0.0 0.0 0.0 0.0 0.0 2.0 2.0 4.0Total Take 0.0 4.0 2.0 0.0 0.0 0.0 0.0 0.0 0.0 0.0 4.0 2.0 18.0 30.0
ESTIMATED SEASONALLY ADJUSTED HARVEST AND TAKE BY COMMUNITY (EXPANDED)Harvest 0.0 10.4 5.2 0.0 0.0 0.0 0.0 0.0 0.0 0.0 10.4 0.0 26.0Struck & Lost 0.0 0.0 0.0 0.0 0.0 0.0 0.0 0.0 0.0 0.0 0.0 4.0 4.0Total Take 0.0 10.4 5.2 0.0 0.0 0.0 0.0 0.0 0.0 0.0 10.4 4.0 30.0Total Take (%) 0.0% 34.7% 17.3% 0.0% 0.0% 0.0% 0.0% 0.0% 0.0% 0.0% 34.7% 13.3% 100.0%Cum. Take 0.0 10.4 15.6 15.6 15.6 15.6 15.6 15.6 15.6 15.6 26.0 30.0Cum. Take (%) 0.0% 34.7% 52.0% 52.0% 52.0% 52.0% 52.0% 52.0% 52.0% 52.0% 86.7% 100.0% SOURCE: AMMC Household Surveys, 2007.
C - 91

Table 46. (cont.) SEA LION & HARBOR SEAL HARVEST ESTIMATES: Atka, 2006
HARVEST BY AGE AND SEXSea Lion Harbor Seal
Reported by Community Est. Reported by Community Est.Sample (Expanded) Sample (Expanded)
Number % Number % Number % Number %Adult Male 16 61.5% 32.0 61.5% 11 84.6% 22.0 84.6%
Adult Female 1 3.8% 2.0 3.8% 0 0.0% 0.0 0.0%Adult Unknown Sex 0 0.0% 0.0 0.0% 0 0.0% 0.0 0.0%
Juvenile Male 2 7.7% 4.0 7.7% 1 7.7% 2.0 7.7%Juvenile Female 0 0.0% 0.0 0.0% 0 0.0% 0.0 0.0%
Juvenile Unknown Sex 0 0.0% 0.0 0.0% 0 0.0% 0.0 0.0%Pup Male 0 0.0% 0.0 0.0% 0 0.0% 0.0 0.0%
Pup Female 0 0.0% 0.0 0.0% 0 0.0% 0.0 0.0%Pup Unknown Sex 0 0.0% 0.0 0.0% 0 0.0% 0.0 0.0%
Male Unknown Age 0 0.0% 0.0 0.0% 0 0.0% 0.0 0.0%Female Unknown Age 0 0.0% 0.0 0.0% 0 0.0% 0.0 0.0%Unknown Sex and Age 7 26.9% 14.0 26.9% 1 7.7% 2.0 7.7%
Total 26 100.0% 52.0 100.0% 13 100.0% 26.0 100.0%
SEASONALLY ADJUSTED TAKE BY MONTH, SEA LION AND HARBOR SEAL
ESTIMATED COMMUNITY HARVEST, STRUCK AND LOST, AND TAKE BY YEAR
SEA LION HARBOR SEALStruck/ Total Struck/ Total
Year Harvest Lost Take Year Harvest Lost Take
1992 28.6 9.9 38.5 1992 28.6 9.9 38.51993 25.1 0.0 25.1 1993 32.7 0.0 32.71994 45.5 8.7 54.2 1994 73.7 8.7 82.31995 40.0 0.0 40.0 1995 42.5 0.0 42.51996 17.3 0.0 17.3 1996 22.7 2.2 24.81997 12.2 0.0 12.2 1997 26.0 1.5 27.51998 16.8 0.0 16.8 1998 16.8 0.0 16.82000 16.8 0.0 16.8 2000 16.8 0.0 16.82001 33.3 11.7 45.0 2002 63.3 6.7 70.02002 73.5 12.0 85.5 2001 36.0 0.0 36.02003 68.8 12.8 81.6 2003 57.6 1.6 59.22004 50.7 12.7 63.3 2004 73.9 16.9 90.82005 54.9 6.1 61.0 2005 47.2 9.1 56.42006 52.0 14.0 66.0 2006 26.0 4.0 30.0
SOURCE: Alaska Department of Fish and Game, Division of Subsistence, Household Surveys 1992-1998;AMMC Household Surveys, 2007.
C - 92
0
2
4
6
8
10
12
14
16
Jan Feb Mar Apr May Jun Jul Aug Sep Oct Nov Dec
Seas
onal
ly A
djus
ted
Tota
l Tak
e
Sea Lion Harbor Seal

Table 47. SEA LION AND HARBOR SEAL HARVEST AND TAKE ESTIMATES: Nikolski, 2006
SAMPLING DESIGN: CHAIN REFERRAL Total Native Households 5
Surveyed Households 5Sampling Fraction 100.0%
Sample Household Members 15Estimated Household Members 15.0
2000 U.S. Census Estimated Native Population 27HARVEST AND USE INFORMATION
Percentage of Native Households: Estimated Community Harvest Sea Harbor and Take (Expanded): Sea Harbor
Lion Seal Lion SealUsed 0.0% 100.0% Total Number Harvested 0.0 17.0
Hunted 0.0% 100.0% Total Number Struck and Lost 0.0 1.0Harvested 0.0% 100.0% Total Number Taken 0.0 18.0Received 0.0% 80.0%
Gave Away 0.0% 100.0% Number Harvested Per Capita 0.00 0.63
SEA LION HARVEST BY MONTH UnknownJan Feb Mar Apr May Jun Jul Aug Sep Oct Nov Dec Month Total
REPORTED HARVEST AND TAKE BY SAMPLED HOUSEHOLDS (UNEXPANDED)Harvest 0 0 0 0 0 0 0 0 0 0 0 0 0 0Struck & Lost 0 0 0 0 0 0 0 0 0 0 0 0 0 0Total Take 0 0 0 0 0 0 0 0 0 0 0 0 0 0
ESTIMATED HARVEST AND TAKE BY COMMUNITY (EXPANDED)Harvest 0.0 0.0 0.0 0.0 0.0 0.0 0.0 0.0 0.0 0.0 0.0 0.0 0.0 0.0Struck & Lost 0.0 0.0 0.0 0.0 0.0 0.0 0.0 0.0 0.0 0.0 0.0 0.0 0.0 0.0Total Take 0.0 0.0 0.0 0.0 0.0 0.0 0.0 0.0 0.0 0.0 0.0 0.0 0.0 0.0
ESTIMATED SEASONALLY ADJUSTED HARVEST AND TAKE BY COMMUNITY (EXPANDED)Harvest 0.0 0.0 0.0 0.0 0.0 0.0 0.0 0.0 0.0 0.0 0.0 0.0 0.0Struck & Lost 0.0 0.0 0.0 0.0 0.0 0.0 0.0 0.0 0.0 0.0 0.0 0.0 0.0Total Take 0.0 0.0 0.0 0.0 0.0 0.0 0.0 0.0 0.0 0.0 0.0 0.0 0.0Total Take (%) --- --- --- --- --- --- --- --- --- --- --- --- ---Cum. Take 0.0 0.0 0.0 0.0 0.0 0.0 0.0 0.0 0.0 0.0 0.0 0.0Cum. Take (%) --- --- --- --- --- --- --- --- --- --- --- ---
HARBOR SEAL HARVEST BY MONTH UnknownJan Feb Mar Apr May Jun Jul Aug Sep Oct Nov Dec Month Total
REPORTED HARVEST AND TAKE BY SAMPLED HOUSEHOLDS (UNEXPANDED)Harvest 1 1 4 0 0 0 1 7 0 1 0 2 0 17Struck & Lost 0 0 0 0 0 0 0 1 0 0 0 0 0 1Total Take 1 1 4 0 0 0 1 8 0 1 0 2 0 18
ESTIMATED HARVEST AND TAKE BY COMMUNITY (EXPANDED)Harvest 1.0 1.0 4.0 0.0 0.0 0.0 1.0 7.0 0.0 1.0 0.0 2.0 0.0 17.0Struck & Lost 0.0 0.0 0.0 0.0 0.0 0.0 0.0 1.0 0.0 0.0 0.0 0.0 0.0 1.0Total Take 1.0 1.0 4.0 0.0 0.0 0.0 1.0 8.0 0.0 1.0 0.0 2.0 0.0 18.0
ESTIMATED SEASONALLY ADJUSTED HARVEST AND TAKE BY COMMUNITY (EXPANDED)Harvest 1.0 1.0 4.0 0.0 0.0 0.0 1.0 7.0 0.0 1.0 0.0 2.0 17.0Struck & Lost 0.0 0.0 0.0 0.0 0.0 0.0 0.0 1.0 0.0 0.0 0.0 0.0 1.0Total Take 1.0 1.0 4.0 0.0 0.0 0.0 1.0 8.0 0.0 1.0 0.0 2.0 18.0Total Take (%) 5.6% 5.6% 22.2% 0.0% 0.0% 0.0% 5.6% 44.4% 0.0% 5.6% 0.0% 11.1% 100.0%Cum. Take 1.0 2.0 6.0 6.0 6.0 6.0 7.0 15.0 15.0 16.0 16.0 18.0Cum. Take (%) 5.6% 11.1% 33.3% 33.3% 33.3% 33.3% 38.9% 83.3% 83.3% 88.9% 88.9% 100.0% SOURCE: AMMC Household Surveys, 2007.
C - 93

Table 47. (cont.) SEA LION & HARBOR SEAL HARVEST ESTIMATES: Nikolski, 2006
HARVEST BY AGE AND SEXSea Lion Harbor Seal
Reported by Community Est. Reported by Community Est.Sample (Expanded) Sample (Expanded)
Number % Number % Number % Number %Adult Male 0 --- 0.0 --- 11 64.7% 11.0 64.7%
Adult Female 0 --- 0.0 --- 1 5.9% 1.0 5.9%Adult Unknown Sex 0 --- 0.0 --- 0 0.0% 0.0 0.0%
Juvenile Male 0 --- 0.0 --- 1 5.9% 1.0 5.9%Juvenile Female 0 --- 0.0 --- 0 0.0% 0.0 0.0%
Juvenile Unknown Sex 0 --- 0.0 --- 0 0.0% 0.0 0.0%Pup Male 0 --- 0.0 --- 0 0.0% 0.0 0.0%
Pup Female 0 --- 0.0 --- 0 0.0% 0.0 0.0%Pup Unknown Sex 0 --- 0.0 --- 0 0.0% 0.0 0.0%
Male Unknown Age 0 --- 0.0 --- 0 0.0% 0.0 0.0%Female Unknown Age 0 --- 0.0 --- 0 0.0% 0.0 0.0%Unknown Sex and Age 0 --- 0.0 --- 4 23.5% 4.0 23.5%
Total 0 --- 0.0 --- 17 100.0% 17.0 100.0%
SEASONALLY ADJUSTED TAKE BY MONTH, SEA LION AND HARBOR SEAL
ESTIMATED COMMUNITY HARVEST, STRUCK AND LOST, AND TAKE BY YEAR
SEA LION HARBOR SEALStruck/ Total Struck/ Total
Year Harvest Lost Take Year Harvest Lost Take
1992 8.2 0.0 8.2 1992 5.8 3.5 9.31993 6.0 0.0 6.0 1993 4.0 1.0 5.01994 0.0 0.0 0.0 1994 6.0 0.0 6.01995 --- --- --- 1995 --- --- ---1996 3.0 0.0 3.0 1996 4.0 1.0 5.01997 3.0 0.0 3.0 1997 4.0 1.0 5.01998 1.1 0.0 1.1 1998 2.2 0.0 2.22000 1.1 0.0 1.1 2000 2.2 0.0 2.22001 6.7 0.0 6.7 2001 5.3 0.0 5.32002 1.0 0.0 1.0 2002 3.0 1.0 4.02003 0.0 0.0 0.0 2003 11.0 3.0 14.02004 2.0 0.0 2.0 2004 6.0 1.0 7.02005 2.0 0.0 2.0 2005 6.0 1.0 7.02006 0.0 0.0 0.0 2006 17.0 1.0 18.0
SOURCE: Alaska Department of Fish and Game, Division of Subsistence, Household Surveys 1992-1998;AMMC Household Surveys, 2007.
C - 94
0
1
2
3
4
5
6
7
8
9
Jan Feb Mar Apr May Jun Jul Aug Sep Oct Nov Dec
Seas
onal
ly A
djus
ted
Tota
l Tak
e
Sea Lion Harbor Seal

Table 48. SEA LION AND HARBOR SEAL HARVEST AND TAKE ESTIMATES: Unalaska, 2006
SAMPLING DESIGN: CHAIN REFERRAL Total Referred Households 18
Surveyed Households 10Sampling Fraction 55.6%
Sample Household Members 30Estimated Household Members 54.0
2000 U.S. Census Estimated Native Population 397HARVEST AND USE INFORMATION
Percentage of Native Households: Estimated Community Harvest Sea Harbor and Take (Expanded): Sea Harbor
Lion Seal Lion SealUsed 20.0% 20.0% Total Number Harvested 9.0 9.0
Hunted 20.0% 20.0% Total Number Struck and Lost 5.4 3.6Harvested 20.0% 20.0% Total Number Taken 14.4 12.6Received 20.0% 10.0%
Gave Away 20.0% 20.0% Number Harvested Per Capita 0.02 0.02
SEA LION HARVEST BY MONTH UnknownJan Feb Mar Apr May Jun Jul Aug Sep Oct Nov Dec Month Total
REPORTED HARVEST AND TAKE BY SAMPLED HOUSEHOLDS (UNEXPANDED)Harvest 0 0 0 0 0 0 0 2 2 0 0 0 1 5Struck & Lost 0 1 0 0 0 0 1 0 0 0 0 1 0 3Total Take 0 1 0 0 0 0 1 2 2 0 0 1 1 8
ESTIMATED HARVEST AND TAKE BY COMMUNITY (EXPANDED)Harvest 0.0 0.0 0.0 0.0 0.0 0.0 0.0 3.6 3.6 0.0 0.0 0.0 1.8 9.0Struck & Lost 0.0 1.8 0.0 0.0 0.0 0.0 1.8 0.0 0.0 0.0 0.0 1.8 0.0 5.4Total Take 0.0 1.8 0.0 0.0 0.0 0.0 1.8 3.6 3.6 0.0 0.0 1.8 1.8 14.4
ESTIMATED SEASONALLY ADJUSTED HARVEST AND TAKE BY COMMUNITY (EXPANDED)Harvest 0.0 0.0 0.0 0.0 0.0 0.0 0.0 4.5 4.5 0.0 0.0 0.0 9.0Struck & Lost 0.0 1.8 0.0 0.0 0.0 0.0 1.8 0.0 0.0 0.0 0.0 1.8 5.4Total Take 0.0 1.8 0.0 0.0 0.0 0.0 1.8 4.5 4.5 0.0 0.0 1.8 14.4Total Take (%) 0.0% 12.5% 0.0% 0.0% 0.0% 0.0% 12.5% 31.3% 31.3% 0.0% 0.0% 12.5% 100.0%Cum. Take 0.0 1.8 1.8 1.8 1.8 1.8 3.6 8.1 12.6 12.6 12.6 14.4Cum. Take (%) 0.0% 12.5% 12.5% 12.5% 12.5% 12.5% 25.0% 56.3% 87.5% 87.5% 87.5% 100.0%
HARBOR SEAL HARVEST BY MONTH UnknownJan Feb Mar Apr May Jun Jul Aug Sep Oct Nov Dec Month Total
REPORTED HARVEST AND TAKE BY SAMPLED HOUSEHOLDS (UNEXPANDED)Harvest 2 1 0 0 0 0 0 1 1 0 0 0 0 5Struck & Lost 0 0 0 0 0 0 0 0 0 0 0 0 2 2Total Take 2 1 0 0 0 0 0 1 1 0 0 0 2 7
ESTIMATED HARVEST AND TAKE BY COMMUNITY (EXPANDED)Harvest 3.6 1.8 0.0 0.0 0.0 0.0 0.0 1.8 1.8 0.0 0.0 0.0 0.0 9.0Struck & Lost 0.0 0.0 0.0 0.0 0.0 0.0 0.0 0.0 0.0 0.0 0.0 0.0 3.6 3.6Total Take 3.6 1.8 0.0 0.0 0.0 0.0 0.0 1.8 1.8 0.0 0.0 0.0 3.6 12.6
ESTIMATED SEASONALLY ADJUSTED HARVEST AND TAKE BY COMMUNITY (EXPANDED)Harvest 3.6 1.8 0.0 0.0 0.0 0.0 0.0 1.8 1.8 0.0 0.0 0.0 9.0Struck & Lost 1.4 0.7 0.0 0.0 0.0 0.0 0.0 0.7 0.7 0.0 0.0 0.0 3.6Total Take 5.0 2.5 0.0 0.0 0.0 0.0 0.0 2.5 2.5 0.0 0.0 0.0 12.6Total Take (%) 40.0% 20.0% 0.0% 0.0% 0.0% 0.0% 0.0% 20.0% 20.0% 0.0% 0.0% 0.0% 100.0%Cum. Take 5.0 7.6 7.6 7.6 7.6 7.6 7.6 10.1 12.6 12.6 12.6 12.6Cum. Take (%) 40.0% 60.0% 60.0% 60.0% 60.0% 60.0% 60.0% 80.0% 100.0% 100.0% 100.0% 100.0% SOURCE: AMMC Household Surveys, 2007.
C - 95

Table 48. (cont.) SEA LION & HARBOR SEAL HARVEST ESTIMATES: Unalaska, 2006HARVEST BY AGE AND SEX
Sea Lion Harbor SealReported by Community Est. Reported by Community Est.
Sample (Expanded) Sample (Expanded)Number % Number % Number % Number %
Adult Male 0 0.0% 0.0 0.0% 1 20.0% 1.8 20.0%Adult Female 2 40.0% 3.6 40.0% 1 20.0% 1.8 20.0%
Adult Unknown Sex 2 40.0% 3.6 40.0% 1 20.0% 1.8 20.0%Juvenile Male 0 0.0% 0.0 0.0% 1 20.0% 1.8 20.0%
Juvenile Female 0 0.0% 0.0 0.0% 0 0.0% 0.0 0.0%Juvenile Unknown Sex 1 20.0% 1.8 20.0% 1 20.0% 1.8 20.0%
Pup Male 0 0.0% 0.0 0.0% 0 0.0% 0.0 0.0%Pup Female 0 0.0% 0.0 0.0% 0 0.0% 0.0 0.0%
Pup Unknown Sex 0 0.0% 0.0 0.0% 0 0.0% 0.0 0.0%Male Unknown Age 0 0.0% 0.0 0.0% 0 0.0% 0.0 0.0%
Female Unknown Age 0 0.0% 0.0 0.0% 0 0.0% 0.0 0.0%Unknown Sex and Age 0 0.0% 0.0 0.0% 0 0.0% 0.0 0.0%
Total 5 100.0% 9.0 100.0% 5 100.0% 9.0 100.0%
SEASONALLY ADJUSTED TAKE BY MONTH, SEA LION AND HARBOR SEAL
ESTIMATED COMMUNITY HARVEST, STRUCK AND LOST, AND TAKE BY YEAR
SEA LION HARBOR SEALStruck/ Total Struck/ Total
Year Harvest Lost Take Year Harvest Lost Take
1992 41.8 16.7 58.5 1992 47.0 3.7 50.81993 53.4 15.9 69.3 1993 32.7 9.9 42.61994 43.6 8.4 51.9 1994 31.4 10.5 41.81995 39.0 11.1 50.1 1995 37.4 9.7 47.11996 15.2 6.3 21.6 1996 20.3 5.1 25.41997 29.1 1.3 30.3 1997 26.5 0.0 26.51998 7.3 5.5 12.7 1998 12.7 0.0 12.72000 49.2 3.4 52.6 2000 34.3 5.1 39.42001 23.1 5.3 28.4 2001 37.8 3.2 41.02002 10.0 5.7 15.7 2002 14.3 1.4 15.72003 10.0 5.7 15.7 2003 14.3 1.4 15.72004 11.4 11.4 22.9 2004 28.6 8.6 37.12005 12.0 4.5 16.5 2005 30.0 4.5 34.52006 9.0 5.4 14.4 2006 9.0 3.6 12.6
SOURCE: Alaska Department of Fish and Game, Division of Subsistence, Household Surveys 1992-1998;AMMC Household Surveys, 2007.
C - 96
0
1
2
3
4
5
6
Jan Feb Mar Apr May Jun Jul Aug Sep Oct Nov Dec
Seas
onal
ly A
djus
ted
Tota
l Tak
e
Sea Lion Harbor Seal

Table 49. SEA LION AND HARBOR SEAL HARVEST AND TAKE ESTIMATES: St. George, 2006
SAMPLING DESIGN: CHAIN REFERRAL Total Referred Households 7
Surveyed Households 3Sampling Fraction
Sample Household Members 9Estimated Household Members 21.0
2000 U.S. Census Estimated Native Population 140HARVEST AND USE INFORMATION
Percentage of Native Households: Estimated Community Harvest Sea Harbor and Take (Expanded): Sea Harbor
Lion Seal Lion SealUsed 100.0% 0.0% Total Number Harvested 9.3 0.0
Hunted 100.0% 0.0% Total Number Struck and Lost 4.7 0.0Harvested 100.0% 0.0% Total Number Taken 14.0 0.0Received 66.7% 0.0%
Gave Away 100.0% 0.0% Number Harvested Per Capita 0.07 0.00
SEA LION HARVEST BY MONTH UnknownJan Feb Mar Apr May Jun Jul Aug Sep Oct Nov Dec Month Total
REPORTED HARVEST AND TAKE BY SAMPLED HOUSEHOLDS (UNEXPANDED)Harvest 0 0 3 0 0 0 0 0 1 0 0 0 0 4Struck & Lost 0 0 1 0 0 0 0 0 0 1 0 0 0 2Total Take 0 0 4 0 0 0 0 0 1 1 0 0 0 6
ESTIMATED HARVEST AND TAKE BY COMMUNITY (EXPANDED)Harvest 0.0 0.0 7.0 0.0 0.0 0.0 0.0 0.0 2.3 0.0 0.0 0.0 0.0 9.3Struck & Lost 0.0 0.0 2.3 0.0 0.0 0.0 0.0 0.0 0.0 2.3 0.0 0.0 0.0 4.7Total Take 0.0 0.0 9.3 0.0 0.0 0.0 0.0 0.0 2.3 2.3 0.0 0.0 0.0 14.0
ESTIMATED SEASONALLY ADJUSTED HARVEST AND TAKE BY COMMUNITY (EXPANDED)Harvest 0.0 0.0 7.0 0.0 0.0 0.0 0.0 0.0 2.3 0.0 0.0 0.0 9.3Struck & Lost 0.0 0.0 2.3 0.0 0.0 0.0 0.0 0.0 0.0 2.3 0.0 0.0 4.7Total Take 0.0 0.0 9.3 0.0 0.0 0.0 0.0 0.0 2.3 2.3 0.0 0.0 14.0Total Take (%) 0.0% 0.0% 66.7% 0.0% 0.0% 0.0% 0.0% 0.0% 16.7% 16.7% 0.0% 0.0% 100.0%Cum. Take 0.0 0.0 9.3 9.3 9.3 9.3 9.3 9.3 11.7 14.0 14.0 14.0Cum. Take (%) 0.0% 0.0% 66.7% 66.7% 66.7% 66.7% 66.7% 66.7% 83.3% 100.0% 100.0% 100.0%
HARBOR SEAL HARVEST BY MONTH UnknownJan Feb Mar Apr May Jun Jul Aug Sep Oct Nov Dec Month Total
REPORTED HARVEST AND TAKE BY SAMPLED HOUSEHOLDS (UNEXPANDED)Harvest 0 0 0 0 0 0 0 0 0 0 0 0 0 0Struck & Lost 0 0 0 0 0 0 0 0 0 0 0 0 0 0Total Take 0 0 0 0 0 0 0 0 0 0 0 0 0 0
ESTIMATED HARVEST AND TAKE BY COMMUNITY (EXPANDED)Harvest 0.0 0.0 0.0 0.0 0.0 0.0 0.0 0.0 0.0 0.0 0.0 0.0 0.0 0.0Struck & Lost 0.0 0.0 0.0 0.0 0.0 0.0 0.0 0.0 0.0 0.0 0.0 0.0 0.0 0.0Total Take 0.0 0.0 0.0 0.0 0.0 0.0 0.0 0.0 0.0 0.0 0.0 0.0 0.0 0.0
ESTIMATED SEASONALLY ADJUSTED HARVEST AND TAKE BY COMMUNITY (EXPANDED)Harvest 0.0 0.0 0.0 0.0 0.0 0.0 0.0 0.0 0.0 0.0 0.0 0.0 0.0Struck & Lost 0.0 0.0 0.0 0.0 0.0 0.0 0.0 0.0 0.0 0.0 0.0 0.0 0.0Total Take 0.0 0.0 0.0 0.0 0.0 0.0 0.0 0.0 0.0 0.0 0.0 0.0 0.0Total Take (%) --- --- --- --- --- --- --- --- --- --- --- --- ---Cum. Take 0.0 0.0 0.0 0.0 0.0 0.0 0.0 0.0 0.0 0.0 0.0 0.0Cum. Take (%) --- --- --- --- --- --- --- --- --- --- --- --- SOURCE: Alaska Department of Fish and Game, Division of Subsistence, Household Surveys,
C - 97
42.9%
with assistance from the St. George Traditional IRA Council, City of St. George, and St. George Tanaq Corporation, 2003. (Numbers based on 2003 Survey Estimates)

Table 49. (cont.) SEA LION & HARBOR SEAL HARVEST ESTIMATES: St. George, 2006
HARVEST BY AGE AND SEXSea Lion Harbor Seal
Reported by Community Est. Reported by Community Est.Sample (Expanded) Sample (Expanded)
Number % Number % Number % Number %Adult Male 1 25.0% 2.3 25.0% 0 --- 0.0 ---
Adult Female 0 0.0% 0.0 0.0% 0 --- 0.0 ---Adult Unknown Sex 0 0.0% 0.0 0.0% 0 --- 0.0 ---
Juvenile Male 3 75.0% 7.0 75.0% 0 --- 0.0 ---Juvenile Female 0 0.0% 0.0 0.0% 0 --- 0.0 ---
Juvenile Unknown Sex 0 0.0% 0.0 0.0% 0 --- 0.0 ---Pup Male 0 0.0% 0.0 0.0% 0 --- 0.0 ---
Pup Female 0 0.0% 0.0 0.0% 0 --- 0.0 ---Pup Unknown Sex 0 0.0% 0.0 0.0% 0 --- 0.0 ---
Male Unknown Age 0 0.0% 0.0 0.0% 0 --- 0.0 ---Female Unknown Age 0 0.0% 0.0 0.0% 0 --- 0.0 ---Unknown Sex and Age 0 0.0% 0.0 0.0% 0 --- 0.0 ---
Total 4 100.0% 9.3 100.0% 0 --- 0.0 ---
SEASONALLY ADJUSTED TAKE BY MONTH, SEA LION AND HARBOR SEAL
ESTIMATED COMMUNITY HARVEST, STRUCK AND LOST, AND TAKE BY YEAR
SEA LION HARBOR SEALStruck/ Total Struck/ Total
Year Harvest Lost Take Year Harvest Lost Take1992 14.9 55.0 69.9 1992 0.0 0.0 0.01993 3.7 14.8 18.6 1993 0.0 0.0 0.01994 2.8 17.1 19.9 1994 0.0 0.0 0.01995 4.0 4.0 8.0 1995 0.0 0.0 0.01996 4.0 4.0 8.0 1996 0.0 0.0 0.01997 19.6 8.1 27.7 1997 0.0 0.0 0.01998 11.8 8.5 20.3 1998 0.0 0.0 0.02000 11.8 8.5 20.3 2000 0.0 0.0 0.02001 7.0 7.0 14.0 2001 0.0 1.0 1.02002 6.0 1.0 7.0 2002 0.0 0.0 0.02003 9.3 4.7 14.0 2003 0.0 0.0 0.02004 9.3 4.7 14.0 2004 0.0 0.0 0.02005 9.3 4.7 14.0 2005 0.0 0.0 0.02006 9.3 4.7 14.0 2006 0.0 0.0 0.0
SOURCE: Alaska Department of Fish and Game, Division of Subsistence, Housewhold Surveys 1992-1998;
C - 98
St George Traditional IRA Council and St. George Tanaq Corporation 2000-2003 (Numbers based on 2003 survey estimates).
0
1
2
3
4
5
6
7
8
9
10
Jan Feb Mar Apr May Jun Jul Aug Sep Oct Nov Dec
Seas
onal
ly A
djus
ted
Tota
l Tak
e
Sea Lion Harbor Seal

Table 50. SEA LION AND HARBOR SEAL HARVEST AND TAKE ESTIMATES: St. Paul, 2006
SAMPLING DESIGN: CENSUS Total Native Households N/A
Surveyed Households N/ASampling Fraction N/A
Sample Household Members N/AEstimated Household Members N/A
2000 U.S. Census Estimated Native Population 460HARVEST AND USE INFORMATION
Percentage of Native Households: Community Harvest Sea Harbor and Take: Sea Harbor
Lion Seal Lion SealUsed N/A N/A Total Number Harvested 20.0 N/A
Hunted N/A N/A Total Number Struck and Lost 6.0 N/AHarvested N/A N/A Total Number Taken 26.0 N/AReceived N/A N/A
Gave Away N/A N/A Number Harvested Per Capita 0.04 N/A
SEA LION HARVEST BY MONTH UnknownJan Feb Mar Apr May Jun Jul Aug Sep Oct Nov Dec Month Total
HARVEST AND TAKE BY COMMUNITY Harvest 4.0 6.0 4.0 0.0 0.0 1.0 0.0 0.0 2.0 1.0 2.0 0.0 0.0 20.0Struck & Lost 0.0 3.0 0.0 0.0 0.0 1.0 0.0 0.0 0.0 0.0 2.0 0.0 0.0 6.0Total Take 4.0 9.0 4.0 0.0 0.0 2.0 0.0 0.0 2.0 1.0 4.0 0.0 0.0 26.0Total Take (%) 15.4% 34.6% 15.4% 0.0% 0.0% 7.7% 0.0% 0.0% 7.7% 3.8% 15.4% 0.0% 100.0%Cum. Take 4.0 13.0 17.0 17.0 17.0 19.0 19.0 19.0 21.0 22.0 26.0 26.0Cum. Take (%) 15.4% 50.0% 65.4% 65.4% 65.4% 73.1% 73.1% 73.1% 80.8% 84.6% 100.0% 100.0%
HARBOR SEAL HARVEST BY MONTH UnknownJan Feb Mar Apr May Jun Jul Aug Sep Oct Nov Dec Month Total
HARVEST AND TAKE BY COMMUNITY Harvest N/A N/A N/A N/A N/A N/A N/A N/A N/A N/A N/A N/A N/A N/AStruck & Lost N/A N/A N/A N/A N/A N/A N/A N/A N/A N/A N/A N/A N/A N/ATotal Take N/A N/A N/A N/A N/A N/A N/A N/A N/A N/A N/A N/A N/A N/A
SEASONALLY ADJUSTED HARVEST AND TAKE BY COMMUNITYHarvest N/A N/A N/A N/A N/A N/A N/A N/A N/A N/A N/A N/A N/A N/AStruck & Lost N/A N/A N/A N/A N/A N/A N/A N/A N/A N/A N/A N/A N/A N/ATotal Take N/A N/A N/A N/A N/A N/A N/A N/A N/A N/A N/A N/A N/A N/ATotal Take (%)Cum. TakeCum. Take (%)SOURCE: Lestenkof et al. 2007.
C - 99
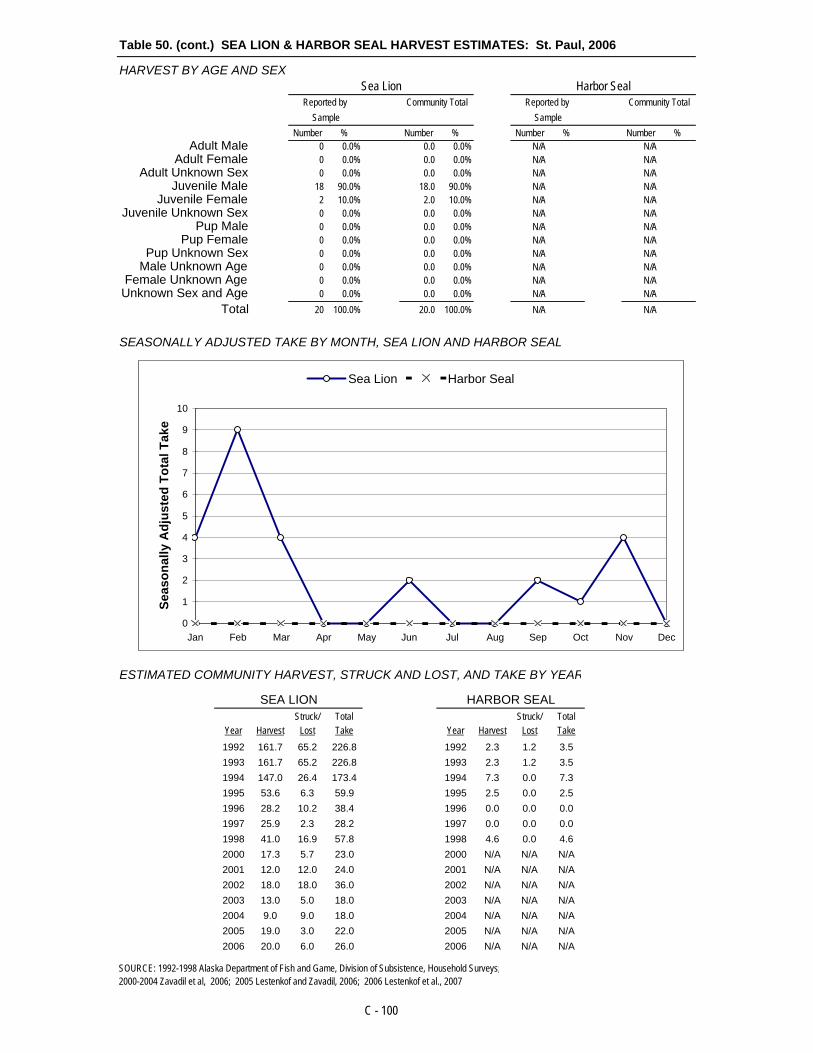
Table 50. (cont.) SEA LION & HARBOR SEAL HARVEST ESTIMATES: St. Paul, 2006
HARVEST BY AGE AND SEXSea Lion Harbor Seal
Reported by Community Total Reported by Community TotalSample Sample
Number % Number % Number % Number %Adult Male 0 0.0% 0.0 0.0% N/A N/A
Adult Female 0 0.0% 0.0 0.0% N/A N/AAdult Unknown Sex 0 0.0% 0.0 0.0% N/A N/A
Juvenile Male 18 90.0% 18.0 90.0% N/A N/AJuvenile Female 2 10.0% 2.0 10.0% N/A N/A
Juvenile Unknown Sex 0 0.0% 0.0 0.0% N/A N/APup Male 0 0.0% 0.0 0.0% N/A N/A
Pup Female 0 0.0% 0.0 0.0% N/A N/APup Unknown Sex 0 0.0% 0.0 0.0% N/A N/A
Male Unknown Age 0 0.0% 0.0 0.0% N/A N/AFemale Unknown Age 0 0.0% 0.0 0.0% N/A N/A
Unknown Sex and Age 0 0.0% 0.0 0.0% N/A N/ATotal 20 100.0% 20.0 100.0% N/A N/A
SEASONALLY ADJUSTED TAKE BY MONTH, SEA LION AND HARBOR SEAL
ESTIMATED COMMUNITY HARVEST, STRUCK AND LOST, AND TAKE BY YEAR
SEA LION HARBOR SEALStruck/ Total Struck/ Total
Year Harvest Lost Take Year Harvest Lost Take1992 161.7 65.2 226.8 1992 2.3 1.2 3.51993 161.7 65.2 226.8 1993 2.3 1.2 3.51994 147.0 26.4 173.4 1994 7.3 0.0 7.31995 53.6 6.3 59.9 1995 2.5 0.0 2.51996 28.2 10.2 38.4 1996 0.0 0.0 0.01997 25.9 2.3 28.2 1997 0.0 0.0 0.01998 41.0 16.9 57.8 1998 4.6 0.0 4.62000 17.3 5.7 23.0 2000 N/A N/A N/A2001 12.0 12.0 24.0 2001 N/A N/A N/A2002 18.0 18.0 36.0 2002 N/A N/A N/A2003 13.0 5.0 18.0 2003 N/A N/A N/A2004 9.0 9.0 18.0 2004 N/A N/A N/A2005 19.0 3.0 22.0 2005 N/A N/A N/A2006 20.0 6.0 26.0 2006 N/A N/A N/A
SOURCE: 1992-1998 Alaska Department of Fish and Game, Division of Subsistence, Household Surveys;2000-2004 Zavadil et al, 2006; 2005 Lestenkof and Zavadil, 2006; 2006 Lestenkof et al., 2007
C - 100
0
1
2
3
4
5
6
7
8
9
10
Jan Feb Mar Apr May Jun Jul Aug Sep Oct Nov Dec
Seas
onal
ly A
djus
ted
Tota
l Tak
e
Sea Lion Harbor Seal

Table 51. SEA LION AND HARBOR SEAL HARVEST AND TAKE ESTIMATES: Egegik, 2006
SAMPLING DESIGN: CENSUS Total Native Households 27
Surveyed Households 27Sampling Fraction
Sample Household Members 57Estimated Household Members 57.0
2000 U.S. Census Estimated Native Population 89HARVEST AND USE INFORMATION
Percentage of Native Households: Estimated Community Harvest Sea Harbor and Take (Expanded): Sea Harbor
Lion Seal Lion SealUsed 0.0% 11.1% Total Number Harvested 0.0 3.0
Hunted 0.0% 3.7% Total Number Struck and Lost 0.0 0.0Harvested 0.0% 3.7% Total Number Taken 0.0 3.0Received 0.0% 7.4%
Gave Away 0.0% 0.0% Number Harvested Per Capita 0.00 0.03
SEA LION HARVEST BY MONTH UnknownJan Feb Mar Apr May Jun Jul Aug Sep Oct Nov Dec Month Total
REPORTED HARVEST AND TAKE BY SAMPLED HOUSEHOLDS (UNEXPANDED)Harvest 0 0 0 0 0 0 0 0 0 0 0 0 0 0Struck & Lost 0 0 0 0 0 0 0 0 0 0 0 0 0 0Total Take 0 0 0 0 0 0 0 0 0 0 0 0 0 0
ESTIMATED HARVEST AND TAKE BY COMMUNITY (EXPANDED)Harvest 0.0 0.0 0.0 0.0 0.0 0.0 0.0 0.0 0.0 0.0 0.0 0.0 0.0 0.0Struck & Lost 0.0 0.0 0.0 0.0 0.0 0.0 0.0 0.0 0.0 0.0 0.0 0.0 0.0 0.0Total Take 0.0 0.0 0.0 0.0 0.0 0.0 0.0 0.0 0.0 0.0 0.0 0.0 0.0 0.0
ESTIMATED SEASONALLY ADJUSTED HARVEST AND TAKE BY COMMUNITY (EXPANDED)Harvest 0.0 0.0 0.0 0.0 0.0 0.0 0.0 0.0 0.0 0.0 0.0 0.0 0.0Struck & Lost 0.0 0.0 0.0 0.0 0.0 0.0 0.0 0.0 0.0 0.0 0.0 0.0 0.0Total Take 0.0 0.0 0.0 0.0 0.0 0.0 0.0 0.0 0.0 0.0 0.0 0.0 0.0Total Take (%) --- --- --- --- --- --- --- --- --- --- --- --- ---Cum. Take 0.0 0.0 0.0 0.0 0.0 0.0 0.0 0.0 0.0 0.0 0.0 0.0Cum. Take (%) --- --- --- --- --- --- --- --- --- --- --- ---
HARBOR SEAL HARVEST BY MONTH UnknownJan Feb Mar Apr May Jun Jul Aug Sep Oct Nov Dec Month Total
REPORTED HARVEST AND TAKE BY SAMPLED HOUSEHOLDS (UNEXPANDED)Harvest 0 0 0 0 0 0 3 0 0 0 0 0 0 3Struck & Lost 0 0 0 0 0 0 0 0 0 0 0 0 0 0Total Take 0 0 0 0 0 0 3 0 0 0 0 0 0 3
ESTIMATED HARVEST AND TAKE BY COMMUNITY (EXPANDED)Harvest 0.0 0.0 0.0 0.0 0.0 0.0 3.0 0.0 0.0 0.0 0.0 0.0 0.0 3.0Struck & Lost 0.0 0.0 0.0 0.0 0.0 0.0 0.0 0.0 0.0 0.0 0.0 0.0 0.0 0.0Total Take 0.0 0.0 0.0 0.0 0.0 0.0 3.0 0.0 0.0 0.0 0.0 0.0 0.0 3.0
ESTIMATED SEASONALLY ADJUSTED HARVEST AND TAKE BY COMMUNITY (EXPANDED)Harvest 0.0 0.0 0.0 0.0 0.0 0.0 3.0 0.0 0.0 0.0 0.0 0.0 3.0Struck & Lost 0.0 0.0 0.0 0.0 0.0 0.0 0.0 0.0 0.0 0.0 0.0 0.0 0.0Total Take 0.0 0.0 0.0 0.0 0.0 0.0 3.0 0.0 0.0 0.0 0.0 0.0 3.0Total Take (%) 0.0% 0.0% 0.0% 0.0% 0.0% 0.0% 100.0% 0.0% 0.0% 0.0% 0.0% 0.0% 100.0%Cum. Take 0.0 0.0 0.0 0.0 0.0 0.0 3.0 3.0 3.0 3.0 3.0 3.0Cum. Take (%) 0.0% 0.0% 0.0% 0.0% 0.0% 0.0% 100.0% 100.0% 100.0% 100.0% 100.0% 100.0% SOURCE: BBNA Household Surveys, 2007.
C - 101
100.0%
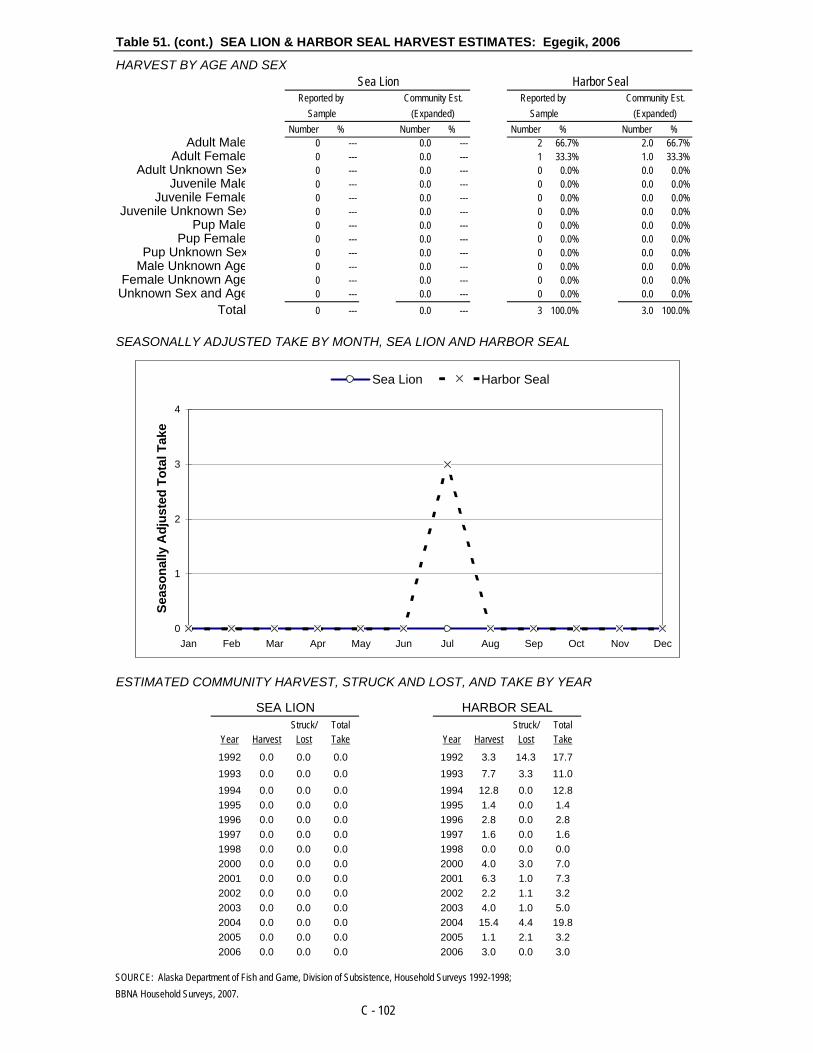
Table 51. (cont.) SEA LION & HARBOR SEAL HARVEST ESTIMATES: Egegik, 2006
HARVEST BY AGE AND SEXSea Lion Harbor Seal
Reported by Community Est. Reported by Community Est.Sample (Expanded) Sample (Expanded)
Number % Number % Number % Number %Adult Male 0 --- 0.0 --- 2 66.7% 2.0 66.7%
Adult Female 0 --- 0.0 --- 1 33.3% 1.0 33.3%Adult Unknown Sex 0 --- 0.0 --- 0 0.0% 0.0 0.0%
Juvenile Male 0 --- 0.0 --- 0 0.0% 0.0 0.0%Juvenile Female 0 --- 0.0 --- 0 0.0% 0.0 0.0%
Juvenile Unknown Sex 0 --- 0.0 --- 0 0.0% 0.0 0.0%Pup Male 0 --- 0.0 --- 0 0.0% 0.0 0.0%
Pup Female 0 --- 0.0 --- 0 0.0% 0.0 0.0%Pup Unknown Sex 0 --- 0.0 --- 0 0.0% 0.0 0.0%
Male Unknown Age 0 --- 0.0 --- 0 0.0% 0.0 0.0%Female Unknown Age 0 --- 0.0 --- 0 0.0% 0.0 0.0%Unknown Sex and Age 0 --- 0.0 --- 0 0.0% 0.0 0.0%
Total 0 --- 0.0 --- 3 100.0% 3.0 100.0%
SEASONALLY ADJUSTED TAKE BY MONTH, SEA LION AND HARBOR SEAL
ESTIMATED COMMUNITY HARVEST, STRUCK AND LOST, AND TAKE BY YEAR
SEA LION HARBOR SEALStruck/ Total Struck/ Total
Year Harvest Lost Take Year Harvest Lost Take
1992 0.0 0.0 0.0 1992 3.3 14.3 17.71993 0.0 0.0 0.0 1993 7.7 3.3 11.01994 0.0 0.0 0.0 1994 12.8 0.0 12.81995 0.0 0.0 0.0 1995 1.4 0.0 1.41996 0.0 0.0 0.0 1996 2.8 0.0 2.81997 0.0 0.0 0.0 1997 1.6 0.0 1.61998 0.0 0.0 0.0 1998 0.0 0.0 0.02000 0.0 0.0 0.0 2000 4.0 3.0 7.02001 0.0 0.0 0.0 2001 6.3 1.0 7.32002 0.0 0.0 0.0 2002 2.2 1.1 3.22003 0.0 0.0 0.0 2003 4.0 1.0 5.02004 0.0 0.0 0.0 2004 15.4 4.4 19.82005 0.0 0.0 0.0 2005 1.1 2.1 3.22006 0.0 0.0 0.0 2006 3.0 0.0 3.0
SOURCE: Alaska Department of Fish and Game, Division of Subsistence, Household Surveys 1992-1998;BBNA Household Surveys, 2007.
C - 102
0
1
2
3
4
Jan Feb Mar Apr May Jun Jul Aug Sep Oct Nov Dec
Seas
onal
ly A
djus
ted
Tota
l Tak
e
Sea Lion Harbor Seal

Table 52. SEA LION AND HARBOR SEAL HARVEST / TAKE ESTIMATES: King Salmon, 2006
SAMPLING DESIGN: CENSUS Total Native Households 21
Surveyed Households 15Sampling Fraction 71.4%
Sample Household Members 52Estimated Household Members 72.8
2000 U.S. Census Estimated Native Population 133HARVEST AND USE INFORMATION
Percentage of Native Households: Estimated Community Harvest Sea Harbor and Take (Expanded): Sea Harbor
Lion Seal Lion SealUsed 0.0% 33.3% Total Number Harvested 0.0 7.0
Hunted 0.0% 26.7% Total Number Struck and Lost 0.0 0.0Harvested 0.0% 20.0% Total Number Taken 0.0 7.0Received 0.0% 20.0%
Gave Away 0.0% 6.7% Number Harvested Per Capita 0.00 0.05
SEA LION HARVEST BY MONTH UnknownJan Feb Mar Apr May Jun Jul Aug Sep Oct Nov Dec Month Total
REPORTED HARVEST AND TAKE BY SAMPLED HOUSEHOLDS (UNEXPANDED)Harvest 0 0 0 0 0 0 0 0 0 0 0 0 0 0Struck & Lost 0 0 0 0 0 0 0 0 0 0 0 0 0 0Total Take 0 0 0 0 0 0 0 0 0 0 0 0 0 0
ESTIMATED HARVEST AND TAKE BY COMMUNITY (EXPANDED)Harvest 0.0 0.0 0.0 0.0 0.0 0.0 0.0 0.0 0.0 0.0 0.0 0.0 0.0 0.0Struck & Lost 0.0 0.0 0.0 0.0 0.0 0.0 0.0 0.0 0.0 0.0 0.0 0.0 0.0 0.0Total Take 0.0 0.0 0.0 0.0 0.0 0.0 0.0 0.0 0.0 0.0 0.0 0.0 0.0 0.0
ESTIMATED SEASONALLY ADJUSTED HARVEST AND TAKE BY COMMUNITY (EXPANDED)Harvest 0.0 0.0 0.0 0.0 0.0 0.0 0.0 0.0 0.0 0.0 0.0 0.0 0.0Struck & Lost 0.0 0.0 0.0 0.0 0.0 0.0 0.0 0.0 0.0 0.0 0.0 0.0 0.0Total Take 0.0 0.0 0.0 0.0 0.0 0.0 0.0 0.0 0.0 0.0 0.0 0.0 0.0Total Take (%) --- --- --- --- --- --- --- --- --- --- --- --- ---Cum. Take 0.0 0.0 0.0 0.0 0.0 0.0 0.0 0.0 0.0 0.0 0.0 0.0Cum. Take (%) --- --- --- --- --- --- --- --- --- --- --- ---
HARBOR SEAL HARVEST BY MONTH UnknownJan Feb Mar Apr May Jun Jul Aug Sep Oct Nov Dec Month Total
REPORTED HARVEST AND TAKE BY SAMPLED HOUSEHOLDS (UNEXPANDED)Harvest 0 0 0 0 1 0 0 3 1 0 0 0 0 5Struck & Lost 0 0 0 0 0 0 0 0 0 0 0 0 0 0Total Take 0 0 0 0 1 0 0 3 1 0 0 0 0 5
ESTIMATED HARVEST AND TAKE BY COMMUNITY (EXPANDED)Harvest 0.0 0.0 0.0 0.0 1.4 0.0 0.0 4.2 1.4 0.0 0.0 0.0 0.0 7.0Struck & Lost 0.0 0.0 0.0 0.0 0.0 0.0 0.0 0.0 0.0 0.0 0.0 0.0 0.0 0.0Total Take 0.0 0.0 0.0 0.0 1.4 0.0 0.0 4.2 1.4 0.0 0.0 0.0 0.0 7.0
ESTIMATED SEASONALLY ADJUSTED HARVEST AND TAKE BY COMMUNITY (EXPANDED)Harvest 0.0 0.0 0.0 0.0 1.4 0.0 0.0 4.2 1.4 0.0 0.0 0.0 7.0Struck & Lost 0.0 0.0 0.0 0.0 0.0 0.0 0.0 0.0 0.0 0.0 0.0 0.0 0.0Total Take 0.0 0.0 0.0 0.0 1.4 0.0 0.0 4.2 1.4 0.0 0.0 0.0 7.0Total Take (%) 0.0% 0.0% 0.0% 0.0% 20.0% 0.0% 0.0% 60.0% 20.0% 0.0% 0.0% 0.0% 100.0%Cum. Take 0.0 0.0 0.0 0.0 1.4 1.4 1.4 5.6 7.0 7.0 7.0 7.0Cum. Take (%) 0.0% 0.0% 0.0% 0.0% 20.0% 20.0% 20.0% 80.0% 100.0% 100.0% 100.0% 100.0% SOURCE: BBNA Household Surveys, 2007.
C - 103

Table 52. (cont.) SEA LION & HARBOR SEAL HARVEST ESTIMATES: King Salmon, 2006
HARVEST BY AGE AND SEXSea Lion Harbor Seal
Reported by Community Est. Reported by Community Est.Sample (Expanded) Sample (Expanded)
Number % Number % Number % Number %Adult Male 0 --- 0.0 --- 1 20.0% 1.4 20.0%
Adult Female 0 --- 0.0 --- 1 20.0% 1.4 20.0%Adult Unknown Sex 0 --- 0.0 --- 0 0.0% 0.0 0.0%
Juvenile Male 0 --- 0.0 --- 0 0.0% 0.0 0.0%Juvenile Female 0 --- 0.0 --- 3 60.0% 4.2 60.0%
Juvenile Unknown Sex 0 --- 0.0 --- 0 0.0% 0.0 0.0%Pup Male 0 --- 0.0 --- 0 0.0% 0.0 0.0%
Pup Female 0 --- 0.0 --- 0 0.0% 0.0 0.0%Pup Unknown Sex 0 --- 0.0 --- 0 0.0% 0.0 0.0%
Male Unknown Age 0 --- 0.0 --- 0 0.0% 0.0 0.0%Female Unknown Age 0 --- 0.0 --- 0 0.0% 0.0 0.0%Unknown Sex and Age 0 --- 0.0 --- 0 0.0% 0.0 0.0%
Total 0 --- 0.0 --- 5 100.0% 7.0 100.0%
SEASONALLY ADJUSTED TAKE BY MONTH, SEA LION AND HARBOR SEAL
ESTIMATED COMMUNITY HARVEST, STRUCK AND LOST, AND TAKE BY YEAR
SEA LION HARBOR SEALStruck/ Total Struck/ Total
Year Harvest Lost Take Year Harvest Lost Take
1992 0.0 0.0 0.0 1992 10.2 0.0 10.21993 0.0 0.0 0.0 1993 21.3 10.7 32.01994 0.0 0.0 0.0 1994 17.0 4.5 21.51995 0.0 0.0 0.0 1995 13.0 3.0 16.01996 0.0 0.0 0.0 1996 9.5 2.4 11.91997 0.0 0.0 0.0 1997 9.7 0.0 9.71998 0.0 0.0 0.0 1998 5.2 0.0 5.22000 0.0 0.0 0.0 2000 3.3 9.8 13.02001 0.0 0.0 0.0 2001 8.5 6.1 14.62002 0.0 0.0 0.0 2002 2.9 0.0 2.92003 0.0 0.0 0.0 2003 7.3 6.1 13.42004 0.0 0.0 0.0 2004 5.0 3.3 8.32005 0.0 0.0 0.0 2005 0.0 0.0 0.02006 0.0 0.0 0.0 2006 7.0 0.0 7.0
SOURCE: Alaska Department of Fish and Game, Division of Subsistence, Household Surveys 1992-1998;BBNA Household Surveys, 2007.
C - 104
0
1
2
3
4
5
Jan Feb Mar Apr May Jun Jul Aug Sep Oct Nov Dec
Seas
onal
ly A
djus
ted
Tota
l Tak
e
Sea Lion Harbor Seal

Table 53. SEA LION AND HARBOR SEAL HARVEST AND TAKE ESTIMATES: Levelock, 2006
SAMPLING DESIGN: CENSUS Total Native Households 19
Surveyed Households 6Sampling Fraction 31.6%
Sample Household Members 18Estimated Household Members 57.0
2000 U.S. Census Estimated Native Population 116HARVEST AND USE INFORMATION
Percentage of Native Households: Estimated Community Harvest Sea Harbor and Take (Expanded): Sea Harbor
Lion Seal Lion SealUsed 0.0% 66.7% Total Number Harvested 0.0 0.0
Hunted 0.0% 16.7% Total Number Struck and Lost 0.0 0.0Harvested 0.0% 0.0% Total Number Taken 0.0 0.0Received 0.0% 66.7%
Gave Away 0.0% 33.3% Number Harvested Per Capita 0.00 0.00
SEA LION HARVEST BY MONTH UnknownJan Feb Mar Apr May Jun Jul Aug Sep Oct Nov Dec Month Total
REPORTED HARVEST AND TAKE BY SAMPLED HOUSEHOLDS (UNEXPANDED)Harvest 0 0 0 0 0 0 0 0 0 0 0 0 0 0Struck & Lost 0 0 0 0 0 0 0 0 0 0 0 0 0 0Total Take 0 0 0 0 0 0 0 0 0 0 0 0 0 0
ESTIMATED HARVEST AND TAKE BY COMMUNITY (EXPANDED)Harvest 0.0 0.0 0.0 0.0 0.0 0.0 0.0 0.0 0.0 0.0 0.0 0.0 0.0 0.0Struck & Lost 0.0 0.0 0.0 0.0 0.0 0.0 0.0 0.0 0.0 0.0 0.0 0.0 0.0 0.0Total Take 0.0 0.0 0.0 0.0 0.0 0.0 0.0 0.0 0.0 0.0 0.0 0.0 0.0 0.0
ESTIMATED SEASONALLY ADJUSTED HARVEST AND TAKE BY COMMUNITY (EXPANDED)Harvest 0.0 0.0 0.0 0.0 0.0 0.0 0.0 0.0 0.0 0.0 0.0 0.0 0.0Struck & Lost 0.0 0.0 0.0 0.0 0.0 0.0 0.0 0.0 0.0 0.0 0.0 0.0 0.0Total Take 0.0 0.0 0.0 0.0 0.0 0.0 0.0 0.0 0.0 0.0 0.0 0.0 0.0Total Take (%) --- --- --- --- --- --- --- --- --- --- --- --- ---Cum. Take 0.0 0.0 0.0 0.0 0.0 0.0 0.0 0.0 0.0 0.0 0.0 0.0Cum. Take (%) --- --- --- --- --- --- --- --- --- --- --- ---
HARBOR SEAL HARVEST BY MONTH UnknownJan Feb Mar Apr May Jun Jul Aug Sep Oct Nov Dec Month Total
REPORTED HARVEST AND TAKE BY SAMPLED HOUSEHOLDS (UNEXPANDED)Harvest 0 0 0 0 0 0 0 0 0 0 0 0 0 0Struck & Lost 0 0 0 0 0 0 0 0 0 0 0 0 0 0Total Take 0 0 0 0 0 0 0 0 0 0 0 0 0 0
ESTIMATED HARVEST AND TAKE BY COMMUNITY (EXPANDED)Harvest 0.0 0.0 0.0 0.0 0.0 0.0 0.0 0.0 0.0 0.0 0.0 0.0 0.0 0.0Struck & Lost 0.0 0.0 0.0 0.0 0.0 0.0 0.0 0.0 0.0 0.0 0.0 0.0 0.0 0.0Total Take 0.0 0.0 0.0 0.0 0.0 0.0 0.0 0.0 0.0 0.0 0.0 0.0 0.0 0.0
ESTIMATED SEASONALLY ADJUSTED HARVEST AND TAKE BY COMMUNITY (EXPANDED)Harvest 0.0 0.0 0.0 0.0 0.0 0.0 0.0 0.0 0.0 0.0 0.0 0.0 0.0Struck & Lost 0.0 0.0 0.0 0.0 0.0 0.0 0.0 0.0 0.0 0.0 0.0 0.0 0.0Total Take 0.0 0.0 0.0 0.0 0.0 0.0 0.0 0.0 0.0 0.0 0.0 0.0 0.0Total Take (%) --- --- --- --- --- --- --- --- --- --- --- --- ---Cum. Take 0.0 0.0 0.0 0.0 0.0 0.0 0.0 0.0 0.0 0.0 0.0 0.0Cum. Take (%) --- --- --- --- --- --- --- --- --- --- --- --- SOURCE: BBNA Household Surveys, 2007.
C - 105

Table 53. (cont.) SEA LION & HARBOR SEAL HARVEST ESTIMATES: Levelock, 2006
HARVEST BY AGE AND SEXSea Lion Harbor Seal
Reported by Community Est. Reported by Community Est.Sample (Expanded) Sample (Expanded)
Number % Number % Number % Number %Adult Male 0 --- 0.0 --- 0 --- 0.0 ---
Adult Female 0 --- 0.0 --- 0 --- 0.0 ---Adult Unknown Sex 0 --- 0.0 --- 0 --- 0.0 ---
Juvenile Male 0 --- 0.0 --- 0 --- 0.0 ---Juvenile Female 0 --- 0.0 --- 0 --- 0.0 ---
Juvenile Unknown Sex 0 --- 0.0 --- 0 --- 0.0 ---Pup Male 0 --- 0.0 --- 0 --- 0.0 ---
Pup Female 0 --- 0.0 --- 0 --- 0.0 ---Pup Unknown Sex 0 --- 0.0 --- 0 --- 0.0 ---
Male Unknown Age 0 --- 0.0 --- 0 --- 0.0 ---Female Unknown Age 0 --- 0.0 --- 0 --- 0.0 ---Unknown Sex and Age 0 --- 0.0 --- 0 --- 0.0 ---
Total 0 --- 0.0 --- 0 --- 0.0 ---
SEASONALLY ADJUSTED TAKE BY MONTH, SEA LION AND HARBOR SEAL
ESTIMATED COMMUNITY HARVEST, STRUCK AND LOST, AND TAKE BY YEAR
SEA LION HARBOR SEALStruck/ Total Struck/ Total
Year Harvest Lost Take Year Harvest Lost Take
1992 0.0 0.0 0.0 1992 10.8 0.0 10.81993 0.0 0.0 0.0 1993 2.7 5.4 8.11994 0.0 0.0 0.0 1994 0.0 0.0 0.01995 0.0 0.0 0.0 1995 0.0 0.0 0.01996 0.0 0.0 0.0 1996 0.0 0.0 0.01997 0.0 0.0 0.0 1997 0.0 0.0 0.01998 0.0 0.0 0.0 1998 0.0 0.0 0.02000 0.0 0.0 0.0 2000 2.8 0.0 2.82001 0.0 0.0 0.0 2001 0.0 0.0 0.02002 0.0 0.0 0.0 2002 0.0 0.0 0.02003 0.0 0.0 0.0 2003 0.0 0.0 0.02004 0.0 0.0 0.0 2004 0.0 0.0 0.02005 0.0 0.0 0.0 2005 2.7 0.0 2.72006 0.0 0.0 0.0 2006 0.0 0.0 0.0
SOURCE: Alaska Department of Fish and Game, Division of Subsistence, Household Surveys 1992-1998;BBNA Household Surveys, 2007.
C - 106
0
1
Jan Feb Mar Apr May Jun Jul Aug Sep Oct Nov Dec
Seas
onal
ly A
djus
ted
Tota
l Tak
e
Sea Lion Harbor Seal

Table 54. SEA LION AND HARBOR SEAL HARVEST AND TAKE ESTIMATES: Naknek, 2006
SAMPLING DESIGN: Active Other TotalTWO-STRATA Total Referred Households 28 61 89
Surveyed Households 26 20 46Sampling Fraction 92.9% 32.8% 51.7%
Sample Household Members 57 67 124Estimated Household Members 61.4 204.4 265.7
2000 U.S. Census Estimated Native Population --- --- 319HARVEST AND USE INFORMATION
Percentage of Native Households: Estimated Community Harvest Sea Harbor and Take (Expanded): Sea Harbor
Lion Seal Lion SealUsed 0.0% 26.8% Total Number Harvested 0.0 15.1
Hunted 0.0% 10.7% Total Number Struck and Lost 0.0 7.5Harvested 0.0% 3.6% Total Number Taken 0.0 22.6Received 0.0% 23.2%
Gave Away 0.0% 5.8% Number Harvested Per Capita 0.00 0.05
SEA LION HARVEST BY MONTH UnknownJan Feb Mar Apr May Jun Jul Aug Sep Oct Nov Dec Month Total
REPORTED HARVEST AND TAKE BY SAMPLED HOUSEHOLDS (UNEXPANDED)Harvest 0 0 0 0 0 0 0 0 0 0 0 0 0 0Struck & Lost 0 0 0 0 0 0 0 0 0 0 0 0 0 0Total Take 0 0 0 0 0 0 0 0 0 0 0 0 0 0
ESTIMATED HARVEST AND TAKE BY COMMUNITY (EXPANDED)Harvest 0.0 0.0 0.0 0.0 0.0 0.0 0.0 0.0 0.0 0.0 0.0 0.0 0.0 0.0Struck & Lost 0.0 0.0 0.0 0.0 0.0 0.0 0.0 0.0 0.0 0.0 0.0 0.0 0.0 0.0Total Take 0.0 0.0 0.0 0.0 0.0 0.0 0.0 0.0 0.0 0.0 0.0 0.0 0.0 0.0
ESTIMATED SEASONALLY ADJUSTED HARVEST AND TAKE BY COMMUNITY (EXPANDED)Harvest 0.0 0.0 0.0 0.0 0.0 0.0 0.0 0.0 0.0 0.0 0.0 0.0 0.0Struck & Lost 0.0 0.0 0.0 0.0 0.0 0.0 0.0 0.0 0.0 0.0 0.0 0.0 0.0Total Take 0.0 0.0 0.0 0.0 0.0 0.0 0.0 0.0 0.0 0.0 0.0 0.0 0.0Total Take (%) --- --- --- --- --- --- --- --- --- --- --- --- ---Cum. Take 0.0 0.0 0.0 0.0 0.0 0.0 0.0 0.0 0.0 0.0 0.0 0.0Cum. Take (%) --- --- --- --- --- --- --- --- --- --- --- ---
HARBOR SEAL HARVEST BY MONTH UnknownJan Feb Mar Apr May Jun Jul Aug Sep Oct Nov Dec Month Total
REPORTED HARVEST AND TAKE BY SAMPLED HOUSEHOLDS (UNEXPANDED)Harvest 0 0 0 0 8 0 0 2 4 0 0 0 0 14Struck & Lost 0 0 0 0 0 2 0 3 2 0 0 0 0 7Total Take 0 0 0 0 8 2 0 5 6 0 0 0 0 21
ESTIMATED HARVEST AND TAKE BY COMMUNITY (EXPANDED)Harvest 0.0 0.0 0.0 0.0 8.6 0.0 0.0 2.2 4.3 0.0 0.0 0.0 0.0 15.1Struck & Lost 0.0 0.0 0.0 0.0 0.0 2.2 0.0 3.2 2.2 0.0 0.0 0.0 0.0 7.5Total Take 0.0 0.0 0.0 0.0 8.6 2.2 0.0 5.4 6.5 0.0 0.0 0.0 0.0 22.6
ESTIMATED SEASONALLY ADJUSTED HARVEST AND TAKE BY COMMUNITY (EXPANDED)Harvest 0.0 0.0 0.0 0.0 8.6 0.0 0.0 2.2 4.3 0.0 0.0 0.0 15.1Struck & Lost 0.0 0.0 0.0 0.0 0.0 2.2 0.0 3.2 2.2 0.0 0.0 0.0 7.5Total Take 0.0 0.0 0.0 0.0 8.6 2.2 0.0 5.4 6.5 0.0 0.0 0.0 22.6Total Take (%) 0.0% 0.0% 0.0% 0.0% 38.1% 9.5% 0.0% 23.8% 28.6% 0.0% 0.0% 0.0% 100.0%Cum. Take 0.0 0.0 0.0 0.0 8.6 10.8 10.8 16.2 22.6 22.6 22.6 22.6Cum. Take (%) 0.0% 0.0% 0.0% 0.0% 38.1% 47.6% 47.6% 71.4% 100.0% 100.0% 100.0% 100.0% SOURCE: BBNA Household Surveys, 2007.
C - 107

Table 54. (cont.) SEA LION & HARBOR SEAL HARVEST ESTIMATES: Naknek, 2006
HARVEST BY AGE AND SEXSea Lion Harbor Seal
Reported by Community Est. Reported by Community Est.Sample (Expanded) Sample (Expanded)
Number % Number % Number % Number %Adult Male 0 --- 0.0 --- 9 64.3% 9.7 64.3%
Adult Female 0 --- 0.0 --- 5 35.7% 5.4 35.7%Adult Unknown Sex 0 --- 0.0 --- 0 0.0% 0.0 0.0%
Juvenile Male 0 --- 0.0 --- 0 0.0% 0.0 0.0%Juvenile Female 0 --- 0.0 --- 0 0.0% 0.0 0.0%
Juvenile Unknown Sex 0 --- 0.0 --- 0 0.0% 0.0 0.0%Pup Male 0 --- 0.0 --- 0 0.0% 0.0 0.0%
Pup Female 0 --- 0.0 --- 0 0.0% 0.0 0.0%Pup Unknown Sex 0 --- 0.0 --- 0 0.0% 0.0 0.0%
Male Unknown Age 0 --- 0.0 --- 0 0.0% 0.0 0.0%Female Unknown Age 0 --- 0.0 --- 0 0.0% 0.0 0.0%Unknown Sex and Age 0 --- 0.0 --- 0 0.0% 0.0 0.0%
Total 0 --- 0.0 --- 14 100.0% 15.1 100.0%
SEASONALLY ADJUSTED TAKE BY MONTH, SEA LION AND HARBOR SEAL
ESTIMATED COMMUNITY HARVEST, STRUCK AND LOST, AND TAKE BY YEAR
SEA LION HARBOR SEALStruck/ Total Struck/ Total
Year Harvest Lost Take Year Harvest Lost Take
1992 0.0 0.0 0.0 1992 26.6 7.0 33.61993 0.0 0.0 0.0 1993 2.7 0.0 2.71994 0.0 0.0 0.0 1994 21.4 8.3 29.71995 0.0 0.0 0.0 1995 34.8 15.3 50.21996 0.0 0.0 0.0 1996 16.2 7.5 23.71997 0.0 0.0 0.0 1997 24.8 6.5 31.21998 0.0 0.0 0.0 1998 15.7 7.8 23.52000 0.0 0.0 0.0 2000 16.3 0.0 16.32001 0.0 0.0 0.0 2001 15.1 4.3 19.42002 0.0 0.0 0.0 2002 26.2 12.5 38.72003 0.0 0.0 0.0 2003 10.5 0.0 10.52004 0.0 0.0 0.0 2004 15.2 3.8 19.02005 0.0 0.0 0.0 2005 6.2 0.0 6.22006 0.0 0.0 0.0 2006 15.1 7.5 22.6
SOURCE: Alaska Department of Fish and Game, Division of Subsistence, Household Surveys 1992-1998;BBNA Household Surveys, 2007.
C - 108
0
1
2
3
4
5
6
7
8
9
10
Jan Feb Mar Apr May Jun Jul Aug Sep Oct Nov Dec
Seas
onal
ly A
djus
ted
Tota
l Tak
e
Sea Lion Harbor Seal
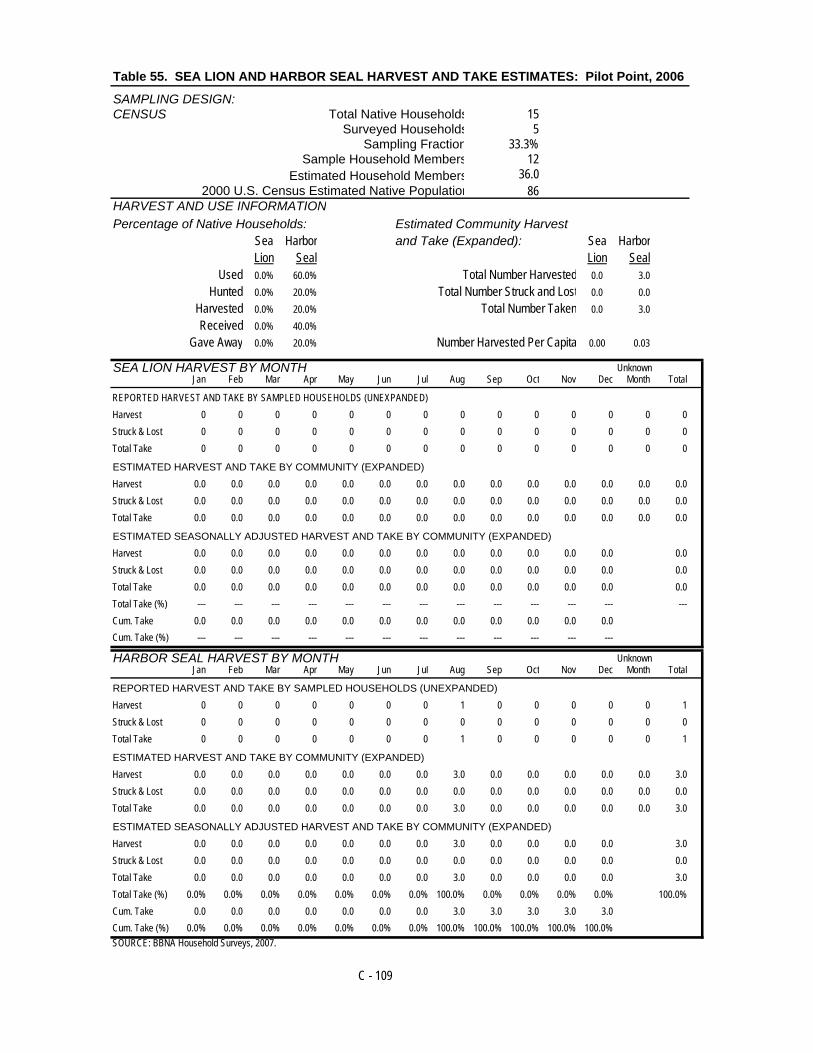
Table 55. SEA LION AND HARBOR SEAL HARVEST AND TAKE ESTIMATES: Pilot Point, 2006
SAMPLING DESIGN: CENSUS Total Native Households 15
Surveyed Households 5Sampling Fraction
Sample Household Members 12Estimated Household Members 36.0
2000 U.S. Census Estimated Native Population 86HARVEST AND USE INFORMATION
Percentage of Native Households: Estimated Community Harvest Sea Harbor and Take (Expanded): Sea Harbor
Lion Seal Lion SealUsed 0.0% 60.0% Total Number Harvested 0.0 3.0
Hunted 0.0% 20.0% Total Number Struck and Lost 0.0 0.0Harvested 0.0% 20.0% Total Number Taken 0.0 3.0Received 0.0% 40.0%
Gave Away 0.0% 20.0% Number Harvested Per Capita 0.00 0.03
SEA LION HARVEST BY MONTH UnknownJan Feb Mar Apr May Jun Jul Aug Sep Oct Nov Dec Month Total
REPORTED HARVEST AND TAKE BY SAMPLED HOUSEHOLDS (UNEXPANDED)Harvest 0 0 0 0 0 0 0 0 0 0 0 0 0 0Struck & Lost 0 0 0 0 0 0 0 0 0 0 0 0 0 0Total Take 0 0 0 0 0 0 0 0 0 0 0 0 0 0
ESTIMATED HARVEST AND TAKE BY COMMUNITY (EXPANDED)Harvest 0.0 0.0 0.0 0.0 0.0 0.0 0.0 0.0 0.0 0.0 0.0 0.0 0.0 0.0Struck & Lost 0.0 0.0 0.0 0.0 0.0 0.0 0.0 0.0 0.0 0.0 0.0 0.0 0.0 0.0Total Take 0.0 0.0 0.0 0.0 0.0 0.0 0.0 0.0 0.0 0.0 0.0 0.0 0.0 0.0
ESTIMATED SEASONALLY ADJUSTED HARVEST AND TAKE BY COMMUNITY (EXPANDED)Harvest 0.0 0.0 0.0 0.0 0.0 0.0 0.0 0.0 0.0 0.0 0.0 0.0 0.0Struck & Lost 0.0 0.0 0.0 0.0 0.0 0.0 0.0 0.0 0.0 0.0 0.0 0.0 0.0Total Take 0.0 0.0 0.0 0.0 0.0 0.0 0.0 0.0 0.0 0.0 0.0 0.0 0.0Total Take (%) --- --- --- --- --- --- --- --- --- --- --- --- ---Cum. Take 0.0 0.0 0.0 0.0 0.0 0.0 0.0 0.0 0.0 0.0 0.0 0.0Cum. Take (%) --- --- --- --- --- --- --- --- --- --- --- ---
HARBOR SEAL HARVEST BY MONTH UnknownJan Feb Mar Apr May Jun Jul Aug Sep Oct Nov Dec Month Total
REPORTED HARVEST AND TAKE BY SAMPLED HOUSEHOLDS (UNEXPANDED)Harvest 0 0 0 0 0 0 0 1 0 0 0 0 0 1Struck & Lost 0 0 0 0 0 0 0 0 0 0 0 0 0 0Total Take 0 0 0 0 0 0 0 1 0 0 0 0 0 1
ESTIMATED HARVEST AND TAKE BY COMMUNITY (EXPANDED)Harvest 0.0 0.0 0.0 0.0 0.0 0.0 0.0 3.0 0.0 0.0 0.0 0.0 0.0 3.0Struck & Lost 0.0 0.0 0.0 0.0 0.0 0.0 0.0 0.0 0.0 0.0 0.0 0.0 0.0 0.0Total Take 0.0 0.0 0.0 0.0 0.0 0.0 0.0 3.0 0.0 0.0 0.0 0.0 0.0 3.0
ESTIMATED SEASONALLY ADJUSTED HARVEST AND TAKE BY COMMUNITY (EXPANDED)Harvest 0.0 0.0 0.0 0.0 0.0 0.0 0.0 3.0 0.0 0.0 0.0 0.0 3.0Struck & Lost 0.0 0.0 0.0 0.0 0.0 0.0 0.0 0.0 0.0 0.0 0.0 0.0 0.0Total Take 0.0 0.0 0.0 0.0 0.0 0.0 0.0 3.0 0.0 0.0 0.0 0.0 3.0Total Take (%) 0.0% 0.0% 0.0% 0.0% 0.0% 0.0% 0.0% 100.0% 0.0% 0.0% 0.0% 0.0% 100.0%Cum. Take 0.0 0.0 0.0 0.0 0.0 0.0 0.0 3.0 3.0 3.0 3.0 3.0Cum. Take (%) 0.0% 0.0% 0.0% 0.0% 0.0% 0.0% 0.0% 100.0% 100.0% 100.0% 100.0% 100.0% SOURCE: BBNA Household Surveys, 2007.
C - 109
33.3%

Table 55. (cont.) SEA LION & HARBOR SEAL HARVEST ESTIMATES: Pilot Point, 2006
HARVEST BY AGE AND SEXSea Lion Harbor Seal
Reported by Community Est. Reported by Community Est.Sample (Expanded) Sample (Expanded)
Number % Number % Number % Number %Adult Male 0 --- 0.0 --- 0 0.0% 0.0 0.0%
Adult Female 0 --- 0.0 --- 0 0.0% 0.0 0.0%Adult Unknown Sex 0 --- 0.0 --- 1 100.0% 3.0 100.0%
Juvenile Male 0 --- 0.0 --- 0 0.0% 0.0 0.0%Juvenile Female 0 --- 0.0 --- 0 0.0% 0.0 0.0%
Juvenile Unknown Sex 0 --- 0.0 --- 0 0.0% 0.0 0.0%Pup Male 0 --- 0.0 --- 0 0.0% 0.0 0.0%
Pup Female 0 --- 0.0 --- 0 0.0% 0.0 0.0%Pup Unknown Sex 0 --- 0.0 --- 0 0.0% 0.0 0.0%
Male Unknown Age 0 --- 0.0 --- 0 0.0% 0.0 0.0%Female Unknown Age 0 --- 0.0 --- 0 0.0% 0.0 0.0%Unknown Sex and Age 0 --- 0.0 --- 0 0.0% 0.0 0.0%
Total 0 --- 0.0 --- 1 100.0% 3.0 100.0%
SEASONALLY ADJUSTED TAKE BY MONTH, SEA LION AND HARBOR SEAL
ESTIMATED COMMUNITY HARVEST, STRUCK AND LOST, AND TAKE BY YEAR
SEA LION HARBOR SEALStruck/ Total Struck/ Total
Year Harvest Lost Take Year Harvest Lost Take
1992 0.0 0.0 0.0 1992 5.4 4.3 9.71993 0.0 0.0 0.0 1993 2.2 0.0 2.21994 0.0 0.0 0.0 1994 3.1 0.0 3.11995 0.0 0.0 0.0 1995 0.0 0.0 0.01996 0.0 0.0 0.0 1996 0.0 0.0 0.01997 0.0 0.0 0.0 1997 0.0 0.0 0.01998 0.0 0.0 0.0 1998 0.0 0.0 0.02000 0.0 0.0 0.0 2000 5.3 2.1 7.42001 0.0 0.0 0.0 2001 2.0 2.0 4.02002 0.0 0.0 0.0 2002 2.0 2.0 4.02003 0.0 0.0 0.0 2003 2.7 2.7 5.32004 0.0 0.0 0.0 2004 1.9 5.6 7.42005 0.0 0.0 0.0 2005 0.0 0.0 0.02006 0.0 0.0 0.0 2006 3.0 0.0 3.0
SOURCE: Alaska Department of Fish and Game, Division of Subsistence, Household Surveys 1992-1998;BBNA Household Surveys, 2007.
C - 110
0
1
2
3
4
Jan Feb Mar Apr May Jun Jul Aug Sep Oct Nov Dec
Seas
onal
ly A
djus
ted
Tota
l Tak
e
Sea Lion Harbor Seal

Table 56. SEA LION AND HARBOR SEAL HARVEST AND TAKE ESTIMATES: Port Heiden, 2006
SAMPLING DESIGN: CENSUS Total Native Households 27
Surveyed Households 25Sampling Fraction 92.6%
Sample Household Members 78Estimated Household Members 84.2
2000 U.S. Census Estimated Native Population 93HARVEST AND USE INFORMATION
Percentage of Native Households: Estimated Community Harvest Sea Harbor and Take (Expanded): Sea Harbor
Lion Seal Lion SealUsed 0.0% 48.0% Total Number Harvested 0.0 17.3
Hunted 0.0% 32.0% Total Number Struck and Lost 0.0 6.5Harvested 0.0% 32.0% Total Number Taken 0.0 23.8Received 0.0% 24.0%
Gave Away 0.0% 16.0% Number Harvested Per Capita 0.00 0.19
SEA LION HARVEST BY MONTH UnknownJan Feb Mar Apr May Jun Jul Aug Sep Oct Nov Dec Month Total
REPORTED HARVEST AND TAKE BY SAMPLED HOUSEHOLDS (UNEXPANDED)Harvest 0 0 0 0 0 0 0 0 0 0 0 0 0 0Struck & Lost 0 0 0 0 0 0 0 0 0 0 0 0 0 0Total Take 0 0 0 0 0 0 0 0 0 0 0 0 0 0
ESTIMATED HARVEST AND TAKE BY COMMUNITY (EXPANDED)Harvest 0.0 0.0 0.0 0.0 0.0 0.0 0.0 0.0 0.0 0.0 0.0 0.0 0.0 0.0Struck & Lost 0.0 0.0 0.0 0.0 0.0 0.0 0.0 0.0 0.0 0.0 0.0 0.0 0.0 0.0Total Take 0.0 0.0 0.0 0.0 0.0 0.0 0.0 0.0 0.0 0.0 0.0 0.0 0.0 0.0
ESTIMATED SEASONALLY ADJUSTED HARVEST AND TAKE BY COMMUNITY (EXPANDED)Harvest 0.0 0.0 0.0 0.0 0.0 0.0 0.0 0.0 0.0 0.0 0.0 0.0 0.0Struck & Lost 0.0 0.0 0.0 0.0 0.0 0.0 0.0 0.0 0.0 0.0 0.0 0.0 0.0Total Take 0.0 0.0 0.0 0.0 0.0 0.0 0.0 0.0 0.0 0.0 0.0 0.0 0.0Total Take (%) --- --- --- --- --- --- --- --- --- --- --- --- ---Cum. Take 0.0 0.0 0.0 0.0 0.0 0.0 0.0 0.0 0.0 0.0 0.0 0.0Cum. Take (%) --- --- --- --- --- --- --- --- --- --- --- ---
HARBOR SEAL HARVEST BY MONTH UnknownJan Feb Mar Apr May Jun Jul Aug Sep Oct Nov Dec Month Total
REPORTED HARVEST AND TAKE BY SAMPLED HOUSEHOLDS (UNEXPANDED)Harvest 0 0 0 0 3 5 1 7 0 0 0 0 0 16Struck & Lost 0 0 0 0 0 3 2 1 0 0 0 0 0 6Total Take 0 0 0 0 3 8 3 8 0 0 0 0 0 22
ESTIMATED HARVEST AND TAKE BY COMMUNITY (EXPANDED)Harvest 0.0 0.0 0.0 0.0 3.2 5.4 1.1 7.6 0.0 0.0 0.0 0.0 0.0 17.3Struck & Lost 0.0 0.0 0.0 0.0 0.0 3.2 2.2 1.1 0.0 0.0 0.0 0.0 0.0 6.5Total Take 0.0 0.0 0.0 0.0 3.2 8.6 3.2 8.6 0.0 0.0 0.0 0.0 0.0 23.8
ESTIMATED SEASONALLY ADJUSTED HARVEST AND TAKE BY COMMUNITY (EXPANDED)Harvest 0.0 0.0 0.0 0.0 3.2 5.4 1.1 7.6 0.0 0.0 0.0 0.0 17.3Struck & Lost 0.0 0.0 0.0 0.0 0.0 3.2 2.2 1.1 0.0 0.0 0.0 0.0 6.5Total Take 0.0 0.0 0.0 0.0 3.2 8.6 3.2 8.6 0.0 0.0 0.0 0.0 23.8Total Take (%) 0.0% 0.0% 0.0% 0.0% 13.6% 36.4% 13.6% 36.4% 0.0% 0.0% 0.0% 0.0% 100.0%Cum. Take 0.0 0.0 0.0 0.0 3.2 11.9 15.1 23.8 23.8 23.8 23.8 23.8Cum. Take (%) 0.0% 0.0% 0.0% 0.0% 13.6% 50.0% 63.6% 100.0% 100.0% 100.0% 100.0% 100.0% SOURCE: BBNA Household Surveys, 2007.
C - 111

Table 56. (cont.) SEA LION & HARBOR SEAL HARVEST ESTIMATES: Port Heiden, 2006
HARVEST BY AGE AND SEXSea Lion Harbor Seal
Reported by Community Est. Reported by Community Est.Sample (Expanded) Sample (Expanded)
Number % Number % Number % Number %Adult Male 0 --- 0.0 --- 0 0.0% 0.0 0.0%
Adult Female 0 --- 0.0 --- 2 12.5% 2.2 12.5%Adult Unknown Sex 0 --- 0.0 --- 4 25.0% 4.3 25.0%
Juvenile Male 0 --- 0.0 --- 0 0.0% 0.0 0.0%Juvenile Female 0 --- 0.0 --- 0 0.0% 0.0 0.0%
Juvenile Unknown Sex 0 --- 0.0 --- 0 0.0% 0.0 0.0%Pup Male 0 --- 0.0 --- 0 0.0% 0.0 0.0%
Pup Female 0 --- 0.0 --- 0 0.0% 0.0 0.0%Pup Unknown Sex 0 --- 0.0 --- 0 0.0% 0.0 0.0%
Male Unknown Age 0 --- 0.0 --- 0 0.0% 0.0 0.0%Female Unknown Age 0 --- 0.0 --- 0 0.0% 0.0 0.0%Unknown Sex and Age 0 --- 0.0 --- 10 62.5% 10.8 62.5%
Total 0 --- 0.0 --- 16 100.0% 17.3 100.0%
SEASONALLY ADJUSTED TAKE BY MONTH, SEA LION AND HARBOR SEAL
ESTIMATED COMMUNITY HARVEST, STRUCK AND LOST, AND TAKE BY YEAR
SEA LION HARBOR SEALStruck/ Total Struck/ Total
Year Harvest Lost Take Year Harvest Lost Take
1992 0.0 0.0 0.0 1992 40.5 36.0 76.51993 0.0 0.0 0.0 1993 30.7 19.9 50.61994 0.0 0.0 0.0 1994 63.0 45.3 108.31995 0.0 0.0 0.0 1995 17.0 10.0 27.01996 0.0 0.0 0.0 1996 34.3 34.3 68.61997 0.0 0.0 0.0 1997 69.2 50.0 119.21998 0.0 0.0 0.0 1998 36.1 18.6 54.72000 0.0 0.0 0.0 2000 19.6 0.0 19.62001 0.0 0.0 0.0 2001 10.1 3.4 13.42002 0.0 0.0 0.0 2002 30.4 18.3 48.72003 0.0 0.0 0.0 2003 10.0 5.6 15.62004 0.0 0.0 0.0 2004 20.0 13.0 33.02005 0.0 0.0 0.0 2005 13.0 19.5 32.52006 0.0 0.0 0.0 2006 17.3 6.5 23.8
SOURCE: Alaska Department of Fish and Game, Division of Subsistence, Household Surveys 1992-1998;BBNA Household Surveys, 2007.
C - 112
0
1
2
3
4
5
6
7
8
9
10
Jan Feb Mar Apr May Jun Jul Aug Sep Oct Nov Dec
Seas
onal
ly A
djus
ted
Tota
l Tak
e
Sea Lion Harbor Seal

Table 57. SEA LION AND HARBOR SEAL HARVEST / TAKE ESTIMATES: South Naknek, 2006
SAMPLING DESIGN: CENSUS Total Native Households 23
Surveyed Households 21Sampling Fraction
Sample Household Members 43Estimated Household Members 47.1
2000 U.S. Census Estimated Native Population 115HARVEST AND USE INFORMATION
Percentage of Native Households: Estimated Community Harvest Sea Harbor and Take (Expanded): Sea Harbor
Lion Seal Lion SealUsed 0.0% 4.8% Total Number Harvested 0.0 0.0
Hunted 0.0% 4.8% Total Number Struck and Lost 0.0 0.0Harvested 0.0% 0.0% Total Number Taken 0.0 0.0Received 0.0% 4.8%
Gave Away 0.0% 0.0% Number Harvested Per Capita 0.00 0.00
SEA LION HARVEST BY MONTH UnknownJan Feb Mar Apr May Jun Jul Aug Sep Oct Nov Dec Month Total
REPORTED HARVEST AND TAKE BY SAMPLED HOUSEHOLDS (UNEXPANDED)Harvest 0 0 0 0 0 0 0 0 0 0 0 0 0 0Struck & Lost 0 0 0 0 0 0 0 0 0 0 0 0 0 0Total Take 0 0 0 0 0 0 0 0 0 0 0 0 0 0
ESTIMATED HARVEST AND TAKE BY COMMUNITY (EXPANDED)Harvest 0.0 0.0 0.0 0.0 0.0 0.0 0.0 0.0 0.0 0.0 0.0 0.0 0.0 0.0Struck & Lost 0.0 0.0 0.0 0.0 0.0 0.0 0.0 0.0 0.0 0.0 0.0 0.0 0.0 0.0Total Take 0.0 0.0 0.0 0.0 0.0 0.0 0.0 0.0 0.0 0.0 0.0 0.0 0.0 0.0
ESTIMATED SEASONALLY ADJUSTED HARVEST AND TAKE BY COMMUNITY (EXPANDED)Harvest 0.0 0.0 0.0 0.0 0.0 0.0 0.0 0.0 0.0 0.0 0.0 0.0 0.0Struck & Lost 0.0 0.0 0.0 0.0 0.0 0.0 0.0 0.0 0.0 0.0 0.0 0.0 0.0Total Take 0.0 0.0 0.0 0.0 0.0 0.0 0.0 0.0 0.0 0.0 0.0 0.0 0.0Total Take (%) --- --- --- --- --- --- --- --- --- --- --- --- ---Cum. Take 0.0 0.0 0.0 0.0 0.0 0.0 0.0 0.0 0.0 0.0 0.0 0.0Cum. Take (%) --- --- --- --- --- --- --- --- --- --- --- ---
HARBOR SEAL HARVEST BY MONTH UnknownJan Feb Mar Apr May Jun Jul Aug Sep Oct Nov Dec Month Total
REPORTED HARVEST AND TAKE BY SAMPLED HOUSEHOLDS (UNEXPANDED)Harvest 0 0 0 0 0 0 0 0 0 0 0 0 0 0Struck & Lost 0 0 0 0 0 0 0 0 0 0 0 0 0 0Total Take 0 0 0 0 0 0 0 0 0 0 0 0 0 0
ESTIMATED HARVEST AND TAKE BY COMMUNITY (EXPANDED)Harvest 0.0 0.0 0.0 0.0 0.0 0.0 0.0 0.0 0.0 0.0 0.0 0.0 0.0 0.0Struck & Lost 0.0 0.0 0.0 0.0 0.0 0.0 0.0 0.0 0.0 0.0 0.0 0.0 0.0 0.0Total Take 0.0 0.0 0.0 0.0 0.0 0.0 0.0 0.0 0.0 0.0 0.0 0.0 0.0 0.0
ESTIMATED SEASONALLY ADJUSTED HARVEST AND TAKE BY COMMUNITY (EXPANDED)Harvest 0.0 0.0 0.0 0.0 0.0 0.0 0.0 0.0 0.0 0.0 0.0 0.0 0.0Struck & Lost 0.0 0.0 0.0 0.0 0.0 0.0 0.0 0.0 0.0 0.0 0.0 0.0 0.0Total Take 0.0 0.0 0.0 0.0 0.0 0.0 0.0 0.0 0.0 0.0 0.0 0.0 0.0Total Take (%) --- --- --- --- --- --- --- --- --- --- --- --- ---Cum. Take 0.0 0.0 0.0 0.0 0.0 0.0 0.0 0.0 0.0 0.0 0.0 0.0Cum. Take (%) --- --- --- --- --- --- --- --- --- --- --- --- SOURCE: BBNA Household Surveys, 2007.
C - 113
91.3%

Table 57. (cont.) SEA LION & HARBOR SEAL HARVEST ESTIMATES: South Naknek, 2006
HARVEST BY AGE AND SEXSea Lion Harbor Seal
Reported by Community Est. Reported by Community Est.Sample (Expanded) Sample (Expanded)
Number % Number % Number % Number %Adult Male 0 --- 0.0 --- 0 --- 0.0 ---
Adult Female 0 --- 0.0 --- 0 --- 0.0 ---Adult Unknown Sex 0 --- 0.0 --- 0 --- 0.0 ---
Juvenile Male 0 --- 0.0 --- 0 --- 0.0 ---Juvenile Female 0 --- 0.0 --- 0 --- 0.0 ---
Juvenile Unknown Sex 0 --- 0.0 --- 0 --- 0.0 ---Pup Male 0 --- 0.0 --- 0 --- 0.0 ---
Pup Female 0 --- 0.0 --- 0 --- 0.0 ---Pup Unknown Sex 0 --- 0.0 --- 0 --- 0.0 ---
Male Unknown Age 0 --- 0.0 --- 0 --- 0.0 ---Female Unknown Age 0 --- 0.0 --- 0 --- 0.0 ---Unknown Sex and Age 0 --- 0.0 --- 0 --- 0.0 ---
Total 0 --- 0.0 --- 0 --- 0.0 ---
SEASONALLY ADJUSTED TAKE BY MONTH, SEA LION AND HARBOR SEAL
ESTIMATED COMMUNITY HARVEST, STRUCK AND LOST, AND TAKE BY YEAR
SEA LION HARBOR SEALStruck/ Total Struck/ Total
Year Harvest Lost Take Year Harvest Lost Take
1992 0.0 0.0 0.0 1992 2.3 6.9 9.21993 0.0 0.0 0.0 1993 6.4 18.0 24.41994 0.0 0.0 0.0 1994 4.4 1.1 5.51995 0.0 0.0 0.0 1995 2.1 0.0 2.11996 0.0 0.0 0.0 1996 1.0 0.0 1.01997 0.0 0.0 0.0 1997 2.5 9.8 12.31998 0.0 0.0 0.0 1998 5.2 7.9 13.12000 0.0 0.0 0.0 2000 4.1 2.7 6.82001 0.0 0.0 0.0 2001 11.0 3.0 14.02002 0.0 0.0 0.0 2002 16.0 3.0 19.02003 0.0 0.0 0.0 2003 1.1 0.0 1.12004 0.0 0.0 0.0 2004 15.4 4.4 19.82005 0.0 0.0 0.0 2005 17.3 9.2 26.52006 0.0 0.0 0.0 2006 0.0 0.0 0.0
SOURCE: Alaska Department of Fish and Game, Division of Subsistence, Household Surveys 1992-1998;BBNA Household Surveys, 2007.
C - 114
0
1
Jan Feb Mar Apr May Jun Jul Aug Sep Oct Nov Dec
Seas
onal
ly A
djus
ted
Tota
l Tak
e
Sea Lion Harbor Seal

Table 58. SEA LION, SPOTTED SEAL, AND HARBOR SEAL HARVEST: Aleknagik, 2006SAMPLING DESIGN: TotalCENSUS Total Native Households 41
Surveyed Households 34Sampling Fraction 82.9%
Sample Household Members 126Estimated Household Members 151.9
2000 U.S. Census Estimated Native Population 187HARVEST AND USE INFORMATION Percentage of Native Households: Estimated Community Harvest
Sea Harbor Seal and and Take (Expanded): Sea Harbor SpottedLion Spotted Seal Lion Seal Seal
Used 0.0% 85.3% Total Number Harvested 0.0 0.0 9.6Hunted 0.0% 35.3% Total Number Struck and Lost 0.0 0.0 7.2
Harvested 0.0% 20.6% Total Number Taken 0.0 0.0 16.9Received 0.0% 67.6%
Gave Away 0.0% 20.6% Number Harvested Per Capita 0.00 0.00 0.05
SEA LION HARVEST BY MONTH UnknownJan Feb Mar Apr May Jun Jul Aug Sep Oct Nov Dec Month Total
REPORTED HARVEST AND TAKE BY SAMPLED HOUSEHOLDS (UNEXPANDED)Harvest 0 0 0 0 0 0 0 0 0 0 0 0 0 0Struck & Lost 0 0 0 0 0 0 0 0 0 0 0 0 0 0Total Take 0 0 0 0 0 0 0 0 0 0 0 0 0 0
ESTIMATED HARVEST AND TAKE BY COMMUNITY (EXPANDED)Harvest 0.0 0.0 0.0 0.0 0.0 0.0 0.0 0.0 0.0 0.0 0.0 0.0 0.0 0.0Struck & Lost 0.0 0.0 0.0 0.0 0.0 0.0 0.0 0.0 0.0 0.0 0.0 0.0 0.0 0.0Total Take 0.0 0.0 0.0 0.0 0.0 0.0 0.0 0.0 0.0 0.0 0.0 0.0 0.0 0.0
ESTIMATED SEASONALLY ADJUSTED HARVEST AND TAKE BY COMMUNITY (EXPANDED)Harvest 0.0 0.0 0.0 0.0 0.0 0.0 0.0 0.0 0.0 0.0 0.0 0.0 0.0Struck & Lost 0.0 0.0 0.0 0.0 0.0 0.0 0.0 0.0 0.0 0.0 0.0 0.0 0.0Total Take 0.0 0.0 0.0 0.0 0.0 0.0 0.0 0.0 0.0 0.0 0.0 0.0 0.0Total Take (%) --- --- --- --- --- --- --- --- --- --- --- --- ---Cum. Take 0.0 0.0 0.0 0.0 0.0 0.0 0.0 0.0 0.0 0.0 0.0 0.0Cum. Take (%) --- --- --- --- --- --- --- --- --- --- --- ---
HARBOR SEAL AND SPOTTED SEAL HARVEST BY MONTHSpotted Seal Harbor Seal Spotted Seal Unknown
Jan Feb Mar Apr May Jun Jul Aug Sep Oct Nov Dec Month Total
REPORTED HARVEST AND TAKE BY SAMPLED HOUSEHOLDS (UNEXPANDED)Harvest 0 0 0 2 6 0 0 0 0 0 0 0 0 8Struck & Lost 0 0 0 1 5 0 0 0 0 0 0 0 0 6Total Take 0 0 0 3 11 0 0 0 0 0 0 0 0 14
ESTIMATED HARVEST AND TAKE BY COMMUNITY (EXPANDED)Harvest 0.0 0.0 0.0 2.4 7.2 0.0 0.0 0.0 0.0 0.0 0.0 0.0 0.0 9.6Struck & Lost 0.0 0.0 0.0 1.2 6.0 0.0 0.0 0.0 0.0 0.0 0.0 0.0 0.0 7.2Total Take 0.0 0.0 0.0 3.6 13.3 0.0 0.0 0.0 0.0 0.0 0.0 0.0 0.0 16.9
ESTIMATED SEASONALLY ADJUSTED HARVEST AND TAKE BY COMMUNITY (EXPANDED)Harvest 0.0 0.0 0.0 2.4 7.2 0.0 0.0 0.0 0.0 0.0 0.0 0.0 9.6Struck & Lost 0.0 0.0 0.0 1.2 6.0 0.0 0.0 0.0 0.0 0.0 0.0 0.0 7.2Total Take 0.0 0.0 0.0 3.6 13.3 0.0 0.0 0.0 0.0 0.0 0.0 0.0 16.9Total Take (%) 0.0% 0.0% 0.0% 21.4% 78.6% 0.0% 0.0% 0.0% 0.0% 0.0% 0.0% 0.0% 100.0%Cum. Take 0.0 0.0 0.0 3.6 16.9 16.9 16.9 16.9 16.9 16.9 16.9 16.9Cum. Take (%) 0.0% 0.0% 0.0% 21.4% 100.0% 100.0% 100.0% 100.0% 100.0% 100.0% 100.0% 100.0% SOURCE: BBNA Househod Surveys (Numbers based on 2005 harvest estimate).
C - 115

Table 58. (cont.) SEA LION, SPOTTED SEAL, AND HARBOR SEAL HARVEST: Aleknagik, 2006
HARVEST BY AGE AND SEXSea Lion Harbor Seal Spotted Seal
Reported by Community Est. Reported by Community Est. Reported by Community Est.Sample (Expanded) Sample* (Expanded) Sample* (Expanded)
Number % Number % Number % Number % Number % Number %Adult Male 0 --- 0.0 --- 0 --- 0.0 --- 2 25.0% 2.4 25.0%
Adult Female 0 --- 0.0 --- 0 --- 0.0 --- 0 0.0% 0.0 0.0%Adult Unknown Sex 0 --- 0.0 --- 0 --- 0.0 --- 6 75.0% 7.2 75.0%
Juvenile Male 0 --- 0.0 --- 0 --- 0.0 --- 0 0.0% 0.0 0.0%Juvenile Female 0 --- 0.0 --- 0 --- 0.0 --- 0 0.0% 0.0 0.0%
Juvenile Unknown Sex 0 --- 0.0 --- 0 --- 0.0 --- 0 0.0% 0.0 0.0%Pup Male 0 --- 0.0 --- 0 --- 0.0 --- 0 0.0% 0.0 0.0%
Pup Female 0 --- 0.0 --- 0 --- 0.0 --- 0 0.0% 0.0 0.0%Pup Unknown Sex 0 --- 0.0 --- 0 --- 0.0 --- 0 0.0% 0.0 0.0%
Male Unknown Age 0 --- 0.0 --- 0 --- 0.0 --- 0 0.0% 0.0 0.0%Female Unknown Age 0 --- 0.0 --- 0 --- 0.0 --- 0 0.0% 0.0 0.0%Unknown Sex and Age 0 --- 0.0 --- 0 --- 0.0 --- 0 0.0% 0.0 0.0%
Total 0 --- 0.0 --- 0 --- 0.0 --- 8 100.0% 9.6 100.0%* Harvest in unknown months is not included in the sample harvest, but is included in the community estimate column.
SEASONALLY ADJUSTED TAKE BY MONTH, SEA LION, HARBOR SEAL, AND SPOTTED SEAL
ESTIMATED COMMUNITY HARVEST, STRUCK AND LOST, AND TAKE BY YEAR
SEA LION HARBOR SEAL SPOTTED SEALStruck/ Total Struck/ Total Struck/ Total
Year Harvest Lost Take Year Harvest Lost Take Year Harvest Lost Take
1992 0.0 0.0 0.0 1992 0.0 3.6 3.6 1992 28.6 5.5 34.11993 0.0 0.0 0.0 1993 0.0 0.0 0.0 1993 4.8 0.0 4.81994 0.0 0.0 0.0 1994 0.0 3.3 3.3 1994 21.5 0.0 21.51995 0.0 0.0 0.0 1995 0.0 0.0 0.0 1995 11.8 13.0 24.91996 0.0 0.0 0.0 1996 0.0 0.0 0.0 1996 7.1 0.0 7.11997 0.0 0.0 0.0 1997 1.2 0.0 1.2 1997 10.8 0.0 10.81998 0.0 0.0 0.0 1998 3.1 0.0 3.1 1998 5.2 0.0 5.22000 0.0 0.0 0.0 2000 2.5 0.0 2.5 2000 6.1 2.5 8.62001 0.0 0.0 0.0 2001 0.0 1.2 1.2 2001 0.0 0.0 0.02002 0.0 0.0 0.0 2002 0.0 2.2 2.2 2002 6.6 11.0 17.62003 0.0 0.0 0.0 2003 0.0 0.0 0.0 2003 3.8 0.0 3.82004 0.0 0.0 0.0 2004 0.0 0.0 0.0 2004 4.6 1.5 6.12005 0.0 0.0 0.0 2005 0.0 0.0 0.0 2005 9.6 7.2 16.92006 0.0 0.0 0.0 2006 0.0 0.0 0.0 2006 9.6 7.2 16.9
SOURCE: Alaska Department of Fish and Game, Division of Subsistence, Household Surveys 1992-1998;BBNA Househod Surveys, 2000-2006 (Numbers based on 2005 harvest estimate).
C - 116
0
10
20
30
40
Jan Feb Mar Apr May Jun Jul Aug Sep Oct Nov Dec
Seas
onal
ly A
djus
ted
Tota
l Tak
e
Sea Lion Harbor Seal Spotted Seal
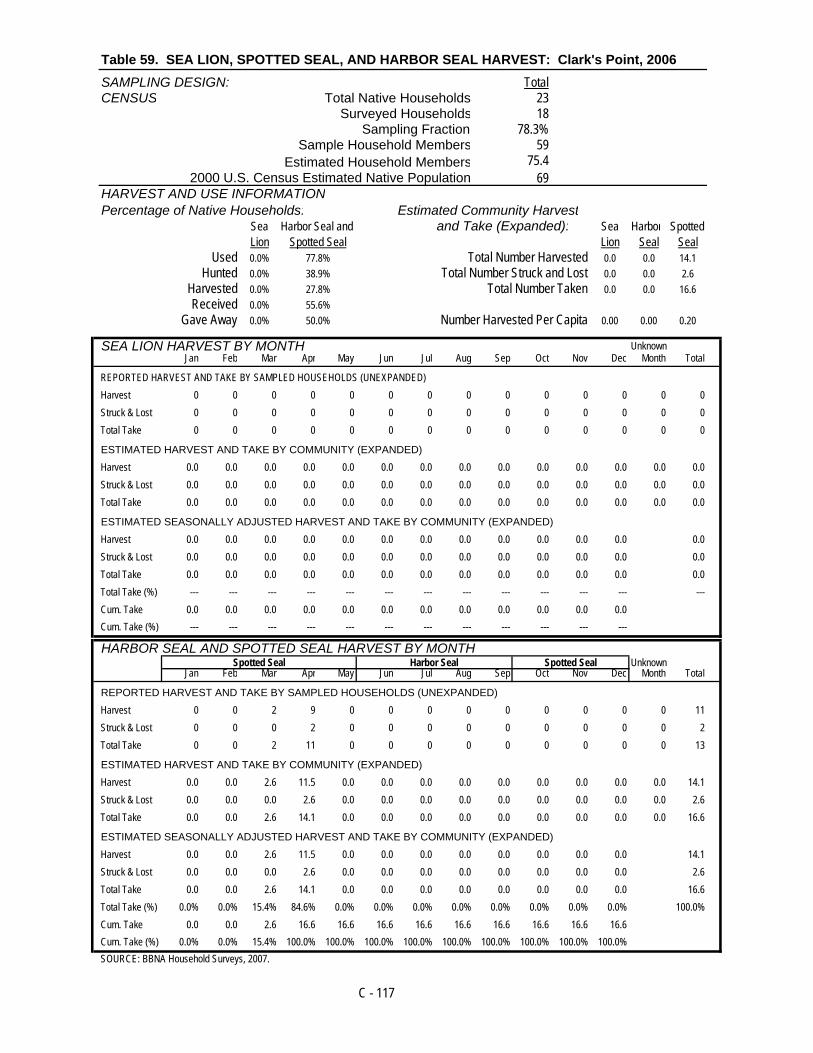
Table 59. SEA LION, SPOTTED SEAL, AND HARBOR SEAL HARVEST: Clark's Point, 2006SAMPLING DESIGN: TotalCENSUS Total Native Households 23
Surveyed Households 18Sampling Fraction 78.3%
Sample Household Members 59Estimated Household Members 75.4
2000 U.S. Census Estimated Native Population 69HARVEST AND USE INFORMATION Percentage of Native Households: Estimated Community Harvest
Sea Harbor Seal and and Take (Expanded): Sea Harbor SpottedLion Spotted Seal Lion Seal Seal
Used 0.0% 77.8% Total Number Harvested 0.0 0.0 14.1Hunted 0.0% 38.9% Total Number Struck and Lost 0.0 0.0 2.6
Harvested 0.0% 27.8% Total Number Taken 0.0 0.0 16.6Received 0.0% 55.6%
Gave Away 0.0% 50.0% Number Harvested Per Capita 0.00 0.00 0.20
SEA LION HARVEST BY MONTH UnknownJan Feb Mar Apr May Jun Jul Aug Sep Oct Nov Dec Month Total
REPORTED HARVEST AND TAKE BY SAMPLED HOUSEHOLDS (UNEXPANDED)Harvest 0 0 0 0 0 0 0 0 0 0 0 0 0 0Struck & Lost 0 0 0 0 0 0 0 0 0 0 0 0 0 0Total Take 0 0 0 0 0 0 0 0 0 0 0 0 0 0
ESTIMATED HARVEST AND TAKE BY COMMUNITY (EXPANDED)
Harvest 0.0 0.0 0.0 0.0 0.0 0.0 0.0 0.0 0.0 0.0 0.0 0.0 0.0 0.0Struck & Lost 0.0 0.0 0.0 0.0 0.0 0.0 0.0 0.0 0.0 0.0 0.0 0.0 0.0 0.0Total Take 0.0 0.0 0.0 0.0 0.0 0.0 0.0 0.0 0.0 0.0 0.0 0.0 0.0 0.0
ESTIMATED SEASONALLY ADJUSTED HARVEST AND TAKE BY COMMUNITY (EXPANDED)
Harvest 0.0 0.0 0.0 0.0 0.0 0.0 0.0 0.0 0.0 0.0 0.0 0.0 0.0Struck & Lost 0.0 0.0 0.0 0.0 0.0 0.0 0.0 0.0 0.0 0.0 0.0 0.0 0.0Total Take 0.0 0.0 0.0 0.0 0.0 0.0 0.0 0.0 0.0 0.0 0.0 0.0 0.0Total Take (%) --- --- --- --- --- --- --- --- --- --- --- --- ---Cum. Take 0.0 0.0 0.0 0.0 0.0 0.0 0.0 0.0 0.0 0.0 0.0 0.0Cum. Take (%) --- --- --- --- --- --- --- --- --- --- --- ---
HARBOR SEAL AND SPOTTED SEAL HARVEST BY MONTHSpotted Seal Harbor Seal Spotted Seal Unknown
Jan Feb Mar Apr May Jun Jul Aug Sep Oct Nov Dec Month Total
REPORTED HARVEST AND TAKE BY SAMPLED HOUSEHOLDS (UNEXPANDED)
Harvest 0 0 2 9 0 0 0 0 0 0 0 0 0 11Struck & Lost 0 0 0 2 0 0 0 0 0 0 0 0 0 2Total Take 0 0 2 11 0 0 0 0 0 0 0 0 0 13
ESTIMATED HARVEST AND TAKE BY COMMUNITY (EXPANDED)
Harvest 0.0 0.0 2.6 11.5 0.0 0.0 0.0 0.0 0.0 0.0 0.0 0.0 0.0 14.1Struck & Lost 0.0 0.0 0.0 2.6 0.0 0.0 0.0 0.0 0.0 0.0 0.0 0.0 0.0 2.6Total Take 0.0 0.0 2.6 14.1 0.0 0.0 0.0 0.0 0.0 0.0 0.0 0.0 0.0 16.6
ESTIMATED SEASONALLY ADJUSTED HARVEST AND TAKE BY COMMUNITY (EXPANDED)
Harvest 0.0 0.0 2.6 11.5 0.0 0.0 0.0 0.0 0.0 0.0 0.0 0.0 14.1Struck & Lost 0.0 0.0 0.0 2.6 0.0 0.0 0.0 0.0 0.0 0.0 0.0 0.0 2.6Total Take 0.0 0.0 2.6 14.1 0.0 0.0 0.0 0.0 0.0 0.0 0.0 0.0 16.6Total Take (%) 0.0% 0.0% 15.4% 84.6% 0.0% 0.0% 0.0% 0.0% 0.0% 0.0% 0.0% 0.0% 100.0%Cum. Take 0.0 0.0 2.6 16.6 16.6 16.6 16.6 16.6 16.6 16.6 16.6 16.6Cum. Take (%) 0.0% 0.0% 15.4% 100.0% 100.0% 100.0% 100.0% 100.0% 100.0% 100.0% 100.0% 100.0% SOURCE: BBNA Household Surveys, 2007.
C - 117

Table 59. (cont.) SEA LION, SPOTTED SEAL, AND HARBOR SEAL HARVEST: Clark's Point, 2006
HARVEST BY AGE AND SEXSea Lion Harbor Seal Spotted Seal
Reported by Community Est. Reported by Community Est. Reported by Community Est.Sample (Expanded) Sample* (Expanded) Sample* (Expanded)
Number % Number % Number % Number % Number % Number %Adult Male 0 --- 0.0 --- 0 --- 0.0 --- 5 45.5% 6.4 45.5%
Adult Female 0 --- 0.0 --- 0 --- 0.0 --- 1 9.1% 1.3 9.1%Adult Unknown Sex 0 --- 0.0 --- 0 --- 0.0 --- 0 0.0% 0.0 0.0%
Juvenile Male 0 --- 0.0 --- 0 --- 0.0 --- 0 0.0% 0.0 0.0%Juvenile Female 0 --- 0.0 --- 0 --- 0.0 --- 0 0.0% 0.0 0.0%
Juvenile Unknown Sex 0 --- 0.0 --- 0 --- 0.0 --- 0 0.0% 0.0 0.0%Pup Male 0 --- 0.0 --- 0 --- 0.0 --- 1 9.1% 1.3 9.1%
Pup Female 0 --- 0.0 --- 0 --- 0.0 --- 0 0.0% 0.0 0.0%Pup Unknown Sex 0 --- 0.0 --- 0 --- 0.0 --- 0 0.0% 0.0 0.0%
Male Unknown Age 0 --- 0.0 --- 0 --- 0.0 --- 2 18.2% 2.6 18.2%Female Unknown Age 0 --- 0.0 --- 0 --- 0.0 --- 0 0.0% 0.0 0.0%
Unknown Sex and Age 0 --- 0.0 --- 0 --- 0.0 --- 2 18.2% 2.6 18.2%Total 0 --- 0.0 --- 0 --- 0.0 --- 11 100.0% 14.1 100.0%
* Harvest in unknown months is not included in the sample harvest, but is included in the community estimate column.
SEASONALLY ADJUSTED TAKE BY MONTH, SEA LION, HARBOR SEAL, AND SPOTTED SEAL
ESTIMATED COMMUNITY HARVEST, STRUCK AND LOST, AND TAKE BY YEARSEA LION HARBOR SEAL SPOTTED SEAL
Struck/ Total Struck/ Total Struck/ TotalYear Harvest Lost Take Year Harvest Lost Take Year Harvest Lost Take
1992 0.0 0.0 0.0 1992 0.0 0.0 0.0 1992 10.6 8.5 19.11993 0.0 0.0 0.0 1993 0.0 0.0 0.0 1993 2.0 0.0 2.01994 0.0 0.0 0.0 1994 0.0 0.0 0.0 1994 2.0 0.0 2.01995 0.0 0.0 0.0 1995 0.0 0.0 0.0 1995 10.0 5.0 15.01996 0.0 0.0 0.0 1996 0.0 0.0 0.0 1996 17.1 3.8 20.91997 0.0 0.0 0.0 1997 1.3 0.0 1.3 1997 3.8 1.3 5.01998 0.0 0.0 0.0 1998 1.3 0.0 1.3 1998 3.8 1.3 5.02000 0.0 0.0 0.0 2000 0.0 0.0 0.0 2000 22.4 1.4 23.82001 0.0 0.0 0.0 2001 0.0 0.0 0.0 2001 28.2 11.5 39.72002 0.0 0.0 0.0 2002 0.0 0.0 0.0 2002 81.0 13.3 94.32003 0.0 0.0 0.0 2003 0.0 0.0 0.0 2003 2.0 0.0 2.02004 0.0 0.0 0.0 2004 0.0 0.0 0.0 2004 27.0 15.0 42.02005 0.0 0.0 0.0 2005 2.8 0.0 2.8 2005 5.5 0.0 5.52006 0.0 0.0 0.0 2006 0.0 0.0 0.0 2006 14.1 2.6 16.6
SOURCE: Alaska Department of Fish and Game, Division of Subsistence, Household Surveys 1992-1998;BBNA Household Surveys, 2000-2007.
C - 118
0
10
20
30
40
Jan Feb Mar Apr May Jun Jul Aug Sep Oct Nov Dec
Seas
onal
ly A
djus
ted
Tota
l Tak
e
Sea Lion Harbor Seal Spotted Seal

Table 60. SEA LION, SPOTTED SEAL, AND HARBOR SEAL HARVEST: Dillingham, 2006SAMPLING DESIGN: Active Other TotalTWO-STRATA Total Native Households 22 54 76
Surveyed Households 13 54 67Sampling Fraction
Sample Household Members 41 175 216Estimated Household Members 69.4 175.0 244.4
2000 U.S. Census Estimated Native Population --- --- 1503HARVEST AND USE INFORMATION Percentage of Native Households: Estimated Community Harvest
Sea Harbor Seal and and Take (Expanded): Sea Harbor SpottedLion Spotted Seal Lion Seal Seal
Used 0.0% 74.1% Total Number Harvested 0.0 0.0 15.2Hunted 0.0% 16.4% Total Number Struck and Lost 0.0 1.0 0.0
Harvested 0.0% 11.1% Total Number Taken 0.0 1.0 15.2Received 0.0% 71.9%
Gave Away 0.0% 50.7% Number Harvested Per Capita 0.00 0.00 0.01
SEA LION HARVEST BY MONTH UnknownJan Feb Mar Apr May Jun Jul Aug Sep Oct Nov Dec Month Total
REPORTED HARVEST AND TAKE BY SAMPLED HOUSEHOLDS (UNEXPANDED)Harvest 0 0 0 0 0 0 0 0 0 0 0 0 0 0Struck & Lost 0 0 0 0 0 0 0 0 0 0 0 0 0 0Total Take 0 0 0 0 0 0 0 0 0 0 0 0 0 0
ESTIMATED HARVEST AND TAKE BY COMMUNITY (EXPANDED)Harvest 0.0 0.0 0.0 0.0 0.0 0.0 0.0 0.0 0.0 0.0 0.0 0.0 0.0 0.0Struck & Lost 0.0 0.0 0.0 0.0 0.0 0.0 0.0 0.0 0.0 0.0 0.0 0.0 0.0 0.0Total Take 0.0 0.0 0.0 0.0 0.0 0.0 0.0 0.0 0.0 0.0 0.0 0.0 0.0 0.0
ESTIMATED SEASONALLY ADJUSTED HARVEST AND TAKE BY COMMUNITY (EXPANDED)Harvest 0.0 0.0 0.0 0.0 0.0 0.0 0.0 0.0 0.0 0.0 0.0 0.0 0.0Struck & Lost 0.0 0.0 0.0 0.0 0.0 0.0 0.0 0.0 0.0 0.0 0.0 0.0 0.0Total Take 0.0 0.0 0.0 0.0 0.0 0.0 0.0 0.0 0.0 0.0 0.0 0.0 0.0Total Take (%) --- --- --- --- --- --- --- --- --- --- --- --- ---Cum. Take 0.0 0.0 0.0 0.0 0.0 0.0 0.0 0.0 0.0 0.0 0.0 0.0Cum. Take (%) --- --- --- --- --- --- --- --- --- --- --- ---
HARBOR SEAL AND SPOTTED SEAL HARVEST BY MONTHSpotted Seal Harbor Seal Spotted Seal Unknown
Jan Feb Mar Apr May Jun Jul Aug Sep Oct Nov Dec Month Total
REPORTED HARVEST AND TAKE BY SAMPLED HOUSEHOLDS (UNEXPANDED)Harvest 0 0 0 8 1 0 0 0 0 0 0 0 0 9Struck & Lost 0 0 0 0 0 0 1 0 0 0 0 0 0 1Total Take 0 0 0 8 1 0 1 0 0 0 0 0 0 10
ESTIMATED HARVEST AND TAKE BY COMMUNITY (EXPANDED)Harvest 0.0 0.0 0.0 13.5 1.7 0.0 0.0 0.0 0.0 0.0 0.0 0.0 0.0 15.2Struck & Lost 0.0 0.0 0.0 0.0 0.0 0.0 1.0 0.0 0.0 0.0 0.0 0.0 0.0 1.0Total Take 0.0 0.0 0.0 13.5 1.7 0.0 1.0 0.0 0.0 0.0 0.0 0.0 0.0 16.2
ESTIMATED SEASONALLY ADJUSTED HARVEST AND TAKE BY COMMUNITY (EXPANDED)Harvest 0.0 0.0 0.0 13.5 1.7 0.0 0.0 0.0 0.0 0.0 0.0 0.0 15.2Struck & Lost 0.0 0.0 0.0 0.0 0.0 0.0 1.0 0.0 0.0 0.0 0.0 0.0 1.0Total Take 0.0 0.0 0.0 13.5 1.7 0.0 1.0 0.0 0.0 0.0 0.0 0.0 16.2Total Take (%) 0.0% 0.0% 0.0% 83.4% 10.4% 0.0% 6.2% 0.0% 0.0% 0.0% 0.0% 0.0% 100.0%Cum. Take 0.0 0.0 0.0 13.5 15.2 15.2 16.2 16.2 16.2 16.2 16.2 16.2Cum. Take (%) 0.0% 0.0% 0.0% 83.4% 93.8% 93.8% 100.0% 100.0% 100.0% 100.0% 100.0% 100.0% SOURCE: BBNA Household Surveys, 2007.
C - 119
59.1% 100.0% 88.2%

Table 60. (cont.) SEA LION, SPOTTED SEAL, AND HARBOR SEAL HARVEST: Dillingham, 2006
HARVEST BY AGE AND SEXSea Lion Harbor Seal Spotted Seal
Reported by Community Est. Reported by Community Est. Reported by Community Est.Sample (Expanded) Sample* (Expanded) Sample* (Expanded)
Number % Number % Number % Number % Number % Number %Adult Male 0 --- 0.0 --- 0 --- 0.0 --- 2 22.2% 3.4 22.2%
Adult Female 0 --- 0.0 --- 0 --- 0.0 --- 1 11.1% 1.7 11.1%Adult Unknown Sex 0 --- 0.0 --- 0 --- 0.0 --- 0 0.0% 0.0 0.0%
Juvenile Male 0 --- 0.0 --- 0 --- 0.0 --- 0 0.0% 0.0 0.0%Juvenile Female 0 --- 0.0 --- 0 --- 0.0 --- 0 0.0% 0.0 0.0%
Juvenile Unknown Sex 0 --- 0.0 --- 0 --- 0.0 --- 0 0.0% 0.0 0.0%Pup Male 0 --- 0.0 --- 0 --- 0.0 --- 0 0.0% 0.0 0.0%
Pup Female 0 --- 0.0 --- 0 --- 0.0 --- 0 0.0% 0.0 0.0%Pup Unknown Sex 0 --- 0.0 --- 0 --- 0.0 --- 0 0.0% 0.0 0.0%
Male Unknown Age 0 --- 0.0 --- 0 --- 0.0 --- 0 0.0% 0.0 0.0%Female Unknown Age 0 --- 0.0 --- 0 --- 0.0 --- 0 0.0% 0.0 0.0%Unknown Sex and Age 0 --- 0.0 --- 0 --- 0.0 --- 6 66.7% 10.2 66.7%
Total 0 --- 0.0 --- 0 --- 0.0 --- 9 100.0% 15.2 100.0%* Harvest in unknown months is not included in the sample harvest, but is included in the community estimate column.
SEASONALLY ADJUSTED TAKE BY MONTH, SEA LION, HARBOR SEAL, AND SPOTTED SEAL
ESTIMATED COMMUNITY HARVEST, STRUCK AND LOST, AND TAKE BY YEAR
SEA LION HARBOR SEAL SPOTTED SEALStruck/ Total Struck/ Total Struck/ Total
Year Harvest Lost Take Year Harvest Lost Take Year Harvest Lost Take
1992 0.0 0.0 0.0 1992 29.2 3.8 32.9 1992 49.6 3.8 53.31993 0.0 0.0 0.0 1993 18.0 4.2 22.2 1993 26.1 0.0 26.11994 0.0 0.0 0.0 1994 16.2 0.0 16.2 1994 35.2 3.0 38.21995 0.0 0.0 0.0 1995 13.3 0.0 13.3 1995 7.5 7.5 15.01996 0.0 0.0 0.0 1996 0.0 0.0 0.0 1996 40.6 1.0 41.61997 0.0 0.0 0.0 1997 1.2 0.0 1.2 1997 18.0 0.0 18.01998 0.0 0.0 0.0 1998 8.5 0.0 8.5 1998 12.2 1.2 13.42000 0.0 0.0 0.0 2000 0.0 0.0 0.0 2000 11.9 3.6 15.52001 0.0 0.0 0.0 2001 0.0 0.0 0.0 2001 6.1 3.6 9.72002 0.0 0.0 0.0 2002 0.0 0.0 0.0 2002 7.7 0.0 7.72003 0.0 0.0 0.0 2003 0.0 0.0 0.0 2003 4.1 0.0 4.12004 0.0 0.0 0.0 2004 0.0 0.0 0.0 2004 0.0 0.0 0.02005 0.0 0.0 0.0 2005 1.3 0.0 1.3 2005 22.5 3.8 26.22006 0.0 0.0 0.0 2006 0.0 1.0 1.0 2006 15.2 0.0 15.2
SOURCE: Alaska Department of Fish and Game, Division of Subsistence, Household Surveys 1992-1998;BBNA Household Surveys, 2000-2007.
C - 120
0
2
4
6
8
10
12
14
16
Jan Feb Mar Apr May Jun Jul Aug Sep Oct Nov Dec
Seas
onal
ly A
djus
ted
Tota
l Tak
e
Sea Lion Harbor Seal Spotted Seal

Table 61. SEA LION, SPOTTED SEAL, AND HARBOR SEAL HARVEST: Manokotak, 2006SAMPLING DESIGN: Active Other TotalTWO-STRATA Total Native Households 32 46 78
Surveyed Households 31 37 68Sampling Fraction 96.9% 80.4% 87.2%
Sample Household Members 149 180 329Estimated Household Members 153.8 223.8 377.6
2000 U.S. Census Estimated Native Population --- --- 378HARVEST AND USE INFORMATION Percentage of Native Households: Estimated Community Harvest
Sea Harbor Seal and and Take (Expanded): Sea Harbor SpottedLion Spotted Seal Lion Seal Seal
Used 0.0% 85.9% Total Number Harvested 0.0 6.6 45.9Hunted 0.0% 49.3% Total Number Struck and Lost 0.0 8.9 8.9
Harvested 0.0% 45.1% Total Number Taken 0.0 15.5 54.8Received 0.0% 74.3%
Gave Away 0.0% 27.6% Number Harvested Per Capita 0.00 0.02 0.12
SEA LION HARVEST BY MONTH UnknownJan Feb Mar Apr May Jun Jul Aug Sep Oct Nov Dec Month Total
REPORTED HARVEST AND TAKE BY SAMPLED HOUSEHOLDS (UNEXPANDED)Harvest 0 0 0 0 0 0 0 0 0 0 0 0 0 0Struck & Lost 0 0 0 0 0 0 0 0 0 0 0 0 0 0Total Take 0 0 0 0 0 0 0 0 0 0 0 0 0 0
ESTIMATED HARVEST AND TAKE BY COMMUNITY (EXPANDED)Harvest 0.0 0.0 0.0 0.0 0.0 0.0 0.0 0.0 0.0 0.0 0.0 0.0 0.0 0.0Struck & Lost 0.0 0.0 0.0 0.0 0.0 0.0 0.0 0.0 0.0 0.0 0.0 0.0 0.0 0.0Total Take 0.0 0.0 0.0 0.0 0.0 0.0 0.0 0.0 0.0 0.0 0.0 0.0 0.0 0.0
ESTIMATED SEASONALLY ADJUSTED HARVEST AND TAKE BY COMMUNITY (EXPANDED)Harvest 0.0 0.0 0.0 0.0 0.0 0.0 0.0 0.0 0.0 0.0 0.0 0.0 0.0Struck & Lost 0.0 0.0 0.0 0.0 0.0 0.0 0.0 0.0 0.0 0.0 0.0 0.0 0.0Total Take 0.0 0.0 0.0 0.0 0.0 0.0 0.0 0.0 0.0 0.0 0.0 0.0 0.0Total Take (%) --- --- --- --- --- --- --- --- --- --- --- --- ---Cum. Take 0.0 0.0 0.0 0.0 0.0 0.0 0.0 0.0 0.0 0.0 0.0 0.0Cum. Take (%) --- --- --- --- --- --- --- --- --- --- --- ---
HARBOR SEAL AND SPOTTED SEAL HARVEST BY MONTHSpotted Seal Harbor Seal Spotted Seal Unknown
Jan Feb Mar Apr May Jun Jul Aug Sep Oct Nov Dec Month Total
REPORTED HARVEST AND TAKE BY SAMPLED HOUSEHOLDS (UNEXPANDED)Harvest 1 0 4 14 5 0 0 1 5 6 7 4 0 47Struck & Lost 0 1 0 1 2 0 0 3 5 3 1 0 0 16Total Take 1 1 4 15 7 0 0 4 10 9 8 4 0 63
ESTIMATED HARVEST AND TAKE BY COMMUNITY (EXPANDED)Harvest 1.0 0.0 4.6 15.7 5.4 0.0 0.0 1.2 5.4 6.8 7.9 4.6 0.0 52.5Struck & Lost 0.0 1.2 0.0 1.0 2.3 0.0 0.0 3.1 5.8 3.3 1.0 0.0 0.0 17.8Total Take 1.0 1.2 4.6 16.7 7.6 0.0 0.0 4.3 11.2 10.1 8.9 4.6 0.0 70.3
ESTIMATED SEASONALLY ADJUSTED HARVEST AND TAKE BY COMMUNITY (EXPANDED)Harvest 1.0 0.0 4.6 15.7 5.4 0.0 0.0 1.2 5.4 6.8 7.9 4.6 52.5Struck & Lost 0.0 1.2 0.0 1.0 2.3 0.0 0.0 3.1 5.8 3.3 1.0 0.0 17.8Total Take 1.0 1.2 4.6 16.7 7.6 0.0 0.0 4.3 11.2 10.1 8.9 4.6 70.3Total Take (%) 1.5% 1.8% 6.5% 23.8% 10.9% 0.0% 0.0% 6.2% 15.9% 14.4% 12.6% 6.5% 100.0%Cum. Take 1.0 2.3 6.8 23.6 31.2 31.2 31.2 35.6 46.7 56.9 65.8 70.3Cum. Take (%) 1.5% 3.2% 9.7% 33.5% 44.4% 44.4% 44.4% 50.6% 66.5% 80.9% 93.5% 100.0% SOURCE: BBNA Household Surveys (Numbers based on 2005 harvest estimates).BBNA Household Surveys (Numbers based on 2005 harvest estimates).
C - 121

Table 61. (cont.) SEA LION, SPOTTED SEAL, AND HARBOR SEAL HARVEST: Manokotak, 2006
HARVEST BY AGE AND SEXSea Lion Harbor Seal Spotted Seal
Reported by Community Est. Reported by Community Est. Reported by Community Est.Sample (Expanded) Sample* (Expanded) Sample* (Expanded)
Number % Number % Number % Number % Number % Number %Adult Male 0 --- 0.0 --- 1 16.7% 1.2 18.8% 5 12.2% 5.4 11.7%
Adult Female 0 --- 0.0 --- 1 16.7% 1.0 15.6% 1 2.4% 1.0 2.2%Adult Unknown Sex 0 --- 0.0 --- 2 33.3% 2.1 31.2% 20 48.8% 22.3 48.6%
Juvenile Male 0 --- 0.0 --- 1 16.7% 1.2 18.8% 3 7.3% 3.5 7.7%Juvenile Female 0 --- 0.0 --- 0 0.0% 0.0 0.0% 0 0.0% 0.0 0.0%
Juvenile Unknown Sex 0 --- 0.0 --- 1 16.7% 1.0 15.6% 2 4.9% 2.1 4.5%Pup Male 0 --- 0.0 --- 0 0.0% 0.0 0.0% 0 0.0% 0.0 0.0%
Pup Female 0 --- 0.0 --- 0 0.0% 0.0 0.0% 0 0.0% 0.0 0.0%Pup Unknown Sex 0 --- 0.0 --- 0 0.0% 0.0 0.0% 1 2.4% 1.2 2.7%
Male Unknown Age 0 --- 0.0 --- 0 0.0% 0.0 0.0% 0 0.0% 0.0 0.0%Female Unknown Age 0 --- 0.0 --- 0 0.0% 0.0 0.0% 1 2.4% 1.0 2.2%Unknown Sex and Age 0 --- 0.0 --- 0 0.0% 0.0 0.0% 8 19.5% 9.3 20.3%
Total 0 --- 0.0 --- 6 100.0% 6.6 100.0% 41 100.0% 45.9 100.0%* Harvest in unknown months is not included in the sample harvest, but is included in the community estimate column.
SEASONALLY ADJUSTED TAKE BY MONTH, SEA LION, HARBOR SEAL, AND SPOTTED SEAL
ESTIMATED COMMUNITY HARVEST, STRUCK AND LOST, AND TAKE BY YEAR
SEA LION HARBOR SEAL SPOTTED SEALStruck/ Total Struck/ Total Struck/ Total
Year Harvest Lost Take Year Harvest Lost Take Year Harvest Lost Take
1992 3.9 0.0 3.9 1992 4.9 3.8 8.7 1992 25.1 1.0 26.11993 0.0 0.0 0.0 1993 3.2 0.0 3.2 1993 7.4 0.0 7.41994 0.0 0.0 0.0 1994 0.0 0.0 0.0 1994 13.7 0.0 13.71995 0.0 0.0 0.0 1995 9.3 2.4 11.7 1995 22.9 3.6 26.51996 0.0 0.0 0.0 1996 2.4 3.6 6.0 1996 31.5 8.4 39.91997 0.0 0.0 0.0 1997 0.0 0.0 0.0 1997 19.7 7.2 26.91998 0.0 0.0 0.0 1998 4.0 0.0 4.0 1998 4.2 1.0 5.22000 0.0 0.0 0.0 2000 1.2 0.0 1.2 2000 23.0 4.7 27.72001 0.0 0.0 0.0 2001 3.5 0.0 3.5 2001 8.3 1.2 9.42002 0.0 0.0 0.0 2002 0.0 0.0 0.0 2002 0.0 0.0 0.02003 0.0 0.0 0.0 2003 2.2 0.0 2.2 2003 5.5 1.1 6.52004 0.0 0.0 0.0 2004 4.0 0.0 4.0 2004 27.1 29.6 56.72005 0.0 0.0 0.0 2005 6.6 8.9 15.5 2005 45.9 8.9 54.82006 0.0 0.0 0.0 2006 6.6 8.9 15.5 2006 45.9 8.9 54.8
SOURCE: Alaska Department of Fish and Game, Division of Subsistence, Household Surveys 1992-1998;BBNA Household Surveys, 2000-2006 (Numbers based on 2005 harvest estimates).
C - 122
0
2
4
6
8
10
12
14
16
18
Jan Feb Mar Apr May Jun Jul Aug Sep Oct Nov Dec
Seas
onal
ly A
djus
ted
Tota
l Tak
e
Sea Lion Harbor Seal Spotted Seal

Table 62. SEA LION, SPOTTED SEAL, AND HARBOR SEAL HARVEST: Togiak, 2006SAMPLING DESIGN: Active Other TotalTWO-STRATA Total Native Households 66 49 115
Surveyed Households 63 45 108Sampling Fraction 95.5% 91.8% 93.9%
Sample Household Members 295 167 462Estimated Household Members 309.0 181.8 490.9
2000 U.S. Census Estimated Native Population --- --- 750HARVEST AND USE INFORMATION Percentage of Native Households: Estimated Community Harvest
Sea Harbor Seal and and Take (Expanded): Sea Harbor SpottedLion Spotted Seal Lion Seal Seal
Used 0.0% 58.2% Total Number Harvested 0.0 11.5 50.9Hunted 0.0% 25.8% Total Number Struck and Lost 0.0 0.0 7.4
Harvested 0.0% 25.8% Total Number Taken 0.0 11.5 58.3Received 0.0% 32.4%
Gave Away 0.0% 25.8% Number Harvested Per Capita 0.00 0.02 0.07
SEA LION HARVEST BY MONTH UnknownJan Feb Mar Apr May Jun Jul Aug Sep Oct Nov Dec Month Total
REPORTED HARVEST AND TAKE BY SAMPLED HOUSEHOLDS (UNEXPANDED)Harvest 0 0 0 0 0 0 0 0 0 0 0 0 0 0Struck & Lost 0 0 0 0 0 0 0 0 0 0 0 0 0 0Total Take 0 0 0 0 0 0 0 0 0 0 0 0 0 0
ESTIMATED HARVEST AND TAKE BY COMMUNITY (EXPANDED)Harvest 0.0 0.0 0.0 0.0 0.0 0.0 0.0 0.0 0.0 0.0 0.0 0.0 0.0 0.0Struck & Lost 0.0 0.0 0.0 0.0 0.0 0.0 0.0 0.0 0.0 0.0 0.0 0.0 0.0 0.0Total Take 0.0 0.0 0.0 0.0 0.0 0.0 0.0 0.0 0.0 0.0 0.0 0.0 0.0 0.0
ESTIMATED SEASONALLY ADJUSTED HARVEST AND TAKE BY COMMUNITY (EXPANDED)Harvest 0.0 0.0 0.0 0.0 0.0 0.0 0.0 0.0 0.0 0.0 0.0 0.0 0.0Struck & Lost 0.0 0.0 0.0 0.0 0.0 0.0 0.0 0.0 0.0 0.0 0.0 0.0 0.0Total Take 0.0 0.0 0.0 0.0 0.0 0.0 0.0 0.0 0.0 0.0 0.0 0.0 0.0Total Take (%) --- --- --- --- --- --- --- --- --- --- --- --- ---Cum. Take 0.0 0.0 0.0 0.0 0.0 0.0 0.0 0.0 0.0 0.0 0.0 0.0Cum. Take (%) --- --- --- --- --- --- --- --- --- --- --- ---
HARBOR SEAL AND SPOTTED SEAL HARVEST BY MONTHSpotted Seal Harbor Seal Spotted Seal Unknown
Jan Feb Mar Apr May Jun Jul Aug Sep Oct Nov Dec Month Total
REPORTED HARVEST AND TAKE BY SAMPLED HOUSEHOLDS (UNEXPANDED)Harvest 0 1 6 5 14 1 2 1 7 8 11 3 0 59Struck & Lost 0 0 0 0 0 0 0 0 0 4 3 0 0 7Total Take 0 1 6 5 14 1 2 1 7 12 14 3 0 66
ESTIMATED HARVEST AND TAKE BY COMMUNITY (EXPANDED)Harvest 0.0 1.0 6.4 5.3 14.8 1.0 2.1 1.0 7.3 8.6 11.7 3.1 0.0 62.5Struck & Lost 0.0 0.0 0.0 0.0 0.0 0.0 0.0 0.0 0.0 4.2 3.2 0.0 0.0 7.4Total Take 0.0 1.0 6.4 5.3 14.8 1.0 2.1 1.0 7.3 12.8 14.9 3.1 0.0 69.8
ESTIMATED SEASONALLY ADJUSTED HARVEST AND TAKE BY COMMUNITY (EXPANDED)Harvest 0.0 1.0 6.4 5.3 14.8 1.0 2.1 1.0 7.3 8.6 11.7 3.1 62.5Struck & Lost 0.0 0.0 0.0 0.0 0.0 0.0 0.0 0.0 0.0 4.2 3.2 0.0 7.4Total Take 0.0 1.0 6.4 5.3 14.8 1.0 2.1 1.0 7.3 12.8 14.9 3.1 69.8Total Take (%) 0.0% 1.5% 9.2% 7.6% 21.2% 1.5% 3.0% 1.5% 10.5% 18.3% 21.3% 4.5% 100.0%Cum. Take 0.0 1.0 7.5 12.7 27.5 28.6 30.7 31.7 39.1 51.8 66.7 69.8Cum. Take (%) 0.0% 1.5% 10.7% 18.2% 39.4% 40.9% 43.9% 45.4% 55.9% 74.2% 95.5% 100.0% SOURCE: BBNA Household Surveys, 2007.
C - 123

Table 62. (cont.) SEA LION, SPOTTED SEAL, AND HARBOR SEAL HARVEST: Togiak, 2006
HARVEST BY AGE AND SEXSea Lion Harbor Seal Spotted Seal
Reported by Community Est. Reported by Community Est. Reported by Community Est.Sample (Expanded) Sample* (Expanded) Sample* (Expanded)
Number % Number % Number % Number % Number % Number %Adult Male 0 --- 0.0 --- 1 9.1% 1.0 9.1% 1 2.1% 1.0 2.1%
Adult Female 0 --- 0.0 --- 0 0.0% 0.0 0.0% 0 0.0% 0.0 0.0%Adult Unknown Sex 0 --- 0.0 --- 0 0.0% 0.0 0.0% 7 14.6% 7.4 14.5%
Juvenile Male 0 --- 0.0 --- 2 18.2% 2.1 18.2% 7 14.6% 7.4 14.5%Juvenile Female 0 --- 0.0 --- 0 0.0% 0.0 0.0% 8 16.7% 8.5 16.6%
Juvenile Unknown Sex 0 --- 0.0 --- 5 45.5% 5.2 45.5% 14 29.2% 14.8 29.0%Pup Male 0 --- 0.0 --- 1 9.1% 1.0 9.1% 2 4.2% 2.2 4.3%
Pup Female 0 --- 0.0 --- 1 9.1% 1.0 9.1% 1 2.1% 1.1 2.1%Pup Unknown Sex 0 --- 0.0 --- 1 9.1% 1.0 9.1% 6 12.5% 6.5 12.7%
Male Unknown Age 0 --- 0.0 --- 0 0.0% 0.0 0.0% 0 0.0% 0.0 0.0%Female Unknown Age 0 --- 0.0 --- 0 0.0% 0.0 0.0% 0 0.0% 0.0 0.0%Unknown Sex and Age 0 --- 0.0 --- 0 0.0% 0.0 0.0% 2 4.2% 2.2 4.3%
Total 0 --- 0.0 --- 11 100.0% 11.5 100.0% 48 100.0% 50.9 100.0%* Harvest in unknown months is not included in the sample harvest, but is included in the community estimate column.
SEASONALLY ADJUSTED TAKE BY MONTH, SEA LION, HARBOR SEAL, AND SPOTTED SEAL
ESTIMATED COMMUNITY HARVEST, STRUCK AND LOST, AND TAKE BY YEAR
SEA LION HARBOR SEAL SPOTTED SEALStruck/ Total Struck/ Total Struck/ Total
Year Harvest Lost Take Year Harvest Lost Take Year Harvest Lost Take
1992 3.9 0.0 3.9 1992 24.3 2.0 26.3 1992 250.2 53.8 304.01993 3.3 3.3 6.5 1993 24.9 15.8 40.7 1993 174.7 49.1 223.81994 1.2 0.0 1.2 1994 0.0 0.0 0.0 1994 154.2 39.9 194.11995 0.0 0.0 0.0 1995 3.3 0.0 3.3 1995 111.5 4.4 115.91996 0.0 0.0 0.0 1996 3.9 0.0 3.9 1996 101.9 7.8 109.71997 3.6 0.0 3.6 1997 6.7 0.0 6.7 1997 79.2 7.1 86.41998 0.0 0.0 0.0 1998 14.1 1.4 15.5 1998 105.0 15.3 120.42000 0.0 0.0 0.0 2000 5.1 1.1 6.3 2000 147.0 26.7 173.62001 0.0 0.0 0.0 2001 5.3 0.0 5.3 2001 60.8 4.5 65.32002 0.0 0.0 0.0 2002 13.9 3.6 17.4 2002 79.2 18.6 97.92003 0.0 0.0 0.0 2003 22.0 0.0 22.0 2003 32.8 8.9 41.72004 0.0 0.0 0.0 2004 6.9 9.7 16.6 2004 63.8 0.0 63.82005 0.0 0.0 0.0 2005 10.8 0.0 10.8 2005 82.0 10.9 92.92006 0.0 0.0 0.0 2006 11.5 0.0 11.5 2006 50.9 7.4 58.3
SOURCE: Alaska Department of Fish and Game, Division of Subsistence, Household Surveys 1992-1998;BBNA Household Surveys, 2000-2007.
C - 124
0
2
4
6
8
10
12
14
16
Jan Feb Mar Apr May Jun Jul Aug Sep Oct Nov Dec
Seas
onal
ly A
djus
ted
Tota
l Tak
e
Harbor Seal Spotted Seal Sea Lion
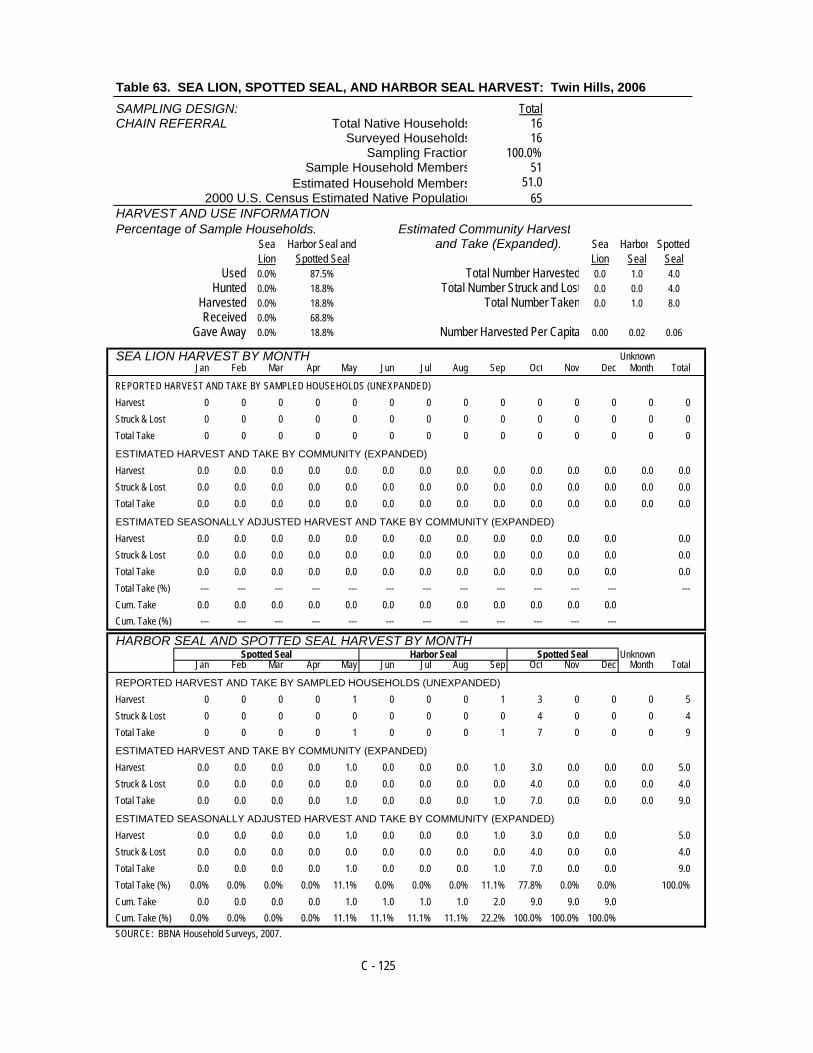
Table 63. SEA LION, SPOTTED SEAL, AND HARBOR SEAL HARVEST: Twin Hills, 2006SAMPLING DESIGN: TotalCHAIN REFERRAL Total Native Households 16
Surveyed Households 16Sampling Fraction
Sample Household Members 51Estimated Household Members 51.0
2000 U.S. Census Estimated Native Population 65HARVEST AND USE INFORMATION Percentage of Sample Households: Estimated Community Harvest
Sea Harbor Seal and and Take (Expanded): Sea Harbor SpottedLion Spotted Seal Lion Seal Seal
Used 0.0% 87.5% Total Number Harvested 0.0 1.0 4.0Hunted 0.0% 18.8% Total Number Struck and Lost 0.0 0.0 4.0
Harvested 0.0% 18.8% Total Number Taken 0.0 1.0 8.0Received 0.0% 68.8%
Gave Away 0.0% 18.8% Number Harvested Per Capita 0.00 0.02 0.06
SEA LION HARVEST BY MONTH UnknownJan Feb Mar Apr May Jun Jul Aug Sep Oct Nov Dec Month Total
REPORTED HARVEST AND TAKE BY SAMPLED HOUSEHOLDS (UNEXPANDED)Harvest 0 0 0 0 0 0 0 0 0 0 0 0 0 0Struck & Lost 0 0 0 0 0 0 0 0 0 0 0 0 0 0Total Take 0 0 0 0 0 0 0 0 0 0 0 0 0 0
ESTIMATED HARVEST AND TAKE BY COMMUNITY (EXPANDED)Harvest 0.0 0.0 0.0 0.0 0.0 0.0 0.0 0.0 0.0 0.0 0.0 0.0 0.0 0.0Struck & Lost 0.0 0.0 0.0 0.0 0.0 0.0 0.0 0.0 0.0 0.0 0.0 0.0 0.0 0.0Total Take 0.0 0.0 0.0 0.0 0.0 0.0 0.0 0.0 0.0 0.0 0.0 0.0 0.0 0.0
ESTIMATED SEASONALLY ADJUSTED HARVEST AND TAKE BY COMMUNITY (EXPANDED)Harvest 0.0 0.0 0.0 0.0 0.0 0.0 0.0 0.0 0.0 0.0 0.0 0.0 0.0Struck & Lost 0.0 0.0 0.0 0.0 0.0 0.0 0.0 0.0 0.0 0.0 0.0 0.0 0.0Total Take 0.0 0.0 0.0 0.0 0.0 0.0 0.0 0.0 0.0 0.0 0.0 0.0 0.0Total Take (%) --- --- --- --- --- --- --- --- --- --- --- --- ---Cum. Take 0.0 0.0 0.0 0.0 0.0 0.0 0.0 0.0 0.0 0.0 0.0 0.0Cum. Take (%) --- --- --- --- --- --- --- --- --- --- --- ---
HARBOR SEAL AND SPOTTED SEAL HARVEST BY MONTHSpotted Seal Harbor Seal Spotted Seal Unknown
Jan Feb Mar Apr May Jun Jul Aug Sep Oct Nov Dec Month Total
REPORTED HARVEST AND TAKE BY SAMPLED HOUSEHOLDS (UNEXPANDED)Harvest 0 0 0 0 1 0 0 0 1 3 0 0 0 5Struck & Lost 0 0 0 0 0 0 0 0 0 4 0 0 0 4Total Take 0 0 0 0 1 0 0 0 1 7 0 0 0 9
ESTIMATED HARVEST AND TAKE BY COMMUNITY (EXPANDED)Harvest 0.0 0.0 0.0 0.0 1.0 0.0 0.0 0.0 1.0 3.0 0.0 0.0 0.0 5.0Struck & Lost 0.0 0.0 0.0 0.0 0.0 0.0 0.0 0.0 0.0 4.0 0.0 0.0 0.0 4.0Total Take 0.0 0.0 0.0 0.0 1.0 0.0 0.0 0.0 1.0 7.0 0.0 0.0 0.0 9.0
ESTIMATED SEASONALLY ADJUSTED HARVEST AND TAKE BY COMMUNITY (EXPANDED)Harvest 0.0 0.0 0.0 0.0 1.0 0.0 0.0 0.0 1.0 3.0 0.0 0.0 5.0Struck & Lost 0.0 0.0 0.0 0.0 0.0 0.0 0.0 0.0 0.0 4.0 0.0 0.0 4.0Total Take 0.0 0.0 0.0 0.0 1.0 0.0 0.0 0.0 1.0 7.0 0.0 0.0 9.0Total Take (%) 0.0% 0.0% 0.0% 0.0% 11.1% 0.0% 0.0% 0.0% 11.1% 77.8% 0.0% 0.0% 100.0%Cum. Take 0.0 0.0 0.0 0.0 1.0 1.0 1.0 1.0 2.0 9.0 9.0 9.0Cum. Take (%) 0.0% 0.0% 0.0% 0.0% 11.1% 11.1% 11.1% 11.1% 22.2% 100.0% 100.0% 100.0% SOURCE: BBNA Household Surveys, 2007.
C - 125
100.0%
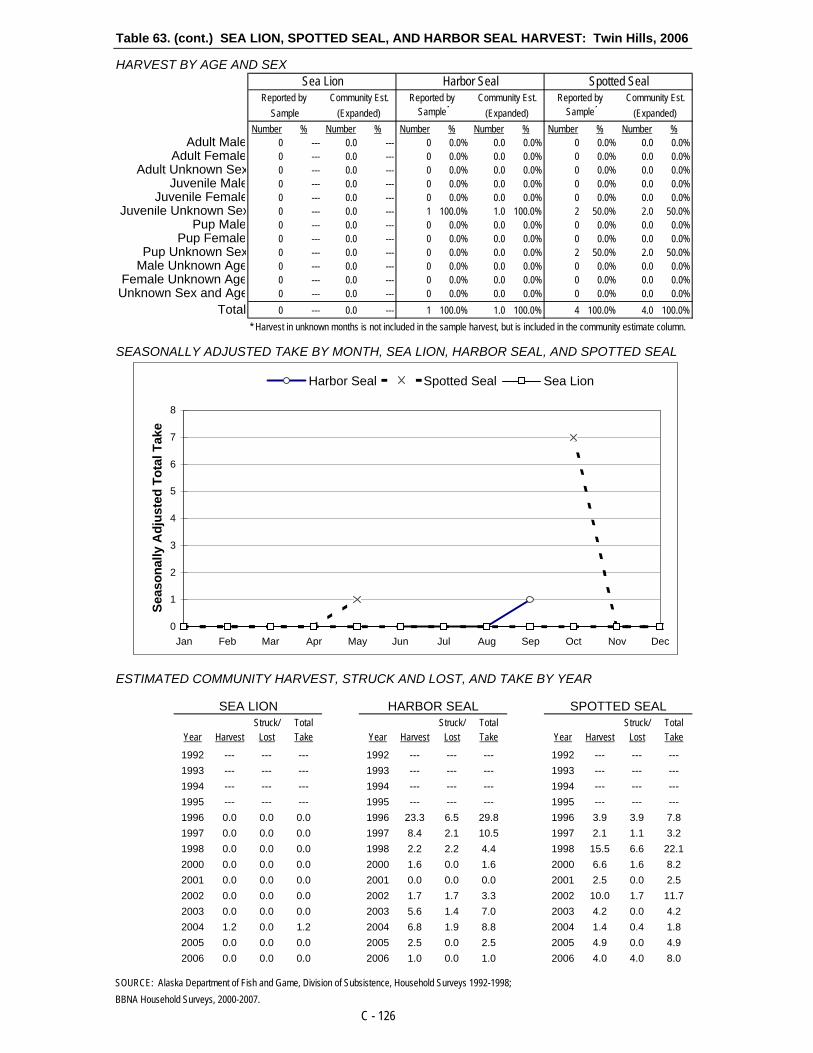
Table 63. (cont.) SEA LION, SPOTTED SEAL, AND HARBOR SEAL HARVEST: Twin Hills, 2006
HARVEST BY AGE AND SEXSea Lion Harbor Seal Spotted Seal
Reported by Community Est. Reported by Community Est. Reported by Community Est.Sample (Expanded) Sample* (Expanded) Sample* (Expanded)
Number % Number % Number % Number % Number % Number %Adult Male 0 --- 0.0 --- 0 0.0% 0.0 0.0% 0 0.0% 0.0 0.0%
Adult Female 0 --- 0.0 --- 0 0.0% 0.0 0.0% 0 0.0% 0.0 0.0%Adult Unknown Sex 0 --- 0.0 --- 0 0.0% 0.0 0.0% 0 0.0% 0.0 0.0%
Juvenile Male 0 --- 0.0 --- 0 0.0% 0.0 0.0% 0 0.0% 0.0 0.0%Juvenile Female 0 --- 0.0 --- 0 0.0% 0.0 0.0% 0 0.0% 0.0 0.0%
Juvenile Unknown Sex 0 --- 0.0 --- 1 100.0% 1.0 100.0% 2 50.0% 2.0 50.0%Pup Male 0 --- 0.0 --- 0 0.0% 0.0 0.0% 0 0.0% 0.0 0.0%
Pup Female 0 --- 0.0 --- 0 0.0% 0.0 0.0% 0 0.0% 0.0 0.0%Pup Unknown Sex 0 --- 0.0 --- 0 0.0% 0.0 0.0% 2 50.0% 2.0 50.0%
Male Unknown Age 0 --- 0.0 --- 0 0.0% 0.0 0.0% 0 0.0% 0.0 0.0%Female Unknown Age 0 --- 0.0 --- 0 0.0% 0.0 0.0% 0 0.0% 0.0 0.0%Unknown Sex and Age 0 --- 0.0 --- 0 0.0% 0.0 0.0% 0 0.0% 0.0 0.0%
Total 0 --- 0.0 --- 1 100.0% 1.0 100.0% 4 100.0% 4.0 100.0%* Harvest in unknown months is not included in the sample harvest, but is included in the community estimate column.
SEASONALLY ADJUSTED TAKE BY MONTH, SEA LION, HARBOR SEAL, AND SPOTTED SEAL
ESTIMATED COMMUNITY HARVEST, STRUCK AND LOST, AND TAKE BY YEAR
SEA LION HARBOR SEAL SPOTTED SEALStruck/ Total Struck/ Total Struck/ Total
Year Harvest Lost Take Year Harvest Lost Take Year Harvest Lost Take
1992 --- --- --- 1992 --- --- --- 1992 --- --- ---1993 --- --- --- 1993 --- --- --- 1993 --- --- ---1994 --- --- --- 1994 --- --- --- 1994 --- --- ---1995 --- --- --- 1995 --- --- --- 1995 --- --- ---1996 0.0 0.0 0.0 1996 23.3 6.5 29.8 1996 3.9 3.9 7.81997 0.0 0.0 0.0 1997 8.4 2.1 10.5 1997 2.1 1.1 3.21998 0.0 0.0 0.0 1998 2.2 2.2 4.4 1998 15.5 6.6 22.12000 0.0 0.0 0.0 2000 1.6 0.0 1.6 2000 6.6 1.6 8.22001 0.0 0.0 0.0 2001 0.0 0.0 0.0 2001 2.5 0.0 2.52002 0.0 0.0 0.0 2002 1.7 1.7 3.3 2002 10.0 1.7 11.72003 0.0 0.0 0.0 2003 5.6 1.4 7.0 2003 4.2 0.0 4.22004 1.2 0.0 1.2 2004 6.8 1.9 8.8 2004 1.4 0.4 1.82005 0.0 0.0 0.0 2005 2.5 0.0 2.5 2005 4.9 0.0 4.92006 0.0 0.0 0.0 2006 1.0 0.0 1.0 2006 4.0 4.0 8.0
SOURCE: Alaska Department of Fish and Game, Division of Subsistence, Household Surveys 1992-1998;BBNA Household Surveys, 2000-2007.
C - 126
0
1
2
3
4
5
6
7
8
Jan Feb Mar Apr May Jun Jul Aug Sep Oct Nov Dec
Seas
onal
ly A
djus
ted
Tota
l Tak
e
Harbor Seal Spotted Seal Sea Lion