the study for update of the hoa lac high-tech park...
TRANSCRIPT

The Study for Update of the Hoa Lac High-Tech Park Master Plan Final Report, Supporting Report, Volume I
6-1
6. SEWERAGE SYSTEM
6.1 Outline of Original Sector Plan
(1) Sewage Collection Area and Basic Collection System
In the original M/P, a common sewerage system which covers both HHTP and VNUH area was planned. The separated collection system was adopted because it is more advantageous in terms of water environment preservation than a combined sewerage system.
(2) Sewage Volume
Sewage volume was projected based on the total water demand as follows.
Table 6.1-1 Projection of Sewage Volume in the Original M/P
Area Volume Remarks Daily Average Sewage (DAS) 68,000 m3/day =Daily Average Water Demand
Daily Maximum Sewage 97,920 m3/day =DAS x (1+ groundwater infiltration ratio, 20%)
Total (Daily Average Sewage) 10,200 m3/hour =DMS x (hourly peak factor, 2.5) x 1/24
Source: JICA Study Team
(3) Outline of Sewerage System
The sewerage system in the original M/P, which was to be shared by HHTP and VNUH, consisted of a sewage collection system, sewage treatment plant, treated water discharge system and water reclamation plant. Main specifications of those sewerage facilities are shown in Table 6.1-2.
Table 6.1-2 Main Specifications for Facilities in the Original M/P
Component System Facilities and Specifications 1. Main Sewage
Collection System Total capacity: Maximum 10,420 m3/hr -Main collection pipes (HCP 200-1800mm x length 18km)
2. Sewage Treatment Plant Total production capacity: 100,000 m3/day (2,000 x 5 trains) -Grit chambers and screens -Oxidation ditches -Sedimentation tanks -Disinfection systems -Sludge dehydration systems -Power substation -Administration and chemical handing room
3. Water Reclamation Plant
Total production capacity: 10,000 m3/day -Rapid sand filters -Reclaimed water reservoir
4. Treated Water Discharge System
Total capacity: 100,000 m3/day -Water quality monitoring equipment -Water discharge pipes and outfall -1,700 m3 x 1 unit
5. Zonal sewage collection System *1
-Collection pipes (HCP: 200-600mm x length 21,160m, VP: 150mm x 5,840m)
-Relay pump station (1 station) *1 Zonal sewage collection system was planned only for phase-1 in the Feasibility Study Source: JICA Study Team

The Study for Update of the Hoa Lac High-Tech Park Master Plan Final Report, Supporting Report, Volume I
6-2
(4) Plan of Sewage Treatment Plant
1) Capacity and Development Plan
A Sewage Treatment Plant was to be developed stepwise in line with the sewage discharge volume in the respective phases as follows.
Table 6.1-3 Sewage Treatment Plant Development Plan in the Original M/P
Phase Items 2005 2010 2020 Daily Maximum Sewage 33,100 m3/day 62,100 m3/day 97,920 m3/day
Water Treatment Capacity 20,000 x 2 trains(Total 40,000)
20,000 x 4 trains (Total 80,000)
20,000 x 5 trains (Total 100,000)
Source: JICA Study Team
Location of the Sewage treatment plant in the original M/P is shown is Figure 6.1-1. Treated water was to be discharged into the Tich River via the tributary running through the HHTP. In order to reduce water consumption in the area, 10 % of the treated water was planned to be reused for irrigation for green keeping and other purposes, after being treated in a water reclamation system.
Source: Master Plan of Hoa Lac High-Tech Park in 1998, JICA Study Team
Figure 6.1-1 Collection System and Location of Sewage Treatment Plant in the Original M/P
2) Water Quality
The sewage treatment plant was planned to treat sewage to meet the Level-B effluent limitations specified by the Vietnamese Standard TCVN 5942-1995, i.e. less than 50 mg/l of BOD and less than 100 mg/l of SS, which is applied when the water is discharged to water bodies being used for navigation and irrigation purposes.
In the event that the sewage contains hazardous or toxic substances with higher concentrations than the specified limitation, tenant enterprises were to be obligated to provide their own pretreatment systems.
Sewage Treatment Plant
Sewage from VNUH

The Study for Update of the Hoa Lac High-Tech Park Master Plan Final Report, Supporting Report, Volume I
6-3
6.2 Present Condition
6.2.1 Current Development Progress
(1) Sewerage system
Sewer pipes have been installed in line with the development of the internal road network and a sewage treatment plant (6,000m3/day) is under construction and will be completed by July 2008. Location of the sewage treatment plant and present development status of the sewer pipes are shown in Figure 6.2-1. Three pump stations are planned and two of them have been partly constructed. Treated effluent from the plant will be discharged into the Tich River.
c ・
Present DevelopmentStatus of Sewerage System
Pump Station (Partly constructed)Pump Station (Planned)Sewage Treatment Plant
Sewer Pipe (D300-500)Pressure Sewer Pipe (D300)
Existing Facilities (11.5ha)Land Grading (31.5ha)
Phase-1 (810ha)Acquired Land (270ha)
Source: JICA Study Team
Figure 6.2-1 Present Sewerage Network
Location of the sewage plant in the original M/P

The Study for Update of the Hoa Lac High-Tech Park Master Plan Final Report, Supporting Report, Volume I
6-4
Source: JICA Study Team
Construction of Water Treatment Plant in HHTP
(2) Difference between the Original M/P and the Present Plan
1) Collection Area and Capacity
The sewerage system which has been developed is aimed at only 200 ha of stage-1. Therefore, capacities of sewer pipe, pump stations and sewage treatment plan are scaled down.
2) Location of Sewage Treatment Plant
Location of the sewage treatment plant has been changed as shown in Figure 6.2-1.
3) Treatment Process and Discharge Water Quality of Sewage Treatment Plant
In the original M/P, the quality of water discharged from the sewage treatment plant was planned to meet the Class-B effluent limitations specified by the Vietnamese Standard TCVN 5942-1995. However, the sewage treatment plant has been designed by HHTP-MB to meet the Class-A limitations, which are more strict than Class-B, because there are some people using the water of Tich River for use in their homes.
Effluent standards for industrial sewage as specified in TCVN 5945-1995 are shown in Table 6.2-1.
(3) Treatment of Sewage in the Existing Facilities in HHTP
The existing facilities such as the Start-UP Center and Internet Gate are equipped with septic tanks. NOBLE, the existing manufacture has constructed its own treatment plant.
6.2.2 Related Project
There are no related projects for the sewerage system near HHTP.

The Study for Update of the Hoa Lac High-Tech Park Master Plan Final Report, Supporting Report, Volume I
6-5
Table 6.2-1 Effluent Standards for Industrial Sewage (TCVN 5945-1995)
Source: Master Plan of Hoa Lac High-Tech Park in 1998, JICA Study Team
6.3 Update of Sector Plan
6.3.1 Sector Development Missions, Strategies and Goals
Missions, strategy and goals for sewerage sector are stated as below.
Table 6.3-1 Missions, Strategies and Goals for Sewerage Sector
Missions To create a sanitary urban environment which enables people in HHTP to work creatively and live healthy lives. To protect the natural environment surrounding HHTP from the impact of various activities in HHTP.
Strategies To plan a collection system with sufficient capacity that can remove sewage efficiently and reliably from the urban area in order to maintain a sanitary living and working environment. To plan a strong and durable water treatment system that can ensure proper discharge water quality in order to conserve the environment. To plan a simple system that can facilitate the operation and minimize the maintenance work in order to secure the reliability of the entire sewerage system.
Goals To complete the development of sewerage system of the HHTP by 2012 (for Phase-1) and by 2020 (for Phase-2).
Applied in the original MP
Applied in the sewage treatment plant design

The Study for Update of the Hoa Lac High-Tech Park Master Plan Final Report, Supporting Report, Volume I
6-6
As indicated in Section 6.2, there are no sewerage projects near HHTP. Therefore, a new sewerage system for HHTP should be developed by HHTP.
The strategies to achieve the development goals in this M/P are as follows.
6.3.2 Planning Framework
(1) Sewage Collection Area
In the Original M/P, the sewerage system including sewage collection system and sewage treatment plant was planned to be used for both HHTP and VNUH from the view point of economical infrastructural development. However, since the original M/P, HHTP and VNUH have developed their infrastructure independently. Therefore, in this M/P, the sewage collection area is confined to HHTP area.
(2) Sewage Volume
1) Daily Maximum Sewage
Daily maximum sewage volume is estimated as shown in Table 6.3-2, which is based on the water demand. Sewerage generation factor, which is defined as 90 %, is determined by the assumption that 10 % of the consumed water will be used for watering and cleaning including public purposes, etc. and will not be discharged into the sewerage system. Daily maximum peak factor (1.3 for phase-1 and 1.2 for phase-2) is consistent with those for water consumption in each phase.
2) Hourly Maximum Sewage
Hourly maximum sewage volume is an important figure to be used for design of the collection system including sewer pipes and pump stations. Hourly maximum sewage volume by functional zone in each phase is shown in Table 6.3-3. The hourly maximum factor is consistent with that of water consumption in each phase.

The Study for Update of the Hoa Lac High-Tech Park Master Plan Final Report, Supporting Report, Volume I
6-7
Table 6.3-2 Sewage Volume in HHTP
Source: JICA Study Team
Table 6.3-3 Hourly Maximum Sewage
[Phase-1]
[Phase-2]
Source: JICA Study Team
(3) Discharge Water Quality
The latest standards for effluent of industrial sewage, TCVN 5945-2005 are shown in Table 6.3-4. In the original M/P, Level-B of the former standard TCVN 5945-1995 was
Average WaterDemand
MaximumSewage Factor Sewage Volume Average Water
DemandMaximum
Sewage Factor Sewage Volume
(m3/day) (%) (m3/day) (m3/day) (%) (m3/day)1. Software Park 140 1.10 150 290 1.08 3102. Research and development (R&D Zone) 1,540 1.10 1,690 2,860 1.08 3,0903. High-tech Industrial Zone 6,300 1.10 6,930 15,300 1.08 16,5204. Education and Training Zone 440 1.10 480 6,040 1.08 6,5205. Center of Hgh-Tech City 640 1.10 700 2,530 1.08 2,7306. Mixed Use Zone 1,910 1.10 2,100 3,600 1.08 3,8907. High Class Residential (R&D Zone, Amenity Zone) 0 1.10 0 450 1.08 4908. Residential Zone 570 1.10 630 2,700 1.08 2,9209. Housing Complex 0 1.10 0 1,440 1.08 1,560
10. Reserved Area 0 1.10 0 8,100 1.08 8,75011. Golf Course (Amenity Zone) 10 1.10 10 10 1.08 1012. Amusement Zone 790 1.10 870 1,500 1.08 1,620
12,300 - 13,600 44,800 - 48,400*1 A = B x C
A: Maximum Sewage Factor B: Sewage Generation Factor ( = 0.90) C: Daily Maximum Peak Factor (Phase-1: 1.3, Phase-2: 1.2)
Daily Maximum Waste Water Quantity (m3/day)
No. Land Use
Phase-2 (2020)Phase-1 (2012)
Net Area Gross Area *1 Daily MaximumSewage
Hourly MaximumSewage
Unit HourlyMaximum Sewage
Unit HourlyMaximum Sewage
(ha) (ha) (m3/day) (m3/hour) (m3/ha/day) (l/ha/s)1. Software Park 45 54 150 8.3 2.778 0.0422. Research and development (R&D Zone) 70 83 1,690 93.0 20.361 0.3113. High-tech Industrial Zone 140 167 6,930 381.2 41.497 0.6344. Education and Training Zone 55 65 480 26.4 7.385 0.1135. Center of Hgh-Tech City 40 48 700 38.5 14.583 0.2236. Mixed Use Zone 75 89 2,100 115.5 23.596 0.3607. High Class Residential (R&D Zone, Amenity Zone) 0 0 0 0.0 #DIV/0! #DIV/0!8. Residential Zone 15 18 630 34.7 35.000 0.5359. Housing Complex 0 0 0 0.0 0.000 0.000
10. Reserved Area 0 0 0 0.0 0.000 0.00011. Golf Course (Amenity Zone) 100 119 10 0.6 0.084 0.00112. Amusement Zone 20 24 870 47.9 36.250 0.554
*1 Gross Area: Area Includes Infrastructure area =Net Area/0.84
No. Land Use
Phase-1 (2012)
Net Area Gross Area *1 Daily MaximumSewage
Hourly MaximumSewage
Unit HourlyMaximum Sewage
Unit HourlyMaximum Sewage
(ha) (ha) (m3/day) (m3/hour) (m3/ha/day) (l/ha/s)1. Software Park 75 89 310 16.3 3.48 0.0512. Research and development (R&D Zone) 130 155 3,090 162.2 19.94 0.2913. High-tech Industrial Zone 340 405 16,520 867.3 40.79 0.5954. Education and Training Zone 95 113 6,520 342.3 57.70 0.8415. Center of Hgh-Tech City 50 60 2,730 143.3 45.50 0.6646. Mixed Use Zone 100 119 3,890 204.2 32.69 0.4777. High Class Residential (R&D Zone, Amenity Zone) 25 30 490 25.7 16.33 0.2388. Residential Zone 50 60 2,920 153.3 48.67 0.7109. Housing Complex 20 24 1,560 81.9 65.00 0.948
10. Reserved Area 180 214 8,750 459.4 40.89 0.59611. Golf Course (Amenity Zone) 100 119 10 0.5 0.08 0.00112. Amusement Zone 60 71 1,620 85.1 22.82 0.333
*1 Gross Area: Area Includes Infrastructure area =Net Area/0.84
No. Land Use
Phase-2 (20120)

The Study for Update of the Hoa Lac High-Tech Park Master Plan Final Report, Supporting Report, Volume I
6-8
applied. However, in this M/P Class-A of TCVN 5945-2005 is applied, due to the fact that the water of Tich River where the treated water will be discharged is used for living purposes.
Table 6.3-4 Effluent Standards for Industrial Sewage (TCVN 5945-2005)
Limitation Parameter Unit A B C
1 Temperature °C 40 40 45 2 pH - 6 - 9 5.5 - 9 5 – 9 3 Odor - 4 Color - 20 50 - 5 BOD5 mg/l 30 50 100 6 COD mg/l 50 80 400 7 Suspended solids mg/l 50 100 200 8 Arsenic mg/l 0.05 0.1 0.5 9 Mercury mg/l 0.005 0.01 0.5 10 Lead mg/l 0.1 0.5 1.0 11 Cadmium mg/l 0.005 0.01 0.5 12 Chromium (VI) mg/l 0.05 0.1 0.5 13 Chromium (III) mg/l 0.2 1 2 14 Copper mg/l 2 2 5 15 Zinc mg/l 3 3 5 16 Nickel mg/l 0.2 0.5 2 17 Manganese mg/l 0.5 1 5 18 Iron mg/l 1 5 10 19 Tin mg/l 0.2 1 5 20 Cyanide mg/l 0.07 0.10 0.20 21 Phenol mg/l 0.1 0.5 1
22 Mineral oil and grease mg/l 5 5 10
23 Animal-vegetable fat and oil mg/l 10 20 30
24 Residual chlorine mg/l 1 2 - 25 PCBs mg/l 0.003 0.01 -
26 Organic phosphorous mg/l 0.3 1 -
27 Organic Chloride mg/l 0.1 0.1 - 28 Sulfide mg/l 0.2 0.5 1 29 Fluoride mg/l 5 10 15 30 Chlorine mg/l 500 600 1000 31 Ammonia (as N) mg/l 5 10 15 32 Total nitrogen mg/l 15 30 60 33 Total phosphorous mg/l 4 6 8 34 Coliform MPN/100m 3000 5000 -
35 Bioassay - 90 % fish can stay alive in water for 96 hours
36 Gross α activity Bq/l 0.1 0.1 - 37 Gross β activity Bq/l 1.0 1.0 -
Source: TCVN 5945-2005
(4) Quality of Water to Be Treated in the Sewage Treatment Plant
It is not economical for HHTP to provide high-grade treatment processes to remove specific substances that could be introduced into the sewage by each enterprise within the park. Therefore, if a tenant enterprise generates sewage that contains hazardous or toxic substances at higher concentrations than the regulated limitations as Class-A and

The Study for Update of the Hoa Lac High-Tech Park Master Plan Final Report, Supporting Report, Volume I
6-9
BOD5 or SS (Suspended Solids) at higher than 300 mg/l respectively, they are to be obligated to construct their own pretreatment plant. Water quality examinations should be implemented at the discharge point of each enterprise in the High-Tech Industrial Zone and Research and Development Zone periodically.
6.3.3 Sector Development Plan
(1) Sewerage System and Collection Network
The plan of the sewerage system in HHTP is shown in Figure 6.3-1. Sewage treatment plant No. 1 (STP1) is under construction and sewage treatment plant No. 2 (STP2) is to be newly constructed.
STP1 treats the sewage from the area on the north side of the Lang – Hoa Lac Highway and STP2 is to treat that from the area on the south side of the Lang – Hoa Lac Highway, which is the Reserved Area. STP2 is planned so that the sewer pipe does not cross the 140m width of the Lang-Hoa Lac Highway in order to facilitate the construction and maintenance works.
(2) Plan of Collection System
1) Outline of Collection System
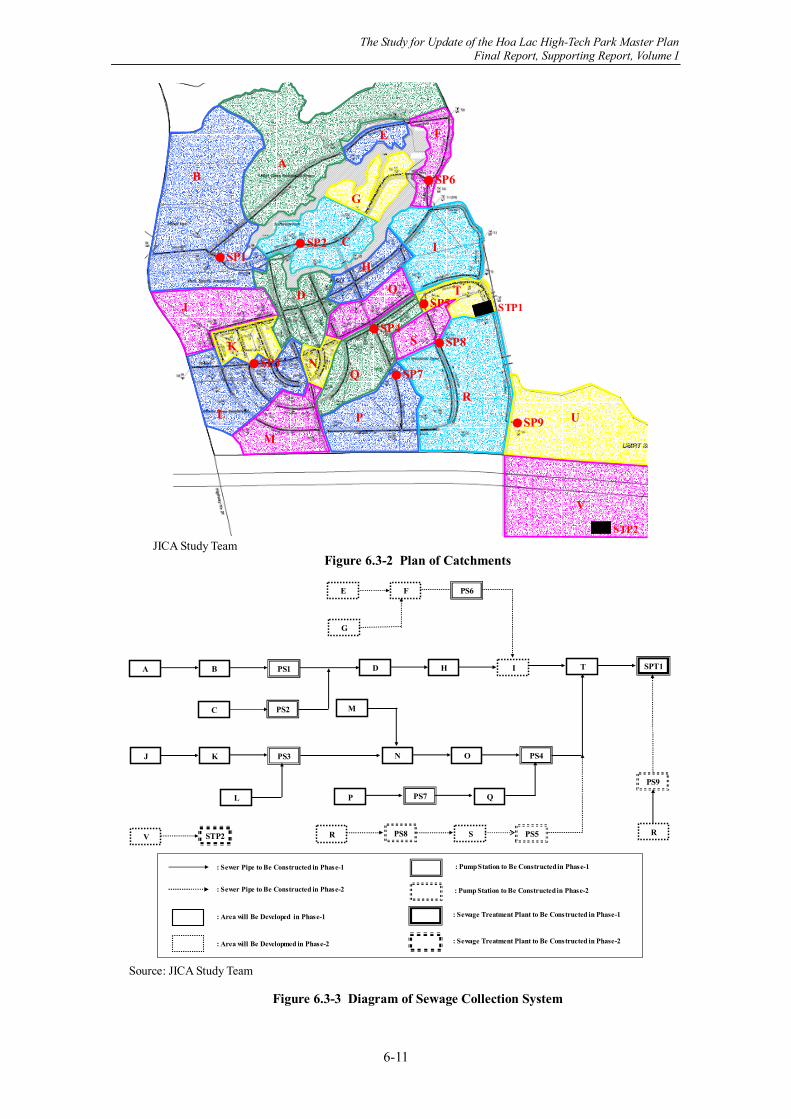
The plan of the collection system is shown in Figure 6.3-2. A diagram of the collection system is shown in Figure 6.3-3.
2) Pipeline at the river/lake-crossing point
The pipeline at the river/lake-crossing point will be put on bridges. However, at the point of the existing bridges, aqueduct bridges should be considered because the existing bridges may not be able to endure the load of the pipes and water.

The Study for Update of the Hoa Lac High-Tech Park Master Plan Final Report, Supporting Report, Volume I
6-10
c ・
The Study for Update of Hoa Lac High-tech Park Master Plan
Japan International Cooperation Agency (JICA)
Sewerage System Plan
High-Tech Industrial Zone
Source: JICA Study Team
Figure 6.3-1 Plan of Sewerage System
The Study for Update of the Hoa Lac High-Tech Park Master Plan Final Report, Supporting Report, Volume I
6-11
JICA Study Team
Figure 6.3-2 Plan of Catchments
Source: JICA Study Team
Figure 6.3-3 Diagram of Sewage Collection System
AB
C
D
E F
G
I
J
K
L
M
N
H
O
P
Q
R
S
T
U
V
●SP1●SP2
●SP9
●SP8
●SP7
●SP4
●SP6
●SP3
●SP5 STP1
STP2
A
C PS2
D SPT1
E
PS4
G
J K
B
Q
F
H
O
PS1
M
N
: Sewer Pipe to Be Constructed in Phase-1
: Sewer Pipe to Be Constructed in Phase-2
: Pump Station to Be Constructed in Phase-1
: Pump Station to Be Constructed in Phase-2
: Sewage Treatment Plant to Be Constructed in Phase-1
: Sewage Treatment Plant to Be Constructed in Phase-2
: Area will Be Developed in Phase-1
: Area will Be Developmed in Phase-2
V STP2
PS9
R
TI
PS6
PS3
L P PS7
SR PS8 PS5

The Study for Update of the Hoa Lac High-Tech Park Master Plan Final Report, Supporting Report, Volume I
6-12
3) Capacity of Pump Stations
Capacities of pump stations are shown in Table 6.3-5. They are determined based on the hourly maximum sewage volume of their catchments. Capacity of each pump is planned in consideration of loads from phase-2.
Table 6.3-5 Capacities of Pump Stations
No. Phase-1(2012) Phase-2(2020) Quantity in phase-2PS1 80 l/s (80 l/s x 6.5 mH x 2 units) 240 l/s (80 l/s x 6.5 mH x 4 units) 202.01 l/sPS2 20 l/s (20 l/s x 7.0 mH x 2units) 20 l/s (20 l/s x 7.0 mH x 2units) 15.93 l/sPS3 80 l/s (80 l/s x 5.0 mH x 2units) 160 l/s (80 l/s x5.0 mH x 3 units) 150.00 l/sPS4 160 l/s (80 l/s x 7.0 mH x 3 units) 320 l/s (80 l/s x 7.0 mH x 5 units) 300.28 l/sPS5 - 130 l/s (65 l/s x 7.5 mH x 3 units) 125.23 l/sPS6 160 l/s (80 l/s x 4.5 mH x 3 units) 320 l/s (80 l/s x 4.5 mH x 5 units) 294.82 l/sPS7 65 l/s (65 l/s x 4.5 mH x 2units) 130 l/s (65 l/s x 4.5 mH x 3 units) 127.31 l/sPS8 - 100 l/s (50 l/s x 5.5 mH x 3 units) 91.17 l/sPS9 - 65 l/s (65 l/s x 7.0 mH x 2 units) 55.05 l/s
* All pump stations have 1 stand-by pump. * Specification of pump stations for phase-2 is in total and includes that for phase-1. Source: JICA Study Team
(3) Plan of Sewage Treatment Plants
1) Capacity of Sewage Treatment Plants
The required capacities of the sewage treatment plants are shown in Table 6.3-6.
Table 6.3-6 Capacities of Sewage Treatment Plants
(m3/day) No. Items Phase-1 (2012) Phase-2 (2020)
Quantity 13,600 39,600
Capacity 3,000 x 2 trains 8,500 x 1 trains Total: 14,500
3,000 x 2 trains 8,500 x 4 trains Total: 40,000
STP1*1
Development Plan 8,500 x 1 train 8,500 x 3 trains Quantity 0 8,800
Capacity - 4,500 x 2 trains Total: 9,000 STP2*2
Development Plan - 4,500 x 2 trains Quantity 13,600 48,400 Total Capacity 14,000 49,000
*1: “3,000 x 2 trains” is under construction *2: STP2 is to treat sewage from Reserved Area
Source: JICA Study Team
2) Location of Sewage Treatment Plants
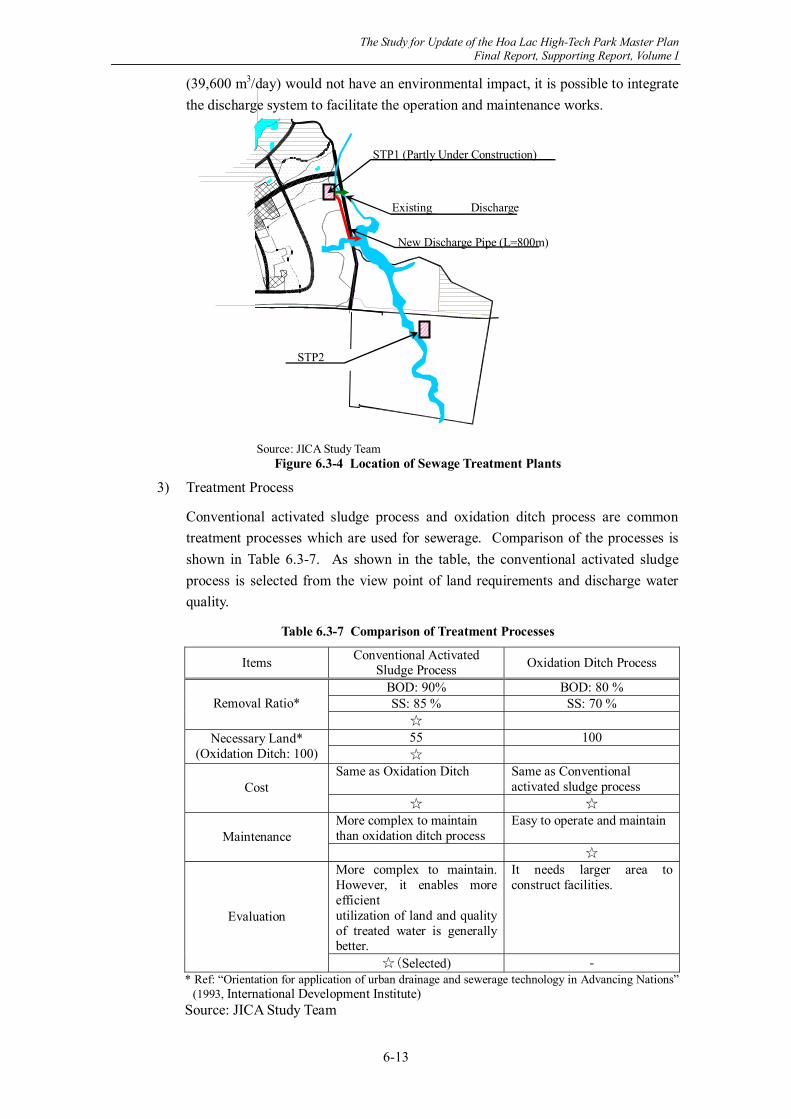
From the viewpoints of economic advantage and hydraulic condition it is desirable that the sewage treatment plants be located along a river where treated water will be discharged. The location of STP1 is suitable and STP2 is proposed to be constructed near the river as shown in Figure 6.3-4.
However, there is concern that a large amount of discharge at one point may have some environmental impact on the Tich River because it is not very wide at the site of STP1. Therefore, a discharge pipe or culvert should be installed as indicated in Figure 6.3-4.
If the environmental impact is evaluated and it is proved that the total of discharge
The Study for Update of the Hoa Lac High-Tech Park Master Plan Final Report, Supporting Report, Volume I
6-13
(39,600 m3/day) would not have an environmental impact, it is possible to integrate the discharge system to facilitate the operation and maintenance works.
Source: JICA Study Team
Figure 6.3-4 Location of Sewage Treatment Plants
3) Treatment Process
Conventional activated sludge process and oxidation ditch process are common treatment processes which are used for sewerage. Comparison of the processes is shown in Table 6.3-7. As shown in the table, the conventional activated sludge process is selected from the view point of land requirements and discharge water quality.
Table 6.3-7 Comparison of Treatment Processes
Items Conventional Activated Sludge Process Oxidation Ditch Process
BOD: 90% BOD: 80 % SS: 85 % SS: 70 % Removal Ratio*
☆ 55 100 Necessary Land*
(Oxidation Ditch: 100) ☆ Same as Oxidation Ditch Same as Conventional
activated sludge process Cost ☆ ☆
More complex to maintain than oxidation ditch process
Easy to operate and maintain Maintenance
☆ More complex to maintain. However, it enables more efficient utilization of land and quality of treated water is generally better.
It needs larger area to construct facilities.
Evaluation
☆(Selected) - * Ref: “Orientation for application of urban drainage and sewerage technology in Advancing Nations”
(1993, International Development Institute) Source: JICA Study Team
Park
STP1 (Partly Under Construction)
STP2
New Discharge Pipe (L=800m)
Existing Discharge

The Study for Update of the Hoa Lac High-Tech Park Master Plan Final Report, Supporting Report, Volume I
6-14
4) Area of Land for Sewage Treatment Plant
Area of land for sewage treatment plants are as follows.
Table 6.3-8 Area of Land for Sewage Treatment Plants
Plant No. Capacity Area STP1* 40,000 m3/day 6.0 ha STP2 9,000 m3/day 1.5 ha Total 49,000 m3/day 7.5 ha
*Land for Existing plant (6,000 m3/day) is 0.9 ha. Source: JICA Study Team
6.3.4 Development Issues
The existing collection system has been developed for only 200 ha of stage-1, which means that it does not have enough capacity for the whole area of HHTP. Even if some pipes have sufficient capacity, the depth will not meet the new plan in this MP and the position of the pipe is not consistent with the new road plan. Therefore, it will be unavoidable to remove the existing sewer pipe. And it is also necessary to study the method for switching the existing system to new system during the construction for phase-1.
The Study for Update of the Hoa Lac High-Tech Park Master Plan Final Report, Supporting Report, Volume I
6-15
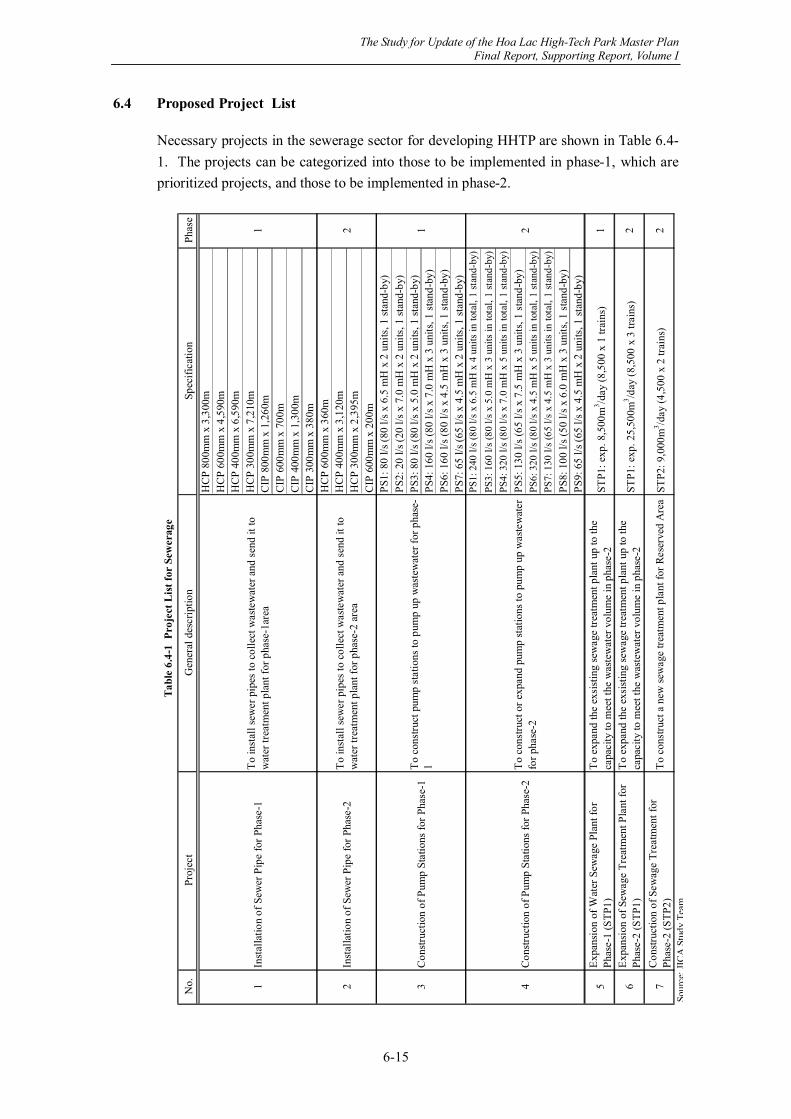
6.4 Proposed Project List
Necessary projects in the sewerage sector for developing HHTP are shown in Table 6.4-1. The projects can be categorized into those to be implemented in phase-1, which are prioritized projects, and those to be implemented in phase-2.
No.
Proj
ect
Gen
eral
des
crip
tion
Spec
ifica
tion
Phas
eH
CP
800m
m x
3,3
00m
HC
P 60
0mm
x 4
,590
mH
CP
400m
m x
6,5
90m
HC
P 30
0mm
x 7
,210
mC
IP 8
00m
m x
1,2
60m
CIP
600
mm
x 7
00m
CIP
400
mm
x 1
,300
mC
IP 3
00m
m x
380
mH
CP
600m
m x
360
mH
CP
400m
m x
3,1
20m
HC
P 30
0mm
x 2
,395
mC
IP 6
00m
m x
200
mPS
1: 8
0 l/s
(80
l/s x
6.5
mH
x 2
uni
ts, 1
stan
d-by
)PS
2: 2
0 l/s
(20
l/s x
7.0
mH
x 2
uni
ts, 1
stan
d-by
)PS
3: 8
0 l/s
(80
l/s x
5.0
mH
x 2
uni
ts, 1
stan
d-by
)PS
4: 1
60 l/
s (80
l/s x
7.0
mH
x 3
uni
ts, 1
stan
d-by
)PS
6: 1
60 l/
s (80
l/s x
4.5
mH
x 3
uni
ts, 1
stan
d-by
)PS
7: 6
5 l/s
(65
l/s x
4.5
mH
x 2
uni
ts, 1
stan
d-by
)PS
1: 2
40 l/
s (80
l/s x
6.5
mH
x 4
uni
ts in
tota
l, 1
stan
d-by
)PS
3: 1
60 l/
s (80
l/s x
5.0
mH
x 3
uni
ts in
tota
l, 1
stan
d-by
)PS
4: 3
20 l/
s (80
l/s x
7.0
mH
x 5
uni
ts in
tota
l, 1
stan
d-by
)PS
5: 1
30 l/
s (65
l/s x
7.5
mH
x 3
uni
ts, 1
stan
d-by
)PS
6: 3
20 l/
s (80
l/s x
4.5
mH
x 5
uni
ts in
tota
l, 1
stan
d-by
)PS
7: 1
30 l/
s (65
l/s x
4.5
mH
x 3
uni
ts in
tota
l, 1
stan
d-by
)PS
8: 1
00 l/
s (50
l/s x
6.0
mH
x 3
uni
ts, 1
stan
d-by
)PS
9: 6
5 l/s
(65
l/s x
4.5
mH
x 2
uni
ts, 1
stan
d-by
)
5Ex
pans
ion
of W
ater
Sew
age
Plan
t for
Phas
e-1
(STP
1)To
exp
and
the
exsi
stin
g se
wag
e tre
atm
ent p
lant
up
to th
eca
paci
ty to
mee
t the
was
tew
ater
vol
ume
in p
hase
-2ST
P1: e
xp. 8
,500
m3 /d
ay (8
,500
x 1
trai
ns)
1
7C
onstr
uctio
n of
Sew
age
Trea
tmen
t for
Phas
e-2
(STP
2)To
con
stru
ct a
new
sew
age
treat
men
t pla
nt fo
r Res
erve
d A
rea
STP2
: 9,0
00m
3 /day
(4,5
00 x
2 tr
ains
)2
Sour
ce:J
ICA
Stud
yTe
am
26
Expa
nsio
n of
Sew
age
Trea
tmen
t Pla
nt fo
rPh
ase-
2 (S
TP1)
To e
xpan
d th
e ex
sist
ing
sew
age
treat
men
t pla
nt u
p to
the
capa
city
to m
eet t
he w
aste
wat
er v
olum
e in
pha
se-2
STP1
: exp
. 25,
500m
3 /day
(8,5
00 x
3 tr
ains
)
4C
onstr
uctio
n of
Pum
p St
atio
ns fo
r Pha
se-2
To c
onst
ruct
or e
xpan
d pu
mp
stat
ions
to p
ump
up w
aste
wat
erfo
r pha
se-2
3
Tabl
e 6.
4-1
Pro
ject
Lis
t for
Sew
erag
e
To in
stal
l sew
er p
ipes
to c
olle
ct w
aste
wat
er a
nd se
nd it
tow
ater
trea
tmen
t pla
nt fo
r pha
se-1
area
11
2In
stal
latio
n of
Sew
er P
ipe
for P
hase
-2To
inst
all s
ewer
pip
es to
col
lect
was
tew
ater
and
send
it to
wat
er tr
eatm
ent p
lant
for p
hase
-2 a
rea
2 2
Inst
alla
tion
of S
ewer
Pip
e fo
r Pha
se-1
Con
struc
tion
of P
ump
Stat
ions
for P
hase
-1To
con
stru
ct p
ump
stat
ions
to p
ump
up w
aste
wat
er fo
r pha
se-
11

The Study for Update of the Hoa Lac High-Tech Park Master Plan Final Report, Supporting Report, Volume I
6-16
6.5 Technical Study for Phase-1 Development
6.5.1 Projects to Be Implemented in Phase-1
Projects to be implemented in phase-1 are shown in Table 6.5-1 and Figure 6.3-1. The projects are to construct a sewage treatment plant and sewage collection system including sewer pipes and pump stations for the phase-1 area.
Table 6.5-1 Projects to Be Implemented in Phase-1
Project Specification Remarks HCP 800 mm x 3,300 m HCP 600 mm x 4,590 m HCP 400 mm x 6,590 m HCP 300 mm x 7,210 m CIP 800 mm x 1,260 m CIP 600 mm x 700 m CIP 400 mm x 1,300 m
Installation of Pipeline
CIP 300 mm x 380 m Construction of Sewage Treatment Plant
STP1: 8,500 m3/day new construction (14,500 m3/day including existing 6,000 m3/day)
High-Tech Industrial Zone
PS1: 80 l/s, 80 l/s x 6.5mH x 2 sets 1 stand-by Software Park
PS2: 20 l/s, 20 l/s x 7.0mH x 2 sets 1 stand-by Software Park
PS3: 80 l/s, 80 l/s x 5.0mH x 2 sets 1 stand-by Mixed Use Zone
PS4: 160 l/s, 80 l/s x 7.0mH x 3 sets 1 stand-by High-Tech Industrial Zone
PS6: 160 l/s, 80 l/s x 4.5mH x 3 sets 1 stand-by
Research and Development Zone
Construction of Pump Stations
PS7: 65 l/s, 65 l/s x 4.5mH x 2 sets 1 stand-by High-Tech Industrial Zone
Source: JICA Study Team
6.5.2 Specifications for Sewage Treatment Plant
Specifications for Sewage Treatment plant for phase-1 are as follows.
Table 6.5-2 Outline of the Sewage Treatment Plant for Phase-1
Items Outline Cover Area 810 ha (Whole Area of HHTP phase-1)
Flow Quantity 13,600 m3/day
Capacity 3,000 x 2 trains (Existing)
8,500 x 1 train (to be Expanded) Total: 14,500 m3/day
Area 6.0 ha (Includes 0.9 ha of existing plant)
Treatment Process Conventional Activated Sludge Process Discharge Facility □800 x 800, 1.0 ‰, L = 800m (Q=48,400m3/day)
Source: JICA Study Team

The Study for Update of the Hoa Lac High-Tech Park Master Plan Final Report, Supporting Report, Volume I
6-17
6.5.3 Specifications for Pump Stations
Specifications for pump stations are shown in Table 6.5-1.
6.5.4 Study on Sewer Pipe
(1) Material of Sewer Pipes
Gravity flow sewer pipes (underground pipes and aerial pipes at bridges) and pressure flow sewer pipes will be installed in HHTP. Materials for these types of pipes should be selected in accordance with the use condition as described below.
1) Gravity Flow Pipe (Underground Pipe)
Hume pipe (HCP) and Polyvinyl chloride pipe (PVC) are commonly used for gravity flow pipes. In HHTP, HCP is recommended from the viewpoint of its durability.
2) Gravity Flow pipe (Aerial Pipe at the Bridges)
HCP is not suitable for the pipe on the bridge due to its heavy weight and PVC is not also applicable because it deteriorates if exposed to direct sunlight and also can be broken by accidental impact. Moreover, steel pipe (SP) tends to corrode if used for gravity flow sewage pipe. Therefore, Cast-iron pipe (CIP) is recommended for the gravity flow pipe at the bridges.
3) Pressure Flow Pipe
CIP and SP are commonly used for pressure flow pipes. In HHTP, CIP is recommended from the viewpoint of cost and dependability because there is no need for welding work.
Table 6.5-3 Materials of Sewer Pipes in HHTP
Type of Pipe Material Underground Pipe Hume Pipe (HCP) Gravity Flow
Aerial Pipe (on Bridge) Cast-Iron Pipe (CIP) Pressure Flow Underground and aerial pipe Cast-Iron Pipe (CIP)
Source: JICA Study Team
(2) Method to Cross the Rivers/Lakes
There are some places that the sewer pipes cross a river or lake. The collection system was considered so that the depth of the pipes may be less than or equal to 1.5 m in order to make it possible to put the pipes on the bridge. The method to cross the rivers/lakes is described and shown below.
1) Case-1 (Depth of the sewer pipe is less than or equal to 1.5 m)
If the depth of the sewer pipe is less than or equal to 1.5 m, the pipes can be installed as gravity flow pipe as shown in Figure 6.5-1.
2) Case-2 (Depth of the sewer pipe is over 1.5 m)
If the depth of the sewer pipe is greater than 1.5 m, the sewage should pumped up in a lift station and the pipes installed as pressure flow pipe as shown in Figure 6.5-

The Study for Update of the Hoa Lac High-Tech Park Master Plan Final Report, Supporting Report, Volume I
6-18
1.
[Case-1] Depth of the sewer pipe ≤ 1.5 m
[Case-2] Depth of the sewer pipe > 1.5 m
Source: JICA Study Team
Figure 6.5-1 Methods to Cross the Rivers and Lakes
6.5.5 Hydraulic Analysis of the Sewerage Collection System
(1) Target Area for Calculation
Hydraulic analysis has been conducted to determine the diameter, gradient and depth of the sewer pipes. Sewer pipes to be installed in phase-1 are to be designed so that they will also be utilized in phase-2, because it is not realistic to install new pipeline for the phase-2 area beside the phase-1 sewer pipes or to demolish the phase-1 sewer pipes and replace them with a new sewage collection system.
Therefore, in this study, the target area for calculation is the whole HHTP area except for the East part of the High-Tech Industrial Zone and the Housing Complex, and Reserved Area, for which sewage treatment plants will be constructed in each area to serve those areas exclusively.
(2) Analysis Condition
1) Basic Formula for Analysis
Basic formula for analysis of water supply network is Manning’s Formula as shown follows.
+8.5m (10years H.W.L)
Pressure Flow
P
Pump Up
Difficult to put on the bridge
Gravity Flow
+8.5m (10years H.W.L)
Depth ≤ 1.5 m
Depth > 1.5 m
G.L: +11m - +18m
G.L: +11m - +18m

The Study for Update of the Hoa Lac High-Tech Park Master Plan Final Report, Supporting Report, Volume I
6-19
2) Design Criteria (TVCN51-1984) a) Velocity of flow
Velocity flow should follow the values below in principle.
Minimum : 0.7 m/s
Maximum : 4.0 m/s b) Minimum Slope
Minimum slope of the sewer pipe is defined as 1/D (D: diameter) as summarized below;
Table 6.5-4 Minimum Slope of Sewer Pipe
Diameter (mm) Minimum Slope (‰) 300 3.33 400 2.50 500 2.00 600 1.67 700 1.43 800 1.25
Minimum Slope = 1/D (D: Diameter of sewer pipe) ( TVCN51-1984) Source: JICA Study Team
c) Safety Ratio (Water Depth in Sewer Pipe)
Water depth in the sewer pipes should follow the table below as a safety margin.
Table 6.5-5 Maximum Water Depth
Diameter (mm) Fullness (h/H) 200 – 300 0.60 350 – 450 0.70 500 – 900 0.75
> 900 0.80 h: Water Depth, H: Inside dimension of pipe Source: JICA Study Team
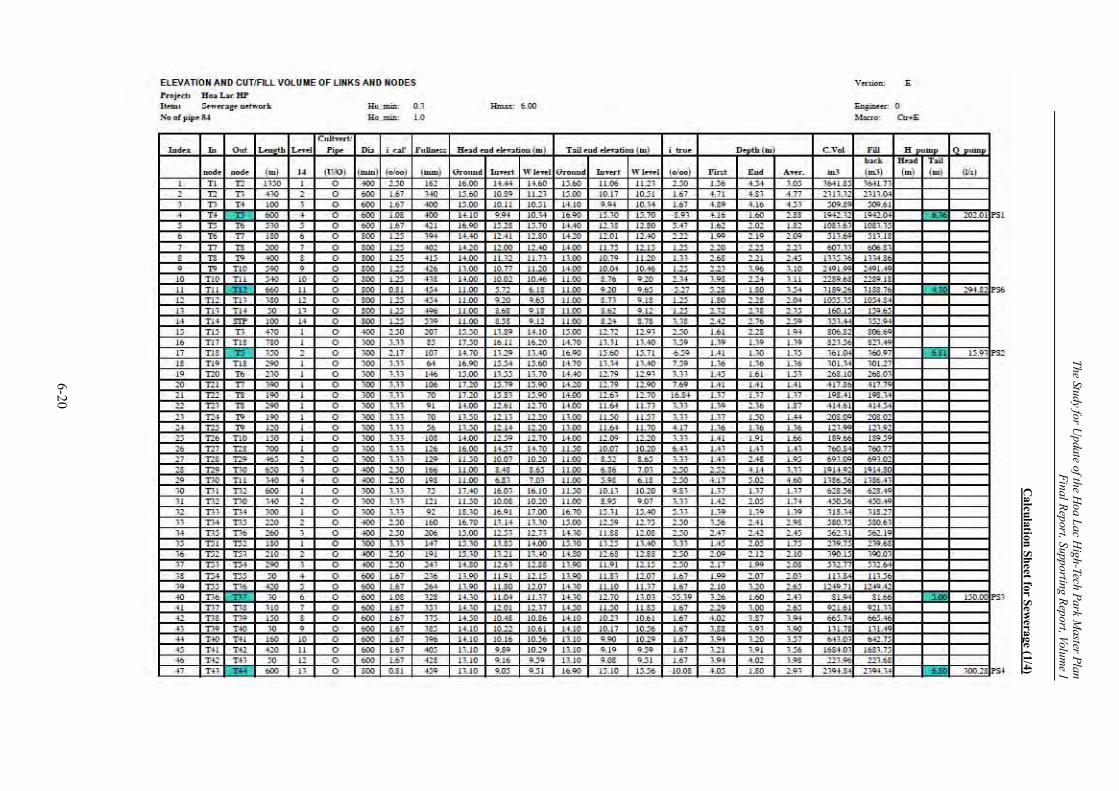
(3) Result of the Hydraulic Analysis
Result of the hydraulic analysis is as follows.
The Study for Update of the H
oa Lac High-Tech Park M
aster Plan Final Report, Supporting Report, Volum
e I
6-20
Calculation Sheet for Sew
erage (1/4)

The Study for Update of the H
oa Lac High-Tech Park M
aster Plan Final Report, Supporting Report, Volum
e I
6-21
Calculation Sheet for Sew
erage (2/4)

The Study for Update of the Hoa Lac High-Tech Park Master Plan Final Report, Supporting Report, Volume I
6-22
Calculation Sheet for Sewerage (3/4)

The Study for Update of the Hoa Lac High-Tech Park Master Plan Final Report, Supporting Report, Volume I
6-23
Calculation Sheet for Sewerage (4/4)

The Study for Update of the Hoa Lac High-Tech Park Master Plan Final Report, Supporting Report, Volume I
6-24
6.5.6 Project Cost
The direct project construction cost is estimated based on the following conditions and assumptions; however, these are subject to change in a later stage based on the further study/design result and market price.
The construction cost of the works is estimated based on the following conditions.
(1) The quantities of the works are roughly estimated based on the preliminary design.
(2) The unit prices of the work are estimated based on the prices in the similar project and converted into 2007 current price.
(3) Exchange rate: 1 USD = 120 JPY = 16,000 VND.
(4) Value Added Tax (VAT) and Import Tax are excluded.

The Study for Update of the H
oa Lac High-Tech Park M
aster Plan Final Report, Supporting Report, Volum
e I
6-25
Quantity Cost(USD) Quantity Cost
(USD) Quantity Cost(USD)
HCP 800mm m 145 3,300 478,500 0 3,300 478,500 Includes Maintenace HallHCP 500mm - 600mm m 85 4,590 390,150 360 30,600 4,950 420,750 Includes Maintenace HallHCP 300mm - 400mm m 50 13,800 690,000 5,515 275,750 19,315 965,750 Includes Maintenace HallCIP 800mm m 1,210 1,260 1,524,600 0 1,260 1,524,600CIP 600mm m 610 700 427,000 200 122,000 900 549,000 Pressure Flow PipeCIP 300mm - 400mm m 310 1,680 520,800 0 1,680 520,800 Pressure Flow PipeAccessorie(valve, meter, etc) lot 121,000 1 121,000 0 1 121,000
Total 4,152,050 428,350 4,580,400PS01: 240 l/s (P=80 l/s x2) set 290,000 1 290,000 0 1 290,000 pump for SP01 (P=80 ls x2) 194,000 0 1 194,000 1 194,000PS02: 20 l/s (P=20 ls x2) set 60,500 1 60,500 0 1 60,500PS03: 160 l/s (P=80 l/s x2) set 225,000 1 225,000 0 1 225,000 pump for SP01 (P=80 ls x1) 97,000 0 1 97,000 1 97,000PS04: 320 l/s (P=80 l/s x3) set 451,000 1 451,000 0 1 451,000 pump for SP01 (P=80 ls x2) 194,000 0 1 194,000 1 194,000PS05: 130 l/s (P=65 l/s x3) set 242,000 0 1 242,000 1 242,000PS06: 320 l/s (P=80 l/s x3) set 451,000 1 451,000 0 1 451,000 pump for SP01 (P=80 ls x2) 194,000 0 1 194,000 1 194,000PS07: 130 l/s (P=65 l/s x2) set 169,000 1 169,000 0 1 169,000 pump for SP01 (P=80 ls x1) 73,000 0 1 73,000 1 73,000PS08: 100 l/s (P=50 l/s x3) set 242,000 0 1 242,000 1 242,000PS09: 65 l/s (P=65 l/s x2) set 121,000 0 1 121,000 1 121,000
Total 1,646,500 1,357,000 3,003,500STP1 exp. 8,500m3/day set 4,840,000 1 4,840,000 0 1 4,840,000STP1 exp. 25,500m3/day set 14,520,000 0 1 14,520,000 1 14,520,000STP2 9,000m3/day set 5,445,000 0 1 5,445,000 1 5,445,000
Total 4,840,000 19,965,000 24,805,000HCP 300mm - 500mm m 12 4,000 48,400 0 4,000 48,400CIP 300mm - 500mm m 12 500 6,050 0 500 6,050
Total 54,450 0 54,450- 10,693,000 21,750,350 32,443,350
Source: JICA Study Team
Table 6.5-6 Project Cost for SeweragePhase-1 Phase-2 TOTAL
RemarksNo. Project Specification unit Unit Cost(USD)
GRAND TOTAL
3 Construction of Water TreatmentPlant
4 Demolition of Existing SewerPipes
1 Installation of Sewer Pipes
2 Construction of Pump Stations

The Study for Update of the Hoa Lac High-Tech Park Master Plan Final Report, Supporting Report, Volume I
7-1
7. COST ESTIMATE
The total project cost for the infrastructure development is estimated based on direct construction cost of the works estimated in the previous Sections 2 to 6 as follows;
Table 7.1-1 Total Project Cost
(Unit: 1,000 US$) Description Phase-I Phase-II Total
1. Direct Cost Internal Road 42,000 7,571 49,571 Landfill 68,348 119,268 187,616 Drainage works 14,306 5,451 19,757 Water supply works 9,858 4,106 13,964 Power supply works 40,639 49,382 90,021 Sewerage works 10,693 21,750 32,443
Sub-total 185,844 207,528 393,372 Consulting Services 18,584 20,753 39,337 Project Direct Cost 204,428 228,281 432,709
2. Indirect Cost Price Escalation (Foreign Portion) 2,396 9,555 11,951 Price Escalation (Local Portion) 23,263 101,614 124,877 Physical Contingency 10,221 11,414 21,635 Import Duties 1,933 2,283 4,216 Value Added Tax 24,302 35,315 59,617 Administration Expenses 1,933 2,283 4,216 Land Acquisition Cost 17,209 25,495 42,704
3. Total Project Cost 286,577 416,239 702,816 Source: JICA Study Team
The following conditions and assumptions are applied in the above estimate.
1) Price Escalation for Foreign Component (FC): 1.7 % of total direct cost of FC 2) Price Escalation for Local Component (LC): 4.0 % of total direct cost of LC 3) Share of Foreign/Local Component: 20-80 4) Physical Contingency: 5.0 % of total direct cost 5) Import Duties: 5.0 % on products to be imported 6) Value Added Tax:10.0 % of total direct cost 7) Administration Expenses:1.0 % of total direct cost

The Study for Update of the Hoa Lac High-Tech Park Master Plan Final Report, Supporting Report, Volume I
8-1
8. IMPLEMENTATION SCHEDULE
After the updating study of Master Plan and its approval, the engineering work including feasibility study, basic design and detailed design will be carried out from 2008 to 2010 for Phase 1. Subsequently, construction work will be commenced in 2010 and completed in 2012. For Phase 2 development, the construction work will be carried out from 2018 to 2020 after the design work completed in 2017.
The Implementation schedule of the HHTP development is shown in the table below;
Table 8.1-1 Implementation Schedule
1. Updated Master Plan
2. Phase-1 Development (810 ha incl. Stage-1)Feasibility studyFund arrangementBasic Design/Detailed DesignProcurement of contractorConstruction of common infrastructureDevelopment of functional zones includingland preparationConstruction of tenant facilities
3. Phase-2 Development (800ha)Feasibility studyFund arrangementBasic Design/Detailed DesignProcurement of contractorConstruction of common infrastructureDevelopment of functional zones includingland preparationConstruction of tenant facilities
2007 2008 2009 2010 2023 20242011 2012 2019 2020 2021 2022Description 2014 20152013 2016 2017 2018
Source: JICA Study Team

The Study for Update of the Hoa Lac High-Tech Park Master Plan Final Report, Supporting Report, Volume I
9-1
9. FINANCIAL ANALYSIS
9.1 Presumption of Financial Analysis
(1) Source of Investment
The source of investment for the development of the Project is planned to be a mixture of public and private financial sources of both foreign and local. The public entity organized for the development and operation of HHTP that is Hoa Lac High-tech Park – Management Board (hereinafter referred to as the HHTP-MB) is planned to furnish all necessary common infrastructures such as internal road, drainage, water supply system, sewerage system and power distribution system. While, the infrastructure inside the functional zones except for research and development zone will be developed by the private development company (hereinafter referred to as the HHTP-DC) selected by and contracted with the HHTP-MB.
As for land preparation (or land leveling work), HHTP-MB will at least responsible for Research and Development Zone, and land preparation for other zones will be carried out by HHTP-DC in principle. However, some land preparation work other than Research and Development Zone could be carried out by HHTP-MB in parallel with construction of common infrastructures in order to ensure to maintain the implementation schedule set out in Chapter 8. In this financial analysis, all the land preparation cost is included in the project cost as shown in Table 9.1-3.
The upper structures of the Project are composed of buildings and facilities for research and development, education and training, residence of various type as well as facilities for amenity functions, and factories for manufacturing of high-tech products in the industrial estate, etc.. These buildings and facilities are planned to be financed out from partly public and partly private financial sources. The construction cost of such buildings and facilities is not included in this financial analysis since those are out of scope of this study.
(2) Phased Development Schedule
The Project is planned to be developed in two phases in the period of 2008 to 2012 as the phase-1 of the Project and 2016-2020 as the Phase-2 of the Project, respectively. Table 9.1-1 shows the area of each functional area composing the Project by phase and by type of financial source for the development of upper structures on top of respective land area prepared by the HHTP-MB.

The Study for Update of the Hoa Lac High-Tech Park Master Plan Final Report, Supporting Report, Volume I
9-2
Table 9.1-1 Development Schedule of Area by Phase
(Unit: hectare) Area Phase-1 Phase-2 Total Financial Source
1 High-tech Industrial Area 140 200 340 Private 2 Software Park 45 30 75 Private 4 Residential Zone 15 35 50 Private 5 Housing Complex 0 20 20 Private 6 Education and Training Zone 55 40 95 Private 7 Reserved Area 0 180 180 Private 8 Amenity Zone 100 10 110 Private 9 Research and Development Zone 70 75 145 Public 10 Center of High-tech City 40 10 50 Private/ Public 11 Mixed Use Zone 75 25 100 Private 12 Amusement Zone 20 40 60 Private/ Public 13 Lake and Buffer Zone 140 0 140 Public 14 Common Area for Infrastructure 110 135 245 Public Total 810 800 1,610
Source: JICA Study Team
(3) Financial Scheme of the Project
It is assumed that the development of all necessary common infrastructure is financed mostly by institutional financial source either in the form of long-term soft loan through ODA or other sources and partly by the national budget. All the estate or land prepared by the HHTP-MB except for the land prepared for the public use such as the area prepared for research and development function is planned to be leased out to the HHTP-DC selected by HHTP-MB. In such a case, HHTP-MB will act as a head lesser who leases the land to the HHTP-DC in lot but not piece by piece of land. The HHTP-DC act as a lessee and develop the upper structure by himself or sub-lease the land for further development of upper structures on the leased land by the HHTP-MB to the private HHTP-DC. The revenue being generated through the leasing of the land by the HHTP-MB is considered as a major source of repayment to the loan arranged for the development of those needed infrastructure.
(4) Project Costs for Financial Analysis
The presumption of conditions for the estimation of various cost items other than project direct cost area as tabulated in Table 9.1-2. The development cost of the Project based on those conditions is estimated at around US$ 552 million and its breakdown is as shown in Table 9.1-3.
As for the financial analysis at this stage of the study, the price escalation is not needed to be considered. Because if the construction cost is assumed to increase the land lease price should also be assumed to increase at the same rate of increase of construction cost. In the case, if the escalation of construction cost is assumed and included the total estimated project cost will reach to US$ 700 million which is 1.28 times higher than the estimated project cost in total covering Phase-1 and Phase-2. It is to be noted that there is 3 to 5 years of interval between the completion of Phase-1 and starting of works for

The Study for Update of the Hoa Lac High-Tech Park Master Plan Final Report, Supporting Report, Volume I
9-3
the construction of Phase-2.
Table 9.1-2 Conditions Applied for Project Cost Estimation
Factor Conditions Share of Foreign/Local Component: 20-80 Physical Contingency: 5.0 % of total direct cost Import Duties: 5.0 % on products to be imported Value Added Tax: 10.0 % of total direct cost Administration Expenses: 1.0 % of total direct cost
Table 9.1-3 Project Cost for Financial Analysis
(Unit: ‘000 US$) Description Phase-I Phase-II Total
1. Direct Cost (2008~12) (2016~20) Internal Road 42,000 7,571 49,571 Landfill 68,348 119,268 187,616 Drainage works 14,306 5,451 19,757 Water supply works 9,858 4,106 13,964 Power supply works 40,639 49,382 90,021 Sewerage works 10,693 21,750 32,443
Sub-total 185,844 207,528 393,372 Consulting Services 18,584 20,753 39,337 Project Direct Cost 204,428 228,281 432,709
2. Indirect Cost Physical Contingency 10,221 11,414 21,635 Import Duties 1,933 2,283 4,216 Value Added Tax 21,669 24,198 45,867 Administration Expenses 1,933 2,283 4,216 Land Acquisition Cost 17,209 25,495 42,704
3. Total Project Cost 257,617 293,953 551,570 Source: JICA Study Team
(5) Maintenance Cost
The Management Board develops and furnishes all necessary common infrastructures and undertakes the maintenance of those infrastructures furnished to as well as manage the infrastructure. The cost incurred annually for such management, operation and maintenance is assumed at 0.50% of the total initial capital investment amount or in an order of US$ 1.90 million annually during the project life for Phase-1 and 0.80% of the total initial capital investment amount or in an order of US$ 1.70 million annually for Phase-2 of the Project, respectively. Thus, the total maintenance cost in Phase-2 is estimated at US$ 2.60 million.
(6) Management Cost for the Operation of the Entire Area
The management of the Project will be undertaken by the HHTP-MB as an executing agency of the Project. The estimated cost for the management of the HHTP after the completion of the construction works is estimated at around US$ 0.33 million per year

The Study for Update of the Hoa Lac High-Tech Park Master Plan Final Report, Supporting Report, Volume I
9-4
through the life of the Project. It is assumed that the management and administration of the HHTP will be carried out by around 50 personnel of various ranks each assigned and specialized for different kind of business activities.
9.2 Assumed Conditions Applied for Financial Analysis
The conditions applied for the financial analysis to examine the financial viability of the Project are assumed as follows:
(1) Investment plan and period
The investment plan period is defined as the total time period between the start of the cost stream and the end of the cost and benefit stream. The cost stream is defined to start with the final engineering design of the Project. The investment plan period for a project normally extends over a period of 25 – 40 years. In the evaluation of the Project, forty (40) years from the year of commissioning of the Project in total is considered applicable taking into account the scale and type of the project as well as the period of amortization of the long-term loan. During the investment plan period, the cost and benefits are recorded annually over the whole period separately for each benefit and cost components.
(2) Currency
The currency used in the economic evaluation is US Dollar. The exchange rate of Vietnam Dong to the United States Dollar is VND 16,000 and the same of Japanese Yen is ¥120 as of August 2007.
(3) Sale Schedule of Estate
It is assumed that the construction of Phase-1 is completed by 2012 and by the end of 2013 all leasable land is scheduled to be sold out. Likewise, the leasable land prepared as Phase-2 of the Project will be sold out completely by the end of 2021 just subsequent year from the completion of the construction works in 2020.
(4) Rate of Land Lease and Management Charge
The land developed as an industrial estate for high-tech industries that are furnished with a high grade infrastructure meeting with the requirement of high-tech industries plan to build their factories in Vietnam has been leased out to the overseas enterprise for maximum 50 years. In most cases, the land is leased to those tenants in a lamp sum amount calculated based on the offered lease charge per hectare for the remaining years of the maximum year of license given by the government to the industrial estate developer.
The industrial developer or operator further charge to the enterprise those who locate their factory in the industrial estate a charges for covering the cost of maintenance and management of the industrial estate on monthly basis.
The average land lease (rent) charge per hectare and the management charge per hectare

The Study for Update of the Hoa Lac High-Tech Park Master Plan Final Report, Supporting Report, Volume I
9-5
per year offered by major industrial estates in Vietnam those have been in operation and attracting a various high-tech industries from abroad is analyzed at US$ 58 /m2 and US$ 0.080 /m2/month or US$ 9,600/hectare/year.
The abovementioned average land lease charge is the offer price to the tenant. Therefore, the wholesale price to the industrial estate developer should be lower than this price level at say around 20%. The average land lease charge for development of industrial estate is, therefore, assumed at US$45/m2. The wholesale price of land lease by type of use is assumed as shown in Table 9.2-1. Thereby, the average land lease charge for the Phase-1 of the Project is computed at US$60/m2.
Table 9.2-1 Assumed Land Lease Charge by Type of Use (Phase-1)
Land Use Area Unit Price
(US$/m2)Total Amount (US$ Million)
1 High-tech Industrial Area 140 45 63.0 2 Software Park 45 60 33.0 4 Residential Zone 15 100 15.0 5 Housing Complex 0 60 12.0 6 Education and Training Zone 55 40 24.0 7 Reserved Area 0 45 0 8 Amenity Zone 100 100 100.0 9 Research and Development Zone 70 40 16.0 10 Center of High-tech City 40 45 18.0 11 Mixed Use Zone 75 60 45.0 12 Amusement Zone 20 40 0 13 Lake and Buffer Zone 140 0 0 14 Common Area for Infrastructure 110 0 0 Total Land Area 810 326.0 Total Salable Area 560 326.0 Average Land Lease Charge (US$/m2) 60.0
Source: JICA Study Team
As for the financial analysis of the Project, the land lease charge by type of area is assumed at US$ 60/m2 and the management charge of the infrastructures developed is assumed at US$ 0.080/m2/month or US$ 9,600/hectare/year, respectively. It is to be noted that the assumed land lease charge per square meter for the high-tech industrial area, which is US$ 45/m2 equals to the prevailing rate quoted to the developer for high-tech industrial estate in Vietnam. And the management charge assumed is equal to the average management charges of the existing industrial estate in Vietnam.
9.3 Result of Financial Analysis
(1) Computation of Internal Rate of Return
Based on the projected revenue and cost streams, the Financial Internal Rate of Return (FIRR) was computed applying various assumptions for calculation as mentioned in the foregoing paragraph. Table 9.4 shows the result of the financial analysis expressed by

The Study for Update of the Hoa Lac High-Tech Park Master Plan Final Report, Supporting Report, Volume I
9-6
FIRR. <See Annex 9.1 and 9.2 for details>
Table 9.3-1 Result of FIRR Computation
Phase-1 Phase-1 + Phase-2FIRR 10.1 % 5.2 %
Source: JICA Study Team
(2) Sensitivity Analysis
The sensitivity analysis of the financial viability of the Project is carried out applying increase and decrease of 10% for respective factors. The result of sensitivity analysis on FIRR is as shown in Table 9.3-2.
Table 9.3-2 Result of Sensitivity Analysis
Case-1 Case-2 Case-3 Case-4 Case-5 Investment Cost + 10% + 10% Revenue (Sale of Estate) - 10% Revenue (Service Charge) - 10% O&M Cost + 10% + 10% Phase-1 7.2 % 7.2% 9.6 % 10.1 % 9.6% Phase-1 + 2 3.9 % 3.2% 4.4 % 5.2 % 2.7 %
Source: JICA Study Team
(3) Marketing Scheme The total area of land completed with the common infrastructure ready for sale is planned to be sold by HHTP-MB to the HHTP-DC in one lot and in subsequent year of completion of the construction works. The HHTP-DC acquired the land area form HHTP-MB will sub-lease the land to the tenant or develop the upper structure for sale on their account and risk. (4) Assessment of Capability for Repayment of Loans
The minimum amount of land lease charge in the US Dollar per square meter for maximum 45 years is assessed which makes the borrower of the loan (HHTP-MB) capable to repay the loans based on the following assumptions:
a. Initial capital investment amount: US$ 258 million (Phase-I only) b. Loan period: 30 years (annual equal installment) c. Grace period: 10 years d. Interest rate: 5.0% p.a. e. Management Charge: US$ 9,600/ha/year (US$ 0.08/m2/Month)
Table 9.3-3 shows the minimum land lease charge per square meter by the rate of equity share in the initial capital investment and by the interest rate applied to the loan.

The Study for Update of the Hoa Lac High-Tech Park Master Plan Final Report, Supporting Report, Volume I
9-7
As appeared in this table, the larger the equity share (self-finance amount) increase, the smaller the minimum amount. The strategy of marketing the land for lease including its pricing is to be studied carefully taking into consideration of loan conditions in terms of financial source, interest rate, currency, amortization period, grace period, etc.
Table 9.3-3 Minimum Land Lease Charge
Unit Case-A Case-B Case-C Share of Equity % 40% 50% 60% Share of Loan % 60% 50% 40% Amount of Equity US$ Million 103 129 155Amount of Loan US$ Million 155 129 103Minimum Amount US$/m2 67 52 37
Source: JICA Study Team
The repayment capability for the loan by the Project is examined as above. When the minimum land lease charge is US$60/m2, the equity share should be around 45% with an interest rate at 5% as in the Case-B.
(5) Cut-off Rate
The Project can be considered as financially feasible if the Financial Internal Rate of Return (FIRR) of the Project can be computed at more than the interest rate of loan assumed to be applied. The standard cut-off rate often referred to for the development project n the developing countries, of which loan is arranged by the international financial source, is LIBOR. The latest LIBOR is around 8.5% in the case the loan is based on US Dollar, but the international financial institutions such as Asian Development Bank offer somewhat lower rate than LIBOR based on the mixture of currency. In such case, the lending rate down to 5.0%.
The cut-off rate applied for the evaluation of the Project’s financial viability is assumed at 5.0% as minimum when an institutional financial assistance program is considered for financing of the project and 8.5% when commercial loan is considered for financing of the Project.
9.4 Result of Computation of Financial Viability Indicators
Result of Computation of Financial Viability Indicator: The Project is deemed as viable in view of financial viability as the FIRR of Phase-1 is computed at 10.1% and Phase-1 and 2 combined is computed at 5.2%, both of which are more than the predetermined cut-off rate that is set at 5.0%. Therefore, the Project is considered as feasible subject to that the assumed condition of leasing out of the land and collection of management charges are realized as planned hereto. In other words, if the rate of leasing

The Study for Update of the Hoa Lac High-Tech Park Master Plan Final Report, Supporting Report, Volume I
9-8
of land and management charges assumed hereto is not accepted by the developer as the minimum rate, then the financial feasibility of the Project could be lost.
However, if the loan is based on commercial conditions the Project is not financially viable because when the Phase-1 and Phase-2 is combined the FIRR is computed as less than the cut-off rate of 8.5%, which is predetermined considering the loan is based on commercial lending.
Marketability of the Leasable Land: Although the financial viability indicators suggest that the Project is financially viable, the basic assumption of such viability is in question. The most important question is whether the average rate of lease planned at US$ 60/m2 which is the minimum rate assuring the financial viability, is acceptable to the developer who would undertake the completion of the leased land to the final shape meeting with the requirement of tenants or lessees. As in the case of the sale of industrial estate for high-tech industries, HHTP-MB has approved and has been offering the land lease at about US$ 20/m2 to the prominent lessees for high-tech industries at present. However, due to a current situation of insufficient infrastructure not many potential investors have been attracted to enter the HHTP even at this quite low level of offered price for leasing of the land. The efforts of marketing of HHTP at the assumed level of land lease rate and management charge to the developer should be made as discussed in the report hereof..
Measures to Make the Project’s Financial Viability More Robust: The financial analysis of the Project is carried out aiming to find out the minimum rate of land lease rate and management charges to make the Project financially feasible. Table 9.4-1 shows those rate and conditions to be realized.
Table 9.4-1 Recommended Minimum Rate of Land Lease and Management Charge
Article Minimum Rate Note Land lease for Industrial Zone
US$ 45/m2 This rate of land lease is the rate for developer. The developer would add some more on top of this rate to cover their expenses to lease the land to their tenant in complete form. The prevailing rates offered to the tenants in Vietnam ranges from US$ 30 to US$ 80 depend on the grade and location of industrial estate.
Management Charge
US$ 9,600/hectare/Year or US$0.08/m2/Month
The prevailing management charge which is aimed at to cover the expenses of maintenance cost of relevant infrastructures of industrial estates in Vietnam at present, ranges from US$ 7,000 to US$ 9,600/hectare/Year depend on the grade and location of industrial estate.
If these rates are not acceptable by the developers or by the tenants searching or selecting the industrial estate for their business operation, then, these charges are to be reduced somewhat. In such a case, the Government of Vietnam is to cover the difference of two rates as the minimum rates to be secured for the maintenance of the financial viability of the Project and the acceptable rates of prominent developer or tenants those

The Study for Update of the Hoa Lac High-Tech Park Master Plan Final Report, Supporting Report, Volume I
9-9
demand the lower rates.
There are three measures which the government could support the Project financially as follows:
1) Subsidy for the land lease
The government will provide some subsidy for the land lease by the HHTP-MB to the developer. As a matter of fact the land lease rate offered by HHTP at present is about US$ 20/m2, which is quite low. Due to the current conditions of HHTP even this rate does not attract the potential tenants substantially. It is expected that the new rate will be accepted by the tenants if the needed infrastructure inside and outside of the Project, however, the necessity of such subsidy should be considered. In the financial analysis, the rate of land lease charge is assumed at US$45/m2, which equals the average land lease charge in Vietnam for the high-tech industrial estate.
2) Subsidy for the management charge
The government will provide some subsidy for the management charge or provide budget for the maintenance of the infrastructure.
3) Purchase of land for research and development activities
The area for research and development are planned to be leased out to the government agencies. However, if this land allotted for such purpose is leased out or sold to these government agencies without any charge, it will be very attractive to those institute..
Table 9.4-2 suggests the necessary amount of budget to cover such expenditure of the government in related to the Project.
Table 9.4-2 Amount of Government Expenditure
Article Rate of Subsidy Amount Note Land lease (Industrial Zone)
US$ 25/m2
(=US$ 45/m2-20/m2) US$ 35 million For industrial estate zone and
Phase-1 only (140 ha x US$ 25/m2= US$35 million)
Land lease (R&D Zone)
US$ 40/m2
US$ 16 million For R&D zone and Phase-1 only
(40 ha x US$ 40/m2= US$16 million)
As the Project is planned to be fully operative at the level which is quite competitive against other industrial estate operating or under construction in other area in and around Hanoi or in Ha Tay province at present, the assumed rate of land lease and management charge could be attractive to the developer and the tenant in the future. Therefore, such subsidy or financial support by the government may not be required to make the project’s financial performance better or viable throughout the project life. However, the study on supporting the needed finance of the Project by the government of Vietnam is to be thoroughly conducted.

The Study for Update of the Hoa Lac High-Tech Park Master Plan Final Report, Supporting Report, Volume I
9-10
Annex 9.1
Financial Viability Indicator Computation
Phase-I FIRR 10.1%
Phase-I Year Investment O&M TotalExpend. Estate Sold Management
Charge Total Revenue Cash-flow
2008 21.58 21.58 -21.582009 8.74 8.74 -8.742010 129.05 129.05 -129.052011 68.43 68.43 -68.432012 29.82 29.82 -29.82
1 2013 2.26 2.26 312.70 4.42 317.12 314.862 2014 2.26 2.26 0.00 4.42 4.42 2.163 2015 2.26 2.26 0.00 4.42 4.42 2.164 2016 2.26 2.26 0.00 4.42 4.42 2.165 2017 2.26 2.26 0.00 4.42 4.42 2.166 2018 2.26 2.26 0.00 4.42 4.42 2.167 2019 2.26 2.26 0.00 4.42 4.42 2.168 2020 2.26 2.26 0.00 4.42 4.42 2.169 2021 2.26 2.26 0.00 4.42 4.42 2.16
10 2022 2.26 2.26 0.00 4.42 4.42 2.1611 2023 2.26 2.26 0.00 4.42 4.42 2.1612 2024 2.26 2.26 0.00 4.42 4.42 2.1613 2025 2.26 2.26 0.00 4.42 4.42 2.1614 2026 2.26 2.26 0.00 4.42 4.42 2.1615 2027 2.26 2.26 0.00 4.42 4.42 2.1616 2028 2.26 2.26 0.00 4.42 4.42 2.1617 2029 2.26 2.26 0.00 4.42 4.42 2.1618 2030 2.26 2.26 0.00 4.42 4.42 2.1619 2031 2.26 2.26 0.00 4.42 4.42 2.1620 2032 2.26 2.26 0.00 4.42 4.42 2.1621 2033 2.26 2.26 0.00 4.42 4.42 2.1622 2034 2.26 2.26 0.00 4.42 4.42 2.1623 2035 2.26 2.26 0.00 4.42 4.42 2.1624 2036 2.26 2.26 0.00 4.42 4.42 2.1625 2037 2.26 2.26 0.00 4.42 4.42 2.1626 2038 2.26 2.26 0.00 4.42 4.42 2.1627 2039 2.26 2.26 0.00 4.42 4.42 2.1628 2040 2.26 2.26 0.00 4.42 4.42 2.1629 2041 2.26 2.26 0.00 4.42 4.42 2.1630 2042 2.26 2.26 0.00 4.42 4.42 2.1631 2043 2.26 2.26 0.00 4.42 4.42 2.1632 2044 2.26 2.26 0.00 4.42 4.42 2.1633 2045 2.26 2.26 0.00 4.42 4.42 2.1634 2046 2.26 2.26 0.00 4.42 4.42 2.1635 2047 2.26 2.26 0.00 4.42 4.42 2.1636 2048 2.26 2.26 0.00 4.42 4.42 2.1637 2049 2.26 2.26 0.00 4.42 4.42 2.1638 2050 2.26 2.26 0.00 4.42 4.42 2.1639 2051 2.26 2.26 0.00 4.42 4.42 2.1640 2052 2.26 2.26 0.00 4.42 4.42 2.16
257.6 90.3 348.0 312.7 176.6 489.3 141.4

The Study for Update of the Hoa Lac High-Tech Park Master Plan Final Report, Supporting Report, Volume I
9-11
Annex 9.2
Financial Viability Indicator Computation
Phase-1 + Phase-2 FIRR 5.2%
Phase-I Phase-II Year Investment O&M TotalExpend. Estate Sold Management
ChargeTotal
Revenue Cash-flow
2008 21.58 21.58 -21.582009 8.74 8.74 -8.742010 129.05 129.05 -129.052011 68.43 68.43 -68.43
1 2012 29.82 29.82 -29.822 2013 0 2.26 2.26 312.70 4.42 317.12 314.863 2014 0 2.26 2.26 0.00 4.42 4.42 2.164 2015 0 2.26 2.26 0.00 4.42 4.42 2.165 2016 30.38 2.26 32.63 0.00 4.42 4.42 -28.226 2017 9.76 2.26 12.02 0.00 4.42 4.42 -7.607 2018 185.44 2.26 187.70 0.00 4.42 4.42 -183.288 2019 45.18 2.26 47.44 0.00 4.42 4.42 -43.029 2020 23.20 2.26 25.46 0.00 4.42 4.42 -21.04
10 1 2021 3.95 3.95 191.31 10.27 201.59 197.6411 2 2022 3.95 3.95 0.00 10.27 10.27 6.3212 3 2023 3.95 3.95 0.00 10.27 10.27 6.3213 4 2024 3.95 3.95 0.00 10.27 10.27 6.3214 5 2025 3.95 3.95 0.00 10.27 10.27 6.3215 6 2026 3.95 3.95 0.00 10.27 10.27 6.3216 7 2027 3.95 3.95 0.00 10.27 10.27 6.3217 8 2028 3.95 3.95 0.00 10.27 10.27 6.3218 9 2029 3.95 3.95 0.00 10.27 10.27 6.3219 10 2030 3.95 3.95 0.00 10.27 10.27 6.3220 11 2031 3.95 3.95 0.00 10.27 10.27 6.3221 12 2032 3.95 3.95 0.00 10.27 10.27 6.3222 13 2033 3.95 3.95 0.00 10.27 10.27 6.3223 14 2034 3.95 3.95 0.00 10.27 10.27 6.3224 15 2035 3.95 3.95 0.00 10.27 10.27 6.3225 16 2036 3.95 3.95 0.00 10.27 10.27 6.32
17 2037 3.95 3.95 0.00 10.27 10.27 6.3218 2038 3.95 3.95 0.00 10.27 10.27 6.3219 2039 3.95 3.95 0.00 10.27 10.27 6.3220 2040 3.95 3.95 0.00 10.27 10.27 6.3221 2041 3.95 3.95 0.00 10.27 10.27 6.3222 2042 3.95 3.95 0.00 10.27 10.27 6.3223 2043 3.95 3.95 0.00 10.27 10.27 6.3224 2044 3.95 3.95 0.00 10.27 10.27 6.3225 2045 3.95 3.95 0.00 10.27 10.27 6.3226 2046 3.95 3.95 0.00 10.27 10.27 6.3227 2047 3.95 3.95 0.00 10.27 10.27 6.3228 2048 3.95 3.95 0.00 10.27 10.27 6.3229 2049 3.95 3.95 0.00 10.27 10.27 6.3230 2050 3.95 3.95 0.00 10.27 10.27 6.3231 2051 3.95 3.95 0.00 10.27 10.27 6.3232 2052 3.95 3.95 0.00 10.27 10.27 6.32
Total 551.57 144.41 695.98 504.01 364.03 868.05 172.06

The Study for Update of the Hoa Lac High-Tech Park Master Plan Final Report, Supporting Report, Volume I
10-1
10. ECONOMIC ANALYSIS
This chapter presents the results of the evaluation of the economic feasibility of implementing the Hoa Lak High-tech Park Development Project. It is concerned with the determination of the net benefits that will accrue to the economy as a result of the project. Only tangible costs and benefits are considered in evaluation.
10.1 Methodology
The relevant economic feasibility criterion is derived from a procedure aimed at maximizing the overall objectives of the national economy. Economic feasibility is measured by comparing the Economic Internal Rate of Return (EIRR) of the project for infrastructure project as a minimum 12% which are considered by Asian Development Bank and other international financial institutions. This 12 percent discount rate is used as the economic opportunity cost of capital, thus, to calculate B/C, NPV and EIRR.
(1) Cost
The project costs for the Project from 2008 to 2020 covering the period of Phase-1 and Phase-2 of the Project was estimated firstly on the basis of the market price as financial costs and it is converted to the economic costs for the economic analysis. As for the economic analysis, it is assumed that the Project is owned and operated fully by the public entity. The monetary unit shown therein, therefore, is based on prevailing market prices of required goods and services at present August 2007. Taxes composed of the current tax and import duties are subtracted as transfer payment from the total financial cost estimated. Tax rates applied for this subtraction were 10 % as value added tax on all prices estimated for local components and 5 % as import duties on all prices estimated for foreign components. The land acquisition as well as administration cost of the Project are also subtracted.
(2) Benefits
The benefits are estimated based on the comparison of the With the Project Case and Without the Project Case. The quantifiable benefits applied for the economic analysis are as follows: 1. Benefits derived from the difference of output from the industrial estate of standard
or rather low level industrial products and high-tech products; 2. Benefits derived from multiplier effect of investment for high-tech industry which
enhances the development and investment to related industries that produce the component, part and other materials required for the production of high-tech products; and
3. Benefits derived from the application of results of research and development activities taken place in HHTP.
10.2 Assumed Conditions for Economic Analysis
Before the economic evaluation is carried out and various inputs factors determined, the

The Study for Update of the Hoa Lac High-Tech Park Master Plan Final Report, Supporting Report, Volume I
10-2
framework has to be established and defined. The data framework consists of the following components.
1. Composition of direct cost
The direct cost estimated for the Project in 2007 is presented in Table 9.3. The cost estimated based on the market price is converted firstly into the economic cost by subtracting tax, import duties, administration expenses, and land acquisition cost which is accounted for around 30% of the direct cost. Then the subtracted cost is converted into economic cost using the standard conversion factor at 10%.
2. Composition of benefits due to increase of productivity
The average output per hectare of industrial estate developed and operating in Vietnam in 2005 is estimated at US$ 0.90 million per year. It was US$ 0.70 million per year in 2000. The reason of this increased output is thought to be attributed by an increased output from the manufacturing activity of high-tech industries especially located in the industrial estate. Based on this estimated value per hectare of industrial estate the difference between the value of standard industrial estate and high-tech industrial estate is guessed as US$ 0.20 million. This suggest that the expansion of manufacturing activity for high-tech products will generate US$ 0.20 million per hectare of industrial estate per year than the manufacturing activity of standard non-high-tech products. This difference of value of output between standard non-high-tech product and high-tech product is considered as the basic economic benefit attributed by the execution of the Project.
In general, the high-tech industrial activity is supported by various related industries such as supply of needed components, parts, software, raw materials, logistic services, transport, etc. from local manufactures in or out of the industrial estate where the high-tech industry is located. Therefore, the investment for the high-tech industry generates the investments and increases the industrial activities of related industries supporting the high-tech manufacturing activity. This is called a multiplier effect of the investment in one sector to the other related sector. However, such multiplier effect can only be measured if there exist In-put and Out-put Table (I-O Table) authorized by the government agency concerned to the macro economic management of the country. In Vietnam, I-O Table does not exist at present the multiplier effect due to an investment in the high-tech industrial activity is guessed at 1.20 at least.
3. Composition of benefits due to investment in FDI
The incremental capital-output ratio (ICOR) 1 of FDI for high-tech industry is measured based on the data available for both GDP and FDI on high-tech industrial sector in the period of 2001-2005. The ICOR of the same is computed at 2.3, which is quite high. This result of analysis supports the multiplier effect of investment of FDI to high-tech industry at 1.20 as the minimum rate.
1 Incremental Capital-Output Ratio: Ratio of GDP growth divided by the growth of investment in one sector.

The Study for Update of the Hoa Lac High-Tech Park Master Plan Final Report, Supporting Report, Volume I
10-3
4. Composition of benefits due to R&D
The theoretical linking with foreign direct investment to economic growth is well known. The trans national corporation those composes the major part of FDI has been actively progress the internationalization of R&D so as to compete among them in all over the world in general but in ASEAN countries in particular. There is a positive correlation between R&D intensity and productivity grown. The output elasticity to R&D development is estimated at 0.10 to 0.50 depending on the sector and timing2. There is also a positive correlation between investment in R&D and the quality of the human capital, which ultimately adds to the significance of the technological progress term in the production function. The average share of investment on R&D accounts around 2.5% in OECD member countries. It is estimated that an increase of 1% of investment in R&D results on increased productivity at 0.46 point. The public investment on R&D in Vietnam in 2005 was 0.53% of GDP and it has been expanded to 1% of GDP in 2006. The amount of investment on R&D will be enhanced and accelerated due to the implementation of the Project. Therefore the elasticity of investment on R&D could reach to more than 0.40 point.
5. Multiplier Effect
The multiplier effect of investment in FDI high-tech sector is determined at 1.50 taking into consideration of estimated rate of simple multiplier effect of high-tech industry to other industries, ICOR and economic effect of R&D in combination.
10.3 Result of Economic Analysis
The economic viability indicators computed are as shown in Table-10.1. <See Annex 10.1 and 10.2 for details>
Table 10.3-1 Result of Economic Analysis
EIRR NPV B/C Discount Rate Phase-1 16.0% US$ 33.2 million 1.22 12%
Phase-1+2 14.6% US$ 29.8 million 1.12 12%
The social economic opportunity cost of Vietnam is considered at 12% as Asian Development Bank and other international financial institution often uses this rate for evaluation of the infrastructure development project not only in Vietnam but also in other ASEAN countries. Therefore, 12% is set at the cut-off rate to measure the project viability.
10.4 Evaluation of Economic Viability
The EIRR is computed as 16.5% for Phase-1 and 17.3% for combination of Phase-1 and Phase-2, both of which is more than the cut-off rate predetermined. NPV computed is positive and B/C is more than 0. Therefore, the Project is considered as viable and competitive from the economic analysis point of view.
2 Industrial R&D Economic and Policy Analysis Report 2006. European Commission

The Study for Update of the Hoa Lac High-Tech Park Master Plan Final Report, Supporting Report, Volume I
10-4
Annex 10.1 Economic Analysis
Conversion Factor Phase-1 74 Phase-2 71
EIRR 16.0% NPV 33.2 Million B/C 1.22 12%
Year CalendarYear IE Area
CapitalInvestme
ntO&M Cost Total
EconomicBenefit
per
MultiplierEffect
EconomicBenefit Balance Discount Cost Benefit
2008 15.97 15.97 -15.97 1.000 16.0 0.02009 6.47 6.47 -6.47 0.880 5.7 0.02010 95.47 95.47 -95.47 0.774 73.9 0.02011 50.62 50.62 -50.62 0.681 34.5 0.02012 22.06 23.48 -23.48 0.600 14.1 0.02013 140 1.42 1.42 0.20 1.50 42.00 40.58 0.528 0.8 22.22014 140 1.42 1.42 0.20 1.50 42.00 40.58 0.464 0.7 19.52015 140 1.42 1.42 0.20 1.50 42.00 40.58 0.409 0.6 17.2
1 2016 140 1.42 1.42 0.20 1.50 42.00 40.58 0.360 0.5 15.12 2017 140 1.42 1.42 0.20 1.50 42.00 40.58 0.316 0.5 13.33 2018 140 1.42 1.42 0.20 1.50 42.00 40.58 0.279 0.4 11.74 2019 140 1.42 1.42 0.20 1.50 42.00 40.58 0.245 0.3 10.35 2020 140 1.42 1.42 0.20 1.50 42.00 40.58 0.216 0.3 9.16 2021 140 1.42 1.42 0.20 1.50 42.00 40.58 0.190 0.3 8.07 2022 140 1.42 1.42 0.20 1.50 42.00 40.58 0.167 0.2 7.08 2023 140 1.42 1.42 0.20 1.50 42.00 40.58 0.147 0.2 6.29 2024 140 1.42 1.42 0.20 1.50 42.00 40.58 0.129 0.2 5.4
10 2025 140 1.42 1.42 0.20 1.50 42.00 40.58 0.114 0.2 4.811 2026 140 1.42 1.42 0.20 1.50 42.00 40.58 0.100 0.1 4.212 2027 140 1.42 1.42 0.20 1.50 42.00 40.58 0.088 0.1 3.713 2028 140 1.42 1.42 0.20 1.50 42.00 40.58 0.078 0.1 3.314 2029 140 1.42 1.42 0.20 1.50 42.00 40.58 0.068 0.1 2.915 2030 140 1.42 1.42 0.20 1.50 42.00 40.58 0.060 0.1 2.516 2031 140 1.42 1.42 0.20 1.50 42.00 40.58 0.053 0.1 2.217 2032 140 1.42 1.42 0.20 1.50 42.00 40.58 0.047 0.1 2.018 2033 140 1.42 1.42 0.20 1.50 42.00 40.58 0.041 0.1 1.719 2034 140 1.42 1.42 0.20 1.50 42.00 40.58 0.036 0.1 1.520 2035 140 1.42 1.42 0.20 1.50 42.00 40.58 0.032 0.0 1.321 2036 140 1.42 1.42 0.20 1.50 42.00 40.58 0.028 0.0 1.222 2037 140 1.42 1.42 0.20 1.50 42.00 40.58 0.025 0.0 1.023 2038 140 1.42 1.42 0.20 1.50 42.00 40.58 0.022 0.0 0.924 2039 140 1.42 1.42 0.20 1.50 42.00 40.58 0.019 0.0 0.825 2040 140 1.42 1.42 0.20 1.50 42.00 40.58 0.017 0.0 0.726 2041 140 1.42 1.42 0.20 1.50 42.00 40.58 0.015 0.0 0.627 2042 140 1.42 1.42 0.20 1.50 42.00 40.58 0.013 0.0 0.528 2043 140 1.42 1.42 0.20 1.50 42.00 40.58 0.011 0.0 0.529 2044 140 1.42 1.42 0.20 1.50 42.00 40.58 0.010 0.0 0.430 2045 140 1.42 1.42 0.20 1.50 42.00 40.58 0.009 0.0 0.431 2046 140 1.42 1.42 0.20 1.50 42.00 40.58 0.008 0.0 0.332 2047 140 1.42 1.42 0.20 1.50 42.00 40.58 0.007 0.0 0.333 2048 140 1.42 1.42 0.20 1.50 42.00 40.58 0.006 0.0 0.334 2049 140 1.42 1.42 0.20 1.50 42.00 40.58 0.005 0.0 0.235 2050 140 1.42 1.42 0.20 1.50 42.00 40.58 0.005 0.0 0.236 2051 140 1.42 1.42 0.20 1.50 42.00 40.58 0.004 0.0 0.237 2052 140 1.42 1.42 0.20 1.50 42.00 40.58 0.004 0.0 0.2
Total 190.59 56.92 248.93 8.00 60.00 1680.00 1431.07 150.39 183.59
Discount Rate

The Study for Update of the Hoa Lac High-Tech Park Master Plan Final Report, Supporting Report, Volume I
10-5
Annex 10.2
Economic Analysis
Conversion Factor Phase-1 74 Phase-2 71
EIRR 14.6% NPV 29.8 Million B/C 1.12 12%
Year CalendarYear IE Area
CapitalInvestme
ntO&M Cost Total
EconomicBenefit
per
MultiplierEffect
EconomicBenefit Balance Discount Cost Benefit
2008 15.97 15.97 -15.97 1.000 16.0 0.02009 6.47 6.47 -6.47 0.880 5.7 0.02010 95.47 95.47 -95.47 0.774 73.9 0.02011 50.62 50.62 -50.62 0.681 34.5 0.02012 22.06 23.48 -23.48 0.600 14.1 0.02013 140 22.47 1.42 23.90 0.20 1.50 42.00 18.10 0.528 12.6 22.22014 140 7.22 1.42 8.65 0.20 1.50 42.00 33.35 0.464 4.0 19.52015 140 137.19 1.42 138.61 0.20 1.50 42.00 -96.61 0.409 56.6 17.2
1 2016 140 32.18 1.42 33.60 0.20 1.50 42.00 8.40 0.360 12.1 15.12 2017 140 16.53 1.42 17.95 0.20 1.50 42.00 24.05 0.316 5.7 13.33 2018 140 0.00 1.42 1.42 0.20 1.50 42.00 40.58 0.279 0.4 11.74 2019 140 0.00 1.42 1.42 0.20 1.50 42.00 40.58 0.245 0.3 10.35 2020 140 0.00 1.42 1.42 0.20 1.50 42.00 40.58 0.216 0.3 9.16 2021 325 2.49 2.49 0.20 1.50 97.50 95.01 0.190 0.5 18.57 2022 325 2.49 2.49 0.20 1.50 97.50 95.01 0.167 0.4 16.38 2023 325 2.49 2.49 0.20 1.50 97.50 95.01 0.147 0.4 14.39 2024 325 2.49 2.49 0.20 1.50 97.50 95.01 0.129 0.3 12.6
10 2025 325 2.49 2.49 0.20 1.50 97.50 95.01 0.114 0.3 11.111 2026 325 2.49 2.49 0.20 1.50 97.50 95.01 0.100 0.2 9.812 2027 325 2.49 2.49 0.20 1.50 97.50 95.01 0.088 0.2 8.613 2028 325 2.49 2.49 0.20 1.50 97.50 95.01 0.078 0.2 7.614 2029 325 2.49 2.49 0.20 1.50 97.50 95.01 0.068 0.2 6.715 2030 325 2.49 2.49 0.20 1.50 97.50 95.01 0.060 0.1 5.916 2031 325 2.49 2.49 0.20 1.50 97.50 95.01 0.053 0.1 5.217 2032 325 2.49 2.49 0.20 1.50 97.50 95.01 0.047 0.1 4.518 2033 325 2.49 2.49 0.20 1.50 97.50 95.01 0.041 0.1 4.019 2034 325 2.49 2.49 0.20 1.50 97.50 95.01 0.036 0.1 3.520 2035 325 2.49 2.49 0.20 1.50 97.50 95.01 0.032 0.1 3.121 2036 325 2.49 2.49 0.20 1.50 97.50 95.01 0.028 0.1 2.722 2037 325 2.49 2.49 0.20 1.50 97.50 95.01 0.025 0.1 2.423 2038 325 2.49 2.49 0.20 1.50 97.50 95.01 0.022 0.1 2.124 2039 325 2.49 2.49 0.20 1.50 97.50 95.01 0.019 0.0 1.925 2040 325 2.49 2.49 0.20 1.50 97.50 95.01 0.017 0.0 1.626 2041 325 2.49 2.49 0.20 1.50 97.50 95.01 0.015 0.0 1.427 2042 325 2.49 2.49 0.20 1.50 97.50 95.01 0.013 0.0 1.328 2043 325 2.49 2.49 0.20 1.50 97.50 95.01 0.011 0.0 1.129 2044 325 2.49 2.49 0.20 1.50 97.50 95.01 0.010 0.0 1.030 2045 325 2.49 2.49 0.20 1.50 97.50 95.01 0.009 0.0 0.931 2046 325 2.49 2.49 0.20 1.50 97.50 95.01 0.008 0.0 0.832 2047 325 2.49 2.49 0.20 1.50 97.50 95.01 0.007 0.0 0.733 2048 325 2.49 2.49 0.20 1.50 97.50 95.01 0.006 0.0 0.634 2049 325 2.49 2.49 0.20 1.50 97.50 95.01 0.005 0.0 0.535 2050 325 2.49 2.49 0.20 1.50 97.50 95.01 0.005 0.0 0.536 2051 325 2.49 2.49 0.20 1.50 97.50 95.01 0.004 0.0 0.437 2052 325 2.49 2.49 0.20 1.50 97.50 95.01 0.004 0.0 0.4
Total 406.18 90.98 498.58 8.00 60.00 3456.00 2957.42 240.13 269.90
Discount Rate