the structural effects of team density and …
TRANSCRIPT

THE STRUCTURAL EFFECTS OF TEAM DENSITY AND NORMATIVE STANDARDS
ON NEWCOMER PERFORMANCE
By
Brian Manata
A DISSERTATION
Submitted to
Michigan State University
in partial fulfillment of the requirements
for the degree of
Communication – Doctor of Philosophy
2015

ABSTRACT
THE STRUCTURAL EFFECTS OF TEAM DENSITY AND NORMATIVE STANDARDS
ON NEWCOMER PERFORMANCE
By
Brian Manata
This dissertation investigates the impact of team density and
team standards on newcomer performance. Data were collected from
204 newcomers, with results indicating that team density had a
substantial negative effect on newcomer performance. Moreover,
although a positive effect was predicted, analyses indicated
that team standards had a trivial impact on newcomer
performance. An interaction effect between team density and team
standards was also predicted, but the hypothesis failed to
receive any statistical support. This dissertation ends with a
detailed discussion in which the contribution and implications
of this research are addressed, and directions for future
research are offered.

iii
ACKNOWLEDGMENTS
I would like to thank Vernon Miller, Frankie B., Jim
Dearing, and Elaine Yakura for serving on my committee; may you
terrorize many other students throughout your academic careers.
I would also like to thank Shannon Cruz for being a sweet BEH
BEH and putting up with me throughout this godforsaken process.
Lastly, I would like to thank Kyle, Bri, Ken, Min, and Vernon
for collecting my data on that fateful Thursday morning (I don’t
know, was it a Thursday?).

iv
TABLE OF CONTENTS
LIST OF TABLES…………………………………………………………………………………………………………………… v
LIST OF FIGURES………………………………………………………………………………………………………………… vi
INTRODUCTION………………………………………………………………………………………………………………………… 1
LITERATURE REVIEW…………………………………………………………………………………………………………… 3
Team Density…………………………………………………………………………………………………………… 5
Normative Standards………………………………………………………………………………………… 6
Team Density and Normative Standards…………………………………………… 8
METHOD………………………………………………………………………………………………………………………………………… 11
Procedure…………………………………………………………………………………………………………………… 11
Sample…………………………………………………………………………………………………………………………… 12
Measures……………………………………………………………………………………………………………………… 13
Team Density……………………………………………………………………………………………… 13
Team Standards………………………………………………………………………………………… 15
Newcomer Performance………………………………………………………………………… 15
Control Variables………………………………………………………………………………… 16
Task and Social Cohesion………………………………………………… 16
Leader Member Exchange (LMX)……………………………………… 17
Reception of Performance Evaluation…………………… 17
Measurement Model……………………………………………………………………………………………… 18
RESULTS……………………………………………………………………………………………………………………………………… 21
Control Variables……………………………………………………………………………………………… 21
Reception of Performance Evaluation……………………………………………… 21
Hypothesis Testing…………………………………………………………………………………………… 22
Hypothesis 1……………………………………………………………………………………………… 23
Hypothesis 2……………………………………………………………………………………………… 23
Hypothesis 3……………………………………………………………………………………………… 24
Post-Hoc Outlier Analysis………………………………………………………………………… 25
DISCUSSION……………………………………………………………………………………………………………………………… 28
Team Density…………………………………………………………………………………………………………… 30
Team Standards……………………………………………………………………………………………………… 31
Limitations……………………………………………………………………………………………………………… 35
CONCLUSION……………………………………………………………………………………………………………………………… 39
APPENDIX…………………………………………………………………………………………………………………………………… 41
REFERENCES……………………………………………………………………………………………………………………………… 50

v
LIST OF TABLES
Table 1: Factor Loadings, Reliabilities, Means, and SDs
across each of the Four Factors……………………………………………………………………… 20
Table 2: Predictors of Newcomer Performance Scores
(outliers included)……………………………………………………………………………………………………… 27
Table 3: Predictors of Newcomer Performance Scores
(outliers exclude)………………………………………………………………………………………………………… 27
Table 4: Correlations between Factors……………………………………………………… 27

vi
LIST OF FIGURES
Figure 1. Hypothesized interaction model between team
density and team standards (H3)……………………………………………………………………… 10
Figure 2. Low versus high density group………………………………………………… 14
Figure 3. Visualized interaction term; outliers included…… 25
Figure 4. Post-hoc hypothesis and finding, in which team
standards has a small indirect effect on newcomer
performance (N = 45); outliers excluded………………………………………………… 32

1
INTRODUCTION
Upon becoming organizational members, newcomers go through
a period of socialization in which they are assimilated to the
organization’s normative culture (Kramer, 2010; Van Maanen &
Schein, 1979). Specifically, during the socialization phase,
newcomers “acquire the knowledge, skills, attitudes, and
behaviors” (Wanberg, 2012, p. 12) deemed essential to fulfilling
their organizational roles. In the main, this period of
adjustment is conceptualized as a concerted effort between both
newcomers and organizational incumbents (Bauer & Erdogan, 2014).
Organizational initiatives, in particular, may be used to guide
newcomers through structured or unstructured experiences that
facilitate their adoption of relevant organizational beliefs,
values, and norms (Jones, 1986; Van Mannen & Schein, 1979).
Conversely, newcomers may actively seek out or observe
information integral to fulfilling their organizational
expectations and outcomes (Chao, O’Leary-Kelly, Wolf, Klein, &
Gardner, 1994; Miller & Jablin, 1991; Morrison, 1993). In both
respects, the assimilation phase is a period of time in which
newcomers acquire normative information that guides them through
their adjustment period (Kramer & Miller, 2014; Stohl, 1986).
Thus far, reviews of the socialization corpus generally
recommend establishing and implementing socialization practices
that facilitate newcomer learning and adjustment (e.g., Bauer &

2
Erdogan, 2014; Chao, 2012; Kramer & Miller, 2014). As van Vianen
and Pater (2012) note, “a common understanding of organizational
values and goals…advance[s] effective communication, smooth
collaborations, and stability among organizational members” (p.
145). These conclusions are buttressed by two recent meta-
analyses, which show that facilitating newcomer adjustment
increases newcomer performance, role-clarity, and overall
retention (Bauer, Bodner, Erdogan, Truxillo, & Tucker, 2007;
Kramer, 2010; Saks, Uggerslev, & Fassina, 2007).
Despite these empirical advances, socialization scholars
have been criticized for failing to apply the tenets of
multilevel theory (MLT; Kozlowski, 2012; Kozlowski & Klein,
2000) and the social network approach (SNA; Butts, 2009; Monge &
Contractor, 2003; Newman, 2010). In the main, both perspectives
suggest that failing to account for multilevel effects (i.e.,
group-level phenomena) as they occur within organizational
systems obfuscates our understanding of how team-member
relations facilitate newcomer performance and assimilation
outcomes (Bauer & Erdogan, 2014; Jokisaari & Nurmi, 2012;
Kozlowski & Bell, 2012; Manata, Miller, DeAngelis, & Paik,
2013). In an attempt to allay these criticisms, this study
focuses on assessing the impact of variables deemed applicable
to both multilevel theory and social network analysis (team
density and standards). A literature review is provided below.

3
LITERATURE REVIEW
Multilevel theory (MLT) postulates that organizations are
complex, hierarchical systems comprised of interdependent teams
and larger units (Kozlowski & Klein, 2000; Morgan, 2006). Hence,
assuming extant between-unit variation in team culture and
normative standards, it is implied that newcomer socialization
differs as a function of the specific unit to which the newcomer
is socialized (Kozlowski & Bell, 2012; Moreland & Levine, 1982,
2001). Similar to MLT, the SNA postulates that individuals are
embedded within multilevel, relational structures (Baurer &
Erdogan, 2014; Jokisaari & Nurmi, 2012; Monge & Contractor,
2003; Newman, 2010). Network level effects, for instance, may be
modeled at the team level of analysis (e.g., Balkundi &
Harrison, 2006), organizational level of analysis (e.g.,
Contractor, Wasserman, & Faust, 2006), and so on. Both
theoretical perspectives thus suggest that newcomer assimilation
outcomes are likely to vary as a function of one’s position and
pattern of relationships (cf. Borgatti, Mehra, Brass, &
Labianca, 2009; Crawford & Lepine, 2013).
Strikingly, research guided by these two theoretical
perspectives (i.e., MLT and SNA) differs substantially from past
socialization investigations. Specifically, whereas past
approaches have focused primarily on the importance of acquiring
organizational-level information (e.g., Chao et al., 1994;

4
Jones, 1986; Miller & Jablin, 1994; Stohl, 1986; Van Maanen &
Schein, 1979), both MLT and SNA focus on the importance of
investigating group-level peer interactions and newcomers’
specific patterns of network relationships. Given the purported
influence of newcomers’ immediate peers during socialization
(cf. Jablin, 2001; Moreland & Levine, 1982, 2001; Louis, Posner,
& Powell, 1983; Ostroff & Kozlowski, 1992; Salancik & Pfeffer,
1978), the general omission of these perspectives is somewhat
unanticipated. Correspondingly, the incorporation of variables
that help illume the complex, multilevel nature of newcomer
socialization is essential to uncovering new and highly
important aspects of newcomer socialization (Bauer & Erdogan,
2014; Jokisaari & Nurmi, 2012; Kozlowski & Bell, 2012; Manata et
al., 2013; Moreland & Levine, 2001).
Newcomer socialization studies guided by both theoretical
perspectives (i.e., MLT and SNA) have helped illustrate how
newcomers’ network positions and group-level relations affect
integral assimilation outcomes. Recent work by Chen (2005) and
Chen and Klimoski (2003), for instance, shows that being
socialized to high performing teams with strong expectations is
associated with substantial increases in performance.
Additionally, in her pioneering work on newcomer social capital,
Morrison (2002) found that being positioned within dense
information networks was associated with increases in newcomer

5
role clarity and task mastery; additionally, newcomers with
strong friendship ties evidenced increases in role clarity,
social integration, and organizational commitment. Jokisaari and
Vuori (2014) relatedly found that newcomers’ innovativeness
increased as their informational resources became increasingly
heterogeneous, and Jokisaari (2013) found that stronger ties to
work colleagues transformed newcomers into more effective group
members. Overall, these studies reinforce the practical and
theoretical importance of assessing how group-level phenomena
and network properties impact key assimilation outcomes like
performance.
Team Density
Of the myriad team-level network variables available (see
Hanneman & Riddle, 2005; Monge & Contractor, 2003; Newman,
2010), density is highly applicable to the multilevel nature of
teams, members’ relational patterns, and socialization outcomes
(e.g., performance; Balkundi & Harrison, 2006). Density is
defined as the extent to which nodes found within a network are
interconnected (Hanneman & Riddle, 2005; Monge & Contractor,
2003). Accordingly, denser networks come to fruition as the
connectivity between nodes increases (Newman, 2010). When
extrapolated to the team level of analysis, the density of the
team increases as connections between team members are realized
(Balkundi & Harrison, 2006).
6
Denser groups are typically characterized by increases in
information exchange, collaboration, and overall member
interaction (Coleman, 1988; Sparrowe, Liden, Wayne, & Kraimer,
2001; Zohar & Tenne-Gazit, 2008). Notably, in other literatures,
these patterns of interaction have been shown to lead to
increases in both team and member performance. For instance, in
their recent meta-analysis of the hidden profile literature, Lu,
Yuan, and McLeod (2012) showed that information sharing in
groups was associated with substantial increases in decision-
making accuracy. Moreover, recent reviews by Kozlowski and Ilgen
(2006) and Kozlowski and Bell (2012) conclude that establishing
shared mental schema of work-related activities aids with task
completion and member coordination. Relatedly, in their meta-
analysis, Balkundi and Harrison (2006) found a positive
association between team density and team performance, and
subsequent empirical investigations have since then buttressed
their initial conclusions (e.g., Bizzi, 2013; Mehra, Dixon,
Brass, & Robertson, 2006; Roberson & Williamson, 2012; Zohar &
Tenne-Gazit, 2008). Given the overall positive effects of team-
level density, the first hypothesis is offered.
H1: Team density positively predicts newcomer performance.
Normative Standards
An additional mechanism by which team density influences
member behavior is normative constraint and coordinated action

7
(Burt, 2000; 2001; Coleman, 1988). Within group contexts, norms
are defined as established patterns of group member behavior to
which other members of the group commonly adhere (Burgoon, 1978;
Lapsinki & Rimal, 2005). Thus, as members enter networks that
are highly clustered and dense, they are likely to be exposed to
group-level normative standards that ultimately constrain their
behavior (Centola, 2010; Shakya, Christakis, & Fowler, 2014).
Barker (1993) and Gibson and Papa (2000), for instance, found
that as newcomers entered their respective organizational units,
they experienced pressure from organizational incumbents to
adopt the team’s normative standards. This is in line with the
theoretical musings of Jones (1984), who posited that as
members’ actions become increasingly visible to other unit
members, normative pressures would likely ensue and thus
attenuate member “shirking or freeriding” (p. 686). Such norms
are likely injunctive in nature, where violations of said
normative behaviors are met with both social sanctions and
member disapproval (Glynn & Huge, 2007; Jackson, 1966, 1975;
Lapinski & Rimal, 2005; Manata & Miller, 2012; Miller & Form,
1964).
In the absence of social sanctions, the mere espousal of
normative standards likely conveys descriptive attitudinal
information to which members assimilate (cf. de la Haye, Mohr,
Robins, & Wilson, 2013; Lapinski & Rimal, 2005; Zohar & Hoffman,

8
2012). In his seminal work, Friedkin (1984) found that members’
attitudes were homogeneous with those of their direct social
circle contacts. Within organizational settings, Fulk (1993)
similarly found that workgroup attitudes and behaviors predicted
those of individual members, as long as the members were
attracted to the workgroup. Other organizational studies and
reviews have also shown how organizational members’ attitudes
and behaviors are typically predicted by the attitudes of those
in their vicinity—generally, their work group (e.g., see
Jokisaari & Nurmi, 2012; Rentsch, 1990; Stephens & Davis, 2009).
Overall, these findings imply that performance norms and
attitudes conveyed by newcomers’ peer groups are likely related
to how newcomers ultimately perceive the importance of their
task (cf. Zohar & Hoffman, 2012), and thus how they perform (cf.
Kim & Hunter, 1993). In consequence:
H2: Team standards positively predict newcomer performance.
Team Density and Normative Standards
Intriguingly, the argument thus far suggests that high-
density teams have the ability to constrain and socialize
newcomers to either high or low levels of performance (i.e., a
team density x normative standards interaction). Presumably,
units with high levels of team density are able to generate
normative environments that constrain members’ actions (Burt,
2001; Coleman, 1988; Zohar & Tenne-Gazit, 2008). Thus, for teams

9
that are high in density and socialize newcomers to high
performance norms, newcomer performance should increase (e.g.,
Chen, 2005; Chen & Klimoski, 2003; Katzenbach & Smith, 1993).
Inversely, for teams that are high in density but evidence low
performance standards, organizational teams and units may
suppress the productivity of their members by either actively
constraining their output (e.g., Cohen & Bailey, 1997;
Roethlisberger & Dickson, 1939; Taylor, 1914; Zurcher, 1983) or
by espousing and infecting newcomers with low-level performance
standards (Monge & Contractor, 2003; Schein, 1968; cf. Zohar &
Hoffman, 2012). In either case, the effect of normative
constraint on newcomer performance likely depends on the
strength and specific direction of the normative standard.
In support of these assertions, Langfred (1998) found that
workgroup standards moderated the cohesion-performance
relationship, such that group cohesion enhanced team performance
when normative standards were high, but attenuated it when they
were low. Similarly, when studying the effects of latrine
ownership, Shakya et al. (2014) found that latrine ownership was
lowest when participants’ network interconnectedness (defined as
transitivity) was high and others’ latrine ownership was low;
notably, this effect disappeared as others’ latrine ownership
decreased, thus suggesting that participants were less likely to

10
be subjected to normative peer pressures. Thus, in line with
these empirical findings, it is predicted that:
H3: Newcomer performance will be highest when team density
and team standards are high, but lowest when team density
is high and team standards are low. Moreover, when team
density is low, the effect of team standards will be weaker
when compared to these two conditions.
Figure 1. Hypothesized interaction model between team density
and team standards (H3).
Team Density
Newcomer Performance
Team Standards

11
METHOD
Participants were sampled from the Residence Education and
Housing Services (REHS). REHS is a unique community of Resident
Assistants (RA) who are charged with overseeing the living
conditions and acclimation of undergraduate students. Moreover,
RAs work in small teams, which are led by Assistant Community
Directors (ACDs; graduate student advisors), that meet on a
weekly basis in order to deal with work issues as they arise
throughout the week. Because RAs typically live and work within
close proximity to one another, and because hundreds of new RAs
are socialized to the REHS community each year, the RA
population was deemed a good sample by which to assess the
effects of team density and team standards on newcomer
performance.
Procedure
Data from this sample were collected during an REHS meeting
that all RAs and ACDs were required to attend (before the start
of the Spring 2015 semester). During this meeting, RAs and their
corresponding ACDs were asked to split up into their respective
sub-staffs, and then each sub-staff was given a set of
customized survey packets. These survey packets contained a
complete list of members assigned to each sub-staff. Thus, this
procedure allowed participants to report on how often they
sought work-related advice from members assigned to their

12
specific team. Each survey packet also contained general
measures of team standards, newcomer performance, demographic
information (gender, months worked, etc.), and other relevant
control variables (see Appendix for full instrument).
Sample
In total, 340 RAs and ACDs across 45 different sub-staffs
from REHS were sampled. Eighteen participants, however, had to
be dropped from the subsequent analyses. Specifically, eight of
these participants were brand new and thus had very limited or
no experience. Additionally, 10 participants were transfers and
thus did not have their names listed on the sub-staff’s
customized survey packet. A decision was made to drop both types
of individuals (i.e., brand new and transfers) because sub-staff
members were unable to report on whether they sought task-
related advice from these members. Additionally, for
participants that were brand new, no connections were typically
listed because they had yet to be integrated into the REHS
network (i.e., they had no connections to report). These 18
participants were removed from the sample, as keeping them would
have forced the introduction of numerous, potentially
artificial, zeroes (i.e., false non-connections) into the
density calculation, thus underestimating it.
Of the remaining 322 REHS members, n = 204 were classified
as newcomers by REHS because they had been employed for 12
13
months or less. This sub-sample of n = 204 thus constituted the
final sample of newcomers used in the subsequent analysis.
Moreover, given the abundance of newcomers, teams were primarily
composed of incoming RAs (M = 63%; SD = .15%)
Of these available data, 88.7% (n = 180) of the
participants were RAs, 10.8% (n = 22) were Assistant Community
Directors, and 0.5% (n = 1) were Community Directors
(supervisorial position). Subjects were mostly female (54.4%; n
= 111), and identified as Caucasian (65.3%; n = 132),
Black/African American (13.9%; n = 28), Asian (8.4%; n = 17),
Multi-ethnic (5.4%; n = 11), and a range of other ethnicities
(7%; n = 14). Additionally, participants were on average 20.67
years old (SD = 2.10), had been working for roughly 5.21 months
(SD = 2.62), and identified as sophomores (34.3%; n = 70),
juniors (37.3%; n = 76), seniors (15.2%, n = 31), and graduate
students (13.2%, n = 27).
Measures
Team Density. To calculate team density, each team member
was sent a list of their respective team members’ names and
asked to check off the names of those from whom they sought
work-related advice (e.g., Bizzi, 2013). Participants were also
asked to report on how frequently these advice-seeking
interactions occurred. Frequency of advice-seeking interactions
was measured using a one-item measure that ranged from 1 = less
14
than once a week to 7 = several times a day. This addition
helped differentiate between stronger and weaker advice-seeking
ties, and also allowed for the network to be treated as a
directed network (i.e., Member A may be tied to Member B, but
Member B need not be tied to Member A).
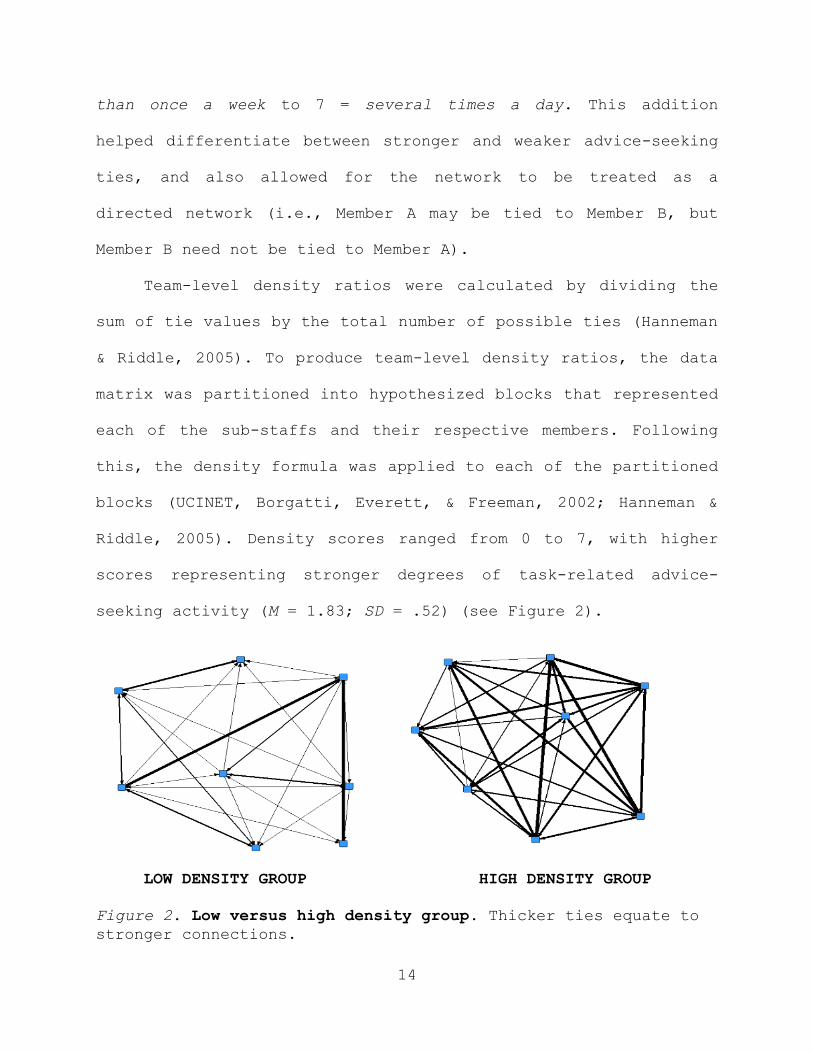
Team-level density ratios were calculated by dividing the
sum of tie values by the total number of possible ties (Hanneman
& Riddle, 2005). To produce team-level density ratios, the data
matrix was partitioned into hypothesized blocks that represented
each of the sub-staffs and their respective members. Following
this, the density formula was applied to each of the partitioned
blocks (UCINET, Borgatti, Everett, & Freeman, 2002; Hanneman &
Riddle, 2005). Density scores ranged from 0 to 7, with higher
scores representing stronger degrees of task-related advice-
seeking activity (M = 1.83; SD = .52) (see Figure 2).
LOW DENSITY GROUP HIGH DENSITY GROUP
Figure 2. Low versus high density group. Thicker ties equate to
stronger connections.

15
Team Standards. The extent to which RA teams had high
standards of performance was measured using Taylor and Bower’s
(1972) three-item peer goal emphasis scale. These items were
positioned on 5-point Likert-type scales (1 = strongly disagree;
5 = strongly agree).
Because team standards were theorized to be a group-level
factor, within-group agreement in team standard scores was
assessed using the intra-class correlation (Bliese, 2000). This
analysis showed that subjects’ team standards responses
evidenced substantial within-group agreement (ICC = .20, p <
.001; cf. Kashy and Kenny, 2000; Maas & Cox, 2004a), thus
providing validity to the claim that team standards construct
was operating at the group-level of analysis (Kozlowski & Klein,
2000). As such, individual-level perceptions of team-level
standards were aggregated to the team-level of analysis (M =
5.84; SD = .55).
Newcomer Performance. Although ACDs are required to
formally evaluate the performance of their respective RAs twice
a year, a complete set of formal evaluations were not available
at the time of data collection. In an attempt to assuage this
limitation, newcomer performance scores were derived by
soliciting subjective self-report evaluations using a one-item
measure that ranged from 0%-100% (M = 84.28; SD = 7.59).

16
Control Variables. Task and Social Cohesion. A decision was
made to control for the potentially confounding effects of group
cohesion. Specifically, given the similarity of Langfred’s
(1998) Group Cohesion x Team Standards hypothesis (i.e., network
density has been previously conceptualized as a measure of
structural cohesion; Hanneman & Riddle, 2005), it was deemed
important to control for group cohesion in order to conclude
that any of the team density effects were unique from the
findings of Langfred (1998). To account for this, both task and
social cohesion measures were created by adapting items from
Carron et al.’s (1985) GEQ cohesion instrument and adding
custom-made items. Task cohesion is defined as an attraction and
unification toward the task, whereas social cohesion is defined
as a general attraction to the group and its members (Castano et
al., 2013; Dion, 2000).
Similar to team standards, intra-class correlations were
calculated in order to assess the degree of within-group
agreement in both task and social cohesion scores. Analyses show
that subjects’ task cohesion responses evidenced substantial
within-group agreement (ICC = .27, p < .001; M = 5.91; SD =
.55). Additionally, subjects’ social cohesion responses also
evidenced within-group agreement, albeit not as substantially,
and was thus also treated as a group-level factor (ICC = .12, p
= .002; M = 6.34; SD = .51) (Bliese, 2000; see Kashy & Kenny,

17
2000 for recommendations on acceptable levels of ICCs). Thus,
both factors were aggregated to the group-level of analysis.
Leader Member Exchange (LMX). Given the integral role of
the supervisor (ACD), the positive effects of LMX on job
performance (Dulebohn, Bommer, Liden, Brouer, & Ferris, 2012)
were controlled for statistically. High LMX relationships are
typically classified as evidencing substantial trust, respect,
and liking between both supervisor and subordinate. Conversely,
low LMX relationships lack in these ostensibly important
relational characteristics (Liden & Maslyn, 1998). To measure
LMX, items were adapted from Graen & Uhl-Bien’s (1995)
recommended LMX scale (items were positioned on 4-point scales).
Because the purpose of this variable was to control for
individual-level perceptions of leader-member relations, this
factor was kept at the individual-level of analysis (M = 3.36;
SD = .59).
Reception of Performance Evaluation. As mentioned above,
ACDs are tasked with formally evaluating their respective RAs’
performance twice a year (once in December, and once in May).
Despite this, the exact time at which RAs receive their
performance evaluations from their ACDs is not held constant
across sub-staffs. Thus, it may be the case that in some sub-
staffs RAs received their performance evaluations in December
(i.e., pre data collection), whereas in other sub-staffs, RAs

18
had yet to receive their performance evaluations before
participating in this study (i.e., post data collection). Given
that these data were collected during the first week of January,
and given that all formal evaluations had yet to be completed,
this created a condition in which some RAs had received their
performance evaluations (n = 125, 63.78%), and others had not.
Depending on the nature of the evaluation (i.e., negative,
neutral, positive), it is not unreasonable to expect the
existence or absence of such an evaluation to impact the number
of connections reported by the subjects, or their reported
levels of self-rated performance. A negative evaluation, for
instance, may either attenuate perceptions of performance
ability, or alter RAs’ advice-seeking patterns. Thus, in order
to control for this potentially confounding factor, a one-item
measure asking subjects if their performance evaluations had
already been received was included in the survey.
Measurement Model
The structural validity of the proposed four-factor model
(i.e., team standards, task cohesion, social cohesion, LMX) was
assessed using confirmatory factor analysis (cf. Hunter, 1980;
Hunter & Gerbing, 1982). Factor loadings were derived using the
centroid method of estimation, and internal consistency and
parallelism theorems were used to generate predicted
correlations for each of the indicators. Items evidencing

19
consistently large residuals were deemed invalid and removed
from the analysis.
Upon removal of items with exceedingly large residuals,
inspection of the root mean squared error term suggested good
model fit (RMSE = .05). Moreover, alpha levels across each of
the four factors suggested good to adequate levels of
reliability. The four-factor model was thus retained. For a full
list of items, factor loadings, means, standard deviations, and
reliability coefficients attributable to each of the four
factors, see Table 1, below.
20
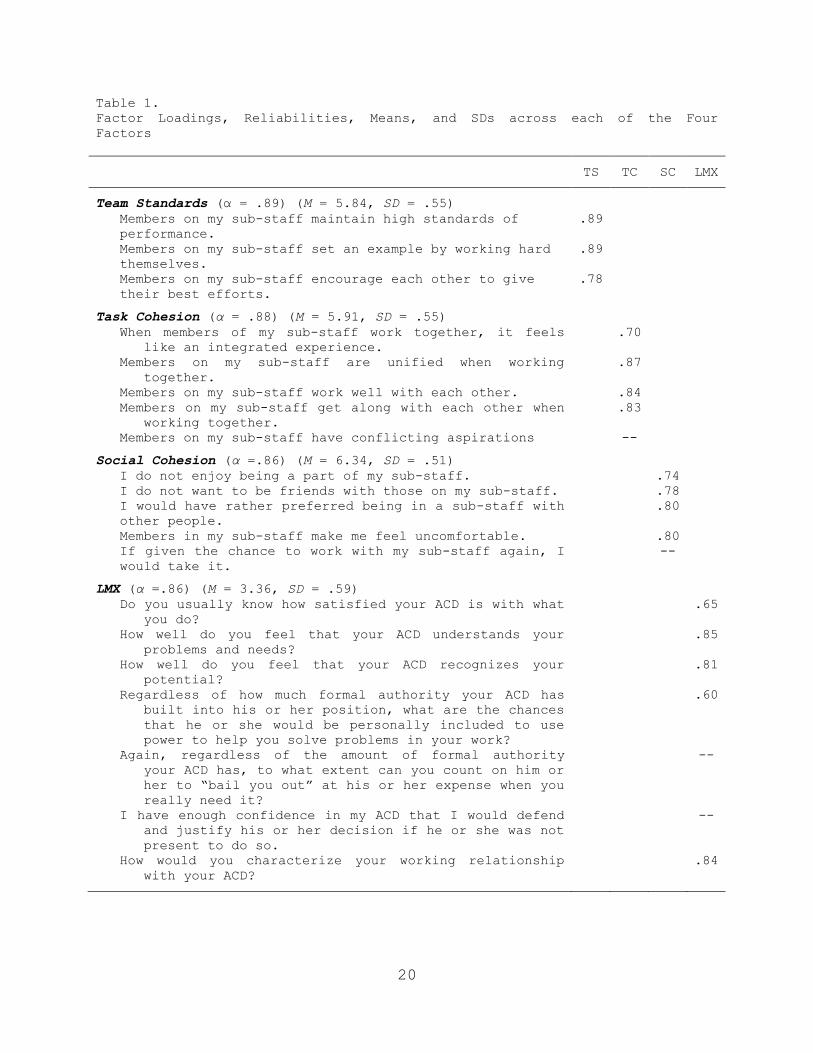
Table 1.
Factor Loadings, Reliabilities, Means, and SDs across each of the Four
Factors
TS TC SC LMX
Team Standards (α = .89) (M = 5.84, SD = .55)
Members on my sub-staff maintain high standards of
performance.
.89
Members on my sub-staff set an example by working hard
themselves.
.89
Members on my sub-staff encourage each other to give
their best efforts.
.78
Task Cohesion (α = .88) (M = 5.91, SD = .55)
When members of my sub-staff work together, it feels
like an integrated experience.
.70
Members on my sub-staff are unified when working
together.
.87
Members on my sub-staff work well with each other. .84
Members on my sub-staff get along with each other when
working together.
.83
Members on my sub-staff have conflicting aspirations --
Social Cohesion (α =.86) (M = 6.34, SD = .51)
I do not enjoy being a part of my sub-staff. .74
I do not want to be friends with those on my sub-staff. .78
I would have rather preferred being in a sub-staff with
other people.
.80
Members in my sub-staff make me feel uncomfortable. .80
If given the chance to work with my sub-staff again, I
would take it.
--
LMX (α =.86) (M = 3.36, SD = .59)
Do you usually know how satisfied your ACD is with what
you do?
.65
How well do you feel that your ACD understands your
problems and needs?
.85
How well do you feel that your ACD recognizes your
potential?
.81
Regardless of how much formal authority your ACD has
built into his or her position, what are the chances
that he or she would be personally included to use
power to help you solve problems in your work?
.60
Again, regardless of the amount of formal authority
your ACD has, to what extent can you count on him or
her to “bail you out” at his or her expense when you
really need it?
--
I have enough confidence in my ACD that I would defend
and justify his or her decision if he or she was not
present to do so.
--
How would you characterize your working relationship
with your ACD?
.84

21
RESULTS
Control Variables
Before conducting any of the main analyses, the effects of
the control variables (task cohesion, social cohesion, LMX,
reception of performance evaluation) on newcomer performance
were assessed using a hierarchical linear model (HLM; Raudenbush
& Bryk, 2002; Singer, 1998; Singer & Willet, 2003). Substantial
group-level effects emerged for task and social cohesion.
Increases in task cohesion predicted increases in newcomer
performance scores, γ = 3.22, z = 1.99, 95% CI [0.05, 6.39].
Moreover, and quite interestingly, increases in social cohesion
predicted substantial decreases in newcomer performance scores,
γ = -3.57, z = -2.21, 95% CI [-6.75, -0.40]. Both of these
variables were thus controlled for statistically when performing
subsequent analyses.
Conversely, LMX and reception of performance evaluation
evidenced trivial effects on newcomer performance, and were thus
dropped from subsequent analyses (Singer & Willet, 2003).
Reception of Performance Evaluation
Whether or not the previous reception of a formal
evaluation altered the amount of reported connections was also
of concern. To assess whether this factor impacted the number of
reported work-related advice-seeking connections, a measure of
out-degree centrality (i.e., reported outward connections;

22
Newman, 2010) was computed for each of the subjects. Analyses
indicated that there was not a substantial difference in the
number of reported outward connections when comparing those that
had received their performance evaluations (M = 10.96, SD =
7.33) to those that had not yet received it (M = 11.60, SD =
7.92), t(308) = .72, p = .48. As such, and in conjunction with
the initial regression model stipulated above, this variable was
no longer considered during analysis.
Hypothesis Testing
In ascertaining the main effects of team density (H1) and
team standards (H2), both variables were added to the previously
stipulated HLM model. Formally,
Newcomer_Performance𝑖𝑗 = π0𝑗 + ε𝑖𝑗
and
π0𝑗 = γ00 + γ01Task Cohesion𝑗 + γ02Social Cohesion𝑗 + γ03Team Density𝑗
+ γ04Team Standards𝑗 + ζ0𝑗
thus leaving us with the combined model of
Newcomer_Performance𝑖𝑗 = γ00
+ γ01
Task Cohesion𝑗 + γ02
Social Cohesion𝑗 +
γ03
Team Density𝑗 + γ04
Team Standards𝑗 + (ε𝑖𝑗 + ζ0𝑗
)
where
ε𝑖𝑗 = within-group residual
ζ0𝑗 = between-group residual
γ00 = grand mean

23
π0𝑗 = group-level mean
γ01 = group-level effect of task cohesion
γ02 = group-level effect of social cohesion
γ03 = group-level effect of team density
γ04 = group-level effect of team standards
Upon running this model, inspection of the residuals for
the stochastic component of the model evidenced substantial
departure from normality. Departures from normality are known to
result in biased second-level standard errors (Maas & Cox,
2004a; 2004b), which affect the accuracy of the confidence
intervals used to assess the fixed effects at Level-2
(Raudenbush & Bryk, 2002). Robust standard errors were thus used
to assess the validity of Hypotheses 1-3, as they are less
affected by this violation (Maas & Cox, 2004a; 2004b).
Hypothesis 1. Counter to expectations, team density emerged
as a substantial negative predictor of newcomer performance (γ =
-1.67, z = -1.85, 95% CI [-3.46, 0.10]). Explicitly, increases
in team density were associated with decreases in newcomer
performance. Thus, despite the emergence of a substantial
effect, the proposed positive effects of team density (H1)
failed to receive statistical support.
Hypothesis 2. In terms of team standards, although the
effect appears somewhat negative (γ = -1.34, z = -0.98, 95% CI

24
[-4.02, 1.34]), the confidence interval is quite wide, thus
indicating that the effect is decidedly weak and potentially due
to sampling error. Thus, team standards did not have a
substantial direct effect on newcomer performance. As such, H2
also failed to receive statistical support.
Hypothesis 3. To assess the validity of H3, an interaction
term, which was designated as the multiplicative term between
team density and team standards, was added to the previously
stipulated model. Formally,
Newcomer_Performance𝑖𝑗
= γ00
+ γ01
Task Cohesion𝑗 + γ02
Social Cohesion𝑗 + γ03
Team Density𝑗
+ γ04
Team Standards𝑗 + γ05
Team Density𝑗 × Team Standards𝑗 + (ε𝑖𝑗 + ζ0𝑖
)
where
γ05
Team Density𝑗 × Team Standards𝑗 = the group-level interaction effect
between team density and team standards
This model produced an interaction estimate in the
predicted direction (γ = 1.24, z = 0.95, 95% CI [-1.33, 3.81]),
but, given the small group-level N, also included 0 in its
confidence interval. To visualize this effect, the regression
equation was modeled at +1, 0, and -1 SD of team standard’s
mean. As is shown in Figure 3, newcomer performance appears
lowest when team density is high and team standards are low.
Conversely, when team density is high and team standards are
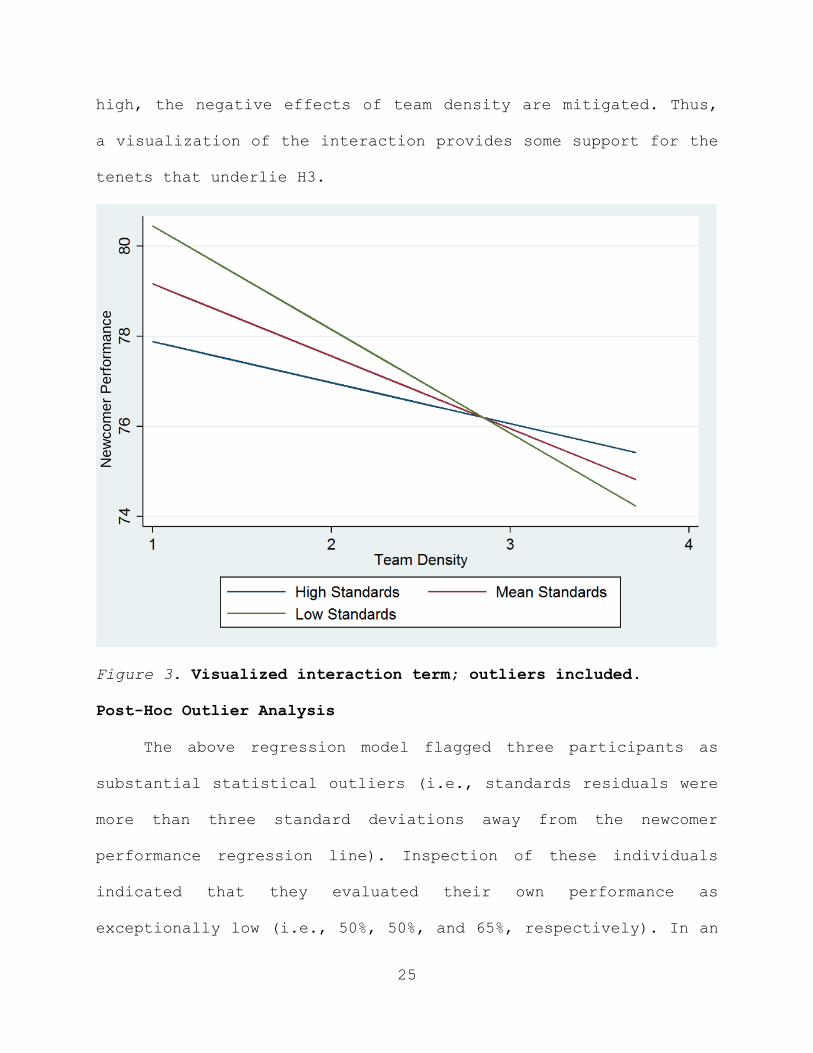
25
high, the negative effects of team density are mitigated. Thus,
a visualization of the interaction provides some support for the
tenets that underlie H3.
Figure 3. Visualized interaction term; outliers included.
Post-Hoc Outlier Analysis
The above regression model flagged three participants as
substantial statistical outliers (i.e., standards residuals were
more than three standard deviations away from the newcomer
performance regression line). Inspection of these individuals
indicated that they evaluated their own performance as
exceptionally low (i.e., 50%, 50%, and 65%, respectively). In an
Ne
wco
me
r P
erf
orm
ance

26
attempt to assess whether these outliers altered the previously
reported conclusions, these individuals were excluded and the
regression models were re-run.
The negative effect of team density (H1) remained negative
and became substantial, γ = -2.67, z = -3.86, 95% CI [-4.03, -
1.31]. Moreover, the insignificant effects of team standards
(H2) became substantially weaker, γ = -.11, z = -0.09, 95% CI [-
2.55, 2.33], thus corroborating the notion that team standards
had little to no direct effect on newcomer performance.
Lastly, and perhaps most importantly, removal of the
outliers negated the interaction effect reported above, γ = -
.24, z = -0.24, 95% CI [-2.24, 1.75]. This occurred because the
three outliers reported high levels of team standards and low
levels of team density, thus making the high standards
regression line appear comparatively less steep than the low
standards regression line (i.e., artificial non-additivity). As
such, upon removal of the outliers, H3 also failed to receive
any statistical support.
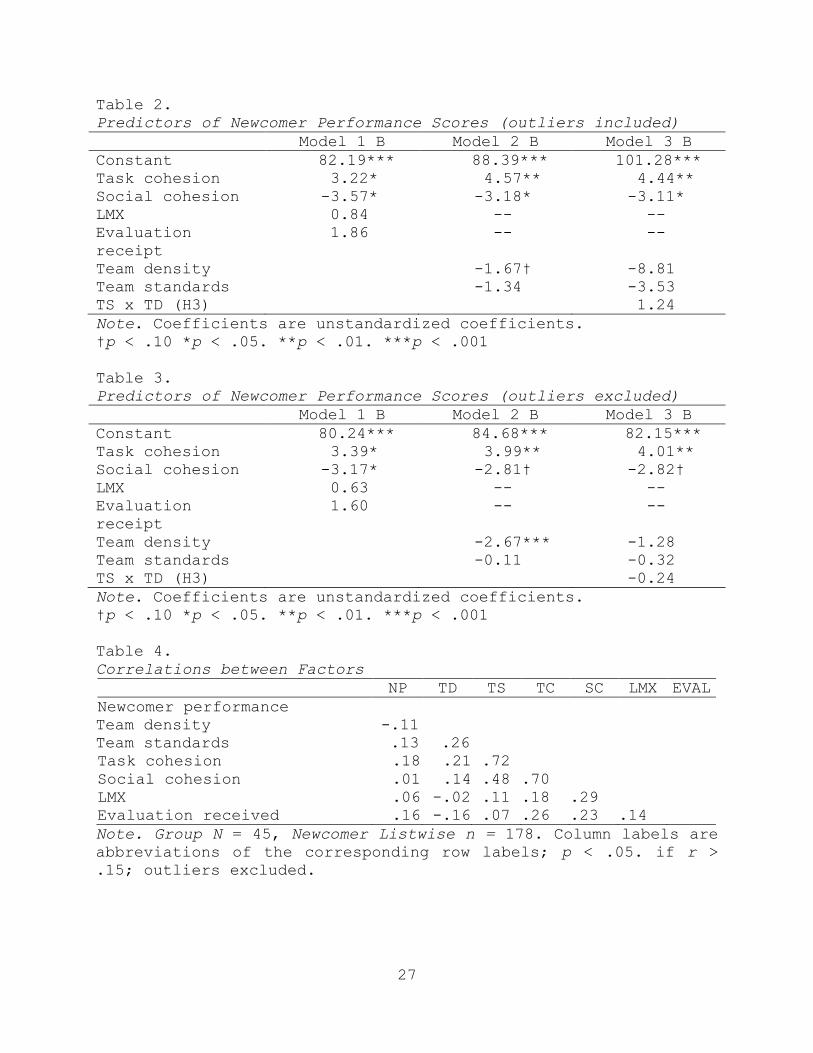
The coefficients attributable to each of the three
multilevel regression models are found in Tables 2 (outliers
included) and 3 (outliers removed). Moreover, correlation
coefficients for each of the factors are reported in Table 4.
27
Table 2.
Predictors of Newcomer Performance Scores (outliers included)
Model 1 B Model 2 B Model 3 B
Constant 82.19*** 88.39*** 101.28***
Task cohesion 3.22* 4.57** 4.44**
Social cohesion -3.57* -3.18* -3.11*
LMX 0.84 -- --
Evaluation
receipt
1.86 -- --
Team density -1.67† -8.81
Team standards -1.34 -3.53
TS x TD (H3) 1.24
Note. Coefficients are unstandardized coefficients.
†p < .10 *p < .05. **p < .01. ***p < .001
Table 3.
Predictors of Newcomer Performance Scores (outliers excluded)
Model 1 B Model 2 B Model 3 B
Constant 80.24*** 84.68*** 82.15***
Task cohesion 3.39* 3.99** 4.01**
Social cohesion -3.17* -2.81† -2.82†
LMX 0.63 -- --
Evaluation
receipt
1.60 -- --
Team density -2.67*** -1.28
Team standards -0.11 -0.32
TS x TD (H3) -0.24
Note. Coefficients are unstandardized coefficients.
†p < .10 *p < .05. **p < .01. ***p < .001
Table 4.
Correlations between Factors
NP TD TS TC SC LMX EVAL
Newcomer performance
Team density -.11
Team standards .13 .26
Task cohesion .18 .21 .72
Social cohesion .01 .14 .48 .70
LMX .06 -.02 .11 .18 .29
Evaluation received .16 -.16 .07 .26 .23 .14
Note. Group N = 45, Newcomer Listwise n = 178. Column labels are
abbreviations of the corresponding row labels; p < .05. if r >
.15; outliers excluded.

28
DISCUSSION
Analyses suggest that team density had a negative effect on
newcomer performance, whereas team standards had a negligible
effect on newcomer performance. Moreover, these effects remained
consistent despite excluding the three outliers.
The exclusion of the three outliers, however, did impact
the substantive conclusions regarding H3. The predicted
interaction effect received partial support when the outliers
were included in the analyses, but failed to receive any
statistical support when they were excluded. This means one of
two things: (1) the newcomers flagged as outliers were true
outliers and thus produced artificial non-additivity, or (2) a
larger sample with additional low-performing newcomers would
negate the outlier status of the three outliers and thus clarify
the nature of the proposed interaction effect (H3). In either
case, it is evident that additional research is required.
Despite failing to find statistical support for all three
hypotheses, the results and nature of this study shed light on
newcomer socialization experiences. Specifically, the previously
unexplored concepts of team density (structural cohesion) and
standards were integrated into the socialization corpus, which
differs markedly from past studies in which scholars have
instead focused on assessing the impact of organizational
context (Van Maanen & Schein, 1979), informational content (Chao

29
et al., 1994), and memorable messages (Stohl, 1986). The main
difference lies in the locus of analysis, which has
traditionally been focused at the individual-level. Thus,
whereas past studies have focused on the impact of individual-
level predictors, this study instead examined how group-level
phenomena (e.g., team standards) and structural variables (team
density) impacted newcomer performance. As such, an overarching
framework is provided in which the influence of peer-level
interactions (Jablin, 2001) and multilevel organizational
structure (Monge & Contrator, 2003) are now assessable within
the context of newcomer socialization (Bauer & Erdogan, 2014).
This study is also unique from previous newcomer
socialization works in which the impact of myriad structural
variables were investigated. Past work has examined the impact
of ego-network densities (Jokisaari, 2013; Jokisaari & Vuori,
2014; Morrison, 2002), which is an individual-level property and
thus different from team-level density, which is a group-level
variable. Doing so forced the differentiation between personal
and team-level networks, which are conceptually different and
thus hold the potential to have different effects (Kozlowski &
Klein, 2000). Future research may attempt to conduct newcomer
socialization research in which both networks are accounted for,
thus allowing for the comparison of both types of networks.

30
Team density was further distinguished from measures of
psychological cohesion (task and social cohesion), which was
important given that the different types of cohesion evidenced
disparate effects. The effects of task cohesion on newcomer
performance, for instance, were positive, but the effects of
team density (structural cohesion) and social cohesion were
negative. Using measures of structural and psychological
cohesion interchangeably should thus be implemented with
caution, as their effects appear non-parallel (Dion, 2000).
Team Density
The negative team density effect contradicts the findings
found in Balkundi and Harrison’s (2006) meta-analysis, which
produced a positive effect between team density and team
performance. One may attempt to account for this unexpected
finding by considering the RA role, which one may argue is
primarily independent. When roles are independent, team density
may thus hamper, as oppose to foster, effective role
performance. To wit, if RAs are forced to work in teams despite
having independent roles, higher levels of density may mean that
RAs are not spending enough time performing their duties. This
information may be especially pertinent to RA administrators, as
they, in this instance, have appeared to force the creation of
teams that may be directly responsible for stifling the
performance of their employees.

31
Future investigations of this ilk may make great use of RA
teams, as they present a considerable advantage in that they are
primarily composed of independent members (a rare occurrence;
cf. Kozlowski & Bell, 2012). In conjunction with assessing the
impact of team density on other similar groups (e.g., faculty
departments), similar evidence in line with what was produced
here may emerge, and thus begin to illume the presence of
important moderators that account for variance in the team
density team performance relationship (cf. Hunter & Schmidt,
2004).
Considering the nature of the network tie (i.e., advice-
seeking ties) may also help explain the negative team density
effect. In particular, members that spend great amounts of time
seeking advice from others may be doing so because they believe
that they are not performing their jobs well. Given that
performance was measured using a one-item self-evaluation
measure, this explanation is also quite sensible.
Team Standards
This study revisited the role of team standards, a concept
which has been long forgotten and essentially neglected in
newcomer socialization research (see Roethlisberger & Dickson,
1939; Taylor, 1914). Despite predicting a strong positive effect
on newcomer performance, the HLM revealed that team standards
had a trivial effect on newcomer performance after controlling

32
Figure 4. Post-hoc hypothesis and finding, in which team
standards has a small indirect effect on newcomer performance (N
= 45); outliers excluded.
for both task and social cohesion. This is not to say, however,
that team standards do not play a critical role in the eventual
performance of newcomers. Strong team standards, for instance,
may be essential to establishing strong levels of task cohesion
(Hoigaard, Safvenbom, & Tonnessen, 2006), which then impact
newcomer performance (Castano et al., 2013). Inspection of the
correlation matrix provides some support for this initial
conjecture. Indeed, a simple causal model in which team
standards predict task cohesion, which then predicts newcomer
performance, fits the data quite well (see Figure 4).
Future research that attempts to evaluate the tenability of
this post-hoc hypothesis may begin to shed light on the proposed
effects of team standards. In doing so, RA administrators (as
well as other organizational executives) may use this
Team
Standards Task Cohesion
Newcomer
Performance
.72 .17
.10

33
information to generate team compositions in which a predominant
proportion of members have high standards of performance (cf.
Bell, 2007).
Researchers might also begin to address other aspects
pertinent to the study of team standards and newcomer
socialization. For example, future research may attempt to focus
precisely on from whom the newcomer is gleaning normative
information. In this study, newcomers were able to indicate that
they sought advice from both peers and supervisors. It may be,
however, that some newcomers place greater value on information
received from peers (Ostroff & Kozlowski, 1993), whereas others
place greater value on information received from supervisors
(cf. Ostroff & Kozlowski, 1992). Under circumstances in which
the standards of peers differ from supervisorial standards,
divisive faultlines may divide the team in two, which may allow
for divergent standards of performance to exist concurrently
within a single team (Lau & Murnighan, 1998; Taylor, 1914). When
these scenarios arise, exactly whom the newcomer retrieves
information from, or precisely why one acclimates to one sub-
group over another, remains an interesting question.
Differentiating between different measures of density-like
constructs (e.g., constraint, Hanneman & Riddle, 2005), as well
as slightly different conceptualizations of the network density
idea (e.g., ego-network density), may also help shed additional

34
light on the negligible team standards effect. For instance, and
as noted above, ego-network density does not focus on the team,
but rather focuses on the member’s personal network (e.g.,
Jokisaari & Vuori, 2014; Morrison, 2002). Thus, researchers must
contend not only with the standards of a newcomer’s specific
team (team-level variable), but also with the standards of the
newcomer’s own personal network (individual-level variable).
This distinction is an interesting one to make, as it suggests
that some newcomers may retrieve normative information from
members on their team, whereas others may retrieve normative
information from members deemed external to their team (or
both). Ultimately, it may be that normative information culled
from a members preferred network acts as the main predictor of
their eventual behavior.
Finally, exactly how normative standards are conveyed to
newcomers remains unclear, and will likely illume the processes
by which both team standards and team density operate. Normative
constraint to performance standards, for instance, can occur
because (a) members explicitly communicate normative information
to the newcomer (injunctive influence) (Hackman, 1992), or
because (b) newcomers simply observe the normative behaviors of
others over time (descriptive influence) (Miller & Jablin,
1991). The effects of standards may thus operate via injunctive
or descriptive influence (or both), which raises the possibility

35
of different effects (cf. Lapinski & Rimal, 2005). Understanding
which of these normative influences impacts newcomer behavior
will be integral to understanding how both team standards and
team density operate during newcomer socialization.
Limitations
The ranges in scores of the three main variables (i.e.,
team density, team standards, newcomer performance) were
restricted to either high or low levels, and were skewed either
positively or negatively. This claim is based on the comparison
made between observed and maximum possible variances, as well as
the skewness statistics produced in the analysis. Given that
team density (skewness = .90; SE = .35) and team standards
(skewness = -.64; SE = .35) scales were positioned on 1-7 point
scales, maximum SD was roughly 3. On the other hand, observed
SDs for team density and team standards were .52 and .55,
respectively. Moreover, given that newcomer performance
(skewness = -1.16; SE = .17) was measured on a 0-100 point
scale, maximum SD was roughly 50, whereas observed SD for
newcomer performance was 7.58.
The restriction of both team standards and newcomer
performance to high levels is likely due to the ego-centric bias
(i.e., consistent overestimation of performance levels and
standards; Harris & Schaubroek, 1988). Future research can
assuage this limitation by having outsiders rate both levels of

36
newcomer performance and team standards (or, when applicable,
utilizing objective measures of performance and standards).
Newcomers’ peers and colleagues, for instance, may be able to
provide reliable estimates of how well newcomers are performing.
Additionally, ratings from multiple top executives/managers may
be able to provide more objective ratings of team standards.
This approach may help increase variance in both newcomer
performance and team standards scores (cf. Hunter & Schmidt,
2004), and thus reduce the risk of attenuating coefficients.
Replicating these results with alternative measures of
newcomer performance will be particularly important, as past
meta-analyses have shown that self-evaluations do not correlate
highly with the ratings of others (Conway & Huffcut, 1997;
Harris & Schaubroek, 1988; Heidemeier & Moser, 2009). If it is
the case that self- and other-ratings do not correlate highly,
then alternative measures of newcomer performance might yield
different results. The use of self-ratings is an obvious
limitation here, which, as similarly recommended above, could be
allayed by implementing other, more objective measures of
newcomer performance. Subsequent empirical attempts would also
benefit from using measures with multiple indicators of newcomer
performance (as opposed to a one-item measure), as this would
contribute to reliability, and thus attenuate measurement error
(Nunnally, Bernstein, & Berge, 1967).

37
Despite the limitation of the one-item performance measure,
it is important keep in mind that the sine qua non of
measurement is validity. To wit, the optimal measurement of
newcomer performance will depend on how accurately the construct
of newcomer performance is represented. Thus, the focus is not
so much on how much agreement there exists between self- versus
other-ratings (e.g., Atwater, Ostroff, Yammarino, & Fleenor,
1998), but rather on which of the two is deemed the most valid
approximation of performance. Given the nature of RA work, one
might question the validity of evaluations that come from others
that do not see them perform (ACDs). Indeed, given the somewhat
independent nature of the RA role, RAs’ self-evaluations of
their performance may be better indicators of their true
performance scores than others’ evaluations. As such,
researchers should consider the possibility that self-
evaluations are better indicators of performance in some
instances, but poorer indicators in others. Ultimately, the
nature of the member’s role, as well as the team’s level of
task-interdependency, will likely guide this question.
The substantive reason responsible for restriction in team
density scores raises both interesting and potentially fruitful
exploratory questions. Specifically, the author is unable to
think of any immediate psychological reason that might
parsimoniously explain why responses about advice-seeking

38
activity would be biased in any specific direction. Instead,
restriction in team density scores may be due to a previously
raised issue: for some teams, team density is not a property
considered integral to the effectiveness of its members. To wit,
if it is to be argued that RAs are primarily independent during
task completion, then it follows that the formation of compact
teams would presumably be stifled. Moreover, if density is not a
property essential to fostering both team and newcomer
performance, then introducing this property without any
additional, beneficial properties may foster, as opposed to
mitigate, lower levels of newcomer performance.

39
CONCLUSION
It should be clear to the reader that future investigations
of this ilk will undoubtedly need to rely on the theoretical
underpinnings offered by both multilevel theory and the social
network approach. In this study, for instance, density was
conceptualized as a team-level factor. Consider, however, that
the inclusion of ego-network density forces the consideration of
density as an individual-level property, and thus the
consideration of multilevel relationships. Moreover, these
complex relationships are further expounded when variables at
higher (or lower) levels of analysis are added to one’s
conceptual model (e.g., departments at a higher level; time at a
lower level). Indeed, as these rich theoretical notions begin to
creep into newcomer socialization research (cf. Manata et al.,
2013), multilevel aspects of organizational networks will
undoubtedly force this type of theoretical thinking (Borgatti et
al., 2009; Kozlowski & Bell, 2012).
It should be recognized, however, that the implementation
of these two approaches leaves us with the uncomfortable notion
that newcomer success is in part a function of factors that one
has little control over. For instance, given the negative
effects of team density evidenced here, one is left with the
question: do newcomers (or organizations) have the ability to
change extant team network patterns? Indeed, being able to

40
accomplish this task constitutes a formidable challenge and thus
seems unlikely. Specifically, such a drastic change would
require either (a) complete overhauls in personnel (Schneider,
1987), or (b) a change in team structure or patterns of
operation (e.g., Barker, 1993). Newcomers are unlikely to
accomplish either of these on their own, especially as they
attempt to acclimate to organizational values, norms, and
beliefs.

41
APPENDIX

42
APPENDIX: Survey Instrument
RA NETWORK STUDY
Name_____________________________
Last Six Digits of your PID_____________________

43
1. What is your position within the RA network?
a. Resident Assistant
b. Assistant Community Director
c. Community Director
2. Roughly how long (in months) have you worked in your position?
a. ____________________________
3. Are you returning to your sub-staff this year, or are you new to your sub-
staff?
a. I am a returning RA/member
b. I am a first-year RA/member
4. What is your sex? (circle one) Male / Female
5. What is your age in years? ____________________ years
6. What year are you in school? (circle one)
a. 1st year (Freshman)
b. 2nd year (Sophomore)
c. 3rd year (Junior)
d. 4+ years (Senior)
e. Graduate Student (M.A. or Ph.D.)
7. Please indicate your ethnicity by placing a checkmark next to one (or
more):
____ African
____ Black/African American
____ Asian
____ Hispanic
____ Caucasian/White
____ Indian sub-continent
____ Latino/Latina
____ Middle-Eastern
____ Multi
____ Native American/First Nation
____ Pacific Islander/Native Hawaiian
____ Other
8. Have you already received your December performance evaluations from your ACD?
a. NO, I have not received my December performance evaluations from my ACD
b. YES, I have received my December performance evaluations from my ACD

44
Below you will find a list of RAs that are in your sub-staff (ACD included). If, between weekly staff
meetings, you seek advice from and communicate with any of these individuals about work-related issues,
place an X next to their names and indicate how frequently these communicative interactions occur. Everyone
on this list could receive an X, or no one could receive an X. Please ignore your own name.
1. [insert member name here] _____ a. How frequently do you seek advice about work-related information from this individual?
Less Than Once a Week 1 2 3 4 5 6 7 Several Times a Day
2. [insert member name here] _____
a. How frequently do you seek advice about work-related information from this individual?
Less Than Once a Week 1 2 3 4 5 6 7 Several Times a Day
3. [insert member name here] _____
a. How frequently do you seek advice about work-related information from this individual?
Less Than Once a Week 1 2 3 4 5 6 7 Several Times a Day
4. [insert member name here] _____
a. How frequently do you seek advice about work-related information from this individual?
Less Than Once a Week 1 2 3 4 5 6 7 Several Times a Day
5. [insert member name here] _____
a. How frequently do you seek advice about work-related information from this individual?
Less Than Once a Week 1 2 3 4 5 6 7 Several Times a Day
6. [insert member name here] _____
a. How frequently do you seek advice about work-related information from this individual?
Less Than Once a Week 1 2 3 4 5 6 7 Several Times a Day
7. [insert member name here] _____
a. How frequently do you seek advice about work-related information from this individual?
Less Than Once a Week 1 2 3 4 5 6 7 Several Times a Day

45
8. [insert member name here] _____
a. How frequently do you seek advice about work-related information from this individual?
Less Than Once a Week 1 2 3 4 5 6 7 Several Times a Day
9. [insert member name here] _____
a. How frequently do you seek advice from about work-related information from this individual?
Less Than Once a Week 1 2 3 4 5 6 7 Several Times a Day

46
When answering these next questions about your sub-staff, consider the REHS performance evaluation
categories:
Genuine Connections w/ Residents
Developing Community
Safety & Security
Educator
Team Player
Leader
Administrator
1. Members on my sub-staff maintain high standards of performance.
Strongly Disagree 1 2 3 4 5 6 7 Strongly Agree
2. Members on my sub-staff set an example by working hard themselves.
Strongly Disagree 1 2 3 4 5 6 7 Strongly Agree
3. Members on my sub-staff encourage each other to give their best efforts.
Strongly Disagree 1 2 3 4 5 6 7 Strongly Agree
4. Of the performance feedback I have received thus far, I think my ACD is a harsh evaluator.
Strongly Disagree 1 2 3 4 5 6 7 Strongly Agree
5. When members on my sub-staff work together, it feels like an integrated experience.
Strongly Disagree 1 2 3 4 5 6 7 Strongly Agree
6. Members on my sub-staff are unified when working together.
Strongly Disagree 1 2 3 4 5 6 7 Strongly Agree
7. Members on my sub-staff work well with each other.
Strongly Disagree 1 2 3 4 5 6 7 Strongly Agree
8. Members on my sub-staff get along with each other when working together.
Strongly Disagree 1 2 3 4 5 6 7 Strongly Agree

47
9. Members on my sub-staff have conflicting aspirations for the sub-staff’s performance.
Strongly Disagree 1 2 3 4 5 6 7 Strongly Agree
10. I do not enjoy being a part of my sub-staff.
Strongly Disagree 1 2 3 4 5 6 7 Strongly Agree
11. I do not want to be friends with those on my sub-staff.
Strongly Disagree 1 2 3 4 5 6 7 Strongly Agree
12. I would have rather preferred being in a sub-staff with other people.
Strongly Disagree 1 2 3 4 5 6 7 Strongly Agree
13. Members in my sub-staff make me feel uncomfortable.
Strongly Disagree 1 2 3 4 5 6 7 Strongly Agree
14. If given the chance to work with my sub-staff again, I would take it.
Strongly Disagree 1 2 3 4 5 6 7 Strongly Agree
Instructions: The following question asks you to think about and rate the performance quality of RAs in
your sub-staff. It is important that you respond to this question honestly, being as accurate as possible.
Please the question carefully and write your numerical response in the space provided after the question
text. As noted in the question text, rate the RA’s performance quality using a percentage-based scale that
ranges from 0-100%. Please round your response to the nearest whole number (i.e., you may use any integer
between 0-100, e.g., 79 or 82, do not use decimals).
1. If I were to rate my personal performance as an RA on a scale that ranges from 0% (low quality) to 100%
(high quality), I would rate my own performance as:
My personal performance: ___________ %

48
THE FOLLOWING QUESTIONS ARE FOR RAS ONLY. ACDs: do not answer these questions.
1. Do you usually know how satisfied your ACD is with what you do? a. Never know where I stand b. Seldom know where I stand c. Usually know where I stand d. Always know where I stand
2. How well do you feel that your ACD understands your problems and needs? a. Not at all b. Some but not enough c. As much as the next person d. Fully
3. How well do you feel that your ACD recognizes your potential? a. Not at all b. Some but not enough c. As much as the next person d. Fully
4. Regardless of how much formal authority your ACD has built into his or her position, what are the chances that he or she would be personally inclined to use power to help you solve problems in your
work?
a. No chance b. Might or might not c. Probably would d. Certainly would
5. Again, regardless of the amount of formal authority your ACD has, to what extent can you count on him or her to ‘‘bail you out’’ at his or her expense when you really need it?
a. No chance b. Might or might not c. Probably would d. Certainly would

49
6. I have enough confidence in my ACD that I would defend and justify his or her decisions if he or she were not present to do so.
a. Probably not b. Maybe c. Probably would d. Certainly would
7. How would you characterize your working relationship with your ACD?
a. Less than average b. About average c. Better than average
d. Extremely effective

50
REFERENCES

51
REFERENCES
Atwater, L. E., Ostroff, C., Yammarino, F. J., & Fleenor, J. W.
(1998). Self-other agreement: does it really matter?
Personnel Psychology, 51, 577-598.
Barker, J. R. (1993). Tightening the iron cage: Concertive
control in self-managing teams. Administrative Science
Quarterly, 38, 408-437.
Balkundi, P., & Harrison, D. A. (2006). Ties, leaders, and time
in teams: Strong inference about network structure’s
effects on team viability and performance. Academy of
Management Journal, 49, 49-68.
Bauer, T. N., Bodner, T., Erdogan, B., Truxillo, D. M., &
Tucker, J. (2007). Newcomer adjustment during
organizational socialization: A meta-analytic review of
antecedents, outcomes, and methods. Journal of Applied
Psychology, 3, 707-721.
Bauer, T. N., & Erdogan, B. (2014). Delineating and reviewing
the role of newcomer capital in organizational
socialization. Annual Review of Organizational Psychology
and Organizational Behavior, 1, 439-457.
Bell, S. T. (2007). Deep-level composition variables as
predictors of team performance: A meta-analysis. Journal of
Applied Psychology, 92, 595-615.
Bizzi, L. (2013). The dark side of structural holes: A
multilevel investigation. Journal of Management, 39, 1554-
1578.
Bliese, P. (2000). Within-group agreement, non-independence, and
reliability: Implications for data aggregation and
analysis. In K. J. Klein & S. W. J. Kozlowski (Eds.),
Multilevel theory, research and methods in organizations
(pp. 349-381). San Francisco, CA: Jossey-Bass.
Borgatti, S. P., Everett, M., & Freeman, L. (2002). UCINET for
Windows: Software for social network analysis. Analytic
Technologies, Harvard, MA.
52
Borgatti, S. P., Mehra, A., Brass, D. J., & Labianca, G. (2009).
Network analysis in the social sciences. Science, 323, 892-
895.
Burgoon, J. K. (1978). A communication model of personal space
violations: Explication and an initial test. Human
Communication Research, 4, 129-142.
Burt, R. S. (2000). The network structure of social capital.
Research in organizational behavior, 22, 345-423.
Burt, R. S. (2001). Structural holes versus network closure as
social capital. Social capital: Theory and research, 31-56.
Butts, C. T. (2009). Revisiting the foundations of network
analysis. Science, 325, 414-416.
Carron, A. V., Widmeyer, W. N., & Brawley, L. R. (1985). The
development of an instrument to assess cohesion in sports
teams: The group environment questionnaire. Journal of
Sport Psychology, 7, 244-266.
Castano, N., Watts, T., & Tekleab, A. G. (2013). A reexamination
of the cohesion-performance relationship meta-analysis: A
comprehensive approach. Group dynamics: Theory, research,
and practice, 17, 207-231.
Centola, D. (2010). The spread of behavior in an online social
network experiment. Science, 329, 1194-1197.
Chao, G. T. (2012). Organizational socialization: Background,
basics, and blueprint for adjustment at work. In S. W. J.
Kozlowski (Ed.), The Oxford Handbook of Organizational
Psychology (pp. 579-614). New York: Oxford University
Press.
Chao, G. T., O’Leary-Kelly, A. M., Wolf, S., Klein, H. J., &
Gardner, P. D. (1994). Organizational socialization: Its
content and consequences. Journal of Applied Psychology,
79, 730-743.
Chen, G. (2005). Newcomer adaptation in teams: Multilevel
antecedents and outcomes. Academy of Management Journal,
48, 101-116.

53
Chen, G., & Klimoski, R. J. (2003). The impact of expectations
on newcomer performance in teams as mediated by work
characteristics, social exchanges, and empowerment. Academy
of Management Journal, 46, 591-607.
Cohen, S. G., & Bailey, D. E. (1997). What makes teams work:
Group effectiveness research from the shop floor to the
executive suite. Journal of Management, 23, 239-290.
Coleman, J. S. (1988). Social capital in the creation of human
capital. American Journal of Sociology, 94, 95-120.
Contractor, N. S., Wasserman, S., & Faust, K. (2006). Testing
multitheoretical, multilevel hypotheses about
organizational networks: An analytic framework and
empirical example. Academy of Management Review, 31, 681-
703.
Conway, J. M., & Huffcuttt, A. I. (1997) Psychometric properties
of multisource performance ratings: A meta-analysis of
subordinate, supervisor, peer, and self-ratings. Human
Performance, 10, 331-360.
Crawford, E. R., & Lepine, J. A. (2013). A configural theory of
team processes: Accounting for the structure of taskwork
and teamwork. Academy of Management Review, 38, 32-48.
de la Haye, K., Robins, G., Mohr, P., Wilson, C. (2013).
Adolescents’ intake of junk food: Processes and mechanisms
driving consumption similarities among friends. Journal of
Research on Adolescence, 23, 524-536.
Dion, K. L. (2000). Group cohesion: From “field of forces” to
multidimensional construct. Group dynamics: Theory,
research, and practice, 4, 7-26.
Dulebohn, J. H., Bommer, W. H., Liden, R. C., Brouer, R. L., &
Ferris, G. R. (2012). A meta-analysis of antecedents and
consequences of leader-member exchange: Integrating the
past with an eye towards the future. Journal of Management,
38, 1715-1759.
Friedkin, N. E. (1984). Structural cohesion and equivalence
explanations of social homogeneity. Sociological Methods &
Research, 12, 235-261.

54
Fulk, J. (1993). Social construction of communication
technology. Academy of Management Journal, 36, 921-950.
Gibson, M. K., & Papa, M. J. (2000). The mud, the blood, and the
beer guys: Organizational osmosis in blue-collar work
groups. Journal of Applied Communication Research, 28, 68-
88.
Glynn, C. J., Huge, M. E. (2007). Opinion as norms: Applying a
return potential model to the study of communication
behaviors. Communication Research, 34, 548-568.
Graen, G. B., & Uhl-Bien, M. (1995). Relationship-based approach
to leadership: Development of leader-member exchange (LMX)
theory of leadership over 25 years: Applying a multi-level
multi-domain perspective. Leadership Quarterly, 6, 219-247.
Hackman, R. J. (1992). Group influence on individuals in
organizations. In M. D. Dunnette, & L. M. Houghs (Eds.),
Handbook of industrial and organizational psychology (pp.
199-267). Palo Alto, CA: Consulting Psychologists Press,
Inc.
Hanneman, R. A., & Riddle, M. (2005). Introduction to social
network methods. Riverside, CA: University of California,
Riverside.
Harris, M. M., & Schaubroek, J. (1988). A meta-analysis of self-
supervisor, self-peer, and peer-supervisor ratings.
Personnel Psychology, 41, 43-62.
Heidemeier, H., & Moser, K. (2009). Self-other agreement in job
performance ratings: A meta-analytic test of a process
model. Journal of Applied Psychology, 92, 353-370.
Hoigaard, R., Safvenbom, R., & Tonnessen, F. E. (2006). The
relationship between group cohesion, group norms, and
perceived social loafing in soccer teams. Small Group
Research, 37, 217-232.
Hunter, J. E. (1980). Factor analysis. In P. Monge (Ed.),
Multivariate techniques in human communication research.
New York: Academic Press.
Hunter, J. E., & Gerbing, D. W. (1982). Unidimensional
measurement, second order factor analysis, and causal
models. Research in Organizational Behavior, 4, 267-320.

55
Hunter, J. E., & Schmidt, F. L. (2004). Methods of meta-
analysis: Correctign error and bias in research findings.
Sage.
Jablin, F. M. (2001). Organizational entry, assimilation, and
disengagement/exit. In F. M. Jablin, & L. Putnam (Eds.),
The new handbook of organizational communication: Advances
in theory, research, and methods (pp. 732-818). Thousand
Oaks, CA: Sage.
Jackson, J. (1966). A conceptual and measurement model for norms
and roles. The Pacific Sociological Review, 9, 35-47.
Jackson, J. (1975). Normative power and conflict potential.
Sociological Methods & Research, 4, 237-263.
Jokisaari, M. (2013). The role of leader-member and social
network relations in newcomers’ role performance. Journal
of Vocational Behavior, 82, 96-104.
Jokisaari, M., & Nurmi, J-E. (2012). Getting the right
connections? The consequences and antecedents of social
networks in newcomer socialization. In C. R. Wanberg (Ed.),
The Oxford Handbook of Organizational Socialization (pp.
78-96). Oxford University Press.
Jokisaari, M., & Vuori, J. (2014). Joint effects of social
networks and information giving on innovative performance
after organizational entry. Journal of Vocational Behavior,
85, 352-360.
Jones, G. R. (1984). Task visibility, free riding, and shirking:
Explaining the effect of structure and technology on
employee behavior. Academy of Management Review, 9, 684-
695.
Jones, G. R. (1986). Socialization tactics, self-efficacy, and
newcomers’ adjustments to organizations. Academy of
Management Journal, 29, 262-279.
Kashy, D. A., & Kenny, D. A. (2000). The analysis of data from
dyads and groups. Handbook of research methods in social
and personality psychology, 451-477.

56
Katzenbach, J. R., & Smith, D. K. (1993). The wisdom of teams:
Creating the high-performance organization. Boston, MA:
Harvard Business School Press.
Kim, M.-S., & Hunter, J. E. (1993). Relationships among
attitudes, behavioral intentions, and behavior: A meta-
analysis of past research, part 2. Communication Research,
20, 331-364.
Kozlowski, S. W. J. (2012). Groups and teams in organizations:
Studying the multilevel dynamics of emergence. In A. B.
Hollingshead & M. S. Poole (Eds.), Research methods for
studying groups and teams: A guide to approaches, tools,
and technologies (pp. 260-283). New York, NY: Routledge.
Kozlowski, S. W. J., & Bell, B. S. (2012). Work groups and teams
in organizations: Review update. In N. Schmitt & S.
Highhouse (Eds.), Handbook of psychology: Industrial and
organizational psychology (Vol. 12, 2nd Ed). London: Wiley.
Kozlowski, S. W. J., & Ilgen, D. R. (2006). Enhancing the
effectiveness of work groups and teams. Psychological
Science in the Public Interest, 7, 77-124.
Kozlowski, S. W. J., & Klein, K. J. (2000). A multilevel
approach to theory and research in organizations:
Contextual, temporal, and emergent processes. In K. J.
Klein & S. W. J. Kozlowski (Eds.), Multilevel theory,
research and methods in organizations: Foundations,
extensions, and new directions (pp. 3-90). San Francisco,
CA: Jossey-Bass.
Kramer, M. W. (2010). Organizational socialization: Joining and
leaving organizations. Cambridge, UK: Polity.
Kramer, M. W., & Miller, V. D. (2014). Socialization and
assimilation: Theories, processes, and outcomes. In L. L.
Putnam, & D. Mumby (Eds.), The Sage handbook of
organizational communication (3rd Ed.). Thousand Oaks, CA:
Sage.
Langfred, C. W. (1998). Is group cohesiveness a double-edged
sword? An investigation of the effects of cohesiveness on
performance. Small Group Research, 29, 124-143.
Lapinski, M. K., & Rimal, R. N. (2005). An explication of social
norms. Communication Theory, 15, 127-147.

57
Lau, D. C., & Murnighan, K. J. (1998). Demographic diversity and
faultlines: The compositional dynamics of organizational
groups. Academy of Management Review, 23, 325-340.
Liden, R. C., & Maslyn, J. M. (1998). Leader-member exchange: An
empirical assessment through scale development. Journal of
Management, 24, 43-72.
Louis, M. R., Posner, B. Z., & Powell, G. N. (1983). The
availability and helpfulness of socialization practices.
Personnel Psychology, 36, 857-866.
Lu, L., Yuan, C. Y., & McLeod, P. L. (2012). Twenty-five years
of hidden profiles in group decision making: A meta-
analysis. Personality and Social Psychology Review, 16, 54-
75.
Maas, C. J. M., & Hox, J. J. (2004a). Robustness issues in
multilevel regression analysis. Statistica Neerlandica, 58,
127-137.
Maas, C. J. M., & Hox, J. J. (2004b). The influence of
violations of assumptions on multilevel parameter estimates
and their standard errors. Computational Statistics and
Data Analysis, 46, 427-440.
Mehra, A., Dixon, A. L., Brass, D. J., Robertson, B. (2006). The
social network ties of group leaders: Implications for
group performance and leader reputation. Organization
Science, 17, 64-79.
Manata, B., & Miller, V. D. (2012). Socialization into high
performing workgroups: A communication perspective. Paper
presented at the 98th Annual Conference of the National
Communication Association, Orlando, FL.
Manata, B., Miller, V. D., DeAngelis, B. N., & Paik, J. E.
(2013). Organizational socialization: The importance and
application of multi-level theory and communication. Paper
presented at the 99th Annual Conference of the National
Communication Association, Washington, D.C.
Miller, D. C., & Form, W. C. (1964). Industrial sociology: The
Sociology of work in organizations. (2nd ed.). New York:
Harper & Row.

58
Miller, V. D., & Jablin, F. M. (1991). Information seeking
during organizational entry: Influences, tactics, and a
model of the process. Academy of Management Review, 16, 92-
120.
Morgan, G. (2006). Images of organization (Updated ed.).
Thousand Oaks.
Moreland, R. L., & Levine, J. M. (1982). Group socialization:
Temporal changes in individual-group relations. In L.
Berkowitz (Ed.), Advances in experimental social psychology
(pp. 137-192). New York, NY: Academic Press.
Moreland, R. L., & Levine, J. M. (2001). Socialization in
organizations and work groups. In M. E. Turner (Ed.),
Groups at work: Theory and research (pp. 69-112). Mahwah,
NJ: Lawrence Erlbaum Associates, Inc.
Monge, P. R., & Contractor, N. S. (2003). Theories of
Communication Networks. Oxford University Press.
Morrison, E. W. (1993). Newcomer information seeking: Exploring
types, modes, sources, and outcomes. Academy of Management
Journal, 36, 557-589.
Morrison, E. W. (2002). Newcomers’ relationships: The role of
social network ties during socialization. Academy of
Management Journal, 45, 1149-1160.
Newman, M. E. J. (2010). Networks: An Introduction. New York:
Oxford.
Nunnally, J. C., Bernstein, I. H., & Berge, J. M. T. (1967).
Psychometrica Theory (Vol. 226). New York: McGraw-Hill.
Ostroff, C., & Kozlowski, S. W. J. (1992). Organizational
socialization as a learning process: The role of
information acquisition. Personnel Psychology, 45, 849-874.
Ostroff, C., & Kozlowski, S. W. J. (1993). The role of mentoring
in the information gather processes of newcomers during
early organizational socialization. Journal of Vocational
Behavior, 42, 170-183.
Raudenbush, S. W., & Bryk, A. S. (2002). Hierarchical Linear
Models: Applications and data analysis methods (Vol. 1).
Sage.
59
Rentsch, J. R. (1990). Climate and culture: Interaction and
qualitative differences in organizational meanings. Journal
of Applied Psychology, 75, 668-681.
Roberson, Q. M., & Williamson, I. O. (2012). Justice in self-
managing teams: The role of social networks in the
emergence of procedural justice climates. Academy of
Management Journal, 55, 685-701.
Roethlisberger, F. J., & Dickson, W. J. (1939). Management and
the worker. Cambridge: Harvard University Press.
Saks, A. M., Uggerslev, K. L., & Fassina, N. E. (2007).
Socialization tactics and newcomer adjustment: A meta-
analytic review and test of a model. Journal of Vocational
Behavior, 70, 413-446.
Salancik, G. R., & Pfeffer, J. (1978). A social information
processing approach to job attitudes and task design.
Administrative Science Quarterly, 224-253.
Schein, E. H. (1968). Organizational socialization and the
profession of management. Industrial Management Review, 9,
1-16.
Schneider, B. (1987). The people make the place. Personnel
Psychology, 40, 437-453.
Shakya, H. B., Christakis, N. A., & Fowler, J. H. (2014).
Association between social network communities and health
behavior: An observational sociocentric network study of
latrine ownership in rural India. American Journal of
Public Health, 104, 930-937.
Singer, J. D. (1998) Using SAS PROC MIXED to fit multilevel
models, hierarchical models, and individual growth models.
Journal of Educational and Behavioral Statistics, 23, 323-
355.
Singer, J. D., & Willet, J. B. (2003). Applied longitudinal data
analysis: Modeling change and event occurrence. New York,
NY: Oxford University Press.
Sparrowe, R. T., Liden, R. C., Wayne, S. J., Kraimer, M. L.
(2001). Social networks and the performance of individuals
and groups. Academy of Management Journal, 44, 316-325.

60
Stephens, K. K., & Davis, J. (2009). The social influences on
electronic multitasking in organizational settings.
Management Communication Quarterly, 8, 1-21.
Stohl, C. (1986). The role of memorable messages in the process
of organizational socialization. Communication Quarterly,
34, 213-249.
Taylor, F. W. (1914). The principles of scientific management.
Harper.
Taylor, J. C., & Bowers, D. G. (1972). Survey of organizations:
A machine scores standardized questionnaire instrument.
Institute for Social Research, University of Michigan, Ann
Arbor, MI.
Van Maanen, J., & Schein, E. H. (1979). Toward a theory of
organizational socialization. Research in Organizational
Behavior, 1, 209-264.
van Vianen, A. E. M., & De Pater, I. E. (2012). Content and
development of newcomer person-organization fit: An agenda
for future research. In C. R. Wanberg (Ed.), The Oxford
Handbook of Organizational Socialization (pp. 139-157).
Oxford University Press.
Wanberg, C. R. (2012). Facilitating organizational
socialization: An introduction. In C. R. Wanberg (Ed.), The
Oxford Handbook of Organizational Socialization (pp. 17-
21). Oxford University Press.
Zohar, D., & Hofmann, D. A. 2012. Organizational culture and
climate. In S. W. J. Kozlowski (Ed.), The Oxford handbook
of organizational psychology (pp. 643-666). Oxford
University Press.
Zohar, D., & Tenne-Gazit, O. (2008) Transformational leadership
and group interaction as climate antecedents: A social
network analysis. Journal of Applied Psychology, 93, 744-
757.
Zurcher, A. L. (1983). Social roles, conformity, conflict, and
creativity. Beverly Hills, CA: Sage Publications, Inc.