the story picturing engine—a system for automatic...
TRANSCRIPT

The Story Picturing Engine—A System for AutomaticText Illustration
DHIRAJ JOSHI, JAMES Z. WANG and JIA LI
The Pennsylvania State University
We present an unsupervised approach to automated story picturing. Semantic keywords are extracted from the story, an annotated
image database is searched. Thereafter, a novel image ranking scheme automatically determines the importance of each image.
Both lexical annotations and visual content play a role in determining the ranks. Annotations are processed using the Wordnet.
A mutual reinforcement-based rank is calculated for each image. We have implemented the methods in our Story Picturing
Engine (SPE) system. Experiments on large-scale image databases are reported. A user study has been performed and statistical
analysis of the results has been presented.
Categories and Subject Descriptors: H.3.3 [Information Storage and Retrieval]: Information Search and Retrieval—Selectionprocess; I.5.3 [Pattern Recognition]: Clustering—Similarity measures
General Terms: Algorithms, Design, Experimentation, Human Factors
Additional Key Words and Phrases: Story picturing, lexical referencing, image retrieval, mutual reinforcement, Markov chain
1. INTRODUCTION
Stories are often accompanied with pictures. Classic tales of folklore were illustrated with beautifulsketches before the advent of the camera. We always associate historic characters we have read aboutwith pictures we have seen in books. Stories written for children ought to be decorated by pictures tosustain a child’s interest, for a picture is worth a thousand words. In modern times, pictures are usedeverywhere, from newspapers, magazines and Web sites to movie banners, in order to punctuate theeffect of stories surrounding the pictures. Often the pictures themselves become more important thanthe accompanying text. In such scenarios, a key task is to choose the best pictures to display.
Story Picturing, aptly called, denotes the process of depicting the events, happenings, and ideasconveyed by a piece of text in the form of a few representative pictures. This work is performed by newswriters and speakers who select a few images from their repertoire to complement their news stories. Inour work, we attempt to automate the process of story picturing. Choosing a few representative images
This work is supported by the US National Science Foundation under Grant Nos. IIS-0219272, IIS-0347148, ANI-0202007,
and IIS-0333036, The Pennsylvania State University, the PNC Foundation, and SUN Microsystems under Grants EDUD-7824-
010456-US and EDUD-7824-030469-US.
Authors’ address: Dhiraj Joshi, 310 IST Building, The Pennsylvania State University, University Park, PA 16802; email:
Dhiraj Joshi is affiliated with the Department of Computer Science and Engineering. James Z. Wang is affiliated with the School
of Information Sciences and Technology and the Department of Computer Science and Engineering. Jia Li is affiliated with the
Department of Statistics and the Department of Computer Science and Engineering at the Pennsylvania State University.
Permission to make digital or hard copies of part or all of this work for personal or classroom use is granted without fee provided
that copies are not made or distributed for profit or direct commercial advantage and that copies show this notice on the first
page or initial screen of a display along with the full citation. Copyrights for components of this work owned by others than ACM
must be honored. Abstracting with credit is permitted. To copy otherwise, to republish, to post on servers, to redistribute to lists,
or to use any component of this work in other works requires prior specific permission and/or a fee. Permissions may be requested
from Publications Dept., ACM, Inc., 1515 Broadway, New York, NY 10036 USA, fax: +1 (212) 869-0481, or [email protected].
c© 2006 ACM 1551-6857/06/0200-0001 $5.00
ACM Transactions on Multimedia Computing, Communications and Applications, Vol. 2, No. 1, February 2006, Pages 1–22.

2 • D. Joshi et al.
Fig. 1. Choosing a representative picture of Paris can be highly subjective.
from a collection of candidate pictures is challenging and highly subjective because of the lack of anydefined criteria. People may choose to display one particular image over another entirely on merit orpure prejudice. Moreover, the process of story picturing is always constrained by the nature of the imagecollection.
For a while, consider the problem of choosing a representative image of Paris from among the imagesshown in Figure 1. The places featured in the images are the Eiffel Tower, the Arc de Triomphe, theChamps Elysees, and a statue in Louvre, while a couple of images show the city of Paris from differentperspectives. Most of the images were taken at night. As must be evident, there is not a simple answer tothis problem nor a clear criterion for selection. A person’s impression of Paris and experiences acquiredover the years will be reflected in his or her choice of an image. Similarly, a photographer’s personaldisposition will be reflected in his or her photo archives. On a visit to Europe, a history lover will clickmore pictures of historical places, while a nature lover will capture the Alps with his camera.
1.1 Related Work
There is a rich resource of prior work which has inspired and motivated our present work. Here we tryto emphasize some of the research that is most related to what we propose. The references that followare to be taken as examples of related work, not as the complete list of work in the cited areas. We havebuilt our story picturing engine using some methods designed for content-based image retrieval andtextual information retrieval. It is also our belief that a successful real-world image retrieval systemmust incorporate visual, textual, and other useful information about images. In our work, we take astep in this direction.
1.1.1 Image Retrieval. Many efficient content-based image retrieval systems have appeared in thelast decade [Smeulders et al. 2000; Ma and Manjunath 1999; Carson et al. 2002; Wang et al. 2001].Most of the work has focused upon quantifying image similarity and retrieving images similar to aquery image. In recent years, linguistic indexing of pictures using learned statistical models has beenexplored [Li and Wang 2003]. Statistical associations between image regions and words have beenstudied [Barnard et al. 2003; Lavrenko et al. 2003]. A modeling paradigm for image annotations basedon latent Dirichlet allocation (LDA) is presented in Blei and Jordan [2003]. A database perspectiveof image annotation and retrieval has also been studied [Carneiro and Vasconcelos 2005]. Spectralgraph clustering has been found to be effective for image retrieval [Chen et al. 2005]. Machine-learning
ACM Transactions on Multimedia Computing, Communications and Applications, Vol. 2, No. 1, February 2006.

The Story Picturing Engine—A System for Automatic Text Illustration • 3
approaches are being applied to study ancient art [Li and Wang 2004]. Concerns have been expressedabout archiving all ancient historical and cultural materials in digital form for posterity [Chen et al.2005]. As the sizes of digital image libraries grow, a constant need for machine intervention in allaspects of search is pressing. With the ever growing power of computational hardware, the need of theday is to come up with intelligent and scientific solutions.
Let us try to analyze how the research issues mentioned in this section are related to story pictur-ing. Linguistic indexing addresses the problem of finding the most suitable text to describe a givenimage. Story picturing, on the other hand, attempts to find the best set of pictures to describe a givenpiece of text. Thus, the two problems can be regarded as the inverse of each other. In our system, wehave incorporated an unsupervised scheme to rank pictures in a given context (for a given story). Theranking is performed based on a mutual reinforcement principle using pairwise similarities. Moreover,similarities between pictures depend upon their low-level content (visual similarities) and associatedmetadata (lexical similarities).
Our motivation for a ranking scheme based on mutual reinforcement stems from the following as-sumption. The important concepts in a story are evenly represented in the form of pictures in an imagedatabase. Pictures about each concept mutually reinforce the best pictures among them. The level ofreinforcement depends upon their mutual similarity values. In such a scenario, our ranking scheme isexpected to choose the best pictures for each represented concept. We also discuss a variation of thisranking scheme in Section 5.
1.1.2 Mutual Reinforcement. Methods based on a mutual reinforcement principle have been widelyreported in literature especially in the domains of journal evaluation and, more recently, on Web search[Brin and Page 1998; Kleinberg 1999; Li et al. 2002; Pinski and Narin 1976; Garfield 1972]. A recentwork on key phrase extraction and sentence clustering also uses mutual reinforcement [Zha 2002].
All such methods fall under the category of link analysis techniques wherein the underlying structureis a graph, the entities can be represented as the nodes, and the edges represent endorsements thatentities give each other. Endorsements can be in the form of citations (as in journal evaluation systems)as well as hyperlinks (in Web analysis). The aim is to associate a numeric measure of importance, alsoreferred to as standing, with each entity on the basis of the link structure. Kleinberg’s HITS algorithmfinds hubs, that is, Web pages pointing to many important sites, and authorities, that is, important Websites pointed to by many other pages [Kleinberg 1999]. Google’s pagerank of a particular Web page is ameasure of its standing based on its link structure [Brin and Page 1998]. In Li et al. [2002], modificationof HITS by assigning a weight to each link based on textual similarities between pages has been foundto perform better than the original HITS.
1.1.3 Text to Scene Conversion. Automatic text-to-scene conversion by computer graphics tech-niques has been studied for several years [Kahn 1979; Lu and Zhang 2002; Clay and Wilhelms 1996;Coyne and Sproat 2001; Brown and Chandrasekaran 1981; Reynolds 1982]. The WordsEye system de-veloped at AT&T Labs [Coyne and Sproat 2001] is a natural language understanding system whichconverts English text into three-dimensional scenes that represent the text. Our scheme, on the otherhand, attempts to choose the best set of images from an image database to illustrate a piece of text.The goals of the former and the latter are similar. However, even with an annotated image databaseavailable, it is not simple to choose a few images which best represent the text. As pointed out earlier,the problem is subjective, and a human being would use his knowledge, acquired over the years, to judgethe importance of each image. Also, the picturing has to be performed only with the images presentin the database often resulting in illustration of certain concepts at the cost of certain others (whichare poorly represented in images). Quantifying image importance in a pool of images is the focus ofour work. Authors Barnard and Forsyth [2001] introduced the idea of auto-illustration as an inverse
ACM Transactions on Multimedia Computing, Communications and Applications, Vol. 2, No. 1, February 2006.

4 • D. Joshi et al.
Fig. 2. A flow diagram of our Story Picturing Engine.
problem of auto-annotation. Statistical associations between images and text were used to find imageswith high likelihood, given a piece of text. In this article, we present a different approach to this problemwhich uses a technique for image ranking and selection, based on a mutual reinforcement principle.This ranking process is at the heart of our Story Picturing Engine (SPE). The set of candidate images isassumed to form a graph with the images acting as nodes and image similarities forming the weightsin the edges. Under a special condition, the image selection can be modeled as a random walk in thegraph.
1.2 Outline of the Article
The rest of the article is organized as follows. In Section 2, we describe our story picturing engineand present the mathematical formalism of the reinforcement principle. In Section 3, we describe theexperiments performed and discuss our results. In Section 4, we present our evaluation methods andresults. In Section 5, we discuss an alternate ranking scheme, and, in Section 6, we conclude and listsome future research directions.
2. THE STORY PICTURING ENGINE (SPE)
Our Story Picturing Engine consists of three components (1) the story processing and image selection,(2) the estimation of similarity between pairs of images based on their visual and lexical features, and (3)the mutual reinforcement-based rank estimation process. In this section, we describe these individualcomponents and show how they work together to form a robust image ranking system. Figure 2 showsa schematic flow diagram of our system.
2.1 Story Processing and Image Selection
The purpose of the story processing component of the system is to identify certain descriptor keywordsand proper nouns in the story and estimate a lexical similarity between keywords using the Wordnet.We first perform stopword elimination from the story. Stopwords are common words (i.e., a, of, the, on)that have little or no meaning by themselves [Agosti et al. 2000]. A list of stopwords has been man-ually prepared which serves the purpose. Wordnet, developed by the Cognitive Science Laboratory atPrinceton University, is a lexical reference system, the design of which is inspired by psycholinguistictheories of human lexical memory [Miller et al. 1990; Fellbaum 1998]. Nouns are arranged in topicalhierarchies and the hierarchy induces a transitive relation hypernymy among concepts. Consider the
ACM Transactions on Multimedia Computing, Communications and Applications, Vol. 2, No. 1, February 2006.
The Story Picturing Engine—A System for Automatic Text Illustration • 5
following wordnet hierarchy oak → tree → plant → organism, where the arrow represents the hyper-nymic relation. A polysemy count is defined for each word based on the number of senses it has (i.e.,the number of different contexts it can be used in). For example, according to Wordnet, the noun casehas 18 different senses. Case is synonymous with a lawsuit, an instance, a container among others andcan be used in place of any of them without changing the meaning of the sentence. On the other hand,the polysemy count of kangaroo is 1.
For our purpose, we choose to eliminate nouns with a very high polysemy count because such wordsadd little weight to the meaning conveyed by the story. Besides this, we also eliminate adjectives, verbsand adverbs, with high polysemy counts from the story. Hence, in our system, common nouns with not-so-high polysemy counts, and verbs, adjectives, and adverbs with low polysemy counts are descriptorkeywords of a piece of text. The values of upper limits to the polysemy count values have been mentionedin the Section 3. These values represent a trade-off between having a very large picture pool and losingimportant information from the stories.
In addition to this, we also identify the set of proper nouns from the text which are deemed moreimportant than the rest of the keywords because they denote the place and people the story is about.For the present implementation of our Story Picturing Engine, we used a simple method for extractingnamed entities. The words in the story which began with a capital letter were selected to form a listof proper nouns for the story in question. At the end of this process, we denote the keywords by k1,k2, . . . , kn, and the set of proper nouns by N1,N2, . . . , Nd . In order to form an initial pool of images uponwhich the ranking algorithm will be applied, we select images which are annotated with at least oneof the N ′
rs and one of the k′s.
We made use of the semantic organization of Wordnet to derive rough semantic similarities betweenkeywords. The following approach is adopted for the present implementation. We now list a few Wordnetdefinitions before proceeding to explain the mathematics:
(1) ki and kj are synonyms if they can be used interchangeably within the same context;
(2) ki is a hypernym of kj if ki occurs in kj ’s topical hierarchy tree;
(3) ki is a meronym of kj if ki is a part of kj (e.g., beak is a meronym of bird);
(4) ki and kj are coordinate terms if they have the same hypernym (e.g., mountain and ridge).
If ki and kj are two keywords, we define a similarity measure Kij between them as follows
Kij =
⎧⎪⎪⎪⎪⎪⎪⎪⎪⎪⎪⎨⎪⎪⎪⎪⎪⎪⎪⎪⎪⎪⎩
1 if ki and kj are identical or synonyms.
μ if ki and kj are related by meronymy
or are co-ordinate terms.
μt if ki and kj are related by hypernymy
and ki appears in kj′s topical hierarchy
tree, t edges away or vice versa.
0 if ki and kj are unrelated.
In the previous expression, μ is a real number between 0 and 1. In our experiments, we have arbitrarilyfixed μ as 0.5. As an example, if ki is kangaroo and kj is fauna then according to our definition, Kij is0.015625 as fauna appears in kangaroo’s topical hierarchy tree 6 edges away from kangaroo.
In literature, there exist more elaborate semantic distance calculation mechanisms based on Wordnethierarchy which have been used in computational linguistics [Budanitsky and Hirst 2001]. However, forour present implementation, this was not the prime focus and so we kept the relations simple. It wouldbe an interesting future research topic to incorporate more sophisticated lexical similarity measuresinto our system.
ACM Transactions on Multimedia Computing, Communications and Applications, Vol. 2, No. 1, February 2006.

6 • D. Joshi et al.
2.2 Estimation of Similarity
Once a pool of images has been identified, we assign a numeric similarity to each pair of images Ii andIj based on their visual and lexical features.
2.2.1 Similarity Assignment. The following steps elaborate our approach.
(1) An Integrated Region Matching (IRM) distance is calculated between images. IRM is an image-matching mechanism which identifies regions in images and calculates an overall region-baseddistance using visual features. Details of IRM have been skipped here due to lack of space and canbe found in Wang et al. [2001].
(2) IRM distances dij are converted into percentile IRM similarities ηij, such that ηij is the fraction ofall dst such that dst ≥ dij.
(3) An annotation-based similarity is also calculated between pairs of images as follows
ζij =∑
kl ∈Ai
∑km∈Aj
Klm.
In the previous expression, Ai and Aj denote the set of words that form the annotations of imagesIi and Ij , respectively. In the present implementation, we only consider words in annotation setsAi and Aj which are among k1, . . . , kn. ζij’s are also converted to respective percentile similarities.
(4) The two forms of similarities are combined to form a unified similarity measure between pairs ofimages. If α ∈ [0, 1], sij is defined as follows
sij = αηij + (1 − α)ζij.
Note that sij > 0 ∀i, j and sij = sj i by the previous definition. The parameter α balances the effectsof lexical and visual features in determining sij. It is desirable to have an intermediate value of α. Themanual annotations associated with an image are reflections of human intelligence applied to interpretthe content of an image, whereas visual features have pronounced effects on integrated region-basedsimilarity. It is important to perform visual processing to identify visually good images from amongthose which bear similar manual annotations. Therefore, we combine the two to form a similaritymeasure which awards visually similar images as well as images judged similar by annotations.
2.3 Reinforcement-Based Rank
Mutual reinforcement refers to the process where each entity contributes towards the rank of others,based on some similarity between them. This kind of ranking has been successfully used in severaldomains over the years. In our system, we use this idea to assign a measure of importance to eachimage, based on its similarity with other images. An iterative mechanism is used to estimate the rankof each image. Finally, the most highly-ranked images are selected. Figure 3 illustrates the idea ofmutual reinforcement. We now discuss the mathematical details of this procedure.
Let I1,I2, . . . , IN represent the working set of images obtained as explained in Section 2.1. We definethe rank of image Ii as ri which is the solution to the equation:
ri =N∑
j=1
sijrj . (1)
Let us first discuss the consequence of rank assignment based on Equation (1) using a standard resultfrom linear algebra [Kleinberg 1999].
If S is a symmetric M ×M matrix, and �u is a vector which is not orthogonal to the principal eigenvectorofS, then the unit vector in the direction ofS tu converges to the principal eigenvector �v ofS as t increases
ACM Transactions on Multimedia Computing, Communications and Applications, Vol. 2, No. 1, February 2006.

The Story Picturing Engine—A System for Automatic Text Illustration • 7
Fig. 3. Mutual reinforcement is depicted by arrows for three images. Every image reinforces the rank of every other image based
on how similar they are.
without bound. Further, if the entries of S are nonnegative, then the principal eigenvector �v has onlynonnegative entries.
Equation (1) is nonlinear but can be solved iteratively by the previous result. The following algorithm,commonly referred to as power method, finds the principal eigenvector of a symmetric matrix withnonnegative entries.
(1) Initialize−→r0 = (r0
1 , r02 , . . . , r0
N ) randomly such that∑N
i=1 r0i = 1 and r0
i > 0 ∀i.(2) t ← 1.
(3) rti = ∑N
j=1 sijrt−1j ∀i ∈ 1, . . . , n.
(4) rti ← rt
i
‖−→rt ‖1
, ‖−→rt ‖1 = ∑Ni=1 rt
i .
(5) t ← t + 1.
(6) Repeat steps (3) to (5) until convergence (i.e.,−→rt = −−→
rt−1).
Since S has only nonnegative entries, its principal eigenvector �v also has only nonnegative entries,
hence the constraints on our choice of the initial vector−→r0 in step (1) ensure that it is not orthogonal
to �v.Consider a graph G such that I1,I2, . . . , IN constitute the nodes of G, and sij is the weight of edge
from image Ij to image Ii, then finding high-ranked images from among I1,I2, . . . , IN using mutualreinforcement becomes akin to finding hubs, authorities, or pages with high pagerank in the WorldWide Web graph. Pictures possessing a high rank are expected to be authoritative in terms of theircontent.
2.4 Discrete State Markov Chain Model
We will now present an interesting model of human behavior under the condition that∑N
j=1 sij = 1 ∀iwhich can be achieved by normalizing each row of the image similarity matrix S. Imagine a humanoperator trying to select a few representative images from a pool of images that capture a particular
ACM Transactions on Multimedia Computing, Communications and Applications, Vol. 2, No. 1, February 2006.

8 • D. Joshi et al.
concept or concepts conveyed by a piece of text. He begins by looking at a random image and, withan intent to look for a better image, proceeds to another. However, it is natural to assume that theselection of the next image would be influenced by its similarity to its precursor. This model capturesa real scenario to a certain extent, as human beings do have a fickle mind and scan through a numberof things before deciding upon the best. Consider the case when the operator is looking at image Ij ,we claim that sij now represents the probability that he or she will proceed to image Ii next. Note that∑N
j=1 sij = 1 and so sij ∀i is a probability mass function.This pattern can be aptly described by a discrete state Markov chain in which each image forms a
discrete state, and S = [sij] represents the transition probability matrix. Thus, the solution �r to theequation �r = S�r, is the stationary distribution of this stochastic model. In other words, ri representsthe probability that the operator will reach image Ii, while performing the random walk.
This model of human behavior has been inspired from Brin and Page’s [1998] explanation of Google’spagerank. In their words, the pagerank represents the probability that a surfer beginning from arandom Web page arrives at a particular page, following only forward hyperlinks.
The model is similar to the model proposed in Section 2.3 as the image ranks are calculated using thesame equation (Equation (1)). However, the similarity matrix S does not remain symmetric under theconstraint
∑Nj=1 sij = 1 ∀i. Hence a small variation of the numerical algorithm proposed in Section 2.3
is used to calculate the image ranks. The rank vector �r can be calculated by iteratively evaluating Sk .This is based on the following set of standard results for Markov chains.
(1) A transition matrix which is element-wise positive is irreducible, aperiodic, and positive recurrent.
(2) If the transition probability matrix S is irreducible, aperiodic, and positive recurrent, then Sk
converges to a matrix in which each column is the unique stationary distribution of S (the convergedmatrix has identical columns).
3. EXPERIMENTS
We performed our experiments on two large databases, the Terragalleria1 and the Art Museum Im-age Consortium (AMICO)2 image databases. Terragalleria is the collection of personal photographs ofQuang-Tuan Luong, who is famous for his scientific work on camera self-calibration and his devotion tothe large-format photography community. He took these pictures during his numerous treks and visitsto various parts of the world. The number of pictures in the Terragalleria database is around 72,00 andeach image bears a manual annotation provided by the photographer. Besides this, on his Web site, hehas included small descriptions of his travels and experiences in different places which we adopted asour test stories. For experiments on the Terragalleria database, we fixed the upper bounds on polysemycounts as 5 for nouns, and 1 each for verbs, adjectives, and adverbs.
AMICO was formed in 1997 by 40 museums or so from all over the world. Images, paintings, andsculptures were archived in digital form to provide for their educational use as multimedia data in themuseums. The number of digital images in this database is around 118,300. Important metadata aboutthe images, including their name, their artist, their country, their genre, the material used, and themuseum were treated as manual annotations. We obtained some sample test stories from ARTKids.3
ARTKids is a nonprofit Web site offering art resources for the classroom and for students of art. Animportant assumption about our test stories is that they revolve around a few central ideas and talk
1http://www.terragalleria.com.2http://www.amico.org. In June 2005, the members of AMICO voted to dissolve their collaboration. The image content was
acquired by another organization.3http://www.artfaces.com/artkids.
ACM Transactions on Multimedia Computing, Communications and Applications, Vol. 2, No. 1, February 2006.

The Story Picturing Engine—A System for Automatic Text Illustration • 9
about places, people, times (e.g., Roman). Complex stories, with timelines and metaphorical references,were not tested in the present scheme. For experiments on AMICO, we fixed the upper bounds onpolysemy counts as 5 for nouns, and 1 each for verbs, and adjectives, and 0 for adverbs.
3.1 Experiments and Results: Terragalleria Database
We present story picturing results for five different stories in this section. The stories used are thephotographer’s descriptions of Paris, Vermont, Japan, Loire Valley, and Rome. The effect of storypicturing applied to his textual descriptions could be reminiscent of a scenario where Q.-T. Luong istrying to choose some representative pictures from his visits to the places described in the story in orderto show them to a friend or to a visitor to the Web site. Naturally, we would expect that the results willbe influenced by his photographic patterns. By patterns, we refer to the way in which a human beinghas internalized concepts. Abstract ideas like nature and spring could stand for a number of things inreal life. It is subjective what concrete things a person prefers to associate with them. The five storiesused in our experiments, written by Q.-T. Luong, are listed next.
—Paris. “The cradle of Paris is Ile de la Cite, a small island in the middle of the Seine river. Paris thenfirst developed along the river, and from the Louvre to the Eiffel tower or the Place de la Concorde toNotre Dame, its evolution and its history can be seen from the river. The central portion of the banksform a very homogeneous ensemble and makes for a fine walk. The banks of the Seine are a UNESCOworld heritage site. The right bank of the Seine is dominated by large perspectives due to the avenuesdesigned by Haussman in the 19th century. The most prominent of them is the one extending fromthe Louvre to the Arc de Triomphe, through the Champs Elysees, France’s most famous avenue.”
—Vermont. “Vermont is mostly a rural state. Many of the towns and villages, churches, covered bridges,weathered farms and barns date back to the 17th century, where the ancestors of many Americanslived before moving west. The countryside has the cozy feeling of a place which has been lived in fora long time, before the age of the machines. Each autumn, the landscape is transformed in a vibrantpalette of colors that few places can rival for the Green mountains have a great variety of trees, manyof which turn red or orange.”
—Japan. “Japan is a complex country where the most extreme modernity coexists with an ancient andrefined culture. Tokyo has some of the most densely packed districts anywhere, and possibly the mosttrendy hi-tech consumer society, yet at the same time the traditional world of Japan still lingers thereand can be seen by the observant eye. Besides the hyper-active city life, there is the serenity of thegardens, the austere elegance of the temples, and a general appreciation of aesthetics, which are sowell expressed in Kyoto. Although it is sometimes a strange and disconcerting place, the country isfree of petty crime, dishonesty, litter, and rudeness. Although they have embraced the 21st centurymore than any other nation, Japanese people are governed by traditional social values and etiquetteand extend their civility to visitors.”
—Loire Valley. “A couple of hours south of Paris, the Loire valley is a cultural landscape of greatbeauty, containing historic towns and villages, great architectural monuments, and cultivated landsformed by many centuries of interaction between their population and the physical environment.The architectural monuments span the period which saw the transition from castles as defensivestructures, Loches, to renaissance chateaux, places of luxury, pleasure and refinement, which haveretained defensive elements only for ornamental reasons. The valley between Sully-sur-Loire andChalonnes is a UNESCO world heritage site.”
—Rome. “Rome, the eternal city, has awed its visitors for two millenia. Founded, according to legend,by Romulus and Remus in 753 B.C., Rome was first the center of the Roman Republic, then ofthe Roman Empire, and it became the capital of the Christian world in the 4th century. Its ruined
ACM Transactions on Multimedia Computing, Communications and Applications, Vol. 2, No. 1, February 2006.

10 • D. Joshi et al.
Fig. 4. Pictures provided by the Story Picturing Engine to illustrate the story on Paris. H1 to H4 are the 4 top-ranked images
while L1 and L2 are the 2 lowest-ranked images. The parameter α is 0.5.
antique monuments, many of them are concentrated on the former Roman Forum, represent a pointof reference for a city that has undergone many transformations through the Imperial, Medieval,Renaissance, and Baroque periods, producing in the process an archaeological record of amazingdensity that matches the richness of the history and legends. Today Rome is Italy’s vibrant capital.Since, according to a saying, a lifetime is not enough to discover everything it has to offer, you canmake sure you will return to Rome by tossing a coin over your shoulder in the Trevi Fountain. TheHistoric Center of Rome is part of a UNESCO world heritage site.”
Figures 4 to 8 show the results of story picturing applied to the stories previously presented. We haveshown the four top-ranked images (indicated as H1 to H4) and two images with lowest ranks (indicatedas L1 and L2), returned by SPE. We believe that a photographer’s archives are governed by his tastes. Ina discussion of Paris, if pictures of the Arc de Triomphe get higher reinforcement compared to picturesof the Eiffel Tower, it might reflect that the photographer was more enamored by the former than thelatter or alternately, that pictures of the Eiffel Tower were taken in the night or were of low quality.In each case, we notice that the low-ranked images, which received low reinforcement, are either odd,irrelevant, or of poor quality.
3.2 Experiments and Results: AMICO Database
As mentioned earlier, AMICO was a digital library which contained over 100, 000 paintings, sculptures,drawings and watercolors, prints, photographs, textiles, costumes and jewelery, works of decorative art,books and manuscripts in digital form. Works dated from prehistoric (around 2000 B.C.) to contemporarytimes. A diverse range of cultures from Native American, to ancient and medieval Greek, Roman,Egyptian, Chinese and Indian civilizations were evenly represented. AMICO had a good collection ofmodern works, too.
Sample stories for this set of experiments were obtained from ARTKids which is an educational Website, as mentioned earlier. We have included results for three short stories which are listed next. Eachstory is a small description of art or sculpture of a particular civilization.
ACM Transactions on Multimedia Computing, Communications and Applications, Vol. 2, No. 1, February 2006.

The Story Picturing Engine—A System for Automatic Text Illustration • 11
Fig. 5. Pictures provided by the Story Picturing Engine to illustrate the story on Vermont. H1 to H4 are the 4 top-ranked images
while L1 and L2 are the 2 lowest-ranked images. The parameter α is 0.5.
Fig. 6. Pictures provided by the Story Picturing Engine to illustrate the story on Japan. H1 to H4 are the 4 top-ranked images
while L1 and L2 are the 2 lowest-ranked images. The parameter α is 0.5.
—Roman Art. “While there is evidence that the Romans also painted on portable panels, the survivingpaintings that we can see today were painted directly on the walls of their rooms. Domestic interiorswere claustrophobic, windowless and dark, so the Romans used painted decoration to visually openup and lighten their living spaces. Technical elements of Roman painting include the fresco technique;brightly colored backgrounds; division of the wall into multiple rectangular areas, tic tac toe design;multipoint perspective, and trompel oeil effects.”
—Egyptian Sculpture. “As far back as 5,000 years ago Egypt had introduced a style that, with surpris-ingly little change, continued for almost 3,000 years. Rules for the making of statues were rigidly
ACM Transactions on Multimedia Computing, Communications and Applications, Vol. 2, No. 1, February 2006.

12 • D. Joshi et al.
Fig. 7. Pictures provided by the Story Picturing Engine to illustrate the story on Loire Valley. H1 to H4 are the 4 top-ranked
images while L1 and L2 are the 2 lowest-ranked images. The parameter α is 0.5.
Fig. 8. Pictures provided by the Story Picturing Engine to illustrate the story on Rome. H1 to H4 are the 4 top-ranked images
while L1 and L2 are the 2 lowest-ranked images. The parameter α is 0.5.
prescribed, as were social and religious customs. Religion was the dominant force in life on earthand it required certain preparations for the life beyond. Sculpture was entirely associated with theneeds of religion and the gods or with the earthly rulers who were regarded as their representatives.To symbolize the Godlike role of the kings, they were represented as half human, half animal. The
ACM Transactions on Multimedia Computing, Communications and Applications, Vol. 2, No. 1, February 2006.

The Story Picturing Engine—A System for Automatic Text Illustration • 13
Fig. 9. Pictures provided by the Story Picturing Engine to illustrate the stories on Egyptian and Greek sculptures. E1 to E4 are
results for story on Egyptian sculpture and G1 to G4 are results for story on Greek sculpture. The parameter α is 0.5.
great Sphinx at Gizeh is the best known example. to express their power and eternal life they werecarved in the hardest stone and in colossal proportions. The statues of Rameses 2 at Abu Simbel areexamples.”
—Greek Sculpture. “The glory of Greece was its sculpture. The roots of Greek sculpture reach into theearlier cultures of Crete, Mycenae, and even Egypt. The figures of the 7th and 6th centuries B.C. lacklife and movement; their faces wear the frozen smile peculiar to archaic sculpture. even so, these earlycraftsmen, whose names are lost with the temples they decorated, show sensitivity to the qualitiesof marble and a superb sense of design. As if to make up for the lack of life in their statues, archaicsculptors sought naturalism by painting them. Greek sculpture rose to its highest achievement inthe 5th century B.C, when the spirit of Greece itself was at its height.”
Figures 9 and 10 show the results of the Story Picturing Engine on the stories just mentioned. Noticethat, in Figure 9, the picture (E2) is irrelevant to the story which was included in the pool by our schemeas its painter is Egyptian.
ACM Transactions on Multimedia Computing, Communications and Applications, Vol. 2, No. 1, February 2006.

14 • D. Joshi et al.
Fig. 10. The two top-ranked images for the story on Roman art for α = 0, 0.5 and 1 are shown here. For A1 and A2, α = 0; for
B1 and B2, α = 0.5; and for C1 and C2, α = 1.
Table I. The Table Shows the Overlap Among the Top 10 Ranks Between Different Values of α.
Comparisons have been Made with α = 0.5. The Top Row Represents the Values of α.
Story 0.0 0.1 0.2 0.3 0.4 0.6 0.7 0.8 0.9 1.0
Paris 2 3 4 5 8 9 8 7 5 4
Vermont 5 7 8 8 10 10 9 9 8 7
Japan 3 10 10 10 10 10 8 8 7 7
Loire Valley 4 10 10 10 10 10 10 10 10 10
Rome 6 10 10 10 10 8 7 5 4 4
3.3 Sensitivity Analysis
We performed a parametric study to see how much the value of parameter α affects the results. Thegoal was to compare the number of common pictures among the top 10-ranked, using different valuesof parameter α. The parameter α, as described in Section 2.2.1, balances the effects of lexical and visualfeatures in determining the reinforcement ranks. Experiments were performed on the five stories,Paris, Vermont, Japan, Loire Valley, and Rome, which were have been mentioned in Section 3.1.The parameter α was varied between 0 and 1 in steps of 0.1, and the top 10-ranked pictures werecollected to determine the extent of overlap. Table I shows the results of this comparison. For ease ofrepresentation, we show the number of pictures in common between different values of α and α = 0.5in the top 10-ranked pictures. We do not take into account the sequence of pictures in the top 10 ranks.
We notice that the overlap is dependent on the stories. The extent of overlap is maximum for valuesof α in the range 0.4 to 0.6 and the overlap decreases for larger or smaller values of α. We see that forthe stories Japan and Loire Valley, the range of maximum overlap is very large. This could mean thattextual similarity is not very discriminating between pictures and real discrimination appears becauseof visual similarity values. Based on our analysis, we conclude that the discriminating powers of visual
ACM Transactions on Multimedia Computing, Communications and Applications, Vol. 2, No. 1, February 2006.

The Story Picturing Engine—A System for Automatic Text Illustration • 15
and lexical similarities depend on the story, in question. With low values of α, images which are visuallynot so appealing, may receive high ranks. On the other hand, high values of α could result in conferringhigh ranks on visually appealing, but distantly relevant, pictures. In real scenarios, an intermediatevalue of α such as 0.5 could be selected to give the flavor of both. Figure 10 shows the two top-rankedimages for different values of parameter α for the story on Roman art. By inspection, the readers maysee that the top-ranked images (for α = 0.5) have a fairly diverse visual and textual content. As pointedout by one of the reviewers, it would indeed be an interesting future work to see which values of α bestsatisfy the users of our system.
4. EVALUATION
As mentioned earlier, the choice of representative pictures is a very subjective process. However, weconducted a user study and collected data for numeric evaluation of our Story Picturing Engine. Inthis section, we first provide a detailed description of our user study, and then discuss the evaluationprocess.
4.1 Story Picturing User Study
The five stories from the travel story collection of Q.-T. Luong (which we described in Section 3) wereselected for the purpose of evaluation. Images in the Terragalleria database were used as candidates.The goal of the study was to the compare human and computer response to story picturing. Humanparticipants were asked to perform the task of story picturing on a given story and a collection ofpictures. Expecting human participants to browse through images in the entire database was ruled outfor two reasons. (1) The number of images in the Terragalleria database is around 7,200. (2) Using asimple keyword-based selection procedure (as described in Section 2.1), images with annotations thatshare keywords with the story text can be obtained, and these could be considered as good potentialcandidates for final selection by participants.
In order to ensure serious participation and minimize random responses, we selected stories wherethe pool size is reasonable enough for an average human to browse in about five minutes. Stories withinitial pool sizes between 40 and 70 were therefore selected. For the story Paris, the initial picture poolsize obtained using our processing was 130. However, for the purpose of the survey, this was reducedto 61 by removing of irrelevant pictures which had crept in because of certain distantly relevant wordswith capital letters that had been identified as proper nouns. The user study was prepared usingPHP and MySQL database applications and was put online. Volunteers could participate and entertheir response at any time of the day. The response was stored in a relational database. Figure 11shows a screenshot of the story picturing page shown to human participants. The human participantswere graduate and undergraduate students affiliated with the School of Information Sciences andTechnology, at The Pennsylvania State University. The participants had a reasonable understandingand knowledge of the English language as the user study was prepared in English, and all the storiesand their annotations were also in English.
In the remainder of this section, we will denote a story as S and the initial picture pool and theirrespective annotations for the story as P(S). The set of five top-ranked pictures and their respectiveannotations, returned by the Story Picturing Engine for the story S will be denoted by R(S). Moreover,the five stories will be referred to by the names Paris, Verm, Rome, Loire, and Japan, respectively. Thestudy was conducted in two phases described as follows.
(1) Phase 1. The aim of the first phase of the study was to gather the human story picturing responseto be used for the second phase. Participants were shown a story, S, and the corresponding poolof pictures, P(S), (obtained as described in Section 2.1) and their respective annotations. From
ACM Transactions on Multimedia Computing, Communications and Applications, Vol. 2, No. 1, February 2006.

16 • D. Joshi et al.
Fig. 11. The Web-based user study shown to human participants of Phase 2.
the collection of pictures, P(S), participants were asked to select five pictures which were the bestrepresentatives of the story S, in their opinion. In other words, they were asked to practice theirjudgment and choose pictures to illustrate the given story, given a reasonably large pool of pictures.The response of the ith human participant for the story S will be denoted as Hi(S). During thisphase, the number of distinct human responses recorded were 3 for Japan and 4 for Loire, Paris,Rome, and Vermont, respectively.
(2) Phase 2. In the second phase of the study, we asked participants to perform story picturing in amore constrained environment. Participants were shown a story, S, a random human response,Hi(S) (collected in the first phase), and the five top-ranked pictures returned by the Story PicturingEngine, R(S). The pictures from the two sets Hi(S) and R(S) were mixed together and displayed ina random order. Similar to the first phase, participants were asked to select five pictures which theyfelt were the best representatives of the story S. The goal was to statistically analyze the responsefor possible inclinations towards human selection (recorded from the first phase) at the expense ofcomputer selection (results of the story picturing engine). The response of the j th human participantfor the story S will be denoted as Fj (S). During this phase, the number of distinct human responses
ACM Transactions on Multimedia Computing, Communications and Applications, Vol. 2, No. 1, February 2006.
The Story Picturing Engine—A System for Automatic Text Illustration • 17
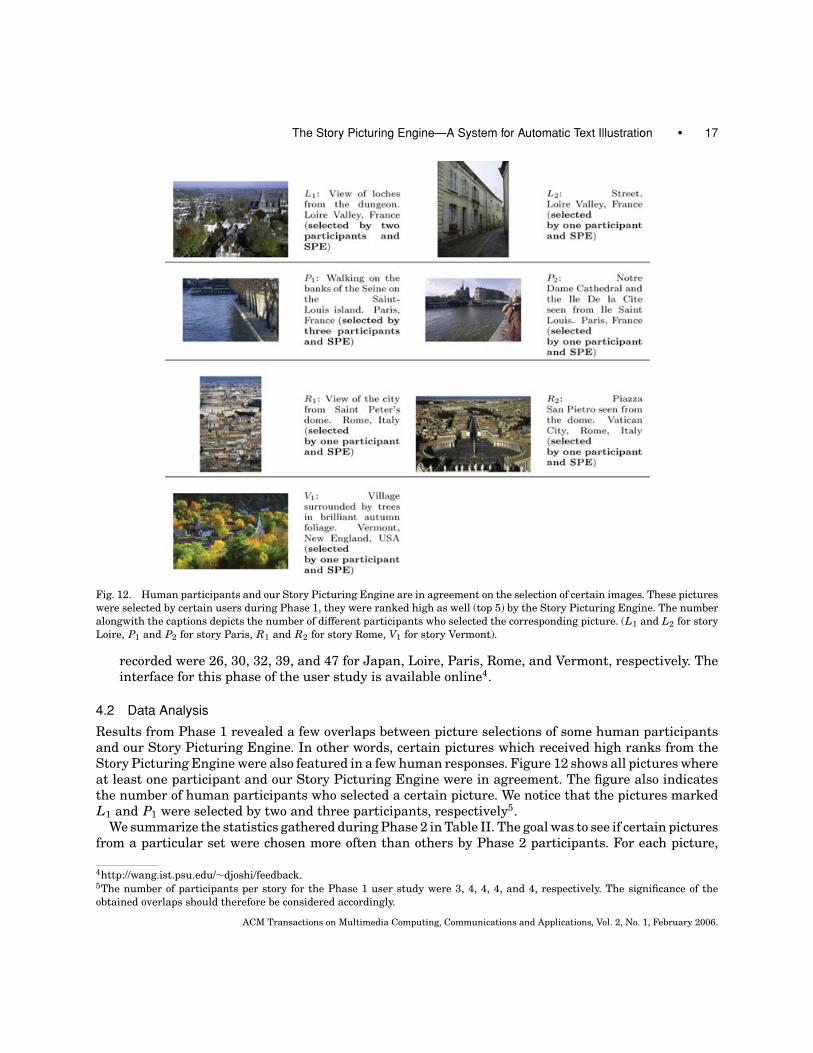
Fig. 12. Human participants and our Story Picturing Engine are in agreement on the selection of certain images. These pictures
were selected by certain users during Phase 1, they were ranked high as well (top 5) by the Story Picturing Engine. The number
alongwith the captions depicts the number of different participants who selected the corresponding picture. (L1 and L2 for story
Loire, P1 and P2 for story Paris, R1 and R2 for story Rome, V1 for story Vermont).
recorded were 26, 30, 32, 39, and 47 for Japan, Loire, Paris, Rome, and Vermont, respectively. Theinterface for this phase of the user study is available online4.
4.2 Data Analysis
Results from Phase 1 revealed a few overlaps between picture selections of some human participantsand our Story Picturing Engine. In other words, certain pictures which received high ranks from theStory Picturing Engine were also featured in a few human responses. Figure 12 shows all pictures whereat least one participant and our Story Picturing Engine were in agreement. The figure also indicatesthe number of human participants who selected a certain picture. We notice that the pictures markedL1 and P1 were selected by two and three participants, respectively5.
We summarize the statistics gathered during Phase 2 in Table II. The goal was to see if certain picturesfrom a particular set were chosen more often than others by Phase 2 participants. For each picture,
4http://wang.ist.psu.edu/∼djoshi/feedback.5The number of participants per story for the Phase 1 user study were 3, 4, 4, 4, and 4, respectively. The significance of the
obtained overlaps should therefore be considered accordingly.
ACM Transactions on Multimedia Computing, Communications and Applications, Vol. 2, No. 1, February 2006.

18 • D. Joshi et al.
Table II. The Table Shows Certain Statistics of the Phase 2 Study. The Distinct
Picture Pool (formed by Phase 1 human response and SPE top-ranked pictures)
Shown to Users is Denoted by Picture Set, Np Represents the Number of Participants
who were Shown this Pool, Selmed, Selmax, and Selmin Denote the Median, Maximum,
and Minimum Number of Times any Picture from this Pool was Chosen by Phase 2
Participants. SPEmed Denotes the Number of SPE Top-Ranked Pictures which were
Chosen More Than or Equal to Selmed Times. SPEtop2 Denotes if the Two Most
Selected Pictures in a Set Contained Any Other SPE Top-Ranked Pictures
picture set Np Selmed Selmax Selmin SPEmed SPEtop2
Japan1 10 5 10 1 2 No
Japan2 8 4 7 1 3 2ndJapan3 8 5 5 1 2 1st
Loire1 7 3 6 2 3 2ndLoire2 4 2 4 1 3 2ndLoire3 13 8 13 1 2 No
Loire4 6 4 6 2 2 No
Paris1 7 4 5 1 3 2ndParis2 14 8 11 2 4 1st, 2ndParis21 4 3 4 1 3 1st, 2ndParis6 7 4 6 2 2 1st
Rome1 12 7 10 2 5 1st, 2ndRome2 10 5 9 2 3 2ndRome3 11 6 11 3 2 No
Rome4 6 4 5 2 3 2nd
Vermont1 10 7 8 1 2 No
Vermont2 13 7 9 3 4 2ndVermont3 13 6 9 4 1 No
Vermont4 11 5 9 2 3 1st, 2nd
we note the number of Phase 2 participants it was selected by and show the maximum, minimum, andmedian over all pictures in a set. It can be expected that pictures which were selected more than orequal to median times have a higher significance over those which were not. We also show the numberof SPE top-ranked pictures which were selected more than or equal to median times and whether anyof them are among the two most selected pictures. As pointed out by one of the reviewers, the value ofSPEmed is expected to be around 2.5 for a random system. We notice from Table II that for 11 out of19 times, SPEmed is greater than 2.5. Moreover, it is interesting to see that 13 out of 19 times, an SPEtop-ranked picture is among the two most selected, and 6 out of 19 times, an SPE top-ranked picture isthe most selected.
For a response Fj (S) for Phase 2, where the participant j , was shown pictures from the set Hi(S)∪R(S),i being a random participant for Phase 1 who was shown the story S, we calculate the following:nS
1 = |(Fj (S) ∩ Hi(S))|, nS2 = |(Fj (S) ∩ R(S))|, and X S
j = nS1 − nS
2 . Here, |V| denotes the cardinality of
the set V. The value of X Sj measures the amount by which the response of participant j (Phase 2) was
inclined towards the response of participant i (Phase 1). A negative value would, in turn, imply that theresponse of j was inclined towards the response of the Story Picturing Engine. For an ideal system whosestory picturing performance matches that of a human being the mean of this statistic should be zero.
Figure 13 shows the frequency histograms of the observation X Sj for different stories. It is clear that
the distribution has a varying skew and observed mean for different stories. However, for the storiesParis, Vermont and Rome, there is a significant amount of mass in the negative axes as well, denotingthat, on several occasions, response of Phase 2 participants was closer to the response of the Story
ACM Transactions on Multimedia Computing, Communications and Applications, Vol. 2, No. 1, February 2006.

The Story Picturing Engine—A System for Automatic Text Illustration • 19
Fig. 13. Empirical frequency distributions of the statistic X j for different stories. The stories are indicated in the figure.
Picturing Engine compared to the corresponding Phase 1 participant. Moreover, for none of the stories,is the observed distribution completely skewed towards the positive axes.
In order to rigorously characterize the performance of the Story Picturing Engine, we construct ahypothesis test for testing the mean of the observation X j (formed by combining X S
j for all the storiesS). The null hypothesis H0 states that the mean of X j is 0, while an alternate hypothesis H1 states that
ACM Transactions on Multimedia Computing, Communications and Applications, Vol. 2, No. 1, February 2006.

20 • D. Joshi et al.
Table III. The Table Shows the Distribution of Different Categories Among the Highest-Ranked
Pictures in Pool 1 and Pool 2, both Selected from the COREL Database. The Bold Numbers Represent
the Distribution Obtained with the Scheme B, while the nonbold Numbers Correspond to Scheme APool 1 Top 20 Ranks Top 40 Ranks Pool 2 Top 20 Ranks Top 40 Ranks
autumn 1 2 4 9 autumn 6 5 13 10England 14 6 23 10 England 5 5 6 9Death valley 2 5 6 12 dogs 1 6 6 13China 3 7 7 9 plants 8 4 15 8
the mean of X j is greater than 0. In order to test this hypothesis, we performed a one-sided Student’s Ttest at 5% significance level and the observed p-value came out to 0.0680 . Hence, at the 5% significancelevel, we cannot reject the null hypothesis H0, which states that our Story Picturing Engine performsequally well, on average, with a human being.
5. AN ALTERNATE RANKING SCHEME
The motivation for a ranking scheme based on mutual reinforcement is discussed in Section 1. Picturesmutually reinforce each other based on their similarity values, and the best among them are expected toreceive high ranks. However, sometimes, a few concepts may be overrepresented or a group of picturesdescribing a certain concept may be extremely self-reinforcing. In such an event, the proposed methodis likely to yield a number of very similar pictures as top-ranked. This is a characteristic of all mutualreinforcement-based methods. However, a simple modification of our present ranking scheme couldalleviate this problem. For demonstration of this modified technique, we use visual similarity-basedranks.
In the modified scheme, a post-ranking operation is performed as follows. We begin by choosing thehighest-ranked picture. At each subsequent step, we choose a picture only if it is sufficiently differentfrom the ones already selected (i.e., if its IRM distance from already selected pictures is greater thansome threshold). The threshold could be arbitrarily selected based on observed similarity values orstatistics gathered from the similarity data. For our experiments, we arbitrarily selected the thresholdas 20. For the remainder of the section, we will refer to the new ranking scheme as B and the originalranking scheme as A.
We compare the performance of A and B on a number of distinct pools of pictures representing avariety of concepts. The goal is to see the distribution of concepts in the highest-ranked pictures in eachpool. The procedure for the formation of picture pool is explained as follows.
(1) Pool 1 contains pictures corresponding to terms autumn, England, Death valley, China. 100 picturesper term are selected from the COREL database.
(2) Pool 2 contains pictures corresponding to terms autumn, England, dogs, plants. 100 pictures perterm are selected from the COREL database.
(3) Pool 3 contains pictures corresponding to terms egg, eggplant, egotist, elbow. The pictures areobtained using Google image search facility for each of these terms and the top 200 pictures perterm are selected. After removing pictures which have been fetched incompletely, we obtain a poolof 508 pictures.
Table III compares the performance of A and B on Pool 1 and Pool 2. It as is evident that these pools ofpictures suffer severely from self-reinforcement. In such a scenario, scheme B has a better distributionover concepts. Table IV, on the other hand, shows a group of pictures where self-reinforcement is notso severe. One of the reasons for this could be that pictures forming this pool are fetched from the Webwhich has a much more visually diverse content than the COREL picture dataset. Hence scheme Agives a fairly uniform distribution over concepts.
ACM Transactions on Multimedia Computing, Communications and Applications, Vol. 2, No. 1, February 2006.

The Story Picturing Engine—A System for Automatic Text Illustration • 21
Table IV. The Table Shows the Distribution of Different
Categories Among the Highest-Ranked Pictures in Pool 3.
The Bold Numbers Represent the Distribution Obtained
with the Scheme B, while the Nonbold Numbers
Correspond to Scheme APool 3 Top 20 Ranks Top 40 Ranks
egg 4 4 7 11eggplant 6 7 17 15egotist 5 4 8 8elbow 5 5 8 6
The performances of schemes A and B depend upon the story pictured. Let’s consider a situation whena certain concept has an abnormally large number of representatives in an image database. Scheme Bis expected to give good illustration in such a case. However, in the absence of such a self-reinforcementphenomenon in the database, scheme A, which has less overhead, would perform as well as scheme B.Alternatively, we can consider the similarity statistics of the picture pool to make decisions about theranking scheme.
6. CONCLUSIONS AND FUTURE WORK
In this article, we proposed a scheme for automated story picturing. Stopword elimination was per-formed, and the text of the story was processed using the Wordnet to form a list of keywords. Theset of proper nouns was also identified. An initial image pool was formed by searching an annotatedimage database using the lexical descriptors of the passage (keywords and proper nouns). An imageranking algorithm was applied to determine mutual reinforcement-based rank for each image. The fewhighest-ranked images are believed to be strong representatives of the ideas conveyed by the story.Performance of the algorithm on sample stories was shown in this article. Finally, a detailed user studywas conducted and the performance of our Story Picturing Engine was statistically characterized. Avariation of the suggested ranking scheme was also proposed to break the monopoly of picture cliqueswhich suffer from extreme self-reinforcement.
In the present implementation, the mutual reinforcement ranks are calculated in real time. Wewould like to build a system in which ranks are precalculated using the entire image database. In sucha system, the time for story picturing is expected to be drastically reduced. More advanced languageprocessing techniques can be incorporated into the Story Picturing Engine for richer performance. Weplan to integrate several image databases together and build an online system which can accept storiesgiven by users. Once the integration is achieved and an offline rank calculation system is built, ourStory Picturing Engine can potentially be used by teachers and students alike.
ACKNOWLEDGMENTS
Discussions with Ruqian Lu have been helpful. The authors would like to thank Q.-T. Luong, J. Trant,and AMICO for providing the image databases used in the project. Some stories for SPE experimentswere adopted from Q.-T. Luong’s Terragalleria and ARTKids Web sites.
REFERENCES
AGOSTI, M., CRESTANI, F., AND PASI, G. 2000. Lectures on information retrieval. Lecture Notes in Computer Science, vol. 1980 .
Springer-Verlag, Germany.
BARNARD, K., DUYGULU, P., FORSYTH, D., DE. FREITAS, N., BLEI, D. M., AND JORDAN, M. I. 2003. Matching words and pictures. J.Mach. Learn. Res. 3, 1107–1135.
BARNARD, K. AND FORSYTH, D. 2001. Learning the semantics of words and pictures. In Proceedings of the International Conferenceon Computer Vision. 408–415.
ACM Transactions on Multimedia Computing, Communications and Applications, Vol. 2, No. 1, February 2006.

22 • D. Joshi et al.
BLEI, D. M. AND JORDAN, M. I. 2003. Modeling annotated data. In Proceedings of the 26th Annual ACM SIGIR Conference onResearch and Development in Information Retrieval. 127–134.
BRIN, S. AND PAGE, L. 1998. The anatomy of a large-scale hypertextual web search engine. In Proceedings of the 7th InternationalWorld Wide Web Conference. 107–117.
BROWN, D. C. AND CHANDRASEKARAN, B. 1981. Design considerations for picture production in a natural language graphics
system. ACM SIGGRAPH Comput. Graph. 15, 2, 174–207.
BUDANITSKY, A. AND HIRST, G. 2001. Semantic distance in wordnet: An experimental, application-oriented evaluation of five
measures. In NAACL Workshop on WordNet and Other Lexical Resources.
CARNEIRO, G. AND VASCONCELOS, N. 2005. A database centric view of semantic image annotation and retrieval. In Proceedingsof the 28th Annual International ACM SIGIR Conference on Research and Development in Information Retrieval. 559–566.
CARSON, C., BELONGIE, S., GREENSPAN, H., AND MALIK, J. 2002. Blobworld: Color and texture-based image segmentation using
em and its application to image querying and classification. IEEE Trans. Patt. Anal. Machine Intell. 24, 8, 1026–1038.
CHEN, C., WACTLAR, H., WANG, J. Z., AND KIERNAN, K. 2005. Digital imagery for significant cultural and historical materials—an
emerging research field bridging people, culture, and technologies. Int. J. Digital Libraries Special Issue: Towards the New
Generation Digital Libraries 5, 4, 275–286.
CHEN, Y., WANG, J. Z., AND KROVETZ, R. 2005. Clue: Cluster-based retrieval of images by unsupervised learning. IEEE Trans.Image Proces. 14, 8, 1187–1201.
CLAY, S. R. AND WILHELMS, J. 1996. Put: Language-based interactive manipulation of objects. IEEE Comput. Graph. Ap-plica. 16, 2, 31–39.
COYNE, B. AND SPROAT, R. 2001. Wordseye: An automatic text-to-scene conversion system. In Proceedings of the 28th AnnualConference on Computer Graphics and Interactive Techniques. 487–496.
FELLBAUM, C. 1998. WordNet—An Electronic Lexical Database. MIT Press, Cambridge, MA and London, UK.
GARFIELD, E. 1972. Citation analysis as a tool in journal evaluation. Science 178, 471–479.
KAHN, K. M. 1979. Creation of computer animation from story descriptions. Ph.D. thesis, MIT, Cambridge, MA.
KLEINBERG, J. M. 1999. Authoritative sources in a hyperlinked environment. J. ACM 46, 5, 604–632.
LAVRENKO, V., MANMATHA, R., AND JEON, J. 2003. A model for learning the semantics of pictures. In Proceedings of Advances inNeural Information Processing Systems 16.
LI, J. AND WANG, J. Z. 2003. Automatic linguistic indexing of pictures by a statistical modeling approach. IEEE Trans. Patt.Analy. Machine Intell. 25, 9, 1075–1088.
LI, J. AND WANG, J. Z. 2004. Studying digital imagery of ancient paintings by mixtures of stochastic models. IEEE Trans.Image Proces. 13, 3, 340–353.
LI, L., SHANG, Y., AND ZHANG, W. 2002. Improvement of hits-based algorithms on web documents. In Proceedings of the 11thInternational World Wide Web Conference. 527–535.
LU, R. AND ZHANG, S. 2002. Automatic Generation of Computer Animation. Lecture Notes in Artificial Intelligent, vol. 2160.
Springer-Verlag, Germany.
MA, W. Y. AND MANJUNATH, B. S. 1999. Netra: A toolbox for navigating large image databases. Multimedia Syst. 7, 3, 184–198.
MILLER, G., BECKWITH, R., FELLBAUM, C., GROSS, D., AND MILLER, K. 1990. Introduction to wordnet: An online lexical database.
J. Lexicography 3, 4, 235–244.
PINSKI, G. AND NARIN, F. 1976. Citation influence for journal aggregates of scientific publications: Theory, with application to
the literature of physics. Inform. Proces. Manag. 12, 297–312.
REYNOLDS, C. W. 1982. Computer animation with scripts and actors. Comput. Graph. 16, 3, 289–296.
SMEULDERS, A. W., WORRING, M., SANTINI, S., GUPTA, A., AND JAIN, R. 2000. Content-based image retrieval at the end of the early
years. IEEE Trans. Patt. Analy. Machine Intell. 22, 12, 1349–1380.
WANG, J. Z., LI, J., AND WIEDERHOLD, G. 2001. Simplicity: Semantics-sensitive integrated matching for picture libraries. IEEETrans. Patt. Analy. Machine Intell. 23, 9, 947–963.
ZHA, H. 2002. Generic summarization and keyphrase extraction using mutual reinforcement principle and sentence clustering.
In Proceedings of the 25th Annual International ACM SIGIR Conference on Research and Development in Information Retrieval.113–120.
Received April 2005; revised August 2005; accepted November 2005
ACM Transactions on Multimedia Computing, Communications and Applications, Vol. 2, No. 1, February 2006.