on shape and the computability of emotionsinfolab.stanford.edu/~wangz/project/imsearch/... · on...
TRANSCRIPT

On Shape and the Computability of Emotions
Xin Lu Poonam Suryanarayan Reginald B. Adams, Jr.Jia Li Michelle G. Newman James Z. Wang
∗
The Pennsylvania State University, University Park, Pennsylvania{xinlu, pzs126, regadams, jiali, mgn1, jwang}@psu.edu
ABSTRACTWe investigated how shape features in natural imagesinfluence emotions aroused in human beings. Shapesand their characteristics such as roundness, angularity,simplicity, and complexity have been postulated toaffect the emotional responses of human beings inthe field of visual arts and psychology. However,no prior research has modeled the dimensionality ofemotions aroused by roundness and angularity. Ourcontributions include an in-depth statistical analysis tounderstand the relationship between shapes and emotions.Through experimental results on the International AffectivePicture System (IAPS) dataset we provide evidence forthe significance of roundness-angularity and simplicity-complexity on predicting emotional content in images.We combine our shape features with other state-of-the-art features to show a gain in prediction and classificationaccuracy. We model emotions from a dimensionalperspective in order to predict valence and arousal ratingswhich have advantages over modeling the traditional discreteemotional categories. Finally, we distinguish images withstrong emotional content from emotionally neutral imageswith high accuracy.
Categories and Subject DescriptorsH.3.1 [Information Storage and Retrieval]: Contentanalysis and indexing; I.4.7 [Image Processing andComputer Vision]: Feature measurement
General TermsAlgorithms, Experimentation, Human Factors
∗J. Li and J. Z. Wang are also affiliated with the NationalScience Foundation. This material is based upon worksupported by the Foundation. Any opinions, findings, andconclusions or recommendations expressed in this materialare those of the authors and do not necessarily reflect theviews of the Foundation.
Permission to make digital or hard copies of all or part of this work forpersonal or classroom use is granted without fee provided that copies arenot made or distributed for profit or commercial advantage and that copiesbear this notice and the full citation on the first page. To copy otherwise, torepublish, to post on servers or to redistribute to lists, requires prior specificpermission and/or a fee.MM’12, October 29-November 2, 2012, Nara, Japan.Copyright 2012 ACM 978-1-4503-1089-5/12/10 ...$15.00.
KeywordsHuman Emotion, Psychology, Shape Features
1. INTRODUCTIONThe study of human visual preferences and the emotions
imparted by various works of art and natural images has longbeen an active topic of research in the field of visual arts andpsychology. A computational perspective to this problemhas interested many researchers and resulted in articles onmodeling the emotional and aesthetic content in images [10,11, 13]. However, there is a wide gap between whathumans can perceive and feel and what can be explainedusing current computational image features. Bridgingthis gap is considered the “holy grail” of computer visionand the multimedia community. There have been manypsychological theories suggesting a link between humanaffective responses and the low-level features in images apartfrom the semantic content. In this work, we try to extendour understanding of some of the low-level features whichhave not been explored in the study of visual affect throughextensive statistical analyses.
In contrast to prior studies on image aesthetics, whichintended to estimate the level of visual appeal [10], we try toleverage some of the psychological studies on characteristicsof shapes and their effect on human emotions. Thesestudies indicate that roundness and complexity of shapesare fundamental to understanding emotions.
• Roundness - Studies [4, 21] indicate that geometricproperties of visual displays convey emotions like angerand happiness. Bar et al. [5] confirm the hypothesisthat curved contours lead to positive feelings and thatsharp transitions in contours trigger a negative bias.
• Complexity of shapes - As enumerated in variousworks of art, humans visually prefer simplicity.Any stimulus pattern is always perceived in themost simplistic structural setting. Though theperception of simplicity is partially subjective toindividual experiences, it can also be highly affectedby two objective factors, parsimony and orderliness.Parsimony refers to the minimalistic structures thatare used in a given representation, whereas orderlinessrefers to the simplest way of organizing thesestructures [3].
These findings provide an intuitive understanding of thelow-level image features that motivate the affective response,but the small scale of studies from which the inferences havebeen drawn makes the results less convincing. In order
Valance
Arousal
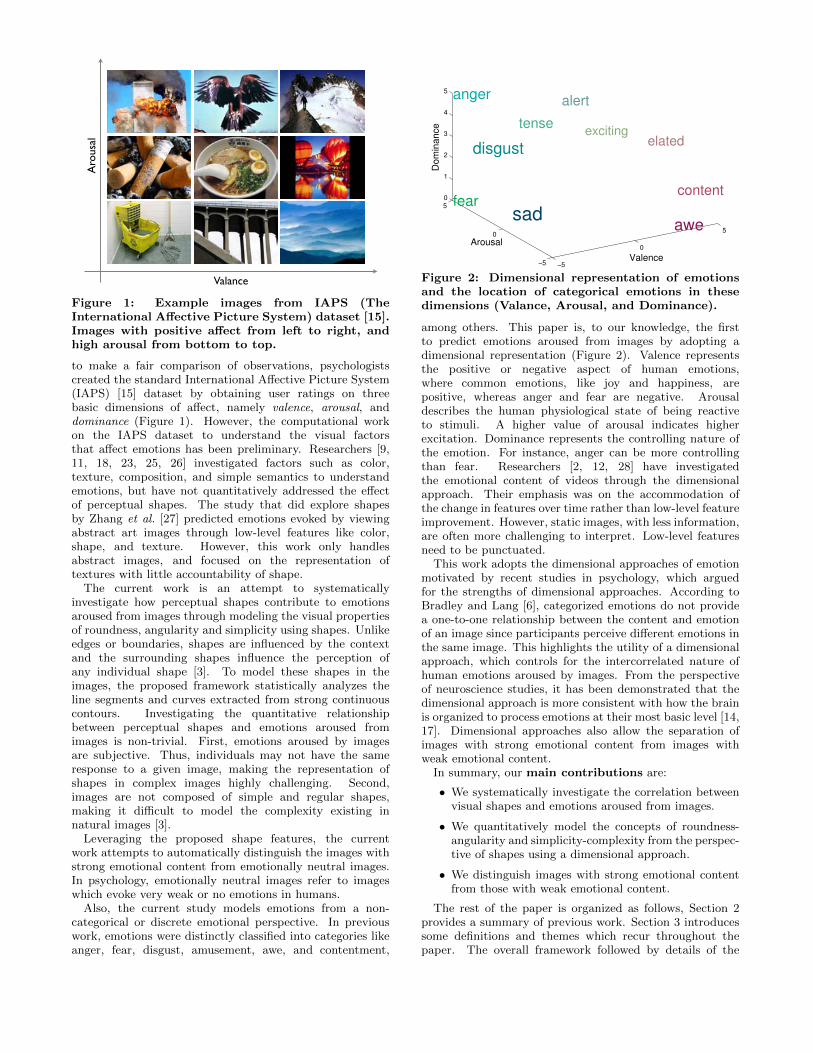
Figure 1: Example images from IAPS (TheInternational Affective Picture System) dataset [15].Images with positive affect from left to right, andhigh arousal from bottom to top.
to make a fair comparison of observations, psychologistscreated the standard International Affective Picture System(IAPS) [15] dataset by obtaining user ratings on threebasic dimensions of affect, namely valence, arousal, anddominance (Figure 1). However, the computational workon the IAPS dataset to understand the visual factorsthat affect emotions has been preliminary. Researchers [9,11, 18, 23, 25, 26] investigated factors such as color,texture, composition, and simple semantics to understandemotions, but have not quantitatively addressed the effectof perceptual shapes. The study that did explore shapesby Zhang et al. [27] predicted emotions evoked by viewingabstract art images through low-level features like color,shape, and texture. However, this work only handlesabstract images, and focused on the representation oftextures with little accountability of shape.
The current work is an attempt to systematicallyinvestigate how perceptual shapes contribute to emotionsaroused from images through modeling the visual propertiesof roundness, angularity and simplicity using shapes. Unlikeedges or boundaries, shapes are influenced by the contextand the surrounding shapes influence the perception ofany individual shape [3]. To model these shapes in theimages, the proposed framework statistically analyzes theline segments and curves extracted from strong continuouscontours. Investigating the quantitative relationshipbetween perceptual shapes and emotions aroused fromimages is non-trivial. First, emotions aroused by imagesare subjective. Thus, individuals may not have the sameresponse to a given image, making the representation ofshapes in complex images highly challenging. Second,images are not composed of simple and regular shapes,making it difficult to model the complexity existing innatural images [3].
Leveraging the proposed shape features, the currentwork attempts to automatically distinguish the images withstrong emotional content from emotionally neutral images.In psychology, emotionally neutral images refer to imageswhich evoke very weak or no emotions in humans.
Also, the current study models emotions from a non-categorical or discrete emotional perspective. In previouswork, emotions were distinctly classified into categories likeanger, fear, disgust, amusement, awe, and contentment,
−5
0
5
−5
0
5
0
1
2
3
4
5
awe
fearcontent
sad
elatedexciting
disgust
tense
alertanger
Dom
inance
Valence
Arousal
Figure 2: Dimensional representation of emotionsand the location of categorical emotions in thesedimensions (Valance, Arousal, and Dominance).
among others. This paper is, to our knowledge, the firstto predict emotions aroused from images by adopting adimensional representation (Figure 2). Valence representsthe positive or negative aspect of human emotions,where common emotions, like joy and happiness, arepositive, whereas anger and fear are negative. Arousaldescribes the human physiological state of being reactiveto stimuli. A higher value of arousal indicates higherexcitation. Dominance represents the controlling nature ofthe emotion. For instance, anger can be more controllingthan fear. Researchers [2, 12, 28] have investigatedthe emotional content of videos through the dimensionalapproach. Their emphasis was on the accommodation ofthe change in features over time rather than low-level featureimprovement. However, static images, with less information,are often more challenging to interpret. Low-level featuresneed to be punctuated.
This work adopts the dimensional approaches of emotionmotivated by recent studies in psychology, which arguedfor the strengths of dimensional approaches. According toBradley and Lang [6], categorized emotions do not providea one-to-one relationship between the content and emotionof an image since participants perceive different emotions inthe same image. This highlights the utility of a dimensionalapproach, which controls for the intercorrelated nature ofhuman emotions aroused by images. From the perspectiveof neuroscience studies, it has been demonstrated that thedimensional approach is more consistent with how the brainis organized to process emotions at their most basic level [14,17]. Dimensional approaches also allow the separation ofimages with strong emotional content from images withweak emotional content.
In summary, our main contributions are:
• We systematically investigate the correlation betweenvisual shapes and emotions aroused from images.
• We quantitatively model the concepts of roundness-angularity and simplicity-complexity from the perspec-tive of shapes using a dimensional approach.
• We distinguish images with strong emotional contentfrom those with weak emotional content.
The rest of the paper is organized as follows, Section 2provides a summary of previous work. Section 3 introducessome definitions and themes which recur throughout thepaper. The overall framework followed by details of the

perceptual shape descriptors are described in Section 4.Experimental results and in-depth analyses are presentedin Section 5. We conclude in Section 6.
2. RELATED WORKPrevious work [11, 26, 18] predicted emotions aroused by
images mainly through training classifiers on visual featuresto distinguish categorical emotions, such as happiness,anger, and sad. Low-level stimuli such as color andcomposition have been widely used in computationalmodeling of emotions. Affective concepts were modeledusing color palettes, which showed that the bag of colorsand Fisher vectors (i.e., higher order statistics about thedistribution of local descriptors) were effective [9]. Zhanget al. [27] characterized shape through Zernike features,edge statistics features, object statistics, and Gabor filters.Emotion-histogram and bag-of-emotion features were usedto classify emotions by Solli et al. [24]. These emotionmetrics were extracted based on the findings from psycho-physiological experiments indicating that emotions can berepresented through homogeneous emotion regions andtransitions among them.
The first work that comprehensively modeled categoricalemotions, Machajdik and Hanbury [18] used color, texture,composition, content, and semantic level features such asnumber of faces to model eight discrete emotional categories.Besides the eight basic emotions, to model categorizedemotions, adjectives or word pairs were used to representhuman emotions. The earliest work based on the Kanseisystem employs 23 word pairs (e.g., like-dislike, warm-cool, cheerful-gloomy) to establish the emotional space [23].Along the same lines, researchers enumerated more wordpairs to reach a universal, distinctive, and comprehensiverepresentation of emotions in Wang et al. [25]. Yet, theaforementioned approaches of emotion representation ignorethe interrelationship among types of emotions.
3. CONCEPT INTERPRETATIONThis work captures emotions evoked by images by
leveraging shape descriptors. Shapes in images aredifficult to capture, mainly due to the perceptual andmerging boundaries of objects which are often not easyto differentiate using even state-of-the-art segmentationor contour extraction algorithms. In contemporarycomputer vision literature [7, 20], there are a number ofstatistical representations of shape through characteristicslike the straightness, sinuosity, linearity, circularity,elongation, orientation, symmetry, and the mass of a curve.We chose roundness-angularity and simplicity-complexitycharacteristics because they have been found previously bypsychologists to influence the affect of human beings throughcontrolled human subject studies. Symmetry is also knownto effect emotion and aesthetics of images [22]. However,quantifying symmetry in natural images is challenging.
To make it more convenient to introduce the shapefeatures proposed, this section defines the four termsused: line segments, angles, continuous lines, and curves.The framework for extracting perceptual shapes throughlines and curves is derived from [8]. The contours areextracted using the algorithm in [1], which used color,texture, and brightness of each image for contour extraction.The extracted contours are of different intensities andindicate the algorithm’s confidence on the presence of edges.
Considering the temporal resolution of our vision system, weadopted a threshold of 40%. Example results are presentedin Figures 3, 4, 5, and 6. Pixels with an intensity higher than40% are treated equally, which results in the binary contourmap presented in the second column. The last three columnsshow the line segments, continuous lines, and curves.
Line segments - Line segments refer to short straightlines generated by fitting nearby pixels. We generated linesegments from each image to capture its structure. Fromthe structure of the image, we propose to interpret thesimplicity-complexity. We extracted locally optimized linesegments by connecting neighboring pixels from the contoursextracted from the image [16].
Angles - Angles in the image are obtained by calculatingangles between each of any two intersecting line segmentsextracted previously. According to Julian Hochberg’stheory [3], the number of angles and the number of differentangles in an image can be effectively used to describeits simiplicity-complexity. The distribution of angles alsoindicates the degree of angularity of the image. A highnumber of acute angles makes an image more angular.
Continuous lines - Continuous lines are generatedby connecting intersecting line segments having the sameorientations with a small margin of error. Line segmentsof inconsistent orientations can be categorized as eithercorner points or points of inflexion. Corner points, shown inFigure 7(a), refer to angles that are lower than 90 degrees.Inflexion points, shown in Figure 7(b), refer to the midpointof two angles with opposite orientations. Continuous linesand the degree of curving can be used to interpret thecomplexity of the image.
Curves - Curves are a subset of continuous lines, thecollection of which are employed to measure the roundnessof an image. To achieve this, we consider each curve as asection of an ellipse, thus we use ellipses to fit continuouslines. Fitted curves are represented by parameters of itscorresponding ellipses.
4. CAPTURING EMOTION FROM SHAPEFor decades, numerous theories have been promoted that
are focused on the relationship between emotions and thevisual characteristics of simplicity, complexity, roundness,and angularity. Despite these theories, researchers have yetto resolve how to model these relationships quantitatively.In this section, we propose to use shape features tocapture those visual characteristics. By identifying thelink between shape features and emotions, we are ableto determine the relationship between the aforementionedvisual characteristics and emotions.
We now present the details of the proposed shape features:line segments, angles, continuous lines, and curves. A totalof 219 shape features are summarized in Table 1.
4.1 Line segmentsPsychologists and artists have claimed that the simplicity-
complexity of an image is determined not only by lines orcurves, but also by its overall structure and support [3].Based on this idea, we employed line segments extractedfrom images to capture their structure. Particularly, weused the orientation, length, and mass of line segments todetermine the complexity of the images.
Orientation - To capture an overall orientation, weemployed statistical measures of minimum (min), maximum

(a) Original (b) Contours (c) Line segments (d) Continuous lines (e) Ellipse on curves
Figure 3: Perceptual shapes of images with high valance.
(a) Original (b) Contours (c) Line segments (d) Continuous lines (e) Ellipse on curves
Figure 4: Perceptual shapes of images with low valance.
Table 1: Summary of shape features.Category Short Name #
Line Segments Orientation 60Length 11
Mass of the image 4Continuous Lines Degree of curving 14
Length span 9Line count 4
Mass of continuous lines 4Angles Angle count 3
Angular metrics 35Curves Fitness 14
Circularity 17Area 8
Orientation 14Mass of curves 4
Top round curves 18
(max), 0.75 quantile, 0.25 quantile, the difference between0.75 quantile and 0.25 quantile, the difference betweenmax and min, sum, total number, median, mean, andstandard deviation (we will later refer to these as {statisticalmeasures}), and entropy. We experimented with both 6- and18-bin histograms. The unique orientations were measuredbased on the two histograms to capture the simplicity-complexity of the image.
Among all line segments, horizontal lines and vertical linesare known [3] to be static and to represent the feelings ofcalm and stability within the image. Horizontal lines suggestpeace and calm, whereas vertical lines indicate strength.To capture the emotions evoked by these characteristics,we counted the number of horizontal lines and verticallines through an 18-bin histogram. The orientation θ, ofhorizontal lines fall within 0◦ < θ < 10◦ or 170◦ < θ < 180◦,and 80◦ < θ < 100◦ for vertical lines.
Length - The length of line segments reflects thesimplicity of images. Images with simple structure mightuse long lines to fit contours, whereas complex contourshave shorter lines. We characterized the length distributionby calculating the {statistical measures} of lengths of linesegments within the image.
Mass of the image - The centroid of line segments mayindicate associated relationships among line segments withinthe visual design [3]. Hence, we calculate the mean andstandard deviation of the x and y coordinates of the linesegments to find the mass of each image.
Some of the example images and their features arepresented in Figures 8 and 9. Figure 8 presents the tenlowest mean values of the length of line segments. The firstrow shows the original images, the second row shows the

(a) Original (b) Contours (c) Line segments (d) Continuous lines (e) Ellipse on curves
Figure 5: Perceptual shapes of images with high arousal.
(a) Original (b) Contours (c) Line segments (d) Continuous lines (e) Ellipse on curves
Figure 6: Perceptual shapes of images with low arousal.
line segments extracted from these images and the third rowshows the 18-bin histogram for line segments in the images.The 18 bins refer to the number of line segments with anorientation of [−90 + 10(i − 1),−90 + 10i) degrees wherei ∈ {1, 2, ..., 18}. Similarly, Figure 9 presents the ten highestmean values of the length of line segments.
(a) Corner point (b) Point of inflexion
Figure 7: The corner point and point of inflexion.
These two figures indicate that the length or theorientation cannot be examined separately to determine thesimplicity-complexity of the image. Lower mean values ofthe length of line segments might refer to either simpleimages such as the first four images in Figure 8 or highlycomplex images such as the last four images in that figure.The histogram of the orientation of line segments helps usto distinguish the complex images from simple images byexamining variation of values in each bin.
4.2 AnglesAngles are important elements in analyzing the simplicity-
complexity and the angularity of an image. We capture thevisual characteristics from angles through two perspectives.
• Angle count - We first calculate the two quantitative
features claimed by Julian Hochberg, who hasattempted to define simplicity (he used the value-laden term “figural goodness”) via information theory:“The smaller the amount of information needed todefine a given organization as compared to the otheralternatives, the more likely that the figure will beso perceived” [3]. Hence this minimal informationstructure is captured using the number of angles andthe percentage of unique angles in the image.
• Angular metrics - We use the {statistical measures}to extract angular metrics. We also calculate the 6-and 18-bin histograms on angles and their entropies.
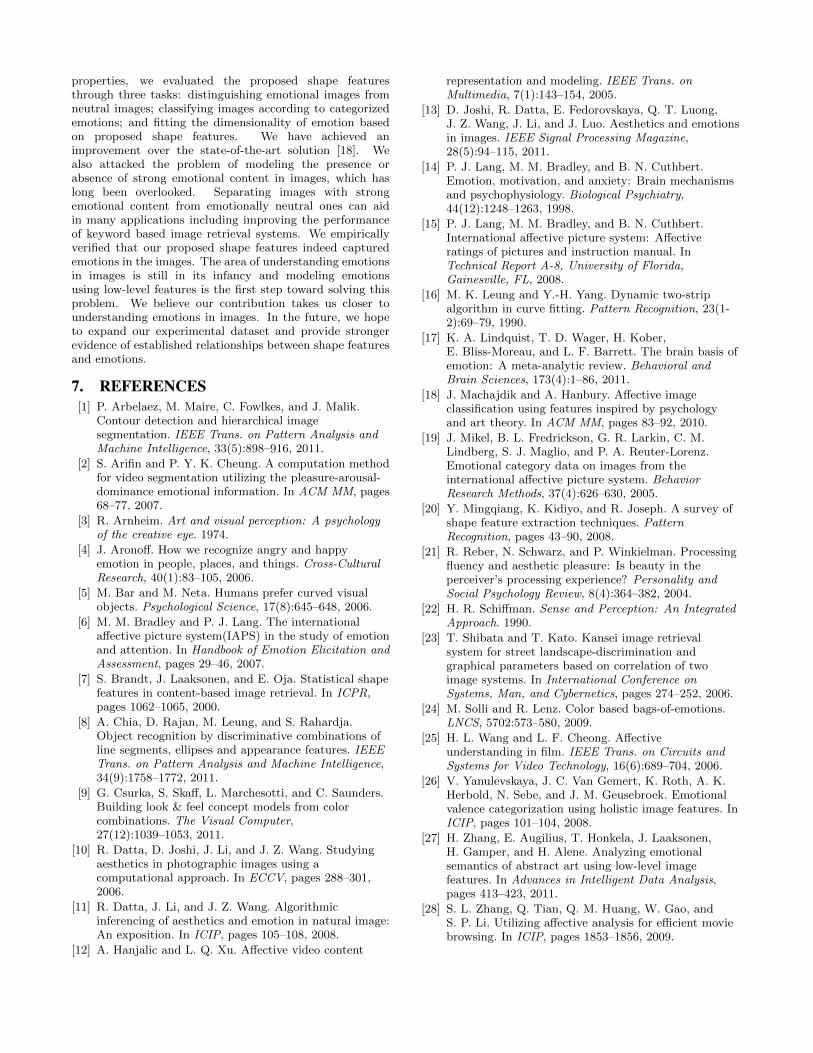
Some of the example images and features are presented inFigures 10 and 11. Images with lowest and highest numberof angles are shown along with their corresponding contoursin Figure 10. These examples show promising relationshipsbetween angular features and simplicity-complexity of theimage. Example results for the histogram of angles in theimage are presented in Figure 11. The 18 bins refer to thenumber of line segments with an orientation in [10(i−1), 10i)degrees where i ∈ {1, 2, ..., 18}.
4.3 Continuous linesWe attempt to capture the degree of curvature from
continuous lines, which has implications for the simplicity-complexity of images. We also calculated the numberof continuous lines, which is the third quantitativefeature specified by Julian Hochberg [3]. For continuouslines, open/closeness are factors affecting the simplicity-complexity of an image. In the following, we focus on the

0 2 4 6 8 10 12 14 16 18 200
0.1
0.2
0.3
0.4
0.5
0.6
0.7
0.8
0.9
1
0 2 4 6 8 10 12 14 16 18 200
0.1
0.2
0.3
0.4
0.5
0.6
0.7
0.8
0.9
1
0 2 4 6 8 10 12 14 16 18 200
0.1
0.2
0.3
0.4
0.5
0.6
0.7
0.8
0.9
1
0 2 4 6 8 10 12 14 16 18 200
0.02
0.04
0.06
0.08
0.1
0.12
0.14
0.16
0 2 4 6 8 10 12 14 16 18 200
0.02
0.04
0.06
0.08
0.1
0.12
0.14
0 2 4 6 8 10 12 14 16 18 200
0.02
0.04
0.06
0.08
0.1
0.12
0 2 4 6 8 10 12 14 16 18 200
0.02
0.04
0.06
0.08
0.1
0.12
0.14
0.16
0 2 4 6 8 10 12 14 16 18 200
0.02
0.04
0.06
0.08
0.1
0.12
0.14
0.16
0 2 4 6 8 10 12 14 16 18 200
0.02
0.04
0.06
0.08
0.1
0.12
0.14
0.16
0.18
0.2
0 2 4 6 8 10 12 14 16 18 200
0.02
0.04
0.06
0.08
0.1
0.12
0.14
0.16
Figure 8: Images with low mean value of the length of line segments and their associated orientationhistograms. The first row is the original images; the second row shows the line segments; and the thirdrow shows the 18-bin histogram for line segments in the images.
0 2 4 6 8 10 12 14 16 18 200
0.1
0.2
0.3
0.4
0.5
0.6
0.7
0.8
0 2 4 6 8 10 12 14 16 18 200
0.1
0.2
0.3
0.4
0.5
0.6
0.7
0.8
0 2 4 6 8 10 12 14 16 18 200
0.05
0.1
0.15
0.2
0.25
0.3
0.35
0.4
0.45
0 2 4 6 8 10 12 14 16 18 200
0.05
0.1
0.15
0.2
0.25
0.3
0.35
0 2 4 6 8 10 12 14 16 18 200
0.05
0.1
0.15
0.2
0.25
0.3
0.35
0 2 4 6 8 10 12 14 16 18 200
0.1
0.2
0.3
0.4
0.5
0.6
0.7
0 2 4 6 8 10 12 14 16 18 200
0.05
0.1
0.15
0.2
0.25
0.3
0.35
0.4
0.45
0.5
0 2 4 6 8 10 12 14 16 18 200
0.05
0.1
0.15
0.2
0.25
0.3
0.35
0 2 4 6 8 10 12 14 16 18 200
0.05
0.1
0.15
0.2
0.25
0 2 4 6 8 10 12 14 16 18 200
0.05
0.1
0.15
0.2
0.25
0.3
0.35
0.4
0.45
Figure 9: Images with high mean value of the length of line segments and their associated orientationhistograms. The first row is the original images; the second row shows the line segments; and the thirdrow shows the 18-bin histogram for line segments in the images.
calculation of the degree of curving, the length span value,and the number of open lines and closed lines. The lengthspan refers to the highest Euclidean distance among all pairsof points on the continuous lines.
Length Span(l) = maxpi∈l,pj∈l
EuclideanDist(pi, pj), (1)
where {p1, p2, ..., pN} are the points on continuous line l.
• Degree of curving - We calculated the degree ofcurving of each line as
Degree of Curving(l) = Length Span(l)/N, (2)
where N is the number of points on continuous line l.
To capture the statistical characteristics of contiguouslines in the image, we calculated the {statisticalmeasures}. We also generated a 5-bin histogram onthe degree of curving of all continuous lines (Figures 12and 13).
• Length span - We used {statistical measures} for thelength span of all continuous lines.
• Line count - We counted the total number ofcontinuous lines, the total number of open lines, andthe total number of closed lines in the image.
4.4 CurvesWe used the nature of curves to model the roundness of
images. For each curve, we calculated the extent of fit toan ellipse as well as the parameters of the ellipse such as itsarea, circularity, and mass of curves. The curve features areexplained in detail below.
• Fitness, area, circularity - The fitness of an ellipserefers to the overlap between the proposed ellipse andthe curves in the image. The area of the fitted ellipse
Table 2: Average number of curves in terms of thevalue of fitness in positive and negative images.
(0.8, 1] (0.6, 0.8] (0.4, 0.6] (0.2, 0.4]Positive imgs 2.12 9.33 5.7 2.68Negative imgs 1.42 7.5 5.02 2.73
Table 3: Average number of curves in terms of thevalue of circularity in positive and negative images.
(0.8, 1] (0.6, 0.8] (0.4, 0.6] (0.2, 0.4]Positive imgs 0.96 2.56 5.1 11.2Negative imgs 0.73 2.19 4 9.75
is also calculated. The circularity is represented bythe ratio of the minor and major axes of the ellipses.The angular orientation of the ellipse is also measured.For each of the measures, we used the {statisticalmeasures} and entropies of the histograms as thefeatures to depict the roundness of the image.
• Mass of curves - We used the mean value andstandard deviation of (x, y) coordinates to describethe mass of curves.
• Top round curves - To make full use of thediscovered curves and to depict roundness, we includedthe fitness, area, circularity, and mass of curves foreach of the top three curves.
To examine the relationship between curves and positive-negative images, we calculated the average number of curvesin terms of values of circularity and fitness on positive images(i.e., the value is higher than 6 in the dimension of valance)and negative images (i.e., the value is lower than 4.5 in thedimension of valance).
The results are shown in Tables 2 and 3. Positive images
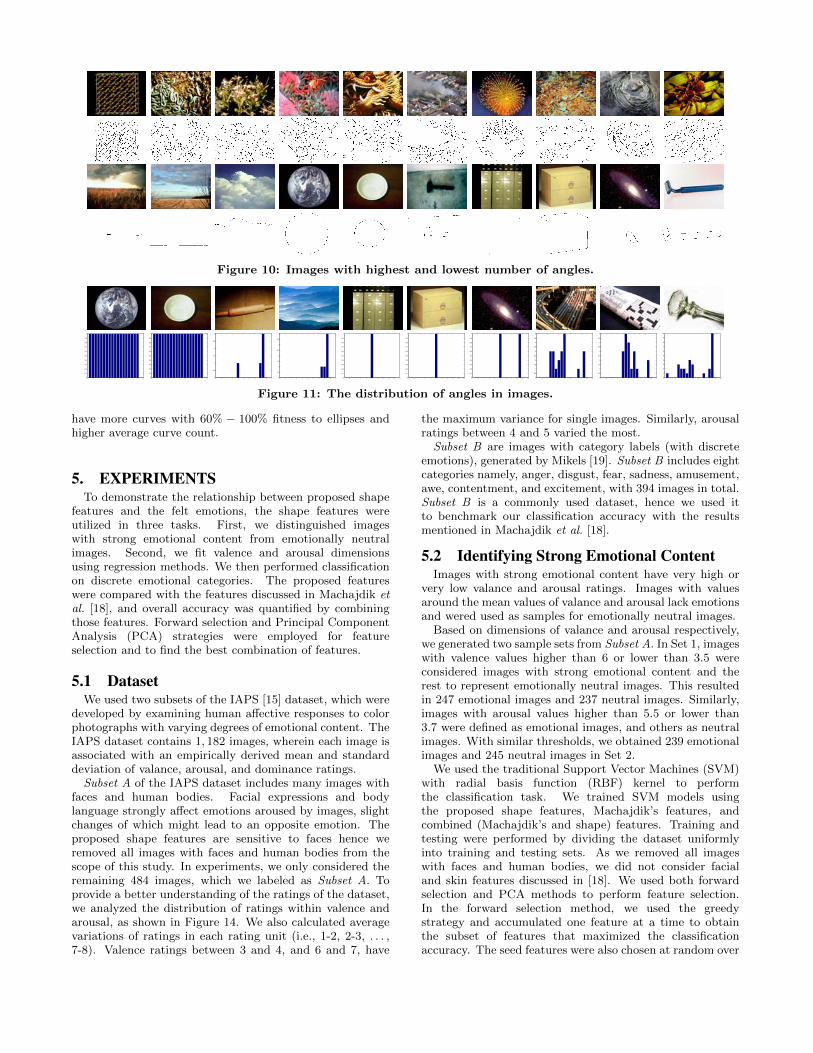
Figure 10: Images with highest and lowest number of angles.
0 2 4 6 8 10 12 14 16 18 200
0.1
0.2
0.3
0.4
0.5
0.6
0.7
0.8
0.9
1
0 2 4 6 8 10 12 14 16 18 200
0.1
0.2
0.3
0.4
0.5
0.6
0.7
0.8
0.9
1
0 2 4 6 8 10 12 14 16 18 200
0.5
1
1.5
2
2.5
3
0 2 4 6 8 10 12 14 16 18 200
0.5
1
1.5
2
2.5
3
3.5
4
0 2 4 6 8 10 12 14 16 18 200
0.1
0.2
0.3
0.4
0.5
0.6
0.7
0.8
0.9
1
0 2 4 6 8 10 12 14 16 18 200
0.1
0.2
0.3
0.4
0.5
0.6
0.7
0.8
0.9
1
0 2 4 6 8 10 12 14 16 18 200
0.1
0.2
0.3
0.4
0.5
0.6
0.7
0.8
0.9
1
0 2 4 6 8 10 12 14 16 18 200
0.5
1
1.5
2
2.5
3
3.5
4
4.5
5
0 2 4 6 8 10 12 14 16 18 200
0.5
1
1.5
2
2.5
3
3.5
4
4.5
5
0 2 4 6 8 10 12 14 16 18 200
1
2
3
4
5
6
7
8
9
10
Figure 11: The distribution of angles in images.
have more curves with 60% − 100% fitness to ellipses andhigher average curve count.
5. EXPERIMENTSTo demonstrate the relationship between proposed shape
features and the felt emotions, the shape features wereutilized in three tasks. First, we distinguished imageswith strong emotional content from emotionally neutralimages. Second, we fit valence and arousal dimensionsusing regression methods. We then performed classificationon discrete emotional categories. The proposed featureswere compared with the features discussed in Machajdik etal. [18], and overall accuracy was quantified by combiningthose features. Forward selection and Principal ComponentAnalysis (PCA) strategies were employed for featureselection and to find the best combination of features.
5.1 DatasetWe used two subsets of the IAPS [15] dataset, which were
developed by examining human affective responses to colorphotographs with varying degrees of emotional content. TheIAPS dataset contains 1, 182 images, wherein each image isassociated with an empirically derived mean and standarddeviation of valance, arousal, and dominance ratings.
Subset A of the IAPS dataset includes many images withfaces and human bodies. Facial expressions and bodylanguage strongly affect emotions aroused by images, slightchanges of which might lead to an opposite emotion. Theproposed shape features are sensitive to faces hence weremoved all images with faces and human bodies from thescope of this study. In experiments, we only considered theremaining 484 images, which we labeled as Subset A. Toprovide a better understanding of the ratings of the dataset,we analyzed the distribution of ratings within valence andarousal, as shown in Figure 14. We also calculated averagevariations of ratings in each rating unit (i.e., 1-2, 2-3, . . . ,7-8). Valence ratings between 3 and 4, and 6 and 7, have
the maximum variance for single images. Similarly, arousalratings between 4 and 5 varied the most.
Subset B are images with category labels (with discreteemotions), generated by Mikels [19]. Subset B includes eightcategories namely, anger, disgust, fear, sadness, amusement,awe, contentment, and excitement, with 394 images in total.Subset B is a commonly used dataset, hence we used itto benchmark our classification accuracy with the resultsmentioned in Machajdik et al. [18].
5.2 Identifying Strong Emotional ContentImages with strong emotional content have very high or
very low valance and arousal ratings. Images with valuesaround the mean values of valance and arousal lack emotionsand wered used as samples for emotionally neutral images.
Based on dimensions of valance and arousal respectively,we generated two sample sets from Subset A. In Set 1, imageswith valence values higher than 6 or lower than 3.5 wereconsidered images with strong emotional content and therest to represent emotionally neutral images. This resultedin 247 emotional images and 237 neutral images. Similarly,images with arousal values higher than 5.5 or lower than3.7 were defined as emotional images, and others as neutralimages. With similar thresholds, we obtained 239 emotionalimages and 245 neutral images in Set 2.
We used the traditional Support Vector Machines (SVM)with radial basis function (RBF) kernel to performthe classification task. We trained SVM models usingthe proposed shape features, Machajdik’s features, andcombined (Machajdik’s and shape) features. Training andtesting were performed by dividing the dataset uniformlyinto training and testing sets. As we removed all imageswith faces and human bodies, we did not consider facialand skin features discussed in [18]. We used both forwardselection and PCA methods to perform feature selection.In the forward selection method, we used the greedystrategy and accumulated one feature at a time to obtainthe subset of features that maximized the classificationaccuracy. The seed features were also chosen at random over

Figure 12: Images with highest degree of curving.
Figure 13: Images with lowest degree of curving.
1 2 3 4 5 6 7 8 90
10
20
30
40
50
60
70
80
90
Ratings
Nu
mb
er
of
Ima
ge
s
Valence
1 2 3 4 5 6 7 80
10
20
30
40
50
60
70
80
90
100
Ratings
Num
ber
of Im
ages
Arousal
(a) Valence (b) Arousal
Figure 14: Distribution of ratings in IAPS.
70
71.5
73
74.5
76
Shape Features Machajdik’s Features All Features
Set 1 Set 2
70
72
74
76
78
Shape Features Machajdik’s Features All Features
Set 1 Set 2
(a) With PCA feature selection (b) Without PCA
Figure 15: Classification accuracy (%) for emotionalimages and neutral images (Set 1 and Set 2 aredefined in Section 5.2).
multiple iterations to obtain better results. Our analysesshowed that the forward selection strategy achieved greateraccuracy for Set 2, whereas PCA performed better forSet 1 (Figure 15). The feature comparison showed thatthe combined (Machajdik’s and shape) features achievedthe highest classification accuracy, whereas individuallythe shape features alone were much stronger than thefeatures from [18] (Machajdik’s features). This resultis intuitive since emotions evoked by images cannot bewell represented by shapes alone and can definitely bebolstered by other image features including their colorcomposition and texture. By analyzing valence and arousalratings of the correctly classified images, we observedthat very complex/simple, round and angular images hadstrong emotional content and high valence values. Simplestructured images with very low degrees of curving alsotends to portray strong emotional content as well as to havehigh arousal values.
By analyzing the individual features for classificationaccuracy we found that line count, fitness, length span,degree of curving, and the number of horizontal linesachieved the best classification accuracy in Set 1. Fitnessand line orientation were more dominant in Set 2.
We present a few example images, which were wronglyclassified based on the proposed shape features in Figures 16and 17. The misclassification can be explained as ashortcoming of the shape features in understanding thesemantics. Some of the images generated extreme emotionsbased on image content irrespective of the low-level features.Besides the semantics, our performance was also limited bythe performance of the contour extraction algorithm.
5.3 Fitting the Dimensionality of EmotionEmotions can be represented by word pairs, as previously
done in [23]. However, some emotions are difficult to label.Modeling basic emotional dimensions helps in alleviatingthis problem. We represented emotion as a tuple consistingof valence and arousal values. The values of valence andarousal were in the range of (1, 9). In order to predictthe values of valence and arousal we proposed to learn aregression model for either dimension separately.
We used SVM regression with RBF kernel to modelthe valance and arousal values using shape, Machajdik’sfeatures, as well as the combination of features. The meansquared error (MSE) was computed for each of the individualfeatures as well as combined for both valence and arousalvalues separately. The MSE values are shown in Figure18(a). These figures show that the valance values weremodeled more accurately by Machajdik’s features than ourshape features. Arousal was well modeled by shape featureswith a mean squared error of 0.9. However, the combinedfeature performance did not show any improvements. Theresults indicated that visual shapes provide a stronger cuein understanding the valence as opposed to the combinationof color, texture, and composition in images.
We also computed the correlation between quantifiedindividual shape features and valence-arousal ratings. Thehigher the correlation, the more relevant the featureswere. Through this process we found that angular count,fitness, circularity, and orientation of line segments showedhigher correlations with valance, whereas angle count, anglemetrics, straightness, length span, and orientation of curveshad higher correlations with arousal.
5.4 Classifying Categorized EmotionsTo evaluate the relationship between shape features and
emotions on discrete emotions, we classified images intoone of the eight categories, anger, disgust, fear, sadness,

(a) Images with strong emotional content (b) Emotionally neutral images
Figure 16: Examples of misclassification in Set 1. The four rows are original images, image contours, linesegments, and continuous lines.
(a) Images with strong emotional content (b) Emotionally neutral images
Figure 17: Examples of misclassification in Set 2. The four rows are original images, image contours, linesegments, and continuous lines.
0
0.425
0.85
1.275
1.7
Shape Features Machajdik’s Features All Features
Valance Arousal
0.2
0.23
0.26
0.29
0.32
Shape Features Machajdik’s Features All Features
(a) (b)
Figure 18: Experimental results. (a) Mean squarederror for the dimensions of valance and arousal. (b)Accuracy for the classification task.
amusement, awe, contentment, and excitement. We followedMachajdik et al. [18] and performed one-vs-all classificationto compare and benchmark our classification accuracy. Theclassification results are reported in Figure 18(b). We usedSVM to assign the images to one of the eight classes. Thehighest accuracy was obtained by combining Machajdik’swith shape features. We also observed a considerableincrease in the classification accuracy by using the shapefeatures alone, which proves that shape features indeedcapture emotions in images more effectively.
In this experiment, we also built classifiers for each of theshape features. Each of the shape features listed in Table 4achieved a classification accuracy of 30% or higher.
Table 4: Significant features to emotions.
Emotion FeaturesAngry CircularityDisgust Length of line segmentsFear Orientation of line segments
and angle countSadness Fitness, mass of curves, circularity,
and orientation of line segmentsAmusement Mass of curves
and orientation of line segmentsAwe Orientation of line segments
Excitement Orientation of line segmentsContentment Mass of lines, angle count,
and orientation of line segments
6. CONCLUSIONSWe investigated the computability of emotion through
shape modeling. To achieve this goal, we first extractedcontours from complex images, and then representedcontours using lines and curves extracted from images.Statistical analyses were conducted on locally meaningfullines and curves to represent the concept of roundness,angularity, and simplicity, which have been postulated asplaying a key role in evoked emotion for years. Leveragingthe computational representation of these physical stimulus
properties, we evaluated the proposed shape featuresthrough three tasks: distinguishing emotional images fromneutral images; classifying images according to categorizedemotions; and fitting the dimensionality of emotion basedon proposed shape features. We have achieved animprovement over the state-of-the-art solution [18]. Wealso attacked the problem of modeling the presence orabsence of strong emotional content in images, which haslong been overlooked. Separating images with strongemotional content from emotionally neutral ones can aidin many applications including improving the performanceof keyword based image retrieval systems. We empiricallyverified that our proposed shape features indeed capturedemotions in the images. The area of understanding emotionsin images is still in its infancy and modeling emotionsusing low-level features is the first step toward solving thisproblem. We believe our contribution takes us closer tounderstanding emotions in images. In the future, we hopeto expand our experimental dataset and provide strongerevidence of established relationships between shape featuresand emotions.
7. REFERENCES[1] P. Arbelaez, M. Maire, C. Fowlkes, and J. Malik.
Contour detection and hierarchical imagesegmentation. IEEE Trans. on Pattern Analysis andMachine Intelligence, 33(5):898–916, 2011.
[2] S. Arifin and P. Y. K. Cheung. A computation methodfor video segmentation utilizing the pleasure-arousal-dominance emotional information. In ACM MM, pages68–77, 2007.
[3] R. Arnheim. Art and visual perception: A psychologyof the creative eye. 1974.
[4] J. Aronoff. How we recognize angry and happyemotion in people, places, and things. Cross-CulturalResearch, 40(1):83–105, 2006.
[5] M. Bar and M. Neta. Humans prefer curved visualobjects. Psychological Science, 17(8):645–648, 2006.
[6] M. M. Bradley and P. J. Lang. The internationalaffective picture system(IAPS) in the study of emotionand attention. In Handbook of Emotion Elicitation andAssessment, pages 29–46, 2007.
[7] S. Brandt, J. Laaksonen, and E. Oja. Statistical shapefeatures in content-based image retrieval. In ICPR,pages 1062–1065, 2000.
[8] A. Chia, D. Rajan, M. Leung, and S. Rahardja.Object recognition by discriminative combinations ofline segments, ellipses and appearance features. IEEETrans. on Pattern Analysis and Machine Intelligence,34(9):1758–1772, 2011.
[9] G. Csurka, S. Skaff, L. Marchesotti, and C. Saunders.Building look & feel concept models from colorcombinations. The Visual Computer,27(12):1039–1053, 2011.
[10] R. Datta, D. Joshi, J. Li, and J. Z. Wang. Studyingaesthetics in photographic images using acomputational approach. In ECCV, pages 288–301,2006.
[11] R. Datta, J. Li, and J. Z. Wang. Algorithmicinferencing of aesthetics and emotion in natural image:An exposition. In ICIP, pages 105–108, 2008.
[12] A. Hanjalic and L. Q. Xu. Affective video content
representation and modeling. IEEE Trans. onMultimedia, 7(1):143–154, 2005.
[13] D. Joshi, R. Datta, E. Fedorovskaya, Q. T. Luong,J. Z. Wang, J. Li, and J. Luo. Aesthetics and emotionsin images. IEEE Signal Processing Magazine,28(5):94–115, 2011.
[14] P. J. Lang, M. M. Bradley, and B. N. Cuthbert.Emotion, motivation, and anxiety: Brain mechanismsand psychophysiology. Biological Psychiatry,44(12):1248–1263, 1998.
[15] P. J. Lang, M. M. Bradley, and B. N. Cuthbert.International affective picture system: Affectiveratings of pictures and instruction manual. InTechnical Report A-8, University of Florida,Gainesville, FL, 2008.
[16] M. K. Leung and Y.-H. Yang. Dynamic two-stripalgorithm in curve fitting. Pattern Recognition, 23(1-2):69–79, 1990.
[17] K. A. Lindquist, T. D. Wager, H. Kober,E. Bliss-Moreau, and L. F. Barrett. The brain basis ofemotion: A meta-analytic review. Behavioral andBrain Sciences, 173(4):1–86, 2011.
[18] J. Machajdik and A. Hanbury. Affective imageclassification using features inspired by psychologyand art theory. In ACM MM, pages 83–92, 2010.
[19] J. Mikel, B. L. Fredrickson, G. R. Larkin, C. M.Lindberg, S. J. Maglio, and P. A. Reuter-Lorenz.Emotional category data on images from theinternational affective picture system. BehaviorResearch Methods, 37(4):626–630, 2005.
[20] Y. Mingqiang, K. Kidiyo, and R. Joseph. A survey ofshape feature extraction techniques. PatternRecognition, pages 43–90, 2008.
[21] R. Reber, N. Schwarz, and P. Winkielman. Processingfluency and aesthetic pleasure: Is beauty in theperceiver’s processing experience? Personality andSocial Psychology Review, 8(4):364–382, 2004.
[22] H. R. Schiffman. Sense and Perception: An IntegratedApproach. 1990.
[23] T. Shibata and T. Kato. Kansei image retrievalsystem for street landscape-discrimination andgraphical parameters based on correlation of twoimage systems. In International Conference onSystems, Man, and Cybernetics, pages 274–252, 2006.
[24] M. Solli and R. Lenz. Color based bags-of-emotions.LNCS, 5702:573–580, 2009.
[25] H. L. Wang and L. F. Cheong. Affectiveunderstanding in film. IEEE Trans. on Circuits andSystems for Video Technology, 16(6):689–704, 2006.
[26] V. Yanulevskaya, J. C. Van Gemert, K. Roth, A. K.Herbold, N. Sebe, and J. M. Geusebroek. Emotionalvalence categorization using holistic image features. InICIP, pages 101–104, 2008.
[27] H. Zhang, E. Augilius, T. Honkela, J. Laaksonen,H. Gamper, and H. Alene. Analyzing emotionalsemantics of abstract art using low-level imagefeatures. In Advances in Intelligent Data Analysis,pages 413–423, 2011.
[28] S. L. Zhang, Q. Tian, Q. M. Huang, W. Gao, andS. P. Li. Utilizing affective analysis for efficient moviebrowsing. In ICIP, pages 1853–1856, 2009.