the stock market preston mcswain director of private asset management neuberger berman...
TRANSCRIPT
The Stock Market
PRESTON MCSWAIN DIRECTOR OF PRIVATE ASSET
MANAGEMENTNEUBERGER BERMAN
smartwomansecurities
© 2007 Smart Woman Securities. Materials are for SWS members’ use
only. All rights reserved.
October 10, 2007
• The Stock Market
• Investing Profiles – Risk and Return
• Lessons from Successful Investors
• What’s Next
Today’s Agenda
Investors ProfilesRisk and Return
Investing• Means to an End – Not A Competition
– No One Investment or Investment Style Fits All– Pick “Your” Way
• Have a Long-Term View
• Diversify, Diversify, Diversify– Stocks, Bonds Cash– Large Cap, Small Cap, International– Balance of Growth and Value Styles
• Stay Emotionally Balanced– Understand Your Risk

Investment Risks Defined• Market Risk
– Negative Performance in the Stock Market
• Inflation Risk– If Your Returns Do Not Outpace Inflation Your
Purchasing Power Goes Down– Stocks Can Be A Good Hedge Against Inflation– Bonds Can Underperform In Periods of High
Inflation
• Company Risk– Individual Stock Risk Due to Poor Management
or Financials
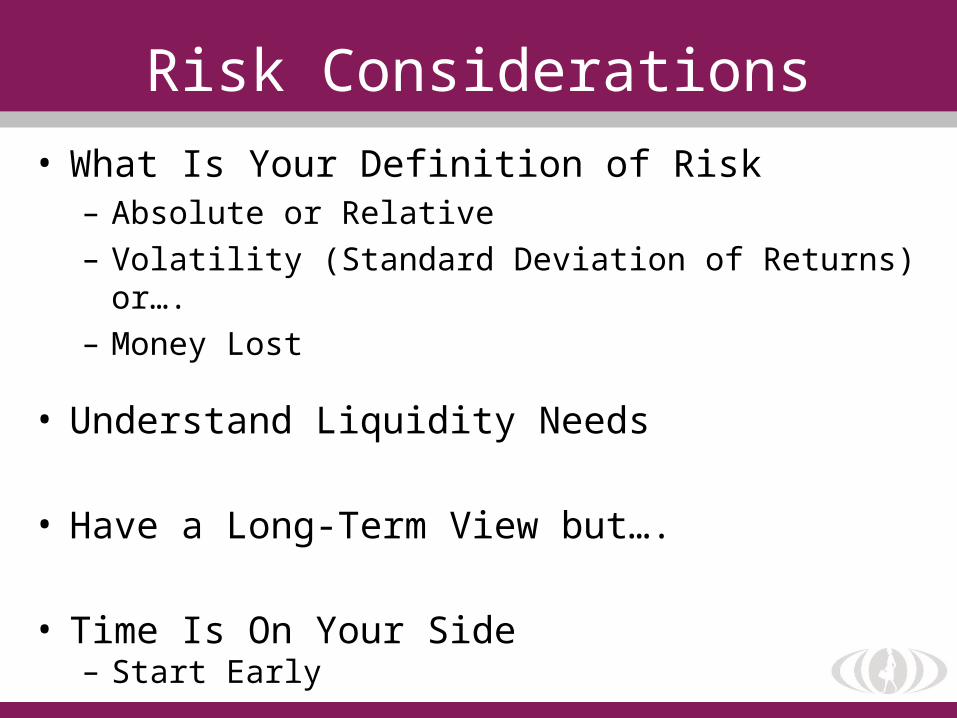
Risk Considerations• What Is Your Definition of Risk
– Absolute or Relative– Volatility (Standard Deviation of Returns) or….– Money Lost
• Understand Liquidity Needs
• Have a Long-Term View but….
• Time Is On Your Side– Start Early

Important Risk Controls• Understand Your Current Allocation of
Funds for Long-Term Investment– 5-10 Year Rule for Stocks– 3-5 Years for Longer Term Bonds– 1-3 Years for Short-Term Bonds– 1 Year or Less Money Market / Savings
Accounts
• Avoid Market Timing
• Do Not Follow the Herd
• Diversify with Mix of Stocks, Bonds and Cash
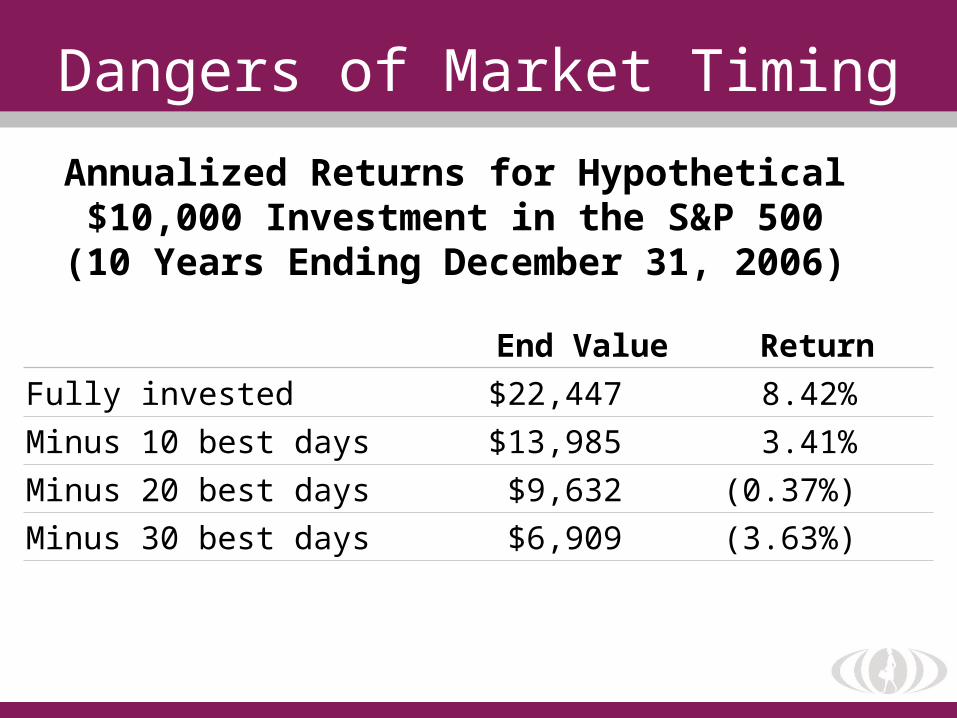
Dangers of Market Timing
End Value Return
Fully invested $22,447 8.42%
Minus 10 best days $13,985 3.41%
Minus 20 best days $9,632 (0.37%)
Minus 30 best days $6,909 (3.63%)
Annualized Returns for Hypothetical $10,000 Investment in the S&P 500
(10 Years Ending December 31, 2006)
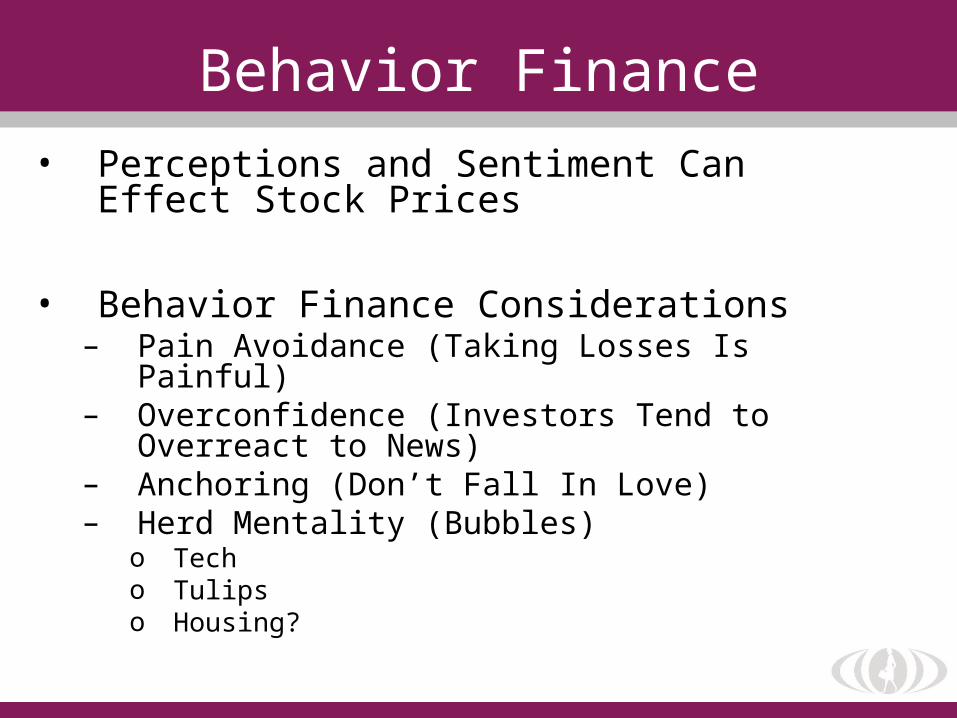
Behavior Finance• Perceptions and Sentiment Can Effect
Stock Prices
• Behavior Finance Considerations– Pain Avoidance (Taking Losses Is Painful)– Overconfidence (Investors Tend to Overreact
to News)– Anchoring (Don’t Fall In Love)– Herd Mentality (Bubbles)
o Techo Tulipso Housing?
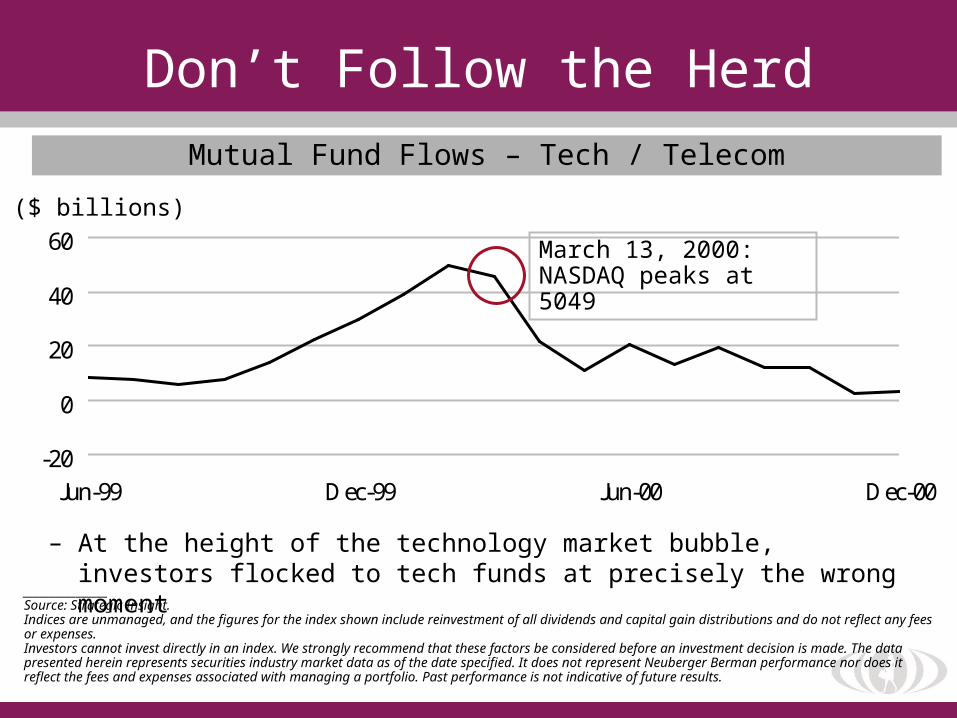
________________Source: Strategic Insight.Indices are unmanaged, and the figures for the index shown include reinvestment of all dividends and capital gain distributions and do not reflect any fees or expenses.Investors cannot invest directly in an index. We strongly recommend that these factors be considered before an investment decision is made. The data presented herein represents securities industry market data as of the date specified. It does not represent Neuberger Berman performance nor does it reflect the fees and expenses associated with managing a portfolio. Past performance is not indicative of future results.
Mutual Fund Flows – Tech / Telecom
– At the height of the technology market bubble, investors flocked to tech funds at precisely the wrong moment
-20
0
20
40
60
Jun-99 Dec-99 Jun-00 Dec-00
($ billions)
March 13, 2000: NASDAQ peaks at 5049
Don’t Follow the Herd
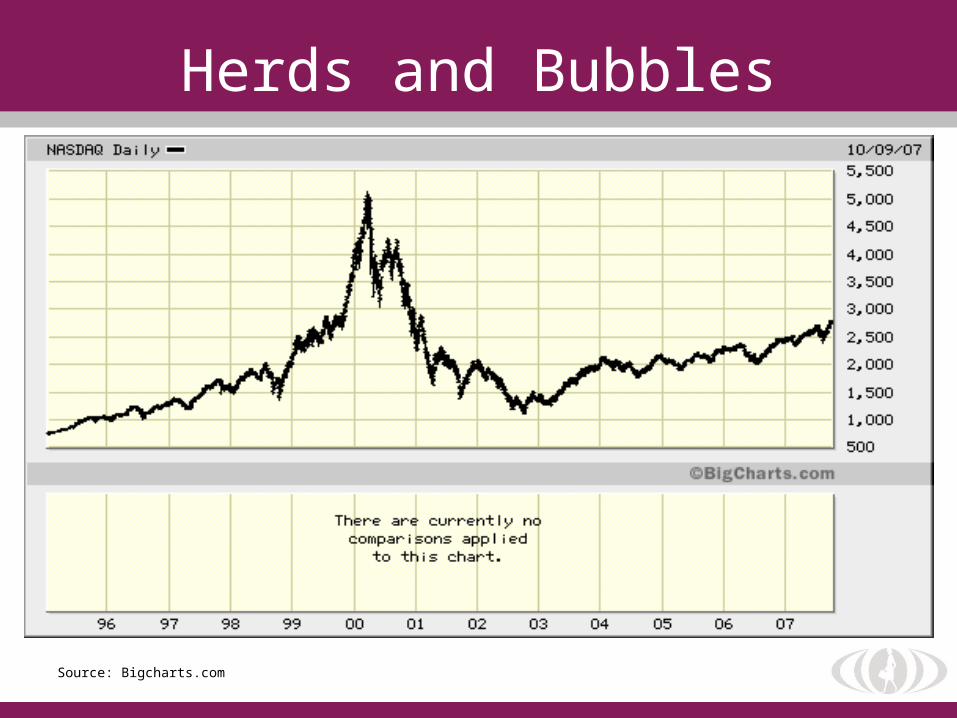
Herds and Bubbles
Source: Bigcharts.com
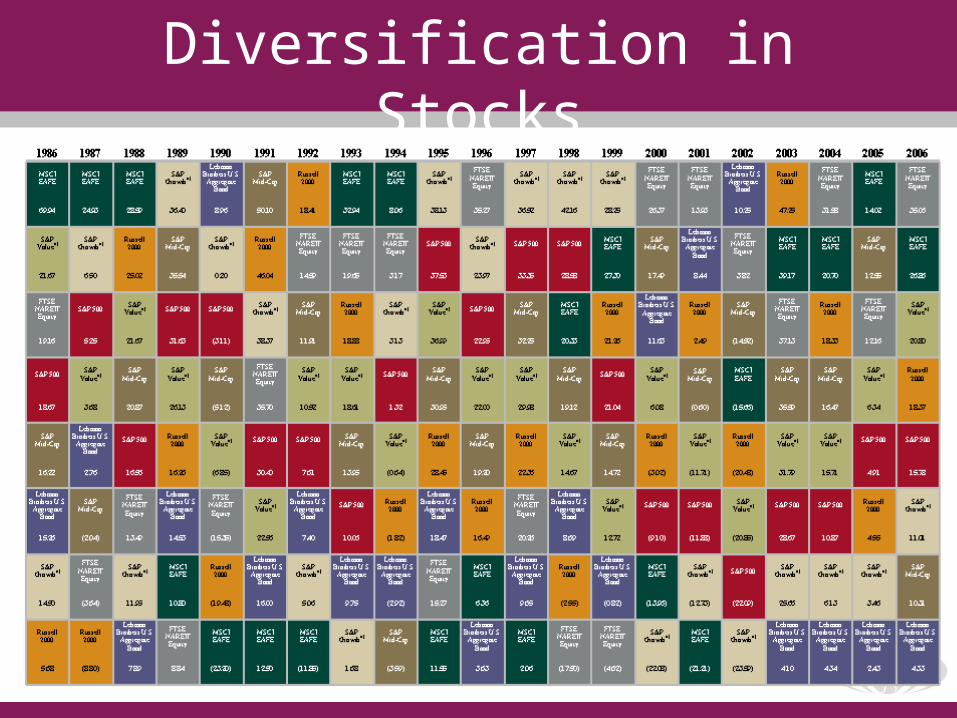
Diversification in Stocks
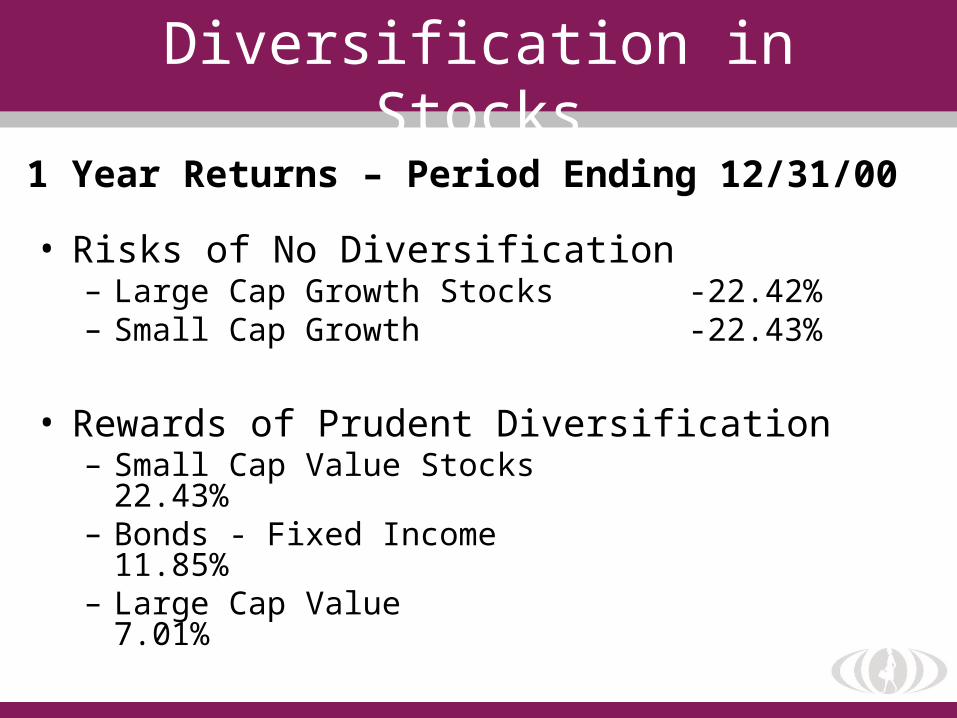
Diversification in Stocks
• Risks of No Diversification– Large Cap Growth Stocks -22.42%– Small Cap Growth -22.43%
• Rewards of Prudent Diversification– Small Cap Value Stocks
22.43%– Bonds - Fixed Income 11.85%– Large Cap Value 7.01%
1 Year Returns – Period Ending 12/31/00
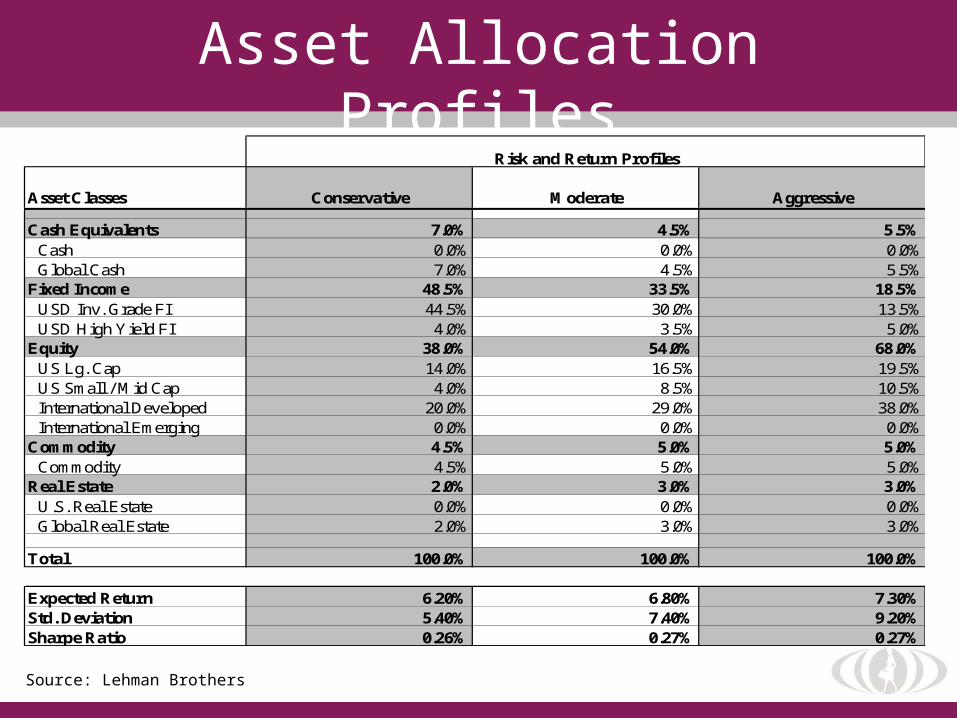
Asset Allocation Profiles
Source: Lehman Brothers
Asset Classes Conservative Moderate Aggressive
Cash Equivalents 7.0% 4.5% 5.5%Cash 0.0% 0.0% 0.0%Global Cash 7.0% 4.5% 5.5%
Fixed Income 48.5% 33.5% 18.5%USD Inv. Grade FI 44.5% 30.0% 13.5%USD High Yield FI 4.0% 3.5% 5.0%
Equity 38.0% 54.0% 68.0%US Lg. Cap 14.0% 16.5% 19.5%US Small / Mid Cap 4.0% 8.5% 10.5%International Developed 20.0% 29.0% 38.0%International Emerging 0.0% 0.0% 0.0%
Commodity 4.5% 5.0% 5.0%Commodity 4.5% 5.0% 5.0%
Real Estate 2.0% 3.0% 3.0%U.S. Real Estate 0.0% 0.0% 0.0%Global Real Estate 2.0% 3.0% 3.0%
Total 100.0% 100.0% 100.0%
Expected Return 6.20% 6.80% 7.30%Std. Deviation 5.40% 7.40% 9.20%Sharpe Ratio 0.26% 0.27% 0.27%
Risk and Return Profiles
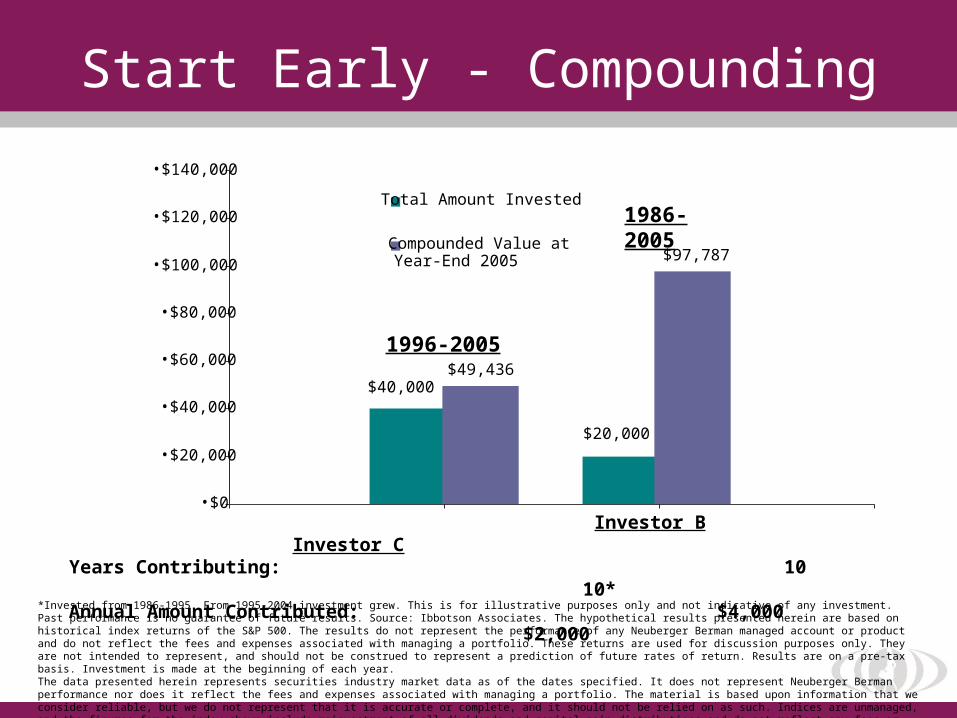
*Invested from 1986-1995. From 1995-2004 investment grew. This is for illustrative purposes only and not indicative of any investment. Past performance is no guarantee of future results. Source: Ibbotson Associates. The hypothetical results presented herein are based on historical index returns of the S&P 500. The results do not represent the performance of any Neuberger Berman managed account or product and do not reflect the fees and expenses associated with managing a portfolio. These returns are used for discussion purposes only. They are not intended to represent, and should not be construed to represent a prediction of future rates of return. Results are on a pre-tax basis. Investment is made at the beginning of each year.The data presented herein represents securities industry market data as of the dates specified. It does not represent Neuberger Berman performance nor does it reflect the fees and expenses associated with managing a portfolio. The material is based upon information that we consider reliable, but we do not represent that it is accurate or complete, and it should not be relied on as such. Indices are unmanaged, and the figures for the index shown include reinvestment of all dividends and capital gain distributions and do not reflect any fees or expenses. Investors cannot invest directly in an index. We strongly recommend that these factors be considered before an investment decision is made.
Investor B Investor CYears Contributing: 10 10*Annual Amount Contributed: $4,000 $2,000
1996-2005
1986-2005
Start Early - Compounding
$20,000
$40,000
$97,787
$49,436
•$0
•$20,000
•$40,000
•$60,000
•$80,000
•$100,000
•$120,000
•$140,000
Total Amount Invested
Compounded Value atYear-End 2005
The Stock Market
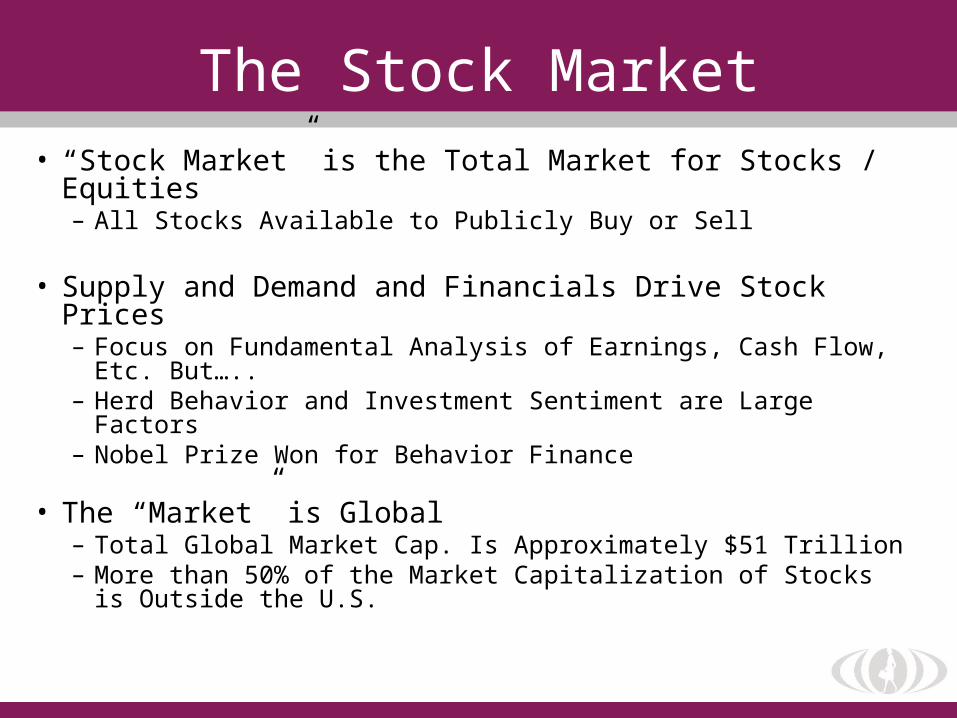
• “Stock Market” is the Total Market for Stocks / Equities– All Stocks Available to Publicly Buy or Sell
• Supply and Demand and Financials Drive Stock Prices– Focus on Fundamental Analysis of Earnings, Cash Flow,
Etc. But…..– Herd Behavior and Investment Sentiment are Large
Factors– Nobel Prize Won for Behavior Finance
• The “Market” is Global– Total Global Market Cap. Is Approximately $51 Trillion– More than 50% of the Market Capitalization of Stocks is
Outside the U.S.
The Stock Market

• Buyers and Sellers– Buy-Side and Sell-Side
• Regulators
• Exchanges– NYSE
• Indices– Index Providers (Dow Jones, Standard and Poors,
etc.)
Market Participants
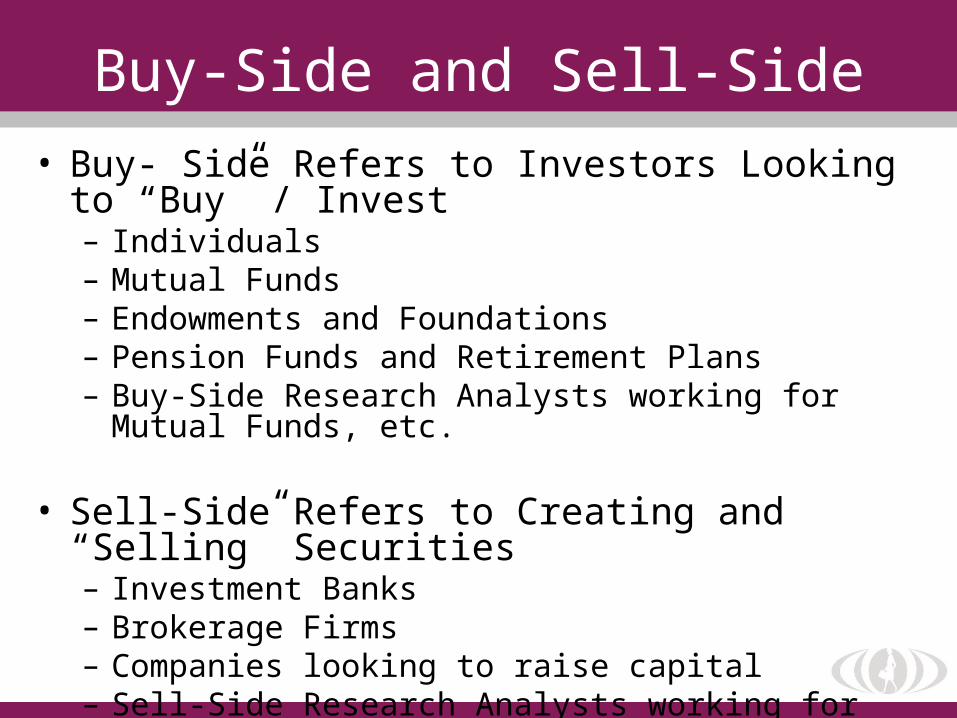
• Buy- Side Refers to Investors Looking to “Buy” / Invest– Individuals– Mutual Funds– Endowments and Foundations– Pension Funds and Retirement Plans– Buy-Side Research Analysts working for Mutual
Funds, etc.
• Sell-Side Refers to Creating and “Selling” Securities– Investment Banks– Brokerage Firms– Companies looking to raise capital– Sell-Side Research Analysts working for
Investment Banks
Buy-Side and Sell-Side
Regulators
• SEC– Created After the Great Depression of the
1920s– The “34 Act” – Created in 1934– Regulation of market participants– Prevents Insider Selling, Front Running, etc.
• NASD– Primary regulator sales and trading practices
Stock Exchanges• Stock Market vs. Stock Exchange
– An “Exchange” is Where You Buy or Sell Stocks– The “Market” is ALL Stocks Traded on Exchanges
• Physical and/or Virtual “Store”– Sell-Side Stocks the Shelves– Buy-Side Buys and Sells– NYSE Floor and NASAQ Computers Market
• U.S. and Global Stock Exchanges– Major U.S. (NYSE, NASDAQ, AMEX, CBOT /
Options)– Regional U.S. (Boston, ICE / Denver, Philadephia)– Asia (Nikkei / Japan, Hang Sang / Hong Kong, etc.)– Europe (London, Frankfurt, Milan, Paris, etc.)
• A Stock Index is a Grouping of Stocks Constructed to Measure Past Performance and Trends
• An Index can be Used for a Proxy for How the “Market” is Performing in Dollar and Percentage Terms
• Indices Are Constructed by Various Financial Firms– Dow Jones Co. – Dow Jone Industrial Average
(DJIA)– Standard and Poors (S&P 500)– Russell Co. (Russell 1000)– Wilshire (Wilshire 5000)– Lehman Brothers (Lehman Brothers Aggregate
– Bonds)
Stock Index
• Dow Jones Industrial Average (DJIA)– The “Dow” is 30 “Blue Chip” Stocks Selected
by the Wall Street Journal(General Electric, Microsoft, etc.)
– Most Widely Quoted in the Press but Narrow Representation of the Broad Market
• Standard & Poor’s 500 (S&P 500)– The “S&P” is 500 primarily Large Cap U.S.
Stocks Selected by Standard & Poors to Give a Broad Representation of the U.S. Stock Market
– The S&P500 is the Standard Institutional Benchmark / Measure of Stock Market Performance
– Most Mutual Funds and other Managers Are Ultimately Compared the S&P500 for Benchmarking
U.S. Broad Stock Indices
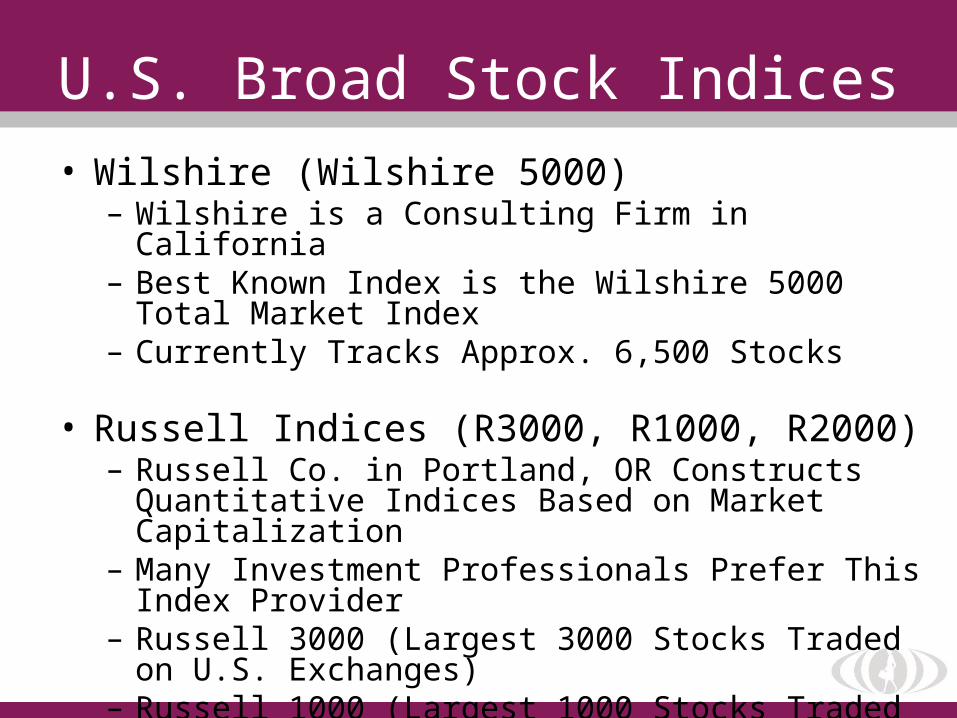
• Wilshire (Wilshire 5000)– Wilshire is a Consulting Firm in California– Best Known Index is the Wilshire 5000 Total
Market Index– Currently Tracks Approx. 6,500 Stocks
• Russell Indices (R3000, R1000, R2000)– Russell Co. in Portland, OR Constructs
Quantitative Indices Based on Market Capitalization
– Many Investment Professionals Prefer This Index Provider
– Russell 3000 (Largest 3000 Stocks Traded on U.S. Exchanges)
– Russell 1000 (Largest 1000 Stocks Traded on U.S. Exchanges)
– Russell 2000 (Smallest 2000 Stocks Trades on U.S. Exchanges)
– Specializes in “Growth and Value” Indices(R1000G, R1000V, R2000G, R2000V)
U.S. Broad Stock Indices
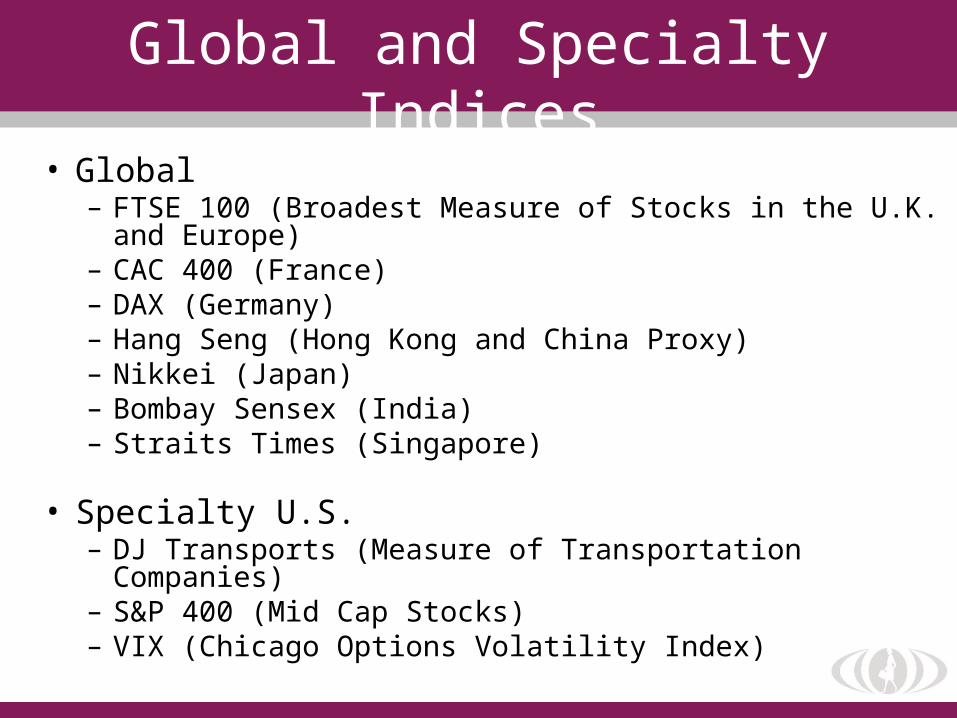
• Global– FTSE 100 (Broadest Measure of Stocks in the U.K.
and Europe)– CAC 400 (France)– DAX (Germany)– Hang Seng (Hong Kong and China Proxy)– Nikkei (Japan)– Bombay Sensex (India)– Straits Times (Singapore)
• Specialty U.S.– DJ Transports (Measure of Transportation
Companies)– S&P 400 (Mid Cap Stocks)– VIX (Chicago Options Volatility Index)
Global and Specialty Indices

Lessons From Successful Investors
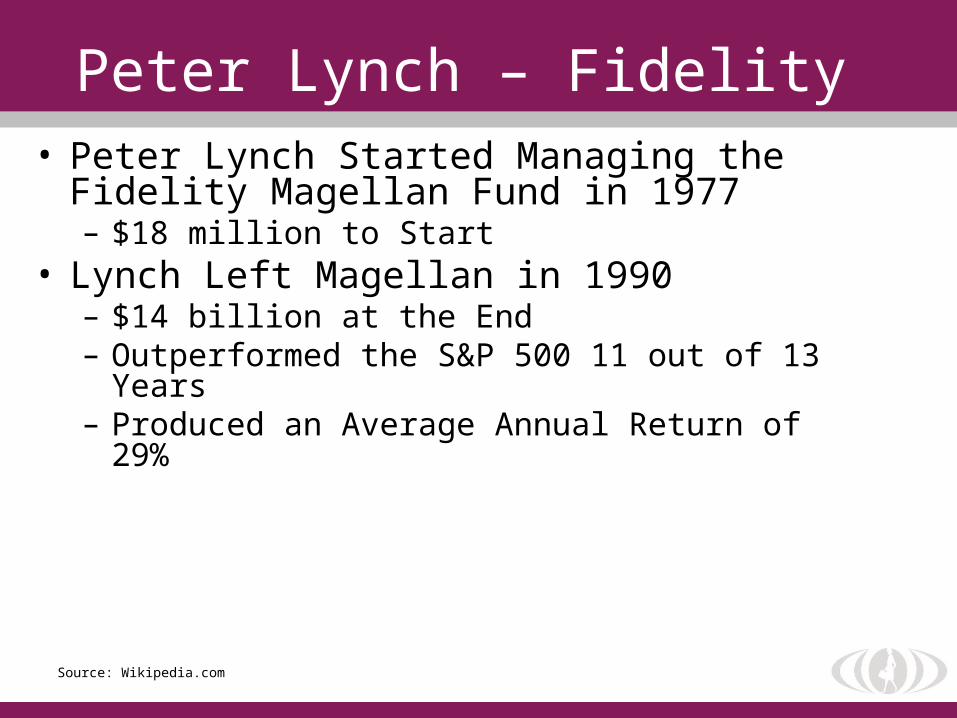
Peter Lynch – Fidelity • Peter Lynch Started Managing the
Fidelity Magellan Fund in 1977– $18 million to Start
• Lynch Left Magellan in 1990– $14 billion at the End– Outperformed the S&P 500 11 out of 13 Years– Produced an Average Annual Return of 29%
Source: Wikipedia.com
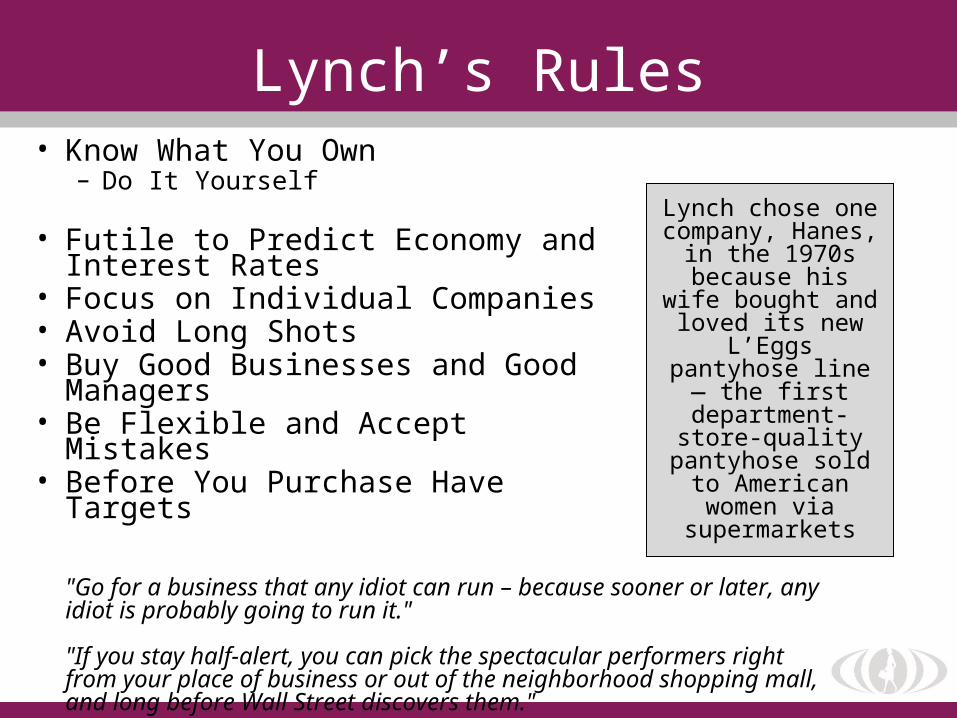
Lynch’s Rules• Know What You Own
– Do It Yourself
• Futile to Predict Economy and Interest Rates
• Focus on Individual Companies• Avoid Long Shots• Buy Good Businesses and Good
Managers• Be Flexible and Accept Mistakes• Before You Purchase Have
Targets
"Go for a business that any idiot can run – because sooner or later, any idiot is probably going to run it."
"If you stay half-alert, you can pick the spectacular performers right from your place of business or out of the neighborhood shopping mall, and long before Wall Street discovers them."
Lynch chose one company, Hanes,
in the 1970s because his wife bought and loved
its new L’Eggs pantyhose line —
the first department-store-quality pantyhose sold to American
women via supermarkets
Warren Buffet• After reading “The Intelligent Investor” by
Benjamin Graham, decided he wanted to study under Graham
• Started a family investment partnership at age 25– In First Year Tripled His Money ($100,000 to
$300,000)– Over the course of the next five years, the Buffett
partnerships racked up an impressive 251.0% profit, while the Dow was up only 74.3%
– Ten years after its founding, the Buffett Partnership assets were up more than 1,156% compared to the Dow's 122.9%
• Today he is the second richest man alive in the US, after Bill Gates, with $52 billion.
Investment Philosophy• Proponent of Value Investing (buying
undervalued assets)• Investing Style of Discipline, Patience and
Value Outperformes Over the Long-Term• Buffett’s Invests in What He Calls “Wonderful
Businesses”– Good Return on Capital, Low Debt– Strong Cash Flow– Strong Brand Recognition with Pricing Power– Simple Business Models (Easy to Understand and
Run)– Predictable Earnings– Management Has Shareholder Interest (“skin in the
game”)
Source: Wikipedia.com, investopedia.com

What's Nextand
Recommended Reading

• Week 3– Opening Your Personal Investment Account– Comparing Brokers, Fees, Etc.– Understanding Taxes and Other Practical
Considerations– Financial Basics of What Drive Analyst
Recommendations
• Week 4-10– Researching stocks: Picking the stocks to invest in
o Financial statement analysiso Basic valuationo Making recommendations
“Investing without research is like playing stud poker and never looking at the cards." - Peter Lynch
Next On Agenda

You must sign up online to become an SWS Member.
SWS Members can then apply for positions as Analysts and Associates on Research Teams, make investment recommendations, and help manage a real investment portfolio after successful completion of the comp in December
Remember: to sign up for the rest of the weeks, you mustgo online.
You will be notified as to your status.
Next Steps
Recommended Reading• One up on Wall Street
– Peter Lynch
• Buffett: The Making of an American Capitalist– Roger Lowenstein
• Classics I & II (Compilations of Papers from Top Investors)– James R. Vertin & Charles D. Ellis
• Random Walk Down Wall Street– Burton G. Malkiel
• The Intelligent Investor– Benjamin Graham