the statistical book libri i statistikave
TRANSCRIPT
The statistical book2017
INSTITUTI I SIGURIMEVE SHOQËRORE
SOCIAL INSURANCE INSTITUTE
2017Libri i statistikave
INSTITUTI I SIGURIMEVE SHOQËRORE
SOCIAL INSURANCE INSTITUTE

2
in million ALL
2015 2016 2017
Income from contributions in total 60,148 66,383 73,556compulsory scheme 59,058 65,173 72,237 collected from GTD1) 56,473 62,692 69,433 collected from SII2) 2,585 2,481 2,804supplementary scheme 1,090 1,210 1,320
Contributions paid from State Budget (SB)3) 5,794 5,022 4,680for special categories4) 3,533 3,712 3,237for self-employed in agriculture 2,261 1,310 1,443
as percentage of GDP 0.71 0.48 0.41Financing of special programs from SB 15,661 14,473 14,909
special programs of government 11,561 10,082 10,041suppl scheme & special treatments 4,100 4,391 4,868
as percentage of GDP 1.10 0.98 0.96TOTAL OF INCOME 81,604 85,878 93,145as percentage of GDP 5.72 5.83 5.99
Expenditure in total 107,309 114,276 119,081benefit costs 88,904 93,457 100,174special government programs 11,497 13,687 11,829suppl scheme & special treatments 4,892 4,973 4,933administrative costs 2,016 2,159 2,145
TOTAL OF OUTCOME 107,309 114,276 119,081as percentage of GDP 7.52 7.76 7.66
-25,705 -28,398 -25,936
as percentage of GDP -1.80 -1.93 -1.67
Notes:1) GTD - General Tax Department2) SII - Social Insurance Institute3) Under article 9 of Law no 7703, date 11.05.1993, the state pays contributions for special groups determined by laws & CMDs, and this is considered insurance period.4) This group includes unemployed receiving unemployment benefit, persons receiving transitional payment, militaries under reform, underground workers, military industry workers, women retiring in relevant year.
FINANCIAL SITUATION - TOTAL OF SCHEMES
Income - Direct contributions, Contributions and Financings from State Budget
Subsidy to cover the difference (Income - Outcome)

3
in million ALL
2015 2016 2017
Income from contributions in total 59,058 65,173 72,237from of juridical & physical entities 56,473 62,692 69,433from self-employed in agriculture 1,940 1,919 2,111from voluntary scheme 435 418 483other income 210 145 210
as percentage of GDP 4.14 4.43 4.64
Expenditure in total 102,417 109,303 114,148benefit cost 88,904 93,457 100,174 sickness 331 337 371 maternity 2,490 2,578 3,018 pensions 86,071 90,529 96,771 employment injuries 12 13 14as percentage of GDP 6.23 6.35 6.44
special government programs 11,497 13,687 11,829as percentage of GDP 0.81 0.93 0.76
administrative cost 2,016 2,159 2,145as percentage of GDP 0.14 0.15 0.14as percentage of SII expenditure 1.88 1.89 1.80
Expenditure in total as percentage of GDP 7.17 7.42 6.44
-43,359 -44,130 -41,911
as percentage of GDP -2.56 -3.04 -3.00
FINANCIAL SITUATION - COMPULSORY SCHEME
Income - Income from direct contributions
Financing of State Budget (Income from contributions - Expenditure)

4
in million ALL
2015 2016 2017
11,497 13,687 11,829
Compensations 11,054 13,231 11,401 price compensations 4,336 4,378 4,582
urban 3,967 4,009 4,201 rural 369 369 381
compensations for minimum income 6,717 8,853 6,819 urban 6,084 8,239 6,222
rural 633 614 597Compensations as percentage of GDP 0.77 0.90 0.73
Social pension 99 140 155Special pensions 64 68 74Special categories1) 281 247 200
as percentage of GDP 0.81 0.93 0.76
Note:1) In "special categories" are included supplements for war invalids andveterans, the supplement due to work invalid status.
EXPENDITURE FOR SPECIAL GOVERNMENT PROGRAMS
Expenditure for special government programs
benefits84.1%
special government
programs9.9%
supplementary4.1%
administrative1.8%
Expenditure of SII in 2017
5
in million ALL
2015 2016 2017
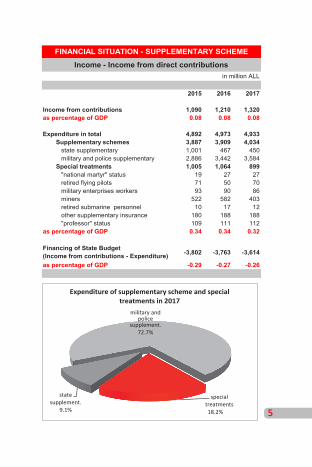
Income from contributions 1,090 1,210 1,320as percentage of GDP 0.08 0.08 0.08
Expenditure in total 4,892 4,973 4,933Supplementary schemes 3,887 3,909 4,034
state supplementary 1,001 467 450 military and police supplementary 2,886 3,442 3,584Special treatments 1,005 1,064 899
"national martyr" status 19 27 27 retired flying pilots 71 50 70 military enterprises workers 93 90 86 miners 522 582 403 retired submarine personnel 10 17 12 other supplementary insurance 180 188 188 "professor" status 109 111 112
as percentage of GDP 0.34 0.34 0.32
-3,802 -3,763 -3,614
as percentage of GDP -0.29 -0.27 -0.26
Income - Income from direct contributions
Financing of State Budget (Income from contributions - Expenditure)
FINANCIAL SITUATION - SUPPLEMENTARY SCHEME
9.1%treatments18.2%
Expenditure of supplementary scheme and special treatments in 2017
state supplement.
military and police
supplement.72.7%
special

6
number at the end of year
2015 2016 2017
Number of urban pensions 454,163 472,390 488,408old-age 345,314 363,664 379,349invalidity 62,101 61,938 62,412survivors 46,748 46,788 46,647
Number of rural pensions 144,769 139,154 132,778old-age 129,161 124,378 118,794invalidity 7,763 7,456 7,304survivors 7,845 7,320 6,680
Number of pensions in total 598,932 611,544 621,186old-age 474,475 488,042 498,143invalidity 69,864 69,394 69,716survivors 54,593 54,108 53,327
NUMBER OF PENSIONS
72.2 73.3 74.5 75.8 77.2 78.6
27.8 26.7 25.5 24.2 22.8 21.4
2012 2013 2014 2015 2016 2017
Number of urban and rural pensions in yearsin percentage against total
rural
urban

7
female male total
227,396 261,012 488,408old-age 179,431 199,918 379,349
invalidity 25,569 36,843 62,412survivors 22,396 24,251 46,647
83,485 49,293 132,778old-age 76,880 41,914 118,794
invalidity 3,173 4,131 7,304survivors 3,432 3,248 6,680
310,881 310,305 621,186old-age 256,311 241,832 498,143
invalidity 28,742 40,974 69,716survivors 25,828 27,499 53,327
PENSIONERS BY GENDER IN 2017
number at the end of year
Urban pension
Rural pension
Pensioners in total
46.662.9
50.0
53.437.1
50.0
urban pensions rural pensions pensions in total
Pensioners by gender in 2017
male female

8
in persons
2015 2016 2017
Beneficiaries of special government programs Compensations
price compensations 573,240 553,226 531,425 urban 428,471 414,072 398,647 rural 144,769 139,154 132,778
compensations for minimum income 414,657 388,513 374,358 urban 304,979 286,863 277,540 rural 109,678 101,650 96,818
Social pensions 1,775 2,412 2,589 Special pensions 286 272 241Special categories1) 6,315 5,531 4,688
Note:1) In "special categories" are included persons benefiting supplements for warinvalids and veterans and supplements due to work invalid status.
BENEFICIARIES OF SPECIAL GOVERNMENT PROGRAMS
279.9 290.9306.0 305.0 286.9 277.5
126.2 115.0 113.5 109.7 101.7 96.8
2012 2013 2014 2015 2016 2017
Pensioners benefiting compensations for minimum income (in thousand)
urban pensioners rural pensioners

9
in persons
2015 2016 2017
2,094 2,287 2,589
transitional payments 108 54 126state supplementary pensions 1,986 2,233 2,463
24,833 25,455 26,279
early retirement pensions 10,532 10,039 9,688military supplementary pensions 14,301 15,416 16,591
4,940 4,950 5,016
"national martyr" status 358 354 351retired flying pilots 256 244 236military enterprises workers 566 512 473miners 2,989 3,011 3,079retired submarine personnel 65 64 62"professor" status 706 765 815
31,867 32,692 33,884
Note:1) These treatments are transfers decided by special laws, and SII is charged tocalculate benefits and apply payment procedures. Direct payments are carried out by Albanian Post.
Beneficiaries of supplementary scheme in total
Beneficiaries of special treatment scheme1)
BENEFICIARIES OF SUPPLEMENTARY SCHEME
Beneficiaries of state supplementary scheme
Beneficiaries of military supplementary scheme

10
ALL in month
2015 2016 2017Urban pension amount
old-age pensions 14,585 14,873 15,527invalidity pensions 12,648 12,803 13,390survivors pensions 6,696 6,613 6,707
Rural pension amountold-age pensions 8,330 8,556 8,808invalidity pensions 6,501 6,595 6,451survivors pensions 3,240 2,830 2,478
Incomes1) from urban pensionsold-age pensions 16,204 16,399 17,002invalidity pensions 14,267 14,330 14,865survivors pensions 8,315 8,140 8,181
Incomes from rural pensionsold-age pensions 8,889 9,117 9,374invalidity pensions 7,059 7,156 7,017survivors pensions 3,799 3,391 3,044
Notes:1) Pensioners income comprise pension amount, compensations forelectricity and bread as well as compensation for pensioners' minimum income.
AVERAGE PENSION / AVERAGE INCOMES
11
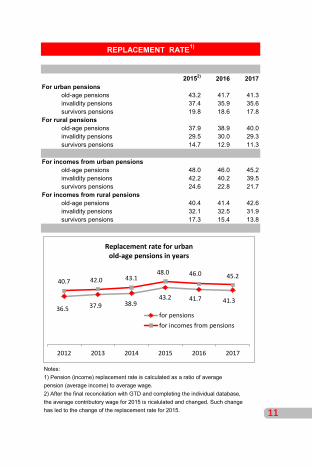
20152) 2016 2017For urban pensions
old-age pensions 43.2 41.7 41.3invalidity pensions 37.4 35.9 35.6survivors pensions 19.8 18.6 17.8
For rural pensionsold-age pensions 37.9 38.9 40.0invalidity pensions 29.5 30.0 29.3survivors pensions 14.7 12.9 11.3
For incomes from urban pensionsold-age pensions 48.0 46.0 45.2invalidity pensions 42.2 40.2 39.5survivors pensions 24.6 22.8 21.7
For incomes from rural pensionsold-age pensions 40.4 41.4 42.6invalidity pensions 32.1 32.5 31.9survivors pensions 17.3 15.4 13.8
Notes:1) Pension (income) replacement rate is calculated as a ratio of averagepension (average income) to average wage.2) After the final reconcilation with GTD and completing the individual database,the average contributory wage for 2015 is ricalulated and changed. Such change has led to the change of the replacement rate for 2015.
REPLACEMENT RATE1)
36.5 37.9 38.943.2 41.7 41.3
40.7 42.0 43.148.0 46.0 45.2
2012 2013 2014 2015 2016 2017
Replacement rate for urban old-age pensions in years
for pensionsfor incomes from pensions

12
in persons
2015 2016 2017
By entities 668,614 661,655 694,411public 145,746 155,401 159,756private companies 321,023 325,303 357,630self-employed 104,686 120,460 110,472self-employed in agriculture 89,527 53,168 58,526voluntarily insured 7,632 7,323 8,027
Insured by State 34,125 40,780 41,014unemployed in unemploym. payment 8,016 5,561 7,106women retiring in relevant year 11,506 21,358 20,502other categories1) 14,603 13,861 13,406
With short-term benefit 15,331 15,851 16,958
Contributors in total 718,070 718,286 752,383
Note:1) Here are included persons receiving transitional payment, militaries underreform, underground workers, military industry workers.
CONTRIBUTORS OF COMPULSORY SCHEME
549.7 561.2654.6 718.1 718.3
752.4
2012 2013 2014 2015 2016 2017
Number of contributors in years (in thousand)

13
2015 2016 2017System Dependency Rate
for pensioners in total 0.82 0.84 0.82urban 0.71 0.70 0.69
rural 1.64 2.67 2.32System Dependency Rate
for old-age pensioners 0.65 0.67 0.66urban 0.53 0.53 0.54
rural 1.47 2.38 2.08
Number of contributors per 1 pensionerfor pensioners in total 1.21 : 1 1.19 : 1 1.22 : 1
for old-age pensioners 1.54 : 1 1.49 : 1 1.53 : 1
Note:1) SDR is calculated as a ratio between average number of pensioners to averagenumber of contributors.
SYSTEM DEPENDENCY RATE SDR1)
(Pensioners / Contributors)
Ratio Contributors / Pensioners
0.85
0.80
0.74
0.820.84
0.82
2012 2013 2014 2015 2016 2017
System Dependency Rate in years

14
in persons
2015 2016 2017
New urban pensions 35,591 34,577 34,018old-age 28,987 29,221 28,039 old-age 28,616 28,973 27,861 reduced old-age 371 248 178invalidity 4,580 3,330 3,811survivors 2,024 2,026 2,168
New rural pensions 1,849 482 441old-age 1,003 260 184invalidity 685 179 217survivors 161 43 40
Number of new pensions in total 37,440 35,059 34,459
NUMBER OF NEW PENSIONS
47.1 44.9 46.1 46.5 48.5 47.7
52.9 55.1 53.9 53.5 51.5 52.3
2012 2013 2014 2015 2016 2017
New old-age pensions by gender in percentage against total
female male

15
2015 2016 2017For old-age pensioners
total 62.4 62.6 62.7male 65.0 65.0 65.0
female 60.2 60.3 60.5For invalidity pensioners
total 53.0 53.1 53.2male 54.5 54.8 55.2
female 50.7 50.6 50.7
Legal retirement agecategory I
male 61.0 61 V 6 M 62.0female 56.0 56 V 6 M 57.0
category IImale 65.0 65.0 65.0
female 60 V 2 M 60 V 4 M 60 V 6 Mcategory III
male 65.0 65.0 65.0female 60 V 2 M 60 V 4 M 60 V 6 M
Note:1) New pensions, awarded and reported at current year, which have met eligibilityconditions the same current year are considered new pensions of current year.With regard to 2015, based on the new social insurance law, urban and rural pensions are unified. The new pensions assigned under the new law will all be considered urban pensions.
AVERAGE RETIREMENT AGE OF NEW OLD-AGE PENSIONS OF CURRENT YEAR1)
62.4 62.3 62.4 62.4 62.6 62.7
59.4
60.3 60.6
2012 2013 2014 2015 2016 2017
Average retirement age of new old-age pensions of current year
urban pensionersrural pensioners
16
in years
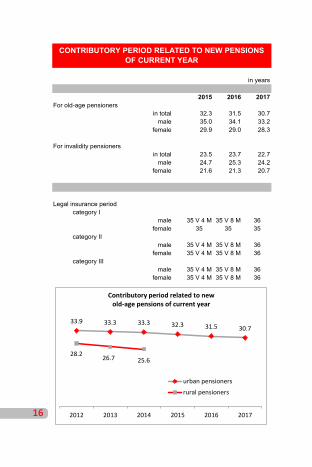
2015 2016 2017For old-age pensioners
in total 32.3 31.5 30.7male 35.0 34.1 33.2
female 29.9 29.0 28.3
For invalidity pensionersin total 23.5 23.7 22.7
male 24.7 25.3 24.2female 21.6 21.3 20.7
Legal insurance period category I
male 35 V 4 M 35 V 8 M 36female 35 35 35
category IImale 35 V 4 M 35 V 8 M 36
female 35 V 4 M 35 V 8 M 36category III
male 35 V 4 M 35 V 8 M 36female 35 V 4 M 35 V 8 M 36
CONTRIBUTORY PERIOD RELATED TO NEW PENSIONS OF CURRENT YEAR
33.9 33.3 33.3 32.3 31.5 30.7
28.2 26.7 25.6
2012 2013 2014 2015 2016 2017
Contributory period related to new old-age pensions of current year
urban pensioners
rural pensioners

17
ALL in month
2015 2016 2017Urban pension amount1)
old-age pensions 14,639 14,508 14,456invalidity pensions 14,193 13,951 13,671survivors pensions 6,954 6,579 7,302
in percentage
RR for pensionsold-age pensions 43.3 40.7 38.4invalidity pensions 42.0 39.1 36.3survivors pensions 20.6 18.5 19.4
1) New pensions amount includes the compensations so the amount of thesepensions is equal to the income amount from the pensions too.
AVERAGE PENSION / REPLACEMENT RATE (RR) FOR PENSIONS OF CURRENT YEAR
12,71913,000
13,611
14,639 14,508 14,45614,25014,538
15,117
2012 2013 2014 2015 2016 2017
Pension amount and income from pension for new urban old-age pensions of current year
for pensionsfor income from pensions
34.9 35.0 36.5
43.3
40.7 38.439.1 39.1 40.543.3
2012 2013 2014 2015 2016 2017
Replacement rate for new old-age pensions of current year
pension amountincome amount from pension
Note:

18
in days
2015 2016 2017Average time term needed to process pension application
by pensions categories:
old-age 23.0 21.2 21.6invalidity 38.7 31.7 34.8survivors 23.5 20.7 20.6
Maximum deadline to process pension appl. 45 45 45
in percentage against totalNew pensions of current year before the due date
old-age 95.4 97.5 96.1invalidity 74.7 81.9 78.7survivors 94.5 96.4 95.8
in daysAverage time term needed to process pensions before the due date
old-age 21.1 20.1 20.8invalidity 26.6 22.9 23.5survivors 20.8 19.2 18.8
AVERAGE TIME TERM NEEDED TO PROCESS PENSION
28.6
29.9
23.5 23.0
21.2
21.6
31.2
31.9
24.2
2012 2013 2014 2015 2016 2017
Average time term needed to process old-age pension applications of current year
urban pensions
rural pensions
maximum deadline

19
2015 2016 2017Average period of benefiting pension
by gender:pensions in total
total 22.3 22.5 22.8male 19.8 20.0 20.0female 25.3 25.6 26.0
urban pensionstotal 21.7 21.9 22.0male 19.7 19.7 19.7female 25.0 25.3 25.4
rural pensionstotal 23.5 23.8 24.7male 20.3 20.6 21.1female 25.9 26.2 26.9
AVERAGE PERIOD OF BENEFITING PENSION
19.1 19.2 19.5 19.8 20.0 20.0
24.1 24.2 25.0 25.3 25.6 26.0
2012 2013 2014 2015 2016 2017
Average period of benefiting old-age pensions by gender in years
male female