the state of the unions 2021
TRANSCRIPT

The State of the Unions 2021A Profile of orgAnized lAbor in new York CitY, new York StAte,
And the United StAteS
Ruth MilkMan and Stephanie luce
the cunY School of laboR and uRban StudieS
SEPTEMBER 2021

The State of the Unions 2011 1The State of the Unions 2021 1
THE STATE OF THE UNIONS 2021:A PROFILE OF ORGANIZED LABOR IN
NEW YORK CITY, NEW YORK STATE, AND THE UNITED STATES
R u t h M i l k M a n a n d S t e p h a n i e l u c e
Organized labor in the United States has suffered sharp decline in numbers and influence in recent years. Following the long, slow recovery from the Great
Recession, anti-union groups launched aggressive attacks on public-sector collective bargaining rights, culminating in the U.S. Supreme Court 2018 decision in Janus v. AFSCME, which prohibits public-sector unions from collecting “fair share” or “agency” fees from non-members. In the private sector, where unionization rates have fallen to record lows, rising health care costs and employer demands for concessions have added to the problems that unions face, even as inequalities in income and wealth have continued to rise. The COVID-19 pandemic has compounded these formidable challenges, as millions of U.S. workers suffered furloughs or layoffs, and others left the labor force entirely to care for children who remained at home while schools and childcare centers were closed. This huge crisis has had little effect on overall patterns of unionization, however, since both unionized and nonunion sectors were impacted by the economic downturn.
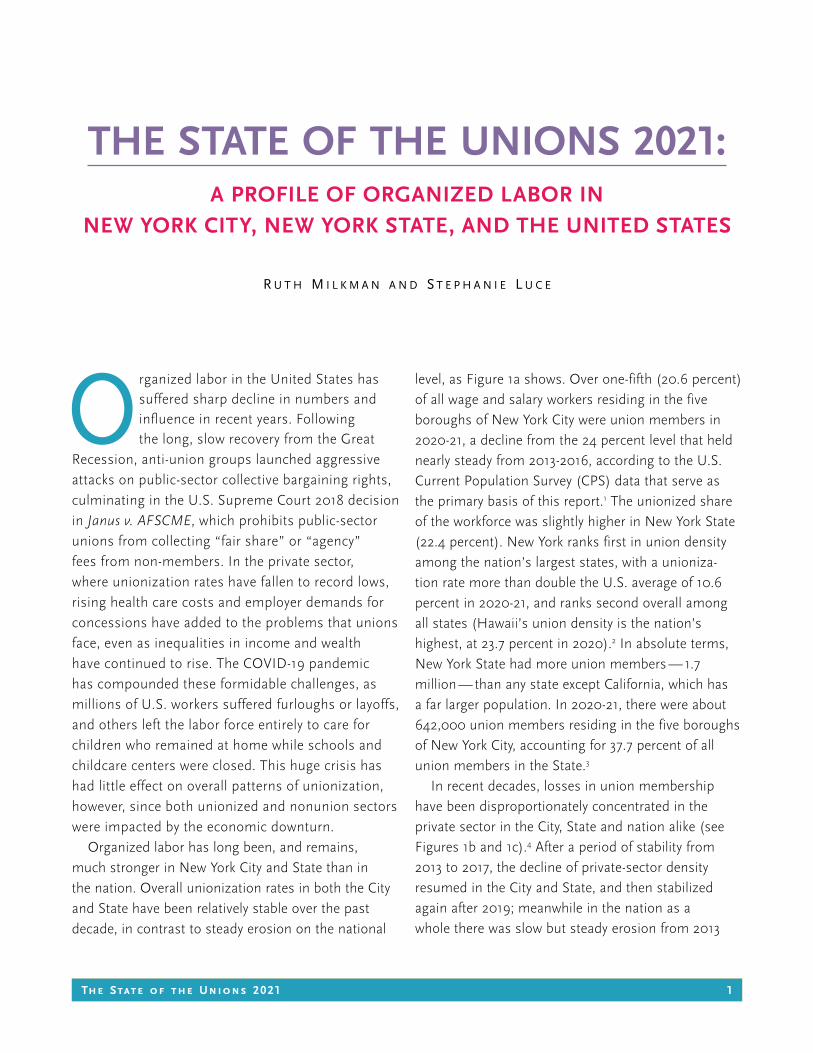
Organized labor has long been, and remains, much stronger in New York City and State than in the nation. Overall unionization rates in both the City and State have been relatively stable over the past decade, in contrast to steady erosion on the national
level, as Figure 1a shows. Over one-fifth (20.6 percent) of all wage and salary workers residing in the five boroughs of New York City were union members in 2020-21, a decline from the 24 percent level that held nearly steady from 2013-2016, according to the U.S. Current Population Survey (CPS) data that serve as the primary basis of this report.1 The unionized share of the workforce was slightly higher in New York State (22.4 percent). New York ranks first in union density among the nation’s largest states, with a unioniza-tion rate more than double the U.S. average of 10.6 percent in 2020-21, and ranks second overall among all states (Hawaii’s union density is the nation’s highest, at 23.7 percent in 2020).2 In absolute terms, New York State had more union members — 1.7 million — than any state except California, which has a far larger population. In 2020-21, there were about 642,000 union members residing in the five boroughs of New York City, accounting for 37.7 percent of all union members in the State.3
In recent decades, losses in union membership have been disproportionately concentrated in the private sector in the City, State and nation alike (see Figures 1b and 1c).4 After a period of stability from 2013 to 2017, the decline of private-sector density resumed in the City and State, and then stabilized again after 2019; meanwhile in the nation as a whole there was slow but steady erosion from 2013

2 The State of the Unions 2021
5%
0%
10%
15%
20%
25%
30%
2001
2002
2003
2004
2005
2006
2007
2008
2009
2010
2011
2012
2013
2014
2015
2016
2017
2018
2019
2020
-21
United States New York State New York City
22.4%
20.6%
10.6%
Perc
enta
ge U
nion
ized
6.2%
13.0%12.8%
0%
5%
10%
15%
20%
25%
2001
2002
2003
2004
2005
2006
2007
2008
2009
2010
2011
2012
2013
2014
2015
2016
2017
2018
2019
2020
-21
Private Density US Private Density New York State Private Density New York City
Perc
enta
ge U
nion
ized
Figure 1a. Union Density in New York City, New York State and the United States, 2001-2021
Percentages shown for 2020-21 include the 18 months from January 2020 to June 2021.Source: U.S. Current Population Survey, Outgoing Rotation Group, 2001 — June 2021.
Percentages shown for 2020-21 include the 18 months from January 2020 to June 2021.Source: U.S. Current Population Survey, Outgoing Rotation Group, 2001 — June 2021.
Figure 1b. Private-Sector Union Density in New York City, New York State and the United States, 2001 - 2021

The State of the Unions 2011 3The State of the Unions 2021 3
34.5%
68.2%67.6%
0%
10%
20%
30%
40%
50%
60%
70%
80%
2001
2002
2003
2004
2005
2006
2007
2008
2009
2010
2011
2012
2013
2014
2015
2016
2017
2018
2019
2020
-21
Public Density US NY State Public Density NYC Public Sector Density
34.5%
6.2%10.6%
68.2%
12.8%
22.4%
67.6%
13.0%
20.6%
68.5%
12.7%
23.6%
66.0%
11.7%
20.0%
0%
10%
20%
30%
40%
50%
60%
70%
80%
Public Sector Private Sector Both Sectors
United States
New York State
NYC (5 Boroughs)
NYS Excluding NYC
NYC Metro Area
Perc
enta
ge U
nion
ized
Figure 1c. Public-Sector Union Density in New York City, New York State and the United States, 2001 - 2021
Percentages shown for 2019-20 include the 18 months from January 2020 to June 2021.Source: U.S. Current Population Survey, Outgoing Rotation Group, 2001 — June 2021.
Figure 2. Union Density, By Sector, New York City, New York State and the United States, 2020-21
Percentages shown for 2020-21 include the 18 months from January 2020 to June 2021.Source: U.S. Current Population Survey, Outgoing Rotation Group, 2020 — June 2021.

4 The State of the Unions 2021
gender, Union MeMberShiP, And Job loSSeS in the CoVid-19 eConoMiC downtUrn
The COVID-19 pandemic and the resulting lockdowns gener-ated vast job losses across the United States. The New York City metropolitan area, where the pandemic’s impact was felt earlier than in the rest of the country, suffered especially deep job losses in 2020. There the decline in employment among women workers was greater than among men — in sharp contrast to the Great Recession, which hit men’s employment harder.
In the 2020 “she-cession,” occupations and industries in which women predominate — such as hospitality and retail — declined especially sharply, whereas during the Great Recession, and most other economic downturns over the past century, male-dominated sectors like construction were impacted most. Another novel feature of the COVID-19 economic crisis was the effect of the gender disparity in parenting responsibilities on employment. Mothers were more likely than fathers to leave the labor force as schools and child-care centers closed their doors in response to the pandemic.
These developments have been widely documented.1 However, little attention has been devoted to comparing the impact of the COVID-19 economic downturn on unionized and nonunion workers, or to how unionization interacts with gender inequalities. That is our focus here.
Both union members and nonunion workers suffered deep employment declines in 2020, but the drop was somewhat smaller for union members, reflecting the fact that unionized workers generally have more job security than their nonunion counterparts as well as the fact that highly unionized industries were often less impacted by the downturn. This has been explored by other researchers at the national level.2 In the United States as a whole, employment fell by 7 percent between 2019 and 2020 for nonunion workers, but by only 2 percent among union members. In the New York City metro-politan area, the gap was substantially narrower, as Figure B1 shows: employment fell by 10 percent between 2019 and 2020 among nonunion workers, compared to 8 percent among union members.3 This may reflect the fact that in 2020 the pandemic hit the New York area much harder than many other parts of the nation.
As Figure B1 shows, unions helped to insulate women workers, in particular, from the broader “she-cession” in which overall job losses for women exceeded those for men. Indeed, for unionized workers in the New York City metropolitan area, the pandemic’s impact on employment was far less extensive for women than for men. The number of employed male union members fell 12 percent between 2019 and 2020. But among employed women union members the decline was
0%
-2%
-4%
-6%
-8%
-10%
-12%
-14%
-16%
-18%
2%
4%
UnionMembers
Private-sectorUnion
Members
Public-sectorUnion
Members
Non-unionWorkers
MaleUnion
Workers
FemaleUnion
Workers
White MaleUnion
Workers
White FemaleUnion
Workers
Black MaleUnion
Workers
Black FemaleUnion
Workers
Latinx MaleUnion
Workers
Latinx FemaleUnion
Workers
-8%
-10%
-12% -12%
-3% -3% -3%
-16%
-8%
-2%
-13%
-2%
Figure B1. Employment Losses between 2019 and 2020 by Union Membership, Gender and Race/Ethnicity, NYC Metropolitan Area
See p. 21 for the endnotes to this section.

The State of the Unions 2011 5The State of the Unions 2021 5
only one-fourth that size, or 3 percent, as Figure B1 shows. In the United States as whole, the gender gap was similar: employment declined 5 percent for male union members and 1 percent among female union members.
This disparity reflects the overrepresentation of women in public-sector employment: in the New York City metropolitan area, women were 55 percent of all workers in the public sector in 2019, prior to the pandemic, while only 47 percent of workers in the private sector that year were female. Moreover, employment declined relatively modestly in the area’s highly-unionized public sector, by only 5 percent between 2019 and 2020. In the less-unionized private sector, in contrast, the decline was double that magnitude, or 10 percent. For union members, the gap between the public and private sectors was even wider: employment declined 13 percent among private-sector union members in the New York City metro-politan area, but only 3 percent among public-sector female union members.
This gender disparity was especially pronounced for white union members: while employment among the area’s white male union members fell 16 percent between 2019 and 2020, for white female union members it was only 3 percent. The gender gap among Latinx union members was nearly as great: employment fell 12 percent for Latinx male union members, but only 3 percent among Latinx female union members.
By contrast, among Blacks, the number of employed male union members fell 8 percent, or half the rate for white union-ized men (16 percent); while the employment of Black female women members rose by 2 percent. This reflects the fact that Black workers are dramatically overrepresented in public-sector employment in the New York metropolitan area: in 2019, 12 percent of all public-sector workers were Black, compared to 3 percent of all private-sector workers. Black women are especially concentrated in public-sector employment: In 2019, 18 percent of employed Black women in the New York City metropolitan area were in the public sector, an even higher share than for women workers overall, 15 percent of whom were in the public sector.
As Figure B2 shows, among nonunionized women workers in the New York City metropolitan area who had children under age 18 in their households, employment fell by 16 percent from 2019 to 2020. In contrast, for nonunion men with children under 18 the decline was a more modest 9 percent. This finding is generally consistent with the national pattern: for nonunion women with children under 18, employment fell 9 percent, and for their male counterparts, by only 6 percent. And in the United States as a whole, female union members with children under 18 experienced a 4 percent employment decline, compared to 3 percent for male union members with children under 18.
However, as Figure B2 shows, among union members in the New York City metropolitan area, the opposite was true: employment fell by 8 percent among women union members
with children, while for male union members employment declined more than twice that amount: 18 percent. This prob-ably reflects patterns of occupational segregation rather than gender disparities in parenting responsibilities. Unionized male workers in the New York City metropolitan area are concentrated in industries like construction and transporta-tion, where employment among union members declined by 13 and 25 percent, respectively, between 2019 and 2020. Those two industries alone accounted for 29 percent (13 percent in construction and 16 percent in transportation) of all the area’s unionized male workers with children at home in 2019.
By contrast unionized women are far more concentrated in public-sector jobs. Public administration and education accounted for 63 percent of all female union members with children under 18 in the New York City metropolitan area in 2019. In both these industries, and especially in education (which alone accounted for 51 percent of all unionized women with children in 2019), layoffs were relatively rare during the pandemic, particularly in regions where schools are highly unionized like the New York metropolitan area.
In summary, unionized women workers in the New York City metropolitan area suffered fewer job losses than their nonunion counterparts during the economic crisis tied to the COVID-19 pandemic. This is especially surprising in the context of the pandemic’s impact on the labor market as a whole, where employment declines were greater for women than for men. Moreover, in contrast to the national trend in which mothers disproportionately withdrew from the labor market with school and childcare center closures, in the New York City metropolitan area, women union members with children suffered a smaller employment decline than nonunion women did.
0%
-2%
-4%
-6%
-8%
-10%
-12%
-14%
-16%
-18%
-20%Non-union
Male Workerswith Children
Under 18
Non-union Female Workerswith Children
Under 18
Male Union Members
with Children Under 18
Female Union Members
with Children Under 18
-9%
-16%
-18%
-8%
Figure B2. Employment Losses between 2019 and 2020 by Union Membership, Gender, and Presence of Children under 18 in Household, NYC Metropolitan Area
6 The State of the Unions 2021
to 2020-21. By contrast, in the public sector, union density has been relatively stable over time; indeed, despite the 2018 Janus decision, by 2020-21 density exceeded the 2018 level in all three geographical jurisdictions (see Figure 1c).
Geographical Variation in Union DensityFigure 2 shows the 2020-21 private- and public-sector union density levels for the United States, New York State, New York City, upstate New York (excluding the five boroughs of New York City), and the larger New York City metropolitan “Combined Statistical Area.”5 These are the five entities for which we present detailed data in this report.
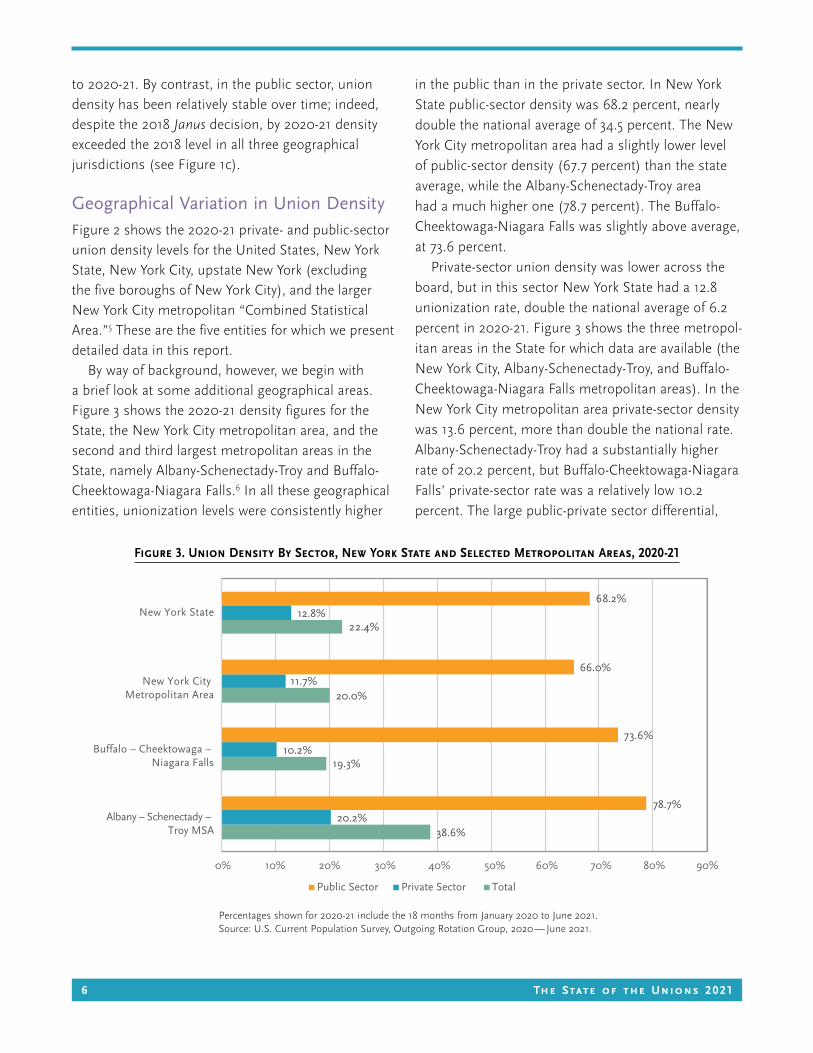
By way of background, however, we begin with a brief look at some additional geographical areas. Figure 3 shows the 2020-21 density figures for the State, the New York City metropolitan area, and the second and third largest metropolitan areas in the State, namely Albany-Schenectady-Troy and Buffalo-Cheektowaga-Niagara Falls.6 In all these geographical entities, unionization levels were consistently higher
in the public than in the private sector. In New York State public-sector density was 68.2 percent, nearly double the national average of 34.5 percent. The New York City metropolitan area had a slightly lower level of public-sector density (67.7 percent) than the state average, while the Albany-Schenectady-Troy area had a much higher one (78.7 percent). The Buffalo-Cheektowaga-Niagara Falls was slightly above average, at 73.6 percent.
Private-sector union density was lower across the board, but in this sector New York State had a 12.8 unionization rate, double the national average of 6.2 percent in 2020-21. Figure 3 shows the three metropol-itan areas in the State for which data are available (the New York City, Albany-Schenectady-Troy, and Buffalo-Cheektowaga-Niagara Falls metropolitan areas). In the New York City metropolitan area private-sector density was 13.6 percent, more than double the national rate. Albany-Schenectady-Troy had a substantially higher rate of 20.2 percent, but Buffalo-Cheektowaga-Niagara Falls’ private-sector rate was a relatively low 10.2 percent. The large public-private sector differential,
38.6%
19.3%
20.0%
22.4%
20.2%
10.2%
11.7%
12.8%
78.7%
73.6%
66.0%
68.2%
0% 10% 20% 30% 40% 50% 60% 70% 80% 90%
Albany – Schenectady – Troy MSA
Buffalo – Cheektowaga – Niagara Falls
New York City Metropolitan Area
New York State
Public Sector Private Sector Total
Figure 3. Union Density By Sector, New York State and Selected Metropolitan Areas, 2020-21
Percentages shown for 2020-21 include the 18 months from January 2020 to June 2021.Source: U.S. Current Population Survey, Outgoing Rotation Group, 2020 — June 2021.

The State of the Unions 2011 7The State of the Unions 2021 7
combined with the fact that the Capital District has a
disproportionate share of public-sector employment,
helps to explain why overall union density is higher in
the Albany-Schenectady-Troy metropolitan area than in
all the other areas shown in Figure 3.
Within New York City, as Figure 4 shows, union
density varies across the five boroughs, with substan-
tially higher unionization levels among residents of
the “outer boroughs” than among those living in
Manhattan in 2020-21. Unfortunately, the CPS sample
size is too small to fully disaggregate the private and
public sector rates in Manhattan and Staten Island.
The highest private-sector union density level among
the four outer boroughs is in the Bronx, followed by
Brooklyn. In regard to the public sector, as Figure 4
shows, public-sector density is slightly above the
city-wide average in Brooklyn and the Bronx, while in
Queens it is somewhat lower.
Union Membership by Age, Earnings, and Education
Unionization rates are much higher for older than
younger workers. As Figure 5 shows, in all the
geographical entities shown except for upstate New
York, the rates are highest for workers aged 55 years or
more, somewhat lower for those aged 25-54, and far
lower for those aged 16-24. (In upstate New York the
rate is highest for those 25-54 years old.) This pattern
reflects the limited extent of union organizing among
new labor market entrants. In addition, as Figure
6 shows, unionized jobs typically provide workers
with higher wages than non-union jobs do. Higher
wages, in turn, are strongly associated with lower
turnover, skewing the unionized workforce to include
a disproportionate share of older workers. In addition,
unionized jobs typically offer more job security than
nonunion jobs, further reducing turnover and thus
82.6%
54.9%
NA
75.9%
71.9%
67.6%
NA
13.0%
6.3%
13.4%
23.4%
13.0%
31.8%
19.2%
9.7%
23.0%
31.4%
20.6%
0% 10% 20% 30% 40% 50% 60% 70% 80% 90% 100%
Staten Island
Queens
Manhattan
Brooklyn
Bronx
NYC (5 Boroughs) Total
Private Sector
Public Sector
Figure 4. Union Density By Sector, New York City and Its Boroughs, 2020-21
NA = Sample size is insufficient to generate reliable estimates. See footnote 1 in the text.Percentages shown for 2020-21 include the 18 months from January 2020 to June 2021.Source: U.S. Current Population Survey, Outgoing Rotation Group, 2020 — June 2021.

8 The State of the Unions 2021
4%
9%11%
NA
7%
11%
23%
26%
20%21%
12%
26%
24%
29%
24%
0%
5%
10%
15%
20%
25%
USA New York State NYS Excluding NYC NYC (5 Boroughs) NYC Metro Area
16–24 25–54 55 and over
30%
35%P
erce
nta
ge U
nio
niz
ed
$26.00
$20.25
$27.88
$22.60
$28.83
$21.43
$26.37$24.71
$28.85
$25.00
$0.00
$5.00
$10.00
$15.00
$20.00
$25.00
$30.00
$35.00
Union Members Non-union Workers
Med
ian
Hou
rly
Wag
e
USA
New York State
NYS Excluding NYC
NYC (5 Boroughs)
NYC Metro Area
Figure 5. Unionization Rates by Age, Selected Geographical Areas, 2020-21
NA = Sample size is insufficient to generate reliable estimates. See footnote 1 in the text.Percentages shown for 2020-21 include the 18 months from January 2020 to June 2021.Source: U.S. Current Population Survey, Outgoing Rotation Group, 2020 — June 2021.
Figure 6. Median Hourly Wage, Union Members and Non-Union Workers, Selected Geographical Areas, 2020-21
Figures reflect preliminary estimates, in 2020 dollars.Wages shown for 2020-21 include the 18 months from January 2020 to June 2021.Source: U.S. Current Population Survey, Outgoing Rotation Group, 2020 — June 2021.

The State of the Unions 2011 9The State of the Unions 2021 9
further contributing to the relatively higher average age
of unionized workers.
Figure 7 shows that — contrary to popular
belief — in all five geographical entitles shown, college-
educated workers have higher unionization rates than
those with less education. The group with “some
college” — education beyond high school but short of
attaining a four-year degree — have the highest rates.
Decades ago, the archetypal union member was a
blue-collar worker with limited formal education. But
college attendance rates have increased steadily over
time, and today mid-level professionals in fields like
education and public administration — most of whom
have attended college — are more likely to be union-
ized than any other group of workers (as discussed
further below).
Industry Variation in Unionization RatesIn 2020-21 more than half (56.0 percent) of all union-
ized workers in the United States were in three basic
industry groups: educational services, health care
and social assistance, and public administration, as
Table 1 shows. In New York City and State, those three
industry groups account for an even larger majority of
all unionized workers (60.9 percent and 63.5 percent,
respectively). All three of these industry groups
include vast numbers of public-sector jobs (although
in health care the majority of workers are employed in
the private sector, as are about one-third of those in
education). Moreover, in contrast to many traditional
union strongholds, all three of these industries include
relatively large numbers of college-educated workers.
10%11%
10%
5%
18%
25%
20%
13%
15%
30%
18%
20%
23%
21%
NA
16%
25%
19%
12%
0%
10%
20%
30%
40%
Earned a 4-year college degree Some college Graduated from high school Did not graduate from high school
USA
New York State
NYC (5 Boroughs)
NYS Excluding NYC
NYC Metro Area
12%
Perc
enta
ge U
nion
ized
Figure 7. Unionization Rates by Education, Selected Geographical Areas, 2020-21
NA = Sample size is insufficient to generate reliable estimates. See footnote 1 in the text.Percentages shown for 2020-21 include the 18 months from January 2020 to June 2021.Source: U.S. Current Population Survey, Outgoing Rotation Group, 2020 — June 2021.
10 The State of the Unions 2021
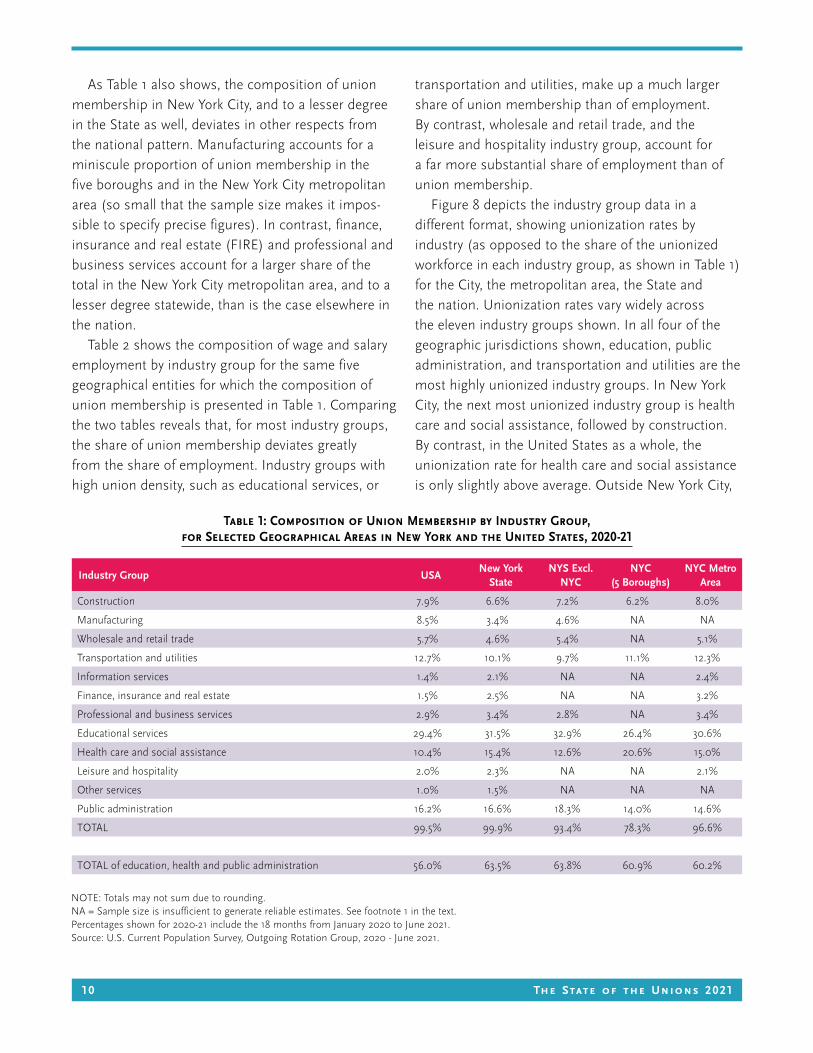
As Table 1 also shows, the composition of union membership in New York City, and to a lesser degree in the State as well, deviates in other respects from the national pattern. Manufacturing accounts for a miniscule proportion of union membership in the five boroughs and in the New York City metropolitan area (so small that the sample size makes it impos-sible to specify precise figures). In contrast, finance, insurance and real estate (FIRE) and professional and business services account for a larger share of the total in the New York City metropolitan area, and to a lesser degree statewide, than is the case elsewhere in the nation.
Table 2 shows the composition of wage and salary employment by industry group for the same five geographical entities for which the composition of union membership is presented in Table 1. Comparing the two tables reveals that, for most industry groups, the share of union membership deviates greatly from the share of employment. Industry groups with high union density, such as educational services, or
transportation and utilities, make up a much larger share of union membership than of employment. By contrast, wholesale and retail trade, and the leisure and hospitality industry group, account for a far more substantial share of employment than of union membership.
Figure 8 depicts the industry group data in a different format, showing unionization rates by industry (as opposed to the share of the unionized workforce in each industry group, as shown in Table 1) for the City, the metropolitan area, the State and the nation. Unionization rates vary widely across the eleven industry groups shown. In all four of the geographic jurisdictions shown, education, public administration, and transportation and utilities are the most highly unionized industry groups. In New York City, the next most unionized industry group is health care and social assistance, followed by construction. By contrast, in the United States as a whole, the unionization rate for health care and social assistance is only slightly above average. Outside New York City,
Industry Group USANew York
StateNYS Excl.
NYCNYC
(5 Boroughs)NYC Metro
Area
Construction 7.9% 6.6% 7.2% 6.2% 8.0%
Manufacturing 8.5% 3.4% 4.6% NA NA
Wholesale and retail trade 5.7% 4.6% 5.4% NA 5.1%
Transportation and utilities 12.7% 10.1% 9.7% 11.1% 12.3%
Information services 1.4% 2.1% NA NA 2.4%
Finance, insurance and real estate 1.5% 2.5% NA NA 3.2%
Professional and business services 2.9% 3.4% 2.8% NA 3.4%
Educational services 29.4% 31.5% 32.9% 26.4% 30.6%
Health care and social assistance 10.4% 15.4% 12.6% 20.6% 15.0%
Leisure and hospitality 2.0% 2.3% NA NA 2.1%
Other services 1.0% 1.5% NA NA NA
Public administration 16.2% 16.6% 18.3% 14.0% 14.6%
TOTAL 99.5% 99.9% 93.4% 78.3% 96.6%
TOTAL of education, health and public administration 56.0% 63.5% 63.8% 60.9% 60.2%
NOTE: Totals may not sum due to rounding.NA = Sample size is insufficient to generate reliable estimates. See footnote 1 in the text.Percentages shown for 2020-21 include the 18 months from January 2020 to June 2021.Source: U.S. Current Population Survey, Outgoing Rotation Group, 2020 - June 2021.
Table 1: Composition of Union Membership by Industry Group, for Selected Geographical Areas in New York and the United States, 2020-21

The State of the Unions 2011 11The State of the Unions 2021 11
the other outstanding high-density industry group is construction, which has a higher unionization rate than health care and social assistance in the other three geographical entities shown in Figure 8. At the other extreme, regardless of geography, union density is consistently low — in the single digits — in wholesale and retail trade; leisure and hospitality; and in finance, insurance and real estate.
Because these industry group data are highly aggregated, however, they obscure the complexity of the City, State and nation’s extremely uneven patterns of unionization by industry. The limited sample size of the CPS restricts our ability to capture that complexity for 2020-21. For this reason, we created a different dataset that consolidates CPS data over a much longer period, the eleven and a half years from January 2009 to June 2021, inclusive. This 150-month blend provides a much larger sample size, permitting a far more disaggregated analysis of industry variations. Because of the longer time span represented in the data, however, the unionization rates derived from this dataset differ somewhat from those shown in Figure 8 for 2020-21.7
Table 3 summarizes the 2009-2021 data for 41 industry groups, showing unionization rates in the New York City metropolitan area, New York State, and the United States as a whole. For almost all the industry groups shown for which data are available, the State had far higher union density than in the nation as a whole in this period. The two exceptions are food manufacturing and the residual category “other transportation”; in both cases the rates were only slightly lower in the State than in the nation. In the New York City metropolitan area, unionization rates for these two industries were even lower than in the State, and there were two additional industries with unionization rates below the national average: paper products and printing; and another residual category: “other manufacturing.”
In 14 of the 41 industries shown, 2009-2021 union-ization rates were at least 25 percent in the New York City metropolitan area: utilities; construction; retail grocery stores; air transportation; bus service and urban transit; postal service (transportation); couriers and messengers; “other information services”; elementary and secondary schools; hospitals; nursing
Industry Group USANew York
StateNYS Excl.
NYCNYC (5
Boroughs)NYC Metro
Area
Construction 7.4% 6.7% 7.0% 6.1% 7.2%
Manufacturing 9.9% 5.5% 7.5% 2.6% 5.2%
Wholesale and retail trade 13.3% 12.1% 12.8% 10.8% 11.8%
Transportation and utilities 5.9% 5.9% 5.3% 6.5% 6.5%
Information services 1.6% 2.5% 1.7% 3.7% 2.7%
Finance, insurance and real estate 6.9% 8.8% 7.4% 10.9% 10.4%
Professional and business services 12.8% 13.1% 11.9% 14.9% 14.7%
Educational services 9.3% 11.6% 12.8% 10.5% 10.9%
Health care and social assistance 11.6% 13.4% 13.7% 13.2% 12.2%
Leisure and hospitality 9.5% 9.8% 8.7% 11.0% 9.0%
Other services 4.9% 5.2% 4.9% 5.8% 5.1%
Public administration 4.8% 5.0% 5.7% 4.0% 4.1%
TOTAL 100.0% 100.0% 100.0% 100.0% 100.0%
Table 2: Composition of Wage and Salary Employment by Industry Group, for Selected Geographical Areas in New York and the United States, 2020-21
NOTE: Totals may not sum due to rounding.NA = Sample size is insufficient to generate reliable estimates. See footnote 1 in the text.Percentages shown for 2020-21 include the 18 months from January 2020 to June 2021.Source: U.S. Current Population Survey, Outgoing Rotation Group, 2020 - June 2021.

12 The State of the Unions 2021
30%
3%
9%
31%
3%
2%
9%
23%
5%
8%
13%
62%
7%
23%
54%
6%
7%
21%
8%
13%
28%
58%
29%
47%
NA
NA
NA
NA
NA
59%
6%
22%
51%
5%
6%
17%
39%
40%38%
9%
NANA
26%
0% 10% 20% 30% 40% 50%
Public administration
Leisure and hospitality
Health care and social assistance
Educational services
Professional and business services
Finance, insurance and real estate
Information
services
Transportation and utilities
Wholesale and retail trade
Manufacturing
Construction
Percentage Unionized
NYC Metro AreaNYC (5 Boroughs)New York StateUSA
60% 70%
24%
Figure 8. Unionization Rates by Industry Group, Selected Geographical Areas, 2020-21
NA = Sample size is insufficient to generate reliable estimates. See footnote 1 in the text.Percentages shown for 2020-21 include the 18 months from January 2020 to June 2021.Source: U.S. Current Population Survey, Outgoing Rotation Group, 2020 — June 2021.

The State of the Unions 2011 13The State of the Unions 2021 13
Table 3. Unionization Rates by Industry, New York City Metropolitan Area, New York State, and the United States, 2009-2021
NA = Sample size is insufficient to generate reliable estimates. See footnote 1 in the text.Source: U.S. Current Population Survey, Outgoing Rotation Group, 2020 - June 2021.
Industry New York Metro New York State United States
TOTAL (All Industries) 20.8% 23.6% 11.1%
Agriculture and mining NA NA 3.6
Utilities 45 50 25
Construction 26 29 14
Food manufacturing 8 12 13
Textile and apparel manufacturing NA NA 3.1
Paper products and printing 10.3 23.5 12.2
Other manufacturing 7.4 13.6 9.1
Wholesale grocery and beverages 15.5 16.5 8.8
Other wholesale trade 5.2 6.8 2.7
Retail grocery stores 25.1 20.7 15.8
Pharmacy and drug stores 9.5 9.5 4.5
Department and discount stores 7.3 6.3 2.6
Other retail trade NA NA 2.0
Air transportation 43.1 40.1 39.2
Truck transportation 14.9 20.3 8.9
Bus service and urban transit 59.9 63.5 40.3
Postal service (transportation) 74.0 77.1 64.2
Couriers and messengers 29.5 30.8 24.8
Other transportation 24.0 26.1 29.8
Newspaper, periodical and book publishing 6.7 7.6 4.7
Motion pictures and video 17.1 16.8 12.5
Radio, television and cable 16.3 18.6 7.1
Wired and other telecommunication 22.6 32.5 14.9
Other information services 30.4 25.0 16.9
Finance, insurance and real estate 7.7 9.2 2.5
Building and security services 14.0 15.8 4.9
Other management and professional services 3.4 5.3 1.9
Elementary and secondary schools 63.6 68.0 40.3
Other educational services 24.3 27.3 12.8
Offices of physicians and other health providers 5.0 6.3 2.6
Hospitals 36.1 38.6 13.8
Nursing care facilities 28.0 30.1 7.0
Home health care services 27.0 27.7 7.7
Child day care services 10.4 11.7 3.6
Other health care and social assistance 21.2 23.4 9.1
Performing arts, museums and sports 25.8 31.0 12.9
Amusement, gambling and recreation 14.2 13.9 7.0
Hotels and accommodation 22.5 20.1 7.3
Restaurants, food service & drinking places 3.2 2.9 1.4
Other services 6.3 7.2 2.9
Public administration 60.1 65.0 31.1

14 The State of the Unions 2021
care facilities; home health care services; performing arts, museums and sports; and public administration. With the exception of retail grocery stores, these industries also had rates at or above 25 percent in the State. “Other transportation” and “other educational services” were well above that threshold in the State (but not in the metropolitan area). In the case of air transportation and postal service transportation, these high unionization rates are the product of national-level collective bargaining, while for the other industries they reflect union strength in local and regional labor markets.
Union contracts may no longer set the wage stan-dard for the New York workforce as a whole, but they often do so in key industries like hospitals, nursing care facilities and telecommunications, as as well as in public-sector industries like transit, education, home
health care (the unionized portion of which is publicly funded) and public administration.
That said, the portrait of industry-specific unionization rates shown in Table 3 fails to capture some important points of differentiation. A notable example is the differences among construction industry segments: commercial construction is far more unionized than its residential counterpart in the metropolitan area, the State and the nation alike.
Union Membership DemographicsThe patterns of unionization by industry have a powerful effect on the demographics of unionism because males and females, as well as workers of various racial and ethnic origins, are unevenly distrib-uted across industries.8 For example, educational services, as well as health care and social assistance,
11%12%
10%9%
23%
31%
19%
13%
18%
35%
18%
12%
25%
23%
20%
NA
20%
30%
19%
10%
0%
10%
20%
30%
40%
White(Non-Latinx)
Black(Non-Latinx)
Latinx Asian – Pacific Islander(Non-Latinx)
USA
New York State
NYC (5 Boroughs)
NYS Excluding NYC
NYC Metro Area
Perc
enta
ge U
nion
ized
Figure 9. Unionization Rates by Race and Ethnicity, Selected Geographical Areas, 2020-21
NA = Sample size is insufficient to generate reliable estimates. See footnote 1 in the text.Percentages shown for 2020-21 include the 18 months from January 2020 to June 2021.Source: U.S. Current Population Survey, Outgoing Rotation Group, 2020 — June 2021.

The State of the Unions 2011 15The State of the Unions 2021 15
both of which have very high unionization rates, disproportionately employ female workers. This helps to explain why the 2020-21 unionization rates for women in New York City and in the New York metro-politan area were higher than that of men, as Figure 9 shows. The male unionization rate was slightly greater than that of females in 2020-21 in upstate New York and in the nation as a whole, but even in those jurisdictions the gender gap is relatively small by historical standards.
Unionization rates also vary by race and ethnicity, as Figure 10 shows. Like the gender dynamic, this too reflects differential racial and ethnic patterns of employment across industries. Blacks are the most highly unionized group in four of the five geographical entities, in large part reflecting their disproportionately high representation in public-sector employment. This effect is further amplified in New York City because of the size of the highly unionized transit sector, in which
Blacks are overrepresented. Although this is not the case for the other geographical areas shown in Figure 10, in New York City, Latinx workers’ unionization rate was equal to that of non-Latinx whites in 2020-21. In the other four jurisdictions shown, however, whites had a slightly higher unionization rate than their Latinx counterparts did.
Notably, workers born in the U.S. territory of Puerto Rico — a substantial population group in the New York metropolitan area and the state, have higher unionization rates than mainland U.S-born workers. In 2020-21, 13 percent of all Puerto Rico-born workers in the United States were unionized, a higher rate than for any other racial or ethnic group.9
Unionization rates also vary with nativity, as Figure 11 shows. In 2020-21, foreign-born workers’ unioniza-tion rate was only slightly below that of U.S.-born workers in New York City. The gap between these two groups was wider in the other geographical areas
11.0% 10.5%
22.1%22.7%
18.8%
24.4%
19.4%
0%
5%
10%
15%
20%
25%
30%
35%
40%
FemaleMale
USA
New York State
NYC (5 Boroughs)
NYS Excluding NYC
NYC Metro Area
22.6% 22.8%
20.7%
Perc
enta
ge U
nion
ized
Figure 10. Unionization Rates by Gender, Selected Geographical Areas, 2020-21
Percentages shown for 2020-21 include the 18 months from January 2020 to June 2021.Source: U.S. Current Population Survey, Outgoing Rotation Group, 2020 — June 2021.

16 The State of the Unions 2021
16%
22%
17%
25%
20%
21%
19%
24%
9%
11%
0% 10% 20% 30%
US-Born
Foreign-Born
PPercentage Unionized
USA
New York State
NYC (5 Boroughs)
NYS Excluding NYC
NYC Metro Area
Figure 11. Unionization Rates by Nativity, Selected Geographical Areas, 2020-21
Percentages shown for 2020-21 include the 18 months from January 2020 to June 2021.Source: U.S. Current Population Survey, Outgoing Rotation Group, 2020 — June 2021.

The State of the Unions 2011 17The State of the Unions 2021 17
shown, however, reflecting the fact that relatively
few foreign-born workers are employed in the highly
unionized public sector. New York City is different
from the other geographical entities shown because it
has a large concentration of immigrants who arrived
in the United States decades ago, many of whom are
naturalized U.S. citizens; those in this group are far
more likely to be union members than recent arrivals.
More generally, as Figure 12 shows, foreign-born
workers are not a homogenous group. The unioniza-
tion rates of naturalized U.S. citizens are higher
than that of U.S.-born workers, in three of the five
geographical entities shown, and naturalized citizens
have the same unionization rate as their U.S.-born
counterparts in upstate New York. Only in the
New York City metropolitan area is the rate for the
U.S.-born higher than that of naturalized citizens.
Foreign-born non-citizens, by contrast, have very
low rates of unionization. They typically are relatively
recent arrivals, and most are also relatively young;
as noted above, few younger workers are union
members, regardless of nativity. Moreover, noncitizen
immigrants are disproportionately likely to be
employed in informal-sector jobs, which tend to have
very low unionization rates. Over time, however, many
immigrants can move into sectors of the labor market
where unions are present. That is especially the case
for those who are naturalized citizens.
Figure 13 shows that unionization rates for
foreign-born workers vary much less within the public
and private sectors than between them, regardless
of citizenship status. Relatively few noncitizens are
employed in the public sector, however. Only 5.1
percent of all foreign-born noncitizens in the United
States were employed in the public sector, compared
to 18.6 percent of U.S. born workers. Thus, the high
level of public-sector unionization among noncitizens
does little to boost their overall unionization rate.
And as the bottom half of Figure 13 shows, private-
sector unionization rates are consistently lower for all
groups, regardless of citizenship status.
ConclusionActively recruiting new members into the ranks of the labor movement, as many dedicated labor organizers have sought to do in recent years, is the primary means by which unions themselves can act to increase the unionization level. Indeed, this is one key counterweight to the downward trend in organized labor’s influence. Yet many factors that the labor movement cannot control also critically influence the level of union density. All else equal, if employment declines in a highly unionized sector of the economy or expands in a non-union (or weakly unionized) sector, union density will fall. The best-known example of this is the steady decline of manufacturing, a former union stronghold, over the past few decades, along with the expansion of private-sector service industries where unions have historically been weak; indeed, these combined trends have been a major driver of the general erosion of union density. Conversely, if employment expands in a highly unionized sector or declines in a non-union or weakly unionized one, the overall level of density will increase. Privatization and subcontracting, both of which often involve a shift from union to non-union status for affected workers, further complicate the picture in some settings. Over the long term, given the “churning” effects of employ-ment shifts and (in non-recessionary periods) normal labor market growth and turnover, simply to maintain union density at a given level requires a great deal of new organizing; and to increase density requires far more extensive effort.
As we have seen, in recent years New York City and State’s unionization levels have been far higher than in other parts of the nation — about double the national average. However, this was not the case in the mid-20th century, when unionization was at its peak: In 1953, 34.4 percent of New York State’s workers were unionized, only slightly above the 32.6 percent national level.10 Although since then organized labor has more than held its own in New York relative to the nation, in absolute terms unions have lost consider-able ground in both the City and State over the

18 The State of the Unions 2021
past few decades especially in the private sector. As recently as 1986, New York City’s private-sector union density was 25.3 percent, nearly twelve percentage points above the 2020-21 level (13.0 percent) level, and statewide the figure was 24.0 percent as recently as 1983 (compared to 12.8 percent in 2020-21).11
As union strength in the private sector has declined, the ratio of public — to private-sector unionization in New York City and State has soared to record highs. In the City in particular, where the Great Recession accelerated the decline in private-sector density, that ratio is of serious concern. In labor’s glory days, a strongly unionized private sector helped foster a social-democratic political culture in New York City.12 The decline in private-sector density is among the factors that have threatened to undermine that tradition in recent years. Although thus far public-sector density in the City has been preserved
intact, even there (albeit to a much lesser extent than in the rest of the nation) public-sector unions have been increasingly on the political defensive in recent years. They were unable to negotiate new contracts for several years after the Great Recession; although that was remedied in the early years of the de Blasio administration. For years that impasse deprived most City workers of significant increases in compensation.
More generally, even taking into account New York City and State’s unusually high union density levels the highest of any major U.S. city and the second highest of any state this is a difficult period for orga-nized labor. Still, for the time being, unions continue to offer substantial protection to a diverse population of workers in the City and State, including teachers and other professionals, as well as large numbers of women, racial-ethnic minorities, and immigrants in both professional and nonprofessional jobs.
9%
22%
25%
5%
12%
11%
11%
25%
24%
10%
28%
21%
0% 5% 10% 15% 20% 25% 30%
Foreign-bornNon-citizens
NaturalizedCitizens
U.S.-Born
Percentage Unionized
USA
New York State
NYC (5 Boroughs)
NYS Excluding NYC
NYC Metro Area13%
20%
20%
Figure 12. Unionization Rates by Nativity and Citizenship Status, Selected Geographical Areas, 2020-21
NA = Sample size is insufficient to generate reliable estimates. See footnote 1 in the text.Percentages shown for 2020-21 include the 18 months from January 2020 to June 2021.Source: U.S. Current Population Survey, Outgoing Rotation Group, 2020 — June 2021.

The State of the Unions 2011 19The State of the Unions 2021 19
Per
cen
tage
Uni
oniz
ed
6%8%
4%
13%
17%
12%
16%
10%
20%
Private Sector
U.S.-born Foreign-born Citizens Foreign-born Non-citizens
35%
42%
22%
69%63%
NA
67% 65%
NA0%
10%
20%
30%
40%
50%
60%
70%
80%USA
New York State
NYC Metro Area
USA
New York State
NYC Metro Area
Per
cen
tage
Uni
oniz
ed
Public Sector
U.S.-born Foreign-born Citizens Foreign-born Non-citizens
9%8%
Figure 13. Public and Private Sector Unionization Rates by Nativity and Citizenship Status, Selected Geographical Areas, 2020-21
NA = Sample size is insufficient to generate reliable estimates. See footnote 1 in the text.Percentages shown for 2020-21 include the 18 months from January 2020 to June 2021.Source: U.S. Current Population Survey, Outgoing Rotation Group, 2020 — June 2021.

20 The State of the Unions 2021
Notes1 This report (apart from the Appendix) is based
on analysis of the U.S. Current Population Survey (CPS) Outgoing Rotation Group data for 2020 and the first six months of 2021. We created a merged data set from the 18 monthly surveys conducted from January 2020 to June 2021, inclusive; the 2020-21 data discussed here and shown in the figures and tables below are the averages for those 18 months. All results are calculated using the CPS unrevised sampling weights, for employed civilian wage and salary workers aged 16 and over. We followed the sample defini-tion and weighting procedures described in Barry T. Hirsch and David A. Macpherson, Union Membership and Earnings Data Book (Washington D.C., 2019). See also unionstats.com which Hirsch and Macpherson update annually (unlike the Data Book which was discontinued after 2019). To ensure reliability, given the limitations of the CPS dataset, we report unionization rates only for subgroups that have a minimum of 100 observations, unless otherwise noted. Rates for subgroups that fall below this threshold are labeled NA (not available). The New York City figures for earlier years are from our September 2010, 2011, 2012, 2013, 2014, 2015, 2016, 2017, 2018, 2019 and 2020 reports, based on CPS data for January 2009-June 2010, January 2010- June 2011, January 2011-June 2012, January 2012-June 2013, January 2013-June 2014, January 2014-June 2015, January 2015-June 2016, January 2016-June 2017, January 2017-June 2018, January 2018-June 2019, and January 2019-June 2020 respectively. These earlier reports are available at http://www.ruthmilkman.info/reports.
2 Union density denotes the proportion of all wage and salary workers who are union members in a region, occupation, or industry. For the state rankings, see unionstats.com.
3 An estimated 642,450 union members resided in New York City’s five boroughs in 2020-21, while the statewide total is estimated at 1,702,453. The CPS data on which these estimates are based rely on respondents self-reports as to whether or not they are union members. (Respondents who indicate that they are not union members are also asked whether they are covered by a union contract, but the analysis in this report does not include those who replied affirmatively to that question.) It is important to note that all geographical data in the CPS (and in this report) refer to respondents’ place of residence which often differs from the location of their workplaces. Since many workers commute from other areas to their jobs in the city, this makes the data for the five boroughs of New York City an imperfect approximation of the extent
of unionization in the city. Some sections of this report present data on union members residing in the wider New York metropolitan area, but that group includes many individuals who are employed outside New York City.
4 In January 2003, methodological changes were made in the CPS (for details, see http://www.bls.gov/cps/rvcps03.pdf). As a result, the data shown in Figures 1a, 1b and 1c for 2003-2020 are not strictly comparable to those for 2001 and 2002.
5 Throughout this report, unless otherwise indicated, we use the term New York metropolitan area to denote the New York-Newark-Bridgeport NY-NJ-CT-PA Combined Statistical Area (CSA), based on the CSA definitions introduced in 2003. The New York-Newark-Bridgeport CSA includes the following counties (in addition to the five boroughs of New York City proper): Duchess, Nassau, Orange, Putnam, Rockland, Suffolk, Ulster and Westchester Counties, New York; Bergen, Essex, Hudson, Hunterton, Mercer, Middlesex, Monmouth, Morris, Ocean, Passaic, Somerset, Sussex and Union Counties, New Jersey; Litchfield, New Haven and Fairfield Counties, Connecticut. The CSA also includes Pike County, Pennsylvania, but that is not included in our dataset. For details, see https://www.whitehouse.gov/sites/whitehouse.gov/files/omb/bulletins/2009/09-01.pdf.
6 These are Metropolitan Statistical Areas based on the 2003 U.S. Census (OMB) area definitions.
7 Since unionization has declined somewhat since 2009 (see Figure 1a-c), the results of this analysis slightly overestimate the actual levels of density for each industry shown in Table 3.
8 Given the nation’s winner-take-all union representa-tion system, and the fact that a relatively small proportion of present-day union membership is the product of recent organizing, the demographic makeup of union membership primarily reflects the demographic makeup of employment in highly unionized industries and sectors. Although unionized workers are more likely than their nonunion counterparts to express pro-union attitudes, this is typically a consequence rather than a cause of union affiliation. See Richard B. Freeman and Joel Rogers, What Workers Want (Ithaca: Cornell University Press, 1999), pp. 68-77. Moreover, individual workers seldom have the opportunity to make independent decisions about union affiliation. Instead, unionization occurs when entire workplaces (or occasionally, entire industries) are organized, and once established, unionization in those workplaces tends to persist over time. Later, as a result of workforce turnover and de-unionization, strongly pro-union workers may be

The State of the Unions 2011 21The State of the Unions 2021 21
employed in non-union settings, and workers with little enthusiasm for organized labor may find themselves employed in union shops.
9 Puerto Ricans born on the U.S. mainland cannot be separately identified in the CPS data. Those born in Puerto Rico are likely to be older, all else equal, further contributing to their high unionization rate. Both groups of Puerto Ricans (those born on the mainland and those born in the territory of Puerto Rico) are U.S. citizens.
10 See Leo Troy, Distribution of Union Membership among the States, 1939 and 1953 (National Bureau of Economic Research, 1957), available at http://www.nber.org/chapters/c2688.pdf. In 1939 the figures were 23.0 percent for New York State and 21.5 for the nation. Figures for New
York City union membership levels during these years,
unfortunately, are not available.
11 The 1986 private-sector figure is 25.3% for the
New York PMSA (NYC’s five boroughs as well as Putnam,
Westchester and Rockland Counties). This and the 1983
statewide figure can be found at http://unionstats.gsu.
edu/. See also Gregory DeFreitas and Bhaswati Sengupta,
The State of New York Unions 2007 (Hofstra University
Center for the Study of Labor and Democracy, 2007), which
includes 1980s data, available at https://www.hofstra.edu/
pdf/cld_stateofnyunions2007.pdf.
12 See Joshua B. Freeman, Working-Class New York
(New York: The New Press, 2000).
Notes for “Gender, Union Membership, and Job Losses in the Covid-19 Economic Downturn” (pp. 4-5)
1 See Ella Koeze, “A Year Later, Who is Back to Work and Who Is Not?” New York Times, March 9, 2021, https://www.nytimes.com/interactive/2021/03/09/business/economy/covid-employment-demographics.html?searchResultPosition=3; Megan Cassella, “The Pandemic Drove Women Out of the Workforce. Will They Come Back?”, Politico, July 22, 2021, https://www.politico.com/news/2021/07/22/coronavirus-pandemic-women-work-force-500329, and for details about New York City, Economic Development Department, New York City, “A Crisis for Working Women and Mothers,” May 2021, https://women.
nyc/wp-content/uploads/2021/05/2021-ChildcareInnovation-SOTE_report.pdf
2 See Celine McNicholas, Heidi Shierholz, and Margaret Poydock, “Union Workers Had More Job Security during the Pandemic, but Unionization Remains Historically Low,” Economic Policy Institute, Jan. 22, 2021, https://files.epi.org/pdf/218638.pdf
3 This analysis compares 2019 (January to December) to 2020 (January to December) annual Current Population Survey data, rather than the 18-month data file for 2020-21 we refer to in the rest of this report, to assess the impact of the pandemic on employment.

22 The State of the Unions 2021
Appendix*
The table below is compiled from a variety of sources and indicates the number of members claimed by individual labor unions with jurisdictions in New York City-based workplaces. Unlike the Current Population Survey (CPS) data that serve as the basis for the rest of this report, which estimate the number of New York City residents who are union members, the data in this Appendix show the number of unionized jobs in New York City.
For a variety of reasons, the total number of union members in New York City shown in the table below is higher than the CPS-based estimate of 642,000 cited on page 1 of this report. Perhaps the most important factor causing this discrepancy is that many union members who are employed in the City are commuters who live in the surrounding suburbs. In addition, some unions may inflate their membership numbers, and unions with broader geographical jurisdictions do not always know precisely how many of their members are
employed in the City. Moreover, many of the unions listed, especially those in sectors like construction and entertainment, have large numbers of members whose employment is irregular and for whom unemployment is common. Even when they are employed, workers in these sectors may oscillate between jobs in the City and jobs in other locations. All these factors help account for the fact that the total shown in the table below is greater than the CPS estimate cited above. Another factor operates in the opposite direction: since the CPS is a household survey that relies on responses from individuals, it is likely to include numerous cases of unionized workers who are unaware of the fact that they are members of labor organizations, potentially leading to an undercount. (It is also possible that some individual respondents to the CPS believe they are union members when in fact they are not, but the greater error is likely to be in the opposite direction.)
* The data in this table were compiled from the most recent available LM-2/3/4 forms (typically from 2020) and other sources by Joseph van der Naald. Thanks to Ed Ott for assistance with this effort.
UNION NAME Reported Membership
Amalgamated Transit Unionc 14,753
American Association of University Professorsc 625
American Federation of Government Employeesc 8,085
American Federation of Musiciansb 7,185
American Federation of School Administrators — Council of Supervisory Associations 6,551
American Federation of State, County and Municipal Employeesc 84,017
American Federation of Teachersa, c
(includes 25,849 members of PSC-CUNY and 125,436 in the NYC UFT)164,514
American Postal Workers Union 8,476
American Train Dispatchers Associationa 223
Anti-Defamation League Staff Association 139
Associated Actors and Artistes of Americab
(includes 18,637 members of Actors Equity Association; 472 members of the American Guild of Musical Artists; and 37,161 members of SAG-AFTRA)
56,359
Association of Commuter Rail Employeesa 271
Association of Surrogates and Supreme Court Reporters Within the City of New Yorka 285
Bakery, Confectionery, Tobacco Workers and Grain Millers International Unionc 1,363
Benefit Fund Staff Association 509
Brotherhood of Security Personnel 19
Brotherhood of Railroad Signalmen 62
Building and Construction Trades Departmenta 136
Citywide Association of Law Assistants of the Civil, Criminal and Family Courtsa 351
Civilian Technicians Association 19

The State of the Unions 2011 23The State of the Unions 2021 23
UNION NAME Reported Membership
Communication Workers of Americaa, c (includes 2,050 members of the NewsGuild of New York)
27,870
Co-Op City Police Benevolent Association 72
Court Attorneys Association of the City of New Yorka 223
Court Officers Benevolent Association of Nassau Countya 11
EMS Superior Officers Associationa 43
Faculty Interest Committee of Ethical Culture Fieldston School 285
Fordham Law School Bargaining Committee 80
Furniture Liquidators of New York 10
Harper Collins Sales Association 33
Independent Association of Legal Workers 4
Independent Guard Union 9
Industrial Workers of the World 470
International Alliance of Theatrical Stage Employeesb, c 21,755
International Association of Bridge, Structural, Ornamental and Reinforcing Iron Workersb 7,656
International Association of Fire Fightersa 8,213
International Association of Heat and Frost Insulators and Allied Workersa 996
International Association of Machinists and Aerospace Workersa 9,986
International Association of Sheet Metal, Air, Rail, and Transportation Workersa, b 8,594
International Brotherhood of Boilermakersb 590
International Brotherhood of Electrical Workersb 27,137
International Brotherhood of Teamstersc 53,625
International Brotherhood of Trade Unions 86
International Federation of Professional and Technical Engineers 103
International Longshoremen’s Association 1,916
International Organization of Masters, Mates & Pilots — Atlantic Maritime Groupc 1,100
International Union of Bricklayers and Allied Craftworkersb 8,615
International Union of Elevator Constructorsb 2,896
International Union of Journeymen and Allied Tradesb 28,522
International Union of Operating Engineersa, b 21,463
International Union of Painters and Allied Tradesa, b 6,710
International Union of Police Associationsa 100
Kingsbrook Jewish Medical Center Staff Association 5
Laborers’ International Union of North Americab 19,652
League of International Federated Employees 767
Local One Security Officers 659
Major League Baseball Players Associationc 92
Marine Engineers Beneficial Associationa 123
Maritime Trades Department Port Council 26
Metal Trades Departmentb 17
MTA Commanding Officers Associationa 22
Mount Sinai Pharmacy Association 120
National Air Traffic Controllers Association 161
National Alliance of Postal and Federal Employees 634
National Association of Letter Carriers 11,031

24 The State of the Unions 2021
UNION NAME Reported Membership
National Association of Transportation Supervisorsa 4,683
National Basketball Players Associationc 34
National Labor Relations Board Union 50
National Postal Mail Handlers Unionc 1,924
National Treasury Employees Union 3,116
National Writers Unionc, e 264
New York City Deputy Sheriffs’ Associationa 126
New York Professional Nurses Association 1,309
New York State Correctional Officers and Police Benevolent Associationa 795
New York State Court Clerks Associationa 1,539
New York State Court Officers Associationa 1,524
New York State Federation of Physicians and Dentists 50
New York State Law Enforcement Officers Uniona 27
New York State Nurses Association 26,459
Newspaper and Mail Deliverers Union 454
International Union of Allied Novelty and Production Workersc 329
Office and Professional Employees International Unionc 8,402
Operative Plasterers’ and Cement Masons’ International Associationb 1,026
Organization of Staff Analystsa 3,243
Organization of Union Representatives 5
Patrolmen’s Benevolent Associationa 23,176
Police Benevolent Association of New York Statea 75
Police Benevolent Association of the New York State Troopersa 233
Postal and Federal Employees Alliance 414
Professional Association of Holy Cross High School 45
Professional Dieticians of New York City Presbyterian 25
Restaurant Workers Union 318 41
Safety Professionals of America 14
Service Employees International Uniona, c
(includes 180,563 NYC members in 1199SEIUc; 85,000 members in SEIU Local 32B-Jc; and 10,000 members in Workers Unitedc)
291,240
Special Patrolman Benevolent Association 80
Stage Directors and Choreograpersb, c 789
St. John’s Preparatory Teachers Association 30
Taxi Workers Alliancee 26,000
Transport Workers Uniona 52,314
Uniformed Sanitation Chiefs Associationa 70
Union of Automotive Techniciansa 51
UNITE HEREd 29,439
United Association of Plumbers and Pipefittersb 15,254
United Auto Workersc 10,431
United Brotherhood of Carpenters and Joinersb, c 18,318
United Food and Commercial Workers International Unionc (includes 12,350 members in the Retail, Wholesale and Department Store Union)
32,306
United Nations International School Staff Association 228

The State of the Unions 2011 25The State of the Unions 2021 25
UNION NAME Reported Membership
United Production Workers Union 2,257
United Steelworkersd 2,628
United Uniformed Workers of New Yorka, f 35,016
United Union of Roofers, Waterproofers and Allied Workersb 1,485
United University Professionsa 2,568
Utility Workers Union of Americac 7,378
Women’s National Basketball Players Associationc 12
Writers Guild of Americab 2,044
TOTAL 1,235,744
a Under the Landrum-Griffin Act (1959) and Civil Service Reform Act (1978) private-sector, postal and federal employee unions are required to file annually LM-2/3/4 forms with the U.S. Department of Labor, which report on their current membership (as well as other data). Public sector unions not covered by these acts are not required to file such forms, and thus some of the membership data were obtained directly from the unions, from the New York City Independent Budget Office (2021), from Freedom of Information Law (FOIL) requests to the Office of the State Comptroller’s Office (2020) and the Metropolitan Transit Authority (2021), from the Port Authority of New York and New Jersey (2021), or from Combined Continuing Disclosure Filings relating to the Metropolitan Transit and Triborough Bridge and Tunnel Authorities (2021).
b Data for these unions include some members working outside New York City. It is impossible to obtain precise data for those employed in the City, because the occupations they represent are not tied to stable workplaces; rather workers are hired for specific projects which are typically, but not always, located in the five boroughs. As a result New York City data for these unions may be overstated.
c The membership figures for this union are available in LM2/3/4 forms. However because the union’s geographical jurisdiction extends beyond the five boroughs of New York City, the number shown was obtained directly from the union.
d Precise membership estimates for one or more of the locals in this union are not available. The figures shown are likely to be inflated because they include some members employed outside New York City.
e This union has dues paying members, but does not currently have collective bargaining rights.
f This includes the following unions, some of which may have members working outside New York City: 5,205 members in the Detectives Endowment Association; 4,301 members in the Sergeants Benevolent Association; 1,586 members in the Lieutenants Benevolent Association; 7,560 members in the Correction Officers Benevolent Association; 6,016 members in the Sanitation Workers Local 831; 2,492 members in the Uniformed Fire Officers Association; 1,200 members in the Sanitation Officers Local 444; 117 members in the Assistant Deputy Wardens — Deputy Wardens Association; 690 members in the Captains Endowment Association; 733 members in the Correction Captains Association; 304 members in the NYC Detective Investigators Association; 1,075 members in the NYS Supreme Court Officers Association; 84 members in the Port Authority Detectives Endowment Association; 89 members in the Port Authority Lieutenants Benevolent Association; 1,782 members in the Port Authority Police Benevolent Association; 214 members in the Port Authority Sergeants Benevolent Association; 189 members in the Uniformed Fire Alarm Dispatchers Benevolent Association; 397 members in the Bridge and Tunnel Officers Benevolent Association; 841 members in the Police Benevolent Association MTA; and 141 members in the Superior Officers Benevolent Association — Triborough Bridge and Tunnel Authority. The numbers for individual unions in the coalition were obtained directly from the unions, from the New York City Independent Budget Office, the Port Authority of New York and New Jersey Employee Payroll Information Directory, and from Combined Continuing Disclosure Filings relating to the Metropolitan Transit and Triborough Bridge and Tunnel Authorities; all are for 2021.
Source: Unless otherwise indicated, the above data are extracted from the most recent LM-2, LM-3 and LM-4 forms that private-sector unions are required to submit annually to the U.S. Department of Labor, available at https://olms.dol-esa.gov/olpdr/

About the Authors
Ruth Milkman holds a Ph.D. in Sociology from the University of California, Berkeley. She is Distinguished Professor of Sociology and History at the CUNY Graduate Center and at the CUNY School of Labor and Urban Studies, where she chairs the Department of Labor Studies. Her most recent books are On Labor, Gender and Inequality (2016), Immigrant Labor and the New Precariat (2020), and Immigration Matters (2020, co-edited with Deepak Bhargava and Penny Lewis).
Stephanie Luce holds an M.A. in Industrial Relations and a Ph.D. in Sociology from the University of Wisconsin, Madison. She is Professor of Labor Studies at the CUNY School of Labor and Urban Studies, and a member of the graduate faculty in Sociology at the CUNY Graduate Center. Her books include Fighting for a Living Wage (2004) and Labor Movements: Global Perspectives (2014).
About The CUNY School of Labor and Urban Studies (SLU)
SLU was established in 2018, as an outgrowth of CUNY’s Murphy Institute. The School offers undergraduate and graduate degrees in Labor Studies and Urban Studies designed to meet the needs of working adults as well as traditional-age college students who seek to learn more about the challenges confronting poor and working class populations in the workplace and in the community. It also collaborates with other units of CUNY to offer a range of college-credit programs designed to give workers the academic and technical skills they need for profes-sional advancement. Its faculty includes distinguished scholars in the social sciences as well as expert practitioners in government, labor, and public service. In addition to its academic programs, SLU sponsors research, organizes forums and conferences, and publishes the journal New Labor Forum.