the state of the unions 2016 - wordpress.com...the state of the unions 2016 ii executive summary...
TRANSCRIPT
July 25, 2016
Frank Manzo IV, M.P.P. Midwest Economic Policy Institute
Don Taylor, M.A. School for Workers, University of Wisconsin–Extension
Michael Childers, Ph.D. School for Workers, University of Wisconsin–Extension
Robert Bruno, Ph.D. University of Illinois at Urbana-Champaign
Jill Manzo Midwest Economic Policy Institute
A Profile of Unionization in Milwaukee, in Wisconsin, and in the United States
HEWLETT-PACKARD THE STATE OF THE UNIONS 2016

The State of the Unions 2016 i
Research Report July 18, 2016
THE STATE OF THE UNIONS 2016 A Profile of Unionization in Milwaukee, in Wisconsin, and in the United States
About the Authors
Frank Manzo IV, M.P.P. is the Policy Director of the Midwest Economic Policy Institute (MEPI), a division of the Illinois Economic Policy Institute (ILEPI). His research focuses on labor market policies, income inequality, community and economic development, infrastructure investment, and public finance. He earned his Master of Public Policy from the University of Chicago Harris School of Public Policy and his Bachelor of Arts in Economics and Political Science from the University of Illinois at Urbana-Champaign. He can be contacted at [email protected].
Don Taylor, M.A. is an Associate Professor at the School for Workers, University of Wisconsin–Extension. He specializes in organizing, public sector labor relations, and organizational development. He has previously held professional staff positions with several unions in both the public and private sectors. He earned his Master of Arts in Political Science and his Bachelor of Arts in History from the University of New Hampshire. He can be contacted at [email protected].
Michael Childers, Ph.D. is a Professor and Director at the School for Workers, University of Wisconsin-Extension. His teaching interests include industrial engineering topics such as time study, production standards, “lean” implementation, job evaluation, and alternative work/pay systems. He earned his M.S. and Ph.D. in Workforce Education and Development from Southern Illinois University, and his B.S. in Industrial Engineering from the University of Illinois at Urbana-Champaign. He can be contacted at [email protected].
Robert Bruno, Ph.D. is a Professor at the University of Illinois at Urbana-Champaign School of Labor and Employment Relations and is the Director of the School’s Labor Education Program. He also serves as Director of the Project for Middle Class Renewal at the University of Illinois at Urbana-Champaign. His research focuses broadly on working-class and union studies issues. He earned his Doctor of Philosophy in Political Theory from New York University and his Master of Arts in Political Science from Bowling Green State University. He can be contacted at [email protected].
Jill Manzo is a Midwest Researcher at the Midwest Economic Policy Institute (MEPI), a division of the Illinois Economic Policy Institute. Her research focuses broadly on transportation infrastructure, economic development, and social justice and inequality. She earned a Bachelor of Arts in Political Science and International Studies from Iowa State University. She can be contacted at [email protected].
MIDWEST ECONOMIC POLICY INSTITUTE
“A Higher Road for a Better Tomorrow”
P.O. Box 8013
St. Paul, Minnesota 55108 Phone: 763-515-0002 www.midwestepi.org www.illinoisepi.org
UNIVERSITY OF ILLINOIS AT URBANA-CHAMPAIGN
Labor Education Program & Project for Middle Class Renewal
815 W. Van Buren Street, Suite 110
Chicago, Illinois 60607 Phone: 312-996-2624
www.illinoislabored.org
UNIVERSITY OF WISCONSIN-EXTENSION
School for Workers “Education for Workplace Democracy”
610 Langdon St., Rm. 422
Madison, WI 53703 Phone: 608-262-2112
www.schoolforworkers.uwex.edu

The State of the Unions 2016 ii
EXECUTIVE SUMMARY Since 2006, unionization has declined in the United States, Wisconsin, and in the Milwaukee region. There are more than 136,000 fewer union members in Wisconsin today than there were in 2006, accounting for 28.5 percent of the 573,000-member drop in union workers across the nation over that time. Consequently, the total number of labor unions and similar labor organizations has dropped by more than 150 over the past decade, as a result of closure or merging of local unions. There are also 2,173 fewer individuals working for labor unions and similar organizations today than there were one decade ago. Declining union membership in Wisconsin has resulted from a number of factors, including the ongoing effects of Act 10 on the public sector and the continued loss of manufacturing jobs. From 2014 to 2015, union membership dropped 3.3 percentage points, from 11.6 percent to 8.3 percent. As of 2015, in Wisconsin:
Men are more likely to be unionized (10.4 percent) than women (6.1 percent);
Veterans are among the most unionized socioeconomic groups in Wisconsin (12.6 percent);
By educational attainment, the most unionized workers in Wisconsin hold Master’s degrees (17.0 percent) and associate’s degrees (9.6 percent);
Public sector unionization (26.1 percent) is five times as high in Wisconsin as private sector unionization (5.2 percent).
Union membership is influenced by a number of factors. Workers in the transportation and warehousing, public administration, construction, manufacturing, and educational and health services are more likely to be union members. Native-born and naturalized citizens are also statistically more likely to be union members than their non-citizen counterparts. On the other hand, workers employed in management, business, financial, sales, office support, service, professional, and agricultural occupations are all less likely to be unionized than their counterparts in production jobs. In Wisconsin, unionization still tends to increase individual incomes by lifting hourly wages. In Wisconsin, unions raise worker wages by an average of 11.0 percent. The state’s union wage effect is the 14
th-
highest in the nation. The union wage differential is greatest for the lowest 10 to 25 percent of workers, ranging from a 12.0 percent to a 12.7 percent increase in worker earnings. Unions therefore foster a middle-class lifestyle in Wisconsin. Unions play a vital role in Wisconsin’s economy and communities. The Wisconsin labor movement, however, will continue to face both short- and long-term challenges. Labor’s response to these challenges could define its influence and effectiveness in the decades to come.

The State of the Unions 2016 iii
TABLE OF CONTENTS Executive Summary ii
Introduction
1
Data and Limitations 2
Unionization Rates and Trends
2
Unionization by Demographics
4
Unionization by Education
7
Unionization by Sector, Industry, and Occupation
8
Predicting Union Membership in Wisconsin 11
Worker Wages Additional Information: Data on Labor Union Establishments
12
14 Conclusions
15
References Cover Photo Credits
16
17 Appendix
18
The State of the Unions 2016 1
INTRODUCTION Organized labor has been the country’s principal institution in fostering a middle-class society that protects the dignity of all work. Workers that have organized into unions have advocated for better pay and fringe benefits, worked to improve health and safety conditions in U.S. workplaces, and provided workers with a voice in the direction of the economy and in the creation of public policy. Over the long run, the labor movement has contributed substantially to U.S. families and communities. Nevertheless, the labor movement has endured a gradual decline in both membership and influence. Almost one-in-four U.S. workers (23.0 percent) were members of labor unions in 1980. Three and a half decades later, in 2015, only one-in-nine employed persons in the United States (11.1 percent) are unionized (Hirsch & Macpherson, 2016). As unionization rates have waned, income inequality has soared. Declining unionization and polarizing worker incomes are linked: The decline of organized labor accounts for between one-fifth and one-third of the growth in inequality (Western & Rosenfeld, 2011). The divergence between worker productivity and worker pay has also been largest in states where collective bargaining coverage has declined the most (Cooper & Mishel, 2015). Wisconsin has not been immune to these trends. From 2009 to 2012, earnings for the top 1 percent increased by 26.7 percent, while incomes grew by just 2.1 percent for the bottom 99 percent of workers in Wisconsin – meaning that the richest 1 percent captured over two-thirds of all the growth in income over that time (Sommeiller & Price, 2015). The decline in unionization has accelerated in Wisconsin over the past few years. In February 2011, Wisconsin Governor Scott Walker implemented his “Budget Repair Bill,” which revised the state’s public sector collective bargaining laws and triggered weeks of demonstrations and rallies by hundreds of thousands of Wisconsinites. Upon passage, the bill curtailed the rights of thousands of public sector workers, cutting pay and benefits for more than four hundred thousand public employees (Taylor, 2015). The continuing legislative initiatives against workers in Wisconsin from 2011 to present have been connected to a more general effort against organized labor (Taylor, 2015). Governor Walker pushed further on March 9, 2015, when 2015 Wisconsin Act 1 was signed. This “right-to-work” law is a statewide regulation that bars labor unions from including “union security” or “fair share” clauses in collective bargaining agreements with employers. These clauses ensure that all members of a bargaining union who receive the benefits of collective bargaining contribute their fair share of dues or membership fees. Without the clauses, workers can “free ride,” enjoying all the benefits of unionization– e.g., a higher wage, better benefits, and a voice at work– without contributing. Wisconsin’s “right-to-work” legislation has faced a legal challenge. In April, 2016, Dane County Circuit Court Judge William Foust ruled the law unconstitutional. While Foust’s ruling temporarily blocked the law, a Court of Appeals Judge reinstated it while the case proceeds. The result of this legal challenge could have lasting impacts on union membership in Wisconsin.
This report, conducted by researchers at the Midwest Economic Policy Institute, the University of Wisconsin-Extension School for Workers, and the Project for Middle Class Renewal at the University of Illinois at Urbana-Champaign analyzes the course of unionization in Wisconsin, in the Milwaukee metropolitan statistical area (MSA), and in the United States from 2006 to 2015. The report is modeled off of The State of the Unions 2016: A Profile of Unionization in Chicago, in Illinois, and in America (Manzo et al., 2016). That study is itself a replication of both The State of the Unions 2015: A Profile of Organized Labor in New York City, New York State, and the United States by the Joseph S. Murphy Institute for Worker Education and Labor Studies at the City University of New York Graduate Center (Milkman & Luce, 2015) and From ’15 to $15: The State of the Unions in California and its Key Cities in 2015 by the Institute for Research on Labor and Employment at the University of California, Los Angeles (Adler et al., 2015). This version for Wisconsin tracks unionization rates and investigates union membership across demographic, educational, sectoral, industry, and occupational classifications. The

The State of the Unions 2016 2 study subsequently evaluates the impact that labor union membership has on a worker’s hourly wage in Wisconsin and in the United States. Additionally, data on labor unions and similar labor organizations are included and analyzed. The report concludes by recapping key findings.
DATA AND LIMITATIONS Except in one section, this Research Report exclusively utilizes data from the Current Population Survey Outgoing Rotation Groups (CPS-ORG). The CPS-ORG is collected, analyzed, and released by the U.S. Department of Labor Bureau of Labor Statistics (BLS). CPS-ORG data reports individual-level information on 25,000 respondents nationwide each month. The records include data on wages, unionization, hours worked, sector, industry, and occupation, as well as other demographic, geographic, education, and work variables. The data was extracted from the user-friendly Center for Economic and Policy Research Uniform Data Extracts (CEPR, 2016). The 10-year dataset from 2006 to 2015 captures information on 3,180,524 individuals aged 16 to 85 in the United States. These observations include 1,914,358 persons with a job, of whom 199,670 reported that they were union members. Survey responses include information from 38,675 employed individuals in Wisconsin since 2006. In 2015, respondents with at least one job totaled 3,062 in Wisconsin, 1,031 in the Milwaukee MSA, and 184,915 nationwide. “Milwaukee MSA” workers are defined as those who live in the Wisconsin component of the Milwaukee-Racine-Waukesha Metropolitan Statistical Area. Analytic weights are provided by the Department of Labor to match the sample to the actual U.S. population 16 years of age or greater. These weights adjust the influence of an individual respondent’s answers on a particular outcome to compensate for demographic groups that are either underrepresented or overrepresented compared to the total population. The weights are applied throughout the analysis. There are limitations to the CPS-ORG dataset. First, the data reports a worker’s state of residence rather than state of employment, so the results may be biased by workers who live in one state but work in another (e.g., living in Wisconsin but working in Illinois) and vice-versa. CPS-ORG data is also based on household survey responses, so the potential exists for respondents to be untruthful. Certain individuals such as undocumented workers may also be underreported if they are more difficult to reach by survey officials. Finally, every surveyed worker does not reply to the union membership question. For example, in 2015, union membership data was only available for 2,750 of the 3,062 surveyed workers (89.8 percent) in Wisconsin. While this does not impact unionization rates, estimates are underreported for both total union workers and total nonunion employees. In addition, economic data from the County Business Patterns (CBP) series from the U.S. Census Bureau is also used (Census, 2016). The CBP provides annual statistics for businesses with paid employees that are used to study economic activity and market trends. The data are published between 18 months and 24 months after the reference year, so there is a longer time lag compared to the release of CPS-ORG information.
UNIONIZATION RATES AND TRENDS Since 2006, unionization has declined significantly in Wisconsin and the United States (Figure 1). The total union membership rate was 14.9 percent in Wisconsin and 12.0 percent nationwide in 2006. Ten years later, both rates have fallen, to 8.3 percent in Wisconsin and 11.1 percent in the United States. The decline in Wisconsin’s unionization rate has translated into a decrease of about 163,000 union members in Wisconsin since 2006, accounting for 28.5 percent of the total 573,000-member national decline in union workers over that time (Figure 2). The decline can be attributed to a number of factors, including the continued loss of jobs in highly-unionized sectors, the ongoing public sector union membership losses resulting from Act 10, and the implementation of “right-to-work.” However, the only unions affected during 2015 were private sector collective bargaining units whose contracts expired or
The State of the Unions 2016 3 opened for renegotiation between the March enactment of 2015 Wisconsin Act 1 and the end of the year. Thus the full impact of “right-to-work” has only begun to be felt.
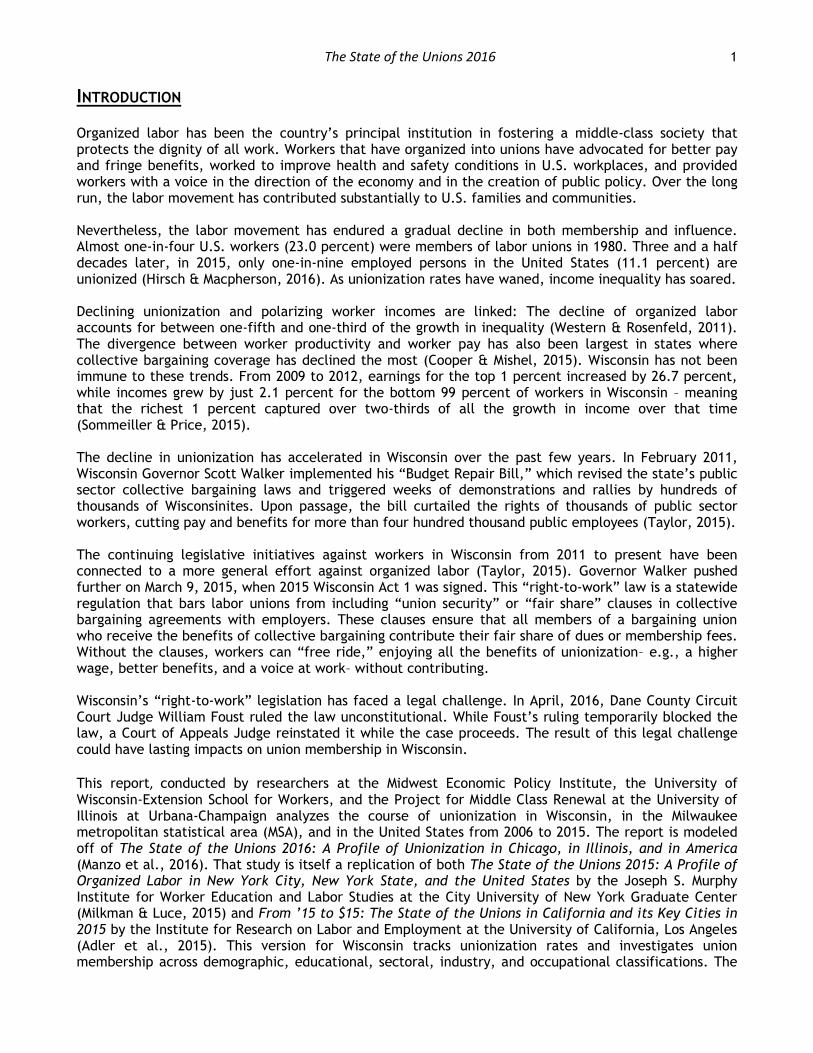
Despite the long-term downward trends, unionization rates and total membership were higher than the national average from 2006 to 2011 and then again from 2013 to 2014 (Figure 1). The 10-year combined Wisconsin unionization rate was 13.0 percent, 1.3 percentage points higher than the 11.7 percent national rate. On a year-by-year basis, Wisconsin’s union membership rate ranged from 0.6 to 2.9 percentage points higher than the national average for most of the time from 2006 to 2014. However, in 2015, the state’s unionization rate plummeted to 8.3 percent, which was 2.8 percentage points lower than the national average (Figure 2). One cautionary note must be mentioned, however. While the total sample included 3,062 respondents of persons living in Wisconsin who were employed (2,750 of whom offered their union membership status), cutting the data into gender, education, industry-level, and other subsets can result in relatively small sample sizes. Thus, the statistics in the following figures are simply estimates. Nevertheless, they are informative in that they shed light on the state’s union membership and provide, at the very least, general parameters on the composition of the union workforce.
FIGURE 1: UNIONIZATION RATES AND TOTAL UNION MEMBERSHIP BY REGION, 2006-2015
FIGURE 2: TOTAL UNION MEMBERS AND OVERALL UNIONIZATION RATES BY REGION, 2006-2015
Wisconsin USA
Year Members Rate Members Rate
2006 385,525 14.90% 15,359,108 11.98%
2007 375,724 14.28% 15,670,352 12.08%
2008 395,893 14.98% 16,097,535 12.44%
2009 384,698 15.22% 15,327,280 12.31%
2010 354,883 14.15% 14,715,061 11.86%
2011 338,656 13.34% 14,754,673 11.78%
2012 292,802 11.23% 14,349,358 11.25%
2013 316,596 12.31% 14,515,755 11.24%
2014 305,611 11.64% 14,569,936 11.08%
2015 222,118 8.28% 14,786,281 11.05%
Totals 3,372,506 13.03% 150,145,339 11.70%
0%
5%
10%
15%
20%
20
06
20
07
20
08
20
09
20
10
20
11
20
12
20
13
20
14
20
15
Unionization Rates by Region
USA Wisconsin
100,000
200,000
300,000
400,000
500,0002
00
6
20
07
20
08
20
09
20
10
20
11
20
12
20
13
20
14
20
15
Union Membership by Region
Wisconsin Trend

The State of the Unions 2016 4
UNIONIZATION BY DEMOGRAPHICS Falling rates of unionization have reflected steep declines in union membership among both men and women (Figure 3). An estimated 16.2 percent of employed men were unionized in 2006, but the 2015 male unionization rate in Wisconsin fell to 10.4 percent. Since 2006, male union density has dropped by 5.8 percentage points in Wisconsin and by 1.5 percentage points in the United States. The female union membership rate has also fallen considerably (Figure 3). As of 2015, the female unionization rate is just 6.1 percent in Wisconsin and 10.6 percent nationwide. Since 2006, female union membership has decreased by 7.5 percentage points in Wisconsin and by 0.3 percentage points in the United States. It is reasonable to surmise that a significant amount of the decline in union density among women may be a result of the impact of Act 10 on public sector occupations with traditionally-high concentrations of female employees, such as teaching. One of the reasons that Wisconsin’s overall union membership is below the national rate is because female union density is relatively low in the Milwaukee MSA (Figure 3). Just 5.1 percent of female workers in the Milwaukee region are unionized – 1.0 percentage points lower than women in Wisconsin overall.
FIGURE 3: GRAPHS OF UNIONIZATION RATES BY GENDER, 2006-2015
0%
5%
10%
15%
20%
25%
20
06
20
07
20
08
20
09
20
10
20
11
20
12
20
13
20
14
20
15
Male
Wisconsin USA
0%
5%
10%
15%
20%
25%
20
06
20
07
20
08
20
09
20
10
20
11
20
12
20
13
20
14
20
15
Female
Wisconsin USA
0%
5%
10%
15%
20%
20
06
20
07
20
08
20
09
20
10
20
11
20
12
20
13
20
14
20
15
Unionization Rates by Gender
Male Female Trends
10.4%
6.1%
10.3%
5.1%
11.5% 10.6%
0%
5%
10%
15%
20%
Male Female
2015 Unionization Rates by Gender
Wisconsin Milwaukee MSA USA

The State of the Unions 2016 5 Non-white workers are more likely to be unionized than white, non-Latino workers in Wisconsin (Figure 4). In Wisconsin, the unionization rate for white, non-Latino workers is 8.7 percent while the unionization rate for all non-white minorities was 11.3 percent. White, non-Latino workers are, however, slightly more likely to be union members in Milwaukee MSA (8.2 percent) than non-white employees (6.1 percent). For both the Milwaukee MSA and Wisconsin more broadly, racial or ethnic unionization rates are below the comparable national average.
FIGURE 4: UNIONIZATION RATES BY RACIAL OR ETHNIC IDENTIFICATION BY REGION, 2015
Over time, union membership has fallen for white, non-Latino workers (Figure 5). Unionization of white workers has gradually fallen by 6.4 percentage points from 2006 to 2015, with the largest drop of 3.0 percentage points occurring from 2014 to 2015. Though union membership has also fallen overall for non-white workers over the decade, union membership has fluctuated more for this racial identity group. This is mainly due to noise from small sample sizes in the dataset.
FIGURE 5: GRAPHS OF UNIONIZATION RATES BY RACIAL OR ETHNIC IDENTIFICATION, 2006-2015
The union membership rate of all workers aged 25 to 64 is between 9 and 11 percent in Wisconsin (Figure 6). The unionization rate of workers aged 25 to 34 in Wisconsin is on par with the equivalent national average. Workers aged 25 to 34 are unionized at 9.7 percent in Wisconsin, 8.8 percent in the
8.7%
11.3%
8.2%
6.1%
11.2% 10.8%
0%
10%
20%
White non-Latino Non-White
2015 Unionization Rates by Race/Ethnicity
Wisconsin Milwaukee MSA USA
0%
5%
10%
15%
20%
25%
20
06
20
07
20
08
20
09
20
10
20
11
20
12
20
13
20
14
20
15
White, non-Latino
Wisconsin USA
0%
5%
10%
15%
20%
25%
20
06
20
07
20
08
20
09
20
10
20
11
20
12
20
13
20
14
20
15
Non-White
Wisconsin USA

The State of the Unions 2016 6 Milwaukee area, and 9.6 percent in the United States. Nevertheless, for young workers aged 16-24, unionization rates are less than 5 percent for Wisconsin, the Milwaukee MSA, and the nation. Workers aged 45 to 54 in both Wisconsin and the Milwaukee region are less-unionized than the comparable U.S. average. Nationally, 13.6 percent of workers aged 45 to 54 are unionized. In Wisconsin, this age group is 9.7 percent unionized; in the Milwaukee MSA, just 6.2 percent unionized. Overall, the average age of union workers is about 44 years old and the average age of nonunion workers is about 41 years old, regardless of region studied (Figure 7).
FIGURE 6: UNIONIZATION RATES BY AGE GROUP BY REGION, 2015
FIGURE 7: AVERAGE AGE OF UNION AND NONUNION WORKERS BY REGION, 2015
2015 Age (Years)
Variable Nonunion Union
Wisconsin 40.85 44.12
Milwaukee MSA 40.96 42.18
USA 40.94 44.51
FIGURE 8: UNIONIZATION RATES OF SELECT DEMOGRAPHIC VARIABLES BY REGION, 2015
1.9%
9.7% 9.1%
9.7%
11.0%
2.7%
4.2%
8.8%
10.3%
6.2%
10.6%
2.1%
4.4%
9.6%
12.3%
13.6% 14.3%
9.6%
0%
5%
10%
15%
20%
Age: 16-24 Age: 25-34 Age: 35-44 Age: 45-54 Age: 55-64 Age: 65+
2015 Unionization Rates by Age
Wisconsin Milwaukee MSA USA
3.4%
8.5%
12.6%
10.4%
1.1%
7.9% 7.4% 9.0% 9.0%
11.6%
15.1%
12.6%
0%
5%
10%
15%
20%
Foreign-Born Native-Born andNaturalized Citzens
Veteran Married
2015 Unionization Rates by Demographic Characteristic
Wisconsin Milwaukee MSA USA

The State of the Unions 2016 7 Union membership varies across other demographic classifications as well (Figure 8). Among the most unionized socioeconomic groups are military veterans. About one-in-eight employed veterans are unionized in Wisconsin (12.6 percent). For the United States, approximately 15.1 percent of employed veterans are members of unions. The unionization rate for married workers, foreign-born workers, native-born workers, and veteran workers are lower in Wisconsin than the national average. Figure 9 reveals that unionization is relatively weak in the suburbs of Milwaukee. In Milwaukee, workers who reside in the central city have a unionization rate of 7.7 percent compared to just 4.1 percent for those who live in the suburbs. Nevertheless, in Wisconsin overall, urban (7.4 percent), suburban (7.3 percent), and rural areas (7.2 percent) are all unionized at a similar rate. Across urban status, the comparable figures are higher for the United States as a whole.
FIGURE 9: UNIONIZATION RATES BY URBAN STATUS BY REGION, 2015
UNIONIZATION BY EDUCATION Workers with master’s degrees are the most unionized educational group in the United States (Figure 10). At 17.0 percent, unionization among master’s degree holders in Wisconsin largely towers over the rates of all other educational attainment groups studied. In Wisconsin and the United States, the second-most unionized employees by educational attainment are those with an associate’s degree. Those without a high school degree and those with a bachelor’s degree comprise the two least unionized educational groups in all regions studied. In the Milwaukee region, 11.5 percent of workers with some college experience but no degree are unionized, the second most unionized group for the area.
FIGURE 10: UNIONIZATION RATES BY EDUCATIONAL ATTAINMENT OR STATUS BY REGION, 2015
7.4% 7.3% 7.2% 7.7%
4.1%
0.0%
11.3% 11.5%
9.3%
0%
5%
10%
15%
City Center Suburb Rural
2015 Unionization Rates by Urban Status
Wisconsin Milwaukee MSA USA
N/A
3.7%
8.4% 8.5% 9.6%
6.3%
17.0%
3.5%
1.4%
4.0%
9.1%
11.5%
8.2%
3.6%
12.5%
0.5%
4.4%
5.8%
10.3% 10.2%
12.2% 10.9%
19.2%
10.1%
2.3%
0%
5%
10%
15%
20%
Less than HighSchool
High School Some College,No Degree
Associates Bachelors Masters Professional orDoctorate
In School, Full-time
2015 Unionization Rates by Education
Wisconsin Milwaukee MSA USA
The State of the Unions 2016 8
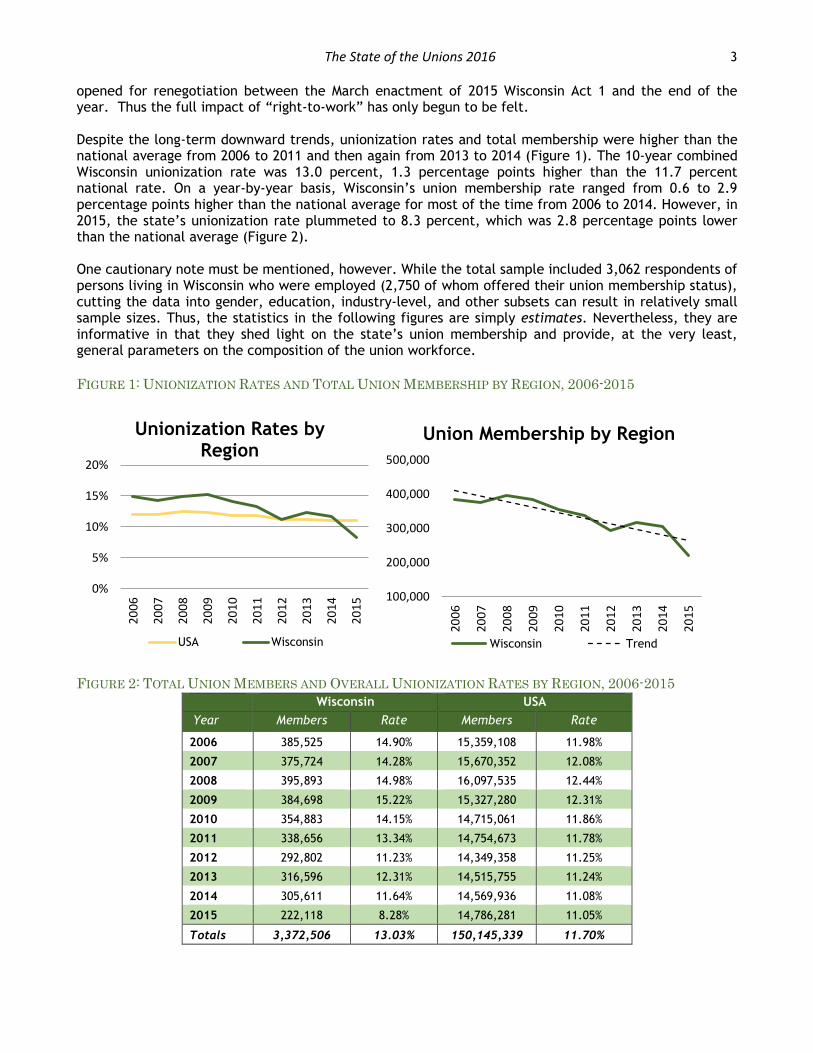
UNIONIZATION BY SECTOR, INDUSTRY, AND OCCUPATION Unionization rates are significantly higher for public sector workers (Figure 11). About one-in-four public sector workers are unionized in both Wisconsin (26.1 percent) and the Milwaukee region (25.8 percent), as are more than one-third nationwide (35.2 percent). In comparison, fewer than one-in-fifteen private sector workers is now a union member in Wisconsin (5.2 percent), the Milwaukee MSA (5.0 percent), and the United States (6.7 percent).
FIGURE 11: UNIONIZATION RATES BY SECTOR OR LEVEL OF GOVERNMENT BY REGION, 2015
Compared to the national average, Wisconsin had higher public sector unionization from 2006 to 2013 (Figure 12). Public sector unionization in Wisconsin peaked at 53.5 percent in 2009, fluctuated from 2009 to 2011, but has declined rapidly since 2011. In 2015, public sector unionization was just 26.1 percent, 9.1 percent lower than the comparable U.S. rate. Private sector unionization, which had been 0.1 to 2.0 percentage-points higher in Wisconsin than the United States from 2006 to 2014, has dropped below the United States’ rate by 1.4 percentage points as of 2015.
FIGURE 12: UNIONIZATION RATES BY SECTOR BY REGION, 2006 TO 2015
5.2%
26.1%
5.0%
25.8%
6.7%
35.2%
0%
10%
20%
30%
40%
50%
Private Sector Public Sector
2015 Unionization Rates by Sector
Wisconsin Milwaukee MSA USA
0%
10%
20%
30%
40%
50%
60%
20
06
20
07
20
08
20
09
20
10
20
11
20
12
20
13
20
14
20
15
Public vs. Private
WisconsinPublic
WisconsinPrivate
USA Public
USA Private
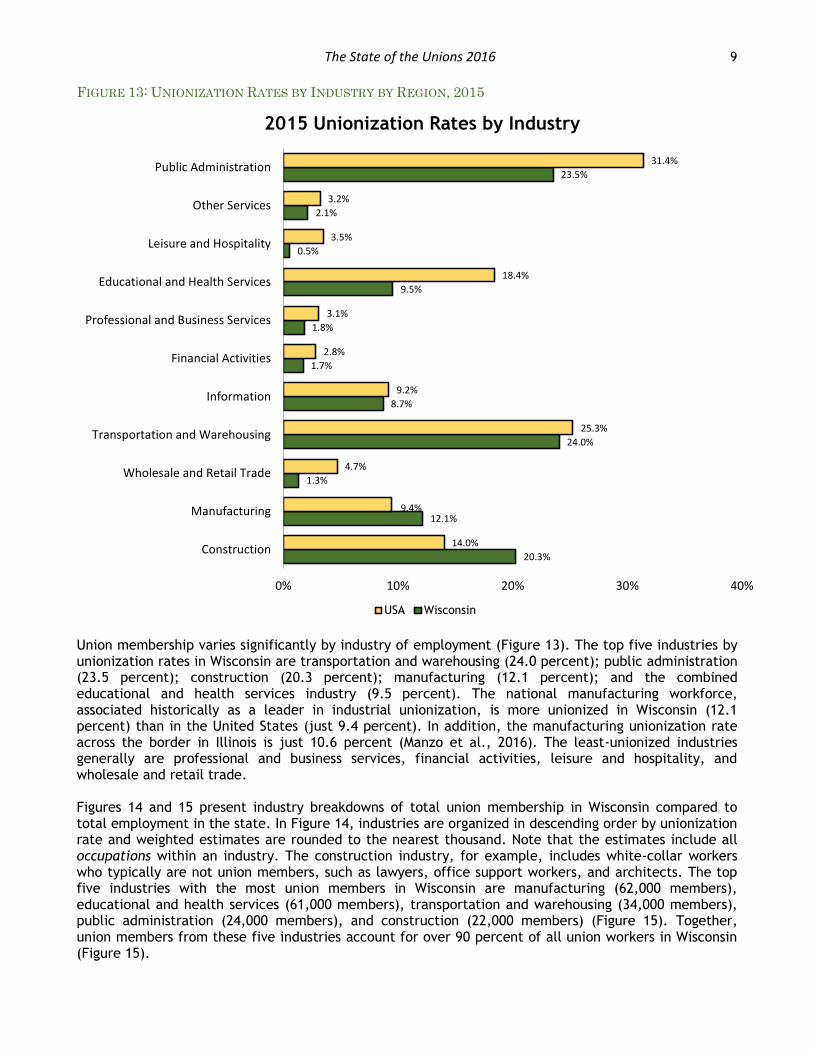
The State of the Unions 2016 9 FIGURE 13: UNIONIZATION RATES BY INDUSTRY BY REGION, 2015
Union membership varies significantly by industry of employment (Figure 13). The top five industries by unionization rates in Wisconsin are transportation and warehousing (24.0 percent); public administration (23.5 percent); construction (20.3 percent); manufacturing (12.1 percent); and the combined educational and health services industry (9.5 percent). The national manufacturing workforce, associated historically as a leader in industrial unionization, is more unionized in Wisconsin (12.1 percent) than in the United States (just 9.4 percent). In addition, the manufacturing unionization rate across the border in Illinois is just 10.6 percent (Manzo et al., 2016). The least-unionized industries generally are professional and business services, financial activities, leisure and hospitality, and wholesale and retail trade. Figures 14 and 15 present industry breakdowns of total union membership in Wisconsin compared to total employment in the state. In Figure 14, industries are organized in descending order by unionization rate and weighted estimates are rounded to the nearest thousand. Note that the estimates include all occupations within an industry. The construction industry, for example, includes white-collar workers who typically are not union members, such as lawyers, office support workers, and architects. The top five industries with the most union members in Wisconsin are manufacturing (62,000 members), educational and health services (61,000 members), transportation and warehousing (34,000 members), public administration (24,000 members), and construction (22,000 members) (Figure 15). Together, union members from these five industries account for over 90 percent of all union workers in Wisconsin (Figure 15).
20.3%
12.1%
1.3%
24.0%
8.7%
1.7%
1.8%
9.5%
0.5%
2.1%
23.5%
14.0%
9.4%
4.7%
25.3%
9.2%
2.8%
3.1%
18.4%
3.5%
3.2%
31.4%
0% 10% 20% 30% 40%
Construction
Manufacturing
Wholesale and Retail Trade
Transportation and Warehousing
Information
Financial Activities
Professional and Business Services
Educational and Health Services
Leisure and Hospitality
Other Services
Public Administration
2015 Unionization Rates by Industry
USA Wisconsin

The State of the Unions 2016 10 FIGURE 14: WISCONSIN INDUSTRY UNIONIZATION RATES, EMPLOYMENT, AND UNION MEMBERS, 2015
Wisconsin
(2015)
Unionization
Rate
Total
Employment
Total Union Members
Total
Sample
Transportation & Warehousing 24.1% 141,000 34,000 142
Public Administration 23.5% 101,000 24,000 105
Construction 20.3% 107,000 22,000 110
Manufacturing 12.1% 509,000 62,000 526
Educational & Health Services 9.6% 640,000 61,000 670
Information 8.7% 43,000 4,000 44
Other Services 2.1% 109,000 2,000 109
Professional & Business Services 1.8% 217,000 4,000 228
Financial Activities 1.7% 145,000 2,000 155
Wholesale & Retail Trade 1.3% 380,000 5,000 386
Leisure & Hospitality 0.5% 238,000 1,000 227
FIGURE 15: COMPOSITION OF WISCONSIN UNION WORKFORCE BY INDUSTRY, 2015
Lastly, Figure 16 depicts unionization rates by occupation. In Wisconsin, the most unionized occupation groups are maintenance and installation occupations such as mechanics (22.5 percent); construction and extraction occupations such as carpenters and operating engineers (21.0 percent); and production occupations such as machinists (16.9 percent). In each of these three occupations, the unionization rate is higher in Wisconsin than the national average. Union membership in construction and extraction occupations, as an example, is 3.8 percentage points higher in Wisconsin than the comparable national average. However, every other major occupational grouping is less unionized in Wisconsin than the rest of the nation.
19.2%
11.5%
1.3%
22.7% 8.2%
1.6%
1.7%
9.0%
0.5%
2.0%
22.3%
Union Members by Industry
Construction
Manufacturing
Wholesale and Retail Trade
Transportation andWarehousingInformation
Financial Activities
Professional and BusinessServicesEducational and HealthServicesLeisure and Hospitality
Other Services
Public Administration

The State of the Unions 2016 11 FIGURE 16: UNIONIZATION RATES BY OCCUPATION BY REGION, 2015
Occupation (2015) Wisconsin USA
Management, Business, & Financial 2.0% 4.4%
Professional & Related 9.9% 16.8%
Service 6.7% 10.6%
Sales & Related 0.4% 3.2%
Office & Administrative Support 4.6% 9.3%
Construction & Extraction 21.0% 17.2%
Installation, Maintenance, & Repair 22.5% 14.7%
Production 16.9% 12.6%
Transportation & Material Moving 11.9% 15.7%
PREDICTING UNION MEMBERSHIP IN WISCONSIN A Probit regression model using average marginal effects was developed to predict the likelihood that any given worker is a union member in Wisconsin, using data from 2013 through 2015. The model, which is detailed in the Table A of the Appendix, reports how statistically significant variables increase or decrease one’s probability of being a union member. The analysis includes data on over 8,000 Wisconsin workers, and weights are applied to match the sample to the actual Wisconsin population. Given that the state averaged about 2.9 million workers over this time, the sample size would yield a normal ±1.1 percent margin of error in a standard survey report.
FIGURE 17: PROBABILITY OF BEING A UNION MEMBER IN WISCONSIN, LARGEST FACTORS, 2013-2015
Probability of Union Membership Wisconsin Mean
Predictor Percentage Point Change
Sector: Local government +17.50%
Sector: Federal government +16.73%
Sector: State government +14.42%
Demographic: Native-born and naturalized citizens +7.60%
Industry: Mining +6.74%
Industry: Wholesale & retail trade -5.56%
Industry: Agriculture, forestry, fishing, & hunting -6.05%
Industry: Information -6.79%
Occupation: Professional and related -7.00%
Occupation: Office & administrative support -8.72%
Industry: Other services -9.29%
Occupation: Sales & related -10.09%
Occupation: Farming, fishing, & forestry -10.88%
Industry: Professional & related services -11.80%
Education: Professional or doctorate degree -13.56%
Occupation: Management, business, & financial -17.34%
Industry: Leisure & hospitality -17.40%
Constant 10.27%
Observations 8,261
Source: CPS-ORG, Center for Economic and Policy Research Uniform Data Extracts, 2013-2015. Only statistically significant variables with a coefficient over ±5.0 percent are displayed in the figure. Occupation dummies are relative to “production” occupations and industry dummies are relative to “manufacturing.” For more, see the Appendix.

The State of the Unions 2016 12 Many factors increase the likelihood that an employed person is a union member in Wisconsin (Figure 17). Relative to workers in the private sector, employment in local government, the largest contributor to an individual’s chances of being a union member, raises the probability by 17.5 percentage points on average. Federal and state government employment respectively increase the union probability by 16.7 and 14.4 percentage points. Generally, being a native-born or naturalized U.S. citizen also increases the probability that a given Wisconsin worker is a union member by 7.6 percentage points compared to being a non-citizen. Many occupation and industry factors contribute negatively to the probability that a worker is in a union. Figure 17 pits occupations against “production” jobs and industries against the “manufacturing” sector. Compared to those in production occupations, workers in the following jobs are all between 7 and 18 percentage-points less likely to be union members: professional and related; office and administrative support; sales and related; farming, fishing, and forestry; and management, business, and financial. Similarly, compared to comparable workers in manufacturing, those in wholesale and retail trade, agriculture, information, other services, professional services, and leisure and hospitality are between 5 and 18 percentage-points less likely to be union members in Wisconsin (Figure 17).
WORKER WAGES Unionized workers typically earn more than their nonunion counterparts (Figure 18). Figure 18 graphically illustrates the difference between the average union wage and the average nonunion wage in Wisconsin and the United States by both percentage benefit and actual per-hour dollar benefit. The results do not control for other factors which may increase a worker’s wages (e.g., education, occupation, industry, age, etc.). The raw averages show that, regardless of geography and time, union membership has been positively correlated with increased worker wages. Nationwide, union membership continues to raise worker wages by about $4.00 per hour, or by about 17 percent. The gap between union and nonunion wages appears to be larger in Wisconsin as of 2015: The wage difference is $4.23 per hour in Wisconsin (Figure 19). Unions raise individual incomes by lifting wages per hour.
FIGURE 18: UNION WAGE DIFFERENCES BY REGION, PERCENTAGE AND DOLLAR VALUES, 2006 TO 2015
The data presented in Figure 19 may overstate or understate the union wage effect because union members may be more or less likely to have characteristics associated with higher wages such as age, education, job experience, and geographic location. Regression analyses (OLS and quantile regressions) are utilized to control for these and similar factors in order to isolate the effect of unionization on wages and report them in Figure 20. The national average further controls for an individual respondent’s
0%
5%
10%
15%
20%
25%
30%
20
06
20
07
20
08
20
09
20
10
20
11
20
12
20
13
20
14
20
15
Union Wage Premiums, %
Wisconsin USA
$0.00
$1.00
$2.00
$3.00
$4.00
$5.00
$6.00
20
06
20
07
20
08
20
09
20
10
20
11
20
12
20
13
20
14
20
15
Union Wage Premiums, $
Wisconsin USA

The State of the Unions 2016 13 state of residence. Data are for employed persons aged 16 and older from 2013 through 2015 and are based on the natural logarithm of hourly wages to “normalize the data” and analyze the results in percentage terms. For more on the union wage premium regressions, see Table B in the Appendix.
FIGURE 19: WAGES OF UNION AND NONUNION WORKERS BY REGION, 2015 Wisconsin USA
Variable Nonunion Union Nonunion Union
Wage $21.52 $25.75 $23.05 $27.03
Union Difference, % +19.65% +17.29%
Union Difference, $ +$4.23 +$3.98
After controlling for education, demographics, and employment factors, the union wage premium is lower but still generally aligns with the differences reported in Figures 18 and 19 (Figure 20). On average, unions are found to increase a worker’s per-hour wage by 11.1 percent in the United States. In Wisconsin, the union wage premium is an estimated 11.0 percent on average, holding all else constant (including occupation and industry). Both results are statistically significant, even at the 1-percent level.
FIGURE 20: REGRESSIONS OF UNION WAGE PREMIUMS FOR UNITED STATES AND WISCONSIN, 2013-2015 Union Wage Premium: Ordinary Least Squares (OLS) and Quantile Regressions, 2013-2015
United States Wisconsin
Mean Mean Percentile: 10th Percentile: 25th Median Percentile: 75th Percentile: 90th
11.06%*** 10.98%*** 11.99%*** 12.72%*** 10.70%*** 8.70%*** 7.96%***
R2=0.456 R2=0.485 R2=0.249 R2=0.315 R2=0.338 R2=0.330 R2=0.308
Three asterisks (***) indicate significance at the 1-percent level. Two asterisks (**) indicates significance at the 5-percent level. Source: CPS-ORG, Center for Economic and Policy Research Uniform Data Extracts, 2013-2015. Statistics are adjusted by the outgoing rotation group earnings weight to match the total population 16 years of age or older. For more, see the Appendix.
Quantile regression permits evaluation of the union wage premium across the wage distribution. While union membership is statistically associated with an 11.0 percent increase in the average Wisconsin worker’s wage, the benefit is actually higher for those in the lower end of the state’s hourly income distribution (Figure 20). In fact, over the past three years, the union wage effects produced raises of between 12.0 percent and 12.7 percent for the bottom 10 to 25 percent of workers. The union wage difference was much smaller for the top 10 percent of earners (8.0 percent) in Wisconsin. Thus, the data strongly indicate that unionization especially benefits low-income and middle-class workers, helping to foster a strong middle class and reducing income inequality. How does the average Wisconsin union wage premium of 11.0 percent compare to the union effect in other states? Similar 2013-2015 ordinary least squares regression models are run to assess each of the 49 other states plus the District of Columbia against Wisconsin. The results, reported in Figure 21, lead to the conclusion that the Wisconsin union wage premium is the 14
th-highest in the nation. Interestingly,
the union wage premium is actually highest for Louisiana (16.3 percent), Indiana (15.1 percent), and Missouri (15.0 percent). A total of 12 states have union wage premiums that are found to be higher than the national average of 11.1 percent. Importantly, a positive union wage premium exists in every state. The decline in union membership from 2014 to 2015 has coincided with a rise in wage inequality in Wisconsin (Figure 22). Average wages increased by 1.4 percent in Wisconsin from 2014 to 2015, significantly lower than wage growth in the rest of the United States (3.4 percent). The wage of the median worker fell by -0.8 percent from $17.95 to $17.81 in Wisconsin. Meanwhile, across the rest of the United States, median wages increased by 2.6 percent. While middle-class workers experienced real income losses, Top 1 Percent in Wisconsin saw their hourly earnings rise by 5.4 percent from 2014 to 2015. Accordingly, the ratio between the hourly earnings of the Top 1 Percent and those of the median

The State of the Unions 2016 14 worker grew by 6.3 percent in Wisconsin over the year. This rise in income inequality exceeded the comparable increase in the rest of the country (4.5 percent).
FIGURE 21: UNION WAGE PREMIUMS BY STATE, OLS REGRESSIONS, 2013-2015
Rank State Union Premium
United States 11.06%
1 Louisiana 16.30%
2 Indiana 15.06%
3 Missouri 14.95%
4 Kansas 14.72%
5 Nevada 13.95%
6 California 13.88%
7 Arkansas 13.62%
8 Idaho 11.94%
9 Tennessee 11.68%
10 New Jersey 11.60%
11 Minnesota 11.14%
12 North Dakota 11.13%
13 Pennsylvania 11.02%
14 Wisconsin 10.98%
15 Montana 10.75%
16 South Dakota 10.73%
17 Illinois 10.52%
18 Hawaii 10.40%
19 Alabama 10.19%
20 Oklahoma 10.14%
21 Wyoming 10.13%
22 Ohio 9.75%
23 South Carolina 9.75%
24 Massachusetts 9.55%
25 New York 9.45%
Rank State Union Premium
26 Arizona 9.38%
27 Michigan 9.31%
28 Maryland 9.21%
29 Oregon 9.01%
30 Rhode Island 8.65%
31 West Virginia 8.35%
32 Nebraska 8.23%
33 Maine 8.20%
34 Kentucky 8.17%
35 Georgia 7.91%
36 Washington 7.64%
37 Texas 7.54%
38 Delaware 7.49%
39 Connecticut 7.34%
40 District of Columbia 7.11%
41 New Hampshire 6.46%
42 Alaska 6.31%
43 North Carolina 5.48%
44 Mississippi 5.2%
45 Vermont 5.15%
46 Florida 4.76%
47 Iowa 4.75%
48 Colorado 3.83%
49 Utah 1.75%
50 New Mexico 1.53%
51 Virginia 0.82%
All estimates are significant at least at the 5-percent level. Source: CPS-ORG, Center for Economic and Policy Research Uniform Data Extracts, 2013-2015. Statistics are adjusted by the outgoing rotation group earnings weight to match the total population 16 years of age or older. For more, see the Appendix.
FIGURE 22: REAL WAGES AND WAGE INEQUALITY, WISCONSIN VS. THE REST OF THE USA, 2014-2015
Real Hourly Wage Variable Wisconsin Rest of the USA
2014 2015 Growth 2014 2015 Growth
Average Wage $21.57 $21.87 1.4% $22.75 $23.52 3.4%
Median Wage $17.95 $17.81 -0.8% $17.54 $18.00 2.6%
Top 1 Percent Hourly Earnings $79.92 $84.22 5.4% $94.48 $101.40 7.3%
Top 1 Percent to Median Inequality Ratio 4.45 4.57 6.3% 5.39 5.63 4.5%
ADDITIONAL INFORMATION: DATA ON LABOR UNION ESTABLISHMENTS As a result of the gradual, long-term decline in union membership, the total number of “labor unions and similar labor organizations” has declined over the past decade. Figure 23 presents County Business

The State of the Unions 2016 15 Patterns data on the number of establishments and paid employees in these organizations. An establishment is a single physical location where business is conducted or where services or operations are performed. Establishments include all the union halls, employees’ associations, worker centers, and similar offices of local or national labor unions, collective-bargaining units, and similar organizations.
FIGURE 23: UNIONS AND SIMILAR ORGANIZATIONS, ESTABLISHMENTS AND EMPLOYMENT, 2005-2014
Wisconsin NAICS Code: 81393 – Labor Unions
and Similar Labor Organizations
Year Establishments Paid Employees
2005 683 7,333
2006 666 7,412
2007 688 6,775
2008 669 6,989
2009 657 6,927
2010 642 6,707
2011 627 6,417
2012 598 5,927
2013 551 5,467
2014 532 5,160
Totals -151 -2,173
The total number of establishments in 2014, the latest year for which data are available, was 532. This is down considerably from the 683 establishments of labor unions and similar labor organizations in Wisconsin in 2005. Over the past ten years, there has been a 151 establishment decline (-22.1 percent) in labor unions and similar labor organizations in Wisconsin – despite a rise in overall employment. In the private sector, reductions in the number of labor organizations are likely due to continued plant closures and deindustrialization, as well as local union mergers; in the public sector, the decline is a result of the closure or merger or local unions resulting from the continued effects of Act 10. Consequently, the number of paid employees working directly for labor unions and similar labor organizations has fallen from 7,333 workers in 2005 to 5,160 workers in 2014 (-29.6 percent). There are thus 2,173 fewer individuals working for labor unions and similar organizations today than there were a decade ago. As unionization has decreased, revenue from membership dues has relatively declined, resulting in these nonprofit organizations closing down and laying off their workers (Figure 23). The largest, staff-intensive unions in Wisconsin have historically been those in the public sector, which have laid off large numbers of staff in several phases since the passage of Act 10.
CONCLUSIONS Since 2006, unionization has declined in the United States, Wisconsin, and in the Milwaukee region. There are more than 136,000 fewer union members in Wisconsin today than there were in 2006, accounting for 28.5 percent of the 573,000-member drop in union workers across the nation over that time. Consequently, total number of labor unions and similar labor organizations has dropped over the past decade. More than 150 labor unions and similar organizations have closed down in Wisconsin over ten years. There are also 2,173 fewer individuals working for labor unions and similar organizations today than there were one decade ago. From 2014 to 2015, union membership in Wisconsin fell from 11.6 percent to 8.3 percent, a 3.3 percentage-point drop. Declining union membership in Wisconsin has resulted from a number of factors, including the ongoing effects of Act 10 on the public sector, the continued loss of manufacturing jobs, and the passage of “right-to-work” in March 2015. Although Wisconsin’s law has faced legal challenges,
The State of the Unions 2016 16 no state “right-to-work” law has ever been permanently overturned by judicial proceedings. So far, the only unions affected were private sector collective bargaining units whose contracts expired or were opened for renegotiation between the March 10 and the end of the year. Thus the full impact of “right-to-work” has only begun to be felt. As of 2015, the overall union membership rate in Wisconsin is 8.3 percent. Men are much more likely to be unionized (10.4 percent) than women (6.1 percent) in the state. Additionally, veterans are among the most unionized socioeconomic groups in Wisconsin, with a unionization rate (12.6 percent). By educational attainment, the most unionized workers in Wisconsin hold Master’s degrees (17.0 percent) and associate’s degrees (9.6 percent). Finally, public sector unionization (26.1 percent remains significantly higher in Wisconsin than private sector unionization (5.2 percent). Union membership is characterized by a number of factors. Employment in the public sector and in manufacturing all raise the likelihood that a given worker is a union member. Native-born and naturalized citizens are also statistically more likely to be union members than their non-citizen counterparts. On the other hand, workers employed in management, business, financial, sales, office support, service, professional, and agricultural occupations are all less likely to be unionized than their counterparts in production jobs. Despite the decline in union density in Wisconsin wages of unionized workers remain 11.0 percent higher on average than non-union workers. The state’s union wage effect is the 14
nd-highest in the nation. The
union wage differential is greatest for the lowest 10 to 25 percent of workers, ranging from a 12.0 percent to a 12.7 percent increase in worker earnings. Unions therefore promote a middle-class in Wisconsin.
REFERENCES Adler, Patrick, Chris Tilly, and Trevor Thomas. (2015). From ’15 to $15: The State of the Unions in California
and its Key Cities in 2015. Institute for Research on Labor and Employment, University of California- Los Angeles, available at http://www.irle.ucla.edu/publications/documents/SOU2015.pdf.
Barry T. Hirsch and David A. Macpherson. (2016). "Union Membership, Coverage, Density, and Employment
Among All Wage and Salary Workers, 1973-2015.” Unionstats.com. Georgia State University and Trinity University, Database from the Current Population Survey, available at www.unionstats.com.
Census. (2016). Business Patterns. 2005-2014. American FactFinder, available at factfinder.census.gov. Center for Economic and Policy Research (CEPR). (2016). 2006-2015 CPS ORG Uniform Extracts, Version 1.7.
Washington, DC. Cooper, David and Lawrence Mishel. (2015). The Erosion of Collective Bargaining Has Widened the Gap
Between Productivity and Pay. Economic Policy Institute, available at http://www.epi.org/publication/collective-bargainings-erosion-expanded-the-productivity-pay-gap/.
Eren, Ozkan and I. Serkan Ozbeklik. (2014). “Union Threat and Nonunion Wages: Evidence from the Case
Study of Oklahoma.” Louisiana State University Working Paper, Submitted to Economic Inquiry, available at http://faculty.unlv.edu/oeren/eren_ozbeklik_paper3.pdf.
Manzo IV, Frank, Robert Bruno, and Virginia Parks. (2015). The State of the Unions 2015: A Profile of
Unionization in Chicago, in Illinois, and in America. Illinois Economic Policy Institute; Labor Education Program, University of Illinois at Urbana-Champaign; School of Social Service Administration, The
The State of the Unions 2016 17
University of Chicago, available at http://illinoisepi.org/countrysidenonprofit/wp-content/uploads/2013/10/State.of_.the_.Unions.2015_ILEPI.LEP_.SSA_.pdf.
Milkman, Ruth and Stephanie Luce. (2015). The State of the Unions 2015: A Profile of Organized Labor in
New York City, New York State, and the United States. Joseph S. Murphy Institute for Worker Education and Labor Studies and the Center for Urban Research, City University of New York Graduate Center, available at https://www.gc.cuny.edu/CUNY_GC/media/CUNY-Graduate-Center/PDF/Communications/1509_Union_Density2015_RGB.pdf.
NH Labor News. (2016). “Wisconsin Loses 10,000 Jobs After Passing Right to Work.” Available at
http://nhlabornews.com/2016/01/50635/. Schmitt, John. (2008). The Union Wage Advantage for Low-Wage Workers. Center for Economic and Policy
Research, available at http://www.cepr.net/documents/publications/quantile_2008_ 05.pdf. Sommeiller, Estelle and Mark Price. (2015). The Increasingly Unequal States of America: Income Inequality by
State, 1917 to 2012. Economic Analysis and Research Network, available at http://www.epi.org/publication/income-inequality-by-state-1917-to-2012/.
Taylor, Don. (2015). “Can Renewal Emerge from Destruction? Crisis and Opportunity in Wisconsin.” Labor
Studies Journal. 50(4): 419-422. Western, Bruce and Jake Rosenfeld. (2011). “Unions, Norms, and the Rise in U.S. Wage Inequality.” American
Sociological Review, 76(4). 513-537, available at http://www.asanet.org/images/journals/docs/pdf/asr/WesternandRosenfeld.pdf.
COVER PHOTO CREDITS Photo “‘Rally” is © Creative Commons Flickr user Judy Burnick (top left), “Wisconsin (State Welcome Sign)” is © Creative Commons Flickr user oldskulphoto (top right), “126/365” is © Creative Commons Flickr user Chris Collins (bottom left), and “004-IMG_5142-1315-07-web” is © Creative Commons Flickr user Phil Ejercito (bottom right). All photos are unmodified except for crops around the edges for fit. All photos used in this report are under a Creative Commons Attribution 2.0 Generic license, available here: https://creativecommons.org/licenses/by/2.0/. The Midwest Economic Policy Institute (MEPI), the University of Illinois Project for Middle Class Renewal, and the University of Wisconsin–Extension School for Workers do not own any photos included in this report.

The State of the Unions 2016 18
APPENDIX TABLE A: PROBIT REGRESSION ON PROBABILITY OF UNION MEMBERSHIP, AVERAGE MARGINAL EFFECTS, WISCONSIN WORKERS, 2013-2015
Wisconsin
Prob(Union Member) Coefficient (St. Err.)
Age 0.0070*** (0.0001)
Age2 -0.0001*** (0.0000)
Female -0.0163*** (0.0004)
Citizen 0.0760*** (0.0016)
White, non-Latino 0.0511*** (0.0011)
African-American 0.0669*** (0.0013)
Latino or Latina 0.0610*** (0.0014)
Center City -0.0081*** (0.0005)
Suburb -0.0227*** (0.0005)
Federal government 0.1673*** (0.0012)
State government 0.1442*** (0.0007)
Local government 0.1750*** (0.0006)
Usual hours worked 0.0012*** (0.0000)
Less than high school 0.0241*** (0.0009)
Some college, no degree 0.0208*** (0.0006)
Associate’s 0.0195*** (0.0006)
Bachelor’s 0.0181*** (0.0006)
Master’s 0.0454*** (0.0006)
Professional/Doctorate -0.1356*** (0.0008)
Industry/Occupation Dummies Y
Constant 0.1027*** (0.0002)
R2 0.2479
Observations 8,261 Three asterisks (***) indicate significance at the 1% level, two asterisks (**) indicates significance at the 5% level, and one asterisk (*) indicates significance at the 10% level. Source: CPS-ORG, Center for Economic and Policy Research Uniform Data Extracts, 2013-2015. The total number of observations of employed persons was 8,261 in Wisconsin. Importance weights are applied to the probit model.
A probit regression model allows for analysis of the probability of a “binary” yes-or-no variable occurring. In this case, the model reports the (positive or negative) direction of the effect that a factor has on the probability of being a union member and whether the output is statistically significant. To determine the magnitude of statistically significant factors, average marginal effects (AMEs) are generated and reported using the dydx, margins command in STATA. Importance weights to match the sample size to the actual
population are applied.

The State of the Unions 2016 19 TABLE B: OLS AND QUANTILE REGRESSIONS OF THE IMPACT OF UNION MEMBERSHIP ON THE NATURAL LOG OF REAL HOURLY WAGES, 2013-2015
(1) USA Mean (1) Wisconsin Mean (2) Wisconsin Median (3) Illinois Mean
Ln(Real Wage) Coefficient (St. Err.) Coefficient (St. Err.) Coefficient (St. Err.) Coefficient (St. Err.)
Union member 0.1106*** (0.0002) 0.1098*** (0.0010) 0.1070*** (0.0011) 0.1051*** (0.0007)
Age 0.0403*** (0.0000) 0.0398*** (0.0001) 0.0396*** (0.0001) 0.0390*** (0.0001)
Age2 -0.0004*** (0.0000) -0.0004*** (0.0000) -0.0004*** (0.0000) -0.0004*** (0.0000)
Female -0.1553*** (0.0001) -0.1482*** (0.0006) -0.1301*** (0.0007) -0.1364*** (0.0005)
Veteran 0.0142*** (0.0002) -0.0115*** (0.0012) 0.0028** (0.0013) 0.0585*** (0.0011)
Citizen 0.0725*** (0.0002) 0.0943*** (0.0024) 0.0921*** (0.0026) 0.0256*** (0.0011)
Immigrant -0.0224*** (0.0002) -0.0237*** (0.0018) -0.0668*** (0.0019) -0.0766*** (0.0009)
White 0.0110*** (0.0002) 0.0524*** (0.0015) 0.0382*** (0.0017) 0.0038*** (0.0010)
African-American -0.1039*** (0.0002) -0.0392*** (0.0020) -0.0673*** (0.0021) -0.1408*** (0.0012)
Latino -0.0701*** (0.0002) 0.0285*** (0.0019) 0.0383*** (0.0020) -0.0665*** (0.0011)
Chicago MSA 0.0066*** (0.0007)
Center City 0.0467*** (0.0001) 0.0432*** (0.0008) 0.0394*** (0.0008) 0.0255*** (0.0009)
Suburb 0.0650*** (0.0001) 0.0991*** (0.0007) 0.1027*** (0.0007) 0.0370*** (0.0008)
Federal government 0.0441*** (0.0003) 0.0262*** (0.0025) 0.0291*** (0.0027) -0.0433*** (0.0019)
State government -0.1060*** (0.0002) -0.1054*** (0.0014) -0.1073*** (0.0015) -0.1169*** (0.0013)
Local government -0.0932*** (0.0002) -0.0932*** (0.0013) -0.1127*** (0.0014) -0.0771*** (0.0010)
Usual hours worked 0.0043*** (0.0000) 0.0054*** (0.0000) 0.0066*** (0.0000) 0.0053*** (0.0000)
Involuntarily part-time -0.1454*** (0.0002) -0.1430*** (0.0015) -0.1321*** (0.0016) -0.1579*** (0.0011)
Less than high school -0.1411*** (0.0002) -0.0916*** (0.0013) -0.0559*** (0.0014) -0.1125*** (0.0010)
Some college 0.0397*** (0.0001) 0.0329*** (0.0009) 0.0060*** (0.0009) 0.0576*** (0.0007)
Associate’s 0.0919*** (0.0002) 0.1293*** (0.0009) 0.1060*** (0.0010) 0.0738*** (0.0009)
Bachelor’s 0.3073*** (0.0001) 0.2836*** (0.0009) 0.2645*** (0.0010) 0.2946*** (0.0007)
Master’s 0.4183*** (0.0002) 0.3435*** (0.0013) 0.3430*** (0.0014) 0.4259*** (0.0009)
Professional/Doctorate 0.5554*** (0.0003) 0.5687*** (0.0020) 0.5758*** (0.0022) 0.6318*** (0.0014)
Industry Dummies Y Y Y Y
Occupation Dummies Y Y Y Y
State Dummies Y N N N
Constant 1.5691*** (0.0009) 1.7396*** (0.0081) 1.4657*** (0.0049) 1.4112*** (0.0048)
R2 0.4558 0.4850 0.3376 0.4538
Observations 409,959 8,166 8,166 13,196
Weighted Y Y Y Y Three asterisks (***) indicate significance at the 1% level, two asterisks (**) indicates significance at the 5% level, and one asterisk (*) indicates significance at the 10% level. Source: CPS-ORG, Center for Economic and Policy Research Uniform Data Extracts, 2013-2015. The total number of observations of employed persons was 8,261 in Wisconsin. The data are adjusted by the outgoing rotation group earnings weight to match the total population 16 years of age or older.
Ordinary least squares and quantile regression models account for other variables to parse out the actual and
unique causal effect that union membership has on hourly wages on average. The analyses control for a host
of demographic, work, sector, industry, occupation, and education variables that could also have an impact a
worker’s wages. In the U.S. model, state indicator variables are included to factor in unmeasured state-
specific characteristics. The sample, in all cases, is weighted to match the actual population. Regression (1)
compares the impact of union membership on wages for Wisconsin compared to the nation from OLS analyses,
regression (2) provides the median regression as an example of outputs from the quartile regressions for
Wisconsin, and regression (3) uses Illinois as an example of OLS results from other states. For full (2) and (3)
regression outputs in a .txt format, please contact author Frank Manzo IV at [email protected].

The State of the Unions 2016 20