immigrant unionization through the great -
TRANSCRIPT
http://asr.sagepub.com/American Sociological Review
http://asr.sagepub.com/content/78/2/315The online version of this article can be found at:
DOI: 10.1177/0003122412473107
2013 78: 315American Sociological ReviewPeter Catron
Immigrant Unionization through the Great Recession
Published by:
http://www.sagepublications.com
On behalf of:
American Sociological Association
can be found at:American Sociological ReviewAdditional services and information for
http://asr.sagepub.com/cgi/alertsEmail Alerts:
http://asr.sagepub.com/subscriptionsSubscriptions:
http://www.sagepub.com/journalsReprints.navReprints:
http://www.sagepub.com/journalsPermissions.navPermissions:
What is This?
- Mar 27, 2013Version of Record >>
at ASA - American Sociological Association on March 29, 2013asr.sagepub.comDownloaded from

American Sociological Review78(2) 315 –332© American Sociological Association 2013DOI: 10.1177/0003122412473107http://asr.sagepub.com
Comment on Rosenfeld and Kleykamp, ASR, December 2009
After decades of de-unionization, research suggests that Hispanics—and Hispanic immi-grants in particular—may revitalize organized labor in the United States. Most of this research consists of case studies of individual organizing campaigns (see, e.g., Milkman 2006). In 2009, however, Rosenfeld and Kleykamp (hereafter RK) set out to determine whether these campaigns had produced quan-tifiable gains at the national level. By analyz-ing detailed data from the Current Population Survey (CPS), they found that when compared to native-born whites “many Hispanic sub-groups are no less likely,” and some Hispanic subgroups are “more likely,” to join or belong to labor unions (Rosenfeld and Kleykamp 2009:933). These results are important, for
they buttress the hopes of both Hispanic workers, who view union membership as a potential avenue to upward mobility, and union organizers, who view immigrants as a potential source of new members. RK note that overall union density is low in the United States, and that unionization is therefore unlikely to usher in widespread assimilation absent a “fundamental restructuring of the institutional underpinnings of organized
473107 ASRXXX10.1177/0003122412473107American Sociological ReviewCatron2013
aUniversity of California-Los Angeles
Corresponding Author:Peter Catron, UCLA Department of Sociology, 264 Haines Hall, 375 Portola Plaza, Los Angeles, CA 90095-1551 E-mail: [email protected]
Immigrant Unionization through the Great Recession
Peter Catrona
AbstractPrevious research has found that in recent years immigrants had a higher propensity to unionize than did native-born workers. However, little research shows that historically marginalized immigrant workers are able to maintain newly acquired union jobs, especially during times unfavorable to unionization more generally. This comment focuses on immigrant unionization during the Great Recession of 2008 to determine whether inroads that immigrants made through organizing were maintained in hostile union environments. Using the Current Population Survey (CPS), I extend Rosenfeld and Kleykamp’s (2009) models for Hispanic unionization (which end in 2007) through the recent downturn and beyond. I find that Hispanic immigrants, who held higher odds of union entry or membership in Rosenfeld and Kleykamp’s pre-recession analysis, lost union jobs at an increased rate during the Great Recession compared with native-born white workers. These effects for Hispanic immigrants filtered throughout various subcategories and control variables, including years since entry, citizenship status, and nationality. These results are likely not due to immigrants’ unfavorable labor market allocation, and to some degree undercut the hopes of those who view immigrants as the key to organized labor’s future and organized labor as the key to immigrant prosperity.
Keywordseconomy, immigrants, Great Recession, unions
at ASA - American Sociological Association on March 29, 2013asr.sagepub.comDownloaded from

316 American Sociological Review 78(2)
labor” (p. 933), but they find that Hispanic immigrants “organize at higher rates than do U.S. born whites” (p. 932) and interpret their findings as evidence for the “steady” assimi-lation of Hispanics who find themselves in “organizable labor market positions” (p. 933).
But the CPS did not begin to identify immigrants until 1994. RK conducted their analyses in the years prior to the Great Reces-sion of 2007 to 2009. The bulk of their data are therefore drawn from a decidedly prosper-ous period in U.S. history. Will the immigrant influx survive the recent downturn? While RK “indirectly control” (p. 919) for effects of the business cycle by deploying state and year fixed effects, they neither test—nor claim to test—effects of the macroeconomy more gen-erally. Their conclusions are therefore vulner-able to charges of ahistoricism that bedevil analysts who try to control—rather than theo-rize—effects of time (Isaac and Griffin 1989).
I therefore address the effects of the recent downturn head-on by extending the models developed by RK through the Great Reces-sion of 2008 and beyond. Results suggest that Hispanic immigrants, who held higher odds of union entry or membership in RK’s pre-recession analysis, lost union jobs more rap-idly than did native non-Hispanic whites during the downturn regardless of citizenship and years since entry. In all likelihood, these results are not attributable to the unfavorable labor market allocation of immigrants, as will be discussed below, and to some degree undercut the hopes of both those who view immigrants as the key to organized labor’s future and those who view unionization as the key to immigrant prosperity.1
DAtA AnD MethoDsData come from the CPS-March outgoing rotation groups and Merged Outgoing Rotation Groups (MORG) for various years.2 I recoded labor market position and firm size variables to match RK’s do files, and data are limited to non–self-employed wage and salary workers age 18 to 65 years.3 First, using a logistic regression to determine the odds of union
membership, I analyze cross-sections from the 2007 and 2009 CPS-March outgoing rotation groups. The first analysis predicts the odds of union membership in 2007 (the last year of RK’s data) and the second analysis predicts the odds of union membership in 2009 (near the bottom of the recession). I examine differ-ences between the two years for race/ethnicity categories as well as Hispanic immigrant racial/ethnic subcategories.
A second analysis takes advantage of the longitudinal aspect of the CPS. Using the same matching scheme for the MORG pro-vided by RK, I report the odds that members of immigrant racial/ethnic groups will leave a union from one year to the next. The match-ing process creates two-year panel data from which changes in union status can be calcu-lated. I performed a multinomial logistic regression with four unordered categorical outcomes (i.e., joining a union, leaving a union, staying in a union, and never being in a union). I ran multinomial regressions for the years 2004 to 2006 (boom years), 2006 to 2008 (an intermediary period), and 2008 to 2010 (the recession and post-recession).4
ResUltsModeling Union Membership through the Recession
Table 1 presents the odds of union membership in 2007 and 2009 following RK’s market posi-tion and firm size models.5 The 2007 cross-section replicates the last year of their study and supports their analysis (see Rosenfeld and Kleykamp 2009: Table 2, p. 926).6 In 2007, Hispanics were neither more nor less likely to hold a union job than were non-Hispanic whites, following RK, in both the market posi-tion and firm size models. In 2009, however, while failing to reach conventional significance levels, Hispanics had 22.4 percent lower odds of holding union jobs than did their non- Hispanic white counterparts in the market posi-tion model. Once firm size is included, Hispanics and non-Hispanic whites continue to show no statistically discernible differences in
at ASA - American Sociological Association on March 29, 2013asr.sagepub.comDownloaded from

Catron 317
table 1. Odds Ratios from Logistic Regressions Predicting Unionization; 18- to 65-Year-Old Wage and Salary Workers, 2007 and 2009
2007 2009
Market Position Firm Size
Market Position Firm Size
Race (White ref.) Black 1.303*
(2.18)1.262
(1.91)1.159
(1.22)1.090(.71)
Hispanic 1.059(.50)
1.081(.66)
.776(–1.94)
.807(–1.60)
Other race .727(–1.90)
.723(–1.90)
.994(–.05)
.980(–.14)
Male 1.242*(2.84)
1.235*(2.74)
1.152(1.82)
1.143(1.70)
Married 1.094(1.21)
1.109(1.36)
1.140(1.74)
1.150(1.84)
Age (exper.) 1.041*(2.92)
1.037*(2.56)
1.068*(4.57)
1.063*(4.20)
Age sq. (exper. squared) .999(–1.88)
.999(–1.65)
.999*(–3.68)
.999*(–3.37)
Education (<HS ref.) High school 1.541*
(2.89)1.379*
(2.09)1.294
(1.50)1.154(.83)
Some college 1.460*(2.34)
1.264(1.42)
1.593*(2.58)
1.366(1.71)
BA + 1.593*(2.92)
1.325(1.71)
1.654*(2.84)
1.383(1.80)
Private Sector .118*(–22.38)
.153*(–18.97)
.110*(–23.27)
.140*(–19.95)
Occupation (professional/managerial reference) Farm/forestry/fishery 1.072
(.08)1.529(.52)
.099*(–2.08)
.130(–1.83)
Production/craft/repair 2.634*(8.20)
2.812*(8.66)
2.676*(8.49)
2.864*(8.86)
Service occupations 1.149(1.51)
1.200(1.93)
1.036(.40)
1.098(1.04)
Industry (Ag. ref.) Mining 2.653
(1.50)2.233
(1.20)5.089*
(2.17)3.888
(1.75) Construction 2.428
(1.72)3.113*
(2.03)4.991*
(2.39)5.811*
(2.54) Manu. durables 2.217
(1.54)1.728(.98)
3.380(1.81)
2.598(1.38)
Manu. nondurables 3.412*(2.36)
2.517(1.66)
5.239*(2.45)
4.027*(2.00)
Transportation 5.181*(3.16)
4.127*(2.54)
10.883*(3.55)
8.904*(3.16)
Communications 4.248*(2.66)
2.898(1.82)
6.867*(2.77)
4.863*(2.22)
Utilities 3.271*(2.07)
2.471(1.50)
6.517*(2.64)
4.875*(2.18)
Wholesale trade 1.222(.34)
1.051(.08)
1.673(.71)
1.479(.53)
Retail trade 1.461(.73)
1.207(.34)
1.719(.80)
1.404(.49)
(continued) at ASA - American Sociological Association on March 29, 2013asr.sagepub.comDownloaded from

318 American Sociological Review 78(2)
2007 2009
Market Position Firm Size
Market Position Firm Size
F.I.R.E. .483(–1.23)
.375(–1.57)
1.333(.41)
1.063(.09)
Business repair .910(–.17)
.839(–.30)
.777(–.35)
.767(–.36)
Personal services 1.575(.81)
1.671(.85)
1.704(.75)
1.727(.75)
Rec./entertain. 1.648(.84)
1.510(.65)
4.187*(1.97)
3.516(1.69)
Professional services 2.649(1.91)
2.314(1.53)
4.211*(2.17)
3.740(1.93)
Public admin. 1.709(1.03)
1.504(.73)
3.568(1.89)
3.160(1.67)
Unclassified .603(–.64)
.526(–.76)
4.238(1.78)
3.341(1.43)
Firm Size (<25 ref.) 25 to 99 1.829*
(3.81)1.536*
(2.84) 100 to 499 3.417*
(8.42)2.851*
(7.60) 500 to 999 4.415*
(8.57)3.700*
(8.09) 1,000+ 4.553*
(11.24)3.584*
(10.21)State/Metro Effect Yes Yes Yes Yes
N 13,692 13,692 13,082 13,082McFadden’s R2 .2258 .2513 .2649 .2840BIC 8,870 8,680 8,501 8,336
Note: z-statistics are in parentheses. Data come from the CPS-March outgoing rotation group for appropriate year. Models weighted with the appropriate CPS weights. BICs calculated without weights. Rosenfeld and Kleykamp (2009) do not use full-time in their model citing that “many unions push to convert part-time positions to full-time during contract negotiations” (p. 935). However, they do use a full-time indicator as a robustness check and find “substantively similar results” (p. 935). I confirm their finding. Rosenfeld and Kleykamp (2009) also control for public administration (labeled government in their tables) and private sector, variables that should be inversely related. The correlation between these two variables in 2007 and 2009 is –.54 (rounded to the nearest hundredth). According to the Census Bureau, individuals who remain in the public administration industry “oversee governmental programs and activities that are not performed by private establishments” (http://www.census.gov/naics). The Census Bureau further specifies, “government establishments engaged in the production of private-sector-like goods and services should be classified in the same industry as private-sector establishments engaged in similar activities” (http://www.census.gov/naics). Therefore, all individuals in the public administration industry remain in the public sector, but those in other industries may be in either the private or public sector. As a robustness check, first, I ran all models without the private sector dummy. I found substantively similar results for the race/ethnic groups, but the model fit is greatly reduced. A second robustness check collapsed the industry variables into major industry codes defined by Waldinger and Der-Martirosian (2000). One dummy includes all public sector/public administration workers and five other private industry sectors. Again, I found substantively similar results for the race/ethnic categories, however, the other race category flirts with different levels of significance. F.I.R.E. refers to financial, insurance, and real estate industries.*p < .05 (two-tailed tests).
table 1. (continued)
at ASA - American Sociological Association on March 29, 2013asr.sagepub.comDownloaded from

Catron 319
the likelihood of holding a union job. Hispanic ethnicity, however, includes immigrants and nonimmigrants and obscures heterogeneous origins among both groups.
Table 2 presents odds ratios for immigrant subcategories in the 2007 and 2009 cross-sections. The first set of models includes immigrant and nonimmigrant race/ethnic cat-egories with controls identical to Table 1. RK do not report equivalent findings; therefore, a comparison to their models is impossible. Nonetheless, I find that in 2007, ceteris pari-bus, Hispanic immigrants revealed no statisti-cally discernible disadvantage vis-a-vis non-Hispanic whites in terms of union mem-bership. In 2009, however, Hispanic immi-grants had 46.7 percent lower odds of union membership in the market position model and 41.4 percent lower odds once firm size vari-ables are added. Given that these effects do not filter through all immigrant race/ethnic categories, they suggest that mechanisms that predict a lower propensity for Hispanic immi-grants to organize are in place, whatever those mechanisms may be.
The second set of models in Table 2 includes years since entry for Hispanic immi-grants. RK found that, controlling for relevant variables, Hispanic immigrants who had lived in the United States for more than 20 years were no more likely to hold union jobs than were native-born whites. But they also noted that immigrant organizing is a relatively recent phenomenon and their data may there-fore have averaged out its effects. This inter-pretation finds some support in my analyses, which show that Hispanic immigrants with more than 20 years in the United States had over 70 percent higher odds of unionization than did native non-Hispanic whites in 2007. But the two groups betrayed no statistically discernible differences in 2009, when the odds ratio for experienced Hispanics actually fell below 1. Moreover, recent Hispanic immigrants had lower odds of unionization than did non-Hispanic whites in both 2007 and 2009. Finally, the gap between newcom-ers and non-Hispanic whites was larger at the bottom of the recession.
The third set of models in Table 2 addresses the subcategory of Hispanic immigrant citi-zenship status. Hispanic immigrant citizens had over 60 percent higher odds of unioniza-tion than did their native white counterparts in 2007. This effect is different from that found by RK, who show that, controlling for firm size, these citizens had 20 percent higher odds of unionization than did non-Hispanic whites. I found that in 2007, Hispanic immi-grant noncitizens revealed no difference in the odds of holding a union job when com-pared to native-born whites. This also differs from RK’s results, which show that Hispanic immigrant noncitizens had 40 percent lower odds of holding a union job, all else being equal. As in previous models, differences between my 2007 cross-section and RK’s analysis may be due to their larger sample, because their data are spread over several years that may average out the statistical effect of one year. Differences between 2007 and 2009 show similar patterns: the statisti-cally significant advantage Hispanic immi-grant citizens enjoyed in 2007 fell to nonsignificance in 2009; and Hispanic immi-grant noncitizens had over 50 percent lower odds of unionization than did native non-Hispanic whites (from no statistically dis-cernible effect in 2007). Hispanic immigrants who became citizens, and in so doing under-went some form of assimilation, were still disadvantaged in holding onto union jobs.
The last set of models in Table 2 includes Hispanic nationality and immigrant subcate-gories. Unionists or employers may view immigrants differently depending on their country of origin. Furthermore, differential socialization at the point of origin may influ-ence the propensity to unionize in the United States. In RK’s analysis, Mexican immigrants and non-Mexican Hispanic immigrants had lower odds of unionization than did native non-Hispanic whites. Although my 2007 analysis reveals no significant difference in their propensity to organize, by 2009 Mexi-can and non-Mexican Hispanic immigrants had lower odds of union membership than did native-born whites net of other factors.
at ASA - American Sociological Association on March 29, 2013asr.sagepub.comDownloaded from

320 American Sociological Review 78(2)
table 2. Immigrant Subcategories; Odds Ratios from Logistic Regressions Predicting Unionization; 18- to 65-Year-Old Wage and Salary Earners, 2007 and 2009
2007 2009
Market Position
Firm Size
Market Position
Firm Size
Immigrant Race White immigrant .709
(–1.54).749
(–1.34).975
(–.12).956
(–.21) Black nonimmigrant 1.392*
(2.60)1.356*
(2.38)1.141
(1.02)1.077(.57)
Black immigrant .715(–.91)
.679(–1.06)
1.239(.72)
1.141(.46)
Hispanic nonimmigrant 1.077(.48)
1.077(.46)
1.015(.09)
1.005(.03)
Hispanic immigrant .989(–.07)
1.039(.25)
.533*(–3.28)
.586*(–2.71)
Other nonimmigrant .851(–.68)
.817(–.82)
1.232(1.08)
1.194(.89)
Other immigrant .627*(–2.15)
.640*(–2.03)
.828(–1.01)
.828(–.99)
N 13,692 13,692 13,082 13,082 McFadden’s R2 .2269 .2523 .2664 .2850 BIC 8,901 8,711 8,529 8,367
Years Entry Hispanic nonimmigrant 1.073
(.46)1.072(.43)
1.015(.10)
1.006(.04)
Hispanic immigrated 20+ years 1.702*(2.60)
1.762*(2.79)
.637(–1.58)
.663(–1.41)
Hispanic immigrated 10 to 20 years .963(–.15)
1.046(.17)
.673(–1.45)
.741(–1.05)
Hispanic immigrated 5 to 10 years .514*(–2.14)
.516*(–2.07)
.310*(–2.57)
.362*(–2.21)
Hispanic immigrated fewer than five years .393(–1.96)
.438(–1.59)
.169*(–2.30)
.222*(–2.00)
N 13,692 13,692 13,082 13,082 McFadden’s R2 .2292 .2544 .2672 .2856 BIC 8,911 8,724 8,551 8,390
Citizenship Hispanic nonimmigrant 1.071
(.45)1.072(.43)
1.012(.08)
1.002(.02)
Hispanic immigrant citizen 1.639*(2.28)
1.685*(2.43)
.725(–1.19)
.743(–1.05)
Hispanic immigrant noncitizen .745(–1.60)
.791(–1.24)
.413*(–3.60)
.479*(–2.96)
N 13,692 13,692 13,082 13,082 McFadden’s R2 .2281 .2533 .2668 .2854 BIC 8,905 8,716 8,535 8,374
Nationality Hispanic nonimmigrant, non-Mexican 1.143
(.59)1.142(.54)
1.359(1.43)
1.366(1.43)
Hispanic immigrant, non-Mexican 1.106(.50)
1.172(.77)
.478*(–2.58)
.525*(–2.22)
Mexican nonimmigrant 1.027(.14)
1.028(.14)
.830(–.93)
.814(–1.00)
Mexican immigrant .901(–.55)
.940(–.32)
.567*(–2.47)
.623*(–1.99)
N 13,692 13,692 13,082 13,082 McFadden’s R2 .2270 .2524 .2669 .2855 BIC 8,919 8,730 8,542 8,379
Note: z-statistics are in parentheses. Data come from the CPS-March outgoing rotation group for appropriate year. All models include variables from Table 1. The reference category for all models is nonimmigrant whites. Models weighted with the appropriate CPS weights. BICs calculated without weights.*p < .05 (two-tailed tests).
at ASA - American Sociological Association on March 29, 2013asr.sagepub.comDownloaded from

Catron 321
Furthermore, the gap between these two groups and non-Hispanic whites in 2009 was greater than that found in RK’s pre-recession analysis. By contrast, Hispanic-origin and Mexican-origin natives showed no difference in union membership compared to native non-Hispanic whites in both years.
Table 3 reports interactions for year and immigrant subcategories pooling 2007, 2008, and 2009. For the results discussed earlier, the 2009 interaction coefficients show that observed differences are correctly signed in all—and statistically significant in most—cases. These results suggest mechanisms are in play that pushed Hispanic immigrants to leave union jobs at higher rates than did native non-Hispanic whites and native-born Hispanics during the Great Recession. How-ever, it is important to understand whether these effects are specific to the Great Reces-sion, or whether Hispanic immigrants’ de-unionization is a function of broader economic circumstances over time. I therefore leverage the full dataset for which immigrant status is available (1994 to 2011).7 I present the inter-action of the co-racial/ethnic unemployment rate for respondents age 18 to 65 years and the immigrant subcategories.8 Because unions emphasize economic gains for their members, there may be a disemployment effect where higher wages force employers to lower the number of employees in a firm. Workers, then, may become unemployed until they find employment in the nonunion sector. To pre-vent this potential reverse causality, I lag the unemployment rate by one year (e.g., last year’s co-racial/ethnic unemployment rate predicts this year’s co-racial/ethnic unioniza-tion odds). Table 4 presents interactions for 1994 to 2007 ( just before the Great Reces-sion) and then adds the recession years.
In the years prior to the Great Recession, Table 4 shows no interaction effect unique to immigrants vis-à-vis native non-Hispanic whites. We might find effects between unem-ployment and Hispanic immigrants if we could examine years prior to 1994 (when the CPS began to track immigrant status), because unemployment did not increase sharply in the
years leading up to the Great Recession.9 However, with inclusion of the Great Reces-sion years, 2008 to 2011, unemployment pro-duces lower odds of unionization for Hispanic immigrants compared with native non- Hispanic whites. The interaction effect filters through Hispanic immigrant noncitizens and Hispanic- and Mexican-origin immigrants. Interestingly, the years since entry model sug-gests that only immigrants who have remained in the United States for a long time and recent arrivals have lower unionization odds as unemployment increases (although recent arrivals fail to reach a conventional signifi-cance level in the firm size model). Reces-sions might have a nonlinear interaction with time since arrival, where low and long tenure predicts de-unionization as unemployment increases. Low tenure immigrants may have been subject to last hired, first fired dynamics, and long tenured immigrants may have volun-tarily taken early retirement in the downturn or involuntarily lost their union jobs and found it difficult to retrain. Nevertheless, these mechanisms are purely speculative and should be examined in future research.
Hispanic immigrants who became citizens, however, show no statistically discernible dif-ference from native non-Hispanic whites, which may support the notion of assimilation into the economic mainstream. Inclusion of the Great Recession years supports the earlier analysis and suggests that Hispanic immi-grants are more likely to lose union jobs (vol-untarily or involuntarily) at an increased rate as unemployment rates skyrocket. These effects may be due to the recession affecting unionized sectors more than nonunionized sectors, unfavorable labor market allocation, seniority schemes, or a host of other mecha-nisms. The following analysis sheds light on potential reasons for the decrease in odds of unionization for immigrants.
Modeling the Odds of Leaving a Union
The CPS-Matched MORG dataset allows one to estimate the shift from employment to
at ASA - American Sociological Association on March 29, 2013asr.sagepub.comDownloaded from

322 American Sociological Review 78(2)
table 3. Odds Ratios of Interactions between Year and Race/Ethnic Subcategories from Pooled Data 2007 to 2009
Labor Market Position Firm Size
Immigrant Race White immigrant 2008 .847
(–.53).852
(–.51) White immigrant 2009 1.423
(1.16)1.343(.98)
African American 2008 .753(–1.68)
.742(–1.76)
African American 2009 .834(–1.08)
.803(–1.30)
Black immigrant 2008 1.499(.86)
1.450(.79)
Black immigrant 2009 1.860(1.36)
1.763(1.26)
Hispanic nonimmigrant 2008 1.059(.29)
1.079(.36)
Hispanic nonimmigrant 2009 .981(–.09)
.966(–.16)
Hispanic immigrant 2008 .804(–1.10)
.838(–.88)
Hispanic immigrant 2009 .562*(–2.73)
.579*(2.53)
Other nonimmigrant 2008 .818(–.67)
.829(–.61)
Other nonimmigrant 2009 1.436(–1.30)
1.445(1.28)
Other immigrant 2008 .911(–.31)
.894(–.36)
Other immigrant 2009 1.372(1.14)
1.371(1.12)
N 40,559 40,559 McFadden’s R2 .2382 .2596 BIC 25,295 24,702
Years Entry Hispanic nonimmigrant 2008 1.059
(.28)1.078(.36)
Hispanic nonimmigrant 2009 .981(–.10)
.966(–.16)
Hispanic immigrated 20+ years 2008 .659(–1.45)
.686(–1.33)
Hispanic immigrated 20+ years 2009 .381*(–2.89)
.383*(–2.85)
Hispanic immigrated 10 to 20 years 2008 .556(–1.50)
.554(–1.49)
Hispanic immigrated 10 to 20 years 2009 .734(–.87)
.734(–.84)
Hispanic immigrated 5 to 10 years 2008 1.124(.23)
1.316(.53)
Hispanic immigrated 5 to 10 years 2009 .650(–.82)
.724(–.84)
Hispanic immigrated fewer than five years 2008
1.755(.91)
1.774(.88)
(continued)
at ASA - American Sociological Association on March 29, 2013asr.sagepub.comDownloaded from

Catron 323
Labor Market Position Firm Size
Hispanic immigrated fewer than five years 2009
.415(–.99)
.466(–.85)
N 40,559 40,559 McFadden’s R2 .2395 .2608 BIC 25,360 24,770
Citizenship Hispanic nonimmigrant 2008 1.058
(.28)1.077(.36)
Hispanic nonimmigrant 2009 .981(–.10)
.966(–.17)
Hispanic immigrant citizen 2008 .811(–.68)
.849(–.53)
Hispanic immigrant citizen 2009 .457*(–2.33)
.453*(–2.32)
Hispanic immigrant noncitizen 2008 .735(–1.14)
.771(–.96)
Hispanic immigrant noncitizen 2009 .583*(1.98)
.621(–1.72)
N 40,559 40,559 McFadden’s R2 .2391 .2604 BIC 25,307 24,717
Nationality Hispanic nonimmigrant, non-Mexican 2008 .993
(–.02)1.001(.00)
Hispanic nonimmigrant, non-Mexican 2009 1.268(.78)
1.259(.72)
Hispanic immigrant, non-Mexican 2008 .632(–1.42)
.635(–1.40)
Hispanic immigrant, non-Mexican 2009 .461*(–2.33)
.470*(–2.25)
Mexican nonimmigrant 2008 1.104(.39)
1.130(.46)
Mexican nonimmigrant 2009 .841(–.67)
.823(–.72)
Mexican immigrant 2008 .935(–.27)
.997(–.01)
Mexican immigrant 2009 .644(1.64)
.667(–1.47)
N 40,559 40,559 McFadden’s R2 .2384 .2599 BIC 25,350 24,756
Note: z-statistics are in parentheses. Data come from the CPS-March outgoing rotation group for appropriate year. Models weighted with the appropriate CPS weights. BICs calculated without weights. All models control for the labor market position and firm size variables defined by RK and immigrant subcategories and year.*p < .05 (two-tailed tests).
table 3. (continued)
at ASA - American Sociological Association on March 29, 2013asr.sagepub.comDownloaded from

324 American Sociological Review 78(2)
table 4. Interaction Effects Predicting Odds of Unionization between Co-racial/Ethnic Unemployment Rate from the Previous Year and Immigrant Subcategories, 1994 to 2011
Labor Market Firm Size
1994 to
20071994 to
20111994 to
20071994 to
2011
Immigrant Race Unemployment rate .976
(–.46)1.063*
(1.98).978
(–.41)1.062
(1.91) White immigrant x unemployment .947
(–.73).982
(–.47).928
(–.97).980
(–.51) African American x unemployment 1.070
(1.90).967
(–1.87)1.083*
(2.19).972
(–1.54) Black immigrant x unemployment .996
(–.05).961
(–1.12).961
(–.57).964
(–1.01) Hispanic nonimmigrant x unemployment 1.028
(.60).977
(–1.10)1.021(.44)
.977(–1.04)
Hispanic immigrant x unemployment 1.009(.20)
.942*(–2.73)
1.014(.29)
.942*(–2.65)
Other nonimmigrant x unemployment .991(–.16)
.983(–.51)
1.002(.03)
.981(–.56)
Other immigrant x unemployment 1.066(1.16)
.984(–.50)
1.053(.93)
.982(–.55)
N 203,585 256,480 200,294 252,104 McFadden’s R2 .2309 .2330 .2518 .2534 BIC 130,762 162,096 126,102 156,321
Years Entry Unemployment rate .985
(–.27)1.075*
(2.36).987
(–.25)1.072*
(2.22) Hispanic nonimmigrant x unemployment 1.021
(.45).972
(–1.35)1.014(.30)
.973(–1.25)
Hispanic immigrated 20+ years x unemployment
.961(–.69)
.910*(–3.33)
.958(–.72)
.909*(–3.31)
Hispanic immigrated 10 to 20 years x unemployment
1.093(1.42)
.973(–.82)
1.088(1.29)
.970(–.89)
Hispanic immigrated 5 to 10 years x unemployment
1.008(.10)
.963(–.76)
1.036(.44)
.961(–.78)
Hispanic immigrated fewer than five years x unemployment
.954(–.55)
.858*(–2.47)
.976(–.27)
.888(–1.88)
N 203,585 256,480 200,294 252,104 McFadden’s R2 .2316 .2337 .2524 .2539 BIC 130,752 162,081 126,102 156,316
Citizenship Unemployment .981
(–.36)1.078*
(2.44).981
(–.34)1.075*
(2.29) Hispanic nonimmigrant x unemployment 1.025
(.53).971
(–1.39)1.018(.38)
.972(–1.29)
Hispanic immigrant citizen x unemployment 1.033(.53)
.962(–1.35)
1.026(.42)
.956(–1.55)
Hispanic immigrant noncitizen x unemployment
1.012(.24)
.909*(–3.45)
1.021(.39)
.914*(–3.17)
N 203,585 256,480 200,294 252,104 McFadden’s R2 .2314 .2337 .2524 .2539 BIC 130,730 162,025 126,085 156,275
(continued) at ASA - American Sociological Association on March 29, 2013asr.sagepub.comDownloaded from

Catron 325
Labor Market Firm Size
1994 to
20071994 to
20111994 to
20071994 to
2011
Nationality Unemployment rate .977
(–.43)1.062*
(1.97).980
(–.38)1.061
(1.90) Hispanic nonimmigrant non-Mexican x
unemployment.985
(–.27).957
(–1.52).970
(–.54).950
(–1.72) Hispanic immigrant, non-Mexican x
unemployment1.048(.85)
.938*(–2.15)
1.036(.62)
.936*(–2.17)
Mexican nonimmigrant x unemployment 1.053(1.01)
.989(–.44)
1.051(.93)
.994(–.22)
Mexican immigrant x unemployment .981(–.36)
.944*(–2.18)
.997(–.06)
.946*(–2.06)
N 203,585 256,480 200,294 252,104 McFadden’s R2 .2310 .2331 .2519 .2534 BIC 130,800 162,140 126,140 156,363
Note: z-statistics are in parentheses. Data come from the CPS-March outgoing rotation group for appropriate year. The unemployment rate is calculated for four race/ethnic categories (white, black, Hispanic, other) for respondents age 18 to 65 years using the MORG to give the annualized unemployment rate. The independent variable is lagged one year from the unemployment rate to help prevent reverse causation because unions emphasize economic gains that may result in a disemployment effect. All models include variables from Table 1. The reference category for all models is nonimmigrant whites. Models weighted with the appropriate CPS weights. BICs calculated without weights.*p < .05 (two-tailed tests).
unemployment during the recession and the odds of leaving a union in a one-year period. First, as noted earlier, the recession may have affected unionized sectors more than non-unionized sectors. Immigrants tend to con-centrate in the construction industry and low-wage occupations—industries that were especially hard-hit during the recession. If these industries became less union dense as the recession unfolded, this would have a major impact on the likelihood that an immi-grant would hold on to a union job. A model determining the shift from employment to unemployment shows that, controlling for industry and other labor market position vari-ables, the odds of entry into unemployment in a one-year period were significantly lower for union members than for nonunionized work-ers as the recession unfolded.10 Unionized workers were thus less rather than more likely to lose their jobs.
Second, by focusing on union leavers, as opposed to union joiners, we can better under-stand why effects described earlier may have occurred and simultaneously shed light on whether the changing industrial composition of the U.S. workforce may be to blame for the decline in unionization of Hispanic immi-grants (and Hispanic immigrant subcatego-ries).11 Table 4 presents odds of leaving a union (as opposed to staying in a union) for race/ethnic categories and Hispanic immi-grant subcategories. The model showing race/ethnic immigrant and nonimmigrant catego-ries also reports selected industries to show whether working in these industries signifi-cantly predicts union leaving.
The first three columns of Table 5 control for the labor market position variables defined by RK. The next three columns add a dummy variable for change in occupation and a dummy variable for the change in industry to
table 4. (continued)
at ASA - American Sociological Association on March 29, 2013asr.sagepub.comDownloaded from

326 American Sociological Review 78(2)
the market position variables. The last three columns limit the sample to only respondents who remained in a stable occupation and industry. Odds that both immigrants and non-immigrant minorities leave a union (as opposed to staying in a union) increase com-pared to native non-Hispanic whites between the pre-recession and recession/post-recession years.12 These trends continue when change in occupation and industry dummies are included. The CPS does not allow analysis for individuals who remained employed with the same employer. However, respondents who stayed in the same occupation and industry (with the exception of the other race catego-ries) also showed increased odds of leaving a union compared to their white counterparts. The gap between minority immigrant groups and native non-Hispanic whites widened in the intermediary period, with few excep-tions. In all likelihood, this was a result of minorities’ vulnerability to economic down-turns. Hout and colleagues (2011) suggest the recession affected minorities before the reces-sion officially began in December 2007—especially for African Americans and immigrants—a finding consistent with the odds of losing a union job in my own analy-sis. For instance, Hispanic-origin natives were no more likely to lose a union job than were non-Hispanic whites in 2004 to 2006, but they had 55.4 percent higher odds of leav-ing a union than did non-Hispanic whites in the intermediary period. In the recession/post-recession years, the gap was invariably significant and tended to widen. In a few cases it tightened a bit—perhaps because minorities had already lost their union sta-tus—but it never fails to achieve significance.
Logistic regressions from Table 2 suggest that Hispanic immigrants were most likely to lose union status. Hispanic immigrants were more likely to leave a union than were native non-Hispanic whites in all models in all periods. In fact, in the labor market position model, Hispanic immigrants had 79.9 percent higher odds of leaving a union (as opposed to staying in a union) between 2004 and 2006 and 94.2 percent higher odds of leaving a
union between 2008 and 2010 than did their native non-Hispanic white counterparts.
Table 5 controls for selected industries to determine whether elevated odds of leaving a union were due to the changing composition of U.S. industries. There were no significant differences in leaving a union (as opposed to staying in a union) between the shown indus-tries and the baseline agriculture, forestry, and fishery industry in the three periods. The sign changed, however, in all but the stable occupation and industry models from lower (but not significant) odds of leaving to higher (but not significant) odds of leaving between the three periods. This suggests that holding a job in these industries did not significantly predict whether someone lost a union job, and the changing composition alone did not account for Hispanic immigrants’ lower odds of holding a union job.
Table 5 also reports the odds of leaving a union in a one-year period for Hispanic immi-grant subcategories. Whereas seniority schemes may predict that recent Hispanic immigrants will become increasingly more likely to leave a union because unions have only recently targeted these groups, it is pos-sible that immigrants who have remained in the United States for a long period should be no less likely to leave a union than would a native non-Hispanic white. Unfortunately, the CPS does not report how long an individual has remained on the job, so this analysis is impossible. But the odds that Hispanic immi-grants left a union increased as the recession unfolded, regardless of how many years they had remained in the United States compared with their native non-Hispanic white counter-parts. Logistic regressions show that Hispanic immigrants who had remained in the United States for more than 20 years were more likely to hold a union job in 2007 and neither less nor more likely to hold a union job in a statistical sense than were native whites in 2009. However, the gap between this group and native non-Hispanic whites in the odds of leaving a union increased from 52.3 percent higher odds in 2004 to 2006 to 71.9 percent higher odds in 2008 to 2010.
at ASA - American Sociological Association on March 29, 2013asr.sagepub.comDownloaded from

327
tabl
e 5.
Od
ds
Rat
ios
for
Mu
ltin
omia
l R
egre
ssio
ns
for
Lea
vin
g a
Un
ion
(as
Op
pos
ed t
o S
tayi
ng
in a
Un
ion
) in
a O
ne-
Yea
r P
erio
d
Lab
or M
arke
t P
osit
ion
Incl
ud
es C
han
ge i
n O
ccu
pat
ion
an
d I
nd
ust
ryL
imit
ed t
o S
tabl
e O
ccu
pat
ion
an
d I
nd
ust
ry
20
04 t
o
2006
2006
to
20
0820
08 t
o
2010
2004
to
20
0620
06 t
o
2008
2008
to
20
1020
04 t
o
2006
2006
to
20
0820
08 t
o
2010
Wh
ite
imm
igra
nt
1.69
4*(4
.07)
1.63
0*(3
.43)
2.27
0*(6
.17)
1.68
4*(3
.99)
1.63
8*(3
.43)
2.20
7*(5
.95)
1.53
7*(2
.69)
1.76
9*(3
.47)
2.32
5*(5
.38)
Afr
ican
Am
eric
an1.
218*
(2.5
8)1.
485*
(5.2
2)1.
470*
(4.9
2)1.
172*
(2.0
6)1.
411*
(4.5
0)1.
427*
(4.5
2)1.
138
(1.4
0)1.
383*
(3.5
0)1.
472*
(4.2
4)B
lack
im
mig
ran
t1.
954*
(3.6
6)1.
300
(1.5
6)1.
902*
(3.7
0)1.
869*
(3.4
0)1.
215
(1.1
3)1.
821*
(3.4
7)1.
726*
(2.3
5)1.
612*
(2.3
7)1.
773*
(2.8
4)H
isp
anic
non
imm
igra
nt
1.29
0*(2
.71)
1.51
4*(4
.63)
1.35
0*(3
.30)
1.28
0*(2
.61)
1.47
5*(4
.31)
1.33
1*(3
.13)
1.20
0(1
.59)
1.53
0*(3
.94)
1.30
5*(2
.44)
His
pan
ic i
mm
igra
nt
1.79
9*(5
.27)
1.72
5*(4
.98)
1.94
2*(6
.11)
1.79
8*(5
.25)
1.69
5*(4
.79)
1.92
3*(5
.99)
1.77
4*(4
.23)
1.77
4*(4
.25)
2.12
7*(5
.84)
Oth
er n
onim
mig
ran
t1.
249*
(3.6
6)1.
331*
(4.4
2)1.
008
(.06
)1.
207
(1.4
9)1.
282*
(1.9
8).9
90(–
.08)
1.16
6(.
99)
1.37
6*(2
.06)
.958
(–.2
7)O
ther
im
mig
ran
t1.
249
(1.7
6)1.
752*
(4.4
2)1.
828*
(5.2
2)1.
974*
(5.4
1)1.
715*
(4.2
3)1.
827*
(5.1
8)2.
192*
(5.3
1)1.
708*
(3.5
4)2.
001*
(5.1
4)
Sel
ecte
d I
nd
ust
ries
Con
stru
ctio
n.5
66(–
1.51
).5
76(–
1.35
)1.
182
(.43
).6
24(–
1.22
).6
15(–
1.18
)1.
264
(.59
).4
15(–
1.68
).4
37(–
1.47
).4
83(–
1.47
)
Man
ufa
ctu
rin
g d
ura
bles
.630
(–1.
23)
.555
(–1.
44)
1.25
7(.
59)
.681
(–1.
00)
.593
(–1.
27)
1.36
5(.
79)
.404
(–1.
74)
.415
(–1.
56)
.583
(–1.
09)
M
anu
fact
uri
ng
non
du
rabl
es.6
59(–
1.10
).6
03(–
1.22
)1.
358
(.78
).6
77(–
1.01
).6
04(–
1.21
)1.
436
(.91
).4
48(–
1.53
).5
01(–
1.22
).5
84(–
1.08
)
T ran
spor
tati
on.5
41(–
1.64
).5
37(–
1.52
)1.
197
(.47
).6
12(–
1.28
).5
92(–
1.28
)1.
368
(.80
).3
83(–
1.86
).4
39(–
1.46
).6
15(–
1.00
)
Pu
blic
ad
min
istr
atio
n.7
63(–
.72)
.679
(–.9
5)1.
760
(1.4
6).8
11(–
.55)
.707
(–.8
5)1.
856
(1.5
8).5
76(–
1.07
).5
45(–
1.08
).8
82(–
.26)
N
101,
776
102,
621
100,
573
101,
776
102,
621
101,
573
68,9
2168
,692
69,9
84
McF
add
en’ s
R2
.167
2.1
660
.178
9.1
751
.173
8.1
849
.186
9.1
880
.197
1
BIC
115,
091
114,
510
110,
432
114,
116
113,
524
109,
690
81,3
2080
,134
79,5
79
(con
tin
ued
)
at ASA - American Sociological Association on March 29, 2013asr.sagepub.comDownloaded from
328
Lab
or M
arke
t P
osit
ion
Incl
ud
es C
han
ge i
n O
ccu
pat
ion
an
d I
nd
ust
ryL
imit
ed t
o S
tabl
e O
ccu
pat
ion
an
d I
nd
ust
ry
20
04 t
o
2006
2006
to
20
0820
08 t
o
2010
2004
to
20
0620
06 t
o
2008
2008
to
20
1020
04 t
o
2006
2006
to
20
0820
08 t
o
2010
Yea
r E
ntr
y
H
isp
anic
non
imm
igra
nt
1.27
4*(2
.58)
1.50
1*(4
.54)
1.34
7*(3
.58)
1.26
5*(2
.49)
1.46
2*(4
.21)
1.32
8*(3
.11)
1.18
3(1
.46)
1.51
5*(3
.84)
1.30
0*(2
.40)
H
isp
anic
im
mig
rate
d 2
0+ y
ears
1.52
3*(2
.85)
1.36
2*(2
.11)
1.71
9*(4
.03)
1.51
5*(2
.80)
1.34
9*(2
.01)
1.70
7*(3
.95)
1.55
9*(2
.52)
1.44
7*(1
.99)
1.76
8*(3
.50)
H
isp
anic
im
mig
rate
d 1
0 to
20
year
s1.
451
(1.9
0)2.
018*
(3.4
1)2.
113*
(3.6
2)1.
448
(1.8
9)1.
970*
(3.2
9)2.
118*
(3.5
9)1.
169
(.60
)2.
163*
(3.1
1)3.
065*
(4.6
6)
His
pan
ic i
mm
igra
ted
5 t
o 10
yea
rs2.
235*
(2.4
8)2.
413*
(3.5
9)2.
991*
(3.5
4)2.
323*
(2.5
8)2.
373*
(3.5
2)2.
770*
(3.3
6)2.
882*
(2.8
3)1.
794
(1.9
3)2.
096
(1.9
0)
His
pan
ic i
mm
igra
ted
few
er t
han
fiv
e ye
ars
4.02
3*(4
.04)
1.99
1(1
.92)
4.67
6*(3
.52)
4.02
9*(4
.09)
1.84
1(1
.70)
4.74
2*(3
.57)
2.86
9*(2
.65)
2.01
3(1
.66)
4.15
9*(2
.74)
N
101,
776
102,
621
100,
573
101,
776
102,
621
100,
573
68,9
2168
,692
69,9
84
McF
add
en’s
R2
.167
8.1
665
.179
7.1
757
.174
2.1
857
.187
5.1
882
.197
9
BIC
115,
141
114,
563
110,
455
114,
166
113,
578
109,
714
81,3
8080
,213
79,6
46
Cit
izen
ship
His
pan
ic n
onim
mig
ran
t1.
292*
(2.7
2)1.
516*
(4.6
5)1.
351*
(3.3
1)1.
282*
(2.6
4)1.
478*
(4.3
3)1.
333*
(3.1
5)1.
204
(1.6
2)1.
533*
(3.9
5)1.
306*
(2.4
4)
His
pan
ic i
mm
igra
nt
citi
zen
1.50
1*(2
.84)
1.31
2(1
.89)
1.63
9*(3
.72)
1.44
7*(2
.59)
1.27
7(1
.69)
1.60
5*(3
.52)
1.34
5(1
.68)
1.35
1(1
.69)
1.82
7*(3
.79)
H
isp
anic
im
mig
ran
t n
onci
tize
n2.
277*
(5.3
6)2.
481*
(6.0
6)2.
656*
(6.0
3)2.
340*
(5.4
9)2.
452*
(5.9
4)2.
645*
(6.0
0)2.
448*
(4.8
0)2.
493*
(4.9
4)2.
803*
(5.3
9)
N10
1,77
610
2,62
110
0,57
310
1,77
610
2,62
110
0,57
368
,921
68,6
9269
,984
M
cFad
den
’s R
2.1
677
.166
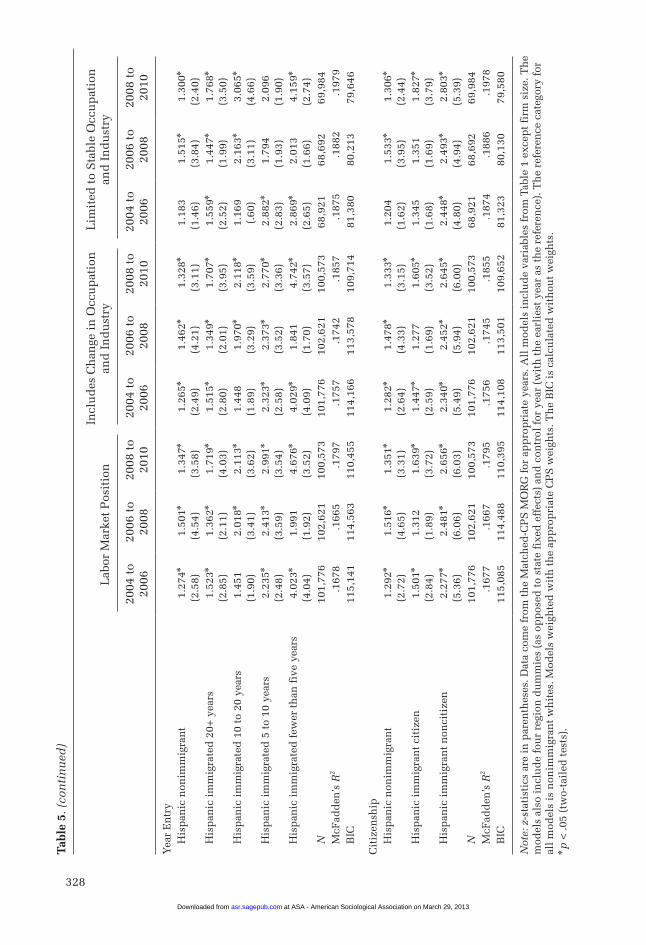
7.1
795
.175
6.1
745
.185
5.1
874
.188
6.1
978
B
IC11
5,08
511
4,48
811
0,39
511
4,10
811
3,50
110
9,65
281
,323
80,1
3079
,580
Not
e: z
-sta
tist
ics
are
in p
aren
thes
es. D
ata
com
e fr
om t
he
Mat
ched
-CP
S M
OR
G f
or a
pp
rop
riat
e ye
ars.
All
mod
els
incl
ud
e va
riab
les
from
Tab
le 1
exc
ept
firm
siz
e. T
he
mod
els
also
in
clu
de
fou
r re
gion
du
mm
ies
(as
opp
osed
to
stat
e fi
xed
eff
ects
) an
d c
ontr
ol f
or y
ear
(wit
h t
he
earl
iest
yea
r as
th
e re
fere
nce
). T
he
refe
ren
ce c
ateg
ory
for
all
mod
els
is n
onim
mig
ran
t w
hit
es. M
odel
s w
eigh
ted
wit
h t
he
app
rop
riat
e C
PS
wei
ghts
. Th
e B
IC i
s ca
lcu
late
d w
ith
out
wei
ghts
.* p
< .0
5 (t
wo-
tail
ed t
ests
).
tabl
e 5.
(co
nti
nu
ed)
at ASA - American Sociological Association on March 29, 2013asr.sagepub.comDownloaded from
Catron 329
We see the same results for Hispanic immigrants who became U.S. citizens. His-panic immigrant citizens and noncitizens show increasing odds of leaving a union com-pared to native non-Hispanic whites follow-ing the patterns above. These effects continue to manifest in models that include a change in occupation and industry as well as the model limiting the sample to respondents who remained in the same occupation and indus-try. With the exception of Mexican-origin natives, the nationality models also show similar results. The race/ethnic immigrant and nonimmigrant models show increasing odds of leaving a union for Hispanic-origin natives compared to their native white counterparts as described earlier. Table 5 provides insight that the recession engendered mechanisms that might offset those of RK’s joining mod-els, whatever those mechanisms may be. These results present a different trend than previous research that portrays immigrants as a source of union revival (e.g., Milkman 2006) or shows higher odds of immigrant union affiliation prior to the Great Recession (RK 2009).
ConClUsIonsRecessions are an unavoidable feature of market economies, and they will affect the life chances and opportunity structures avail-able to different groups depending on how they are mediated by societal institutions and economic structures. My results suggest that, net of other factors, compared to non- Hispanic whites, Hispanic immigrants were more likely to lose union jobs (whether vol-untarily or involuntarily) at an increased rate during the Great Recession. This has poten-tially disruptive effects throughout the econ-omy and society. After all, immigrants have breathed new life into unions, and unions have given working-class immigrants a
potential ladder out of low-paying jobs. But unions that hope to organize immigrants must address cultural and language differences as well as possible racial prejudices from employers and the native working class. Recessions may make this task harder by altering the design of governmental policies, employers’ attitudes, and the patience of local communities—and in so doing may steer immigrants away from the organizable sec-tors of the economy to ethnic and enclave economies that may be unorganizable. If the link between unions and immigrants is sev-ered, both communities are likely to suffer.
The specific mechanisms that would lead to lower immigrant unionization in bad times should thus be examined—perhaps through case studies that ask not only “who joins” but also “who leaves unions.” Such analyses would shed light not only on why immigrants were disproportionately likely to lose union jobs in the recession, but also on whether their rates of unionization will recover with the macroeconomy—or whether a lasting scarring effect will make immigrants more difficult to organize in the future.
RK conclude that many Hispanic immi-grant subgroups have a higher propensity to unionize than do native-born workers and find evidence for the “steady” assimilation of Hispanics who find themselves in “organiza-ble labor market positions” (p. 933). But immigrants’ propensity to unionize is by no means unchanging, and Hispanic assimilation need not be steady over time. RK identified very real gains among immigrants in the period prior to the Great Recession, but my analysis suggests these gains have to a large degree evaporated in the wake of the recent downturn. To fully understand the immigrant–union relationship, and to avoid the perils of ahistoricism, we need to examine data col-lected in bad times as well as good times at a relatively fine level of detail.
at ASA - American Sociological Association on March 29, 2013asr.sagepub.comDownloaded from

330 American Sociological Review 78(2)
APPenDIx
table A1. Odds Ratios Predicting Employed Worker Transitions to Unemployment in a One-Year Period
2004 to 2006 2006 to 2008 2008 to 2010
Union .995(–.06)
.804*(–2.56)
.882*(–2.12)
Race (White ref.) Black 1.622*
(5.93)1.600*
(6.25)1.737*
(9.71) Hispanic 1.083
(.97).908
(–1.27)1.063
(1.10) Other race 1.199
(1.70)1.056(.54)
1.108(1.38)
Male .941(–1.02)
1.059(1.04)
1.078(1.81)
Married .625*(–8.63)
.594*(–10.35)
.650*(–11.47)
Age (exper.) .989(–1.25)
.965*(–4.35)
.982*(–2.93)
Age sq. (exper. squared) 1.000(.45)
1.000*(3.41)
1.000*(2.37)
Education (<HS ref.) High school .876
(–1.57).744*
(–3.92).800*
(–3.74) Some college .671*
(–4.35).607*
(–6.20).736*
(–4.79) BA + .616*
(–4.51).505*
(–6.98).580*
(–7.19)Private Sector 1.578*
(3.81)1.416*
(3.34)1.809*
(7.21)Occupation (professional/managerial reference) Farm/forestry/fishery 1.658
(1.94)1.421
(1.24).882
(–.57) Production/craft/repair 1.469*
(4.14)1.350*
(3.60)1.338*
(4.95) Service occupations 1.311*
(3.45)1.247*
(3.09)1.149*
(2.63)Industry (Ag. ref.) Mining .098*
(–3.32).877
(–.36)1.014(.06)
Construction .923(–.36)
1.610*(2.10)
1.379*(2.03)
Manu. durables .707(–1.58)
1.116(.48)
.958(–.27)
Manu. nondurables .663(–1.79)
.964(–.15)
.653*(–2.54)
Transportation .385*(–3.75)
.908(–.39)
.603*(–2.96)
Communications .864(–.56)
.955(–.17)
.785(–1.26)
Utilities .391*(–2.74)
.532(–1.82)
.391*(–3.97)
(continued)
at ASA - American Sociological Association on March 29, 2013asr.sagepub.comDownloaded from

Catron 331
AcknowledgmentsI gratefully thank Jake Rosenfeld and Meredith Kleykamp who blindly sent their MORG recode and Matching do files. I would also like to acknowledge Andrew Schrank, Melissa Binder, John Roberts, Dale Willits, Jessica Garrick, and the anonymous ASR reviewers for their insightful comments and helpful suggestions and assistance.
notes 1. The United States has experienced only two reces-
sions since the CPS began to identify immigrants in 1994. This comment is focused on the Great Reces-sion of 2008, but I also found some evidence of a delayed recession effect from the 2001 dot- com crash in 2002, when Hispanic and Hispanic-immigrant unemployment increased (Hout, Levanon, and Cumberworth 2011) (results avail-able upon request). Furthermore, RK’s Figure 2 shows potential recession effects for Hispanics in most recession periods (the interesting exception being the 1981 to 1982 recession, which until recently was the most severe postwar recession).
2. All CPS datasets were downloaded from the National Bureau of Economic Research (http://www.nber.org/cps). My own files used to recode
and merge the NBER data are available upon request in addition to all supplementary analyses.
3. By keeping the positive selection of only respon-dents who remain employed, I implicitly controlled for those who were more likely to lose a job during the recession.
4. The logistic regressions control for the labor market and firm size variables defined by RK (for a list of covariates used, see Rosenfeld and Kleykamp [2009] Table A2, p. 935). The multinomial logistic regressions control for the labor market position variables, regional dummies (as opposed to state fixed effects following RK), and year.
5. I also compared 2006 with 2008, but these results show similar but less severe declines.
6. The notable differences, namely marital status showing nonsignificance, may be because RK had a larger sample spread over several years.
7. The recession effects occur for Hispanic immigrants. 8. Milkman (2006) argues that kinship among immi-
grants in the workplace and community is the foundation for building solidarity among workers. This, along with previous organizing experience and a shared experience of stigmatization, is why immigrants have a higher propensity to organize. However, if there is a high co-ethnic unemployment rate, workers may fear exercising co-ethnic solidar-ity if there is a strong chance of losing their jobs.
2004 to 2006 2006 to 2008 2008 to 2010
Wholesale trade .619(–1.90)
.813(–.82)
.620*(–2.68)
Retail trade .895(–.53)
1.040(.18)
.627*(–3.04)
F.I.R.E. .569*(–2.43)
1.037(.15)
.565*(–3.43)
Business repair .939(–.28)
1.184(.73)
.873(–.83)
Personal services .751(–1.23)
1.003(.01)
.612*(–2.82)
Rec./entertain. 1.019(.07)
1.025(.09)
.603*(–2.62)
Professional services .532*(–2.93)
.728(–1.42)
.477*(–4.73)
Public admin. .510*(–2.39)
.434*(–2.84)
.287*(–5.70)
Unclassified .494(–1.65)
1.078(.20)
.530*(–1.99)
Region/metro/year Yes Yes Yes
N 105,533 106,022 105,174
Note: z-statistics are in parentheses. Data come from the CPS-MORG Matching for appropriate years. Models weighted with the appropriate CPS weights. F.I.R.E. refers to financial, insurance, and real estate industries.*p < .05 (two-tailed tests).
table A1. (continued)
at ASA - American Sociological Association on March 29, 2013asr.sagepub.comDownloaded from
332 American Sociological Review 78(2)
9. Unemployment increased slightly in the years after the 2001 dot-com crash. See note 1 for the analysis looking at this period.
10. See Table A1 in the Appendix for results.11. I do not report the odds of joining a union because
the economic downturn reduced the number of people who report this status. However, the odds of joining a union (as opposed to never being in a union) increased or remained similar over the three periods for many of the race/ethnicity categories compared to native whites. Whereas these groups’ preference for union jobs may have increased, union joiners are not able to replace union leavers during the recession.
12. The exception being the nonimmigrant other race category, which largely consists of Asian Americans.
ReferencesHout, Michael, Asaf Levanon, and Erin Cumberworth.
2011. “Job Loss and Unemployment.” Pp. 59–81 in The Great Recession, edited by D. B. Grusky, B. Western, and C. Wimer. New York: Russell Sage Foundation.
Isaac, Larry W. and Larry J. Griffin. 1989. “Ahistori-cism in Time-Series Analyses of Historical Process: Critique, Redirection, and Illustrations from U.S. Labor History.” American Sociological Review 54:873–90.
Milkman, Ruth. 2006. L.A. Story: Immigrant Workers and the Future of the U.S. Labor Movement. New York: Russell Sage Foundation.
Rosenfeld, Jake and Meredith Kleykamp. 2009. “Hispan-ics and Organized Labor in the United States, 1973 to 2007.” American Sociological Review 74:916–37.
Waldinger, Roger and Claudia Der-Martirosian. 2000. “Immigrant Workers and American Labor: Challenge . . . or Disaster.” Pp. 49–80 in Organizing Immigrants: The Challenge for Unions in Contemporary Califor-nia, edited by R. Milkman. Ithaca, NY: ILR Press.
Peter Catron completed his master’s degree in sociology at the University of New Mexico in 2011. His thesis addressed patterns of unionization among Hispanic immigrants in the United States. He began working on his PhD at UCLA in the fall of 2012.
at ASA - American Sociological Association on March 29, 2013asr.sagepub.comDownloaded from