the state of networking in osg - indico.fnal.gov fileosg is working to better monitor, manage and...
TRANSCRIPT

The State of Networking in OSGMarch 21, 2018Shawn McKee

Vision: Networks Supporting Science While some of us are interested in (or worried about!)
networks it is fair to say most scientists would rather not have to think about them.◦ Ideally networks are “transparent” and always do the right thing,
allowing data to move as fast as possible, from anywhere to anywhere at anytime
The challenge is twofold:◦ Networks underlie all our distributed infrastructures and must work
well for us to use our grids, clouds and HPC resources.◦ Problems in the network can be very hard to identify, isolate and fix
OSG is working to better monitor, manage and diagnose our networks for all our benefit.
3/21/2018 OSG AHM 2
OSG Networking Area Mission OSG Networking was added at the beginning of OSG’s second 5-year
period in 2012 The “Mission” is to have OSG become the network service data
source for its constituents◦ Information about network performance, bottlenecks and problems
should be easily available.◦ Should support our VOs, users and site-admins to find network
problems and bottlenecks.◦ Provide network metrics to higher level services so they can
make informed decisions about their use of the network (Which sources, destinations for jobs or data are most effective?)
The GOAL: to make the most out of the networks we have!
3/21/2018 OSG AHM 3

Components of OSG NetworkingOSG networking has a number of components We measure the network using a global perfSONAR deployment We control the perfSONAR measurements centrally (meshconfig) We visualize the network measurements in numerous ways including
MaDDash, Kibana and Grafana dashboards We aggregate and make available not only perfSONAR metrics but
also data transfer (FTS), flow (ESnet and LHCOPN) and interface statistics (ESnet)
We provide an analytics capability for the data stored in our Elasticsearch instance at U Chicago◦ This includes our prototype network alarming and alerting services◦ Data is accessible in numerous ways including via Jupyter, Kibana and RESTful
APIOSG AHM 43/21/2018

Current OSG Network Data Pipeline
OSG AHM 53/21/2018

Target OSG Network Data Pipeline
OSG AHM 63/21/2018
Simpler, ALL data goes to RabbitMQ bus for fanning out to users and tools
Managing perfSONAR Deployments OSG originally developed a “meshconfig” GUI built within the OIM/MyOSG
framework◦ We provided a GUI (MCA) to define and organize the regularly scheduled
tests between specific sets of perfSONAR instances. ◦ The mesh-config was a huge benefit; no longer need to use email to hundreds
of system admins to make changes to network tests and their organization. The GUI made changes easy and consistent.
Problem: not able to be made easily available to others within or outside OSG. ◦ Campuses deploying many perfSONARS◦ Science VOs wanting to organize/customize their perfSONARs
The perfSONAR development team has taken over responsibility for this and will be providing updates and enhancements going forward◦ Instructions are available for campuses and Vos to deploy their own MCA from
containers hosted on GitHub◦ Next release of perfSONAR (v4.1) will change meshconfig to pSConfig (including
and updated MCA.3/21/2018 OSG AHM 7

Monitoring Metrics We use MaDDash to view metric summaries◦ Provide quick view about how networks are working
OSG hosts a production instance at: http://psmad.grid.iu.edu/maddash-webui/
OSG AHM 8
• Metrics are displayed via source-destination matrix
• Multiple dashboards (meshes) can be selected
• Custom menus link to relevant resources
• There is integrated analysis which detects common problems and provides advice
3/21/2018
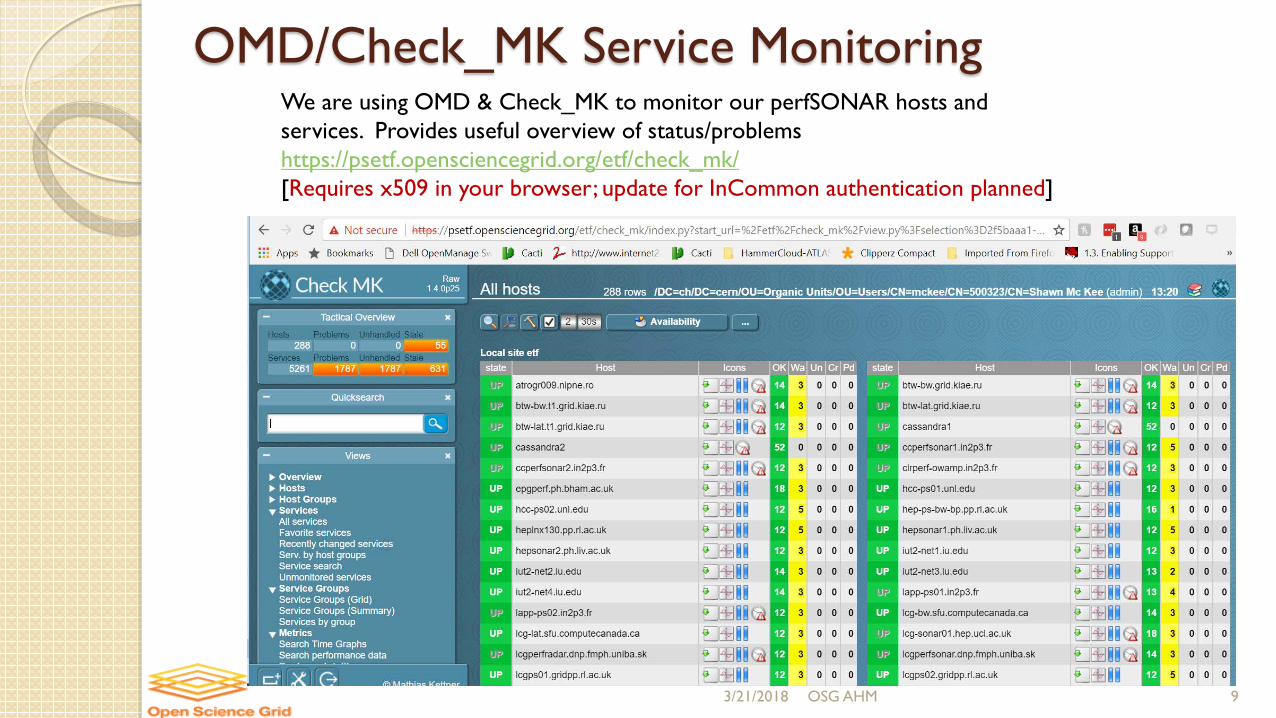
OMD/Check_MK Service Monitoring
OSG AHM 9
We are using OMD & Check_MK to monitor our perfSONAR hosts and services. Provides useful overview of status/problemshttps://psetf.opensciencegrid.org/etf/check_mk/[Requires x509 in your browser; update for InCommon authentication planned]
3/21/2018
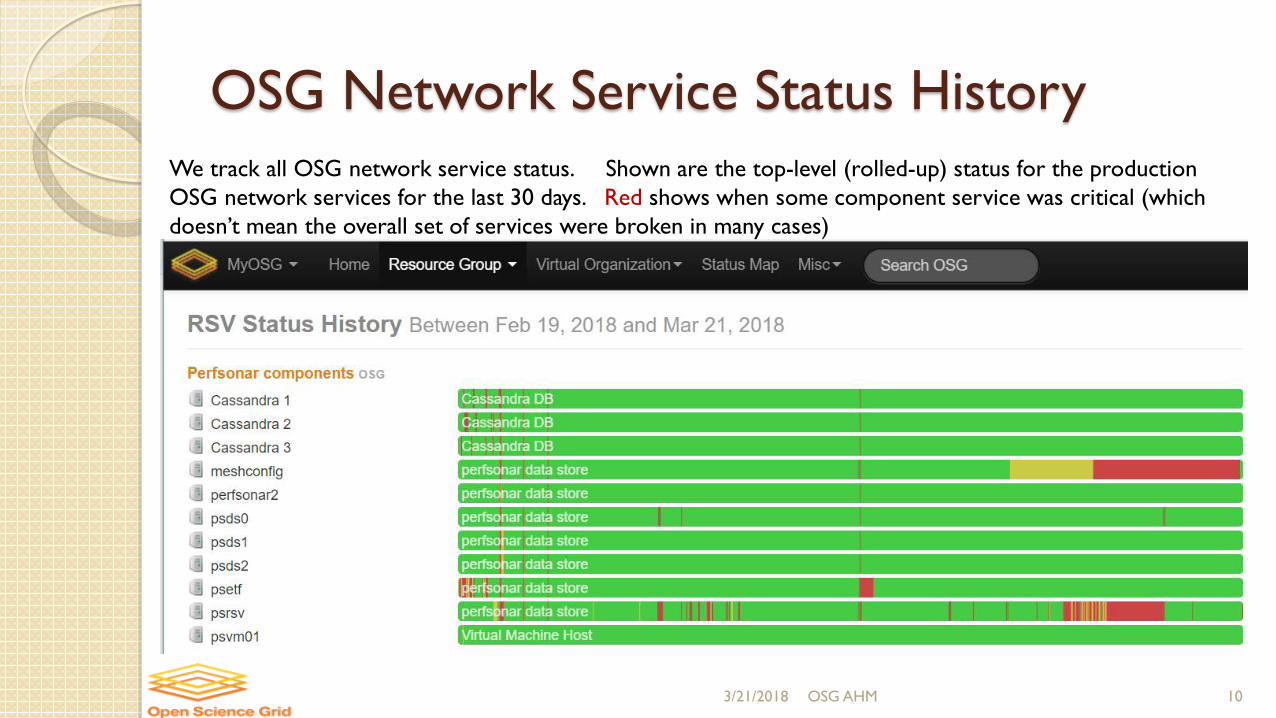
OSG Network Service Status History
3/21/2018 OSG AHM 10
We track all OSG network service status. Shown are the top-level (rolled-up) status for the production OSG network services for the last 30 days. Red shows when some component service was critical (which doesn’t mean the overall set of services were broken in many cases)

Status of Alerting and Alarming If you remember last years network presentation or saw the network
analytics presentation yesterday, you know we have a prototype alerting system in place in OSG
The alarming and alerting activity has been progressing but there have been some disruptions◦ Upgrades from the evolution of the data pipeline have, in some cases, broken
existing alarms and dashboards◦ There are still “Unknown” instances that are not correctly mapped to their
host sites by the collectors We need to fix this, perhaps by adding an updateable lookup table
Users are able to sign of for customized alerts via a Google spreadsheet.◦ Still fairly “raw”; alarms the will need to be improved to provide more user
friendly (non-expert) information
3/21/2018 OSG AHM 11

Example Traceroute Visualization via Neo4J
3/21/2018 OSG AHM 12
We have tools to query the UC Elasticsearch for network path info and can send it to Neo4J
Example from querying traceroute data from Elasticsearch for src, dest and time interval
Can hover over items to see additional info
Neo4j creates the view and handles interactions with the user
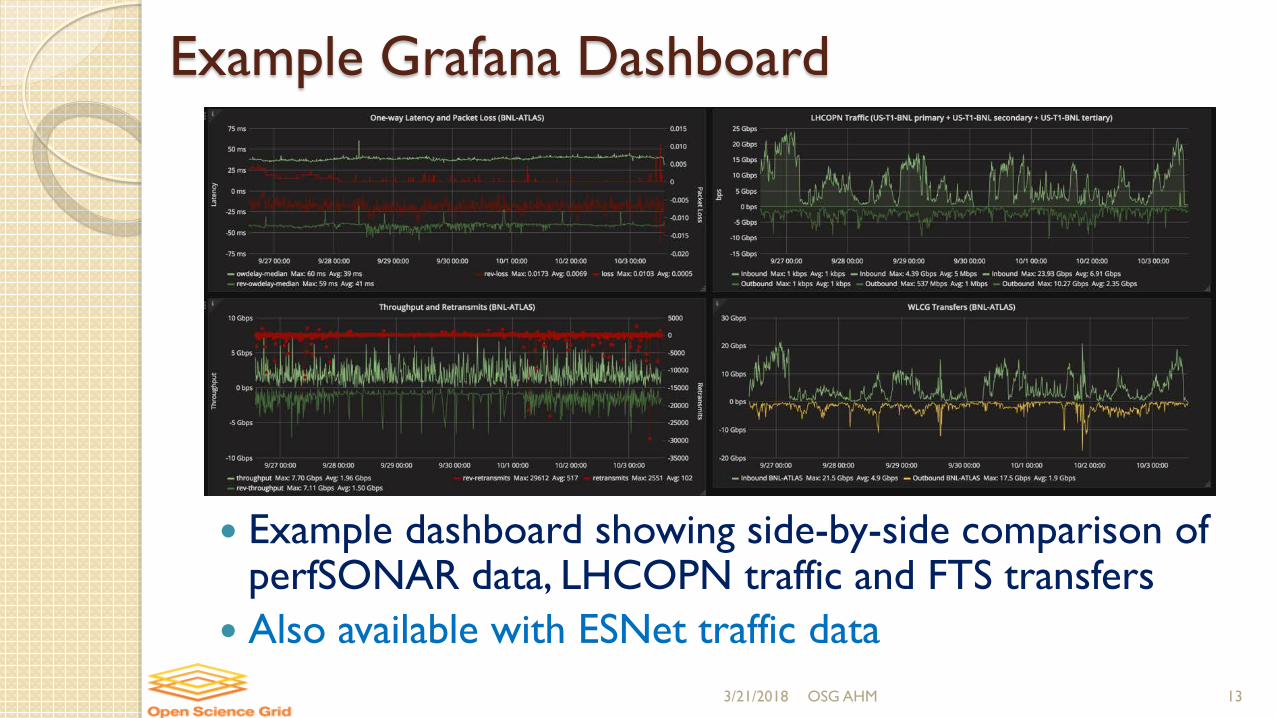
Example Grafana Dashboard
3/21/2018 OSG AHM 13
Example dashboard showing side-by-side comparison of perfSONAR data, LHCOPN traffic and FTS transfers
Also available with ESNet traffic data

LHCOPN Total Traffichttp://monit-grafana-open.cern.ch/dashboard/db/lhcopn?orgId=16
3/21/2018 OSG AHM 14

LHOPN Detailedhttp://monit-grafana-open.cern.ch/dashboard/db/lhcopn-detailed?orgId=16
3/21/2018 OSG AHM 15
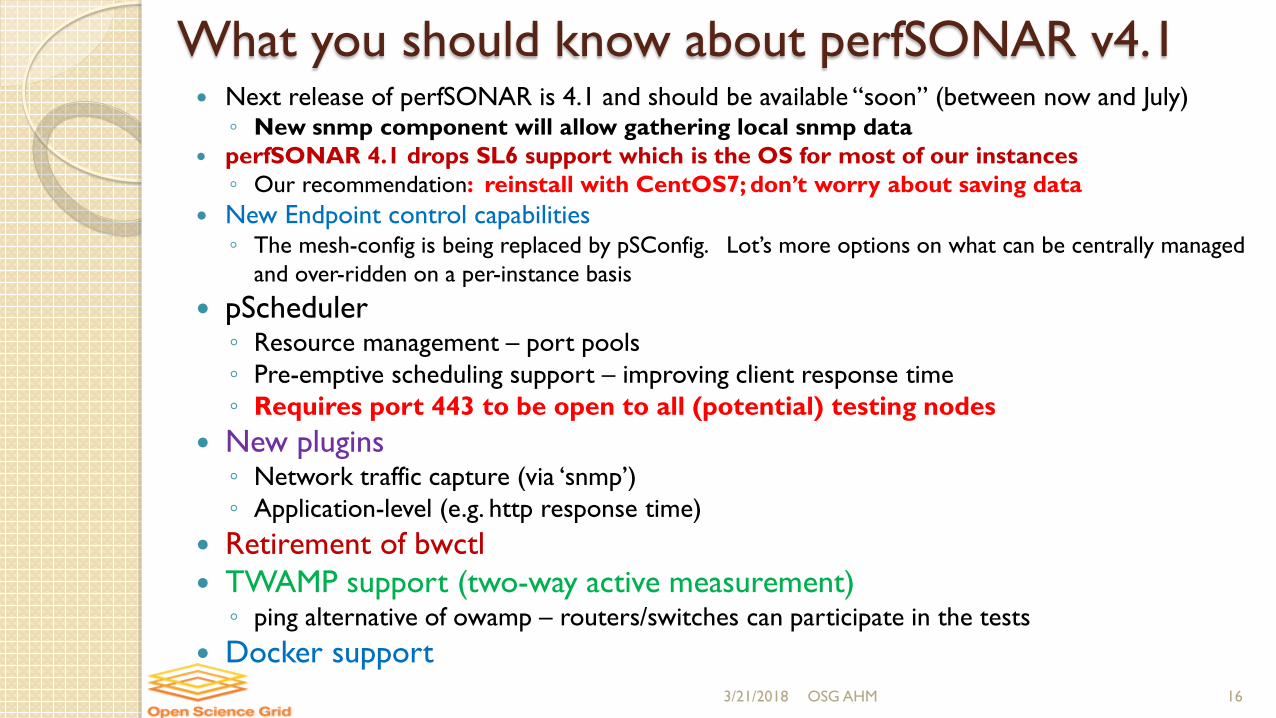
What you should know about perfSONAR v4.1 Next release of perfSONAR is 4.1 and should be available “soon” (between now and July)◦ New snmp component will allow gathering local snmp data
perfSONAR 4.1 drops SL6 support which is the OS for most of our instances◦ Our recommendation: reinstall with CentOS7; don’t worry about saving data
New Endpoint control capabilities ◦ The mesh-config is being replaced by pSConfig. Lot’s more options on what can be centrally managed
and over-ridden on a per-instance basis
pScheduler◦ Resource management – port pools◦ Pre-emptive scheduling support – improving client response time◦ Requires port 443 to be open to all (potential) testing nodes
New plugins◦ Network traffic capture (via ‘snmp’)◦ Application-level (e.g. http response time)
Retirement of bwctl TWAMP support (two-way active measurement)◦ ping alternative of owamp – routers/switches can participate in the tests
Docker support3/21/2018 OSG AHM 16
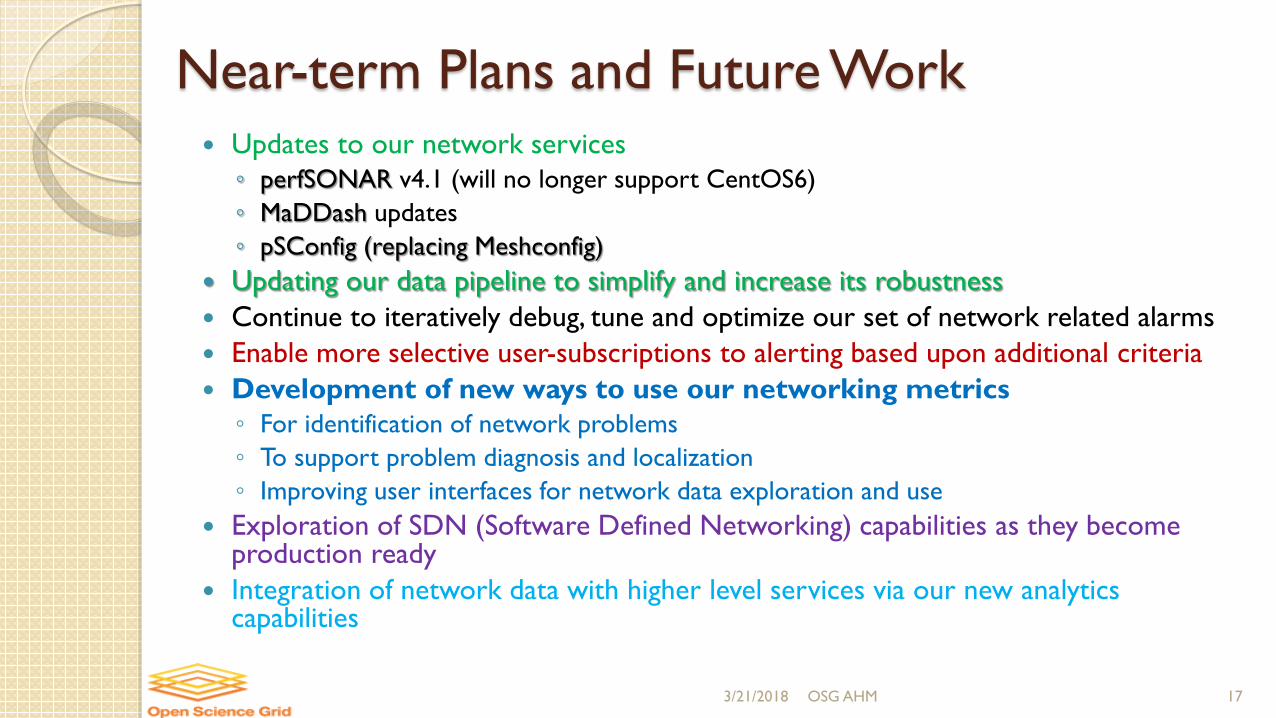
Near-term Plans and Future Work Updates to our network services◦ perfSONAR v4.1 (will no longer support CentOS6)◦ MaDDash updates◦ pSConfig (replacing Meshconfig)
Updating our data pipeline to simplify and increase its robustness Continue to iteratively debug, tune and optimize our set of network related alarms Enable more selective user-subscriptions to alerting based upon additional criteria Development of new ways to use our networking metrics◦ For identification of network problems◦ To support problem diagnosis and localization◦ Improving user interfaces for network data exploration and use
Exploration of SDN (Software Defined Networking) capabilities as they become production ready
Integration of network data with higher level services via our new analytics capabilities
3/21/2018 OSG AHM 17
Helping Out Site-Admins and Users
3/21/2018 OSG AHM 18
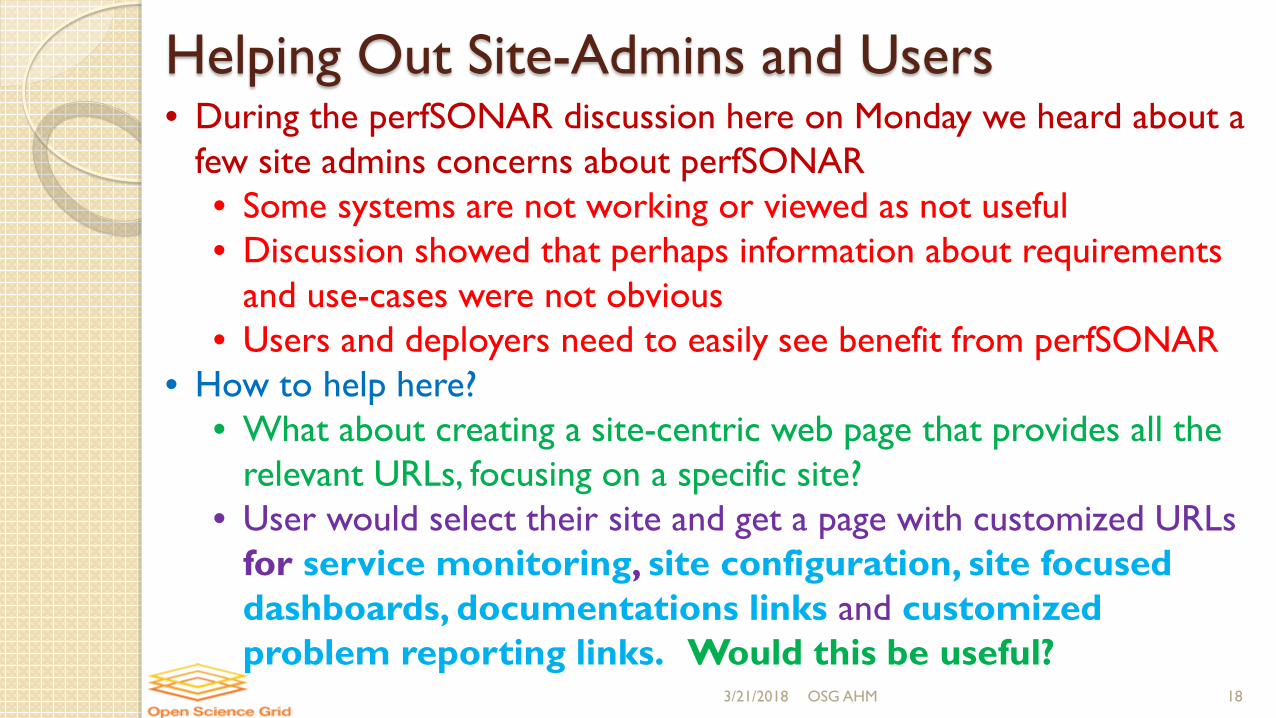
• During the perfSONAR discussion here on Monday we heard about a few site admins concerns about perfSONAR• Some systems are not working or viewed as not useful• Discussion showed that perhaps information about requirements
and use-cases were not obvious• Users and deployers need to easily see benefit from perfSONAR
• How to help here?• What about creating a site-centric web page that provides all the
relevant URLs, focusing on a specific site?• User would select their site and get a page with customized URLs
for service monitoring, site configuration, site focused dashboards, documentations links and customized problem reporting links. Would this be useful?
Summary We have made significant strides in making the network “visible” and
easier to diagnose◦ ~250 OSG/WLCG perfSONAR deployments globally All monitored, managed and orchestrated by OSG
◦ Tools to manage and maintain our infrastructure are in place◦ We have production data pipeline providing both long term storage of all
network metrics and near-realtime analytics capability New opportunities to improve our networks and their use are
possible because of the unique set of data we have◦ Exploiting the rich dataset we have is underway.◦ To automate identification of network problems and provide “targeted
alerting” remains a high priority.◦ To inform and enable higher level services, researchers and users
We are soliciting additional help to explore and extract value from this unique dataset we have created. Contact me if interested!!
3/21/2018 OSG AHM 19

Questions or Comments?
Thanks!
3/21/2018 OSG AHM 20

References
Network Documentation
https://opensciencegrid.github.io/networking/
Modular Dashboard Prototype http://maddash.aglt2.org/maddash-webui
OSG Production instances for OMD, MaDDash and Datastore https://psetf.grid.iu.edu/etf/check_mk/ http://psmad.grid.iu.edu/maddash-webui/ http://psds.grid.iu.edu/esmond/perfsonar/archive/?format=json
Mesh-config in OSG https://meshconfig.grid.iu.edu/
3/21/2018 OSG AHM 21

Extra Slides
3/21/2018 OSG AHM 22

Primary Features of MCA Gathers and organizes information on hosts from a combination of
sources◦ Can import perfSONAR global lookup service entries◦ Able to gather information from registration databases like GOCDB and OIM
Auto-completion / entry of values Context dependent user interface (see Testspecs) Can be easily installed outside of OSG Provides a RESTful interface to allow easy monitoring and software-
controlled config◦ https://meshconfig-itb.grid.iu.edu/apidoc/
Supports filtering and dynamic host groups◦ Can now build dynamic meshes, e.g., all CentOS7 hosts who are members of
the CMS community Able to support both perfSONAR 3.x and 4.x
3/21/2018 OSG AHM 23

Infrastructure Alerting
March 6, 2018 LHCONE-RAL 24
We have monitoring of the network dataflow into the Elasticsearch instances
Emails are sent to the core OSG/WLCG team if there are issues seen (drastic changes in information flow)
The email plot is clickable and can take us to a Timelionvisualization accessible via Kibana
OSG Networking and End-to-end Most scientists just care about the end-to-end results: ◦ How well does their infrastructure support them in doing
their science? Network metrics allow OSG to differentiate end-site
issues from network issues. There is an opportunity to do this better by having
access to end-to-end metrics to compare & contrast with network-specific metrics. ◦ What end-to-end data can OSG regularly collect for such a
purpose? ◦ Is there some kind of common instrumentation that can be
added to some data-transfer tools? (NetLogger in GridFTP, having transfers "report" results to the nearest perfSONAR-PS instance?, etc)
◦ Let’s try to put all the information we have together…
3/21/2018 OSG AHM 25

Software Defined Networks and OSG Within the next few years evolving technology in the
area of Software Defined Networking(SDN) may be able to provide OSG researchers with the ability to construct their own Wide-Area networks with specified characteristics.
What will OSG be able to do to integrate this type of capability with the rest of the OSG infrastructure?
We are planning for how best to enable evolving capabilities in the network for OSG users and admins. We need to address:◦ What is the impact on the OSG software stack?◦ What strategic modifications/additions/tools are useful?
3/21/2018 OSG AHM 26