the state of community management 2017
TRANSCRIPT
The State of Community Management2017
Leveraging Investment to Create Strategic Value
With support from:

2THE COMMUNITY ROUNDTABLE: STATE OF COMMUNITY MANAGEMENT 2017

3THE COMMUNITY ROUNDTABLE: STATE OF COMMUNITY MANAGEMENT 2017
Table of Contents
Welcome From the Founders of TheCR
The Community Maturity Model
Using this Research
Methodology and Demographics
Community Maturity Overall
Where Community Resides
Strategy
Leadership
Culture
Community Management
Content and Programs
Policies and Governance
Tools
Metrics and Measurement
SOCM2017 in Summary
The ROI Conundrum
Understanding Patterns in Community Maturity
What’s Next for Communities?
About TheCR and TheCR Network
Acknowledgments
5
6
22
26
1412
15
16
20
24
32343638
42
40
4446
49
48
51
7
23
28
810
This publication features data and analysis from The State of Community Management 2017 survey received through March 2017. Community professionals are encouraged to take the survey – which remains open now – and receive their community scorecard
at http://the.cr/socm2017survey. Knowing your own scores will help you pull more valuable information from the survey data.
RESEARCH FINDINGS BY COMPETENCY
SUMMARY AND CONTEXT
ABOUT THE COMMUNITY ROUNDTABLE
ABOUT THIS REPORT
EXECUTIVE SUMMARY
RESEARCH FINDINGS
Trends
Key Finding: Strategy
Key Finding: Operations
Key Finding: Tactics
Where Does Community Stand in 2017?
Reflection on Past Key Findings

4 THE COMMUNITY ROUNDTABLE: STATE OF COMMUNITY MANAGEMENT 2017
At The Community Roundtable, we collaborate with clients to identify proven, practical strategies for better communities. We believe communities accelerate an organization’s potential by connecting employees and customers in meaningful ways. Clients rely on our models, practical research, and peer networks to take their communities to the next level.
The Community Roundtable has developed models and associated research platforms that inform programming in TheCR Network, our training offerings and our advisory services. These models include:
• The Community Maturity Model
• The Community Skills Framework
• The Social Executive Framework
• The Community Engagement Framework
Over 200 organizations have relied on The Community Roundtable’s services, including Adobe, Aetna, the American Academy of Arts and Sciences (AAAS), Autodesk, CA Technologies, H&R Block, Microsoft, SAP, Steelcase, The World Bank, and Verizon.
Learn more about The Community Roundtable and TheCR Network at communityroundtable.com.
Our launch partner:
Higher Logic is an industry leader in cloud-based community platforms. Over 1,000 organizations worldwide use Higher Logic to bring like-minded people all together, by giving their community a home where they can meet, share ideas, answer questions and stay connected.
Higher Logic aims to empower engagement, collaboration and community evolution, which we believe are the fundamental elements to the long-term relevance of any organization. By fostering community growth, you can open up a world of possibility. Tap into the power your community can generate for you. www.higherlogic.com.

5 THE COMMUNITY ROUNDTABLE: STATE OF COMMUNITY MANAGEMENT 2017
Welcome to The State of Community Management 2017 Welcome to the eighth edition of The State of Community Management. Thanks to your support, it has become the most read and most often cited resource in the community management space.
It also presents a challenge. How do you keep a re-source like this fresh each year when, as any com-munity manager can tell you, communities and their best practices don’t shift radically each year? We do this in three general ways.
First, our longevity has afforded us the ability to look at how the answers to questions have evolved over time. In some areas, there has been no mea-surable change – as the community field (and our survey base) expand, new communities taking the survey mask some of the progress older com-munities have made. But in other areas, such as engagement, we are seeing shifts that signal fun-damental changes in how organizations and com-munity leaders approach community. While we caution comparing year-over-year data, because our sample shifts each year, these are still import-ant takeaways.
Second, we are continually tweaking the survey to gain new insights. This year, for example, we took a more granular approach in our questions about policies and guidelines, as well as content and pro-grams, and we asked respondents about their own year-over-year trends. All of these are reflected in more detail in the text.
And third, we take a look back at our key findings from the 2014-2016 State of Community Manage-ment reports, to make sure what we found then still holds true today. Don’t let the annual publi-cation of the report lead you to assume the older versions are outdated. In fact, we often tell new community professionals to go back to the quali-tative SOCM 2011 and SOCM 2012 reports for ideas on how to move their communities up the levels of the Community Maturity Model.
Since our first report, our own work has evolved and grown. The Community Maturity Model has been supplemented by the Community Skills Framework, Social Executive Framework and most recently, the Community Engagement Framework, which high-lights four valuable types of engagement in com-munities: Validating, Sharing, Asking and Answer-ing, and Exploring. These core behaviors, common across community use cases, are what drive com-munities to succeed, and focusing on the value of these behaviors as they apply to your community can provide you with a structure on which to track your community maturity and success.
These are exciting – and perhaps a little scary – times for communities. We need to demonstrate, articulate and measure the value of community to new audiences, many of whom are not the ‘believ-ers’ that our early adopters were. And as we note, winning over that more skeptical audience requires new tactics. In a world drawn to the new and flashy “next big thing”, saying we need to double down on doing what we do in communities and doing it better doesn’t sound very innovative. But don’t forget, what experienced community professionals feel is ancient history is new, challenging and ex-citing for legions of new and maturing community practitioners.
We hope you find this report inspiring and encour-aging, and can use it to generate new ideas and re-inforce critical elements of creating successful com-munities. Dig in and enjoy, and share your thoughts with the #socm2017 hashtag.
Rachel Happe Jim Storer

6 THE COMMUNITY ROUNDTABLE: STATE OF COMMUNITY MANAGEMENT 2017
The Community Maturity ModelThe State of Community Management research uses the The Community Roundtable’s Community Maturity Model (CMM) as a framework for defining and evaluating the performance of communities and community management. The CMM defines the eight competencies our work has shown are required to build successful communities, and articulates how these competencies progress from hierarchical organizations to those that embrace a networked approach to their business.
The eight competencies in the model are the building blocks of a productive community.
The four maturity stages track how communities evolve.
Ideas for exploring the model can be found throughout our research. The 2011 State of Community Management Report, for example, covers the practices of each competency. The 2012 report defines how an organization moves through the stages of maturity. More recent reports measure and highlight the common elements of successful communities.
TheCR Network, our community for community leaders, provides training, weekly programming, resources, connec-tions and personal support that helps members succeed. TheCR Network members also play a key role in defining and shaping this research.
EXPLORE THE MODEL:
While our research is presented annually, each edition has its own focus and key findings, which remain valid over time. Community professionals can gather insights and ideas from any of the past reports that they can use to apply the CMM to their current community practice. You can access past reports at http//www.communityroundtable.com/SOCM.
The Community Maturity Model competencies serve as the underpinning for on-demand training in TheCR Academy. Our Community Manager Fundamentals courses provide critical skills for managing community, and Community Program Essentials gives program leaders valuable skills for integrating community into organizations.
THE COMMUNITY MATURITY MODEL IN PRACTICE:
2011 2012
TheCR ACADEMY

7 THE COMMUNITY ROUNDTABLE: STATE OF COMMUNITY MANAGEMENT 2017
Using this ResearchThe Community Roundtable’s research aims to provide immediate value to community practitioners by capturing the current practices of community management. It is framed by and structured around the Community Maturity Model, which provides a common context for talking about the different aspects of community management.
USE THIS RESEARCH TO:• Validate your approach
• Prioritize your resources
• Inform conversations with stakeholders
• Educate staff
• Assess the maturity of your program
Community program leaders have leveraged the CMM framework and related TheCR resources to build roadmaps, provide internal consulting and shape community strategy.
Community Performance BenchmarkIf you find our approach to measuring commu-nity maturity valuable and would like to dig in more deeply, TheCR’s Community Performance Benchmark can help. Benchmarking provides a valuable assessment of where your community stands along the Community Maturity Model, benchmarks your community management pro-cesses and provides you with independent, ex-perienced recommendations for strengthening your community performance.
USE THE COMMUNITY PERFORMANCE BENCHMARK TO:• Assess your community management matu-
rity – the investment that produces results
• Deliver an unbiased perspective on the pro- gress of your community program
• Justify or revise your community roadmap to ensure you hit your goals
• Identify potential gaps and unrealized opportunities
• Plan and budget smartly for the future
The Community Performance Benchmark is particularly valuable ahead of strategic and planning meetings or where more executive education is needed to ensure support for a community program.
For organizations just getting started with a community approach, The Community Readiness Audit follows a similar format with an eye toward identifying the elements most critical for getting a community approach to take root.
For more information, contact The Community Roundtable: [email protected]
• Identify gaps & opportunities in your program
• Build a roadmap
• Justify budget requests

8THE COMMUNITY ROUNDTABLE: STATE OF COMMUNITY MANAGEMENT 2017
Executive Summary: The State of Community in 2017This State of Community Management report is the eighth in TheCR’s series of annual snapshots of community management. Since its launch in 2010 as a way to capture best practices in community management, the report has evolved into an annual quantitative examination of how communities approach the strategy, operations and tactics of effective community management.
This year, we see several emerging trends that are shaping communities and reflect both the perception and reality of community management in 2017.
TREND: Optimistic perceptions foreshadow emerging success for community.For 2017, we asked for the first time not just where communities stood across a number of areas of community management and practice, but how their budgets, staffing and key indicators had changed over the past 12 months. The results were quite positive. Respondents were three times more likely to say their staffing and budgets had grown over the past year than that there had been cuts.
Perhaps more remarkable, respondents said that they had seen growth across key indicators, such as activity, questions answered and value generated. Respondents were ten times as likely to say their community or community program was generating more value year-over-year than they were to say it was generating less.
Decreased sharply
Decreased
Stayed the same
Increased
Increased sharply
Don’t know
Decreased sharply
Decreased
Stayed the same
Increased
Increased sharply
Don’t know
43%
29%
6%9%
10%
49%
30%
9% 8%
3%1%
1% 1%
3%
3%
Budget Change
Answered Questions Change Activity Change Value Generated Change
Sta�ng Change
43% 43%45%
18%
7% 7%
24%23%
3%8%
18%
5%12%
19%20%
1
2
Decreased sharply
Decreased
Stayed the same
Increased
Increased sharply
Don’t know
Decreased sharply
Decreased
Stayed the same
Increased
Increased sharply
Don’t know
43%
29%
6%9%
10%
49%
30%
9% 8%
3%1%
1% 1%
3%
3%
Budget Change
Answered Questions Change Activity Change Value Generated Change
Sta�ng Change
43% 43%45%
18%
7% 7%
24%23%
3%8%
18%
5%12%
19%20%
1
2
y/y Budget Change
y/y Answered Questions
y/y Staffing Change
y/y Activity y/y Value Generated

9 THE COMMUNITY ROUNDTABLE: STATE OF COMMUNITY MANAGEMENT 2017
TREND: Communities can demonstrate ROI – if they have the data.With increased investment and executive interest comes increased pressure to demonstrate results. However, the vast majority of respondents said they could not yet measure the value their community generated, and only a small subset of those who could measure value said they could use it to calculate the ROI (return on investment) of their community.
As we have noted in past years, the ability to measure results is a critical differentiator between average and best-in-class communities.
In an effort to give community professionals a more accessible and defensible way to measure ROI, TheCR developed a simple ROI calculator that uses the answers available in a community as the locus of value. The formula takes into account both answered questions and searches that lead to answers, and multiplies them by an average “value of an answer” to get a financial result. The search component is critical to this calculation. It provides the “networked value of community” that grows from the fact that communities are uniquely able to transparently capture and resurface vetted and verified information. However, many organizations struggle to determine the number of questions being answered in their community, and the number of times those answers were surfaced in search.
Just 15% of the communities who took the survey – 51 of 331 – were able to provide the 5 data points (number of answered questions, number of searches, search success rate, value of an answered question and community cost) to use even our simplified ROI formula.
Most remarkable, nearly 60% of communities said they had no way to know how many searches had been performed in their community. Since answering questions and searching for answers are such powerful elements of community behavior, platform vendors need to do a better job of making these critical behaviors more easily accessible in their metrics and dashboards.
But there is good news. For those community practitioners who can calculate their ROI, the results are impressive. More than half of those who said they could calculate it themselves had an ROI over 100%, and of those who provided the data needed to use our calculator, 71% had a positive ROI.
Just 9% of communities in our survey said they could calculate their community value and ROI.
VALUE
23%
VALUE& ROI
30%
VALUE
41%
VALUE& ROI
9%
Overall Best-in-Class
Can you measure value and ROI for your community?
Just 32% of communities say they can measure value, and only about 9% overall can measure ROI, too.
Best-in-class communities are better about measuring value, but even so, only 30% of the best-in-class can measure their ROI.
10 THE COMMUNITY ROUNDTABLE: STATE OF COMMUNITY MANAGEMENT 2017
KEY FINDINGS: 2017 State of Community ManagementThe growth landscape for communities is encouraging, but what kinds of things are the best communities in our sample doing that others can adopt? We examine this question each year by comparing the overall sample with a “Best-in-Class” group of communities – those who scored in the Top 20% overall on the survey scorecard. While some indicators show little variation between average and best-in-class communities, others delineate sharp differences.
Each year we highlight the most notable data in strategy, operations and tactics in our key findings. These findings tend to hold true over time, and together can provide powerful insights to accelerate your community success. (To review the key findings for the past three years – and how the research has held up – you can turn to page 16.)
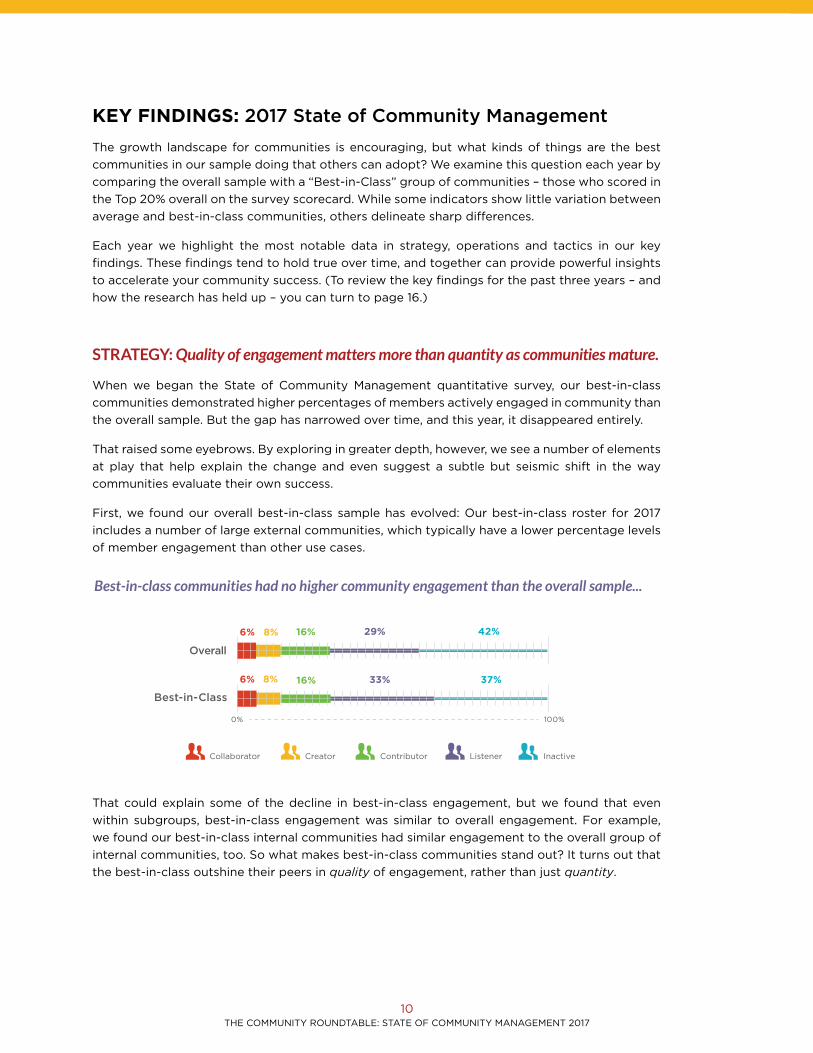
STRATEGY: Quality of engagement matters more than quantity as communities mature.
When we began the State of Community Management quantitative survey, our best-in-class communities demonstrated higher percentages of members actively engaged in community than the overall sample. But the gap has narrowed over time, and this year, it disappeared entirely.
That raised some eyebrows. By exploring in greater depth, however, we see a number of elements at play that help explain the change and even suggest a subtle but seismic shift in the way communities evaluate their own success.
First, we found our overall best-in-class sample has evolved: Our best-in-class roster for 2017 includes a number of large external communities, which typically have a lower percentage levels of member engagement than other use cases.
That could explain some of the decline in best-in-class engagement, but we found that even within subgroups, best-in-class engagement was similar to overall engagement. For example, we found our best-in-class internal communities had similar engagement to the overall group of internal communities, too. So what makes best-in-class communities stand out? It turns out that the best-in-class outshine their peers in quality of engagement, rather than just quantity.
0%
100%
37%
33%
16%
8%
6%
42%
29%
16%
8%
6%
Average Best-in-Class
Inactive
Listener
Contributor
Creator
Collaborator
0% 100%
37% 33% 16% 8% 6%
42% 29% 16% 8% 6%
Overall
Best-in-Class
Inactive Listener Contributor Creator Collaborator
Best-in-class communities had no higher community engagement than the overall sample...

11 THE COMMUNITY ROUNDTABLE: STATE OF COMMUNITY MANAGEMENT 2017
…But best-in-class outperform peers on a number of metrics around quality and community success.
Value Generated 86%
Questions Answered 73%
Active Members 73%
Value Generated Questions Answered Active Members
38% 55% 47% 67%
Best-in-Class
Questions Answered 61%
Active Members 64%
Value Generated 62%Overall
Some examples: A higher percent-age of best-in-class community managers noted gains in member activity, questions answered and value generated over the past 12 months than the overall sample. They also had a higher percentage of their content generated by mem-bers rather than formally generated by the organization.
Overall OverallBest-in-Class Best-in-Class
Value Generated 86%
Questions Answered 73%
Active Members 73%
Value Generated Questions Answered Active Members
38% 55% 47% 67%
Best-in-Class
Questions Answered 61%
Active Members 64%
Value Generated 62%Overall
Value Generated 86%
Questions Answered 73%
Active Members 73%
Value Generated Questions Answered Active Members
38% 55% 47% 67%
Best-in-Class
Questions Answered 61%
Active Members 64%
Value Generated 62%Overall
Percent of communities with significant executive participation.*
Percent of communities measuring answered questions as a metric.
*Defined as responding to, creating or collaborating on content
Best-in-class communities also reported a higher return on investment (ROI) than the overall sample – although the sample size was too small to be statistically significant.
What should you take away from this? While quantity of engagement does play a role in community success – pure activity metrics alone do not capture the overall value of community.
Therefore, the data suggest community managers should:
FOCUS EARLY ON THE BEHAVIORS YOU SEE AS MOST IMPORTANT. While there are times in the life cycle of a community that you want to prioritize activity, it should be thought of as an interim goal to inspire and reward the types of engagement that generate strategic value.
LOOK FOR WAYS TO DEEPEN MEMBER ENGAGEMENT, NOT JUST BROADEN IT. A member is a member is a member – whether they contribute once or a hundred times to your community. But which would you rather have? Find ways to capture and keep the interest of your highest-value members, whether that value is from their contributions (as advocates) or their visibility (as executive leaders). Advocacy programs, strong member programming and programs to target new members all seem to drive higher-value engagement, and are worth a focus.
EDUCATE STAKEHOLDERS ON THE DIFFERENCES BETWEEN VANITY AND VALUE METRICS. Reach and scale are numbers that can resonate with stakeholders, but they aren’t ultimately where value is derived. Helping stakeholders understand how community value is generated and what engagement behaviors support your goals can help turn skeptics into supporters.
Percent reporting growth in metric over past 12 months
Best-in-class communities noted a higher percentage of quality executive engagement than their peers.
Best-in-class communities were more likely to use metrics like influencer engagement, questions answered, time to first response and resolution, and revenue generated than their peers.

12 THE COMMUNITY ROUNDTABLE: STATE OF COMMUNITY MANAGEMENT 2017
OPERATIONS: Lasting behavior change requires more than transactional investments.
One consistent finding in The State of Community Management over the past few years has been a “bubble” of communities in Stage 2. While just over 10 percent of communities each year score in Stage 1 of the Community Maturity Model, about 60 percent are working their way through Stage 2, and only a small number move into Stage 3 or 4 each year.
Moving up the hierarchy of stages in the Community Maturity Model requires different approaches at different times – and has varying levels of difficulty. Moving from Stage 1 to Stage 2, in many ways, is driven by a willingness to invest in the critical elements of community – drafting a strategy, hiring staff, installing a platform, developing metrics, etc. All of these are critical building blocks for communities. But they have something else in common – they are largely achievable as projects, not long-term commitments. You can imagine them on a checklist. Did that... did that... did that.
Communities in Stage 3 make ongoing commitments to enable community success. It’s not just buying a platform – it’s integrating it with business systems and workflows. It’s not just hiring staff, it’s building a system to engage advocates, educate stakeholders, and develop governance structures. It’s bringing a strategy document to life by defining shared value, building roadmaps and committing resources to create the day-in, day-out content and programs to inspire, trigger and reward the engagement defined in the strategy.
It’s a larger commitment and one for which it is often hard to secure executive support because it is not seen as ‘scalable.’ It is driven by hard work of cultivating relationships and defining and encouraging desired behaviors - which are critical but difficult to ‘see’ progress on any given day. Nonetheless, it is only through this deeper commitment to a community approach that organizations can move forward. Those that make the commitment begin to see the long-term, sustainable impact community can provide.
Strategy
Leadership
Culture
Community Management
Content & Programming
Policies & Governance
Tools
Metrics & Measurement
Overall
Stage 1 Stage 2 Stage 3 Stage 4
Overall Best-in-Class
SOCM 2017 Scorecard
Overall
External
Internal
Stage 1 Stage 2 Stage 3 Stage 4
13%
12%
15%
59%
58%
61%
27%
29%
23%
1%
1%
1%
Overall Maturity Scores
13 THE COMMUNITY ROUNDTABLE: STATE OF COMMUNITY MANAGEMENT 2017
Therefore, the data suggest community managers should:
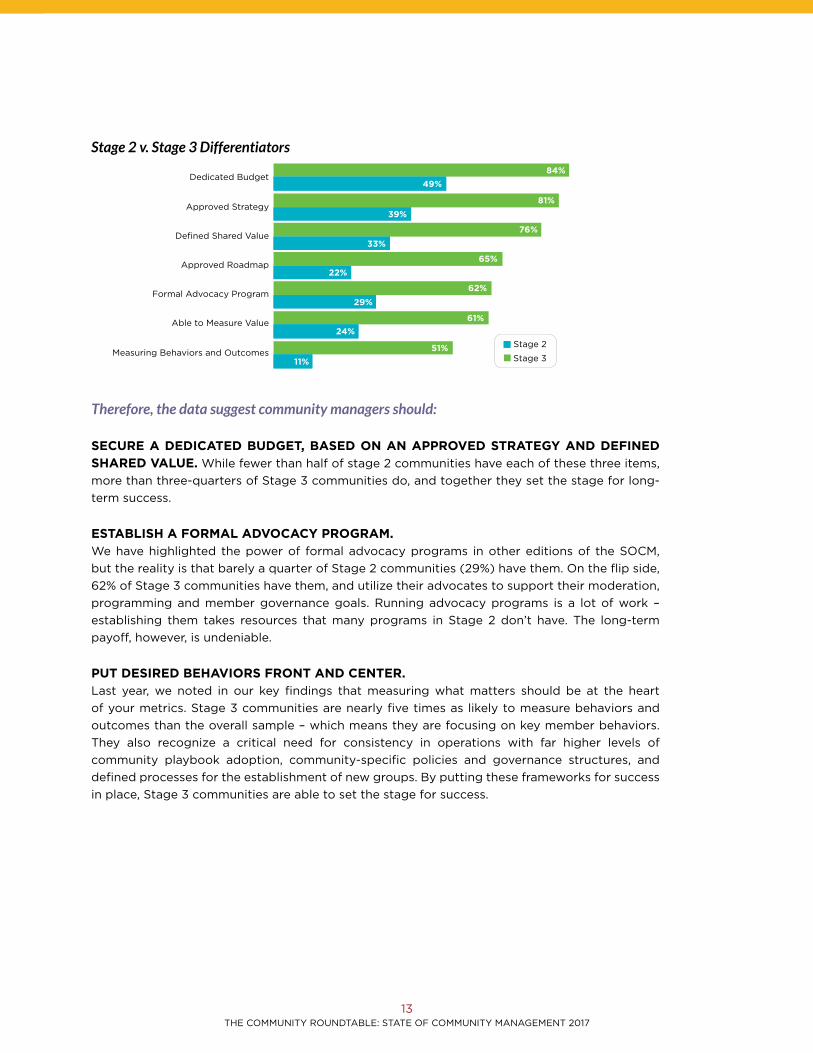
SECURE A DEDICATED BUDGET, BASED ON AN APPROVED STRATEGY AND DEFINED SHARED VALUE. While fewer than half of stage 2 communities have each of these three items, more than three-quarters of Stage 3 communities do, and together they set the stage for long-term success.
ESTABLISH A FORMAL ADVOCACY PROGRAM.We have highlighted the power of formal advocacy programs in other editions of the SOCM, but the reality is that barely a quarter of Stage 2 communities (29%) have them. On the flip side, 62% of Stage 3 communities have them, and utilize their advocates to support their moderation, programming and member governance goals. Running advocacy programs is a lot of work – establishing them takes resources that many programs in Stage 2 don’t have. The long-term payoff, however, is undeniable.
PUT DESIRED BEHAVIORS FRONT AND CENTER. Last year, we noted in our key findings that measuring what matters should be at the heart of your metrics. Stage 3 communities are nearly five times as likely to measure behaviors and outcomes than the overall sample – which means they are focusing on key member behaviors. They also recognize a critical need for consistency in operations with far higher levels of community playbook adoption, community-specific policies and governance structures, and defined processes for the establishment of new groups. By putting these frameworks for success in place, Stage 3 communities are able to set the stage for success.
Dedicated Budget
Approved Strategy
Defined Shared Value
Approved Roadmap
Formal Advocacy Program
Able to Measure Value
Measuring Behaviors and Outcomes
49%
39%
33%
22%
29%
24%
11%
84%
81%
76%
65%
62%
61%
51%Stage 3
Stage 2
Stage 2 v. Stage 3 Differentiators

14 THE COMMUNITY ROUNDTABLE: STATE OF COMMUNITY MANAGEMENT 2017
The data suggest that community managers and program owners:
START COMMUNITY PROGRAMS IF YOU HAVE NOT DONE SO ALREADY. Programming complements your community content, and it creates opportunities to connect members around common interests in ways content production alone fails to achieve. Programming also triggers opportunities for interaction through member-generated dialog.
MAKE PROGRAMS A PROACTIVE PART OF YOUR STRATEGIC PLAN. While responsiveness to short-term member needs is important, have a program plan in place that connects with your community strategy and annual roadmap. Content and programs need to reflect the shared value of community, and a program plan tied more closely to strategy can generate the engagement behavior that is most valuable for the community. Without a strategic anchor, it’s easy to fall into the trap of creating programming for the most recent squeaky wheels that may not provide value to other members.
THINK OF COMMUNITIES AS EDITORIAL OPPORTUNITIES.Integrating community programs with editorial calendars does numerous things. It leverages the organizational editorial processes to enhance the community’s stature in the organization or market. It ensures better connectivity between organizational content and learning opportunities. And it creates opportunities to leverage the power of community discussions and program elements for your larger organizational content needs. Editorial elements can drive traffic to community programs, and great program insights can be repurposed into new elements with real value that highlight member or user voice.
TACTICS: Connecting content and programs to strategy accelerates community success.
More is not better, when it comes to community content and programs. In this year’s survey, there was no difference in the frequency of programs between average and best-in-class communities that offered community programming and the overall sample.
So if everyone is offering the same amount of community programs – why are best-in-class communities outperforming their peers? The answer is strategy. Best-in-class communities are about twice as likely to integrate their programming calendar with their community strategy, and to connect community programs with their functional group’s (or organization’s) editorial calendar. The community program works hand-in-glove with larger strategic elements, making the community a central piece of the organization.
41% 76% 37% 69%
Overall OverallBest-in-Class Best-in-Class
Percentage of communities with content aligned with community strategy
Percentage of communities with program plans aligned with community strategy

15THE COMMUNITY ROUNDTABLE: STATE OF COMMUNITY MANAGEMENT 2017
Where Does Community Stand in 2017?The community market is no longer nascent. Innovators and early adopters have had communities for many years. We have entered mainstream adoption – both of customer communities and of internal employee communities. Getting to this point has taken the work of hundreds of organizations and thousands of people, and we have only gotten here because communities have great stories to tell. It is awesome to see and it’s something to celebrate.
Success, however, is not without its challenges and in the community space we have plenty.
SHIFTING PROGRAM EXPECTATIONS
Executives increasingly see the need and opportunity that communities provide – but that doesn’t necessarily mean they understand the dynamics of communities and how they deliver value. The need for concise and easy-to-absorb executive education is growing – and it is driving our interest in providing research and services around ROI, dashboards and training.
Community professionals need to focus on translating “community speak” to the larger organization, as well. Early community adopters often had the advantage of stakeholders on the executive team drawn to community approaches. This new round of executives is likely to be less knowledgeable or more risk-averse, and will need help understanding basics of community that we often take for granted.
SHIFTING COMMUNITY MANAGEMENT NEEDS
As the community market matures, organizations need to integrate communities into core functions and workflows as well as report their progress in financial terms. The need for community professionals with strong business and program management skills is growing. The availability of candidates with both strong business and community management skills is not growing as quickly, in part because those are both complex skill sets to develop. Organizations, however, are still looking to find those unicorns who can do it all and they are mostly coming up short. On the other
side, many community professionals with years of community management experience are not getting opportunities because they lack business skills.
Savvy organizations will recognize that the best way to move forward is to apply people with business skills in the organization to the community effort. This can close the skills gap, and it is another way to connect the community approach into the larger organization. But until organizations accept that they will need to hire and manage for multiple roles and skills, this frustration is likely to continue.
SHIFTING VENDOR MARKETPLACE
We have seen a reduction in organizations that are buying technology ahead of developing a community approach. However, in too many cases, we still see technology driving community-related decisionmaking, rather than supporting it. There are more organizations than ever adopting social networking or community technology, but generally with less entrepreneurial zeal and understanding than the early adopters. Because the size of the market has grown, there are also more vendors jumping into the fray. Together that has created more, not less, confusion. In the absence of good information, organizations risk treating community as a ‘feature’ of a larger bigger technology platform instead of a management construct enabled by sophisticated technology. They also run the risk of surrendering control over their community strategy to technology partners who may not have their specific community goals at heart.
We see in our research and in our work that the leading community programs are growing – in value, activity, community management resources and impact on their organizations. The great news for everyone else is that the lessons in how to build high value community programs is out there, if the organization is willing to learn.
Rachel Happe

51THE COMMUNITY ROUNDTABLE: STATE OF COMMUNITY MANAGEMENT 2017
The State of Community Management 2017 would not be possible without the support and advice of the members of the SOCM Working Group from TheCR Network.
Research is a shared value in the Network, and these members stepped up to:• Review and give feedback on the goals and timeline
• Raise issues and opportunities for insightful new and revised questions
• Explore issues related to specific aspects of the 2017 survey
• Support and advocate for participation from community professionals across the globe
The input and counsel of the skilled and experienced members of TheCR Network helps en-sure this report and the insights derived from it are as practical and useful for community managers and program owners as possible.
We couldn’t do it without you – thank you!
Acknowledgments
The Community Roundtable Team – 2017
Shannon Abram Rachel HappeJillian Bejtlich
Ted McEnroe Emma Nicholas
Hillary Boucher
Jim Storer
Georgina Cannie Jerry Green
Rachael SilvanoKelly SchottLauren Keeler
Judi Cardinal Akamai
Marjorie AndersonProject Management
Institute
Becky ScottCisco
Rachel MedanicTalk Social to Me
J.J. LovettCA Technologies
Ted HoptonMcGraw-Hill Education
Lori Harrison-SmithSteelcase
Jennifer HonigTechstra Solutions
Eileen ForanLimelight Networks
Jay Graff JM Family Enterprises
Chris Catania Esri

Web: http://communityroundtable.comEmail: [email protected]
TheCR Academy: http://the.cr/TheCRAcademy
Connect with us:
For the full State of Community Management 2017 report, including:
• Analysis of communities across all eight competencies of theCommunity Maturity Model• Strategy• Leadership• Culture• Community Management• Content and Programs• Policies and Governance• Tools• Metrics and Measurement
• Success strategies from Best-in-Class Communities
• A closer look at community staffing and how communitiesdefine value
• Plus, a detailed look at community ROI
Download the full SOCM 2016 at http://the.cr/socm2017

Web: http://communityroundtable.comEmail: [email protected]
TheCR Academy: http://the.cr/TheCRAcademy
Connect with us: