the socio economic drivers of rural electrification in sub-saharan africa
TRANSCRIPT
SEEDS SURREY
Surrey Energy Economics ENERGY
Discussion paper Series ECONOMICS
CENTRE
The socio economic drivers
of rural electrification in
Sub-Saharan Africa
Oona Nanka-Bruce
August 2010
SEEDS 128 Department of Economics ISSN 1749-8384 University of Surrey

The Surrey Energy Economics Centre (SEEC) consists of members of the Department of Economics who work on energy economics, environmental economics and regulation. The Department of Economics has a long-standing tradition of energy economics research from its early origins under the leadership of Professor Colin Robinson. This was consolidated in 1983 when the University established SEEC, with Colin as the Director; to study the economics of energy and energy markets.
SEEC undertakes original energy economics research and since being established it has conducted research across the whole spectrum of energy economics, including the international oil market, North Sea oil & gas, UK & international coal, gas privatisation & regulation, electricity privatisation & regulation, measurement of efficiency in energy industries, energy & development, energy demand modelling & forecasting, and energy & the environment.
SEEC research output includes SEEDS - Surrey Energy Economic Discussion paper Series (details at www.seec.surrey.ac.uk/Research/SEEDS.htm) as well as a range of other academic papers, books and monographs. SEEC also runs workshops and conferences that bring together academics and practitioners to explore and discuss the important energy issues of the day.
SEEC also attracts a large proportion of the department’s PhD students and oversees the MSc in Energy Economics & Policy. Many students have successfully completed their MSc and/or PhD in energy economics and gone on to very interesting and rewarding careers, both in academia and the energy industry.
Enquiries:
Director of SEEC and Editor of SEEDS: Lester C Hunt SEEC, Department of Economics, University of Surrey, Guildford GU2 7XH, UK. Tel: +44 (0)1483 686956 Fax: +44 (0)1483 689548 Email: [email protected] www.seec.surrey.ac.uk
i
___________________________________________________________
Surrey Energy Economics Centre (SEEC)
Department of Economics University of Surrey
SEEDS 128 ISSN 1749-8384
___________________________________________________________
THE SOCIO ECONOMIC DRIVERS OF RURAL ELECTRIFICATION IN
SUB-SAHARAN AFRICA
Oona Nanka-Bruce
August 2010 ___________________________________________________________
This paper may not be quoted or reproduced without permission.
ii
ABSTRACT
A significant proportion of the population in sub-Saharan Africa live in the rural areas, with the majority living on less than US$1 per day. Access to electricity is considered an essential element in the sustainable development of rural areas and an enabler for countries to achieve their Millennium Development Goals. This paper contributes the first analytical study of the socio-economic factors which have a significant impact on rural electrification (RE) development in sub-Saharan Africa. The study employs cross-sectional data for 24 of the 47 countries in the sub-Saharan region and finds factors including the Human Development Index, wealth distribution, institutional development and urban population size of a country to have a significant impact on RE development. A detailed policy survey of four countries from the sample; two countries categorised as over-performing (Nigeria and Madagascar) and two as under-performing (Tanzania and Chad), highlights that collaboration with international partners, integration of national policies and strategies and the use of renewable energy sources enhances the development of rural electrification in sub-Saharan Africa. Keywords: rural electrification; socio-economic factors; developing countries; Sub-Sahara Africa; sustainable development; MDGs; econometric modelling; policy survey.

The socio economic drivers of rural electrification in Sub‐Saharan Africa Page 1 of 34
The socio economic drivers of rural electrification in Sub-Saharan Africa
Oona Nanka-Bruce
Principal Power Systems Engineer Power Networks and Energy Strategic Consulting
Parsons Brinckerhoff Westbrook Mills
Godalming Surrey
GU7 2AZ UK
Tel: +44(0)1483-528775 Fax: +44-(0)1483-528987
Email: [email protected]
1. INTRODUCTION
Poverty is a major obstacle for sustainable development not only for developing countries but also the
entire world. This is acknowledged by the United Nations member states who adopted the Millennium
Declaration, committing their nations to a new global partnership to reduce extreme poverty and setting
out a series of time-bound targets - with a deadline of 2015 - that have become known as the Millennium
Development Goals (MDGs)1. The partnership also includes a number of international organisations
including the World Bank, International Monetary Fund, International Fund for Agricultural Development
and World Health Organization. Although some countries are on track to meet the goals, other countries,
particularly in Sub-Saharan Africa are not2. Tackling poverty has therefore become one of the main
objectives of multilateral donors, such as the World Bank and other organisations, together with economic
growth. One way of alleviating poverty is to promote access to modern energy, in particular to
electricity3.
In Sub-Saharan Africa, the rural population make up a significant proportion of the total population, where
in most of the countries over 60 percent live in rural areas. The rural communities are key to increased
Note This research was supported by Lester C. Hunt, Director of SEEC, University of Surrey. I would like to thank Joanne Evans, also from SEEC for valuable suggestions and comments on earlier drafts of the paper, and Mr Ian Harlow, Principal Economist at Parsons Brinckerhoff for his assistance with data sources. The views expressed are those of the author.

The socio economic drivers of rural electrification in Sub‐Saharan Africa Page 2 of 34
economic production and social progress; however their contribution to the economy is muted due to
inadequate policies, strategies and institutional frameworks for development. Electrification is seen as a
crucial element in the sustainable development of the rural areas4.
One major use of rural electrification (RE) is for lighting, which brings benefits of increased study time
and improved study environment for school children, extended hours for small businesses, and greater
security. Another common use is for television, which provides both entertainment and information such
as health programmes. Thus electrification is thought to bring an improved quality of life. There is also a
greater willingness of health and education workers to stay in communities that have electricity5.
In the past RE projects have been assessed purely on financial terms and therefore deemed not viable.
However in recent years there has been a shift in methodology for assessing the benefits of RE to include
its impact on social welfare, which makes RE projects more acceptable.5
The majority of the research to date on electrification in developing countries considers either how (rural)
electrification projects should be evaluated; how to assess the impact of electrification on poverty
reduction and/or economic development; energy demand modelling to assess the relationship between
electricity consumption and socio-economic factors such as economic growth, quality of life (education,
health) or outlines the progress of electrification projects in developing countries.
A significant number of studies focus on developing countries in Asia, predominantly China and India,
using energy modelling to examine the relationship between rural electrification and rural development.
Kanagawa3 (2008) developed an energy economic model on rural areas for one State in India, using cross-
sectional data. The research assessed the relationship between access to electricity and the advancement
of the socio-economic conditions in the rural areas, with a focus on poverty reduction. Kanagawa
concluded that the literacy rate above 6 years could be explained by household electrification rate, sex
ratio and road density per 1000km sq, emphasising how educational improvements could be attained
through access to electricity. Although the paper provides a good assessment of the relationships between
electricity consumption and other socio-economic factors such as GDSP (gross domestic state products)
The socio economic drivers of rural electrification in Sub‐Saharan Africa Page 3 of 34
and literacy rate, the focus is at the household level, and based specifically on the electricity consumption
of lighting appliances.
Shiu6 (2004) uses time series data from 1971 to 2000 to examine the causal relationship between
electricity consumption and real GDP using the error-correction model for the whole of China. Shiu finds
that for China there is a unidirectional Granger causality going from electricity consumption to real GDP
but not the other way. The paper summaries the empirical findings of causality tests between
energy/electricity and income for 11 Asian countries, which shows that for some countries unlike for
China, real GDP drives energy consumption whereas in others there is a bi-directional relationship
between energy consumption and real GDP. Shiu concludes that one of the reasons for the unidirectional
relationship in China results from the lack of electricity access to a large number of the rural population
due to insufficient capital investment in power sector infrastructure and high tariffs. The paper
recommends that the government accelerate rural electrification.
Yang7 (2003) analysed the impact of rural electrification on poverty reduction and rural economic
development, using panel data on six provinces in China over a 20 year period, to provide
recommendations to government and investors on how best to use their limited capital on rural
electrification investment. The six provinces are categorised in pairs into well-developed, medium-
developed and least-developed rural provinces. Yang concludes that rural electrification has the largest
impact on economic growth in well-developed rural provinces and least impact in the least-developed
provinces. With respect to poverty reduction, the largest impact was evident in the medium-developed
provinces with limited impact in the well-developed and least-developed provinces. The paper provides
guidance on how to formulate policy on rural electrification depending on what the primary objectives are;
economic growth or poverty reduction.
The literature on rural electrification on countries in sub-Saharan Africa focuses on the assessment of
existing policies or assessing field trials. Gaunt8 (2005) examined the progress of electrification in South
Africa and the impact that decisions taken to meet social objectives of poverty alleviation had on
electrification by considering technology, financial, institutional and ethical aspects; and the implications
for other developing countries based on the South African experience. Although electrification
programmes are planned and evaluated on financial or socio-economic models, Gaunt finds that
electrification is usually carried out as a social objective to alleviate poverty and for political reasons.
The socio economic drivers of rural electrification in Sub‐Saharan Africa Page 4 of 34
These multiple objectives for electrification cause confusion when formulating policy as reviews of
electrification programmes based on socio-economic objectives have shown that the projects do not
always meet all the objectives. The research found that financial constraints and a better understanding of
customer requirements led to innovative research and development and the adoption of revised procedures
and new technologies. This produced cost effective electrification programmes and prompted the
extension of access to electricity in rural areas.
Ilskog & Kjellström9 conducted field studies based on a methodology developed by Ilskog10 for the
evaluation of rural electrification projects with respect to sustainable development. The methodology
considered the use of 39 indicators which covered five aspects of sustainability; technical, economical,
social/ethical, environmental and institutional. The field studies were conducted for seven rural areas in
Eastern and Southern Africa, to assess whether the contribution of rural electrification projects by the
private sector or non-governmental organisations were more effective with regards to sustainable
development than where rural electrification was the responsibility of government utilities. The authors
concluded that government utilities performed better from a social/ethical perspective whereas the private
organisations managed client relationships better. However, they point out that it is difficult to draw
general conclusions from the studies due to the size of the sample used and the conditions under which the
studies were conducted. Rural electrification is a developmental issue and therefore the proposed
methodology which takes into account various aspects of sustainability is a better way of evaluating a
project compared to a pure financial assessment. The methodology is also at the micro level and therefore
there will be greater confidence in the accuracy of the data used for the assessment. However, the
significant amount of information required for the evaluation process will present difficulty in most cases.
It is also not clear how the conclusions drawn could be translated at the macro level to assist policy
makers in decision making.
Bhattacharyya & Timilsina11 (2009) conducted a survey to establish the most appropriate energy demand
models for developing countries when modelling energy demand. The policy paper examines different
types of energy demand modelling techniques; econometric, end-use approach, input-output, scenario and
hybrid. They ascertain that although most of the mentioned models may be suitable for developed
countries, they are not suitable for developing countries because of factors such as poor quality of
information, and the fact that usually the past and future are not on the same trajectory due to structural
changes and economic transition. Bhattacharyya & Timilsina consider end-use models to be more
appropriate for developing countries and conclude that models for developing countries should include
The socio economic drivers of rural electrification in Sub‐Saharan Africa Page 5 of 34
factors such as rural energy, informal economies, structural economic change, technological diversities,
investment decisions, rural-urban divide and inequity. The focus of this paper is on energy supply rather
than energy demand modelling, however, the work by Bhattacharyya & Timilsina provides useful insight
into the difficulties associated with energy modelling of developing countries.
There are many facets of (rural) electrification; impact on economic growth, poverty reduction,
improvement in the quality of life, and the complexity in project evaluation. The literature review
highlights the factors which are important in developing a model; including economic factors such as GDP
and capital investment but also social factors such as equity11, social development7,8,9,10, institutional
development and technology8,9,10. However, there is no evidence from literature that an econometric study
has been conducted on the sub-Saharan Africa region. The objective of this paper is to determine the
socio-economic drivers which have a significant impact on rural electrification in sub-Saharan Africa.
Bearing in mind the difficulties associated with energy modelling for developing countries11, the paper
also conducts a policy survey on four countries which are atypical from the norm to corroborate the
econometric modelling and to provide additional information which shows good practice in the region.
The significance of conducting a study for the whole region is that the experiences obtained on countries
over-performing the general trend would assist other countries in the region in improving rural
electrification development.
2. METHODOLOGY
To determine the socio-economic factors which have an impact on the rate of rural electrification in Sub-
Saharan Africa we develop an econometric model on 24 countries and go on to conduct a policy survey on
four countries selected from the econometric analysis.
In line with the literature7,8,9,10, the econometric model for rural electrification uses cross-sectional data
and takes into account institutional, economic and social factors. Technological factors are excluded from
the model, because technology is usually a time varying factor with no way of measuring technical
progress across countries.

The socio economic drivers of rural electrification in Sub‐Saharan Africa Page 6 of 34
The general form of the econometric model used in the regression is:
REi = f(Yi, HDIi, GIi, FDIi , IDi, NAIi, UPi) (1)
where RE (rural electrification) is the percentage of rural population who have access to electricity, and is
the dependent variable. Y (GDP/capita) is an economic measure of a country’s income per person and is
used to measure the economic development. It is expected that the greater the development of a country
the higher will be the level of rural electrification, and therefore one would expect a positive relationship
with RE. HDI (Human Development Index) is used to rank countries by their level of "human
development". The HDI combines normalized measures of life expectancy, literacy, educational
attainment, and GDP per capita for countries worldwide and is also a measure of a country’s development.
One would therefore expect a positive relationship with RE. GI (Gini Index) is a measure of statistical
dispersion most prominently used as a measure of inequality of income distribution or inequality of wealth
distribution. A low Gini coefficient indicates more equal income or wealth distribution and is usually
associated with developed countries. However, a high Gini coefficient indicates a more unequal income
distribution and is usually associated with a developing country. RE is higher in developed than
developing countries and therefore one would expect a negative relationship between GI and RE.
An increase in FDI (Foreign Direct Investment) would enable a country to have more funds available to
implement Growth Poverty Reduction Strategy Programmes which usually involves development of rural
areas. In addition, FDI may also have a social welfare element associated with it therefore a positive
relationship with RE would be expected. The level of ID (Institutional Development) in a country is
indicated by the policies, regulatory framework in place which would encourage investment in rural
electrification by private investors, donor organisations, NGOs (non-governmental organisations) and so
on. One would expect a positive relationship with RE. This variable is based on the Country Policy and
Institutional Assessment (CPIA) ratings calculated by the World Bank’s International Development
Association (IDA). NAI (Net Aid Inflows) is usually associated with poverty reduction, and since rural
electrification is seen as one way of alleviating poverty in the rural areas one would expect a positive
relationship with RE. An increase in UP (Urban Population) could lead to an increase in revenue for the
country. Thus one would expect a positive relationship with RE. i denotes a country in the sample.

The socio economic drivers of rural electrification in Sub‐Saharan Africa Page 7 of 34
The regression will start initially with equation (2)
ln(REi) = β0 + β1*ln(Yi) + β2*ln(HDIi) + β3*ln(GIi) + β4*ln(FDIi) + β5*ln(IDi) + β6*ln(NAIi)
+ β7*ln(UPi) + ui (2)
where based on the above descriptions, it is expected that
β1 > 0, β2 > 0, β3 < 0, β4 > 0, β5 > 0, β6 > 0, β7 > 0 assuming ui ~ NID (0, σ2)
The common approach in the literature is to use natural logs because this enables the impact of the
independent variables on RE to be observed in terms of percentage changes (i.e. coefficients are
dimensionless). Various forms of equation (2) will be estimated to establish the preferred equation to be
used to explain the factors which determine the rate of rural electrification in sub-Saharan Africa. The
method of assessing the regression results will include (a) checking the statistical significance of the
coefficients and their signs with respect to prior expectations, and (b) conducting a series of diagnostics
tests (RAMSAY reset, heteroskedasticity and normality) to confirm the preferred equation.
The residuals from the preferred equation identified by the econometric study will be used to select
countries, which are considered outliers from the general trend of rural electrification for further study in
order to verify the appropriateness of the socio-economic factors determined by the econometric model.
In theory, the residuals of a regression are considered random i.e. white noise. However in this case it is
expected that the residuals would also contain information which are not explicitly explained by the
explanatory variables in the equation. The assumption12 here is that the residuals would provide
information on how countries differ from the average rural electrification trend in sub-Saharan Africa i.e.
country specific information. The residuals furthest from zero are used to determine the outliers i.e.
countries significantly different from the norm. The countries with the largest positive residuals are
considered over-performing and those with the largest negative residuals considered under-performing.
The policy survey will assess the external drivers which impact the development of rural electrification in
each country by focusing on PESTE factors (Political/institutional, Economic, Social (rural development
and specifically rural electrification, Technological (focusing on the electricity sector) and Environment).
The results of the study are then analysed to verify the suitability of the socio-economic factors
determined by the econometric model.

The socio economic drivers of rural electrification in Sub‐Saharan Africa Page 8 of 34
3. ECONOMETRIC MODEL
3.1 Data
There are 47 countries in sub-Saharan Africa. This study is based on 24 countries due to limited
availability of the necessary data on the remaining countries. Sub-Saharan Africa is divided into four
regions; West, East, Central and South. The countries to be investigated are grouped according to the
regional location of each country as classified by the United Nations Statistics Division13.
West Africa East Africa Central Africa Southern Africa
Benin Ethiopia Cameroon Lesotho
Burkina Faso Kenya Chad Namibia
Ghana Madagascar Congo, Rep South Africa
Guinea Malawi Gabon
Mali Mozambique
Mauritania Rwanda
Nigeria Tanzania
Senegal Uganda
Zambia
The sample can be considered representative of sub-Saharan Africa because the sample size is
approximately half the total number of countries, and it provides a good coverage of each region, varying
levels of development and the range of incomes.
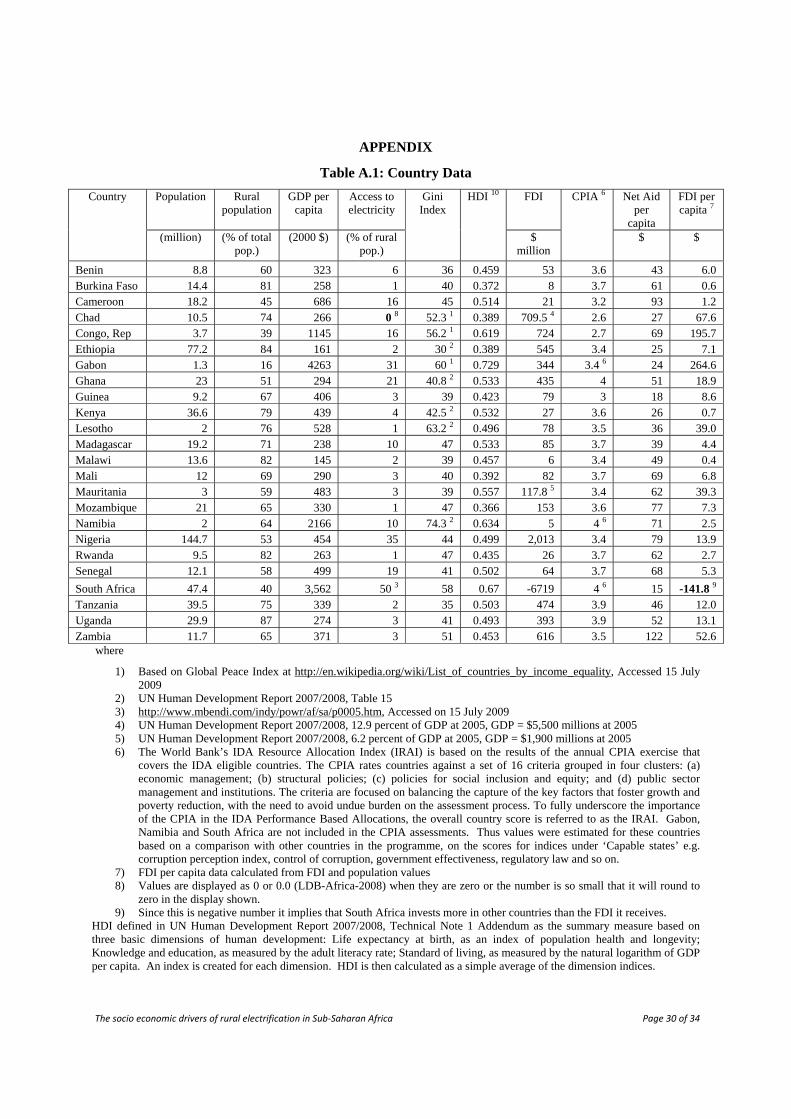
The data used in the model14 is presented for economies as constituted in 2006, with any exceptions noted.
However, the Country Policy and Institutional Assessment ratings are for 2008. The original data is
presented in the appendix, Table A.1. The percentage of urban population used in the model is calculated
from the total population and percentage of rural population. Since it is not possible to take natural logs of
values less than or equal to zero, the numbers highlighted in Table A.1 were revised as follows; a rural
electrification value of 0.1 percent was entered for Chad, and an FDI value of N/A entered for South
Africa. The regression analysis was conducted in EViews Version 615.
3.2 Empirical Findings
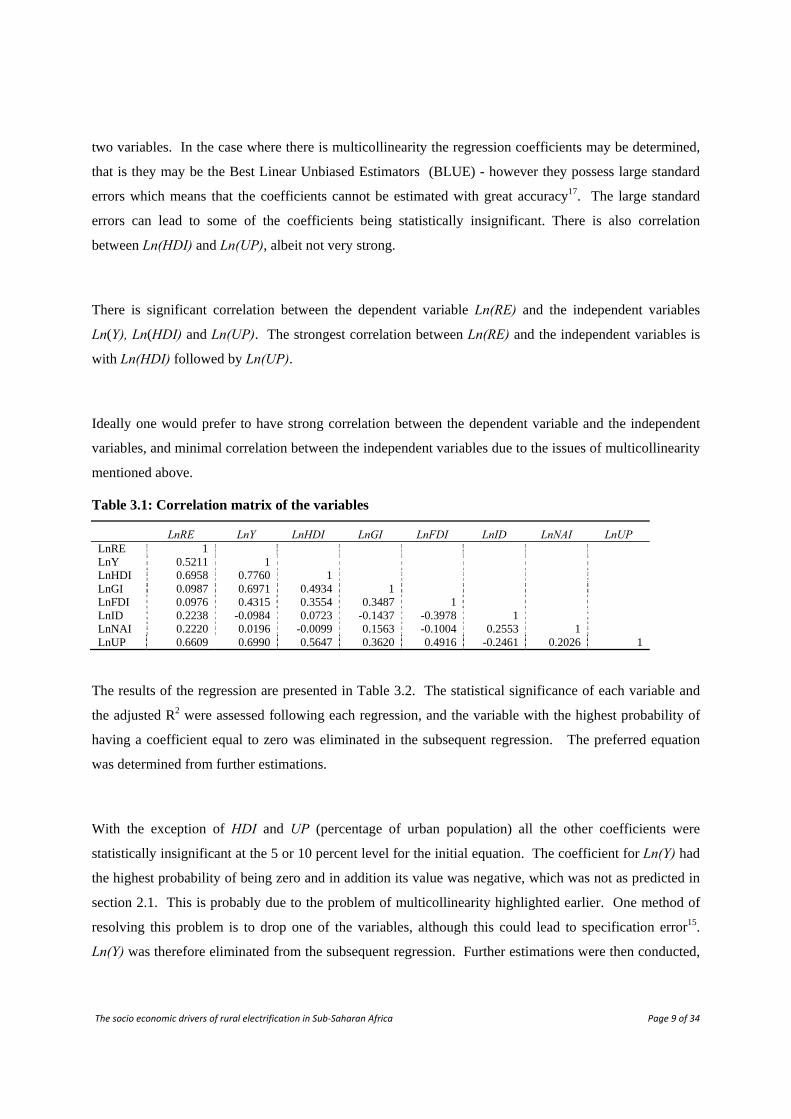
The correlation matrix in Table 3.1 gives an indication of the relationship between the variables and shows
that there is a strong correlation between the independent variable Ln(Y) and the independent variables
Ln(HDI), Ln(GI) and Ln(UP). The strongest correlation is with Ln(HDI). This is not surprising since a
third of HDI is derived from GDP per capita16, and thus there is a high degree of collinearity between the
The socio economic drivers of rural electrification in Sub‐Saharan Africa Page 9 of 34
two variables. In the case where there is multicollinearity the regression coefficients may be determined,
that is they may be the Best Linear Unbiased Estimators (BLUE) - however they possess large standard
errors which means that the coefficients cannot be estimated with great accuracy17. The large standard
errors can lead to some of the coefficients being statistically insignificant. There is also correlation
between Ln(HDI) and Ln(UP), albeit not very strong.
There is significant correlation between the dependent variable Ln(RE) and the independent variables
Ln(Y), Ln(HDI) and Ln(UP). The strongest correlation between Ln(RE) and the independent variables is
with Ln(HDI) followed by Ln(UP).
Ideally one would prefer to have strong correlation between the dependent variable and the independent
variables, and minimal correlation between the independent variables due to the issues of multicollinearity
mentioned above.
Table 3.1: Correlation matrix of the variables
LnRE LnY LnHDI LnGI LnFDI LnID LnNAI LnUP LnRE 1 LnY 0.5211 1 LnHDI 0.6958 0.7760 1 LnGI 0.0987 0.6971 0.4934 1 LnFDI 0.0976 0.4315 0.3554 0.3487 1 LnID 0.2238 -0.0984 0.0723 -0.1437 -0.3978 1 LnNAI 0.2220 0.0196 -0.0099 0.1563 -0.1004 0.2553 1 LnUP 0.6609 0.6990 0.5647 0.3620 0.4916 -0.2461 0.2026 1
The results of the regression are presented in Table 3.2. The statistical significance of each variable and
the adjusted R2 were assessed following each regression, and the variable with the highest probability of
having a coefficient equal to zero was eliminated in the subsequent regression. The preferred equation
was determined from further estimations.
With the exception of HDI and UP (percentage of urban population) all the other coefficients were
statistically insignificant at the 5 or 10 percent level for the initial equation. The coefficient for Ln(Y) had
the highest probability of being zero and in addition its value was negative, which was not as predicted in
section 2.1. This is probably due to the problem of multicollinearity highlighted earlier. One method of
resolving this problem is to drop one of the variables, although this could lead to specification error15.
Ln(Y) was therefore eliminated from the subsequent regression. Further estimations were then conducted,
The socio economic drivers of rural electrification in Sub‐Saharan Africa Page 10 of 34
each time eliminating the variables that were statistically insignificant. Equation (2D) was selected as a
preferred equation since all the coefficients were statistically significant at the 5 percent level and were of
the expected sign.
ln(REi) = β0 + β1*ln(HDIi) + β2*ln(GIi) + β3*ln(IDi) + β4*ln(UPi) + ui (2D)
This equation also produced the highest adjusted R2 value and passed all the diagnostic tests defined in
section 2.1. The strong correlation between the independent variables Ln(HDI) and Ln(UP), and the
dependent variable Ln(RE) shown in Table 3.1 is further confirmed by their presence in the final equation.
The insignificance of Ln(Y) in the initial equation was attributed to its strong correlation with Ln(HDI).
However Table 3.1 also shows a strong correlation between Ln(Y) and Ln(RE). Therefore another form of
equation (2) was considered which in this case included Ln(Y) but excluded Ln(HDI), to establish if that
equation would provide a better explanation for the rate of rural electrification. This alternative form will
be referred to as the ‘Y-model’ and equation (2D) as the ‘HDI-model’. The initial equation for the Y-
model is defined in equation (3).
ln(REi) = β0 + β1*ln(Yi) + β2*ln(GIi) + β3*ln(FDIi) + β4*ln(IDi) + β5*ln(NAIi) + β6*ln(UPi) + ui (3)
The results of the Y-model presented in Table 3.2 show that for the initial equation, with the exception of
Urban Population (UP), all the coefficients were statistically insignificant at the 5 percent level.
Institutional development (ID) was statistically significant at the 10 percent level. Further estimations led
to equation (3C) the preferred equation.
ln(REi) = β0 + β1*ln(Yi) + β2*ln(GIi) + β3*ln(IDi) + β4*ln(UPi) + ui (3C)
The coefficients of Ln(GI) and Ln(Y) were not statistically significant at the 5 or 10 percent level, and this
can be explained by the high correlation between the two variables. As discussed earlier one would
expect the standard errors to be large which would affect the t-statistic. Equation (3C) was therefore
considered a suitable equation for the Y-model, albeit with the coefficients of Ln(GI) and Ln(Y)
statistically significant at the 15 and 20 percent level respectively. Equation (3C) passed all the diagnostic
tests and the sign of the coefficients were as predicted.

The socio economic drivers of rural electrification in Sub‐Saharan Africa Page 11 of 34
Table 3.2: Regression results HDI-model Y-model
Equation 2A Equation 2B Equation 2C Equation 2D Equation 3A Equation 3B Equation 3C
C 3.8619 3.9468 2.9701 2.3360 -6.5969 -6.8348 -6.6483
(0.6907) (0.7308) (0.5719) (0.4541) (-1.1728) (-1.2788) (-1.2932)
LNY -0.0931 0.6722 0.6264 0.5838
(-0.1840) (1.2115) (1.2718) (1.3408)
LNHDI 4.8948 4.7581 4.4249 4.1751
(3.1565) (3.6062) (3.5855) (3.4022)
LNGI -2.0257 -2.1728 -1.9750 -2.1305 -2.0665 -1.9427 -2.0605
(-1.6077) (-2.3023) (-2.1978) (-2.3796) (-1.3131) (-1.3783) (-1.5377)
LNFDI -0.1652 -0.1640 -0.1760 -0.1237 -0.1285
(-1.3701) (-1.4053) (-1.5392) (-0.8261) (-0.8947)
LNID 2.1272 2.0835 2.5934 3.5757 3.8970 4.0607 4.6291
(1.1437) (1.1651) (1.5761) (2.3818) (1.7592) (2.0257) (2.5823)
LNNAI 0.2743 0.2961 0.1029
(0.6711) (0.7808) (0.2033)
LNUP 1.7334 1.6691 1.8227 1.6595 1.9645 2.0377 1.9002
(2.7983) (3.3653) (4.0499) (3.8220) (2.5569) (3.0905) (3.0845)
Diagnostics
Sample 23 23 23 24 23 23 24
Adj. R2 0.6991 0.7172 0.7237 0.7419 0.5305 0.5569 0.6206
Akaike criterion
2.5733 2.4886 2.4390 2.4246 2.9957 2.9113 2.8099
Hetero (White)
F(7,15) = 0.905 (p=0.5281)
F(6,16)= 1.068 (p=0.4212)
F(5,17)=1.024 (p=0.4346)
F(4,19)=1.160 (p=0.3593)
F(6,16)=0.557 (p=0.7579)
F(5,17)=0.649 (p=0.6659)
F(4,19)=1.19 (p=0.3472)
RAMSAY reset
F(2,13) = 1.256 (p=0.3171)
F(2,14)=1.255 (p=0.3153)
F(2,15)=1.532 (p=0.2481)
F(2,17)=2.315 (p=0.1290)
F(2,14)=0.801 (p=0.4682)
F(2,15)=0.728 (p=0.4993)
F(2,17)=0.936 (p=0.4117)
Normality (Jarque Bera)
0.5564 (p=0.7572)
0.5938 (p=0.7431)
0.0494 (p=0.9756)
1.5463 (p=0.4616)
0.5503 (p=0.7595)
0.5233 (p=0.7698)
0.6019 (p=0.7401)
Comparison of equations (2D), HDI-model, and (3C), Y-model, indicate that in addition to either HDI or
Y, for both equations the dominant socio-economic variables were GI, ID and UP. The models have
confirmed the importance of economic factors as well as social factors such as equity, social development
and institutional development in determining the rate of rural electrification as highlighted in the literature.
The only difference between the two models is whether HDI or Y should be selected. The points
considered in assessing which model provided the best explanation of the development of rural
electrification in sub-Saharan Africa were; statistical significance, average rate of rural electrification,

The socio economic drivers of rural electrification in Sub‐Saharan Africa Page 12 of 34
adjusted R2, Alkaike criterion, heteroskedasticity, functional form and non-nested tests, and these are
discussed further.
The coefficients of the independent variables in the HDI-model are all statistically significant at the 5
percent level. However, that is not the case for the Y-model as mentioned and discussed earlier. The
coefficient of the constant could be used as a measure of the average rate of rural electrification. In this
case, the constant term is statistically insignificant at the 5 or 10 percent level for both equations (2D) and
(3C). However making the assumption that some information could be obtained from this term then
equation (2D) with a constant coefficient of 2.34 estimates an average rural electrification rate of 10.34
percent. Whereas, equation (3C) with a constant coefficient of -6.64 estimates an average rural
electrification rate of 0.0013 percent. The average rural electrification rate in Sub-Saharan Africa as
determined from Table A.1 is 10.13 percent, therefore the HDI-model appears to provide a more realistic
estimate of the average rural electrification rate.
The adjusted R2 value is 0.74 for the HDI-model and 0.62 for the Y-model, which indicates that the HDI-
model better explains the rate of rural electrification compared to the Y-model. The Akaike Information
Criterion (AIC) is a measure of the goodness of fit of an estimated statistical model. The AIC is not a test
on the model in the sense of hypothesis testing, rather it is a tool for model selection. Given a data set,
several competing models may be ranked according to their AIC, with the one having the lowest AIC
being the best18. The Akaike criterion for the HDI-model is 2.42 and for the Y-model is 2.81, once again
pointing to the HDI-model being the better model. However, both models passed the heteroskedasticity,
function form and normality tests.
When you have two non-nested equations, (I) and (II), the non-nested test can be used to determine if
additional information from equation (II) is not captured in equation (I) and vice versa. To conduct the
test for equation (I), the fitted values of the dependent variable in equation (II) is included as a variable in
equation (I) and the coefficients re-estimated. If the coefficient for the fitted values is statistically
significant then there is additional information from equation (II) that is not captured in equation (I). The
test is then repeated for equation (II) using the fitted values of the dependent variable from equation (I)19.

The socio economic drivers of rural electrification in Sub‐Saharan Africa Page 13 of 34
A comparison of equation (2D) was made with equation (3C), by including the estimated fitted values of
Ln(RE) from (3C) as follows;
ln(REi) = β0 + β1*ln(HDIi) + β2*ln(GIi) + β3*ln(IDi) + β4*ln(UPi) + ψ*ln(^REYi) + ui (4)
The null hypothesis ψ = 0 was tested using the conventional t-test for ψ. Similarly, a comparison of
equation (3C) was made with equation (2D), by including the estimated fitted values of Ln(RE) from (2D)
as follows;
ln(REi) = β0 + β1*ln(Yi) + β2*ln(GIi) + β3*ln(IDi) + β4*ln(UPi) + φ*ln(^REHDIi) + ui (5)
and the null hypothesis φ = 0 was tested.
The rejection of the null hypothesis in either case suggests that there is additional information from the
alternative model not captured in the original model whereas acceptance suggests the opposite. The
regression results for ψ (equ 4) and φ (equ 5) are presented in Table 3.3, with the t-statistics in parenthesis.
Table 3.3: Results of non-nested tests
ψ -0.1904 (-0.2537)
φ 1.0493 (2.9251)
From the results, one cannot reject the null that ψ = 0 indicating that with respect to the HDI-model no
additional information can be obtained from the Y model. However, one can reject the null that φ = 0 thus
indicating that with respect to the Y-model additional information can be obtained from the HDI-model.
This shows that of the two equations, (2D) provides a better explanation of the socio-economic factors that
determine the rate of rural electrification in sub-Saharan Africa.
The series of tests suggest that the HDI-model is the preferred model which points to the fact that the
socio-economic factors which significantly impact the rate of rural electrification are:
RE = f (HDI, GI, ID, UP)
RE = 3.4*Ln(HDI) – 2.38*Ln(GI) + 2.38*Ln(ID) + 3.8*Ln(UP)
However, it is believed that the Y-model has additional information which could enhance the selection of
the countries for the detailed study.
The socio economic drivers of rural electrification in Sub‐Saharan Africa Page 14 of 34
4. ASSESSMENT OF NATIONAL POLICY
4.1 Selection of countries for further analysis
In the methodology described in Section 2.2, it is assumed that the residuals contain white noise as well as
additional information that can be used to explain the rate of rural electrification in sub-Saharan Africa.
Although the HDI model has been shown to be the preferred model for determining the rate of rural
electrification, it is believed that taking into consideration the residuals from both the HDI and Y models
would enhance the country specific information and reduce the impact of white noise. Figure 4.1 shows
the residuals obtained from equations (2D) and (3C).
To verify the suitability of using both models, the Spearman rank correlation coefficient was calculated
for the residuals from both models. The rankings of the residuals are shown in the Appendix, Table A.2.
A Spearman rank correlation coefficient of 0.824 was calculated, which shows that there is a strong
correlation between the ranking of the residuals for both the HDI and the Y models and confirms that
using the residuals from both models should enable more accurate country specific information to be
determined.
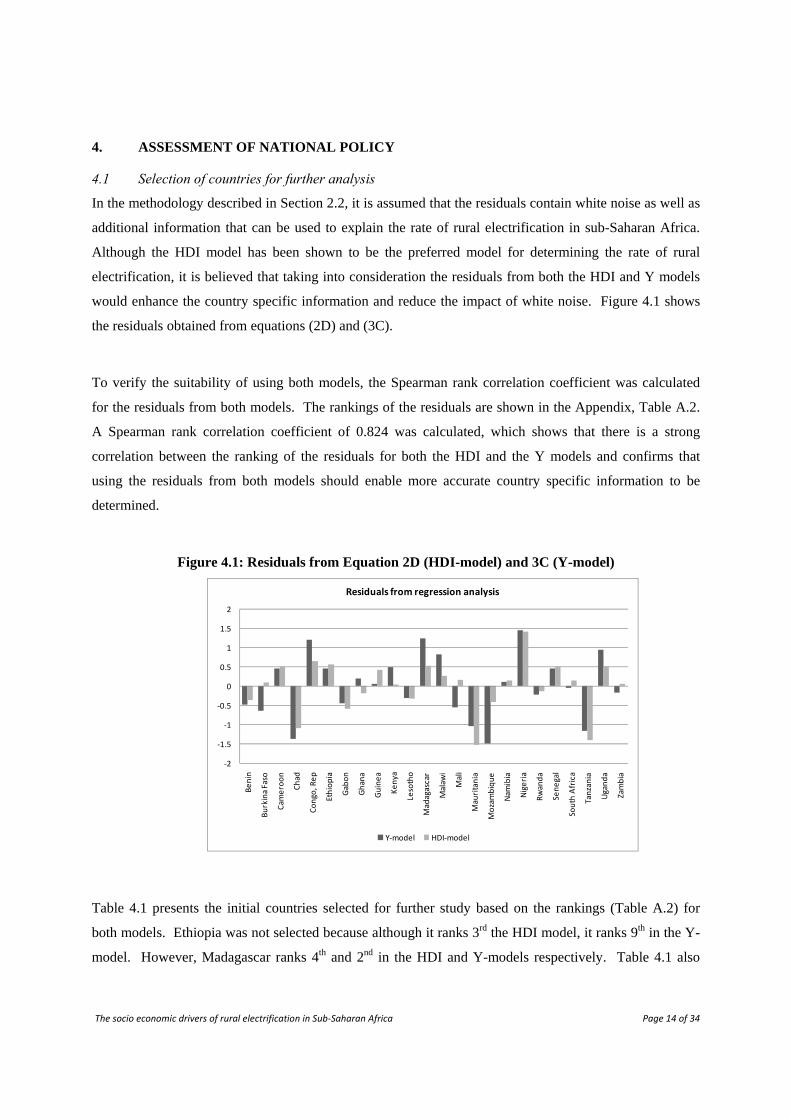
Figure 4.1: Residuals from Equation 2D (HDI-model) and 3C (Y-model)
Table 4.1 presents the initial countries selected for further study based on the rankings (Table A.2) for
both models. Ethiopia was not selected because although it ranks 3rd the HDI model, it ranks 9th in the Y-
model. However, Madagascar ranks 4th and 2nd in the HDI and Y-models respectively. Table 4.1 also
‐2
‐1.5
‐1
‐0.5
0
0.5
1
1.5
2
Benin
Burkina Faso
Cam
eroon
Chad
Congo, Rep
Ethiopia
Gabon
Ghana
Guinea
Kenya
Lesotho
Madagascar
Malaw
i
Mali
Mauritania
Mozambique
Nam
ibia
Nigeria
Rwanda
Senegal
South Africa
Tanzania
Uganda
Zambia
Residuals from regression analysis
Y‐model HDI‐model

The socio economic drivers of rural electrification in Sub‐Saharan Africa Page 15 of 34
includes information on country location and population. The additional factors of population and
location were also taken into consideration to ensure that the countries selected for the detailed survey
were also representative of the sub-Saharan African region.
Table 4.1: Initial country selection for further analysis
Countries Location Population (million)
Over-performing Nigeria West 144.7
Congo, Rep Central 3.7
Madagascar East 19.2
Under-performing Chad Central 10.5
Tanzania East 39.5
Mauritania West 3
The average country population in sub-Saharan Africa excluding Nigeria is approximately 15 million.
The average based on the countries presented in Table A.1 is 18 million, excluding Nigeria. Taking
average population and location into account, the selected countries for detailed study were Nigeria,
Madagascar, Chad and Tanzania.
4.2 Review of Country Information
The purpose of the detailed study was to determine if additional information could be obtained from the
error term to augment the results of the econometric study. The detailed study was based on information
up to 2008, and assessed the external drivers which impacted on rural electrification in each country in
relation to PESTE factors.
(a) Nigeria
Political/Institutional: Nigeria held elections in April 2007, which was the first democratic political
transition since independence in 1960. There were widespread allegations of fraud and intimidation;
nevertheless the new president assumed office peacefully and with a commitment to continue with the
economic reforms of the previous administration. The guiding framework for economic reforms is the
National Economic Empowerment and Development Strategy (NEEDS)20 which focuses on driving
economic growth, reducing poverty and achieving the Millennium Development Goals (MDGs)21.
NEEDS provides a framework for a nationally coordinated programme of action by the federal, state and
local governments. For the programme to be successful, it requires effective co-ordination between all the
The socio economic drivers of rural electrification in Sub‐Saharan Africa Page 16 of 34
tiers of government with clearly delineated roles and responsibilities for each level of government. An
Independent Monitoring Committee, co-ordinated by the business community is seen as essential to the
whole process.
The sectors that were identified as key to poverty reduction were health, education, electricity, roads and
water. These sectors received 60 percent of the total capital budget in 200420.
Economic: The leading sectors21 are oil (37.3 percent) and agriculture (31.7 percent) with other services
including telecommunications (12 percent) and general commerce (14.9 percent). Agriculture is
considered the dominant economic activity in terms of employment and linkages with the rest of the
economy. The agriculture sector comprises predominantly small farmers with low and declining
productivity20.
Nigeria’s external debt was greatly reduced in 2007. It was expected that the huge drop in external debt
and debt-servicing would make more resources available for investment in infrastructure, poverty
alleviation and security improvement.
One of the main constraints to economic growth is the extremely high level of corruption in Nigeria –
NEEDS quotes “by 1999 corruption was practically institutionalised”. It pervaded both private and
public institutions and plagued all levels of government and discouraged foreign investment in the
country. The government established the Independent Corrupt Practices Commission (ICPC) in 2000 and
the Economic and Financial Crimes Commission (EFCC) in 2003 to fight corruption.
Social: Nigeria has the largest population in Africa. 70 percent22 of the population live in the rural areas20.
The Energy Commission of Nigeria (ECN) states that the rural electrification rate in 2006 was 15
percent23 which is significantly lower than the World Bank data of 35 percent in Table A.1.
As part of implementing NEEDS, there is emphasis on state and local government developing their own
programmes, benchmarks and targets and implementing guides to reduce inefficient resource allocation
and to ensure an integrated approach to rural development which will be effective in poverty reduction.
The socio economic drivers of rural electrification in Sub‐Saharan Africa Page 17 of 34
The 2007 Progress Report24 shows the improvement in the agriculture, education and health sectors since
the implementation of NEEDS. The National Rural Electrification Program started in 1981 with the aim
of connecting all local government headquarters and a number of important towns to the national grid.
The Program was constrained by several factors including NEPA’s operational difficulties and rural
electrification being driven by political rather than social and economic reasons. The 2005 Electricity Act
also led to the creation of the Rural Electrification Agency (REA) and the Rural Electrification Fund with
a more expansive agenda of providing reliable and affordable electricity supply to all rural dwellers. The
REA inherited 1500 uncompleted grid extension projects, which are at various stages of completion25.
However allegations of fraud by the REA management could hinder the progress of RE projects.
Technological: The main sources of existing electricity generation are natural gas (70 percent) and hydro
(30 percent) (percentages are with respect to energy produced). Nigeria has an abundance of renewable
energy sources; biomass, wind, solar and small hydro plants (SHP). Increased penetration of renewables
into the energy mix is seen by the ECN as the solution to improving the quality of life and untapped
economic potential of the rural population26. The Sokoto Energy Research Centre in Nigeria has
implemented several pilot solar electrification systems sponsored by ECN in collaboration with state
governments and private organisations. Various types of rural renewable projects; public-private
partnership of SHPs, collaboration with international governments and institutions for SHPs, pilot wind
power project; are documented25.
Nigeria’s power system was deemed unreliable and incapable of meeting demand, to the point of holding
back economic progress. One of the goals under NEEDS was to deregulate and liberalize the electricity
industry to encourage private sector participation, attract investment and encourage the use of alternative
energy sources20. The 2005 Electricity Power Sector Act abolished monopoly power of National
Electricity Power Authority (NEPA), the state owned company, which led to the unbundling of NEPA.
Despite the recent changes, there remain difficulties in the power sector; supply/demand imbalance,
inefficiency in transmission and distribution, slow pace of privatization23.
Environment: More than 60 percent of the rural population depend on wood fuel for domestic and
commercial uses. This leads to deforestation, desertification, air pollution from cooking which poses
health hazards, which adversely impacts the rural population in particular25. Since 2004, environmental

The socio economic drivers of rural electrification in Sub‐Saharan Africa Page 18 of 34
protection and conservation have been scaled-up. In addition a number of institutional and policy reforms
have been established22.
(b) Madagascar
Political/Institutional: The incumbent president was re-elected in December 2006 with firm parliamentary
support for implementing the 2007 – 2012 Madagascar Action Plan (MAP)27, which was adopted in
November 2006. However, the discredited opposition won control of the capital, Antananarivo at the
local elections in December 2007. A national anti-corruption council was set up in 2003 to fight
corruption. This and other efforts such as the set up of the Independent Bureau against Corruption
improved its CPI28 from 1.7 in 2002 to 2.8 in 2005. The government is aiming for a score of 5.2 by
201221.
The driving force behind the MAP was the government’s commitment to achieving the Millennium
Development Goals (MDGs). The strategies and measurable targets defined in the MAP were SMART,
with specific agencies made responsible for each target. Implementation of the MAP involved the
development of a monitoring system29. 2007, the first year of the implementation of the MAP, involved
the development of different management, implementation and monitoring tools including the National
Integrating Monitoring and Evaluation System (NIMES). All stakeholders (government, technical and
financial partners, private sector) were involved in the development of priority indicators selected to
reflect the level of achievement of objectives under the MAP. Madagascar was selected as one of the pilot
countries for the UN Public-Private Alliance for Rural Development (UNPPA), which promotes an
integrated approach to rural development for poverty eradication and sustainable development. It
considers that the provision of roads, transport, water and irrigation, power and telecommunications are
important elements of rural infrastructure essential for rural transformation30.
JIRAMA is the national energy company for water and electricity, and is solely owned by the government.
Since liberalization in 1999, it has retained monopoly in transmission and distribution. However it is not
the sole source of electricity production as there is now private participation in power generation. The
Rural Electrification Development Agency (Agence pour le Développement de l’Electrification Rurale
(ADER)) was created in 2002, and is responsible for implementing government policy on rural
electrification. There are several partnerships with international agencies for rural development31, 32.
The socio economic drivers of rural electrification in Sub‐Saharan Africa Page 19 of 34
Political crisis since January 2009 has had a negative impact on developmental efforts30.
Economic: The dominant economic activity is in the tertiary sector (i.e. service industry – banking,
insurance, telecommunications and tourism) which contributed roughly 50 percent of GDP in 2006. The
agricultural (primary) sector is the next key sector, which contributed 27 percent of GDP in 200621. There
is significant economic activity in the rural areas comprising agriculture, ecotourism and handicrafts. The
main agricultural activities include litchi, rice, jatropha, vanilla, coffee and spices33.
Social: Over 70 percent of the country’s population live in rural areas (a range of 70 – 80 percent is noted
in various literature), with most living on less than $1 per day. Rural development is one of the key
objectives of the MAP. The Malagasy government is involved with a number of international agencies;
IFAD34, World Bank, ILO35, UNDP; to promote growth in the agricultural sector and agro-based
industry30.
The Rural Electrification Development Agency (ADER) website36 lists the existing and planned rural
electrification projects. Majority of existing rural electrification is decentralised. There is also evidence
of several planned public private electrification projects, both grid extensions and off-grid systems.
Technological: The source of electricity production mainly comprises hydropower (64 percent) and
thermal (36 percent) as at 2005 (percentages are with respect to energy produced). Fluctuations in oil
prices resulted in high production costs for thermal plant and a financial crisis for JIRAMA. This resulted
in power shortages with severe consequences to business activity37. The 2009 PRSP indicates that the
energy demand is still not being met due to technical issues (dilapidated equipment) and the continued
financial issues of the company. As a result of the problems faced by JIRAMA, the targets set for rural
electrification in the MAP have not been met. As at 2006 the restructuring of JIRAMA was still
ongoing27. However, a number of independent power producers and private investors have emerged
which have enabled an increase in installed power between 2006 to 200729.
Environment: Globally, Madagascar is one of the richest nations in terms of biodiversity; however severe
poverty could have a negative impact on the environment where poor management of agricultural
resources could lead to increased poverty and greater need for agricultural expansion. One of the key goals

The socio economic drivers of rural electrification in Sub‐Saharan Africa Page 20 of 34
of the MAP is to protect the environment by developing industries around it such as eco-tourism and
sustainable farming30.
(c) Tanzania
Political/Institutional: Tanzania is politically stable but there are growing concerns over the effectiveness
of the government to fight corruption. Civil society with the help of the media has pushed for
accountability. Parliament has backed these efforts where opposition parties have challenged alleged
corruption by government officials. The major unresolved issue is the political impasse between the
government and the major opposition party in the Zanzibar islands. However, steps are being taken to
resolve the problem ahead of the next presidential elections in 201038.
A National Energy Policy was adopted in 2003 with an objective to aid the development process of the
country by establishing an efficient energy sector in an environmentally sound manner. The Tanzania
Electric Supply Company Limited (TANESCO) is a state owned monopoly company responsible for
generation, transmission and distribution. In 2000, the power generation sector was deregulated to allow
the participation of Independent Power Producers (IPPs) and by 2009 account for 290MW39 of generation.
One of the objectives of the National Energy Policy was to encourage private sector participation in the
energy sector which was going through parliament during 2009.
The Rural Energy Agency (REA) is an autonomous body under the Ministry of Energy and Minerals, and
became operational in 2007. Its main role is to promote and facilitate improved access to modern energy
services in rural areas in mainland Tanzania. The Rural Energy Fund (REF), established at the same time,
is responsible for providing grants to qualified project developers. REF receives funds from government,
international financial organisations, multilateral and bilateral agencies and other development partners40.
Economic: Agriculture is a key economic activity which employs 82 percent of the workforce and
accounts for 60 percent of all exports. Agriculture contributes 26.5 percent21 to GDP and is a crucial
source of income particularly for the rural population. The contribution of agriculture to GDP varies in
literature (ranging from 27 to 45 percent) however it remains the dominant economic activity.
Diversification into non-farm activities in the rural areas has not been effective because they have been on
a small scale. Mining is one of the fastest growing economic sectors in Tanzania. Artisanal and small-

The socio economic drivers of rural electrification in Sub‐Saharan Africa Page 21 of 34
scale mining has been an alternative source of income for rural communities; however there are potential
problems with large-scale operators about land rights41.
Social: Over 75 percent of the country’s population live in rural areas, with the majority living below the
poverty line. Poverty in the rural areas is highest amongst households that depend on agriculture. 2
percent of the rural population have access to electricity. The target is for 15 percent of the rural
population to have access by 2015. The strategy is to use low-cost electrification for remote rural areas,
and apply renewable energies (solar, wind, biomass and mini-hydro).
The REA through the REF has funded ten projects by 2009 since its inception – all of which are grid
extensions to un-electrified commercial centers with TANESCO, the state-owned utility, as the project
developer. REA is currently collaborating with TANESCO on future projects which comprise both grid
extensions and isolated systems based on renewable sources for rural electrification42.
TaTEDO43 rural development initiatives include among others the productive uses of sustainable energy
for income generation and social services improvement – focusing on off-grid electrification. One of
these initiatives is the use of Jatropha oil to power Energy Services Platforms44, 45 which is supported at
ministerial level in government. This has the combined benefit of the provision of modern energy services
for the rural community plus income generation from growing Jatropha to alleviate poverty. The US
government through USAID has given Tanzania $5.4 million for the development of Jatropha farming in
rural areas46. TaTEDO collaborates with other international NGOs and companies through the Enabling
Access to Sustainable Energy (EASE) network. A 2006 article in the EASE newsletter suggests that there
is no consistency between the national energy policy (which aims to ensure availability of reliable and
affordable energy supplies for all in a sustainable manner) and plans relating to national economic
planning. Thus the implementation of the energy policy would require synchronisation with the policies,
plans and strategies of other sectors if they are also to achieve their development goals47.
Technological: The electricity supply comprises both grid and off-grid (isolated) systems. Hydro
accounts for roughly two – thirds of the electricity supply and thermal (natural gas/diesel generation)
constitutes the rest. Drought conditions led to a severe power crisis in recent years resulting in power
shortages. This was further compounded by high oil prices.

The socio economic drivers of rural electrification in Sub‐Saharan Africa Page 22 of 34
Tanzania has significant energy resources which include hydro, biomass, natural gas, coal, wind and solar.
However with the exception of hydro and natural gas, little of the other energy resources have been
commercially exploited.
Environment: Majority of the energy consumed is traditional biomass, predominantly wood fuel, which
constitutes about 90 percent of the total primary energy consumption. More than 80 percent of the total
primary energy, which is mainly in the form of biomass, is consumed in rural areas47. The negative
impacts of this on rural communities are several; the use of wood fuel for cooking creates indoor pollution
which leads to poor health particularly for women and children, environmental issues of deforestation and
climate change, reduced productivity and therefore income from inefficient use of energy. One of the
objectives of the Energy Policy is to address the environmental problem.
(d) Chad
Political/Institutional: Chad is a landlocked country, sharing its borders with six countries and also
considered one of the poorest in Africa. It achieved independence in 1960. The 1996 Constitution was
amended in 2005 to enable the President of the Republic to be elected several times48.
Significant oil reserves were discovered in the Doba region. Oil production which started in 2003 was
partly financed by the World Bank. 80 percent of the project royalties and dividends were to be used to
reduce poverty in the priority areas such as health, social services, education, rural development
(agriculture and livestock), infrastructure, environment and water resources. This has not materialised and
has created growing resentment towards the government which is seen as corrupt and inept in its
management of the oil revenue, leading to political tensions with attempts to overthrow the government49.
Chad Water and Electricity Company (STEE), a state owned company, holds a monopoly on the
distribution of water and electricity, with prices fixed by ministerial order according to a price structure48.
There are plans to privatise the company. A National Rural Development Strategy was presented to the
international community in 1999 to help increase productivity, crop diversification and ensure food
security in the rural areas. Although the pace of implementation is slow, there has been some
improvement in production and the dissemination of new techniques. However, a number of issues still

The socio economic drivers of rural electrification in Sub‐Saharan Africa Page 23 of 34
remain such as insufficient resources and lack of proactive policies to improve the performance of the
rural sector and particularly rural electrification50, 51.
The objectives of the 2003 PRSP50 have not been fully integrated into the daily management of national
institutions and consequently have not formed part of institutional and sectoral priorities and budgets. For
any real change to be effected, the national policies have to be incorporated into specific institutional and
sectoral programs with realistic performance indicators. Despite being oil-rich, Chad is a poor country
with limited resources and still requires extensive international assistance to finance its development and
help in implementing the sectoral strategies51.
Economic: Oil represented roughly 47 percent of GDP in 2006. The next major sector was the primary
sector; agriculture (e.g. cereal production, cotton, gum arabic) and livestock breeding; which contributed
approximately 18.7 percent of GDP in 200621. Before 2003, the rural sector was the driver of the Chadian
economy, accounting for 40 percent of GDP and employing 80 percent of the active population, majority
of whom live in the rural areas. Major exports apart from oil are cotton, live cattle and gum Arabic48.
Cotton is produced by small producers and is the main source of income in rural areas. However the fall
in international cotton prices, difficulties at Cottonchad (the state-owned cotton company), the landlocked
position of the country and the poor road infrastructure makes Chadian cotton uncompetitive and
adversely impacts the income of the rural population48.
Social: Chad is divided into three distinctive climatic zones; the Saharan desert, Sahelian and Sudanese or
tropical, each with different agricultural capabilities48. Traditional methods are still used in farming and
livestock breeding (extensive pasturing and herding are the norm). As a result both activities are heavily
dependent on climatic conditions as well as damaging to the environment50.
There is uneven distribution of basic social services (health, education, water electricity) between the
capital city and other towns, and between urban and rural areas. This results from institutional and human
shortcomings, and poor political choices. Most health and educational facilities are found in the urban
areas with majority of rural areas having no schools or health facilities. Other services; telecoms, water,
electricity, courts, prisons are only in urban areas50. Although some progress has been made in the
The socio economic drivers of rural electrification in Sub‐Saharan Africa Page 24 of 34
education and health sectors, both sectors continue to be plagued with problems such as lack of suitable
personal and resources, limited training, inadequate materials51.
Technological (Electricity Sector): Only 2 percent of the total population have access to electricity –
majority of whom live in the capital N’Djamena. 100 percent of power generation is from fossil fuel.
Despite being an oil exporter, Chad imports petroleum for power generation. Consequently its electricity
prices are one of the highest in the world38. A number of crisis measures were proposed to reduce the cost
of electricity and expand access, some of which have been implemented; a refinery at Farcha to supply
fuel for power stations, a power station at Farcha, however a national plan is required to resolve the
energy problem. A national energy strategy and rural electrification plan are at the planning stage51.
No information was found on alternative energy sources in Chad although PRSP 2007 does indicate that
solar and wind energy need to be investigated for rural electrification.
Environment: Traditional biomass (wood fuel and charcoal) provide 90 percent of the energy consumed in
Chad and is a major contributor to deforestation. Traditional methods in farming and livestock breeding
also contribute to deforestation and desertification. Environmental policies are being put in place to
protect the environment as this is seen as essential to the continuation of core economic activities and of
reducing poverty51.
4.3 Analysis
(a) Nigeria
Nigeria is politically stable as at 2009. The economic reforms started in 2004 placing rural development
at the top of the political agenda, recognising that development of the rural areas would reduce poverty,
ensure food security for the country and protect the agricultural sector which is the second source of the
nation’s wealth. The reduction in Nigeria’s external debt in 2007 should release more resources for
investment in rural development. There is integration of policies at the national, state and local levels to
ensure effective implementation of programs. In addition there is collaboration with international
governments and institutions with regards to rural electrification.
The socio economic drivers of rural electrification in Sub‐Saharan Africa Page 25 of 34
However the unreliability of grid connected supplies and the level of corruption in the country,
particularly with regards to the REA fraud allegations currently being investigated may hinder the
progress of RE. In addition, the inconsistencies in the data for the rural population and rate of rural
electrification create some doubt in the performance of Nigeria with regards to rural electrification.
(b) Madagascar
There has been significant progress in rural electrification because government policies for rural
development are at the national level. In addition, Madagascar benefits from extensive public private
partnerships with international agencies and private investors for rural development, including rural
electrification. The increase in rural electrification is one of the objectives of the MAP, and is not seen
only as a social function to eradicate poverty (i.e. improved access for individuals, education, health,
water and telecoms) but also for economic development due to extensive agriculture opportunities. Rural
electrification is considered an important indicator in the monitoring process.
There is the emphasis to further develop rural electrification to drive growth in the whole economy. One
of the constraints is the poor quality of supply by the national carrier JIRAMA. However the indication is
that majority of the planned rural electrification is off-grid. Therefore it is expected that the increase in
rural electrification would continue provided there is political stability in the country.
(c) Tanzania
Government policies indicate the awareness of the low level of electrification in the country, particularly
rural electrification and the need to develop plans and strategies for rural development to alleviate poverty
and improve the quality of life. Improving energy access is considered an important aspect of rural
development, and specific targets for rural electrification are stated in PRSP 2006. The Rural Energy
Agency only became operational in 2007 and has implemented a number of projects with several in the
planning stages. Majority of the existing rural projects are owned or supported by TANESCO and tend to
be grid extensions. Unlike Madgascar, there is limited international private investor involvement. This
may improve with the privatisation of TANESCO.
Similar to Madagascar, there are significant economic opportunities in the rural areas of Tanzania.
However public – private partnerships with international agencies and private investors are limited
The socio economic drivers of rural electrification in Sub‐Saharan Africa Page 26 of 34
although this is starting to improve (e.g. USAID for Jatropha). Therefore with better national co-
ordination in the policies of different sectors and improved international partnerships there could be
significant improvement in the rate of rural electrification in the years to come.
(d) Chad
There is virtually no rural electrification in the country. Despite being oil-rich, Chad is a very poor
country where the majority of the population, in particular the rural population, have limited access to
basic services; education, health, water and electricity. The government is seen as corrupt and having
mismanaged oil revenue to be used for poverty reduction. There appears to be no integration of policies at
the national or sectoral level and therefore it is doubtful how effective developmental programs for the
whole country, and particularly the rural population, will be in the near future. Political tensions in the
country also hinder progress since resources are then diverted to providing security for the incumbent.
International involvement is limited, particularly private investors, as a result of the poor political and
institutional environment.
The national energy and rural electrification plans are now being developed. Until there is significant
improvement in the development and implementation of institutional and sectoral programs, it is unlikely
that rural development will become a priority.
4.4 Findings of policy assessment
(a) Over-performing countries
Despite the concern with regards to data from Nigeria, there are some common factors which differentiate
over-performing (OP) countries from the under-performing (UP) countries. The countries are politically
stable and an appreciable proportion of the urban population have access to electricity which enables the
government to consider extending electrification to rural areas. Rural development and electrification is at
the top of the political agenda because it is perceived as both an economic (increasing the wealth of the
nation) and social (reducing poverty and meeting MDGs) function. Rural electrification is not seen as the
sole responsibility of government rather there is the understanding of the importance of international
public private partnerships on RE projects. This is particularly evident in Madagascar. The Institutions
are further developed; in particular the Rural Electrification Agencies have been in operation for much
The socio economic drivers of rural electrification in Sub‐Saharan Africa Page 27 of 34
longer. There is also greater collaboration between national and sector departments because of the
awareness that lack of energy access impacts other basic services; education, health and water resources.
Rural electrification in OP countries involves both grid connected and off-grid systems. The off-grid
systems comprise mini-grids and isolated systems usually based on renewable energy sources, with the
countries showing greater application and experience of alternative energy sources. Evaluating
performance of the RE programs is key to ensuring continued development. To that end, the OP countries
have Independent Monitoring bodies to assess the progress of Program objectives.
(b) Under-performing countries
Tanzania has some of the characteristics of the OP countries; it is in the initial stages of using off-grid
renewable energy sources, specifically bio-fuel technology, but its REA is in its infancy compared to the
OP countries and there is less collaboration both nationally and internationally. In addition the current
level of electrification in the country is low. However as these factors improve it is expected that the rate
of electrification would significantly improve.
Chad on the other hand has a lot of work to do in all areas assessed; institutional, economic, social and
technology. It is unlikely that the rate of rural electrification would change appreciably in the next few
years.
(c) All countries
There are some factors which are common across the countries; there is significant use of traditional
biomass in all the countries with its negative impact on the environment. Nigeria and Madagascar are
further ahead in dealing with the problem however a mental shift is required by majority of the population
in all countries. The perceived greater corruption in sub-Saharan Africa compared to developed countries.
Most of the selected countries appear to recognise the detrimental effect of corruption and are taking steps
to tackle the problem.
The socio economic drivers of rural electrification in Sub‐Saharan Africa Page 28 of 34
5. CONCLUSIONS
The rural population exceeds 60 percent in most countries in sub-Saharan Africa, majority of who live on
less than $1 per day. Most of the countries are committed to achieving the Millennium Development
Goals by 2015 which includes halving the population living below $1 per day and improving health and
education. Access to electricity is seen as an essential element in the development of the rural areas to
eradicate extreme poverty and improve the quality of life. The objective of the paper was to assess the
socio-economic factors which have a significant impact on rural electrification in sub-Saharan Africa.
The literature review indicated that a combination of institutional, economic, social and technological
factors needed to be considered when assessing rural electrification. An econometric model, using cross-
sectional data for 24 countries, was developed based on variables which took into account the above
factors with the exception of technology. The results of the econometric study indicate that the factors
which have a significant impact on rural electrification are; the Human Development Index, wealth
distribution, the level of institutional development and the size of the urban population. The
supplementary detailed policy survey conducted on four countries from the sample; Nigeria, Madagascar,
Tanzania and Chad, examined the external drivers (political/institutional, economic, social, technological
and environment) which impacted rural electrification.
The policy survey indicated that a number of issues are important to the development of rural
electrification; the level of institutional development including the collaboration of policies and strategies
of different sectors, the involvement of the international community including public private partnerships,
the focus on poverty reduction by focusing on both social (provision of basic services health and
education) and economic aspects, the concern of government to improve wealth distribution, and the
emphasis on sustainable development (i.e. the use of alternative energy sources) the benefits of which are
two-fold; reducing environment degradation as well as extending electricity access to areas beyond the
grid and possibly at lower cost.
The policy survey supports the findings of the econometric study. It also suggests that the use of
renewable energy sources and international/national collaboration plays an important role in increasing the
rate of rural electrification.
The socio economic drivers of rural electrification in Sub‐Saharan Africa Page 29 of 34
The research has shown that rural electrification has both economic and social benefits. It is therefore
recommended that other countries in sub-Saharan Africa adopt policies which take the findings in this
paper into consideration.
Recommendations for further research
The literature search indicates this is the first attempt at this type of study for sub-Saharan Africa.
Therefore further research could consider whether the use panel data would be beneficial. The detailed
study indicates that the provision of electricity by the incumbent electricity utility is inadequate. Most of
the countries are considering a form of structural reform of the industry to provide reliable supplies for
both the urban and rural population. Therefore further research could assess the impact of structural
reforms on rural electrification.
The socio economic drivers of rural electrification in Sub‐Saharan Africa Page 30 of 34
APPENDIX
Table A.1: Country Data
Country Population Rural population
GDP per capita
Access to electricity
Gini Index
HDI 10 FDI CPIA 6 Net Aid per
capita
FDI per capita 7
(million) (% of total pop.)
(2000 $) (% of rural pop.)
$ million
$ $
Benin 8.8 60 323 6 36 0.459 53 3.6 43 6.0 Burkina Faso 14.4 81 258 1 40 0.372 8 3.7 61 0.6 Cameroon 18.2 45 686 16 45 0.514 21 3.2 93 1.2 Chad 10.5 74 266 0 8 52.3 1 0.389 709.5 4 2.6 27 67.6 Congo, Rep 3.7 39 1145 16 56.2 1 0.619 724 2.7 69 195.7 Ethiopia 77.2 84 161 2 30 2 0.389 545 3.4 25 7.1Gabon 1.3 16 4263 31 60 1 0.729 344 3.4 6 24 264.6 Ghana 23 51 294 21 40.8 2 0.533 435 4 51 18.9 Guinea 9.2 67 406 3 39 0.423 79 3 18 8.6 Kenya 36.6 79 439 4 42.5 2 0.532 27 3.6 26 0.7 Lesotho 2 76 528 1 63.2 2 0.496 78 3.5 36 39.0 Madagascar 19.2 71 238 10 47 0.533 85 3.7 39 4.4 Malawi 13.6 82 145 2 39 0.457 6 3.4 49 0.4 Mali 12 69 290 3 40 0.392 82 3.7 69 6.8 Mauritania 3 59 483 3 39 0.557 117.8 5 3.4 62 39.3 Mozambique 21 65 330 1 47 0.366 153 3.6 77 7.3 Namibia 2 64 2166 10 74.3 2 0.634 5 4 6 71 2.5 Nigeria 144.7 53 454 35 44 0.499 2,013 3.4 79 13.9 Rwanda 9.5 82 263 1 47 0.435 26 3.7 62 2.7 Senegal 12.1 58 499 19 41 0.502 64 3.7 68 5.3
South Africa 47.4 40 3,562 50 3 58 0.67 -6719 4 6 15 -141.8 9
Tanzania 39.5 75 339 2 35 0.503 474 3.9 46 12.0 Uganda 29.9 87 274 3 41 0.493 393 3.9 52 13.1 Zambia 11.7 65 371 3 51 0.453 616 3.5 122 52.6
where
1) Based on Global Peace Index at http://en.wikipedia.org/wiki/List_of_countries_by_income_equality, Accessed 15 July 2009
2) UN Human Development Report 2007/2008, Table 15 3) http://www.mbendi.com/indy/powr/af/sa/p0005.htm, Accessed on 15 July 2009 4) UN Human Development Report 2007/2008, 12.9 percent of GDP at 2005, GDP = $5,500 millions at 2005 5) UN Human Development Report 2007/2008, 6.2 percent of GDP at 2005, GDP = $1,900 millions at 2005 6) The World Bank’s IDA Resource Allocation Index (IRAI) is based on the results of the annual CPIA exercise that
covers the IDA eligible countries. The CPIA rates countries against a set of 16 criteria grouped in four clusters: (a) economic management; (b) structural policies; (c) policies for social inclusion and equity; and (d) public sector management and institutions. The criteria are focused on balancing the capture of the key factors that foster growth and poverty reduction, with the need to avoid undue burden on the assessment process. To fully underscore the importance of the CPIA in the IDA Performance Based Allocations, the overall country score is referred to as the IRAI. Gabon, Namibia and South Africa are not included in the CPIA assessments. Thus values were estimated for these countries based on a comparison with other countries in the programme, on the scores for indices under ‘Capable states’ e.g. corruption perception index, control of corruption, government effectiveness, regulatory law and so on.
7) FDI per capita data calculated from FDI and population values 8) Values are displayed as 0 or 0.0 (LDB-Africa-2008) when they are zero or the number is so small that it will round to
zero in the display shown. 9) Since this is negative number it implies that South Africa invests more in other countries than the FDI it receives.
HDI defined in UN Human Development Report 2007/2008, Technical Note 1 Addendum as the summary measure based on three basic dimensions of human development: Life expectancy at birth, as an index of population health and longevity; Knowledge and education, as measured by the adult literacy rate; Standard of living, as measured by the natural logarithm of GDP per capita. An index is created for each dimension. HDI is then calculated as a simple average of the dimension indices.

The socio economic drivers of rural electrification in Sub‐Saharan Africa Page 31 of 34
Table A.2: Ranking of residuals for the HDI and Y models
HDI rank Y rank
Nigeria 1 1
Congo, Rep 2 3
Ethiopia 3 9
Madagascar 4 2
Senegal 5 7
Cameroon 6 8
Uganda 7 4
Guinea 8 12
Malawi 9 5
Mali 10 19
South Africa 11 13
Namibia 12 11
Burkina Faso 13 20
Zambia 14 14
Kenya 15 6
Rwanda 16 15
Ghana 17 10
Lesotho 18 16
Benin 19 18
Mozambique 20 24
Gabon 21 17
Chad 22 23
Tanzania 23 22
Mauritania 24 21

The socio economic drivers of rural electrification in Sub‐Saharan Africa Page 32 of 34
ENDNOTES
1 United Nations Millennium Development Goals’ web page, www.un.org/millenniumgoals, Accessed March 2009.
2 United Nations MDG Progress Monitor, http://www.mdgmonitor.org/index.cfm, Accessed March 2009.
3 Kanagawa, M., Nakata, T., “Assessment of access to electricity and the socio-economic impacts in rural areas of developing countries”, Energy Policy, No. 36, April 2008, pp 2016 – 2029.
4 Mwenechanya, J.M., “The Need for a National Rural Energy Policy and Legal and Regulatory Framework”, presentation to the Regional Conference on Enabling Environment for Private Participation in Rural Energy Service Delivery and Financing in the SADC Countries, April, 2004.
5 World Bank, The Independent Evaluation Group, The Welfare Impact of Rural Electrification: A Reassessment of the Costs and Benefits (Washington DC, 2008).
6 Shiu, A., Lam, P., “Electricity consumption and economic growth in China”, Energy Policy, No. 32, 2004, pp 47 – 54.
7 Yang, M., “China’s rural electrification and poverty reduction”, Energy Policy, No. 31, 2003, pp 283 – 295.
8 Gaunt, C.T., “Meeting electrification’s social objectives in South Africa, and implications for developing countries”, Energy Policy, No. 33, 2005, pp 1309 – 1317.
9 Ilskog, E., Kjellström, B., “And then they lived sustainably ever after? – Assessment of rural electrification cases by means of indicators”, Energy Policy, No. 36, May 2008b, pp 2674 – 2684.
10 Ilskog, E., “Indicators for assessment of rural electrification – An approach for the comparison of pears and apples”, Energy Policy, No. 36, May 2008a, pp 2665 – 2673.
11 Bhattacharyya, S. C., Timilsina, G.R., “Energy Demand Models for Policy Formulation: A Comparative Study of Energy Demand Models”, Policy Research Working Paper no. 4866, The World Bank, March 2009.
12 An assumption that the estimated residuals from a cross section equation provide additional information is also used by the UK regulator OFGEM. They use the Corrected Ordinary Least Squares method to assess the efficiency of the Distribution Network Operators by estimating using OLS, a cost function for a cross section of electricity distribution countries, with the assumption that the residuals contain information about the relative (in)efficiency of the companies. See, “Electricity Distribution Price Control Review Final Proposals”, Paper No. 265/04, UK Office of Gas and Electricity Markets (OFGEM), November 2004, www.ofgem.gov.uk
13 United Nations Statistics Division web page, http://unstats.un.org/unsd/methods/m49/m49regin.htm
14 World Bank Group – Africa Region, The Little Data Book on Africa 2008, The International Bank for Reconstruction and Development/ World Bank, (Washington DC, 2008, pp 1 – 107).
15 EViews 6, Quantitative Micro Software, Standard edition – Nov 5 2007 build, © 1994-2007.
16 UNDP, Human Development Report 2007/08 – Human Development Indicators, Palgrave Macmillan, 2007, pp 219 - 383
17 Gujarati, D.N., Basic Econometrics, 4th edition, (New York: McGraw-Hill, 2003), Chapter 10.

The socio economic drivers of rural electrification in Sub‐Saharan Africa Page 33 of 34
18 Burnham, K. P., and D. R. Anderson, Model Selection and Multimodel Inference: A Practical Information-Theoretic Approach, 2nd ed., (Springer-Verlag, 2002), ISBN 0-387-95364-7.
19 Adeyemi, O.I., Hunt, L.C., “Modelling OECD industrial energy demand: Asymmetric price responses and energy saving technical change”, Energy Economics, No. 29, 2007, pp 693 – 709.
20 International Monetary Fund, “Nigeria: Poverty Reduction Strategy Paper, National Economic Empowerment and Development Strategy”, IMF Country Report No 05/433, December 2005.
21 African Economic Outlook 2008, www.oecd.org/document/61/0,3343,en_2649_15162846_39963489_1_1_1_1,00.html, accessed September 2009.
22 The World Bank data detailed in Table 4.1 specifies the rural population as 53 percent at 2006, an indication of inconsistency in the data. Irrespective of that, the rural population remains substantial.
23 Sambo, A. S., “Renewable Energy Electricity in Nigeria: The Way Forward”, presented at the Renewable Electricity Policy Conference, Shehu Musa Yar’adua Centre, Abuja, December 2006.
24 International Monetary Fund, “Nigeria: Poverty Reduction Strategy Paper – Progress Report”, IMF Country Report No 07/270, August 2007.
25 There were plans to implement several other projects before the end of 2007. These include 85 projects proposed as constituency projects and 407 classified as priority projects. However there is no information on completed projects on the web site, www.reang.org , Accessed 24 Sep 2009.
26 Sambo, A. S., “Strategic Developments in Renewable Energy in Nigeria”, International Association of Energy Economics (IAEE) Energy Forum, Third Quarter 2009.
27 International Monetary Fund, “Republic of Madagascar: Poverty Reduction Strategy Paper, Madagascar Action Plan (MAP) 2007 – 2012”, IMF Country Report No 07/59, February 2007.
28 Transparency International World Wide Corruption Perceptions Index. The scores are out of 10.
29 International Monetary Fund, “Republic of Madagascar: Poverty Reduction Strategy Paper, Annual Progress Report for 2007 and First Semester of 2008”, IMF Country Report No 09/10, January 2009.
30 UN Public-Private Alliance for Rural Development (UNPPA), 2009 Substantive session, report to the Secretary-General, 6-31 July 2009, pp 9 – 15.
31 www.un.org/esa/coordination/Alliance/UNDP%20GSB%20In%20Madagascar.htm, accessed 15 September 2009, UNDP, Growing Sustainable Business Initiatives in Madagascar.
32 E8-fund comprises 9 leading electricity companies from the G8 countries.
33 http://pdf.usaid.gov/pdf_docs/Pdacd355.pdf , accessed 14 September 2009, USAID, Madagascar Business and Market Expansion (BAMEX), Aug 2004 - Aug 2008, Final Report.
34 International Fund for Agricultural Development
35 International Labour Organization
36 www.ader.mg, Agence pour le Développement de l’Electrification Rurale, Madagascar, accessed September 2009
The socio economic drivers of rural electrification in Sub‐Saharan Africa Page 34 of 34
37 Tim Cocks, “Powercuts and candlelight in Madagascar”, Antananarivo, Madagascar, BBC NEWS: http//news.bbc.co.uk/go/pr/fr/-/1/hi/world/Africa/4719680.stm, published 2006/02/17 09:38:39 GMT, accessed 15 September 2009
38 African Economic Outlook Report 2006, www.oecd.org/document/0/0,3343,en_2649_15162846_36563539_1_1_1_1,00.html, accessed September 2009.
39 Roughly 30 percent of total generation of 957MW at 2006, see Energy Information Administration, International Energy Statistics, http://tonto.eia.doe.gov/cfapps/ipdbproject/IEDIndex3.cfm?tid=2&pid=2&aid=7, accessed 25 September 2009
40 www.rea.go.tz, Rural Energy Agency, Tanzania, accessed September 2009.
41 International Monetary Fund, “United Republic of Tanzania: Poverty Reduction Strategy Paper, National Strategy for Growth and Reduction of Poverty”, IMF Country Report No 06/142, April 2006
42 Msofe, B. H., “Opportunities for Investments and Partnerships in the Rural Energy Sector in Tanzania”, presented at Workshop on Energy and Environment Partnership in Southern Africa, Botswana, 19 -20 Jan 2009.
43 www.tatedo.org, TaTEDO, Centre for Sustainable Modern Energy Expertise, Tanzania, accessed September 2009.
44 Sawe, E.N., “Decentralised (off-grid) rural electrification through Biofuels”, presented at the Biodiesel/MFP Business Planning Workshop, Sustainability Institute, Cape Town, South Africa, 12 March 2008.
45 Sawe, E.N., “Productive Uses of Energy from Energy Services Platforms – The case of Jatropha oil/diesel powered Energy Services Platforms (ESPs)”, presented at the African Electrification Initiative Workshop, Maputo, Mozambique, 9–12 June 2009.
46 http://allafrica.com/stories/200908171438.html, article by Happy Lazaro, 15 August 2009, accessed 21 September 2009.
47 Shuma, Jensen, “Rural Energy Agency: Opportunities and Challenges in Tanzania”, ACCESS – newsletter of Enabling Access to Sustainable Energy (EASE), volume 3, February 2006.
48 World Trade Organization, “Trade Policy Review – Report by CHAD”, WT/TPR/G/174, 11 December 2006.
49 http://www.51voa.com/VOA_Standard_English/VOA_Standard_5459.html, article by Raymond Thibodeaux, 27 April 2006, accessed 23 September 2009.
50 International Monetary Fund, “Chad: Poverty Reduction Strategy Paper”, IMF Country Report No 03/209, July 2003.
51 International Monetary Fund, “Chad: Poverty Reduction Strategy Paper - 2005 Annual Implementation Progress Report”, IMF Country Report No 07/282, August 2007.

Note:
This paper may not be quoted or reproduced without permission
Surrey Energy Economics Centre (SEEC)
Department of Economics
University of Surrey
Guildford
Surrey GU2 7XH

SURREY
ENERGY
ECONOMICS
DISCUSSION PAPER
SERIES
For further information about SEEC please go to:
www.seec.surrey.ac.uk