the silver hake stocks and fishery offthe northeastern …spo.nmfs.noaa.gov/mfr421/mfr4215.pdf ·...
TRANSCRIPT
The Silver Hake Stocks and Fishery off theNortheastern United States
E. D. ANDERSON, F. E. LUX, and F. P. ALMEIDA
Introduction
The silver hake or whiting, Merluccius bilinearis, stocks inhabiting theContinental Shelf waters off the northeastern coast of the United States havesupported active commercial fishingsince the 1930's. Fishing was conducted exclusively by the United Statesuntil distant water fleets from theU.S.S.R. began catching silver hake onGeorges Bank in 1962.
Total international landings (commercial and estimated recreational) ofsilver hake from the Gulf of Maine tothe Middle Atlantic increased fromabout 55,000 tons (100 percent U.S.)in 1960 to a peak of over 350,000 tons(15 percent U.S.) in 1965 and then declined sharply to again about 55,000tons (40 percent U.S.) in 1970. Landings during 1971-75 averaged about121,000 tons (15 percent U.S.), decreased to about 82,000 tons (31 percent U.S.) in 1976-77, and droppedfurther to 43,000 tons (67 percentU.S.) in 1978.
Distant water fleet catches have diminished steadily since 1973 due inpart to quota limitations implementedbeginning that year by the Interna-
E. D. Anderson, F. E. Lux, and F. P. Almeidaare with the Woods Hole Laboratory, NortheastFisheries Center, National Marine Fisheries Service, NOAA, Woods Hole, MA 02543.
ABSTRACT-Three stocks of silver hake,Merluccius bilinearis, are presently definedfor management purposes off the northeastern coast of the United Stares. The historical development and current status ofthe fishery is reviewed. Total internationallandings from the three stocks increased
12
tional Commission for the NorthwestAtlantic Fisheries (ICNAF) and tofurther restrictions imposed by the United States beginning I March 1977 as aresult of the Fishery Conservation andManagement Act (FCMA). UnitedStates landings have improved slowlysince 1974.
Edwards (1968) estimated that silverhake comprised the largest standingcrop of any species in the offshore areabetween the Nova Scotian shelf and theNew York Bight in 1963-65. Based oncurrent assessments of the status of thestocks in this area (Resource Assessment DivisionI), it still maintains thatsupremacy at the present time. By virtue of the available biomass and thecurrent level of landings, silver hakemust be classified as an underutilizedspecies.
This paper describes the distributionand stock definition of silver hake offthe northeastern United States, reviewsthe historical development and currentstatus of the fishery, describes the pastand present stock size estimates, anddiscusses some of the possible implications of an expanded U.S. silver hakefishery.
'Resource Assessment Division. 1978. Summaryof stock assessments August 1978. Woods HoleLab. Ref. 78-40, 26 p., on file at NortheastFisheries Center Woods Hole Laboratory, WoodsHole, Mass.
from 55,000 rons in 1960 to over 350,000rons in 1965, but have fluctuated at lowerlevels since and were only 43,000 tons in1978. Landings, fishing patterns, andmanagement regulations are reviewed foreach stock since 1955. Estimares of srockbiomass from virtual population analysis
Distribution
The silver hake occurs in Atlanticcontinental shelf waters between Newfoundland and South Carolina and ismost abundant between Cape Sable,Nova Scotia, and New York (Bigelowand Schroeder, 1953). In U.S. waters,it is abundant from Maine to New Jersey. Silver hake is also abundant on theNova Scotian shelf in Canadian watersand supports a large, primarilyU.S.S.R. fishery. The pattern of distribution varies with season and area.Throughout the winter off New England, it is found primarily in deeperwaters near the outer edge of the continental shelf and in deep basins in theGulf of Maine where the water iswarmer than inshore. In the spring andsummer as the coastal waters warm,there is a general, though incomplete,shoreward movement with the mainconcentrations of fish being found inwaters of about 20-80 m. Some silverhake move into shallow beach areas.Farther south in the New York Bight,the seasonal pattern is somewhat different. Fish are present in inshore watersfrom late autumn to spring and thenmove more into southern New Englandwaters during the spring and summer.
Stock Definition
The silver hake inhabiting waters offthe northeast coast of the U.S. are pres-
indicate a general rebuilding of the resource since 1970. Current levels of harvest in relation to available surplus stockindicate the potential for major expansionof the U.S. silver hake fishery. Some of theimplications associated with such an expansion are discussed.
Marine Fisheries Review
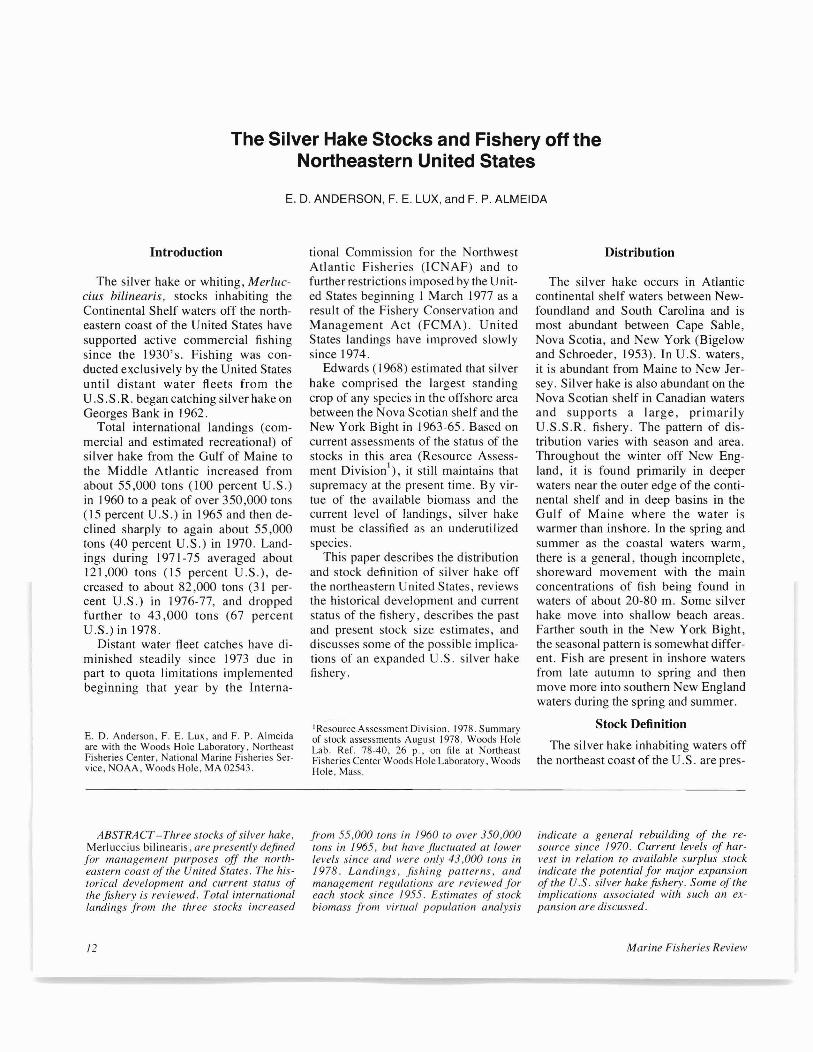
Figure I.-Fishing grounds off northeastern U.S. and the divisions and subdivisions of ICNAF Subarea 5 and Statistical Area 6.
ently grouped into three stocks according to divisions and subdivisions ofICNAF Subarea 5 and Statistical Area6. These are: I) The Gulf of Maine(Div. 5Y) stock, 2) the Georges Bank(Subdiv. 5Ze) stock, and 3) the southern New England-Middle Atlantic(Subdiv. 5Zw and Statistical Area 6)stock (Fig. I). These delineationsreflect, to some extent, scientific information concerning stock identification, but resulted primarily withinICNAF from a need to assess and manage based on the areas by which catchstatistics were reported.
There is some evidence that silverhake in the area between the Gulf ofMaine and Cape Hatteras consist ofseveral discrete stocks. Conover et al.(1961) examined morphometric measurements and found no significant differences between fish from the inshoreGulf of Maine and the northern part ofGeorges Bank nor between fish fromthe southern New England and theMiddle Atlantic areas, but did findhighly significant differences betweenfish from the Gulf of Maine-northernGeorges Bank area and the southernNew England-Middle Atlantic area.Tagging studies were conducted in1957-58 in the Gulf of Maine-GeorgesBank area and off New Jersey (Fritz,1959), resulting in only a 4.3 percentrecapture rate (Fritz, 1963). The recaptures occured fairly close to the taggingsites (the greatest distance traveled was65 km), indicating the lack of any significant movement of silver hake fromone area to another.
Nichy (1969) examined first-yeargrowth patterns on otoliths from youngsilver hake and found a difference inotol ith zonal formation and length atage between fish north and south of lat.41 °30'N. Recent calculation of growthparameters using age-length data fromthe Gulf of Maine, Georges Bank, andsouthern New England-Middle Atlanticareas (Almeida2
) indicated that fish in
2Almeida, F. P. 1978. Determination of the vonBertalanffy growth equation for the southernNew England-Middle Atlantic, Georges Bank,and Gulf of Maine stocks of silver hake. WoodsHoleLab. Ref. No. 78-13, 15 p., on file at NOI1heast Fisheries Center Woods Hole Laboratory,Woods Hole, Mass.
January 1980
the Gulf of Maine grow faster and attaingreater lengths than those to the south.
Konstantinov and Noskov (1969) reported that serological analysis had distinguished one silver hake stock in theGeorges Bank area and another in theCape Cod-Cape Hatteras area, with anapproximate division in the NantucketShoals area (Subdiv. 5Ze and 5Zwboundary area) and some mixing of thetwo groups during autumn and winter.
Examination of the seasonal distribution of silver hake catches during U.S.research vessel bottom trawl surveys(Anderson, 1974) suggests that fishwhich summer in the inshore portionsof the Gulf of Maine and along thenorthern part of Georges Bank appearto overwinter in the deep areas of theGulf of Maine, and fish which occupythe southern part of Georges Bank inthe warm months overwinter in deepwater along the southern edge of theBank. Fish in the southern NewEngland-Middle Atlantic area undergoa seasonal inshore-offshore migration.Survey catches indicate a generallycontinuous distribution of fish from thesoutheastern part of Georges Bank tothe Middle Atlantic area and show noapparent division between a GeorgesBank stock and a southern NewEngland-Middle Atlantic stock.
Examination and consideration of allavailable information suggests the possibility of a Gulf of Maine-northern
Georges Bank stock and another stock(maybe two) extending from southernGeorges Bank to the Middle Atlanticarea. However, scientific evidence ispresently not sufficient to define separate spawning stocks which are genetically distinct. Results from additionalstudies planned or in progress, such asmorphometric-meristic analysis, biochemical analysis, and tagging, mustbe examined before further conclusionscan be drawn. In the meantime, providing that traditional fishing areas and patterns do not change substantially, thepresent stock delineations are satisfactory for management of the resource.
Fishery
Historical Development
The U.S. silver hake fishery apparently began in the early 1840's (Fritz,1960). Prior to the early 1920's, landings were less than 7 million pounds(3,175 t) annually, and the species wasconsidered a nuisance. However, in theearly 1920's, a market was developedin St. Louis, Mo., for fried fish shops(Johnsan, 1932), which purchased aquarter of the Atlantic coast yearlylandings. Technological advances inhandling, freezing, processing, andtransportation further aided in creatingmarkets and developing the fishery.
During the early days of the fishery,when it was an inshore operation, the
13
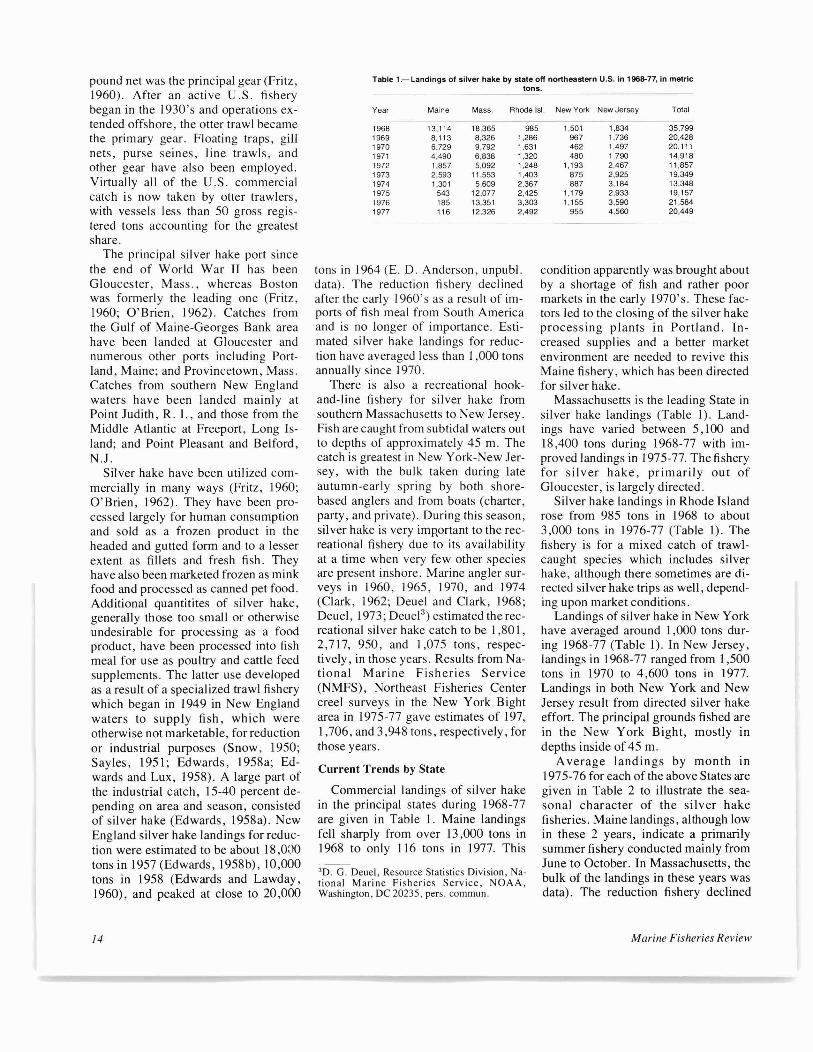
Table 1.-Landings 01 silver hake by state 011 northeastern U.S. in 1966-77, in metrictons.
Year Maine Mass. Rhode lsI. New York New Jersey Total
1968 13.114 18,365 985 1,501 1,834 35,7991969 8,113 8,326 1,286 967 1,736 20,4281970 6.729 9,792 1,631 462 1,497 20,1111971 4,490 6,838 1,320 480 1,790 14,9181972 1,857 5,092 1,248 1,193 2,467 11,8571973 2,593 11,553 1,403 875 2,925 19,3491974 1,301 5,609 2,367 887 3,184 13,3481975 543 12,077 2,425 1,179 2,933 19,1571976 185 13,351 3,303 1,155 3,590 21,5841977 116 12,326 2,492 955 4,560 20,449
pound net was the principal gear (Fritz,1960). After an active U.S. fisherybegan in the 1930's and operations extended offshore, the otter trawl becamethe primary gear. Floating traps, gillnets, purse seines, line trawls, andother gear have also been employed.Virtually all of the U.S. commercialcatch is now taken by otter trawlers,with vessels less than 50 gross registered tons accounting for the greatestshare.
The principal silver hake port sincethe end of World War II has beenGloucester, Mass., whereas Bostonwas formerly the leading one (Fritz,1960; O'Brien, 1962). Catches fromthe Gulf of Maine-Georges Bank areahave been landed at Gloucester andnumerous other ports including Portland, Maine; and Provincetown, Mass.Catches from southern New Englandwaters have been landed mainly atPoint Judith, R. 1., and those from theMiddle Atlantic at Freeport, Long Island; and Point Pleasant and Belford,N.J.
Silver hake have been utilized commercially in many ways (Fritz, 1960;0' Brien, 1962). They have been processed largely for human consumptionand sold as a frozen product in theheaded and gutted form and to a lesserextent as fillets and fresh fish. Theyhave also been marketed frozen as minkfood and processed as canned pet food.Additional quantitites of silver hake,generally those too small or otherwiseundesirable for processing as a foodproduct, have been processed into fishmeal for use as poultry and cattle feedsupplements. The latter use developedas a result of a specialized trawl fisherywhich began in 1949 in New Englandwaters to supply fish, which wereotherwise not marketable, for reductionor industrial purposes (Snow, 1950;Sayles, 1951; Edwards, 1958a; Edwards and Lux, 1958). A large part ofthe industrial catch, 15-40 percent depending on area and season, consistedof silver hake (Edwards, 1958a). NewEngland silver hake landings for reduction were estimated to be about 18,000tons in 1957 (Edwards, 1958b), 10,000tons in 1958 (Edwards and Lawday,1960), and peaked at close to 20,000
14
tons in 1964 (E. D. Anderson, unpub!.data). The reduction fishery declinedafter the early 1960's as a result of imports of fish meal from South Americaand is no longer of importance. Estimated silver hake landings for reduction have averaged less than 1,000 tonsannually since 1970.
There is also a recreational hookand-line fishery for silver hake fromsouthern Massachusetts to New Jersey.Fish are caught from subtidal waters outto depths of approximately 45 m. Thecatch is greatest in New York-New Jersey, with the bulk taken during lateautumn-early spring by both shorebased anglers and from boats (charter,party, and private). During this season,silver hake is very imp-ortant to the recreational fishery due to its availabilityat a time when very few other speciesare present inshore. Marine angler surveys in 1960, 1965, 1970, and 1974(Clark, 1962; Deuel and Clark, 1968;Deuel, 1973; Deuel3
) estimated therecreational silver hake catch to be I ,80 I,2,717, 950, and 1,075 tons, respectively, in those years. Results from National Marine Fisheries Service(NMFS), Northeast Fisheries Centercreel surveys in the New York Bightarea in 1975-77 gave estimates of 197,1,706, and 3,948 tons, respectively, forthose years.
Current Trends by State
Commercial landings of silver hakein the principal states during 1968-77are given in Table I. Maine landingsfell sharply from over 13,000 tons in1968 to only 116 tons in 1977. This
3D. G. Deuel, Resource Statistics Division, National Marine Fisheries Service, NOAA,Washington, DC 20235, pers. commun.
condition apparently was brought aboutby a shortage of fish and rather poormarkets in the early 1970's. These factors led to the closing of the silver hakeprocessing plants in Portland. Increased supplies and a better marketenvironment are needed to revive thisMaine fishery, which has been directedfor silver hake.
Massachusetts is the leading State insilver hake landings (Table I). Landings have varied between 5,100 and18,400 tons during 1968-77 with improved landings in 1975-77. The fisheryfor silver hake, primarily out ofGloucester, is largely directed.
Silver hake landings in Rhode Islandrose from 985 tons in 1968 to about3,000 tons in 1976-77 (Table I). Thefishery is for a mixed catch of trawlcaught species which includes silverhake, although there sometimes are directed silver hake trips as well, depending upon market conditions.
Landings of silver hake in New Yorkhave averaged around 1,000 tons during 1968-77 (Table I). In New Jersey,landings in 1968-77 ranged from 1,500tons in 1970 to 4,600 tons in 1977.Landings in both New York and NewJersey result from directed silver hakeeffort. The principal grounds fished arein the New York Bight, mostly indepths inside of 45 m.
Average landings by month in1975-76 for each of the above States aregiven in Table 2 to illustrate the seasonal character of the silver hakefisheries. Maine landings, although lowin these 2 years, indicate a primarilysummer fishery conducted mainly fromJune to October. In Massachusetts, thebulk of the landings in these years wasdata). The reduction fishery declined
Marine Fisheries Review
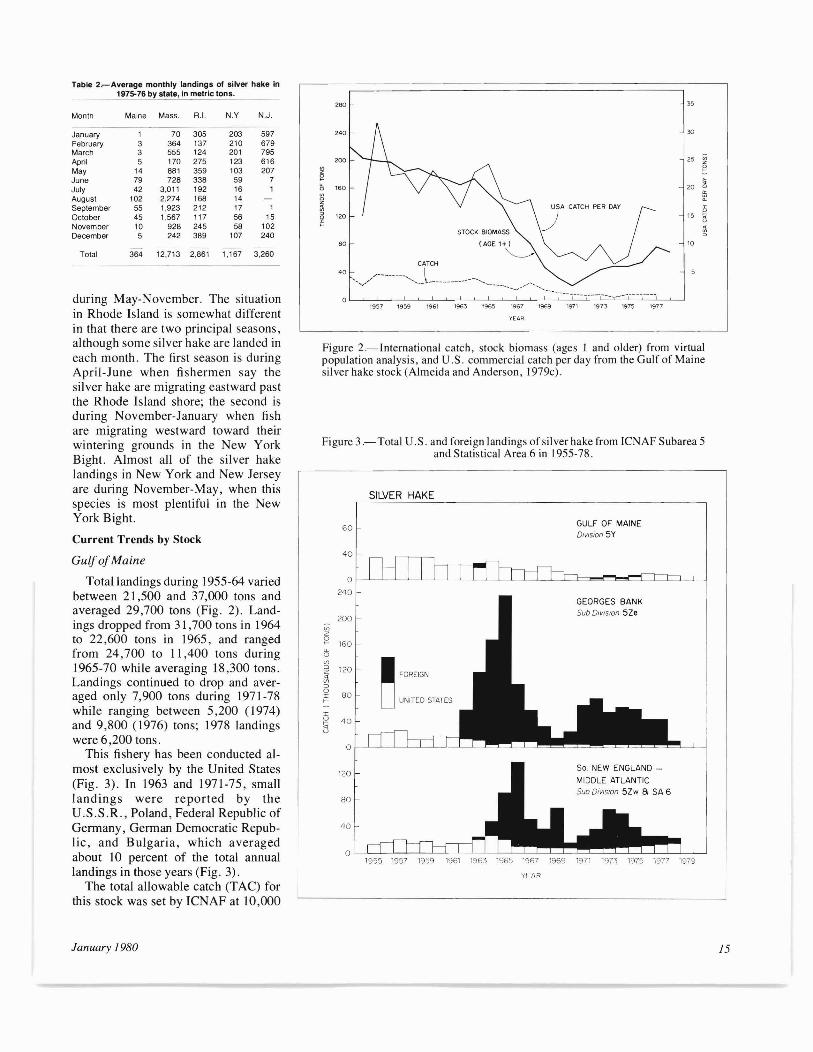
Figure 3.-Total U.S. and foreign landings of silver hake from ICNAF Subarea 5and Statistical Area 6 in 1955-78.
Figure 2.-lnternational catch, stock biomass (ages I and older) from virtualpopulation analysis, and U.S. commercial catch per day from the Gulf of Mainesilver hake stock (Almeida and Anderson, 1979c).
30
25
20
15
10
1957 1959 1961 1963 1965 1967 1969 1971 1973 1975 1977
CATCH
40 "~/r-------'-_,_J --,,,, ,_, ---- _
o
YEAR
80
280
240
120
200
160
Table 2~Average monthly landings 01 silver hake in1975-76 by state, in metric tons.
Month Maine Mass. R.1. N.Y N.J.
January 1 70 305 203 597February 3 364 137 210 679March 3 555 124 201 795April 5 170 275 123 616May 14 881 359 103 207June 79 728 338 59 7July 42 3,011 192 16 1August 102 2,274 168 14September 55 1.923 212 17 1October 45 1.567 117 56 15November 10 928 245 58 102December 5 242 389 107 240
Total 364 12,713 2.861 1.167 3,260
during May-November. The situationin Rhode Island is somewhat differentin that there are two principal seasons,although some silver hake are landed ineach month. The first season is duringApril-June when fishermen say thesilver hake are migrating eastward pastthe Rhode Island shore; the second isduring November-January when fishare migrating westward toward theirwintering grounds in the New YorkBight. Almost all of the silver hakelandings in New York and New Jerseyare during November-May, when thisspecies is most plentiful in the NewYork Bight.
Current Trends by Stock
Gulf ofMaine
Total landings during 1955-64 variedbetween 21,500 and 37,000 tons andaveraged 29,700 tons (Fig. 2). Landings dropped from 31,700 tons in 1964to 22,600 tons in 1965, and rangedfrom 24,700 to 11,400 tons during1965-70 while averaging 18,300 tons.Landings continued to drop and averaged only 7,900 tons during 1971-78while ranging between 5,200 (1974)and 9,800 (1976) tons; 1978 landingswere 6,200 tons.
This fishery has been conducted almost exclusively by the United States(Fig. 3). In 1963 and 1971-75, smalllandings were reported by theU.S.S.R., Poland, Federal Republic ofGermany, German Democratic Republic, and Bulgaria, which averagedabout 10 percent of the total annuallandings in those years (Fig. 3).
The total allowable catch (TAC) forthis stock was set by ICNAF at 10,000
January 1980 15
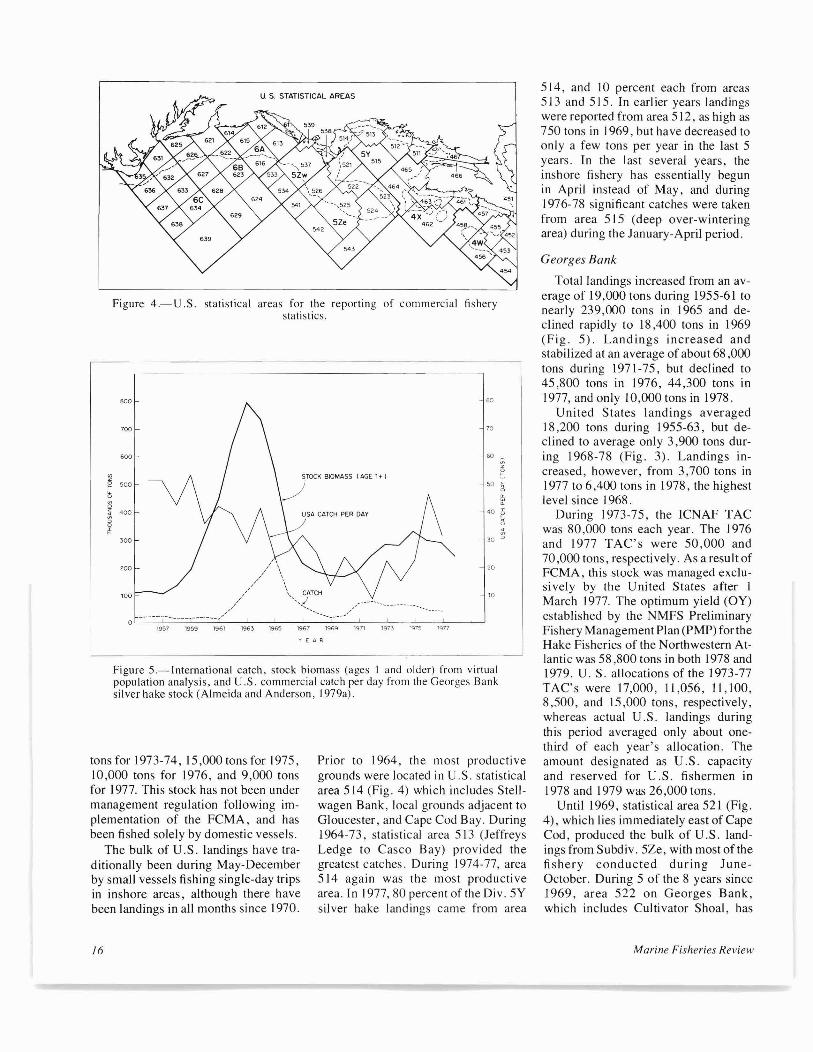
Figure 4.- U .S. statistical areas for the reporting of commercial fisherystatistics.
Figu.re 5.-lnternational catch, stock biomass (ages I and older) from virtualpopulation analysis, and U.S. commercial catch per day from the Georges Banksilver hake stock (Almeida and Anderson, 1979a).
514, and 10 percent each from areas513 and 515. In earlier years landingswere reported from area 512, as high as750 tons in 1969, bu t have decreased toonly a few tons per year in the last 5years. Tn the last several years, theinshore fishery has essentially begunin April instead of May, and during1976-78 significant catches were takenfrom area 515 (deep over-winteringarea) during the January-April period.
Georges Bank
Total landings increased from an average of 19,000 tons during 1955-61 tonearly 239,000 tons in 1965 and declined rapidly to 18,400 tons in 1969(Fig. 5). Landings increased andstabilized at an average of about 68 ,000tons during 1971-75, but declined to45,800 tons in 1976, 44,300 tons in1977, and only 10,000 tons in 1978.
United States landings averaged18,200 tons during 1955-63, but declined to average only 3,900 tons during 1968-78 (Fig. 3). Landings increased, however, from 3,700 tons in1977 to 6,400 tons in 1978, the highestlevel since 1968.
During 1973-75, the TCNAF TACwas 80,000 tons each year. The 1976and 1977 TAC's were 50,000 and70,000 tons, respecti vely. As a result ofFCMA, this stock was managed exclusi vely by the Uni ted States after IMarch 1977. The optimum yield (OY)established by the NMFS PreliminaryFishery Management Plan (PMP) for theHake Fisheries of the Northwestern Atlantic was 58,800 tons in both 1978 and1979. U. S. allocations of the 1973-77TAC's were 17,000, 11,056, 11,100,8,500, and 15,000 tons, respectively,whereas actual U.S. landings duringthis period averaged only about onethird of each year's allocation. Theamount designated as U.S. capacityand reserved for U.S. fishermen in1978 and 1979 was 26,000 tons.
Until 1969, statistical area 521 (Fig.4), which lies immediately east of CapeCod, produced the bulk of U.S. landings from Subdiv. 5Ze, with most of thefishery conducted during JuneOctober. During 5 of the 8 years since1969, area 522 on Georges Bank,which includes Cultivator Shoal, has
10
20
40
50
'0
60
70
- 80
Prior to 1964, the most productivegrounds were located in U.S. statisticalarea 514 (Fig. 4) which includes Stellwagen Bank, local grounds adjacent toGloucester, and Cape Cod Bay. During1964-73, statistical area 513 (JeffreysLedge to Casco Bay) provided thegreatest catches. During 1974-77, area514 again was the most productivearea. In 1977, 80 percent of the Di v. 5Ysilver hake landings came from area
u. S. STATISTICAL AREAS
,/1\\,// \, ,
// \. CATCH
/ "'/----- ------- ,/,,/ ----~
0L-_L-.C=L----=cL-_L-_L-_'----_'----_'----_'---- '----_----'1957 1959 1961 1963 1965 1967 1969 1971 1973 -q75 'qn
YEA R
lOa
200
500
700
600
'00
800
400
tonsfor 1973-74, 15,000 tons for 1975,10,000 tons for 1976, and 9,000 tonsfor 1977. This stock has not been undermanagement regulation following implementation of the FCMA, and hasbeen fished solely by domestic vessels.
The bulk of U.S. landings have traditionally been during May-Decemberby small vessels fishing single-day tripsin inshore areas, although there havebeen landings in all months since 1970.
/6 Marine Fisheries Review
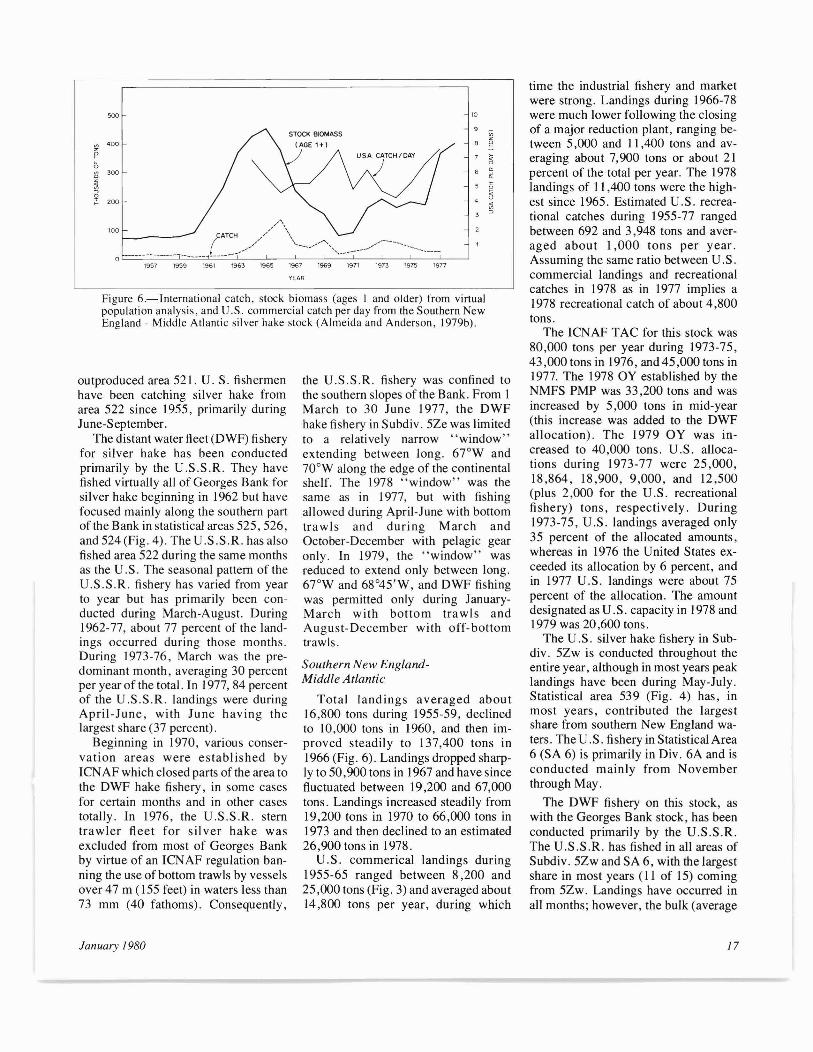
Figure 6.-International catch, stock biomass (ages I and older) from virtualpopulation analysis, and U.S. commercial catch per day from the Southern NewEngland - Middle Atlantic silver hake stock (Almeida and Anderson, 1979b).
YEAR
'9~ 1959 1961 1963 1965 1%7 ~ 1971 '~3 '9~ '~7
time the industrial fishery and marketwere strong. Landings during 1966-78were much lower following the closingof a major reduction plant, ranging between 5,000 and 11,400 tons and averaging about 7,900 tons or about 21percent of the total per year. The 1978landings of 11,400 tons were the highest since 1965. Estimated U.S. recreational catches during 1955-77 rangedbetween 692 and 3,948 tons and averaged about 1,000 tons per year.Assuming the same ratio between U.S.commercial landings and recreationalcatches in 1978 as in 1977 implies a1978 recreational catch of about 4,800tons.
The ICNAF TAC for this stock was80,000 tons per year during 1973-75,43,000 tons in 1976, and 45,000 tons in1977. The 1978 OY established by theNMFS PMP was 33,200 tons and wasincreased by 5,000 tons in mid-year(this increase was added to the DWFallocation). The 1979 OY was increased to 40,000 tons. U.S. allocations during 1973-77 were 25,000,18,864, 18,900, 9,000, and 12,500(plus 2,000 for the U.S. recreationalfishery) tons, respectively. During1973-75, U.S. landings averaged only35 percent of the allocated amounts,whereas in 1976 the United States exceeded its allocation by 6 percent, andin 1977 U.S. landings were about 75percent of the allocation. The amountdesignated as U.S. capacity in 1978 and1979 was 20,600 tons.
The U.S. silver hake fishery in Subdiv. 5Zw is conducted throughout theentire year, although in most years peaklandings have been during May-July.Statistical area 539 (Fig. 4) has, inmost years, contributed the largestshare from southern New England waters. The U.S. fishery in Statistical Area6 (SA 6) is primarily in Div. 6A and isconducted mainly from Novemberthrough May.
The DWF fishery on this stock, aswith the Georges Bank stock, has beenconducted primarily by the U.S.S.R.The U.S.S.R. has fished in all areas ofSubdiv. 5Zw and SA 6, with the largestshare in most years (II of 15) comingfrom 5Zw. Landings have occurred inall months; however, the bulk (average
10
the U.S.S.R. fishery was confined tothe southern slopes of the Bank. From IMarch to 30 June 1977, the DWFhake fishery in Subdiv. 5Ze was limitedto a relatively narrow "window"extending between long. 6rW and70 0 W along the edge of the continentalshelf. The 1978 "window" was thesame as in 1977, but with fishingallowed during April-June with bottomtrawls and during March andOctober-December with pelagic gearonly. In 1979, the "window" wasreduced to extend only between long.67°W and 68°45'W, and DWF fishingwas permitted only during JanuaryMarch with bottom trawls andAugust-December with off-bottomtrawls.
Southern New EnglandMiddle Atlantic
Total landings averaged about16,800 tons during 1955-59, declinedto 10,000 tons in 1960, and then improved steadily to 137,400 tons in1966 (Fig. 6). Landings dropped sharply to 50,900 tons in 1967 and have sincefluctuated between 19,200 and 67,000tons. Landings increased steadily from19,200 tons in 1970 to 66,000 tons in1973 and then declined to an estimated26,900 tons in 1978.
U.S. commerical landings during1955-65 ranged between 8,200 and25,000 tons (Fig. 3) and averaged about14,800 tons per year, during which
..,,;"\
CATCH // \,
a ------- ------- ------- L ---/ '-----/~'",'--------//-----------
1001--_---
500
200
400
300
outproduced area 52l. U. S. fishermenhave been catching silver hake fromarea 522 since 1955, primarily duringJune-September.
The distant water fleet (DWF) fisheryfor silver hake has been conductedprimarily by the U.S.S.R. They havefished virtually all of Georges Bank forsilver hake beginning in 1962 but havefocused mainly along the southern partof the Bank in statistical areas 525,526,and 524 (Fig. 4). The U.S .S.R. has alsofished area 522 during the same monthsas the U.S. The seasonal pattern of theU.S.S.R. fishery has varied from yearto year but has primarily been conducted during March-August. During1962-77, about 77 percent of the landings occurred during those months.During 1973-76, March was the predominant month, averaging 30 percentper year of the total. In 1977, 84 percentof the U.S.S.R. landings were duringApril-June, with June having thelargest share (37 percent).
Beginning in 1970, various conservation areas were established byICNAF which closed parts of the area tothe DWF hake fishery, in some casesfor certain months and in other casestotally. In 1976, the U.S.S.R. stemtrawler fleet for silver hake wasexcluded from most of Georges Bankby virtue of an ICNAF regulation banning the use of bottom trawls by vesselsover 47 m (155 feet) in waters less than73 mrn (40 fathoms). Consequently,
January 1980 17
Figure 7.-Gulf of Maine silver hake spawning stock biomass (ages 2 and older)in 1955-78 and abundance at age I of the 1954-77 year classes. Open circlesindicate estimated year-class sizes (Almeida and Anderson, 1979c).
of 56 percent during 1963-77) has generally come during February-April, although during 1969-72 the largestamounts came during June-August.ICNAF conservation areas have restricted the DWF fishery both seasonally and areally. Additional restrictionswere placed on the DWF fishery in SA 6as a result of bilateral fisheries agreements. The 1977 DWF hake fishery inSubdiv. 5Zw + SA 6 was restricted to a"window" extending from the 5Ze5Zw boundary west into Div. 6A alongthe edge of the shelf which was openonly through March. The 1978 and1979 DWF fisheries were confined toessentially the same area with fishingwith bottom gear (which is needed tocatch silver hake although some may becaught with pelagic gear) limited toJanuary-March.
Status of the Stocks
700
600
500
400
300
RECRUITMENT
)SPAWNING STOCK BIOMASS (AGE 2+)
)
'956 1958 1960 1962 196"1 1966 1968 1970 1972 1974 1976 1978
YEAR
260
240
200
160
120
Figure 8.-Georges Bank silver hake spawning stock biomass (ages 2 and older)in 1955-78 and abundance at age I of the 1954-77 year classes. Open circlesindicate estimated year-class sizes (Almeida and Anderson, 1979a).
to an estimated 254,000 tons at the beginning of 1978. As with the Gulf ofMaine stock, recruitment was very poorduring the mid- and late 1960's (Fig.8), but improved in the early 1970's.The 1975, 1976, and 1977 year classeswere estimated to be poor. Projectionsindicate that the spawning stockbiomass underwent a 10 percent de-
1956 1958 1960 1962 1964 1%6 1968 1970 1972 1974 1976 1978
Y(AI:(
500
100
700
600
200
400
0_ /00"
°
3,500
3,000
~~
~ 2,500
§~
~ 2.000-~~ 1.500~z
~~ 1,000
~
900
Georges BankTotal estimated stock biomass (ages
I and older) increased from about110,000 tons in 1955 (Fig. 5) to a highof nearly 800,000 tons in 1963 and thendeclined to about 168,000 tons in 1970(Almeida and Anderson, 1979a). Totalbiomass increased to approximately332,000 tons in 1975 but then declined
Gulf of MaineTotal estimated stock biomass (ages
1 and older) decreased from about220,000 tons in 1955 to a low of onlyabout 20,000 tons in 1971 (Fig. 2) andthen increased to slightly over 75,000tons in 1977 (Almeida and Anderson,1979c). Recruitment to this stock wasvery poor during the mid- and late1960's (Fig. 7), but improved in the1970' s. The 1973 and 1976 yearclasses were estimated to be thestrongest observed since 1964 althoughthey were still smallerthan the 1954-72mean size. Projections indicate that thetotal stock biomass available at the beginning of 1978 was slightly less than in1977, but spawning stock biomass(ages 2 and older) increased approximately 10 percent from 1977 to 1978(Fig. 7). The catch of about 6,200 tonsin 1978 was estimated to result in anincrease of 5-10 percent in spawningstock biomass from 1978 to 1979.These estimates, as well as those for theother two stocks, are based on virtualpopulation analysis (Almeida and Anderson (1979a,b,c) provide greater detail of the assessment analyses). Thechanges in biomass, as indicated, aremore valid in a relative rather than absolute sense due to the imprecision ofthe data and parameters utilized in theanalyses.
/8 Marine Fisheries Review
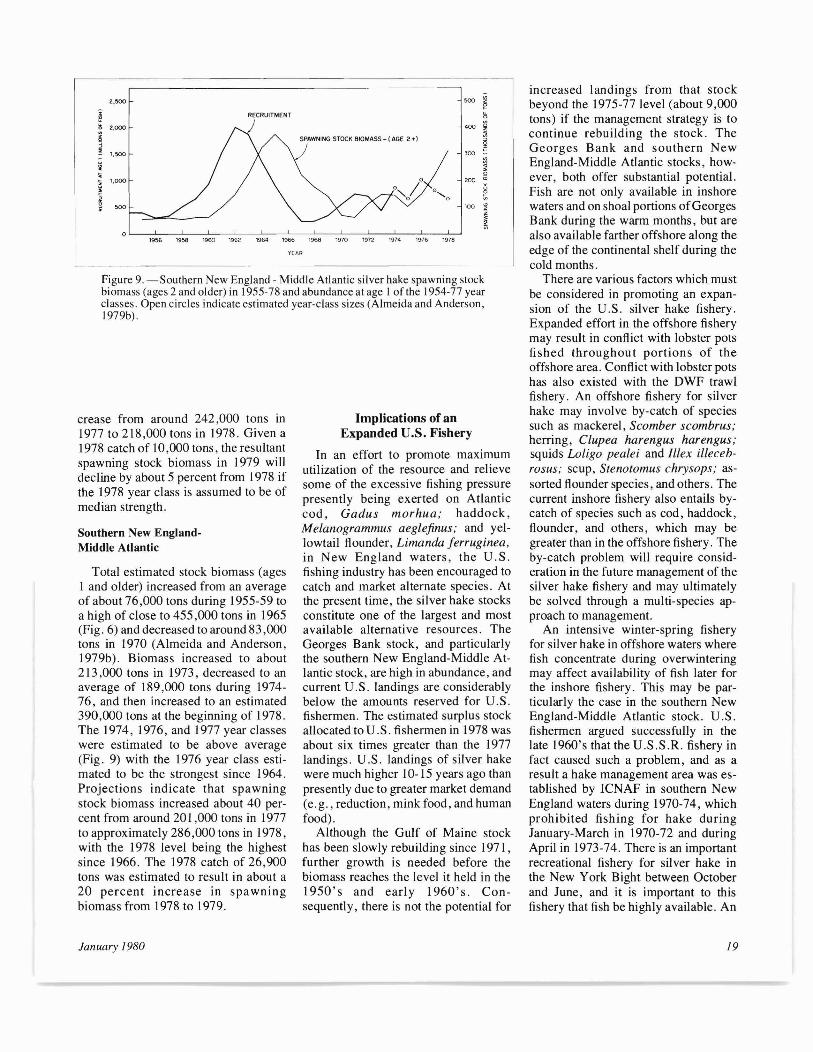
Figure 9, -Southern New England - Middle Atlantic silver hake spawning stockbiomass (ages 2 and older) in 1955-78 and abundance at age I of the 1954-77 yearclasses, Open circles indicate estimated year-class sizes (Almeida and Anderson,1979b),
Southern New EnglandMiddle Atlantic
crease from around 242,000 tons in1977 to 218,000 tons in 1978, Given a1978 catch of 10 ,000 tons, the resultantspawning stock biomass in 1979 willdecline by about 5 percent from 1978 ifthe 1978 year class is assumed to be ofmedian strength,
increased landings from that stockbeyond the 1975-77 level (about 9,000tons) if the management strategy is tocontinue rebuilding the stock. TheGeorges Bank and southern NewEngland-Middle Atlantic stocks, however, both offer substantial potential.Fish are not only available in inshorewaters and on shoal portions ofGeorgesBank during the warm months, but arealso available farther offshore along theedge of the continental shelf during thecold months.
There are various factors which mustbe considered in promoting an expansion of the U.S. silver hake fishery.Expanded effort in the offshore fisherymay result in conflict with lobster potsfished throughou t portions of theoffshore area. Conflict with lobster potshas also existed with the DWF trawlfishery. An offshore fishery for silverhake may involve by-catch of speciessuch as mackerel, Scomber scombrus;herring, Clupea harengus harengus;squids Loligo pealei and Illex illecebrosus; scup, Stenotomus chrysops; assorted flounder species, and others. Thecurrent inshore fishery also entails bycatch of species such as cod, haddock,flounder, and others, which may begreater than in the offshore fishery. Theby-catch problem will require consideration in the future management of thesilver hake fishery and may ultimatelybe solved through a multi-species approach to management.
An intensive winter-spring fisheryfor silver hake in offshore waters wherefish concentrate during overwinteringmay affect availability of fish later forthe inshore fishery. This may be particularly the case in the southern NewEngland-Middle Atlantic stock. U.S.fishermen argued successfully in thelate 1960's that the U.S.S .R, fishery infact caused such a problem, and as aresult a hake management area was established by ICNAF in southern NewEngland waters during 1970-74, whichprohibited fishing for hake duringJanuary-March in 1970-72 and duringApril in 1973-74. There is an importantrecreational fishery for silver hake inthe New York Bight between Octoberand June, and it is important to thisfishery that fish be highly available. An
500
400
300
200
°.........0
100
Implications of anExpanded U.S. Fishery
In an effort to promote maximumutilization of the resource and relievesome of the excessive fishing pressurepresently being exerted on Atlanticcod, Gadus morhua; haddock,Melanogrammus aeglefinus; and yellowtail flounder, Limanda ferruginea,in New England waters, the U.S.fishing industry has been encouraged tocatch and market alternate species. Atthe present time, the silver hake stocksconstitute one of the largest and mostavailable alternative resources. TheGeorges Bank stock, and particularlythe southern New England-Middle Atlantic stock, are high in abundance, andcurrent U.S. landings are considerablybelow the amounts reserved for U.S.fishermen. The estimated surplus stockallocated to U.S. fishermen in 1978 wasabou t six times greater than the 1977landings. U.S. landings of silver hakewere much higher 10-15 years ago thanpresently due to greater market demand(e.g., reduction, mink food, and humanfood).
Although the Gulf of Maine stockhas been slowly rebuilding since 1971,further growth is needed before thebiomass reaches the level it held in the1950's and early 1960's. Consequently, there is not the potential for
SPAWNING STOCK BIOMASS - (AGE 2 +1
)
YEAR
1956 1958 1960 1962 1964 1966 1968 1970 1972 1974 1976 1978
500
2,000
1,500
1,000
Total estimated stock biomass (agesI and older) increased from an averageof about 76,000 tons during 1955-59 toa high of close to 455,000 tons in 1965(Fig. 6) and decreased to around 83,000tons in 1970 (Almeida and Anderson,1979b). Biomass increased to about213,000 tons in 1973, decreased to anaverage of 189,000 tons during 197476, and then increased to an estimated390,000 tons at the beginning of 1978.The 1974, 1976, and 1977 year classeswere estimated to be above average(Fig. 9) with the 1976 year class estimated to be the strongest since 1964.Projections indicate that spawningstock biomass increased about 40 percent from around 20 1,000 tons in 1977to approximately 286,000 tons in 1978,with the 1978 level being the highestsince 1966. The 1978 catch of 26,900tons was estimated to result in about a20 percent increase in spawningbiomass from 1978 to 1979,
2,>00
January 1980 19
expansion in the commercial fishery in that area may reduce availabilityto the recreational fishery.
The U.S. silver hake trawl fisherydoes not have a minimum codend meshsize regulation although the DWF hakefishery has a 60-mm stretched meshregulation. Significant expansion of theU.S. fishery in the absence of aminimum mesh size regulation may increase mortality on undersized silverhake, particularly in areas where prerecruits are highly abundant.
An expanded silver hake fishery maynot necessarily relieve pressure on theAtlantic cod, haddock, and yellowtailflounder stocks in all areas. Thegreatest potential for expansion is in thesouthern New England-Middle Atlanticstock. However, this area representsthe southern extent of the range for codand haddock, and catches of these twospecies are less there than in theGeorges Bank and Gulf of Maine areas.In the Gulf of Maine, where there isperhaps the greatest need for alternatespecies to cod and haddock,the silver hake stock has not yet recovered to levels capable of supporting anexpanded fishery.
It was suggested earlier that silverhake in the Gulf of Maine and on thenorthern part of Georges Bank may belong to the same stock but that scientificevidence is presently not sufficient toeither verify or disprove this theory. Ifthese areas were combined for management, it could be harmful to the inshore Gulf of Maine resource if the allowable harvest for the combined areaswere taken solely or predominantly
20
from inshore waters. Until conclusiveevidence becomes available to definethe stock structure, traditional fishingareas and patterns should be maintained, which implies that any immediate expansion of the silver hakefishery in the Gulf of Maine-northernGeorges Bank area should be confinedto the latter area.
In conclusion, assessment analysesindicate that the silver hake resource offthe northeastern coast of the UnitedStates has been rebuild ing since 1970.The current low level of landings compared with the estimated availablesurplus stock indicates the potential fora major expansion of the U.S. silverhake fishery. Such an expansion,however, would probably impact onother species and fisheries but could beaccomplished through a rational multispecies management regime.
Literature Cited
Almeida, F. P., and E. D. Anderson. 1979a.Status of the Georges Bank silver hakestock - 1978. Int. Comm. Northwest Atl.Fish., Redb., II p.
____.1979b. Status of the southern NewEngland-Middle Atlantic silver hake stock 1978. Int. Comm. Northwest Atl. Fish. Res.,Redb., II p.
____. 1979c. Status of the Gulf of Mainesilver hake stock - 1978. Int. Comm. Northwest Atl. Fish., Redb., 12 p.
Anderson, E. D. 1974. Comments on the delineation of red and silver hake stocks in ICNAFSubarea 5 and Statistical Area 6. Inl.Comm.Northwest Atl. Fish., Redb., 8 p.
Bigelow, H. B., and w. C. Schroeder. 1953.Fishes of the Gulf of Maine. U.S. Fish Wildl.Serv., Fish. Bull. 53, 577 p.
Clark, J. R. 1962. The 1960 salt-water anglingsurvey. U.S. Fish Wild. Serv., Circ. 153,36 p.
Conover, J. T., R. L. Fritz, and M. Vieira.
1961. A morphometric study of silver hake.U.S. Fish Wildl. Serv .. Spec. Sci. Rep. Fish.368, 13 p.
Deuel, D. G. 1973. 1970 salt-water angling survey. U.S. Dep. Commer., Natl. Mar. Fish.Serv., Curro Fish. Stat. 6200, 54 p.
____, and J. R. Clark. 1968. The 1965salt-water angling survey. U.S. Fish Wildl.Serv., Res. Pub I. 67,51 p.
Edwards, R. L. 1958a. Gloucester's trawl fisheryfor industrial fish. Commer. Fish. Rev.20(8): 10-1 5.
1958b. Species composition ofindustrial trawl landings in New England,1957. U.S. Fish Wild. Serv., Spec. Sci. Rep.Fish. 266,23 p.
____. 1968. Fishery resources of the NorthAtlantic area. In D. Gilbert (editor), The futureof the fishing industry of the United States, p.52-60. Univ. Wash. Publ. Fish., New Ser. 4.
____, and L. Lawday. 1960. Speciescomposition of industrial trawl-fish landingsin New England, 1958. U.S. Fish Wildl.Serv., Spec. Sci. Rep. Fish. 346,20 p.
____, and F. E. Lux. 1958. NewEngland's industrial fishery. Commer. Fish.Rev. 20(5): 1-6.
Fritz, R. L. 1959. Hake tagging in Europe and theU.S., 1931-1958. J. Cons. Int. Explor. Mer24(3):480-485.
____. J960. A review of the Atlantic coastwhiting fishery. Commer. Fish. Rev.22(11):1-11.
____.1963. An analysis of silver hake tagreturns. Int. Comm. Northwest Atl. Fish.,Spec. Publ. 4:214-215.
Johnson, F. F. 1932. Some unusual markets forfish and shellfish. U. S. Bur. Fish., Fish. Circ.11,31 p.
Konstantinov, K. G., and A. S. Noskov. 1969.USSR research report, 1968. Int. Comm.Northwest Atl. Fish., Redb. (Part 11):99-117.
Nichy, F. E. 1969. Growth patterns on otolithsfrom young silver hake, Merluccius bilinearis(Mitch.). Int. Comm. Northwest Atl. Fish.,Res. Bull. 6: 107-117.
O'Brien, J. J. 1962. New England whitingfishery, and marketing of whiting products,1946-61. U.S. Bur. Commer. Fish., Mark.News Serv., Boston, 39 p.
Sayles, R. E. 195 I. The trash fishery of southernNew England in 1950. Commer. Fish. Rev.13(7):1-4.
Snow, G. W. 1950. Development of trash fisheryat New Bedford, Massachusetts. Commer.Fish. Rev. 12(7):8-10.
Marine Fisheries Review