the significance of non-motorised transport for developing countries...
TRANSCRIPT

Non-motorised transport in developing countries final report
1
THE SIGNIFICANCE OF NON-MOTORISED TRANSPORTFOR DEVELOPING COUNTRIES
STRATEGIES FOR POLICY DEVELOPMENT
A study on the effectiveness of non-motorised transport in relation toeconomic growth, reduction of poverty and quality of life in urban areasand on the applicability of arrangements developed in the Netherlands.
I-ce, Interface for Cycling Expertise,Utrecht, the Netherlands
Projectleader : Maurits Servaas
December 2000

Non-motorised transport in developing countries final report
2
TABLE OF CONTENTS
CHAPTER 1 NON-MOTORISED URBAN TRANSPORT STRATEGY – A REVIEW OFDUTCH EXPERIENCE .................................................................. 7
1.1 BACKGROUND TO THIS STUDY................................................................................................. 7
1.2 OBJECTIVES OF THIS STUDY ................................................................................................... 7
1.3 EXPECTED OUTPUT............................................................................................................... 7
1.4 ACTIVITIES ........................................................................................................................ 8
1.5 ORGANISATION OF THE REPORT.............................................................................................. 8
CHAPTER 2 NON-MOTORISED URBAN TRANSPORT..................................... 8
2.1 NON-MOTORISED TRANSPORT IN DEVELOPING COUNTRIES ........................................................ 8
2.2 NON-MOTORISED TRANSPORT IN THE NETHERLANDS ................................................................ 8
2.3 THE NMT- USER: A PRISONER OF HIS MODE? CAPTIVE VS CHOICE MODES .................................... 8
2.4 ROLE OF NMT AT DIFFERENT STAGES OF DEVELOPMENT........................................................... 8
2.5 SOCIAL, ECONOMIC AND CULTURAL DIMENSIONS OF NMT USE ................................................... 8
2.5.1 The Socio-Economic background of NMT-users ......................................................... 8
2.5.2 NMT and its gender dimension .................................................................................. 8
2.5.3 A profile of the NMT user .......................................................................................... 8
2.6 THE USER’S AND NON-USER’S PERSPECTIVE AND ATTITUDE TOWARDS NMT................................... 8
2.7 FRAMEWORK FOR UNDERSTANDING NMT USE .......................................................................... 8
2.8 CONCLUSION ....................................................................................................................... 8
CHAPTER 3 INSTITUTIONAL AND POLICY ARRANGEMENTS........................ 8
3.1 INTRODUCTION..................................................................................................................... 8
3.2 AN OVERVIEW OF ALL RELEVANT STAKEHOLDERS IN NMT............................................................ 8
3.3 INSTITUTIONS ...................................................................................................................... 8
3.4 NATIONAL AND LOCAL PLANNING FOR NON-MOTORISED TRANSPORT ........................................... 8
3.4.1 Dutch bicycle policy in the 1990’s: the Bicycle Master Plan.......................................... 8
3.4.2 Framework............................................................................................................... 8
3.4.3 Strategy ................................................................................................................... 8
3.4.4 Target groups ........................................................................................................... 8
3.4.5 Implementation strategy ............................................................................................ 8
3.4.6 Communication ........................................................................................................ 8
3.4.7 Evaluation ................................................................................................................ 8
3.4.8 Is the Dutch Masterplan a blue print for a good bicycle policy?..................................... 8
3.5 FINANCING INVESTMENTS ...................................................................................................... 8
3.6 CAPACITY BUILDING.............................................................................................................. 8
3.6.1 The required qualifications of those responsible for preparing and implementing transportpolicies: ................................................................................................................... 8

Non-motorised transport in developing countries final report
3
3.7 LESSONS LEARNED............................................................................................................... 8
CHAPTER 4 PLANNING FOR CYCLING AND WALKING .................................. 8
4.1 INTRODUCTION..................................................................................................................... 8
4.2 TRANSPORT MANAGEMENT AND PLANNING............................................................................... 8
4.3 SPECIFIC AND GENERIC NMT PLANNING .................................................................................. 8
4.4 THE PLANNING PROCESS AND THE WEIGHING OF INTERESTS OF NMT AND MT................................ 8
4.5 NETWORKS AS A BASIC PLANNING CONCEPT ............................................................................ 8
4.5.1 The Delft bicycle experience...................................................................................... 8
4.5.2 The Delhi Bicycle Master Plan................................................................................... 8
4.6 THE URBAN MOBILITY PLAN FOR PEDESTRIAN AND BICYCLE TRAFFIC.............................................. 8
4.6.1 SWOT of the urban transport system and the role of NMT........................................... 8
4.6.2 overview of existing land use and road infrastructure networks.................................... 8
4.6.3 macro analysis of the present mobility: performance and costs .................................... 8
4.6.4 micro analysis of the present mobility ......................................................................... 8
4.6.5 Inventory and assessment of user needs................................................................... 8
4.6.6 urban transport scenarios.......................................................................................... 8
4.6.7 Choice of mobility policies ......................................................................................... 8
4.6.8 Design of the future network of pedestrian and bicycle routes...................................... 8
4.6.9 Choice of design standards ....................................................................................... 8
4.7 QUALITY CRITERIA ................................................................................................................ 8
4.7.1 Coherence, Directness, Comfort, Attractiveness and Safety ........................................ 8
4.7.2 The application of quality criteria................................................................................ 8
4.8 NMT ROAD SAFETY MANAGEMENT APPROACH......................................................................... 8
4.9 ROAD SAFETY MEASURES ..................................................................................................... 8
4.9.1 Speed control ........................................................................................................... 8
4.9.2 Road design............................................................................................................. 8
4.9.3 Vehicle design .......................................................................................................... 8
4.9.4 Education and awareness raising............................................................................... 8
CHAPTER 5 TECHNICAL AND INFRASTRUCTURAL ISSUES CONCERNING NMT8
5.1 INTRODUCTION..................................................................................................................... 8
5.2 SEGREGATION VERSUS INTEGRATION....................................................................................... 8
5.3 HIERARCHY IN URBAN ROAD NETWORK ..................................................................................... 8
5.4 INFRASTRUCTURE DESIGN...................................................................................................... 8
5.4.1 Triangle of shape, function and use ........................................................................... 8
5.5 MOBILITY IMPROVEMENT MENUS ............................................................................................. 8
5.5.1 Pedestrian facilities .................................................................................................. 8
5.5.2 Bicycle facilities ........................................................................................................ 8
5.5.3 Traffic calming as an urban transport strategy............................................................. 8
5.6 THE COST AND BENEFITS OF VARIOUS NMT- PROMOTION MEASURES............................................ 8
5.6.1 Cost Benefit Analysis of NMT-interventions in 4 cities ................................................. 8

Non-motorised transport in developing countries final report
4
5.6.2 Cost and benefits of the pilot interventions in SSATP .................................................. 8
5.6.3 Promising results form the Cost Benefit Analysis ........................................................ 8
CHAPTER 6 IMPEDIMENTS, REQUIREMENTS AND OPTIONS FOR NMTPROMOTION ............................................................................... 8
6.1 IMPEDIMENTS, REQUIREMENTS AND OPTIONS FOR FURTHER DEVELOPMENT OF NMT....................... 8
6.1.1 Lack of traffic safety .................................................................................................. 8
6.1.2 Requirement: improve safety..................................................................................... 8
6.1.3 Bicycle theft and lack of parking facilities .................................................................... 8
6.1.4 Requirement: prevent bicycle theft and offer parking facilities ...................................... 8
6.1.5 Lack of proper infrastructure...................................................................................... 8
6.1.6 Requirement: provide infrastructure and facilities ........................................................ 8
6.1.7 Taxes, fees and procedures ...................................................................................... 8
6.1.8 Requirement: remove procedures and registration obligations ..................................... 8
6.1.9 Unaffordable prices and fees for urban poor ............................................................... 8
6.1.10Requirement: make bicycles affordable for the poor .................................................... 8
6.2 STAKEHOLDER PARTICIPATION................................................................................................ 8
6.2.1 Stakeholder participation: key to success ................................................................... 8
6.2.2 Lessons learned from the African case study.............................................................. 8
6.3 ORGANISATIONAL REQUIREMENTS FOR LOCAL NMT INTERVENTIONS ............................................ 8
CHAPTER 7 OBJECTIVES AND STRATEGIES FOR INCREASED ROLE OF NON-MOTORISED TRANSPORT IN URBAN ECONOMIES.................... 8
7.1 INTRODUCTION..................................................................................................................... 8
7.2 THREE OBJECTIVES: IMPROVED QUALITY OF LIFE, ECONOMIC GROWTH AND POVERTY REDUCTION... 8
7.2.1 Quality of Life and Economic Growth ......................................................................... 8
7.2.2 Poverty Reduction .................................................................................................... 8
7.3 FIVE STRATEGIES: PARTICIPATION, URBAN PLANNING, EDUCATION & SENSITISATION, INCENTIVES ANDPROMOTION, CAPACITY BUILDING........................................................................................... 8
7.3.1 Participation ............................................................................................................. 8
7.3.2 Urban Planning......................................................................................................... 8
Information campaigns and other promotion activities........................................................... 1
7.3.4 Incentives and Promotion.......................................................................................... 8
7.3.5 Capacity Building...................................................................................................... 8
7.4 NON-MOTORISED TRANSPORT SYSTEM APPROACH: INTEGRAL AND INTEGRATED ............................. 8
CHAPTER 8 CONCLUSIONS AND RECOMMENDATIONS................................ 8
8.1 CONCLUSIONS ..................................................................................................................... 8
8.2.1 Recommendations.................................................................................................... 8
8.2.2 Additional recommendations ..................................................................................... 8
Non-motorised transport in developing countries final report
5
LIST OF TABLES
TABLE 1 PERCENTAGE OF EACH TRIP PURPOSE IN TOTAL BICYCLE USE ................................................. 8
TABLE 2 BICYCLE OWNERSHIP IN VARIOUS COUNTRIES....................................................................... 8
TABLE 3 CHANGE IN SHARE OF CYCLING IN COMMUTER TRIPS PER DISTANCE CLASS IN THE NETHERLANDS, 1982 -1995 ( %)...................................................................................................................... 8
TABLE 4 MODAL SHARE PER DISTANCE CATEGORY (1995).................................................................. 8
TABLE 5 TRIP PURPOSES BY MODE OF TRANSPORT IN THE NETHERLANDS, 1998 (IN %) .......................... 8
TABLE 6 VALUATION OF ATTRIBUTES OF TRANSPORT INFRASTRUCTURE/SERVICES BY GENDER ................. 8
TABLE 7 ATTITUDE AND ASSESSMENT OF NMT-USERS (%)................................................................. 8
TABLE 8 ASSESSMENT OF CYCLING IN TWO CITIES BY NON-NMT USERS (%) ......................................... 8
TABLE 9 ACTORS AND THEIR RESPONSIBILITIES................................................................................. 8
TABLE 10 INTENDED CHANGES IN BEHAVIOUR BY MOTORISTS IN THE EVENT OF DRIVING LESS (IN %) ........... 8
TABLE 11 NUMBER OF CYCLE VICTIMS FROM 1980 TO 2010 (EXPECTED)............................................... 8
TABLE 12 THE PROBABILITY OF A FATAL CAUSE FOR A PEDESTRIAN AFTER A COLLISION WITH A CAR AT VARIOUSSPEEDS 8
TABLE 13 TYPES OF INTERVENTION TO GET A PROPER BALANCE IN SHAPE, FUNCTION AND ACTUAL USE ....... 8
TABLE 14 TWO MENUS OF INTERVENTIONS USED IN THE SSATP PROJECT.............................................. 8
TABLE 15 NEEDS OF PEDESTRIANS AND IMPERATIVES FOR PLANNING AND DESIGN.................................... 8
TABLE 16 CHANGES IN TOTAL AMOUNT OF TRIPS AND KILOMETRES FOR THREE MODES OF TRANSPORT DURINGEVENING PEAK HOURS (16.00 – 18.00 HR) DUE TO BICYCLE POLICY, 1998. .............................. 8
TABLE 17 AN OVERVIEW OF THE MAIN COSTS AND BENEFITS OF INTERVENTIONS TESTED IN SSATP PROJECT8
TABLE 18 PROPORTION OF ROAD USERS KILLED IN VARIOUS MODES OF TRANSPORT AS PERCENTAGE OF TOTALFATALITIES (IN %)............................................................................................................ 8
TABLE 19 BICYCLE THEFT AND LOCATION IN CITIES UNDER SURVEY (IN PERCENTAGES) ............................. 8
TABLE 20 USER PARTICIPATION INSTITUTIONS AND POTENTIAL ROLE IN NMTPROJECTS............................. 8
TABLE 21 THE FOUR POLICY FIELDS AND THEIR PROMISING POLICY ELEMENTS DURING THREE PHASES OF NMT. 8
LIST OF FIGURES
FIGURE 1 MODAL SHARE FOR VARIOUS ASIAN CITIES (*OTHER = INCLUDING CARS) .........................8
FIGURE 2 TRENDS IN MODAL SHARE FOR BICYCLES IN TOTAL TRIPS IN 2 CITIES, 1920-1995..............8
FIGURE 3 NMT USE AND MOVEMENT CHARACTERISTICS AND ITS INFLUENCING ENVIRONMENTS .........8
FIGURE 4 THE FIVE SPEARHEADS OF DUTCH BICYCLE POLICY.......................................................8
FIGURE 5 TARGET GROUPS IN THE BMP...................................................................................8
FIGURE 6 THE TRIANGLE SHAPE-FUNCTION-USE ........................................................................8
FIGURE 7 COST AND BENEFITS OF 2 SETS OF INTERVENTIONS IN AMSTERDAM, 1998.......................8
FIGURE 8 COST AND BENEFITS OF THE MASTERPLAN IN BOGOTA, COLOMBIA. ................................8
FIGURE 9 COSTS AND BENEFITS OF PRO-BICYCLE POLICY IN MOROGORO, 2000-2010.....................8
FIGURE 10 COST AND BENEFITS OF ROAD RECONSTRUCTION IN DELHI. ...........................................8

Non-motorised transport in developing countries final report
6
LIST OF ANNEXES
ANNEX 1 TERMS OF REFERENCE: WORLD BANK URBAN TRANSPORT STRATEGY REVIEW
ANNEX 2 RESOURCE PERSONS
ANNEX 3 STUDY PLANNING MATRIX
ANNEX 4 SELECTED BIOGRAPHY
ANNEX 5 STEP-BY-STEP APPROACH
ANNEX 6 NEGOTIATED GOVERNMENT
ANNEX 7 PROBLEM TREE
ANNEX 8 OBJECTIVE TREE
ANNEX 9 DELFT STATEMENT
ANNEX 10 COST BENEFIT ANALYSIS OF A BICYCLE POLICY
ANNEX 11 ANALYSIS OF EFFECTIVENESS AND EFFICIENCY (CBA) OF TEST INTERVENTIONS IN SSATP

Non-motorised transport in developing countries final report
7
CHAPTER 1 NON-MOTORISED URBANTRANSPORT STRATEGY – A REVIEWOF DUTCH EXPERIENCE
1.1 Background to this study
This paper contributes to the World Bank’s Urban Transport Strategy Review. This reviewis the first comprehensive and detailed examination of this subject since the previousUrban Transport Strategy was published in 1986. Its aim is to be informed and supportedby a series of other papers as well, collating experience and best practice on differenttopics in urban transport. The papers, of which this document is one, identify criticalproblems and issues, the outcome of interventions, organisational models, etc. Thepapers will be widely disseminated as the basis for improving understanding andcollaboration in the field of urban transport in developing countries. The StrategyDocument will reflect this digest of experience.
Through the Netherlands Trust Fund, the World Bank is funding a number of reviews ofrelevant Dutch experience in urban transport. Both direct experience in developingcountries and experience within The Netherlands are included. The general objective ofthe studies is to define if, and in which way, Dutch experience in urban transport planningand administration in large and medium size towns is adaptable to other countries, andunder which conditions.
Non-motorised transport (NMT) plays a dominant role as an affordable, but sometimesunpleasant and dangerous, main mode of transport in some of the very poor countries.The consequence is that it is frequently associated with poverty, low-tech and notinnovative, as something that countries aim to develop out of. It is beginning to play anincreasing role, albeit usually as a convenient and non-polluting local distribution mode inmulti-modal systems, in a number of high income industrialised countries such theNetherlands. The World Bank is particularly concerned to ensure that the strategy, whichit pursues for urban transport development, is sensitive to the need for proper utilisationof the potential of non-motorised transport. The assignment of Interface for CyclingExpertise Holland (I-CE) to produce this report is evidence for the legitimate role of non-motorised transport in urban transport development.
1.2 Objectives of this study
The objective of the study is to identify the factors determining the effectiveness of non-motorised transport in contributing to the health of the city economy, as well as the impacton the quality of life in developing countries. The study will also pay attention to thequestion of the applicability of arrangements developed in the Netherlands in developingcountries.
1.3 Expected output
The study aims to produce the following output:

Non-motorised transport in developing countries final report
8
• Appropriate roles of NMT at different stages for development identified;• Opportunities for NMT in developing countries, including suggested key actors and
necessary actions to be included in NMT strategies identified;• Factors which may limit the use of, and any systematic biases against NMT in
developing countries identified;• Criteria for the separation and/or integration of motorised and non-motorised road-
users suggested;• Potential gender and cultural biases for NMT use identified and approaches to
overcome these identified;• Benefits of the low income population from improvements in NMT conditions
highlighted;• Circumstances in which NMT should be encouraged as a mode of public transport in
developing countries specified;• Options for financing NMT interventions suggested; and• Information on costs and benefits of most important interventions provided.
1.4 Activities
This paper results from the analysis of reports on Dutch experiences, research andpolicy; a series of interviews; and the international seminar “Velo Mondial 2000” held inJune 2000 in Amsterdam.
Members of the sounding board have discussed the draft report and provided theconsultant useful information, advice and recommendations.
1.5 Organisation of the report
In this report we will consider the significance of non-motorised transport for individualmobility and user costs, for traffic management and road safety, for the city climate andeconomy, for health and the environment. We will support this with calculations andestimations regarding the economic costs to invest in facilitating walking and cycling andthe benefits as a result.
Though walking and cycling have common interests in claiming a treatment as fully-fledged modes of transport and as therefore ask for good planning and facilities, we willalso pay attention to conflicting interests between the two.
The paper presents a synthesis of the outcome of aforementioned activities. In chapter 2a general introduction will be given about the importance and functionality of NMT in theNetherlands as well as in developing countries. Reference is made to the role of NMTduring different stages. It provides insight in the social, economic and cultural dimensionsof NMT use and attitude and perception of NMT-users and non-users. Furthermore, amodel will be presented that helps to explain the use of NMT.
Chapter 3 identifies and describes the actors or stakeholders in NMT development,institutional and policy arrangements as regards NMT development. It will focus on thedevelopment of NMT in the Netherlands. The chapter will deal with lessons learned fromthe Dutch approach, as well as its applicability for other countries. Financing mechanismfor NMT-interventions and capacity building will be discussed in more detail.
Chapter 4 will be about planning for cycling and walking. We start with some discussionabout transport management and planning, specific and generic planning. During theplanning process there are several moments that NMT and MT interests should beweighed. Section 4.4 explains at what moments that might take place in three differentsettings. We will continue with a practical example from the Netherlands and Delhiconcerning the use of networks as a basic planning concept. The development of anurban mobility plan for pedestrian and bicycle traffic is explained after that. In a growingnumber of countries 5 major criteria for NMT planning are used. In section 4.7 we will

Non-motorised transport in developing countries final report
9
elaborate on that. Chapter 4 will be concluded with a section on the safety managementapproach.
Chapter 5 focuses on technical issues; it kicks off with some views on the issue ofsegregation versus integration. The chapter continues with arguments for using ahierarchy in the urban road network system for planning purposes. The mobilityimprovement menus as they have been used in the SSATP programme will be reviewed.The facilities for pedestrians and cyclists will be studied in detail. Finally, the costs andbenefits of NMT interventions will be highlighted, as they have been calculated for 4 cities(I-ce) and SSATP.
In chapter 6 the biases and impediments for NMT development and options to overcomethese will be discussed. Furthermore, we present an overview of user participationmodels and conclude the chapter with organizational conditions to be met.
Chapter 7 defines objectives or principles for the development of NMT. It will elaborate onthree principles, i.e. quality of life, economic growth and poverty reduction. It will showNMT’s contribution in achieving the objectives. Suggestions are made with respect topotential strategies for achieving the above-mentioned objectives.
In the final chapter, we will draw conclusions and discuss about a suitable approach topromote NMT use in developing countries. We will conclude with specificrecommendations for the Bank and some recommendations about planning for NMT ingeneral.
Before we kick off with chapter 2, the introductory chapter, the reader is referred to Annex1 for the Terms of Reference for this study and Annex 2 for the study planning matrix, inwhich objectives, output and activities are mentioned.
In the remaining of the paper Non-Motorised Transport will be abbreviated with NMT.NMT includes all means of transport that are human powered. In our paper we primarilyfocus on cyclists and pedestrians. Because of lack of available data we will not focus onnon-motorised freight transport, unless otherwise stated.

Non-motorised transport in developing countries final report
10
CHAPTER 2 NON-MOTORISED URBANTRANSPORT
2.1 Non-Motorised Transport in Developing Countries
“Reduced Mobility and limited accessibility have become a major problem for theArequipa Metropolitan region and its urban transport system. The problems areexacerbated by inefficient traffic management and poor driving behaviour, aside fromthe lack of adequate transport facilities and related infrastructure. Congestion andabsence of adequate emission standards and control systems have attributed to airpollution and noise levels, especially within CBD’s limits. Moreover, local climaticpatterns are becoming favourable for thermal inversion, thus creating potential transportrelated health hazards. Increased travel distance and time spent on daily trips for basicactivities, caused by urban growth and restricted modal split options have resulted inincreased car ownership and use” (Zuniga, 19961).
So far the excerpt of the report on sustainable transport in Peru. The reason why westart this chapter with this rather extensive quote is that is shows perfectly well thesituation in which many urban areas all over the world are: diminishing mobility andaccessibility, worsening health and environmental situation, lack of transport facilitiesand infrastructure, poor planning and traffic management and neglect of multi-modaltransport systems. In such a harsh environment, NMT was and is put under quiteserious pressure.
But let’s return to the relevance of NMT-modes in developing countries. It is correctlyclaimed that NMT is an integral element of urban transport in developing countriesworld-wide. Its significance and function varies per continent however. In severalcountries in Asia, China on top, cycling has been the most or at least second mostimportant means of urban transport.
The available figures for walking are highly inaccurate. There are major differencesbetween data sources.Figure 1 shows the share of various modes in 6 Asian cities. In Indian cities the share ofNMT at peak hours ranges from 30 up to 70%; trips undertaken by bicycle account forabout 10% to 35% of the total trips2. Bicycles are not only important for the entire trip(from origin to destination), but, particularly in developed countries, also as a feedermode to public transport. In a rich country like The Netherlands, 27% of all trips is bybicycle, whereas only 5% is by public transport. Although bicycle trips to and from publictransport stops are only a small proportion of the total number of bicycle trips, it is truethat the bicycle has a role to play when it comes to the promotion of public transport. Itspotential as feeder system is very high.

Non-motorised transport in developing countries final report
11
Source: International Road Federation, 1998.Figure 1 Modal share for various Asian cities (*other = including cars)
Walking remains important too as a mode in an integral transport system. The case ofAfrica shows that in Nairobi and Dar es Salaam for instance nearly half of the trips areentirely made on foot, whereas for the remaining share a combination is made of publictransport and walking. Just only 10% rely on private motorized transport. Thedependence on NMT is even higher in secondary (-sized) cities. The finding that publictransport plays an important role in urban transport, as shown for some Asian cities inthe figure above, is also true for many other cities in the developing world. In a largenumber of cities, especially in Asia, the share of buses and trains is high; they arewidely used by the middle income and poorer sections of the population. Walking is inmany developing countries the most important means of transport, followed by publictransport. Cycling has a smaller share of total number of trips, except for a few (big)exceptions
The function of bicycles differs widely between the continents. In Asia and Africa,generally spoken, bicycles serve as a means of transport of goods and people, while inthe Americas the recreational purpose of cycling is important. About trip purposeshardly any statistical data is available. The “local background study” provides someinsight in trip purposes in 5 selected cities. Table below presents the findings. As can beseen, the bicycle is primarily used for going to and from work. In Delhi this is by far themost important purpose. The suggestion that in Latin America the bicycle is used as ameans of recreation is not supported by these findings. However, this probably has todo with the organization of the specific surveys in Lima and Leon; the surveys tookplace at moments that no recreational use of bicycles can be expected.
0 %
2 0 %
4 0 %
6 0 %
8 0 %
1 0 0 %
Dhaka
Shang
hai
Jaka
rta
Kuala
L.Man
ila
Bang
kok
other
paratransi t
bus
bicycles
walk ing
Non-motorised transport in developing countries final report
12
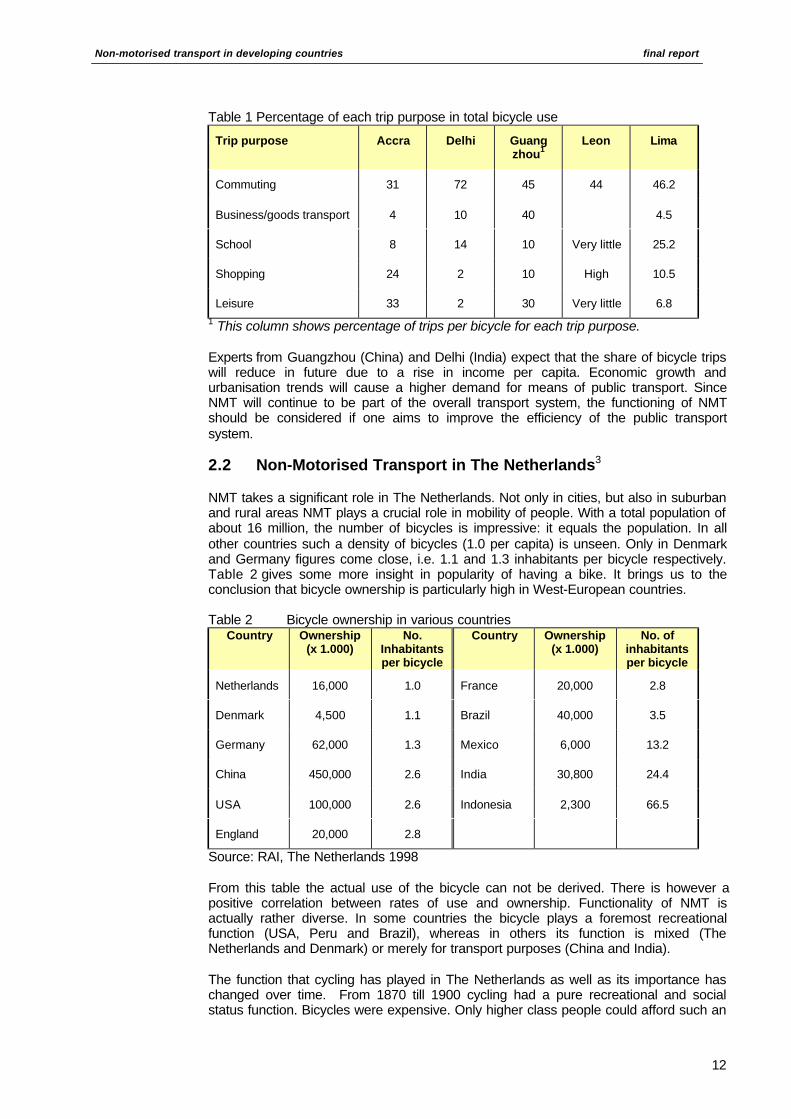
Table 1 Percentage of each trip purpose in total bicycle use
Trip purpose Accra Delhi Guangzhou1
Leon Lima
Commuting 31 72 45 44 46.2
Business/goods transport 4 10 40 4.5
School 8 14 10 Very little 25.2
Shopping 24 2 10 High 10.5
Leisure 33 2 30 Very little 6.81 This column shows percentage of trips per bicycle for each trip purpose.
Experts from Guangzhou (China) and Delhi (India) expect that the share of bicycle tripswill reduce in future due to a rise in income per capita. Economic growth andurbanisation trends will cause a higher demand for means of public transport. SinceNMT will continue to be part of the overall transport system, the functioning of NMTshould be considered if one aims to improve the efficiency of the public transportsystem.
2.2 Non-Motorised Transport in The Netherlands3
NMT takes a significant role in The Netherlands. Not only in cities, but also in suburbanand rural areas NMT plays a crucial role in mobility of people. With a total population ofabout 16 million, the number of bicycles is impressive: it equals the population. In allother countries such a density of bicycles (1.0 per capita) is unseen. Only in Denmarkand Germany figures come close, i.e. 1.1 and 1.3 inhabitants per bicycle respectively.Table 2 gives some more insight in popularity of having a bike. It brings us to theconclusion that bicycle ownership is particularly high in West-European countries.
Table 2 Bicycle ownership in various countriesCountry Ownership
(x 1.000)No.
Inhabitantsper bicycle
Country Ownership(x 1.000)
No. ofinhabitantsper bicycle
Netherlands 16,000 1.0 France 20,000 2.8
Denmark 4,500 1.1 Brazil 40,000 3.5
Germany 62,000 1.3 Mexico 6,000 13.2
China 450,000 2.6 India 30,800 24.4
USA 100,000 2.6 Indonesia 2,300 66.5
England 20,000 2.8
Source: RAI, The Netherlands 1998
From this table the actual use of the bicycle can not be derived. There is however apositive correlation between rates of use and ownership. Functionality of NMT isactually rather diverse. In some countries the bicycle plays a foremost recreationalfunction (USA, Peru and Brazil), whereas in others its function is mixed (TheNetherlands and Denmark) or merely for transport purposes (China and India).
The function that cycling has played in The Netherlands as well as its importance haschanged over time. From 1870 till 1900 cycling had a pure recreational and socialstatus function. Bicycles were expensive. Only higher class people could afford such an

Non-motorised transport in developing countries final report
13
investment. At the beginning of the last century, though prices were still high, thebicycle became more accessible to other classes as well as a result of economic growthand higher incomes. From 1920 till 1950 the bicycle was a necessary, and for mostpeople only means of transport. Its role then became essential in everyday life. Bothusage of car and public transport was expensive. Moreover, urbanisation andconcentrated forms of working and living in cities did not hamper the dominant role ofbicycles. From 1950 till 1975 however, the bicycle got a negative image. In the rapidlydeveloping economy of post-war Netherlands, the bicycle represented the past. Thisidea about bicycles prevails in many developing countries nowadays. Further, a processof suburbanisation and long-distance commuting undermined the position of the bicycleeven more. Urban planners were primarily engaged in providing a suitable environmentfor motorised traffic. It lasted till 1975 that the negative image of cycling changed due tothe combination of serious accessibility problems of the inner-city, increasedenvironmental awareness and political activism. The bicycle is rediscovered byindividuals, and used for both utility, health and recreational purposes4. TheGovernment is rediscovering the bicycle as a quasi-collective item, and stimulates itsuse in order to reduce the negative external effects of car use and to increase themobility in urban areas. For example, the Government provides subsidies and taxreductions to reduce cost price on sales and repairs (by lowering the VAT) and investsquite significantly in infrastructure. The trend of bicycle ownership is clearly visible fromthe below figure. As a comparison, the Danish cycling experience has also been shown.Although the actual values are different, the shape of the curve is similar in manyEuropean countries: relative high proportions of cycling between the thirties and fifties, adecline of cycling coinciding the mass motorization, and a rediscovery of the bicycle(may it be on lower levels) in the last decades of the 20th century.
Figure 2 Trends in modal share for bicycles in total trips in 2 cities, 1920-1995.
The below table shows the bicycle share in commuter traffic trips for each distanceclass between 1982 and 1995. It shows that the overall bicycle share is stable, i.e.
1930 1940 1950 1990198019701960
0
80
40
60
20
Amsterdam Copenhagen

Non-motorised transport in developing countries final report
14
around 27%. Since total mobility has increased during that period, it means that anactual increase of number of bicycle trips has taken place. The share of cycling in shorttrips (< 5 km) has grown in 1995 compared to 1982 with 6 to 7%. The increase in thisdistance category is primarily at the expense of the car. But as trips tend to becomelonger, and the share of cycling for the longer distance category is lower than for theshort distance trips, the overall share of cycling is more or less stable. In fact thegrowing share of longer trips might turn out to be the biggest threat for the future role ofcycling.
Table 3 Change in share of cycling in commuter trips per distance class in theNetherlands, 1982 -1995 ( %).
1982 – 1984 1986 1990 1995
0 - 2.5 km 47.9 48.1 49.4 52.1
2.5 - 5 km 43.1 45.2 51.4 51.1
5 - 7.5 km 27.4 27.1 31.0 32.5
7.5 - 10 km 19.7 21.1 22.9 24.2
> 10 km 4.3 4.3 3.6 4.2
Total 27.7 26.8 27.9 27.4
Source: The Dutch Bicycle Master Plan (1998)
Table 4 Modal share per distance category (1995)
Bicycle Passen-ger cardriver
Carpassen-
ger
Publictransport
Walking Other Total
0 - 2.5km
16.1 7.4 2.3 0.3 14.6 0.6 41.3
2.5-
5 km 6.6 5.9 2.1 0.5 1.3 0.4 16.7
5 - 7.5km
2.8 5.4 2.0 0.6 0.5 0.4 11.8
7.5-
10 km 1.6 6.6 2.2 1.1 0.1 0.4 12.0
> 10 km 0.7 9.7 4.5 2.8 0.1 0.5 18.2
Total 27.8 35.0 13.2 5.3 16.6 2.1 100
Source: The Dutch Bicycle Master Plan (1998)
From this table it can be derived that the majority of trips is still short. Of all trips shorterthan 2.5 km 40% has been made by foot, the second important mode after cycling.When commuter trip distances can be reduced by sound urban planning and spatialpolicy, than the opportunity for more bicycle trips will occur. However, the trend is thatthe share of trips shorter than 2.5 km is less in 1995 compared to 1980, respectively41% and 45%. Especially the share of longer trips (> 15 km) is growing.
During the fifties to seventies some developments which were mutually reinforcing eachother (trends in spatial planning, growing car ownership, trends in transport planningand predominant cultural images) were detrimental for the use of the bicycle. After mid-seventy the situation has changed. The function of NMT has been re-valued; NMT has

Non-motorised transport in developing countries final report
15
been integrated in overall transport planning, though opinions between spatial planners,politicians and citizens about the best way to do it, may still differ.
In Table 5 purposes are presented for trips by foot and bicycle (in percentage) for theNetherlands. It shows that the distribution of bicycle trips over the various purposes,hardly differ from the total of all modes in general. However, trip characteristics permode are quite different as has been argued before.
Table 5 Trip purposes by mode of transport in the Netherlands, 1998 (in %)
Walking Cycling Total
Commuting 5 15 15
Business trip 5 2 5
Social 11 11 14
Shopping 25 26 23
Education 11 14 8
Leisure 10 12 12
Get around 16 3 4
Other 19 17 18
100 100 100
Source: CBS the Netherlands, 1998.
In this chapter we won’t go into much detail concerning the Dutch experiences andprojects. Chapter 3 refers. Some basic information and lessons learnt from the DutchMasterplan will be presented. Chapter 5 goes into more detail about the experiences inDelft, a Dutch city where a network planning approach has been pursued.
2.3 The NMT-user: a Prisoner of his mode? Captive vs ChoiceModes
The Dutch experience shows that the share of bicycles/pedestrians in the trips made isrelatively constant. Some changes between the distance classes can be observed.Many other countries, developing countries in particular, show an impressive decreaseof NMT in the modal share. Evidence from these countries proves that cyclists andpedestrians hardly choose voluntarily for using the bicycle or going on foot5. For themthere are no other options to choose from; they are the so called captive riders orwalkers. People who do have options are deterred from using bicycles (or going onfoot), by a lack of facilities for safe and convenient walking and cycling as well as by the“poverty” image NMT has. It suggests that users in the Netherlands will have differentreasons for using NMT than those so-called captive riders and walkers in developingcountries. That will consequently have an impact on the strategy to promote NMT. TheDutch choice for NMT is typically not an exclusive choice of mode, but an inclusivechoice per trip. The Dutch transport system maintains parallel public infrastructures andservices for walking, cycling, public transport and private car. The existence of vehiclechoice and parallel infrastructure and services allows for sensible mode-chains, inparticular the cycling-train and walking-bus chains. In the range of options the privatecar choice is still dominant.
This captive ridership in a wide number of countries also explains why men and womentravel long distances on foot or bicycle. For example, in outer areas of Delhi, non-

Non-motorised transport in developing countries final report
16
motorised vehicles and pedestrians are present on most intercity highways and travellong distances6.
The result of this finding is that in case of a dominant “captive ridership” one shouldprimarily focus its interventions and policies on preventing these NMT-users to switch toanother mode, than to focus on motivating non-NMT-users to walk or cycle. Byproviding facilities that increase safety, directness, speed and comfort one will attractnew users as well.
2.4 Role of NMT at Different Stages of Development
The topic dealt with in section 2.3 is closely linked to the role of NMT at different stagesof development. Economic development in a number of poor countries initially goeshand in hand with a decrease in NMT and an increase in car and motorbike ownership.Growth rates of the number of motorbikes in the last 10 years in Vietnam areastonishing. In Ganghzou bicycle trips are more and more replaced by car trips andpublic transport. A severe drawback in the economy of Nigeria in the late eightees had asignificant impact on vehicle ownership and trips made by car. From the observedtrends we can conclude that economic growth does not automatically lead to increaseduse of NMT in urban areas in developing countries, the reverse may be more likely.
Below we present two different scenarios of future transport development. In both caseswe assume that no NMT-interventions are carried out.
Inthe
bicycle/pedestrian motorbike
carpublic transport
Reduction of no. of trips Increase of no. of trips

Non-motorised transport in developing countries final report
17
above figure, we have elaborated on the Chinese or Vietnamese case. In thesecountries walking and cycling have been the major way to move around in the city untilquite recently. Therefore the circle at the top left is biggest. The red ring means areduction of the number of trips during the last few years has taken place. Withoutinterventions, the process is likely to continue. Not only people choose voluntarily for amore “prestigious” means of transport, they are also more or less forced to. Tripdistances become longer, roads are upgraded and even not allowed for cyclists, andNMT-users feel more and more endangered as safety is decreasing due to increasedvolume and speed of MT.
The green rings mean an increase in trips. The inner ring is the initial situation (let’sassume 1995), the outer ring the situation in 10 years time from now. It is expected thatthe growth for the three other modes (public transport, car and motorbike) will comepartly from the switch from pedestrians/bicycle to these three, and partly from theincrease in mobility. Namely, people travel more than they used to do 10 years ago1.
From the figure one may derive that a road user will probably try to motorise his or hertrips; once that is possible, the road user will choose for an individual one with which hecan identify. The car can thus be assumed as the “highest” order of transport:motorised, highest status and non-public.
To some extend the same starting point and process can be observed in some Africancountries. There are differences: the importance of pedestrians is actually much highercompared to the bicycle; changes due to income increase will be from walking intocycling; therefore NMT use will be relatively stable (internal NMT changes); the role ofmotorbikes which are not very popular now won’t change so much. Therefore, theincrease is expected to be in public transport and private cars.
This scenario is actually quite comparable with the situation in the post-war Europewhen a sudden decrease in NMT could be observed and the use of other modesincreased due to similar reasons (which are not all explained here).
Below a figure is presented which represents a situation that can be found in countriesof Latin America. It shows the absence of motorbikes and the minimal role of walkingand cycling as a means of transport. Growth will be especially in trips per car and publictransport.
1
Godefrooij argues that an increase in travel time and trips is unlikely. Through time the number of trips andtime spent on commuting per person is fairly constant (See G.Hupkes, Gasgeven of afremmen,toekomstscenarios voor ons vervoerssysteem, 1977). The only difference is that people will travel further, notmore often or longer. Werner Brög states that ‘market of trips is a closed market’. If so, than an increase inone mode of transport, should generate a decrease in another (generally, the number of trips by footdecreases). Godefrooij suggests that this also the case in Asia. ‘Travel more’ is only valid when we look atkilometre/person. The reason for this distinction is that it brings us to the real issue of transport systems: toenable people to be engaged in economic and social activities. One can improve the quality of the system(and so participation in activities) by enlarging the options of choosing the transport mode. A more or lessforced extension of the trip generates more costs, but not necessarily more income.

Non-motorised transport in developing countries final report
18
The issue of non-motorised freight transport is not dealt with in these two figures due tolack of data. However, experts expect that without promotional activities (or without theremoval of regulations that makes it difficult for cart riders to operate), this transportmode will disappear gradually. Interesting to see is the emergence of new, innovativenon-motorised freight transport in congested cities in the USA and the Netherlands.However, it is still doubtful whether these bicycle couriers and recumbent freightbicycles can compensate for the decrease of the more “traditional” non-motorisedfreight transporters in developing countries.
In general, the above expected trends suggest that without an active policy to promoteNMT, its overall share will decrease.
2.5 Social, Economic and Cultural Dimensions of NMT Use
The prevalence of NMT-use is very much related to social, economic and culturalenvironment, which are differing per area and stage of economic development. Belowwe will go into some more detail and conclude with a profile of the existing NMT-user.As section 2.2 about cycling in the Netherlands has shown us, the use of NMT variesover time, as does its user. This statement about the dynamics of NMT is valid for othercountries as well.
Increase of trips
Bicycle/pedestrian
carpublic transport
Decrease of trips

Non-motorised transport in developing countries final report
19
2.5.1 The Socio-Economic background of NMT-users
As is stated in chapter 1, NMT is frequently associated with poverty. It remains the mainmeans of transport for large poor sections of some of the very poor countries. Thesesections are often referred to as the captive user (see section 2.3). Actually, this pictureis just partly correct. Namely, the share of NMT in kilometres as well as in number oftrips is significant in some of the richest countries in the world (the Netherlands,Denmark, Germany, and Switzerland). Further, in some developing countries ownershipof bicycles is highest in the middle-income strata. The poor are usually excluded fromthis means due to the lack of finances. A survey, carried out in 1996 reveals that amajority (54%) of bicycle users in Delhi (India) earns a family income of over 2000 Rps,indicating that bicycles are not just owned by the poor. Only 19% of the users earns lessthan 1500 Rps. A similar survey in Leon (Nicaragua) finds out that 89% of the users isrelatively well off (based on housing conditions), and certainly doesn’t belong to thepoorest strata in society.
With respect to age, the NMT-share of each age-cohort correlates closely with its sharein total mobility. This means that the age-cohort 25-35 shows the highest share of NMT-use; it is equally the most mobile age group. Data from Guangzhou, Delhi, Leon andAccra support this conclusion. It is author’s impression however that in medium-sizedcities in Vietnam, the age group 10 – 20 is of most importance. Nearly all secondaryschoolchildren go to school on bike, since public transport is not appropriate.Motorbikes are taking over more and more the position of the bicycle as a means oftransport for the age group 25 - 35.
2.5.2 NMT and its gender dimension
As can be found in all statistics, women are using far less the bicycle as means oftransport in developing countries as men do. Figures from India (New Delhi), Ghana(Accra), Peru (Lima) and Nicaragua (Leon) show clearly that there is a strong genderbias in the use of the bicycle. Men’s share is 100%, 99%, 84.6% and 90% of all usersfor the aforementioned cities. In Guangzhou (China) such a bias is not existing. Author’simpression is that in Vietnam for instance the majority of cyclists is female (data islacking). However, China and Vietnam are exceptions to the overall picture elsewhere.Nevertheless, these exceptions can help us in identifying the reasons for and ways toovercome the gender bias. 2
Some reports refer to the social or moral fabric/construction of society in which awoman should stay at home, or should not go around in such an inelegant way. Thoughthis might be a valid reason in some cases, in many others it is probably not. Forinstance, the first explanation (women should stay at home) conflicts with the findingthat women’s share in using public transport is generally much higher. The secondexplanation (the elegance excuse) is not consistent with the fact that these women oftenare engaged in “rough” jobs. In these cases it has probably more to do with intra-household decision-making processes (the battle about the bicycle is generally lost bythe female members), lack of money to buy an additional bicycle, insecurity in certainareas and the design of available bicycles (unsuitable for female dresses).
Further, as shows the case in Vietnam and China, campaigns in the sixties andseventies to promote the use of bicycles by both men and women as part of people’sideological and economic liberation contributed vastly to the unbiased use. This showsthat the present bias should not be taken for granted by policy makers.
Data from the field show the enormous potential of the bicycle for women, particularlythe poorer ones. Data from Tanzania reveals that 90% of the volume transported by ahousehold is carried on a woman’s head. Health reports state that carrying heavy loadsmight result in cervical spondylosis and spinaldeformaties. As women carry out most of
2 In some West-European countries women are the predominant bicycle users. One of the reasons is that thefamily car is often used by the husband.

Non-motorised transport in developing countries final report
20
household transport, a higher rate of bicycle use could reduce their workloadsignificantly and help to prevent some unhealthy effects of their work.
A study on transport services and its gender aspects in Lima (Peru) shows that thispotential female demand for NMT will only be adequately served if services do considersocial safety. The study shows women’s valuation of attributes of transport services andinfrastructure is different from that of men. Women rank the attribute “social safety”much higher than men. Below table refers.
Table 6 Valuation of attributes of transport infrastructure/services by genderranking Women’s valuation ranking Men’s valuation
1 Social safety 1 Speed
2 Road safety 2 Road safety
3 Price 3 Organisation (schedules/routes)
4 Comfort 4 Single fare
5 Courteousy 5 Social safety
6 Hygiene 6 Courteousy
7 Organisation 7 Hygiene
Source: Gomez (2000)7
For recommendations to overcome the gender division in the use of NMT, we would liketo refer to chapter 8.
2.5.3 A profile of the NMT user
The typical bicycle user in urban areas in developing countries is a man, in the agecategory of 25 and 35 and who is employed. His financial status allows him to buy orrent a bicycle. A motorbike or car is far beyond his income level. He prefers to take thebicycle instead of the bus, since it saves money and time. This profile of a “stereotypebicycle-user” can help us in designing interventions for the promotion of NMT. A profileof a typical pedestrian can not be given, since accurate data are missing. However,there are indications that walking is not such a gender-specific activity.
2.6 The user’s and non-user’s perspective and attitude towardsNMT
It is only since quite recent that some attention is being paid to the needs of thepopulation with respect to transport and mobility. The user-perspective was hardly thebasis for transportation planning. In the best scenario traffic counts formed the basis ofthe huge investments in urban infrastructure. Usually it was not. To solve the mobilityneeds of the poor, emphasis had been concentrated on public transport. A supply-driven approach rather than a demand driven one had been pursued. Due to limitedsuccess of the strategy followed, a more qualitative approach was pursued. Usersurveys were conducted. An example of this is the survey carried out in 5 differentlocations in the world (Accra, Delhi, Guangzhou, Leon and Lima) in 19968. Travelbehaviour as such and characteristics of the trip formed the basis of a study. Below,major key findings are presented. They give some ideas about the perception of usersof NMT (bicycles in particular) and of users of public transport (in the case of Leon).
The study in Nicaragua (Leon) shows that 82% of the cyclists interviewed prefers thebicycle to public transport because it is more affordable. A second reason is that thebicycle is quicker and more flexible. While public transport is bound to certain routes,with a bicycle you can get nearly everywhere. A minority of the users sees the bicycleas a means of sports and exercise.
Non-motorised transport in developing countries final report
21
Asked about whether they would switch from bicycle to a motorbike if possible, a vastmajority of cyclists stated they would not: 84% said to prefer to continue cycling due tothe low costs (50%) and to its safety.
A survey in Accra (Ghana) accrues similar more or less results; 42% of NMT-usersconsider the low costs involved as the most important reason to use a bicycle. The time-factor is mentioned by 36%, and its flexibility by another 8%. If compared with othermeans of transport, the bus for instance, respondents actually preferred the bicyclebecause of its costs (98%), speed (96%) and its reliability (94%).
A major difference between Nicaragua and Accra is that in Accra 65% of the cyclistssaid to change from bicycle to motorbike if the situation would allow it (in Leon only 16%would change). Major reasons for not changing are 1) costs (39%), 2) time-saving onshort tracks (13%) and 3) flexibility (14%).
In Lima (N=300) the results show that 70% of the respondents finds that a bicycle isfast, 11% that it is comfortable and 7% that it is safer than walking when asked tomention the most important reason for using the bicycle.
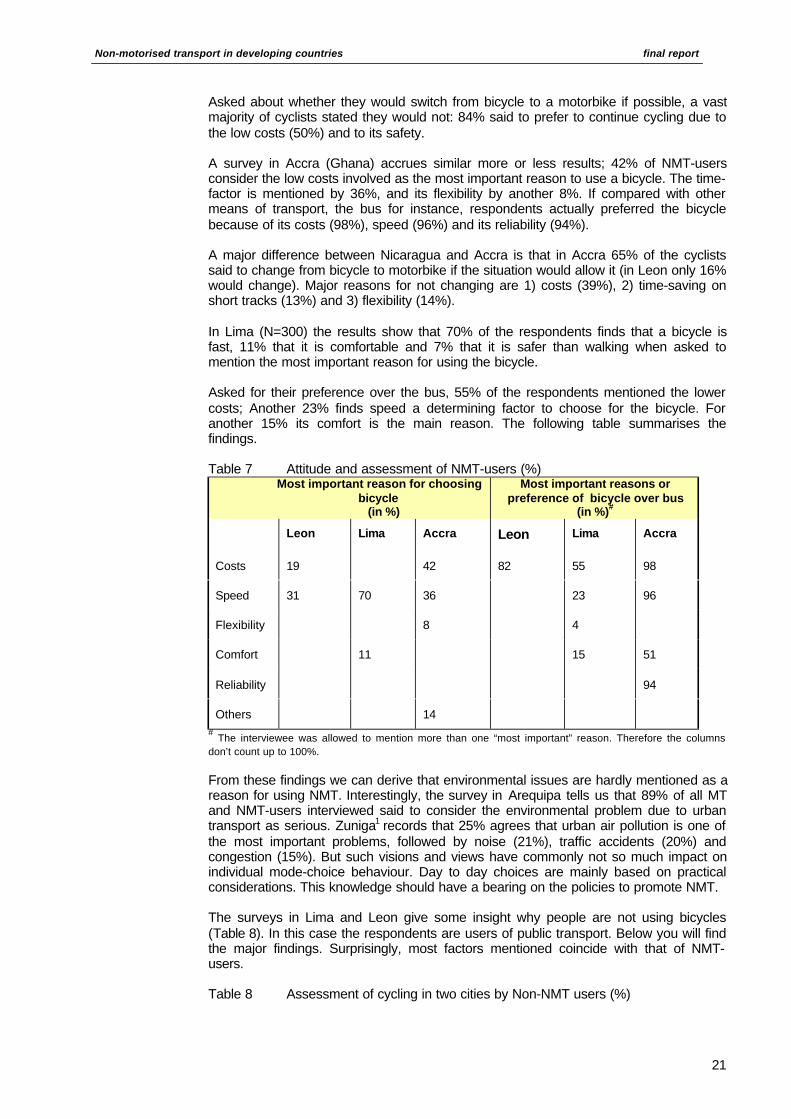
Asked for their preference over the bus, 55% of the respondents mentioned the lowercosts; Another 23% finds speed a determining factor to choose for the bicycle. Foranother 15% its comfort is the main reason. The following table summarises thefindings.
Table 7 Attitude and assessment of NMT-users (%)Most important reason for choosing
bicycle(in %)
Most important reasons orpreference of bicycle over bus
(in %)#
Leon Lima Accra Leon Lima Accra
Costs 19 42 82 55 98
Speed 31 70 36 23 96
Flexibility 8 4
Comfort 11 15 51
Reliability 94
Others 14# The interviewee was allowed to mention more than one “most important” reason. Therefore the columnsdon’t count up to 100%.
From these findings we can derive that environmental issues are hardly mentioned as areason for using NMT. Interestingly, the survey in Arequipa tells us that 89% of all MTand NMT-users interviewed said to consider the environmental problem due to urbantransport as serious. Zuniga1 records that 25% agrees that urban air pollution is one ofthe most important problems, followed by noise (21%), traffic accidents (20%) andcongestion (15%). But such visions and views have commonly not so much impact onindividual mode-choice behaviour. Day to day choices are mainly based on practicalconsiderations. This knowledge should have a bearing on the policies to promote NMT.
The surveys in Lima and Leon give some insight why people are not using bicycles(Table 8). In this case the respondents are users of public transport. Below you will findthe major findings. Surprisingly, most factors mentioned coincide with that of NMT-users.
Table 8 Assessment of cycling in two cities by Non-NMT users (%)

Non-motorised transport in developing countries final report
22
Positive factors aboutcycling(Leon)
Negative factors about cycling
(Leon) (Arequipa)
Costs 33 Chance of gettingaccident
45 35
Speed andmobility
27 Risk of theft and ofassaults
11 25
Comfort 7 High costs (taxes andhigh spare parts)
10
Health/exerciseand pleasure
16 Lack of respectingtraffic laws
15
Lack of cycle paths 20
Destination too far 10
Steep slopes 5
In their synthesis report7, the authors conclude that in these 5 cities were the studieshave been carried out, the bicycle is considered as a sustainable mode of transport.However, bicycles are perceived as hampering the smooth flow of motorised vehiclesand contribute little to mobility in the city. Cycling has a low status in most cities and isregarded in some as a vehicle for men only.

Non-motorised transport in developing countries final report
23
2.7 Framework for understanding NMT use
In this chapter attention has been paid to factors that influence NMT-use and ownershipof bicycles in particular. A profile has been drawn up for a cyclist and stakeholders thatmight influence the development of NMT are presented. In this section we will present aframework for better understanding NMT use. The framework therefor gives us insightin which environments or fields we have to make interventions to foster NMT. Figure 3shows a schematic framework that can be derived from the 5 country study carried outby I-ce.
Figure 3 NMT use and movement characteristics and its influencing environments
The circle with trip characteristics and movements is actually the overall denominator forNMT trip lengths and travel time, purpose of trip, modal share, ownership of bicycle,theft and safety. All this will be influenced by the three environments. Hereunder thethree environments are elaborated.
The activity environment consists of factors which determine whether and how a tripis made. Basic questions are then:1. In which activities do I want to participate?2. How can I get there (which options do I have)?
The answers are dependent on the socio-economic conditions (income per capita,employment etc.); land-use patterns and density; demographic background (ageprofile); cultural values which influence the status of walking and cycling and finally theawareness of NMT-benefits.
The comparative study shows that despite similar socio-economic characteristics of itspopulations, large differences exist in the socio-economic background of bicycle usersand trip purpose in the five cities. Differences in building densities and spatial patterns,in bicycle infrastructure, bicycle industry, and institutional support are due to that. A highdensity of development (population and built environment) like in Chinese cities, creates
NMT USE ANDMOVEMENT
CHARACTERISTICS
INSTITUTIONALSETTING
ACTIVITYENVIRONMENT
PHYSICAL &INFRASTRUC-
TURALENVIRONMENT

Non-motorised transport in developing countries final report
24
a favourable condition for NMT use, since travel distances are generally short. Averagetravel distance in big cities of over 2 million inhabitants in China is around 3.3 kilometre.The study indicates that population density correlates (positively) with bicycle use. Forwalking a similar correlation is presumed.
The infrastructure support environment consists of factors that enable people towalk or cycle. It includes a NMT-network with facilities which can be safely andefficiently used; a manufacturing and retail industry that influences the availability andprice of bicycles; and other facilities such as at the workplace, stations, public transportetc, not necessarily part of a NMT-network. The quality of these facilities is of allimportance to their use. In chapter 5 we will introduce the five main criteria forassessing their quality.
The comparative country study shows that in China the government encourages thedesign and construction of a three-tier grade separated road section where a physicaldivision between cars and bicycles is made. In Guangzhou specific pedestrian andcycle facilities are constructed to promote NMT. In the case of Lima and Leon, bothcities with World Bank supported infrastructure investments, the modal share of NMT(cycling) has increased or stabilised, whereas in Delhi (without investments for bicyclepromotion) their share went down from 18% in 1981 to 6% in 1994.
The institutional setting includes people, policy, laws and regulations that might foster(or hinder) the use and purpose of NMT. It comprises of a policy and funds for bicycleand walking infrastructure and facilities, a subsidy and/or credit programme for usingNMT, active promotion campaigns etc. Further, it comprises people, like politicians,planners and transport engineers (supply side) as well as advocacy groups, NMT-representatives and scientists on the other. The attitude and perspective of thesegroups, as well as their own capacity and that of their institution is a decisive factor aswell that influences use and purpose of NMT.
The supportive credit and financial incentives programme in China did many peoplemake use of NMT and buy a bicycle. In many other cases, there is a strong institutionalbias against NMT. Expertise for planning and design of NMT infrastructure is low; taxeson imports are high; special fees for bicycle ownership (Ghana and Leon) are existingand stronger looked after than the fees for car ownership.
Based on this model and its explorative power, Tiwari and Saraf9 stated that theinstitutional support is the key environment since it influences and shapes the other twoenvironments as well.
This model focuses on the use of NMT, especially the bicycle. Actually, one can easilyjustify that the model applies for all transport modes; a person will, once a decision formoving has been made assess what means of transport is available and suits him/herbest for that particular trip. This decision-making will be based on factors as mentionedin the three surrounding circles. This way it becomes clear why NMT is and should betreated as an integral part of traffic and transport policy.
2.8 Conclusion
The important conclusion is that the prevalence of NMT is related to various factors.Individual characteristics or the ones under the “activity” environment play one importantrole. However, as has been shown in this chapter, the institutional context as well as theinfrastructure one, fulfils another important role to understand NMT use and function.The weight of these factors varies geographically and in time. In many countriestendencies point into a direction of more motorised transport in future at the cost ofNMT. This finding urges policy makers to take action. A decline in popularity should notbe taken as granted as has the Dutch case shown. In the following chapter we willtherefore go into more detail about the institutional context, how that might influenceNMT-use. A focus will be on the experiences gained in the Netherlands.

Non-motorised transport in developing countries final report
25
CHAPTER 3 INSTITUTIONAL AND POLICYARRANGEMENTS
3.1 Introduction
In this chapter we will focus on the institutional aspects of transport, NMT in particular. Itis useful to have a good overview of what the actors are in the field of policy, planningand implementation of interventions. Therefor we open this chapter with a section onstakeholders in NMT. In section 3.3 we will present a model - the interaction triangle.We continue with an extensive description of the Dutch Masterplan bicycle and willhighlight the lessons learned. The final sections will be about financing mechanism forNMT investments and capacity building.
3.2 An overview of all relevant stakeholders in NMT
In this section an overview will be presented of all relevant stakeholders in NMT. Beforewe will elaborate on this, it is useful to define the term as it is commonly used:
“A stakeholder is any person, group or institution which has an important (be it direct orindirect) interest in an activity or issue, whether in terms of affecting it or by beingaffected”.
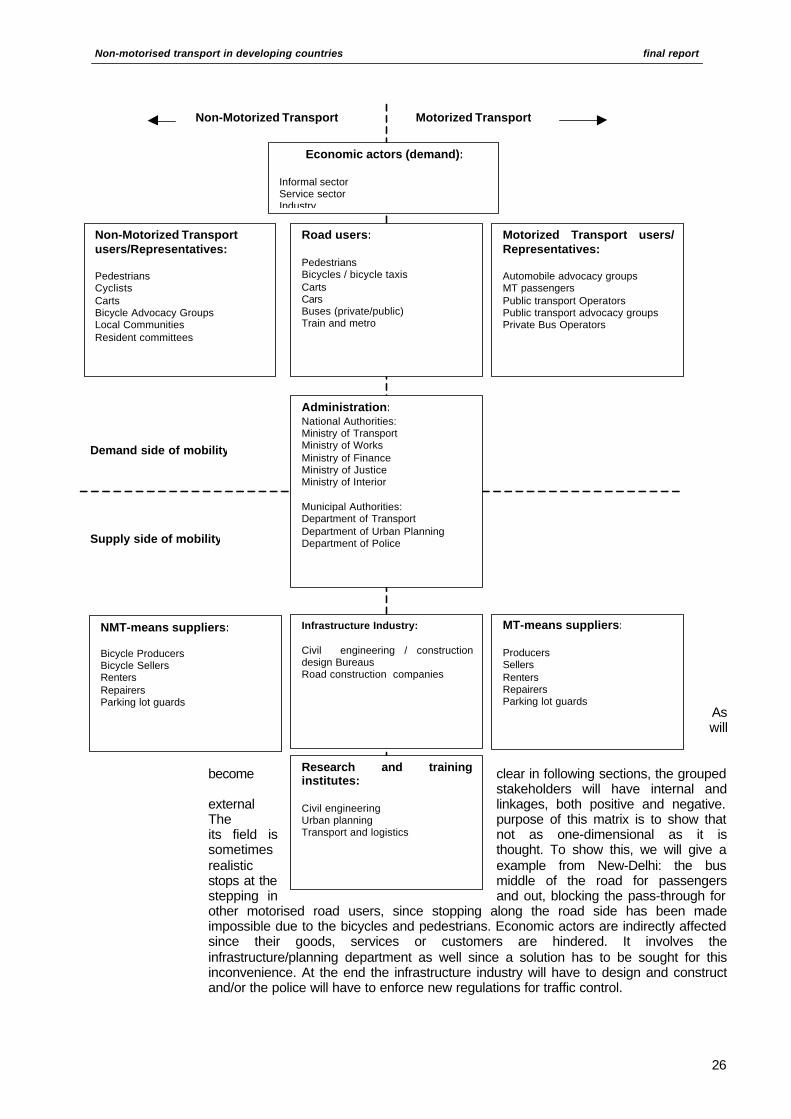
Stakeholders in NMT are all road-users (pedestrians, cyclists, tri-cyclists, carts, carsand buses, trains and metro) as well as their representatives (advocacy groups,passengers, operators and local communities). Furthermore, we can identifyadministrative agencies (ministries of transport, works, finance, and law and their localrepresentative departments), research and training institutes, and finally the transportand infrastructure industry. Economic actors, such as employers, shop-keepers orinformal industries do express a demand for NMT and can be called indirectstakeholders. Below these stakeholders are presented systematically in a matrix. Adivision that has been made is based on two criteria: demand or supply, motorised andnon-motorised. In case such a clear-cut division could not be made, the stakeholder-group is placed on the dividing line.
Non-motorised transport in developing countries final report
26
Aswill
become clear in following sections, the groupedstakeholders will have internal and
external linkages, both positive and negative.The purpose of this matrix is to show thatits field is not as one-dimensional as it issometimes thought. To show this, we will give arealistic example from New-Delhi: the busstops at the middle of the road for passengersstepping in and out, blocking the pass-through forother motorised road users, since stopping along the road side has been madeimpossible due to the bicycles and pedestrians. Economic actors are indirectly affectedsince their goods, services or customers are hindered. It involves theinfrastructure/planning department as well since a solution has to be sought for thisinconvenience. At the end the infrastructure industry will have to design and constructand/or the police will have to enforce new regulations for traffic control.
Research and traininginstitutes:
Civil engineeringUrban planningTransport and logistics
Infrastructure Industry:
Civil engineering / constructiondesign BureausRoad construction companies
Non-Motorized Transportusers/Representatives:
PedestriansCyclistsCartsBicycle Advocacy GroupsLocal CommunitiesResident committees
Motorized Transport users/Representatives:
Automobile advocacy groupsMT passengersPublic transport OperatorsPublic transport advocacy groupsPrivate Bus Operators
Economic actors (demand):
Informal sector Service sectorIndustry
Road users:
PedestriansBicycles / bicycle taxisCartsCarsBuses (private/public)Train and metro
NMT-means suppliers:
Bicycle ProducersBicycle SellersRentersRepairersParking lot guards
Administration:National Authorities:Ministry of TransportMinistry of WorksMinistry of FinanceMinistry of JusticeMinistry of Interior
Municipal Authorities:Department of TransportDepartment of Urban PlanningDepartment of Police
Non-Motorized Transport Motorized Transport
Demand side of mobility
Supply side of mobility
MT-means suppliers:
ProducersSellersRentersRepairersParking lot guards

Non-motorised transport in developing countries final report
27
One major stakeholder, i.e. the Donor community (World Bank, Bilateral Donor, NGO),has been excluded for reasons of simplicity. Actually, since they operate by or throughone of the others, they are left out.
Rijnsburger10, a Dutch policy-expert working on the SSATP, identified variousstakeholders and their role (and interventions as well as instruments) in the promotionof NMT. Table below refers.
Table 9 Actors and their responsibilities
Level of intervention Instruments Requirements
Investment in infrastructure andfacilities
CapitalExpertise
Legislation By-laws enforcement
Direct intervention by central orlocal government
Promotion Credibility
Subsidising local investments incycling infrastructure and facilities
Capital
Criteria
Financing research anddemonstration projects
Capital
Expertise
Promotion Credibility
Central government to stimulateinitiatives within ownresponsibilities of lowergovernments and NGO’s
Legislation By-laws enforcement
Facilitating policy development Capital
Expertise
Development agency/donor tosupport government policydevelopment.
Facilitating implementation Capital
Expertise
Formulation of policy documentand action plan
Finance
Expertise
Lobbying and campaigning Contacts
NGO to initiate changes ingovernment policy.
Street action Grass root basis
3.3 Institutions
Above the issue of stakeholders has been addressed. Various divisions between theparties of interest have been discussed. Usually a pragmatic approach is helpful, i.e.demand vs supply, users vs non-users. Before we will continue with a series of casestudies in which a whole range of stakeholders will enter the stage, an abstraction willbe presented, the so-called “interaction triangle”11.

Non-motorised transport in developing countries final report
28
The three circles show the components of the interaction triangle. The “politician” circlerepresents urban/local political authorities and administrators. They are elected personwho are in charge of making final decisions.
The consumer circle includes inhabitants, cyclists, other road users etc whose interestsand aspirations should be expressed in cycle projects undertaken. They are the oneswho know the day-to-day problems in urban transport. Information and suggestionsfrom the ‘consumers’ is therefor of imminent importance for policy makers and transportproviders. They are the prime experts when it comes to identify problems that need tobe solved. Often from this circle first initiatives are taken to set a process in motion toget attention for NMT issues.
The professional circle consists of the experts who, on a paid basis, investigate andanalyse the situation, generate options for solutions, and prepare the political decision-making; this circle includes designers and city-engineers as well.
It is the Dutch experience that partnerships should be created to ensure sustainable andsuccessful plans. Leaving out one of the circles in the process may result in weaksolutions and ongoing disputes. The triangle offers the opportunity that conflictsbetween two circles might be solved by the third, intermediary party. As a result of thissynergy of circles a climate of innovation can emerge and a process of decentralised,multi-stakeholder decision making can become possible. However, lack of consensusand politically feasible solutions may result in a lack of political willingness, which in turnmight affect funding and resource allocation.
3.4 National and Local Planning for Non-Motorised Transport
Changes in city traffic and transport in which cycling is (positively) involved, are ofteninitiated and carried by individuals, such as activists, professionals and civil servants orpoliticians. Upscaling to higher levels is then the necessary approach for integration ofcycling in urban and national policies, resource allocation for infrastructure, and forchanging the perceptions of citizens with respect to status and economic benefits. Forupscaling one will rely on the stakeholders that were described in section 3.3. TheNetherlands has been through such a process as the following sections will show. TheDutch national cycling plan, the Bicycle Masterplan, will be described in detail.
3.4.1 Dutch bicycle policy in the 1990’s: the Bicycle Master Plan
This section will rather intensively review the development of the Dutch Bicycle MasterPlan, its framework, major strategy and objectives. We will briefly mention the sort ofactivities that has been carried out and the major results.
POLITICIANS
PROFESSIONALS CONSUMERS
Non-motorised transport in developing countries final report
29
As was mentioned before, in the 1970s a trend reversal took place in the role of cyclingin Holland. Local advocacy groups, parties and neighbourhood groups, in Amsterdamand Eindhoven for instance made plans for improving the traffic liveability and/orenhancing the cycle network in the city. Due to several reasons the politicalenvironment at national level got interested in an increased role of “slow traffic modes”.The reasons were: 1) prior investments in road construction could not solve theproblems in mobility, 2) an increasing budget deficit and 3) increasing external effectsrelated to car use.
In fact, in the late seventies the essential objectives for the later national bicycle planwere laid down in various policy documents; they aimed at:• Limiting growth in car use• Improving flow of public transport• Stringent parking policy• Constructing safe and attractive bicycle routes.
Nevertheless, it took 15 years before the preparation started for the establishment of theNational Bicycle Master Plan in 1990. A project manager was assigned and a projectgroup from several divisions and levels of the Ministry of Transport was established.Besides, a sounding board was set up, made up with representatives of interest groups(bicycle industry, bicycle advocacy groups, Dutch Traffic safety Organisation,Association of Road Users) and authorities (provinces and municipalities). After oneyear, the project group could present the Bicycle Master Plan Policy Document that wasapproved one year later in 1992 by a parliamentary commission for transport.
3.4.2 Framework
The Dutch Bicycle Masterplan was an elaboration of one element ('track') of the'Structured Scheme for Traffic and Transport', a long term transport strategy for theNetherlands (1989). It set a number of targets for 2010, of which the most importantwas to limit the expected growth of car use of 70% to a growth of 'only' 35%, thuscutting the envisaged growth by 50%. To achieve this, a strategy was chosencomprising 5 components:
Component 1: Dealing with the source.This means clean and efficient vehicles, limiting land use for infrastructure and limitingvehicle access to towns and areas of natural interest.Component 2: Reducing and managing mobility.This requires shorter distances between places where people live, work, shop andentertain.Component 3: Improving the alternatives to the car.This includes bicycles, public transport as well as car-pooling.Component 4: Providing selective accessibility by road.Not all places should be totally accessible to all modes of transport.Component 5: Capacity building.This comprises communication, research, training, government co-operation andfinance.
Objectives were formulated and included issues as quality of life, accessibility,environment, safety and energy. Traffic fatalities had to go down with 50%, trafficinjuries by 40%, and car use emission levels by 75% (nitrogen oxide) and 10%(hydrocarbon and carbon dioxide) by the year 2010 (base year 1986).
3.4.3 Strategy
The approach taken by the Government was one of decentralisation in policyexecution. An important role has been laid down for parties other than the centralgovernment, as provinces and municipalities.

Non-motorised transport in developing countries final report
30
Further, it pursued an integral policy approach for curbing car traffic. The projectgroup elaborated on this and aimed not so much at just increased use of bicycles but onsolving traffic and transport problems and/or restricting car use. It found that bicyclepolicy must be seen as an inextricable part of traffic and transport policy as a whole,where cycling is a transport mode amidst other modes. A statement as: choose andfacilitate the transport mode that is most efficient for a specific trip is therefor notsurprising and shows its integral vision. Spatial planning (the compact city) has to beduly considered since short trip distances increase the chance of bicycle use.
The overall objective of the Ministry of Transport with respect to bicycle policy was:
“Promoting bicycle use while simultaneously increasing bicycle safety and appeal”
This objective has been operationalised into 5 so called spearheads and targets. Below,the spearheads and targets are given (
Figure 4). It was recognised that a two-fold strategy should be followed: a long-term anda short-term in which positive direct effects are to be produced. This entails the removalof cycling bottlenecks, providing examples and to speed up the plans under preparationand execution. Long term measures included the innovation development, promotioncampaigns, legislation and capacity building.

Non-motorised transport in developing countries final report
31
Figure 4 The five spearheads of Dutch bicycle policyAs has been mentioned before, decentralisation was a major starting point when itcomes to policy execution. Therefor the main task the national project group saw foritself is one of enabling stakeholders (authorities, public transport operators andenterprises) to embed bicycle policy in their policy plans and to execute activityprogrammes, by means of providing knowledge, arguments, instruments and finances.
3.4.4 Target groups
The diagram below shows the main target groups during the implementation of BMP.The importance of each group is and was not fixed and changed over the period of theprogramme. For instance, whereas the provinces played a minor role in the beginning,during the final stage (when the decentralised approach took off the road) their role asco-financer and policy / programme developer became more important.
Figure5
Spearhead 1:The switch from the car to the bicycle
Primary target:An increase in the number of passenger kilometers by bicycle of 3.5 billion bythe year 2010 in relation to 1986, resulting in a contribution of 8.75 percent tothe desired reduction in the growth of car use.
Spearhead 2:The switch from the car to public transport and bicycle
Primary target:An increase in train transport of 1.5 billion passenger kilometers (15 percent)by the year 2010 in relation to 1990, by means of improving the transport chainof public transport and the bicycle.
Spearhead 3:Cyclist safety
Primary target:Fifteen percent fewer cyclist fatalities in 1995 than in 1986 and 50 percentfewer in 2010. Ten percent fewer injured cyclists in 1995 than in 1986 and 40percent fewer in 2010.
Spearhead 4:Bicycle parking facilities and theft prevention
Primary target:A substantially lower number of bicycle thefts in 2000 in relation to 1990.
Spearhead 5:Communication
Primary target:In 1995, bicyclepolicy is an integralpart of all traffic andtransport planscarried out by theState, provinces,municipalities andtransport regions.The transfer ofknowledge in 1995 iscompleted withregard to the resultsof the pilot and modelprojects.
BMP Project group Ministry of Transport Other ministriescentral divisions
Interest Consultancies Regional Provincesorganizations directorates
Citizens / traffic participants
Intermediarytarget group
Indirecttargetgroup
Directtargetgroup
ProjectInitiator
Intermediary target group
Municipalities Companies and organizations Public transportoperators.

Non-motorised transport in developing countries final report
32
Target groups in the BMP
The figure suggests that the Bicycle Master Plan is rather top-down. In fact, this has notbeen the case, although some representatives of bicycle user groups have a differentopinion. In reality, there were opportunities to influence decision-making at higherlevels, and to give and receive feedback.
The municipalities formed the most important target group by far. They are in the bestposition to pursue / endorse effective bicycle policy. At the end of the row, the citizensand traffic participants are positioned. They form the indirect target group for the BMP’sactivities.
3.4.5 Implementation strategy
It was realised that for reaching the objectives, one is heavily dependent on other,related policies, such as the extent to which car use is facilitated, public transportprovided and spatial planning of cities carried out. A very concrete example of anunintended side-effect of the policies of the Ministry of Education was the effect of freestudents passes for public transport: these free passes resulted in a dramatic drop inbicycle use in university cities.
The State’s influence on decisions made at local level concerning traffic policy is limited.Therefore, extensive guidance and capacity building of intermediaries appeared crucialfor achieving successes.
To avoid funding of parallel programmes the budget for research, pilot and modelprojects was not decentralised.
In making organisations more part of the process and so to increase capacity as well astheir commitment to promote bicycle use, the project aimed at co-implementation withintended target groups.
It selected a whole range of relatively small projects. It was thought that a wide range ofprojects would spin off more than a few big ones. This again is more in line with theBMP strategy to enable other stakeholders, to act as a catalyst and to get bicycling onthe agenda.
3.4.6 Communication
Communication turns out to be one of the most crucial conditions for achieving theexpected, medium- and long term impact. Not communication for its own good, but fordisseminating knowledge, innovations and arguments in order to sensitise, involve andactivate other stakeholders, ministries, provinces, private sector, public transportoperators, municipalities etc. As can be seen from
there was no direct communication between the project team and the road users.There was a deliberate choice to concentrate the communication on intermediary targetgroups. No mass media campaigns were executed within the framework of the BicycleMasterplan.
To make sure that the message comes across, the project group has used variouspackages, media and intermediaries.
3.4.7 EvaluationWhen evaluating the BMP one can focus on three different sets of output:− First, one might focus on the direct outcomes of the projects that have been carried
out. In that case one shall pay attention to the development of knowledge,arguments and instruments (3.4.7.1).

Non-motorised transport in developing countries final report
33
− Second, one might focus on the internalisation of the results of the projects inpolicy and plans of the target groups (3.4.7.2).
− Third, one might look at the effects that has been reached and for which one havedeveloped quantitative verifiable indicators (3.4.7.3).
3.4.7.1 Evaluation of the project results
From the beginning the project team had chosen for a large number of small, diverseprojects, rather then to concentrate on a few bigger ones. The risk of failures wasaccepted because it was recognized that failures can be very instructive as well. This isespecially true for experiments and pilot projects. But it is also fair to say that the largenumber of projects that needed to be managed complicated the work of the projectteam.
The results of the 31 research projects were generally positive. The majority ofprojects provided a clear-cut and practical response to the research questions.
The results of the 41 pilot and model projects were less positive. Just half of themwere successful. The reason for this rather low rate is caused by the fact that theseprojects were relatively innovative trials. Further, the team should have paid moreattention to the following:• Hypotheses and theories which are at the basis of the project, should be discussed
critically. It should be clear whether verification of falsification of such hypothesesare in itself enough justification for the project.
• Much effort should be put into a smooth co-operation with project partners.• A leading project team should allow for project partners to feel ownership for the
project, and get the opportunity to claim positive results.
Nevertheless, the BMP-evaluation report states that the more intangible results, likemotivating and convincing target groups, were far more positive.
The results of the 18 instrument development projects (with a strong technicalemphasis) are mixed. Due to institutional problems with respect to the execution of thiscomponent, success was limited. However, the design manual for better bicyclefacilities and infrastructure has been positively received by professionals (Sign up forthe bike (1993)) and was regarded as one of the most important outputs of the project.This publication marks the change-over of provision for cycling as a matter of trial anderror and common sense to a well based part of professional transport planning.
Twenty-two projects were carried in the field of communication. They were believed tobe successful.
3.4.7.2 Evaluation of the internalisation of the results in policy of target group
At ministerial levelAgain, the results are rather difficult to quantify. One might argue that the project groupwas overoptimistic about the participation and motivation of other stakeholders andtherefore in some cases failed. Further, it turned out to be too laborious and complex toinvolve all stakeholders. The strategy therefore was changed in order to focus on fewerissues. Through a shift at national policy level with respect to transport, biginfrastructure projects and roadway network received more attention at the cost of a/o.the bicycle. However, three definite positive issues can be mentioned:1. Bicycles are taken into account in the implementation programme for sustainable
safe traffic infrastructure.2. Bicycles received increased attention with regards to parking policy and transport
management at companies.3. Action is now on the way for improving parking facilities at railway stations and bus
stops.

Non-motorised transport in developing countries final report
34
At municipal level
A research on the development of the intensity of bicycle policy in nineteenmunicipalities shows that between 1990 and 1996:1. Cycling received more attention in policy in 16 of 19 municipalities under survey;2. Policy shifted from resolving bottlenecks for bicyclists to a more comprehensive
approach paying (some) attention to all BMP spearheads;3. There is a growing (but yet small) recognition that direct measures to restrain car
use, will be needed.
In 17 of the 19 municipalities under survey, a bicycle plan was developed. In 13 casesthe plan was considered to be excellent due to scope, programme and planned financialsupport. The survey indicates furthermore that there are primarily two factors that willfoster the intensification of bicycle policy:1. Local traffic problems and perception of it.2. Political will and commitment depending on vision and courage of the councillors
concerned.
At company level
The use of bicycles has been adopted in nearly all company transport plans. However,the number of companies with such a transport plan is still limited. The success canalso been derived from the fact that more than 20,000 copies of the brochure “workingwith the bicycle” were requested by companies. Regarding to concrete results, a growthof employees using the bike, one should be less positive. Though a growth in cycling inwork-home traffic can be observed, the growth is less than expected.
3.4.7.3 Evaluation based on the criteria formulated under the spearheads
Increase in bicycle use (spearhead 1)
Since citizens or traffic participants haven’t been a direct target group on which the BMPfocused, it is hard to state and evaluate what the effect of the programme has been onbicycle use. However, during the BMP-life time the bicycle has become a moreappropriate alternative to the car. A clear increase in appreciation/valuation of thebicycle combined with public transport for work and that of carpooling as an alternativeto car use come to the fore in the following table.
Table 10 Intended changes in behaviour by motorists in the event of driving less (in%)
1993 1996
Bicycle for short distances 71 73
Public transport for medium distances 21 23
Train for longer distances 30 32
Bicycle combined with public transport (commuting) 26 34
Carpooling 37 45
Live closer to work 10 11
Source: Verkeer en Waterstaat,1998.Although these figures do not relate directly to actual behaviour, the shift in expressedintentions do suggest that cycling is more accepted as a feasible alternative thanbefore.

Non-motorised transport in developing countries final report
35
Switch from car to public transport and bicycle (spearhead 2):
Again, it lacks data to show whether there has been a significant change in the multi-modal transport share. However, public transport operators have improved the facilitiesfor parking bicycles. At a number of places, parking facilities are built for cyclists to parktheir bikes at bus stops (see under spearhead 4).
Cyclist’s safety (spearhead 3):
Data shows that the targets for reducing the number of fatalities and hospitalised cyclevictims are met for 1995. It is likely that the targets set for 2010 will be achieved. Table11 refers.

Non-motorised transport in developing countries final report
36
Table 11 Number of cycle victims from 1980 to 2010 (expected)Cyclist fatalities Hospitalised
cyclists
1980 426 4,199
1986 (base year) 312 3,419
1990 304 3,277
1995 267 2,499
Target 1995 (reduction 15% and 10%) 265 3,080
Target 2010 (reduction 50% and 40%) 155 2,050
Source: Institute for Road Safety (SWOV) 1999.
Bicycle parking facilities and theft prevention (spearhead 4):
As stated before, significant progress has been made in efforts to improve parkingfacilities for bikes at stations, bus stops, offices and public buildings. The capacity ofguarded parking lots has doubled since 1990, though its share is just 2% of all bicyclesparked. However, the target of reduced theft rates won’t be reached. The situation ismore or less stable at a 600 to 700,000 thefts per year. On the other hand, thesenumbers are still less than the expected 900.000 theft cases, with which experts in theearly nineties counted. However, reliable data on theft cases is a problem, since not allthefts are reported to the police. Remarkably, theft is less than before considered as areason not to go by bicycle. Still, research shows that theft is often the reason for nothaving a bike, or having a very affordable one.Unfortunately, there seems to be a positive correlation between a good bicycle policy,bicycle use and theft. The more people start to ride bicycle, the more opportunities arecreated for thieves to steal a bike and the bigger the potential demand for a stolen bikewill be. It takes quite much integral effort as the Dutch case shows to battle this complexissue.
All spearheads as presented before depend for their success on a wide range of actorsand policies. It shows once more that bicycling policy should be part of an integratedand consistent traffic and transport policy. Achieving substantial results is therefor alaborious and difficult task. Conditions for success are often beyond the immediatecontrol of a single party. For instance, to reduce trip distance and so to increase thelikeliness that people switch to a bike one should especially focus on spatial planning.To reduce theft of bicycles, success is also dependent on the policy of the police andjudicial authorities. We therefore refer back to the model presented in section 2.7,pointing out that travel behaviour and NMT-use is the outcome of a complex social andinstitutional process.
IntegrationNevertheless, one may conclude that bicycle policy is now embedded in governmentand public transport operator policy. The capacity building approach, i.e. support totarget-groups in the sense of distributing factual knowledge and of instrumentsdeveloped has resulted in a lasting impression.
3.4.8 Is the Dutch Masterplan a blue print for a good bicycle policy?
There are about 10 countries that have formulated a national bicycle plan; most of thesecountries are European. A masterplan for the bicycle as has been developed in theNetherlands and England is unique. Recently, a bicycle plan has been formulated inSouth Africa, the Shova Lula (easy rider). Bogota and Delhi have developed a greater-city NMT-plan.
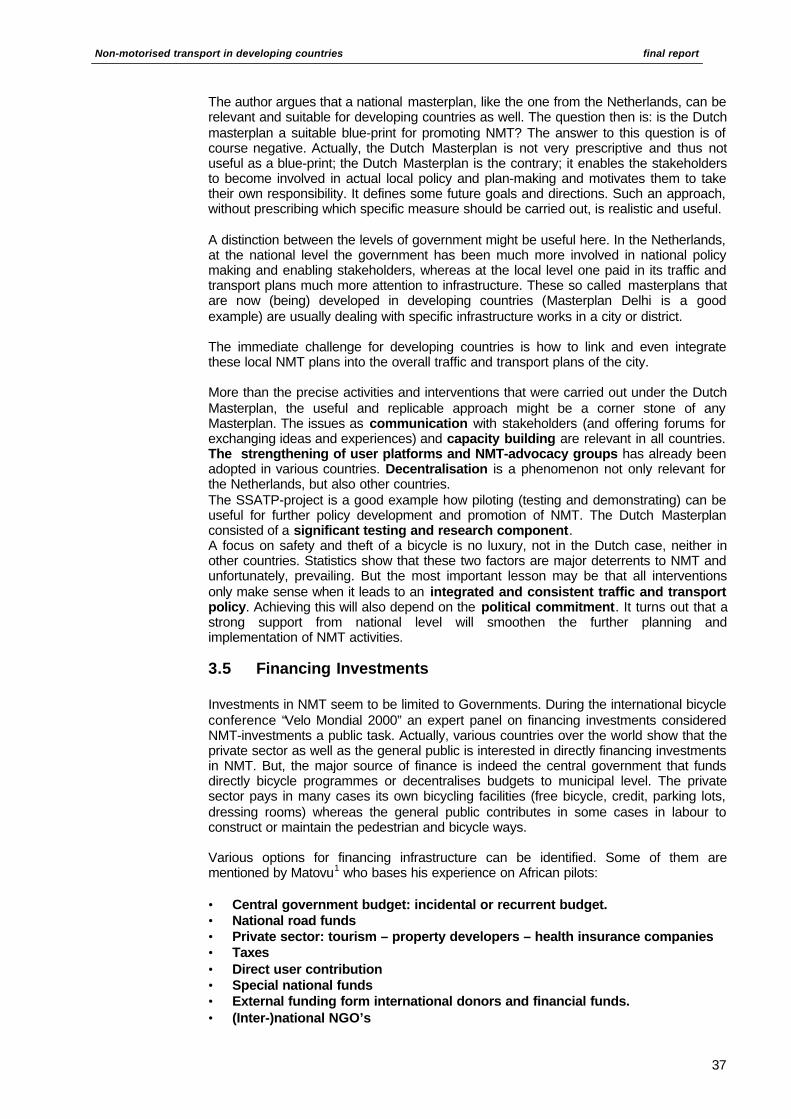
Non-motorised transport in developing countries final report
37
The author argues that a national masterplan, like the one from the Netherlands, can berelevant and suitable for developing countries as well. The question then is: is the Dutchmasterplan a suitable blue-print for promoting NMT? The answer to this question is ofcourse negative. Actually, the Dutch Masterplan is not very prescriptive and thus notuseful as a blue-print; the Dutch Masterplan is the contrary; it enables the stakeholdersto become involved in actual local policy and plan-making and motivates them to taketheir own responsibility. It defines some future goals and directions. Such an approach,without prescribing which specific measure should be carried out, is realistic and useful.
A distinction between the levels of government might be useful here. In the Netherlands,at the national level the government has been much more involved in national policymaking and enabling stakeholders, whereas at the local level one paid in its traffic andtransport plans much more attention to infrastructure. These so called masterplans thatare now (being) developed in developing countries (Masterplan Delhi is a goodexample) are usually dealing with specific infrastructure works in a city or district.
The immediate challenge for developing countries is how to link and even integratethese local NMT plans into the overall traffic and transport plans of the city.
More than the precise activities and interventions that were carried out under the DutchMasterplan, the useful and replicable approach might be a corner stone of anyMasterplan. The issues as communication with stakeholders (and offering forums forexchanging ideas and experiences) and capacity building are relevant in all countries.The strengthening of user platforms and NMT-advocacy groups has already beenadopted in various countries. Decentralisation is a phenomenon not only relevant forthe Netherlands, but also other countries.The SSATP-project is a good example how piloting (testing and demonstrating) can beuseful for further policy development and promotion of NMT. The Dutch Masterplanconsisted of a significant testing and research component.A focus on safety and theft of a bicycle is no luxury, not in the Dutch case, neither inother countries. Statistics show that these two factors are major deterrents to NMT andunfortunately, prevailing. But the most important lesson may be that all interventionsonly make sense when it leads to an integrated and consistent traffic and transportpolicy. Achieving this will also depend on the political commitment. It turns out that astrong support from national level will smoothen the further planning andimplementation of NMT activities.
3.5 Financing Investments
Investments in NMT seem to be limited to Governments. During the international bicycleconference “Velo Mondial 2000” an expert panel on financing investments consideredNMT-investments a public task. Actually, various countries over the world show that theprivate sector as well as the general public is interested in directly financing investmentsin NMT. But, the major source of finance is indeed the central government that fundsdirectly bicycle programmes or decentralises budgets to municipal level. The privatesector pays in many cases its own bicycling facilities (free bicycle, credit, parking lots,dressing rooms) whereas the general public contributes in some cases in labour toconstruct or maintain the pedestrian and bicycle ways.
Various options for financing infrastructure can be identified. Some of them arementioned by Matovu1 who bases his experience on African pilots:
• Central government budget: incidental or recurrent budget.• National road funds• Private sector: tourism – property developers – health insurance companies• Taxes• Direct user contribution• Special national funds• External funding form international donors and financial funds.• (Inter-)national NGO’s

Non-motorised transport in developing countries final report
38
Central government budget: incidental or recurrent budget
Several central governments have allocated an annual budget for NMT, to be used atlocal (municipality) level or at central level. The budget often covers salaries and otheroverhead only. Funds for “hard-ware” were delivered through other channels.
National road fundIn many cases in the SSATP pilot municipalities budget has been received from thenational road funds (based on special extra fuel tax). These extra funds are usuallyearmarked for road maintenance. In the Netherlands case, the ministry had a budget forsubsidising a certain percentage of the investment of the lower authorities.
The investments in bicycle infrastructure may come from the general road budget aswell. When bicycle needs are incorporated in the normal design and constructionpractices of road planners, we might reach a win-win situation: motorised traffic can gounhindered on their roads, bicyclists can make use of their paths. In an ideal worldthere would be no need for special NMT-funds, as NMT-provisions would be anintegrated part of transport investments. Given the present arrears in NMT-provisions,special funding is indispensable to improve the situation. Such funds firstly help to shiftthe attention of transport planners to the specific needs of NMT-users, and secondly arenecessary to catch up with the existing arrears in provision.
Private sector: tourism – property developers – health insurance companiesThe private sector is often overlooked as a partner in investment in NMT. There ishardly any information on Public-Private-Partnerships in NMT. There are someexamples that developers made some beautification and accessibility provisions fortheir new-built residential area. In the Netherlands Tourist and environmentalorganisations have constructed some bicycle and pedestrian paths and established areferring system. Health and life insurance companies are expected to have an interestin making roads safer because of financial reasons. An interesting example is Sustransin the UK: this charity organisation has constructed and implemented the National CycleRoute Network in the UK.
TaxesTransport related taxes are or might be used for investments in NMT. Some examplesare mentioned below:1) Taxing the import or purchase of bicycles has been a common practice in manycountries; rates might go up to 400%. This direct taxing of bicycles is not favourable forbicycle sales and use. In Kenya there has been an increase of sales of 1500% between1986 and 1989 after tax was cut from 80% to 20%12. So far, experiences show thatrevenues are not reinvested in bicycle infrastructure.2) In some countries (Nicaragua, China, Tanzania) cyclists have to pay an annualuser tax or levy to certify legal ownership. From experiences in Tanzania it is clear thatthese revenues were never reinvested in NMT. Like with the import tax, these taxes limitthe use of bicycles.3) A road tax for motorised vehicles exists world-wide. Usually, in developingcountries there are serious problems in collecting these. The tax is generally collected inthe car owner’s residence;4) Bus operating taxes are being collected in a number of countries;5) Though not really taxes, we mention here: Parking fees from cars and bicycles. Ina number of Dutch cities parking fees are re-invested in bicycle infrastructure.
Tax collection at local (municipal) level faces difficulties; lack of transparency inprocedures and destination, corruption, misuse of tax-funds, “unfair” taxes result inmassive tax evasion and low collection rates.
Direct user contributionThere are quite a number of cases reported from various countries in which userscontribute their labour or money to improving NMT facilities or making roads safer for

Non-motorised transport in developing countries final report
39
pedestrians and cyclists. Spontaneous initiatives are taken by neighbourhoods to buildspeed humps in order to reduce speed of motorised vehicles. Moreover, simplefootbridges and footpaths are either build on private initiative or as part of a communityplan.
In Dar es Salaam, as part of the World Bank SSATP project, a number of experimentshave been carried out with direct user contribution to urgent NMT infrastructureimprovements in lower and lower-middle income areas. Good communication andparticipation in decision-making and urgency of the problems to be solved aredetermining factors for user contribution. It makes the users more aware of total costsmade by the government and stimulates people’s responsibility to maintain the facilities.In quite a number of development programmes of a.o. DANIDA, 15% of the investmentcosts for infrastructure must be paid (in kind or cash) by the beneficiary communities.
In cases the contribution has to be paid in cash, collection problems will occur,particularly in low-income areas. Since benefits for beneficiaries accrue over a longertime period, people’s repayment capacity might be limited.
One might question why bicyclists and pedestrians should contribute for facilitieswhereas car drivers don’t have to do so. Even more so, because the need for specialinvestments in NMT are a consequence of the pre-dominant position of MT. Further, tomake the provision of NMT-facilities partly dependent of user contribution seems toundermine the status of NMT in traffic and transport policies. A discussion about up towhat level user contributions would help the cause of NMT still has to take place.
Special national fundsIn a number of countries, national governments have established special programmesfor improving the transport sector in the country. Three of such programmes are1) traffic safety programme2) environmental programme3) income-/job creating programme (poverty alleviation)
External funding from international donors and financial fundsInternational funds might be available from donors (grants) and financial institutions(soft loans) for mobility or NMT-programmes. These funds might trigger off localawareness, professional capacity and enthusiasm. Attention can be attracted throughsuccessful demonstration pilots for which local budget would have never been madeavailable. Matovu argues that medium-size grants are more efficient than loans due tothe fact that many beneficiaries belong to low-income groups. Further, its higherflexibility in fund handling is appropriate to the characteristics of such projects. However,the author states that large-scale urban infrastructure construction programmes toenable low-cost urban mobility can and must be programmes of entirely local currencyexpenditures, financed with local currency revenues. The reason for this statement isthat, according to Matovu, these programmes can contribute more to the nationaleconomy than programmes that heavily rely on imports of goods and services.
In the international expert meeting in Delft, June 2000, the participants have ranked thetax on motorised vehicle acquisition and use as most important source. Communitycontributions are considered second-best. Development tax, property tax and trafficfines as respectively number three, four and five.
(Inter-)national NGO’sNGO’s seldom focus on (pure) construction activities. Their programmes usually consistof a number of capacity building activities, training, education, awareness building etc.
3.6 Capacity Building
The institutional environment has been identified as the key determent in the use ofbicycles (chapter 2). In a number of reports lack of capacity (human and financial) is

Non-motorised transport in developing countries final report
40
mentioned as a crucial factor, hindering further development of NMT in urban areas.Capacity building involves the creation of an enabling environment, where soundinstitutions and adequate human resources (quantitatively and qualitatively) are present.City governments in an increasing number of countries have received the mandate toplan and manage their transport systems. However, institutionally city governments areoften not ready to deal with this important task.13
3.6.1 The required qualifications of those responsible for preparing andimplementing transport policies:
It must be recognised that a successful local authority policy requires capacity buildingat the local level to create a body of experienced and well trained technicians andtransport managers, who are able to advise local leaders on their choice of system andpolicies, based on current practise.
They should therefore:• Have a sound knowledge of transportation facility design, environmental impact
mitigation, traffic flow analysis, traffic control, and transportation planning;• Use a multidisciplinary approach to the solution of transportation problems. This can
be realised either by the engineer being trained in all the related professions, or byworking with professionals from other disciplines;
• Update their knowledge on technology and management as the world is changingfast and is becoming less predictable;
• Have a growing degree of interaction with other disciplines and problem areasthrough:
a) Professionalisation of “NMT”-knowledge and updating of professionaltechnical knowledge by learning new techniques along the traditional tasks ofthe engineer;
b) Institutional integration so that the engineer grows out of a restrictive projectapproach and becomes more knowledgeable about costs and communitymanagement.
These training courses should be more practical and down-to-earth. They should focuson increasing engineer’s ability to design for local solutions.
The following box presents a case study from Kenya.
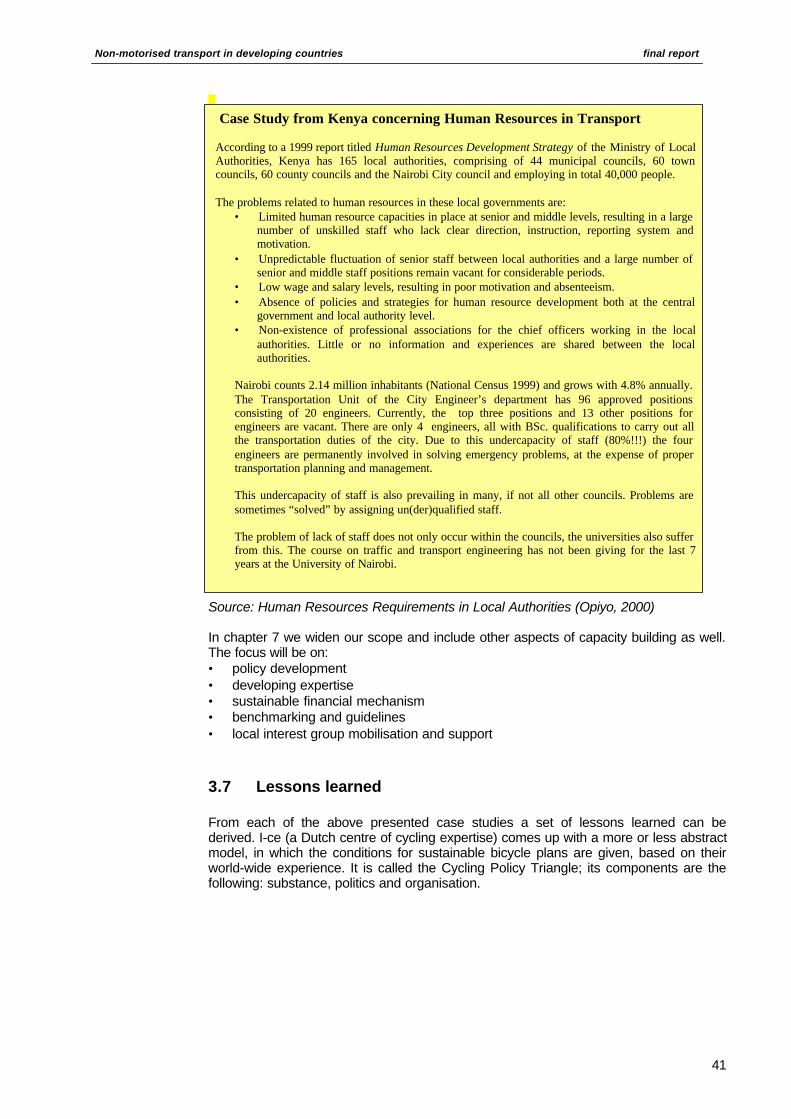
Non-motorised transport in developing countries final report
41
Source: Human Resources Requirements in Local Authorities (Opiyo, 2000)
In chapter 7 we widen our scope and include other aspects of capacity building as well.The focus will be on:• policy development• developing expertise• sustainable financial mechanism• benchmarking and guidelines• local interest group mobilisation and support
3.7 Lessons learned
From each of the above presented case studies a set of lessons learned can bederived. I-ce (a Dutch centre of cycling expertise) comes up with a more or less abstractmodel, in which the conditions for sustainable bicycle plans are given, based on theirworld-wide experience. It is called the Cycling Policy Triangle; its components are thefollowing: substance, politics and organisation.
Case Study from Kenya concerning Human Resources in Transport
According to a 1999 report titled Human Resources Development Strategy of the Ministry of LocalAuthorities, Kenya has 165 local authorities, comprising of 44 municipal councils, 60 towncouncils, 60 county councils and the Nairobi City council and employing in total 40,000 people.
The problems related to human resources in these local governments are:• Limited human resource capacities in place at senior and middle levels, resulting in a large
number of unskilled staff who lack clear direction, instruction, reporting system andmotivation.
• Unpredictable fluctuation of senior staff between local authorities and a large number ofsenior and middle staff positions remain vacant for considerable periods.
• Low wage and salary levels, resulting in poor motivation and absenteeism.• Absence of policies and strategies for human resource development both at the central
government and local authority level.• Non-existence of professional associations for the chief officers working in the local
authorities. Little or no information and experiences are shared between the localauthorities.
Nairobi counts 2.14 million inhabitants (National Census 1999) and grows with 4.8% annually.The Transportation Unit of the City Engineer’s department has 96 approved positionsconsisting of 20 engineers. Currently, the top three positions and 13 other positions forengineers are vacant. There are only 4 engineers, all with BSc. qualifications to carry out allthe transportation duties of the city. Due to this undercapacity of staff (80%!!!) the fourengineers are permanently involved in solving emergency problems, at the expense of propertransportation planning and management.
This undercapacity of staff is also prevailing in many, if not all other councils. Problems aresometimes “solved” by assigning un(der)qualified staff.
The problem of lack of staff does not only occur within the councils, the universities also sufferfrom this. The course on traffic and transport engineering has not been giving for the last 7years at the University of Nairobi.

Non-motorised transport in developing countries final report
42
I-ce
states that without an adequate internal management in the project and without politicalsupport or commitment and without a proper bicycle plan, activities to promote bicycleuse are unsustainable.
The circle on top (substance) represents the contents of an action plan, including plansfor bicycle networks and routs to public transport terminals, for parking and riding. It alsomeans that criteria for high quality measures (designs and implementation) areconsidered and met.
The second dimension (not in order of importance) is the organisational one. It refers tocapacity of planners, designers and executors to perform well. Knowledge (technical aswell as institutional) and experience in management of programmes are important.
The political dimension refers to commitment of politicians and bureaucracies, theirwillingness to put cycling on the agenda, to endorse legislation, to allocate budget andto enable stakeholders (users, private sector, public transport operators etc.) toparticipate in bicycling promotion and/or fine-tune activities to their interest v.v.
SUBSTANCE
ORGANIZATION POLITICS

Non-motorised transport in developing countries final report
43
CHAPTER 4 PLANNING FOR CYCLING ANDWALKING
“The sum of rational individual choices won't result automatically in anoptimal situation at collective level. Ultimately this will be the strongestargument for a NMT policy: that it will contribute to a more efficienttransport system.” Tom Godefrooij, bicycle expert
4.1 Introduction
In this chapter planning issues are put central. The first sections will deal with transportand traffic planning in a more general way and touch issues as transport managementand planning (section 4.2), specific and generic NMT planning (4.3), the weighing ofinterests of road users during the planning (4.4). From then onwards we will narrow ourscope. Networks as a basic planning concept is dealt with in section 4.5; thedevelopment of an urban mobility plan for pedestrian and bicycle traffic in section 4.6.Quality criteria and their application, road safety management and measures concludethis chapter.
4.2 Transport Management and Planning
Transport needs in urban areas all over the world are diverse. These needs might varyfor people, travel purpose, distance and time. In chapter 2 we already identified thatsome people are more or less locked up in their transport-prison, i.e. the captive NMT-user; but, at macro-level it is justified to state that a multi-modal system is often requiredand in place. One might speak of transport markets; for each segment of that market asuitable supply should be realised. For short distances NMT appears to be the mostefficient means of mobility, while for longer distances public transport or cars offergreater efficiency. The break-even-point depends on many factors, such as the variableopportunity cost of time of a traveller and the price of transport.
What modal mix is most efficient, depends on many factors and can not be easilyidentified. Besides factors mentioned above, it relies on patterns of land use, landprices, travel needs, existing transport vehicles and infrastructure, etc. Therefore, thefigure shown in chapter 2 (section 2.7) about understanding NMT use can be easilyapplied for understanding any traffic behaviour and so modal split. While identifyingoptimal modal share, one has to define whether one focuses on the optimal share for anindividual (that might differ per person) or for society as a whole (neighbourhood or city).In the latter case one should include social costs as well, like air pollution, trafficcongestion, access to housing, poverty alleviation, health and traffic fatalities, petroleumimports. Thus, on an individual level the assessment of the efficiency of the variousmodes is often different as compared to such an assessment on a collective level. Thisjustifies interventions that promote those modes which contribute to the efficiency of thetransport system as a whole (or to a more efficient mix of modes).
Studies show us that a merely uni-modal system often leads to sub-optimal situation.Too many private cars or even too many bicycles will lead to congestion and a reductionin average speed, compared to multi-modal systems.

Non-motorised transport in developing countries final report
44
Designing and maintenance of NMT infrastructure on micro-level without a clearconceptual approach on macro-level is risky. There is an important interplay betweenthese two entities: micro (the level of individual modal choice, route choice) and macro(the level of modal share, travel volume). They are interlinked and can not be dealt withwithout considering the other. Actually, this interlinkage can be partly found back in theconcept of direct and indirect NMT planning. For instance, spatial planning (clearly notdirectly a NMT-issue) might have enormous consequences when is chosen for a city,where businesses and employment are concentrated in one big CBD and residentialareas can be found far out of the city. The distances between living areas and workingareas are then very unfavourable for NMT.
The question whether the whole city should be considered as one big network dependson the size of the city and its structure. In big cities, it is generally recommended tofocus on sub-markets rather than the city as a whole. Studies have shown that a big cityis divided into more or less autonomous communities. People won’t cross the borders oftheir communities daily, and therefor traffic management and NMT-planning should takethese communities as a starting point.
4.3 Specific and generic NMT Planning
There are two ways of NMT planning: 1) creating specific facilities for NMT; and 2)improving generically the conditions for NMT by weakening the dominance and threat ofmotorised modes of transport. These interventions might consist of rerouting motorisedtransport, restricting access to, or parking in zones or streets, and traffic calmingmeasures. These so-called bicycle- and pedestrian friendly measures of generic NMTplanning have an area-wide or corridor-related character. Experience shows that traffic-calming measures in neighbourhoods and shopping/market areas are amongst the mosteffective indirect planning concepts. Restricting MT have turned out to be very efficientin supporting NMT management programmes. It often is the most effective first stepwhen low numbers of NMT-users don't justify (yet) the investments for specific facilities.This shows that generic and specific planning for NMT should be complementary toeach other, and if wisely implemented, can create a synergy. This concept underscoresthe fact that it is not always necessary to start with big (long-term) investments forspecific modes.
4.4 The planning process and the weighing of interests of NMTand MT
The question that comes in mind is how the interests of NMT-users will be consideredand valued against the interests of other road users during the planning process. Thebox below gives us three fictitious scenarios at what moment these interests are likely toconflict and a valuation has to be made.

Non-motorised transport in developing countries final report
45
The present situation is probably closest to the one described in the first scenario; thesecond scenario can act as a catalyst to induce changes; the third scenario comesclose to the ideal situation where NMT-policy is a regular part of the planning process,at expert level as well as at political level.
Actually, what is mentioned in scenario 2 is meant to be as an example of a situation,where there is no integrated or balanced way of dealing with interests. As in the firstscenario, where the weighing of interest has been done entirely by the engineers, in thesecond scenario the weighing of interests is done either by politicians or by the generalpublic. Advocacy groups can contribute significantly, mobilise support and act as acatalyst. It is according to some experts a necessary step to get NMT on the politicalagenda.
Instead of focusing on actual blackspots in the existing traffic situation, one shouldactually analyse the mobility need (origins and destinations) and indicate how the needcan be satisfied in a most efficient way. An assessment of various modes of transport isthen part of a mobility plan: it has identified the mode that suits a trip best specifies thefacilities for accommodating the mobility plan and how choices for ways of transport canbe influenced.
Three scenarios of the valuation of interest between NMT and MT
Scenario 1: the ivory tower model
Planning and design for transport and traffic are merely desk-exercises of a few engineers.Interaction with and participation of stakeholders in this phase hardly take place. The demandside of mobility is not being considered. Since the engineers have a pro-motorised traffic bias,the requirements and contribution of NMT to mobility are neglected. As a result, advocacygroups for NMT don’t find any response. User platforms and other groups are not existing.Planners and designers just follow their (outdated) textbooks which prescribe how the plansshould look like (supply driven). To go short, there is no valuation of interests at all. Moreover,since politicians are not interested or don’t see the relevance of NMT and mobility, the valuationof interest is also not taking place in the political scene.
Scenario 2: the populistic modelThis model is the opposite of the previous one. NMT is not neglected, but taken serious.Actually, there is even a bias towards NMT. Apparently, NMT is the “love-baby” of thepoliticians (or of the general public) and has been a topic during the elections. Policymakers, planners and designers at the departments are rather uncomfortable with thissituation since NMT has become an instrument of politicians. The valuation of interestsof stakeholders (road users) is not made by the department and experts but by thegeneral public during political debates. The role of advocacy groups is important.
Scenario 3: the balanced modelIn this model various stakeholders are involved at different phases of policy making, planningand design and valuation of interests of road users. The public debate defines the main directionfor transport and traffic policy. General issues as more traffic safety, less environmentalpollution, a more liveable city, less traffic jams are typically issues the public is requiring.Implicitly a valuation of the various modes of transport has been made.
The following step is the development of a City Mobility Plan for instance. A careful analysis ofmobility/traffic problems and a selection of financially and politically feasible options will leadto a plan of action to solve (some of) these. The valuation of interests is based on the assessmentwhat measures will work best to solve the existing problems with the existing budget. Cost-benefit and multi-criteria analysis are the tools for planners and designers to come up with a planof action.
The third valuation of interests takes actually places when the plans are presented to the publicfor comments. Plans might be changed or just accepted. A final decision (and thus valuation ofinterests) is made by the City’s council. At 4 different interfaces a valuation between theinterests of NMT and MT takes actually place.

Non-motorised transport in developing countries final report
46
In the Netherlands the municipalities make a plan per mode of transport and try tomatch these with the other plans. An assessment of what the optimal modal mix wouldbe, is not (yet) taking place. This plan-making is still a matter of planners and trafficexperts who, in general, are biased. The conflict of interests between NMT and MTtakes place at the design-table; promotion of NMT means quite often: less space forMT. However, when the programmes of requirements and objectives for each mode areclearer, a more objective valuation of interests can be made: this will give less room forprejudices and biases.
4.5 Networks as a Basic Planning Concept
Planning for NMT should aim at facilitating trips between any origin and destinationwithin the relevant distance categories in a certain area. A useful tool to achieve this isthe concept of 'network of routes/connections'. The design of the network should bebased on route choice preferences of the users. This network is the basis for theselection of actual measures that facilitate walking and/or cycling. A morecomprehensive description of the design of cycle route networks can be found in 'Signup for the bike, design manual for a cycle-friendly infrastructure'.
The network planning process is a method based on mapping. It means that everyinfrastructure/traffic problem should be pointed out on a concrete spot and fit in thedesired network. The gaps in the pattern of connections will be traced. Based on itsposition in the hierarchy of functions, specific measures can be designed. As a resultthe basic map will be revalued into a NMT map. Hereunder we will highlight the Delftand Delhi experience. But first, we present a diagram of how this NMT network planningprocess works out.
BOTTOM
UP
Make network tests Make basic map ofexisting road and citystructure
Add information ofall kinds of newplans/developments(data + circumstances)
Find problems asBlack spots (accidents)ObstaclesMissing linksInconveniencesNo bicycle parking fac.Barriers
Find desired routesbetween differentorigins anddestinations
Proposals forfacilities asCrossingsTraffic lightsIntersectionsSectionsPavements /sheltersBicycle parking (etc)
NMT -MASTERPLAN
TOPDOWN
Prioritize
Existing Planned
Design standards
Non-motorised transport in developing countries final report
47
4.5.1 The Delft bicycle experience14
The objective of the Delft bicycle network plan was to encourage the use of bicycles andto make cycling safer, quicker and more comfortable, and to reduce car-traffic.Characteristic of this network, that existed already for 75%, is its hierarchy. It consists ofthree sub-networks, each having its own functional and design characteristics: 1) a citylevel network for internal and external and through bicycle trips, requiring quite large-scale expensive improvements (tunnels, bridges); 2) a district (inner-city) levelnetwork for connecting main facilities within the district and collecting/distributingbicycle traffic to and from the urban network, requiring less expensive, investments(bicycle paths, lanes, small bridges, improved junction lay out, etc); and finally 3) a sub-district level network to serve trips within the neighbourhood and provide access topremises (short cuts, paths, small bridges etc). Gaps in the network were solved, directlinks increased and other activities such as under 2 were implemented. All this with theintention to increase the safety, directness and comfort. As the evaluation shows bicycleuse increased compared to the control area (without interventions) and with leaving outother factors, in terms of kilometres per capita and number of trips. Especially,additional trips were made by former walkers and car passengers. The route choicechanged as well. New facilities were used, but, only when they were at the same lengthas the former one (the volume increase has been caused for 58% by route shift, noexternal increase). It did improve the safety situation, since these new facilities wereoften separated paths, which are by their nature more safe. Car use, as the secondobjective, did not increase. The percentage of short trips by car did even fall. One mightconclude that due to improved cognition and perception of alternatives and the removalof detours and delays, bicycle trips were longer on average. Also the bicycle was usedmore often for certain purposes such as shopping. The total modal share changed tothe advantage of bicycles (from 40 to 43%), car and walking remained stable (26%).Public transport went down (from 6 to 4%). The share of bicycle use increased sincefacilities are no constraints anymore and become more competitive.
Interesting to know is whether the approach that is common practice in the Netherlandsnowadays, is applicable in other countries. The project evaluators and various keyinformants believe that the approach is transferable, but do not mention under whatconditions.
4.5.2 The Delhi Bicycle Master Plan
The Bicycle Master Plan for Delhi15 is based on the experiences from the Netherlandsand proves that the network approach can be used in other countries as well. The plan,drawn up by TRIPP, highlights the benefits of a more NMT-friendly city and show someexamples of how that can be achieved by reconstructing roads.16 Its basic concept isnetwork planning, which is elaborated as “network route planning”, “road sectionplanning” and “intersection planning”. In order to promote cycling, a recognisablenetwork of links and junctions has to be developed where the need for detours isminimised and the number of encounters between cyclists (and pedestrians) and motorvehicles are reduced. A special focus is directed to through routes where high numbersof NMT-users can or do make use of. Investments on these routes are more efficientsince NMT volume is high. Besides, to make the network effective, less-intensively usedroutes have to be included to create a coherent structure. In their phasing ofinterventions such a prioritisation based on volume of NMT-traffic and their function hasbeen pursued:
Phase 1: routes with heavy NMT use, where NMT-users have to share the road withMT. Beneficiaries are NMT- as well as MT-users.Phase 2: routes with fast traffic are to be reconstructed to secure safe cycling andwalking.Phase 3: smaller roads have to be reconstructed as part of the bicycle plan.

Non-motorised transport in developing countries final report
48
In a later stage, the network should be developed in such a way it serves distribution atdistrict level, and access on neighbourhood level. Traffic calming measures are thenmore suitable and cost-effective than separated bicycle tracks.
Once the routes are selected and prioritisation has been made, road section planning(what to do with the lay-out: separation or mixing) and junction/intersection planning hasto be dealt with. Especially at intersections, interests of different modes come together,which the planner has to solve. In that process of finding the optimal solution theplanner is searching the correct balance between shape, function and use. This processwill be the subject of next section. For now, we can conclude that the network planninghas been a successful approach in the Netherlands, and can be easily transferred todeveloping countries. The existence of a dense, coherent and consistent network ofbicycle facilities improves cycling conditions and its use. Since there is no uniform- butscattered - origin destination patterns, focusing on a few major routes won’t help somuch.
A hierarchical functional design encourages the use of the bicycle network; if each levelin the network will have its own spacing and design, a logical structure becomes visible.Besides cost-saving aspects (not every route needs expensive adjustments), such anetwork will help to improve recognition and perception of bicycle travel possibilities.

Non-motorised transport in developing countries final report
49
4.6 The urban mobility plan for pedestrian and bicycle traffic
In this section we will describe the approach of development of an urban mobility planas it has been recommended in the guidelines for pedestrian and bicycle traffic inAfrican cities17.The approach is that planning is a learning process ('learning by doing'),where adjustments should be possible. A mobility plan is essential to provide thedirection and continuity of improvements in urban NMT facilities. It further mayencourage relevant departments (planning, transport, land use) to work closer together.The 'learning by doing' approach would imply that feed back stages are an essentialpart of the process.
Though not meant to be a blue print, the following stages are recommended to befollowed:1) Establishment of a proper organisational set-up for urban mobility planning and
implementation, of a user participation set-up and of financing arrangement forinterventions.
2) Preparation of an inventory of user needs and of a NMT route network inventoryand problem inventory.
3) Preparation of a NMT action plan ('pilots').4) Preparation of a long-term urban network plans (as the framework for intervention
selection; no urban mobility plan yet).5) Design of a first package of interventions (using: design concepts, detailed design
aspects).6) Appraisal of the proposed interventions (and the action plan), approval and a start
with implementation (after the first package, the second etc.).7) Development of a complete long-term mobility plan and policies.
As can be derived from the above, before starting an urban mobility plan, it isrecommended to kick off with a down-to-earth action plan (under 3). The advantage ofthis sequence is that an action plan forces a practical orientation and can providevaluable experiences and knowledge about mobility problems, to be used as input for amobility plan. These actions should be planned as pilot projects, with much attention forthe criteria for success. One should be very careful in avoiding obvious failures. Wewon’t go here into more detail about the establishment of an action plan. Hereunder thesteps to be taken are listed for the preparation of an urban mobility plan.
See Steps to be taken:
4.6.1 Carry out a SWOT analysis of the urban transport system (strengths, weaknesses,opportunities and threats)
4.6.2 Provide an overview of the existing road infrastructure and land use:
• inventory of existing pedestrian and bicycle routes
• map of public transport routes and major motor vehicle roads
• maps of land use and important traffic attractors
4.6.3 Analyse the present mobility at macro level: transport system performance
4.6.4 Analyse the present mobility at micro level: understanding changes in the transport system
4.6.5 Analyse the present mobility: make an inventory of user needs
4.6.6 Investigate different urban transport policy scenarios
4.6.7 Choose mobility policies
4.6.8 Design the network of pedestrian and bicycle routes that must be established in the nextten years
4.6.9 Choose design standards
The municipal government is the authority to take the initiative to start the planningprocess. Three tasks can be identified:
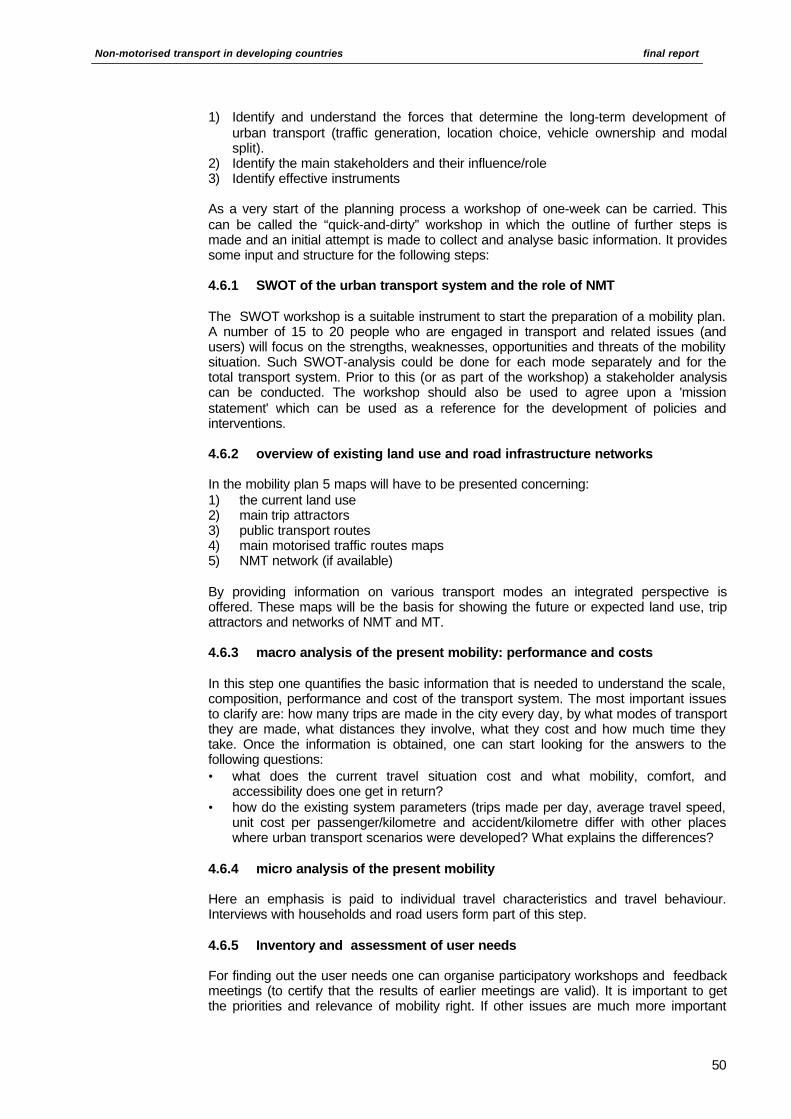
Non-motorised transport in developing countries final report
50
1) Identify and understand the forces that determine the long-term development ofurban transport (traffic generation, location choice, vehicle ownership and modalsplit).
2) Identify the main stakeholders and their influence/role3) Identify effective instruments
As a very start of the planning process a workshop of one-week can be carried. Thiscan be called the “quick-and-dirty” workshop in which the outline of further steps ismade and an initial attempt is made to collect and analyse basic information. It providessome input and structure for the following steps:
4.6.1 SWOT of the urban transport system and the role of NMT
The SWOT workshop is a suitable instrument to start the preparation of a mobility plan.A number of 15 to 20 people who are engaged in transport and related issues (andusers) will focus on the strengths, weaknesses, opportunities and threats of the mobilitysituation. Such SWOT-analysis could be done for each mode separately and for thetotal transport system. Prior to this (or as part of the workshop) a stakeholder analysiscan be conducted. The workshop should also be used to agree upon a 'missionstatement' which can be used as a reference for the development of policies andinterventions.
4.6.2 overview of existing land use and road infrastructure networks
In the mobility plan 5 maps will have to be presented concerning:1) the current land use2) main trip attractors3) public transport routes4) main motorised traffic routes maps5) NMT network (if available)
By providing information on various transport modes an integrated perspective isoffered. These maps will be the basis for showing the future or expected land use, tripattractors and networks of NMT and MT.
4.6.3 macro analysis of the present mobility: performance and costs
In this step one quantifies the basic information that is needed to understand the scale,composition, performance and cost of the transport system. The most important issuesto clarify are: how many trips are made in the city every day, by what modes of transportthey are made, what distances they involve, what they cost and how much time theytake. Once the information is obtained, one can start looking for the answers to thefollowing questions:• what does the current travel situation cost and what mobility, comfort, and
accessibility does one get in return?• how do the existing system parameters (trips made per day, average travel speed,
unit cost per passenger/kilometre and accident/kilometre differ with other placeswhere urban transport scenarios were developed? What explains the differences?
4.6.4 micro analysis of the present mobility
Here an emphasis is paid to individual travel characteristics and travel behaviour.Interviews with households and road users form part of this step.
4.6.5 Inventory and assessment of user needs
For finding out the user needs one can organise participatory workshops and feedbackmeetings (to certify that the results of earlier meetings are valid). It is important to getthe priorities and relevance of mobility right. If other issues are much more important

Non-motorised transport in developing countries final report
51
than mobility, one should consider the relevance of the plan or adjust the plan. In thatcase one might consider starting community development activities where improvingliving conditions (housing, sanitation and employment) is put central. NMT developmentcan be gradually linked or integrated into these as a natural alliance.The selection of unbiased participants is important. A large number of focus groupdiscussions and user platform writing sessions will result in a document “inventory andassessment of user needs”.It goes too far in detail to present possible contents but it may touch experiences,problems and needs, actual and potential conflicts between road users, blackspots andwhat has to be done.
4.6.6 urban transport scenarios
Scenarios are a good way to discuss and compare different visions on urban transportdevelopments with a wide variety of people. One can identify three prototype scenarios:
Laissez-faire strategyThis is the situation where no clearly defined (NMT) transport policies are formulatedand/or implemented. Activities carried out are uncoordinated, unrelated and very adhoc. A rather chaotic traffic situation is the result, in which NMT users find themselvesendangered.
Urban highways strategyAn alternative scenario is that of highway construction in and around the city to avoidtraffic jams. Usually these highways connect the inner-city with new urban residentialand industrial areas, which are quite far out of the centre.
Traffic demand management strategyAn active approach, to enhance or restrict certain modes of transport for specific trippurposes. An example of this restrictive demand management is the parking policy ininner-cities in Western Europe. Further, toll ways (electronic toll systems) in urbanisedareas are another example. Traffic demand management, by offering or not offering aspecific service, will have an impact on land use and activities.
The final selection of the strategy depends on factors as:• Estimated travel cost in future compared to available income per person• Mobility of an individual• The average travel time per inhabitant• Investment costs• Environmental impact• To what extent it contributes in meeting the user needs• To what extent it is consistent with the outcome of the SWOT results• Costs of required investments versus estimated benefits (with regards to transport
efficiency, but also more general and economic benefits) (criterion value for money).
4.6.7 Choice of mobility policies
At this stage of plan development the options for mobility policies within each strategymust be identified and chosen. Policy fields might include: pedestrian and bicycle traffic,traffic calming and safety, traffic management, public transport, taxes affecting land useand transport, road reserves and public open spaces, spatial planning, traffic behaviourand education, police enforcement and environmental issues. There are mainly twomajor criteria for decision-making:• the expected positive contribution towards the preferred transport strategy• the expected impact of a certain policy on future mobility, travel time, costs, user
needs, road network requirements and environmental quality.

Non-motorised transport in developing countries final report
52
4.6.8 Design of the future network of pedestrian and bicycle routes
4.8.1.1 Design of a pedestrian route network
Based on all the information collected one can make a map based on the one preparedin step 2. The below schedule is an indication how a map for a district can be developedfor a pedestrian route network.
Step Description
1 Identify missing links in the existing network, and to identify alignments that can be chosento provide for the missing links.
2 Make a map with the expected main future trip origins and destinations in the area
3 Make an estimate of the pedestrian share in the trips along each “desire-line” on the map
4 Make on a copy of step 1 the main future pedestrian “desire-lines”
Match the desire-lines with the network already existing and indicate additional alignmentrequirements. Minimise conflict points
5 Test the draft network against the user requirements (safety, comfort, directness,coherence and attractiveness)
6 Test the draft network against the provider requirements (cost-effectiveness, sufficientroute network density, availability of sufficient public road reserves)
7 Prepare the final map with individual main routes, starting and end points.
8 Verification (physical)
9 Check road reserves
4.8.1.2 Design of a bicycle route network
There is a huge difference between planning a bicycle route network for a city wherecycling is an established mode of transport with a significant modal share and for a citywhere it only plays a marginal role.
Cities with a minor share of cyclists:In cities without an established cycling culture, the construction of a network ofseparated bicycle track has a high chance of resulting in failure. Opening such anetwork does not mean that there will immediately be a high volume of cyclists using it.A perfect example from Ghana, where a high standard (and costly) bicycle track is laiddown in a low-density area, shows that the road will be intensively used, except bybicyclists (for drying beans, playing, walking etc.).
Further, like in Lima, the stretch might be very difficult to reach and lead from nowhere-to-nowhere. Since the new track will be just part of the trip, the access roads should besafe and convenient as well
The question to be answered is at what scale or area one should start to makeinvestments for a bicycle network. The answer depends very much on the size of thecity; it is recommended to start “not too big”: in a big city it means one should start withjust one district; in a small/medium city one might cover the whole city. Such districtwould serve as a pilot to demonstrate the feasibility of cycling as part of the urbantransport system. It is therefore important to maximise the chance for success. Criteriafor selection the district are:• Low or low/middle income district (in the lowest income population are bicycle
ownership can be too low)• High proportion of medium distance trips to work (3-8 km).• Moderate motorised traffic density• No significant gradients

Non-motorised transport in developing countries final report
53
The next question to be answered is what type of route network can be best aimed at.To prevent the problems like mentioned above, it is recommended to start with genericimprovements of the road network (see section 4.3). Improving road safety byintroducing traffic calming measures on existing roads where cycling in mixed traffic canbe made safe. Thus a provisional network of 'quiet back streets' can be created. Thisnetwork can be made more visible by signing and small additional facilities such assmall scale bicycle parking facilities, crossing facilities, et cetera. Furthermore, oneshould identify missing links in the network of potential safe roads so that directness isimproved. This approach should help to concentrate cycling on certain routes, and thusmake it more visible. It should also sustain and expand the existing cycling to levels thatwould justify investment in more appropriate special facilities.
At neighbourhood level one can integrate bicycle and pedestrians easily since bicycleuse is still limited.
Cities with an important share of cyclists:The question how a network should look like for the future is already answered in theprevious sections. The issues mentioned for interventions in non-cycling cities are validhere as well: improving safety and provision of missing links.The most important challenge of the bicycle network planning is the establishment of acore structure of bicycle arterial routes throughout the entire city, which are clearlyrecognisable as a special investment in improved urban cycling.
4.6.9 Choice of design standards
Design standards of roads are poor in a lot of cases, or at least incongruous with thecomposition of actual road users. If existent, they often don't address the specific needsof NMT. In a number of countries design standards have not been laid down. It isrecommended that they will be as part of the mobility plan.
4.7 Quality criteria
Based on Dutch research on the impact of experimental NMT infrastructure facilities,one can conclude that there are five main requirements more or less representing allwishes of users regarding the infrastructure18,19: Again, these criteria go for pedestrianas well as for cycle facilities.
4.7.1 Coherence, Directness, Comfort, Attractiveness and Safety
1 Coherence
Indicators for coherence are among others: ease of finding, consistence of quality andfreedom of route choice. The system of NMT facilities has no gaps and is linked to themain points where cyclists and pedestrians begin or complete their journeys; completeNMT networks provide connections between all points of origin and destination. It wouldimply:
• Easy access to main network at points of origin and destination• Integration with public transport• Hierarchical approach (i.e. urban, district and neighbourhood network)• Constant route quality and easy to recognise

Non-motorised transport in developing countries final report
54
2 Directness (indicator = travelling time gained and detour factor)
The system of NMT connections provides NMT users with a route which goes asdirectly as possible to their destinations, in which any detour and waiting time atjunctions is reduced to a minimum. It implies:
• Finely meshed network (limiting detours)• Short-cuts wherever possible to bridge natural or man-made barriers• Connections traverse major car corridors as little as possible• Straight paths and no detours at junctions• Minimising delays, well regulated traffic lights
3 Attractiveness
The NMT facilities in an area should be designed and fitted into the built and non-builtsurroundings in such a way that it is pleasant to go cycling or walking. This meansshading, absence of mud and dust, little exposure to exhaust of cars, socially secureand an attractive surrounding, among others. This means:
• Connections coincide as little as possible with major car corridors• Connections pass through attractive, shaded or green environment• Alternative connections available to avoid insecure spots• Socially secure lay out (street lights, no dark hiding places)• Facilities that curb speed or MT intensity, such as shrubbery or street objects
4 Traffic safety (indicator = less accidents)
The NMT facilities guarantee the road safety of the cyclists and pedestrians and theother road users. Fewer accidents will occur. The general approach to safety is: tominimise the encounters between NMT and (high volumes of) speeding motorisedtransport. This can be achieved by segregation of modes, or by traffic calming (see alsochapter 5). A safer network and road design implies:
• NMT-connections coincide as little as possible with major car corridors• NMT-connections cross major car corridors as little as possible• Alternative connections available to avoid unsafe connections• Facilities that curb speed or MT intensity, such as shrubbery or street objects• No mopeds on cycle paths or walkways• Paths enough wide• At junctions, reduced car speed, traffic light or crossings at different levels• Good layout at junctions• No obstacles (poles, containers, badly parked cars etc.)
5 Comfort
The NMT facilities allow a rapid and comfortable flow of NMT (so, capacity is largeenough to prevent pedestrian and bicycle congestion); it means cycling and walking in asteady cycling speed without any hindrance, caused by bumps and potholes, gradients,stopping at junctions. It also refers to possibilities to shelter or to park the bicycle. Theimplications are rather at technical design than on network level.
4.7.2 The application of quality criteria
The above criteria are now globally used and found practical. The elaboration of thesecriteria might vary from one place to another. A lesson learnt is that one should considerthese five criteria in connection with each other to be most effective; however, somecriteria can not always be met: directness is at odds with safety if the cycle path has togo through a no-go area, or with attractiveness if it is along a busy truck road. Althoughit is obvious that safety is of major importance, one should not too easy make

Non-motorised transport in developing countries final report
55
compromises on directness and comfort, as these requirements are importantdeterminants for use. The implication is that restrictive measures for motorised trafficmay be necessary to meet the criteria.
One or two major weak points can undermine the high quality of a route. It is therefore awaste of efforts and money to invest in a few expensive, high quality bicycle routes in acity where cycling is not safe, especially on access or collector roads. A programme toattack the problem spots on potential cycling routes has much more sense and is morecost-effective than to lay-down a single expensive, high-quality bicycle route. Aninventory of all measures necessary to implement the complete network enables theroad authorities to prioritise these measures on the basis of a multi-criteria analysis.Thus the best value for invested money can be achieved.
On a neighbourhood NMT connection, directness is much more important than comfort.Another finding is that pedestrians and cyclists in high volumes do often not mix well onthe same track, due to speed discrepancy.
4.8 NMT Road Safety Management Approach
Road safety is among the most expressed needs of NMT and MT-users in urban areasall over the world. The speed and volume of cars, trucks and buses are particularlythreatening to cyclists and pedestrians. Together with bad driving behaviour, they comeoften into mind when discussing about safety and promotion of bicycle use. In caseswith growing motorization (as is in many developing countries the case) it is absolutelyvital to protect the remaining NMT against the threat and actual dangers of thismotorization.It has been recommended by experts to develop a NMT policy in which safety is putcentral. By doing this, it should target on 2 issues:
1) reduction of risks, and so the number of accidents and casualties per cyclingkilometre.
2) reduction of traffic complexity for NMT-users in urban traffic.
In section 4.9 we will go into some more detail about road safety measures. Here it willsuffice to focus on three broader concepts:
Increasing the number of route options for cyclists / pedestriansThis will allow the NMT-user to choose the safest option and avoid the dangerous ones.If a complete and coherent network of well-maintained routes exists, overall safety forNMT-users is increased. With the lay-out of a network one should consider the quality ofthe road surface as well. Too steep slopes, bends, puddles and other things that mightcause unexpected manoeuvres by cyclists should be avoided.
Minimising and/or softening confrontations between motorised traffic and cycling/ pedestrian trafficThis can be done by segregation of transport modes on roads where speed discrepancyis and remains high. Or one could also reduce the speed differences between thevarious modes. Moreover, at junctions mode-specific traffic lights can be installed.
Improving the competitive position of the bicycle/pedestrians in relation to cartrafficReduction of the volume of car traffic is an option, by prohibiting cars to enter zones orstreets. Further, one could minimise waiting time for cyclists and pedestrians and soavoid dangerous crossings. The design of infrastructure should strongly support theright of way for cyclists. Further, by upgrading facilities and maintaining them safety canbe increased. For instance, potholes force cyclists to make sudden moves towards theroad axis.

Non-motorised transport in developing countries final report
56
4.9 Road Safety Measures
4.9.1 Speed control
Speed control is a very efficient means to reduce accidents on the roads. Not only theabsolute speed of the fastest vehicle is involved, the differentiation between the variousroad users as well. The lower the maximum speed, the less chance for getting anaccident. Data shows that after the introduction of a maximum speed relaxation in theUSA (from 55 to 65 mph), resulting in an actual increase of 2-4 mph, the fatality rateincreased significantly. In some states the fatality rate even increased with 34%. Afterspeed limit reduction from 60 to 50 km/h in Zurich, 24% fewer pedestrian fatalities wererecorded. Same figures revealed from a study on the effects of speed limits, carried outin 21 countries: reducing speed limits from 60 to 50 km/h will result in a reduction of25% fatalities and casualties20.
Table 12 The probability of a fatal cause for a pedestrian after a collision with a carat various speeds
Speed 30 km/hr 40 km/hr 50 km/hr 60 km/hr
Probability ofdeath
5-8% 25% 45-80% >85%
There are various ways to control speed: The most obvious method is policeenforcement. This method is requiring a lot of person power, and therefore not veryeffective and efficient in practice, if one had to rely on this method only. As an additionalmeans it is still important.
Today's most accepted method is 'traffic calming' i.e. infrastructure measures likehumps, chicanes et cetera, which impose the required speed behaviour on motorists.
More innovative is the IT-approach: speed recording systems, intelligent speedgovernors and such. These systems adapt the vehicles maximum speed to what isappropriate in the situation.
The IT-approach is very promising for the future, but for today traffic calming is the mostfeasible option.
4.9.2 Road design
Measures in road design to improve the road safety for vulnerable road users usuallyrefer to traffic calming measures. As has been presented in this chapter, a whole rangeof measures can be taken; besides, the construction of pedestrian crossings, specialbicycle tracks or walkways, a physical separation between the road shoulder and thecarriageway can help to reduce risks.
4.9.3 Vehicle design
Though it is more useful to put efforts on the prevention of collisions, it is still worth tofocus on designs of cars, buses and trucks. Especially the latter two are often involvedin accidents with NMT-users and a deadly cause. It has partly to do with the design ofthe front of these vehicles which is vertical and therefor hits the more vulnerable parts ofhuman body, chest and head, more severely21.
Further, one could think of an in-vehicle speed-controller, a standard one for urbanareas (maximum speed 50 km/hr) or one that starts working when particular moves aremade (bending) or under surface characteristics (bumpy road), or on speed recorders.

Non-motorised transport in developing countries final report
57
This technique, called ISA, Intelligent Speed Adaptation, can reduce speeds at anydesired road without physical facilities like speed humps, but is still under research.
The further development (and enforcement of its use) of rear view mirrors, so thatturning vehicles are able to see other (slower) road users should be encouraged. “Blindcorners” are often mentioned by motorists as the reason why they did not see thebicyclist or motorised two-wheelers before they crashed.
4.9.4 Education and awareness raising
A fourth set of interventions includes campaigns to make the rights and responsibilitiesof pedestrians and cyclists known to the general public as well as the traffic rules thatdeal with safety. Training and educating children in and outside schools help them tounderstand more about traffic rules. Further, driver’s license tests could pay moreattention to the interface with NMT-users. However, one of the best strategies is to getcar-drivers cycling (or walking). This way they will better understand the needs andproblems that NMT-users encounter. However, there is a debate among expertswhether these interventions are really effective.

Non-motorised transport in developing countries final report
58
CHAPTER 5 TECHNICAL ANDINFRASTRUCTURAL ISSUESCONCERNING NMT
5.1 Introduction
In this chapter we will focus on infrastructure and technical issues that will foster the useof NMT. Designing infrastructure and technical solutions will never take place in anisolated context. Methodologies for decision-making are described. At the end of thischapter we will present some technical solutions with which has been experimented inthe SSTAP22 project. We will kick off with the discussion about segregation versusintegration of various modes of transport, NMT and MT in particular.
5.2 Segregation versus integration
The decision whether various means of transport should be separated or integrated willdepend on several factors. In general there are three options:• Mixed traffic: not any single mode of transport has an exclusive right to use (specific
parts of) the road; it refers to a fully integrated transport system.• Visual segregation: The second option is a bicycle/pedestrian lane where a strip on
the carriageway is reserved for bicyclists or pedestrians. Though the facility ismeant to be for pedestrians or cyclists only, one can not speak of a full segregation,since the facility can easily be used by other means of transport.
• Physical segregation: The third option is a sidewalk for pedestrians or bicycle trackfor cyclists. Here the exclusive right of the pedestrian or cyclist is recognised. Thetrack can not (or only very difficult) be accessed by motorised transport. Though thetrack or path itself is uni-modal, at intersections one will always have to deal withother means of transport.
Below a diagram is shown. The diagram refers to segregation or integration of cycletraffic and motorised traffic. It indicates roughly when one should think over particularoptions. As one can recognise, the main components are speed and volume.

Non-motorised transport in developing countries final report
59
In this graph the speed and traffic volume are the ingredients to choose between thethree options as mentioned before. Safety is the goal behind this graph. In area 1 thereappears to be no need for any intervention. Speed and volume are both low. A case asin area 2 hardly ever occurs. In area 3 where speed and/or volume are withinreasonable limits all three options may be valid. This depends on other road or trafficcharacteristics and finance. If in area 4 some kind of segregation is desirable, but oneshould choose for a cycle-lane or track. In area 6 physical segregation is necessary:both speed and volume fully justify investments in bicycle tracks for cyclists’ safety. Inarea 5, a cycle track is desirable, but motorised traffic volumes are so low that a mixedprofile is also acceptable. Cycle-lanes are not to be recommended.In 'Sign up for the bike23' additional considerations are given to decide on what to do incase of situations within area 3. These considerations are: the parking pressure,continuity of routes, number of intersections, and the presence of tram rails.
The graph only shows the volume of motorised traffic, whereas it seems to bereasonable to take into consideration the volume of non-motorised traffic as well.This graph, however, is based on the safety of cyclists: a lonely cyclist will be as muchendangered by the situation as larger volumes. However, when it comes to building
facilities, the number of actual users of the facility will have an impact on the cost/benefitratio of the investment, and thus on the priority.
Another important consideration is that there are 2 ways to achieve a satisfactorysituation for cyclists: one could either build the facility which is recommended for thegiven combination of volume and speed of the motor traffic, or one could diminish thespeed and volumes to acceptable levels for the existing road lay out. This would requirea change in the circulation of the motorised traffic network.
Further, the available road reserve, cost of construction and function of the road shouldbe considered as well. De Langen24 comes up with some useful remarks concerningmixing or separating transport modes and developed decision matrices, which arepresented hereafter. He states:
• Mixing different modes of transport should be combined with traffic calmingmeasures, so that different modes can not choose their own speed freely.
• Mixing pedestrians with motorised traffic is undesirable and only possible whenvolume and speed of MT is very low (<20 km/h).

Non-motorised transport in developing countries final report
60
• Mixing pedestrians and cyclists will usually not create big safety problems, but(depending on volume and capacity of facility) will mainly cause hindrance andinefficiency.
• Pushcarts do belong to the same category as pedestrians. Therefore they shouldbe separated from motorised traffic in the same way as pedestrians. But existingfootpaths are usually not wide enough to accommodate these carts.
• As a rule of the thumb one can state that at the lowest residential access level (withspeeds below 30 km/h), traffic can be mixed. These tracks and roads are NMTdomain. However, at the main transit level, the use of urban corridor carriage-waysshould be restricted to motor-vehicles only and NMT should be completelyseparated. But on most roads (local collector and collector) bicycles can be mixedwith MT (pedestrians can’t!).
On a general level one could observe that there is a big difference in the manoeuvringof pedestrians on the one hand and riding traffic on the other. The implication is that inmany cases it is more appropriate to integrate cycling with motorised traffic than tointegrate cycling and walking. Banning the bicycle from the main road to the sidewalk isno good alternative.
Actually, as De Langen argues, separation of pedestrians and carts on road sectionsdoes not eliminate traffic accident hazards for them. If fact, crossing of the main MTtraffic corridors and collectors is often the most dangerous part. Also at intersectionssome kind of segregation is possible. This could be done by segregation in time (i.e.traffic lights) or segregation in space (i.e. grade separation: tunnels and bridges). Suchsolutions however can be very costly, or not feasible within the existing situation.Therefore speed reduction at intersections is an indispensable option to improve safety.
Based on the considerations above, De Langen comes with the following ranking forpriorities in interventions:1) safe crossings at intersections and mid-block2) separation between pedestrians and MT on all roads apart from access roads, by
means of walkways3) traffic calming to create safe cycling conditions on all local collector roads and most
other collector roads4) consider bicycle lane markings on wide-lane collector roads, or provision of bicycle
traffic capacity on service roads along urban corridors, or separated bicycle tracks.
5.3 Hierarchy in urban road network
Road safety of all road users, including NMT-users can benefit from a road systemwhich will contribute to a more predictable behaviour of road users. In the Netherlandsand Sweden such predictable road behaviour is advanced by creating a limited numberof road categories with their specific function each, and a road design to promote theenvisaged use. (Thus creating the balance between function, shape and use; see 5.4.)The main categories are:1. Transit road: these roads are designed for large flows of traffic on longer distances.
On these roads there is no direct access to individual addresses. Traffic is meant toflow only.
2. Distributor roads: these roads are designed to enable the road users to find theirway to the area of their destination, but don't give direct access to individualaddresses. The distributor road should allow for turning manoeuvres of road usersfinding their way. A moderate low speed is appropriate to allow road users to reactto sudden manoeuvres, and to 'negotiate' with other road users. These roads maysometimes have a 'transit' function for NMT-users.
3. Access roads: these roads are primarily meant to give access to individualaddresses, and should allow for stop-and-go situations at destinations and otheractivities around homes and businesses. Low speeds are imperative. The needs ofNMT are indicative.

Non-motorised transport in developing countries final report
61
A similar hierarchy of roads can be made for NMT and would not automatically coincidewith the one for MT.
Hereunder three decision matrices are presented, on which one can base his or herdecision to integrate or separate. For this three matrices goes that first one has toidentify the specific function of the road: access, arterial transit, or a mix betweenaccess and transit.25

Non-motorised transport in developing countries final report
62
Is the land useresidential, or mixed
residential/commercial,or industrial?
Access trackNMT-only road,mixed walking,cycling, carts
Is MT ADT >500 ?
Industrial access roadcycling and MT mixed,separate walking tracksometimes desirable.(HGV not further dealt
with)
Is MT ADT> 500 ?
Is MT accessdesirable and/or
possible?
Mixed residential / commercial functionResidential function only Industrial function
Access roadMixed walking, cycling,carts and motorvehicles(No HGV allowed)
Access roadSeparate walkways,cycling-MT mixedon carriage-ways(No HGV allowed)
Access road(light)Mixed walking,cycling, carts andmotor vehicles(No HGV allowed)
yes
yes
no
no
yes no
Roads with only an access function
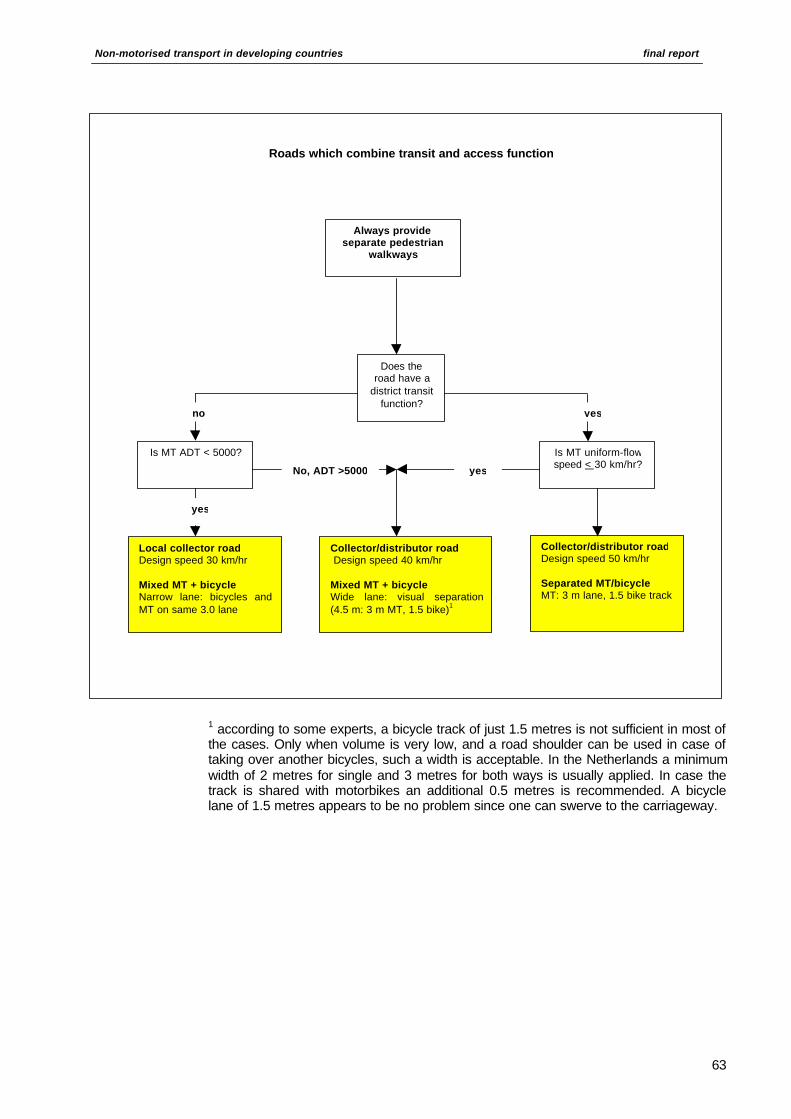
Non-motorised transport in developing countries final report
63
1 according to some experts, a bicycle track of just 1.5 metres is not sufficient in most ofthe cases. Only when volume is very low, and a road shoulder can be used in case oftaking over another bicycles, such a width is acceptable. In the Netherlands a minimumwidth of 2 metres for single and 3 metres for both ways is usually applied. In case thetrack is shared with motorbikes an additional 0.5 metres is recommended. A bicyclelane of 1.5 metres appears to be no problem since one can swerve to the carriageway.
Collector/distributor roadDesign speed 50 km/hr
Separated MT/bicycleMT: 3 m lane, 1.5 bike track
Always provideseparate pedestrian
walkways
Local collector roadDesign speed 30 km/hr
Mixed MT + bicycleNarrow lane: bicycles andMT on same 3.0 lane
Does theroad have a
district transitfunction?
Is MT ADT < 5000?
Collector/distributor road Design speed 40 km/hr
Mixed MT + bicycleWide lane: visual separation(4.5 m: 3 m MT, 1.5 bike)1
yes
no
Is MT uniform-flowspeed < 30 km/hr?
yesNo, ADT >5000
yes
Roads which combine transit and access function

Non-motorised transport in developing countries final report
64
5.4 Infrastructure design
After having decided what kind of function a road will have in the hierarchical urban roadnetwork, the intended function might sometimes not coincide with its practical use. Innext section we will elaborate on that.
5.4.1 Triangle of shape, function and use
The following approach (Figure 6) can be used for analysing a particular problem intraffic. As mentioned above, a planner has to design a road with certain ideas in mindabout the road’s purpose or functions for various modes, the shapes that go with it andits expected use. A function is not always been pursued by its shape, but usually bytraffic regulations (signs) as well. There are several different functions such as access,distribution or transit for each kind of mode. Since the interest of various modes differ(and conflicts are luring), the planner develops a functional classification of roads androad hierarchy is adopted.
Always separatetransit traffic fromaccess traffic
All mixed service roadWalk + cycle + MT on same roadon both sides of the main roadOne-way MTTwo-way cycling
Provide separated walkway
Arterial transit roadprohibited for NMT
Provide frequent safeNMT crossing points
Service roadParallel to transit section,separated by open drain,median verge or barrier
Is MT ADT > 500 ?
Access transit
Walkway,Cycle track (one way)MT lane (one way)MT parking lane
Walkway,Mixed MT + cycle roadMT parking laneOn both sides of the main roadOne-way MT, two-way cycling
Is ADT bicycles >4000?
Mixed walk + MT trackCycle track (separated)
Is ADT bicycle >4000 ?
yesno
Roads with a main arterial transit function

Non-motorised transport in developing countries final report
65
Figure 6 The triangle shape-function-use
Like function, the shape of a road can also change over time, e.g. by lack of propermaintenance or because of a reconstruction of the road. The third component is “use”,i.e. the actual traffic composition and behaviour plus all other activities carried out withinthe road reserve. That can be different from the intended one. If a traffic problem arises,there is a imbalance or incompatibility between function, shape and use. For example,bicyclists who are cycling on the main (collector) road might be forced to do so byparked cars blocking the bicycle track. Function and use have been mixed up. Theeasiest way to solve such a problem is to prevent cars parking on that track byadjustments in the shape of the segregation measure or enforce parking restrictions.Hereunder a set of interventions is given.
Table 13 Types of intervention to get a proper balance in shape, function and actualuse
Type of intervention Example
Adjust the shape: • build traffic calming structures
• construct walkways
• reconstruct the carriageways
• place kerbstones to prevent parking
Influence the use: • establish and enforce parking restrictions
• relocate street traders
• ban truck traffic
Change the function: • provide other routes for transit traffic
• convert areas into pedestrian zones
shape
function use

Non-motorised transport in developing countries final report
66
5.5 Mobility improvement menus26
The pilot projects in the SSATP consisted of two interrelated menus of interventions forimproving existing roads, i.e. pedestrian and bicycle facilities and measures for trafficcalming. Two menus of interventions to improve existing roads are given below.
Table 14 Two menus of interventions used in the SSATP project
Menu Type of intervention
Pedestrian and bicyclefacilities
Walkways (1)Missing walk and cycle route links (2)Pedestrian crossings, combined with vehicle speedreduction (3)Physical separation between road shoulder andcarriageway (4)Separation bicycle tracks on main bicycle routes (5)
Traffic calming Raised zebra crossing (6)Speed hump (7)Intersection corner redesign (8)Pedestrian crossing island (9)Median (10)Narrowing with bicycle slips (11)Bus bays, combined with a raised crossing (12)Raised intersection of local collector roads (13)Low speed roundabouts at intersections (14)Short straight sections, or staggering (chicane) roadaxis (15)Carriageway narrowing (16)Road and road surface devices (rumbles, pinchpoints, signs)
5.5.1 Pedestrian facilities
Interventions to improve pedestrian facilities and safety do not obtain the full effect ifthese are randomly planned. Like with interventions for bicycles, a comprehensiveapproach should be followed, that is linked to urban planning and traffic strategies andinterventions for other modes of transport.
Two sets of interventions should be put central (as mentioned in table above):• Area-wide speed reduction or traffic calming schemes• Provision of an integrated walking network
Whereas the first set of interventions is usually applied in residential areas, the secondcan often be found in town-centres (shopping areas, historical sites). Again, the waythey should be applied depends much on the position of the road in the functionallyhierarchical network.
Ad 1) walkwaysPedestrian speed in urban areas is generally low due to an absence of walkways,pedestrian congestion, bad pavement quality and waiting time for crossing roads. Anaverage walking speed of around 3 km/hr is quite common. Average speed of walkingcan be improved drastically with low cost and efficient measures.

Non-motorised transport in developing countries final report
67
Ad 2) construction of missing walk and cycle route linksIn the African pilot cities pedestrians and cyclists had to make significant detours toreach their destinations. Fenced plots, lack of bridges and nonnegotiable roads causedmajor increase in trip time. The construction of NMT-bridges over streams ranked highin all user priority lists; once constructed the bridges are widely used and appreciated.
Ad 3) pedestrian crossings, combined with vehicle speed reductionIn many cities pedestrians and cyclists face problems when crossing the road. A majorshare of fatalities and injuries among NMT-users is when they cross the streets andhave a collision with a car or bus. High speed of the motorised vehicle and/or a suddencrossing at an inappropriate place is often the major reason. Solutions have to beestablished for both problems: i.e. traffic speed should be slowed, roads should becrossed at safe, clearly visible crossing points. Raised zebra crossings, speed humpsand pedestrian crossing islands do reduce the speed of cars up to 30 km/hreffectively and provide pedestrians and cyclists safer means to cross roads. So far, theAfrican experience shows us that concentrating crossing movements are difficult torealise. Therefor, attention to speed limitation turns out to be most important.
Ad 4) Separation between road shoulder and carriagewayAn open road shoulder along urban roads increases the traffic accident hazardssignificantly. The grey zone along the shoulder where no barriers are constructed doescreate conflicts between various purposes: walking, cycling, trading, parking, overtakingetc. Facilities (bollards or concrete T-blocks) should be made at intersection corners,bus bays, speed humps and shoulders opposite pedestrian crossing islands and 25 m.on either side of a raised zebra-crossing.
Table 15 presents the needs of pedestrians with regard to walking facilities andcrossings. These needs or requirements should guide planning and design of thefacilities offered.
Table 15 Needs of pedestrians and imperatives for planning and design
Walking facilitiesNeeds of pedestrians:
1) Appropriate walking network enabling pedestrians to reach all their destinations.
2) Shortest possible routes between two destinations, except in areas mainly devoted toleisure, commercial or cultural activities
3) Choice between alternative routes for trips with different purposes (leisure and work tripsfor example).
4) Continuity of routes (avoiding abrupt changes in the way they are planned and theamount of attention required from the pedestrians; remove obstacles).
5) Adequate location of crossings (zebras, traffic light crossings, underpasses or bridges)in order to satisfy the two requirements: shortest route, continuity.
6) Reduction of friction between motor or bicycle traffic and pedestrians wherever possible(segregated or separated pedestrian routes, or speed reduction).
7) Good surface of pavement; wide enough to accommodate the volume/flow ofpedestrians; shelters for bad weather or for waiting; adequate lighting; specific directionsigns for pedestrians; resting facilities.

Non-motorised transport in developing countries final report
68
CrossingNeeds of pedestrians:
1) Adequate location of crossings (see above)
2) Adequate time for crossing (long enough gaps between cars – traffic lights)
3) Reduced waiting time for pedestrians to cross (through-traffic management measures)
4) Reduced physical effort (as few underpasses or pedestrian bridges as possible).
5) Possibility of crossing all along links with particular specifications (commercial streets,leisure areas): traffic management.
6) Adequate mutual visibility of pedestrians and drivers on the approaches to the crossing(through planning of parking facilities).
7) Reduced risk for pedestrians when crossing in the right place (design must ensure thatvehicle users behave as expected).
5.5.2 Bicycle facilities
Ad 5) Separation of bicycle tracks on main bicycle routesThe authors of the guidelines state that safety is the major requirement for cyclists.Speed reduction has therefor top-priority. Separate tracks do solve the problem onsections, but not on intersections. Further, invisibility of the cyclists (not expecting oraware of a cyclists) is another field to work on. The best way to achieve visibility is bymixed use of the carriageway on most roads within the limits set out in 5.2 (segregationversus integration). Here we would like to focus on the various options:
Bicycle lanes on mixed traffic roadsWhen road capacity is a problem giving separate lanes to cyclists on a combinedcarriageway is the first preference. Speed level should be below 50 km/hr. Atintersections enough space should be reserved for cyclists (crossingislands/medians). No tested example from the SSATP project is available.
Mixed traffic service parallel to a transit MT carriagewayThe possibility of cycling along the major urban corridors is essential, to enablecycling throughout the city. Based on the experiences in SSATP, a.o. Dar esSalaam a mixed traffic service road along the main corridors appears to be mostattractive in large African cities. As a side-effect one can see that the traffic on themain road is not obstructed. However, the barrier character of the road forcrossing NMT will be enlarged.
Separated bicycle- or NMT-only tracksA bicycle lane is no solution when speed of MT will remain high. Separatedbicycle- or NMT-only tracks are a potential solution. However, still speed shouldbe slowed down at intersections. The intensity of cyclists and pedestrians arefactors to decide whether pedestrians should have separate facilities. Theconstruction of a bicycle-only track without considering the pedestrians may resultin a chaotic, ineffective solution because pedestrians will make widely use of thecycle path if there is no alternative. One should also identify whether the volumeof cyclists is sufficient to avoid invasion of other users. Experiences in Africa(Ghana) and Latin America (Lima) have shown that too low volume of bicyclistscan cause problems alike.
5.5.3 Traffic calming as an urban transport strategy

Non-motorised transport in developing countries final report
69
Though very little experience exists today about whether and how traffic calminginterventions have to be adjusted to local African, Asian and Latin-Americancircumstances, one might conclude that these interventions have great potential.However, some experts argue that there is no win-win situation in general. Car drivingwill be less attractive and comfortable, braking and gaining speed again will cost extraenergy and even lead to more emissions. However, if its main objective is to create asafe flow of traffic, and to reduce the number of accidents it is a useful strategy. Further,one can expect an increase in road capacity through higher intersection efficiency.Actually, this illustrates once more the necessity and importance of dividing the roadnetwork into a hierarchical structure (see section 5.3), and to incorporate NMT in anoverall traffic management strategy. Doing so, one can establish three clear roaddomains and according measures: NMT, consisting of all access roads and trackswhere MT is just partly allowed; mixed NMT/MT, consisting of collector roads where MTspeeds are limited and the mix of cycling and MT is safe; and finally, the MT consistingof MT-only transit urban corridors.
Ad 6 and 7) Speed hump and raised zebra crossingIn the SSATP project various traffic calming measures are tested. The conclusion is thathumps with precast concrete blocks (for slopes), a short flat top, and approaches with astrengthened foundation and brick pavement, work best.
On all locations with a considerable number of concentrated pedestrian crossings oneshould construct raised zebra crossings. The raise of an entire intersection (platform) isalso possible. No tests are available from the SSATP yet.
Ad 4) Separation between road shoulder or intersection corner and carriagewayOpen road shoulders along urban roads greatly increase the traffic accident hazards,since it does not delineate the functions; conflicts will arise between walking, parking,street trading, picking up passengers etc. A physical, visible separation between thecarriageway and the shoulder largely eliminates the problem.
Ad 8) Intersection corner reconstructionIn Africa intersections have been designed according to highway standards (too wide).As a result speed is generally too high, causing accident hazards. Furthermore, the‘empty’ space in the corner is occupied by street vendors or taxis, making theintersection more prone to accidents and congestion. A reconstruction of theintersection would increase safety by reducing car speed. A reconstruction of Y-shapeinto T-shape junctions also will limit car speed.
Ad 10) MedianOvertaking at an urban road (and using the opposite road side) is dangerous behaviour.The construction of median, preventing drivers to overtake, is an effective means oftraffic calming. The median can also be used by a pedestrian when crossing the road.The need for this is bigger when it is a 2x2 lane road.
Ad 11) Road narrowing with bicycle slips (bypasses)Road narrowing with bicycle slips or bypasses has two distinct advantages: it reducesthe speed of cars and simultaneously channels the two traffic flows in a smooth way.The obvious disadvantage of a road narrowing without bypasses is that it may result injamming cyclists and pedestrians. It is therefore important to create bypasses forcyclists to prevent this and to make sure that such bypasses will not be blocked (e.g. byparking cars).
Ad 12) Bus baysThe construction of bus bays can reduce the chaotic stopping of buses for passengers.This stopping and departing has a strong impact on safety, but also on traffic flow. Sincethey also regulate traffic flow in a better way, this instrument can also create a positiveattitude of bus drivers towards traffic calming programmes.

Non-motorised transport in developing countries final report
70
5.6 The cost and benefits of various NMT- promotion measures
This section is split up into two parts. Firstly we will focus on 4 case studies at city levelin which a cost-benefit analysis has been conducted. It has appeared to be the first ofits kind. Therefor, assumptions may be sometimes questionable and need furtherresearch. However, the overall results will show the economic value of increasedcycling. The second part consists of a number of tests conducted in the SSATP-programme for which a cost-benefit analyses of walking and cycling interventions havebeen carried out. This section concludes with some basic conclusions.
Annex 10 shows the methodology of Cost-Benefit-Analysis as it can be used for NMT.An adjusted methodology has been used in a Dutch study on the cost-effectiveness of amunicipal bicycle policy in a small city in the Netherlands.
5.6.1 Cost Benefit Analysis of NMT-interventions in 4 cities27
The overall objective of the study carried out in 4 cities (Delhi, Morogoro, Amsterdamand Bogota) is to give an indication of the potential benefits of cycling interventions. Theauthors clearly did not pretend to have conducted a thorough scientific exercise, sincetime and budget were limited.
Amsterdam:In the study the costs and benefits have been calculated for two sets of interventions,i.e. improving parking facilities for bicycles throughout the city; and improving the bicyclenetwork, according to the proposals in the Core Bicycle Network Plan, resulting in highquality bicycle facilities on 7 important routes and quality improvements of all otherroutes of the core bicycle network. Table below presents the changes in total amount oftrips and kilometres during evening peak hours due to bicycle policy.
Table 16 Changes in total amount of trips and kilometres for three modes oftransport during evening peak hours (16.00 – 18.00 hr) due to bicycle policy, 1998.
Trips (x 1000) Kilometres (x 1000)
Bicycle Car Public T. Bicycle Car Public T.
Actual situation 1998 102 219 138 335 4216 2471
Parking interventions 109 216 135 367 4200 2451
Network interventions 104 218 137 345 4212 2464
From this table we can derive that in the case of Amsterdam parking plays a morecrucial role for promoting cycling than a further development of a network. Apparently,bicycle theft is an urgent problem and the cycling conditions are relatively good already.Extrapolating these figures for daily totals, an increase of 44,000 bicycle trips and areduction of 131,000 car/kilometres can be expected.
The economic value of these changes can be calculated when looking at the reductionof parking places needed for cars (a saving of 16.8 million NFL per year); a reduction ofpollution (a saving of 3.1 million NFL per year); a reduction of traffic accidents (a savingof 5.6 million NFL per year); a reduction of thefts (7.5 million NFL per year); a reductionin costs of health and absenteeism (7 million NFL per year) and time saving (15.3million NFL per year). With a total cost of 120 million NFL over 20 years the overall CBis 1:1.5.

Non-motorised transport in developing countries final report
71
Figure 7 Cost and Benefits of 2 sets of interventions in Amsterdam, 1998
Bogota:In this study the potential benefits of the bicycle master plan are estimated. The BicycleMasterplan of Bogota consists of the construction of a 300 kilometres long routenetwork, with a primary network of separate bicycle paths of 150 km and an equallylong secondary network of other high-quality bicycle amenities.
For the calculations several assumptions have been made: the masterplan will result inan increase of bicycle use from 0.58% of total number of trips to 3-5% in 2009 (baseyear = 1999). With an autonomous increase in mobility of 2.5% per year, it will lead to953,000 bicycle journeys per day in 2009; of these trips 843,000 are extra bicycle trips.Number of bus and car trips will reduce by 472,000 and 168,000 respectively.
The total costs of the bicycle infrastructure amount up to 186 million USD. The benefitsare calculated as saved costs since not travelling by car. For the period 2000-2009these amount up to 493 USD. The composition of savings is as follows28:
Less road maintenance: 0.05 USD per journey 14.1 million USDFewer parking places: 1.00 USD per journey 282 million USDLess congestion: 0.26 USD per journey 72 million USDLess pollution: 0.44 USD per journey 124 million USD
The savings on prevented accidents and on running costs for vehicles are thefollowing29:
Traffic safety: 300,000 USD per kilometre 643 million USDUser costs (car): 0.175 USD per kilometre 105 million USDUser costs (bus): 1.95 USD per trip 62 million USD
2% 4%
18% 15% 20%
41%
-200
-150
-100
-50
0
50
100
150
million US$in 20 years(US$ 1998)
Cos
ts
Infr
astr
uctu
re
Con
gest
ion
Pol
lutio
n
Hea
lth
Roa
d sa
fety
Bic
ycle
thef
t
Use
r co
sts
Tim
e sa
ving
s
CostsBenefits
C / B = 1 : 1.5
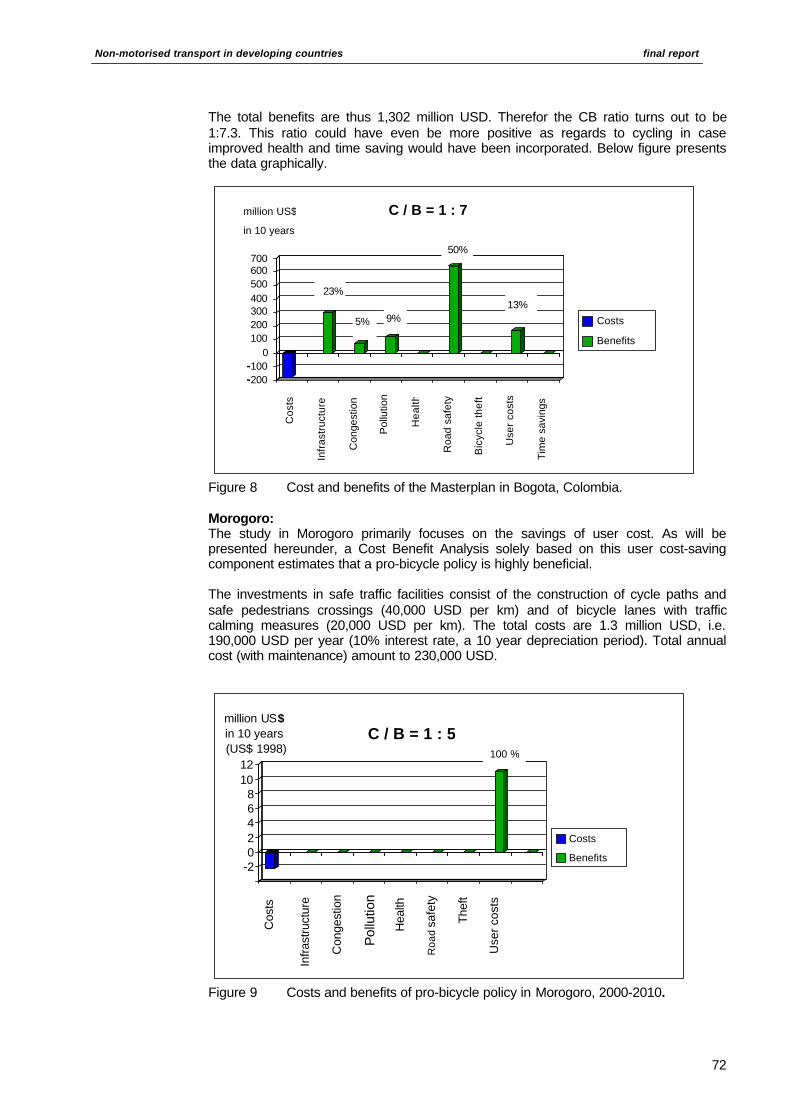
Non-motorised transport in developing countries final report
72
The total benefits are thus 1,302 million USD. Therefor the CB ratio turns out to be1:7.3. This ratio could have even be more positive as regards to cycling in caseimproved health and time saving would have been incorporated. Below figure presentsthe data graphically.
Figure 8 Cost and benefits of the Masterplan in Bogota, Colombia.
Morogoro:The study in Morogoro primarily focuses on the savings of user cost. As will bepresented hereunder, a Cost Benefit Analysis solely based on this user cost-savingcomponent estimates that a pro-bicycle policy is highly beneficial.
The investments in safe traffic facilities consist of the construction of cycle paths andsafe pedestrians crossings (40,000 USD per km) and of bicycle lanes with trafficcalming measures (20,000 USD per km). The total costs are 1.3 million USD, i.e.190,000 USD per year (10% interest rate, a 10 year depreciation period). Total annualcost (with maintenance) amount to 230,000 USD.
Figure 9 Costs and benefits of pro-bicycle policy in Morogoro, 2000-2010.
23%
5% 9%
50%
13%
-200-100
0100200300400500600700
million US$
in 10 years
Cos
ts
Infr
astr
uctu
re
Con
gest
ion
Pol
lutio
n
Hea
lth
Roa
d sa
fety
Bic
ycle
thef
t
Use
r co
sts
Tim
e sa
ving
s
Costs
Benefits
C / B = 1 : 7
100 %
-202468
1012
million US$in 10 years(US$ 1998)
Cos
ts
Infra
stru
ctur
e
Con
gest
ion
Pol
lutio
n
Hea
lth
Roa
d sa
fety
Thef
t
Use
r cos
ts
Costs
Benefits
C / B = 1 : 5

Non-motorised transport in developing countries final report
73
The current total costs for making a journey are about 14 million USD per year. 25% ofthese costs are related to travel time. The difference in travel costs between a-laissezfaire and a pro-bicycle policy are 11 million USD in 10 years, assuming that bicycle usewill increase from the actual 20 to 30% in 2010. These savings can be regarded asbenefits. All other potential benefits, like savings on investments for motorisedtransport, environment, quality of life, traffic safety, increased mobility and employmentare not considered. Even so, the outcome of the Cost Benefit Analysis shows a positiveC/B ratio of 1:5.30
Delhi:In the case of Delhi the cost and benefits of improvements on one representative stretchof the Delhi road network have been calculated. The improvements include aconstruction of a cycle path and bus lane. The upgraded road will be more efficientbecause present chaotic mix of different transport modes, including bicycles, leads to areduction in capacity and speed. Further, a positive impact on bicycle use is expectedsince traffic safety has been increased.
The reconstruction will cost about Rs. 26 million per kilometre. Maintenance will beabout Rs 2.6 million per kilometre. Depreciation period is 25 years for infrastructure, thediscount rate amount to 6% per year.
The benefits will result from an improved traffic flow, accommodating 400 instead of 290buses per hour in each direction, and 100% more cars per hour. Travel time will reducesignificantly (50% for bus passengers and 30% for car and scooter riders). The averagetotal travel time for MT will drop by 48%, which corresponds to Rs. 128 million per year.
For estimating the environmental and user costs, the study compares the situationwhere 7% of trips are made by bicycle with the situation that no cycling exists anylonger in Delhi, due to safety and environmental reasons. Savings on user costs (fuel)and on costs of air pollution are Rs. 68.1 million and Rs. 14.5 million per yearrespectively.
Increased safety will lead to a cost saving of Rs. 3.7 million per year, based on Rs.67,694 per prevented injury and Rs. 469,475 per prevented fatality. All this results in netpresent value of total costs of Rs. 121 million and a net present value of benefits of Rs2444 million. The C/B ratio is thus 1:2031.
Figure 10 Cost and benefits of road reconstruction in Delhi.
7%2%
31%
60%
05
1015202530354045
million US$in 25 years
(US$ 1998)
Cos
ts
Infr
astr
uctu
re
Con
gest
ion
Pol
lutio
n
Hea
lth
Roa
d sa
fety
Bic
ycle
thef
t
Use
r co
sts
Tim
e sa
ving
s
Costs
Benefits
C / B = 1 : 20

Non-motorised transport in developing countries final report
74
5.6.2 Cost and benefits of the pilot interventions in SSATP
In the SSATP project a series of test interventions for improved walking and cyclingfacilities/infrastructure has been carried out. Its primarily focus in these tests has beenon speed reduction or traffic calming as well as increasing attractiveness of NMT. Werefer to the guidelines for pedestrian and bicycle traffic in African cities, produced on bythe WB SSATP for more details. Here we suffice with excerpts of some examples.
Walkway improvement along corridor:The activities for improving the walkway were primarily focused on removing black spotsin the walking routes. Comfort, directness and safety were improved. It had a verypositive B/C ratio of 3.4. Actually, it could have been higher when other benefits(increased safety and comfort) were included as well.
Raised zebra-crossing in Dar es Salaam and Morogoro:The study shows that zebra-crossing only make sense if they are raised. No positiveeffects were measured in the test with only a painted zebra-crossing. Improved safetyhowever, has been the key effect of the raised zebra: no accidents happened afterconstruction, whereas before 12 serious accidents occurred. The B/C ratio is 1.45 andonly takes into account the accident cost avoidance.
NMT bridge in Dar es Salaam:The construction of the bridge is a time-saving intervention. The detour (in case of nobridge) requires 15 minutes on average. The time-saving is set at 5 minutes. The totalcosts are then considered to be small: the B/C ratio proves that: 4:1.
Road shoulder separation MT – NMT in Dar es Salaam:A 500 meter long section of a collector road with previously open shoulder was linedwith T-blocks. The open shoulders often create chaotic situations, reduce capacity ofthe carriageway and damage the road pavement. After implementation the situationimproved considerably. With regard to the value of the road shoulder, the test showed aone dollar increase per pedestrian per kilometre per year. It means that with an averagedaily traffic (ADT) of 1,600 one will break-even. Actual ADT is however three times ashigh! Further, the pavement is still in good condition and doesn’t need any repair due toimproper use of the shoulder. The costs saved on road widening (to increase capacity)are avoided. It appears that all benefit-components on itself would fully justify theinvestment.
Below, the findings are summarised in table form.
Table 17 An overview of the main costs and benefits of interventions tested in SSATP project
Test interventions Totalbenefits
Benefitcomponents
Total cost Costcomponents
B/Cratio
Walk way improvementalong corridor in Morogoro
14,400 USD(per year)
Saving travel time 18,000 USD
4,200 USD/py
Repair culverts
Walkway construct.
Build bridges
3.4
Raised zebra-crossing inDar es Salaam andMorogoro
4,350 USD(per year)
Avoidance cost ofaccidents
4,500 USD perzebra-crossing
1,000 USD/py
Raised zebra-crossing
1.45
NMT bridge in Dar esSalaam
6,000 USD(per year)
Saving travel time 11,000 USDper bridge
1,500 USD/py
Bridge
Cost reductionbecause communityparticipation
4

Non-motorised transport in developing countries final report
75
Test interventions Totalbenefits
Benefitcomponents
Total cost Costcomponents
B/Cratio
Road shoulder separationMT – NMT in Dar es Salaam
Unknown, buteach benefit-componentseems tojustify theinvestment
Increased value ofroad shoulder
Reduced cost ofpavementmaintenance
Increased cap. ofcarriageway
1.6 USD permeter (peryear)
T-blocks ?
Median in Eldoret (Kenya) 5,500 USD1
(per year)
10,000 USD2
(per year)
1 reduction in costsaccidents2Increase modalshare of cycling
21,000 USD
4,500 USD(per year)
Median construction 1.21
2.32
Mixed NMT track along anurban corridor in Eldoret
7,000 USD1
(per year)
15,000 USD2
(per year)
1 saving on busfee2 reduced costs ofaccidents
25,000 USD
5,300 USD(per year)
Construction of road
,, crossing island
,, speed humps
Repair drainageculverts
> 4
Bicycle track along urbancorridor in Eldoret
6,000 USD1
(per year)
4,000 USD2
(per year)
14,000 USD3
(per year)
1 Pedestrians gain2 avoided costs ofaccidents cyclists3halteringreduction ofbicycle use on thisstretch
18,000 USD
3,900 USD(per year)
Reconstruction road
High kerbs
1.5
4 to 5
Median in Eldoret:The need for the construction of a median on both sides of a bridge in Eldoret wasrather urgent. Car speed was far too high; dangerous overtaking was common; safetyfor pedestrians and cyclists was absolutely not guaranteed when crossing the road orusing the edge of the carriageway. However, after completion the traffic safety wasrestored; vehicle speed brought down; and NMT volume increased. The B/C ratio turnsto be 1.2 (in case one considers the reduction of cost of accidents only) and 2.3 (in caseonly the change in modal share is taken into account).
Mixed NMT track along an urban corridor in Eldoret:The major purpose for this test intervention is to reduce the number of accidents assoon as possible. Speed appeared to be very high (max. 70-90 km/ph). By theconstruction of a separate track for cyclists and pedestrians it was aimed to increaseroad capacity of MT as well. The project turned out to be successful, but withunexpected results. Due to the limited capacity of the track, cyclists and pedestrianscould not use the facility both. In fact, pedestrians claimed the track and cyclists usedthe carriageway. Still, as mentioned before, the results were positive: safety improved(no fatal accidents were recorded after completion of the track), the road capacityincreased and attractiveness enhanced by eliminating those black (unsafe) spots.Therefor the B/C ratio exceeds even 4.0.
Bicycle track along urban corridor in Eldoret:Irregular parking along the road, high speed of motorised traffic on the carriageway andobstructed go-through for pedestrians created problems concerning safety and roadcapacity. The test intervention aimed at smoother car-parking, unhindered walking onsidewalk and increasing safety and attractiveness for cyclists and pedestrians. Again,like in the previous example, things worked out differently. However, its effect, thoughunintended, is positive: the new bicycle track remains free of parked cars; attractivenessfor pedestrians using the new track increased and so did safety for them. The cyclistsstill make use of the carriageway, but due to better use of the road, capacity and safety

Non-motorised transport in developing countries final report
76
increased. In Table 17 the benefits are given in case pedestrians still maintain theauthority over the track (6,000 USD) and in case cyclists will capture the track (18,000).The corresponding ratio’s of B/C are 1.5 and 4 to 5 respectively.
5.6.3 Promising results form the Cost Benefit Analysis
One of the authors of the first study presented in this paragraph, made the followingthree conclusions based on the CBA:
• Measures that reduce MT driving speed, especially in urban areas, will improvesafety and in some cases mobility for pedestrians and cyclists;
• The benefits from facilities for pedestrians and cyclists exceed costs widely;
• Measures that improve conspicuity and visibility are cost beneficial. It improvesthe status of the bicyclists/pedestrians, makes him/her more recognised, and thatwill promote cycling and safety;
Moreover, the following conclusions can be derived from the test interventions inSSATP:
• The B/C ratio is high in case black spots are eliminated. The impact of preventedcosts of accidents (fatalities, injuries, damage, congestion) appears to be veryimportant;
• The savings on bus fares by using bicycles can have a significant impact;
• Investments in walking infrastructure do have similar (or sometimes even higher)C/B ratios as those in cycling infrastructure. There is no reason to focus moreintensively on cycling because of cost-efficiency;
And more in general:
• In a city (like Amsterdam) where facilities are already up to a certain high standard,additional investments will have less impact than in cities without any, or very littlemoney spent on NMT.
• Calculations have shown that when investing in bicycle infrastructure (compared toa MT lane), the total savings on infrastructure and trip costs are about 35% (1,600USD) of total annual cost of bicycle infrastructure.
• The total costs of MT (infrastructure and operating costs) are 4 to 8 times higherthan for bicycles.

Non-motorised transport in developing countries final report
77
CHAPTER 6 IMPEDIMENTS, REQUIREMENTSAND OPTIONS FOR NMTPROMOTION
6.1 Impediments, requirements and options for furtherdevelopment of NMT
This section will go into more detail with respect to requirements or conditions for furtherdevelopment of NMT. Since the study embraces the demand-side approach we willfocus on primarily perceptions of users and non-users. From data we can derive mainfactors that are negatively affecting the use of bicycles. Promotion of NMT should dealwith these issues.
6.1.1 Lack of traffic safety3
Lack of traffic safety which results in a high risk of getting involved in road trafficcrashes is one of the major deterrents to bicycle use by a large number of people. Inchapter 2, non-NMT-users mentioned it as the most important factor for not usingbicycles in Leon and Arequipa (40% and 35% respectively).
In Table 18 some data on traffic victims is presented. Pedestrians and cyclists take inmany countries a more than proportional share of total number of road users killed. Thefigure ranges from 2 up to 5 times the proportional share of total victims. Withmotorcyclists they belong to the group of vulnerable road users (VRU).
However, experience in countries like the Netherlands and Denmark show that the risksfor cyclists to be killed can be reduced substantially. From the European researchproject ‘Walcyng’ it appeared that a larger share of cycling in the modal split correlateswith a lower risk per kilometre cycled. So the present rather dangerous position of NMTshould not be taken for granted, nor be used as an excuse for not promoting its use.
Table 18 Proportion of road users killed in various modes of transport as percentageof total fatalities (in %)
City, Nation (year) Pedestrians Bicyclists Motor bikes Cars Others
Delhi, India (1994) 42 14 27 12 5
Thailand (1987) 47 6 36 12 -
Kathmandu, Nepal 43 9 13 36 -
Bandung, Indonesia(1990) 33 7 42 15 3
Netherlands (1990) 10 22 12 55 -
USA (1995) 13 2 5 79 1
3 In a study by Gomez (2000), social safety is mentioned as the most important attributeto evaluate transport options. The reader is referred to section 2.5.2.

Non-motorised transport in developing countries final report
78
6.1.2 Requirement: improve safety
As has been shown in chapter 5, traffic calming measures and special facilities as cycleand walking tracks and lanes for pedestrians and cyclists improve their safetysignificantly. Additional measures as traffic regulations (speed limits) and laws onliability by traffic accidents4 should be considered as well. The final choice of measuresdepends very much on the existing safety situation, function of road, and the volumeand speed of traffic.
Though some experts claim that NMT promotion only makes sense when safetyproblems are tackled first, counter-arguments exist: there is no need to wait till safetystandards are improved, before other promotional measures can be taken. Actually, theproblem tree for cycling (annex 7) underscores this statement. From this tree we canderive that unsafety and invisibility are linked. Poor visibility and/or low awareness ofother road-users on their turn are partly the results of low numbers of NMT-users. Itleads to a conclusion that the chance of a fatal accident per NMT-user (especially acyclist) decreases when more cyclists or walkers are using the road32.
Awareness raising and education/training of road users on traffic safety, especiallyrelated to NMT have an important impact on the behaviour of MT-users if combined withother initiatives including policing and design changes of vehicles and roadenvironment. Generally, road safety education consists of teaching skills, knowledge,understanding of and behavioural patterns, to enable road users to prevent accidents. Ittakes place at primary and secondary schools, driving schools and at specific courses.Foremost, riding or driving skills are a precondition for safe behaviour since without that,no sufficient attention can be paid to safety. Knowledge about rules is the secondprecondition. People should learn how to apply these rules. Thirdly, rules have to beunderstood in the general framework of understanding traffic processes. Wittink33
argues that especially practical training and exposure to traffic will learn children andthus future MT-users how to behave, instead of learning traffic rules. Rules forbehaviour need to be internalised, i.e. their application should be a kind of reflex, withno need for conscious thinking about their relevance for the situation. In complex trafficsituations decisions often have to be made in fractions of seconds. Besides, training ofriders/drivers is already obligatory; but, unfortunately, issues concerning NMT-users andtheir rights are seldom dealt with.
Mohan comes in his proposal for effective communication with some astonishing resultsof educational campaigns that are challenging Wittink’s implicit assumptions:1) knowledge will not always improve people’s behaviour; actually, it sometimes
motivates them to do the opposite.2) skilled riderships will not always enhance safety in traffic; actually, the so called
driving experts endure more injuries than average.3) information is not always available and easy to understand; in information
campaigns the message is sometimes poorly presented (or even wrong) andtherefor easy to misinterpret.
The ways to prevent or minimise the risk of such results are similar to the onessuggested by Saad34. Again, community participation will increase the chance ofsuccess. In the following box main requirements are mentioned for designing andimplementing road safety campaigns.
4 In case of traffic accidents in the Netherlands between a motorised and non-motorised road user, the formerwill be held liable, unless he can prove innocence.

Non-motorised transport in developing countries final report
79
Various experts have stated that there is no better training of MT-users than let themexperience the dangers and needs of cyclists and pedestrians themselves, by beingone of them. Research has shown that when MT-users were or still are NMT-practitioners themselves, awareness and attitude are better. Furthermore, educationseems to be more effective when a individual approach is used, more directed to thespecific characteristics of the target group.
The expectations about the effectiveness of influencing traffic behaviour throughcampaigns shouldn’t be too high. Various studies have shown that the direct effect isvery limited. On the other hand, campaigns are a suitable instrument to get issues onthe agenda and to create support for interventions that might results in the desiredbehaviour.
Therefore, information and education campaigns should never replace other measures,but be complementary to them.
A starting point for improving safety can be an analysis of the existing safety situation, aso-called safety diagnosis35. Lassarre and Muhlrad provide a framework for bettertargeting safety actions and designing optimal solutions. Their methodology comprisesof:a) statistical accident analysis,b) in-depth accidents analysis andc) complementary investigations to understand better the accident factors, especially
the behavioural ones.
Part of these investigations can be directed to public opinions and attitude towardssafety and safety measures. This safety diagnosis can be adapted to each different
Main Requirements for Effective Public Information Campaigns
The aim of road safety campaigns is to communicate information to roadusers, not only to enhance their knowledge about safety issues, but also toinfluence their behaviour on the road and to prepare them for new legislationor safety measures.
1. The choice of the topics for a public information campaign must be knowledge-based, i.e. based on accident rates and causes (especially those related to drivingbehaviour), and on general road user behaviour.
2. To ensure effectiveness one has to consider the actual situation, determine thedesired situation and than how changes can be achieved. This way the purpose ofthe campaign can be decided, as well as target group and target behaviour, andestablish assessment criteria.
3. Communication with road-users must be a two-way process. It is very importanthow road users interpret and receive a message, how their attitude and perceptionis of safety problems and actually what their understanding and knowledge is ofregulations, rules and other road users. Further, it can provide insight in thepsychology of the accident risk (fate / destiny or just wrong-doing by him/herselfor other road users).
4. The selection of the means of communication will depend on the characteristic ofthe target group. Research in Niger has shown that for instance private andprofessional car drivers do have a very different background, socio-economicstatus, education level. Since the target groups are diverse, one needs to developseveral communication strategies.
5. Evaluation of former campaigns is a must. It provides the communication expertinformation about the likely problems to encounter and the fields ofimprovement.
6. A safety traffic campaign must be part of a wider prevention policy and thereforerelated to other measures.
Abstracted from: Communication with the Road User – Farida Saad (1998)
Non-motorised transport in developing countries final report
80
level of intervention (i.e. urban areas – city – route – particular category of road network– neighbourhood – blackspot). The way of accident registration turns out to be notuniform (standardised), reliable and complete which makes it not only difficult tomeasure actual progress within the city or country, but also to compare betweencountries. The impact of measures will be therefore difficult to assess. A clearer,standardised form (which allows adjustments however) and in which use police officersare properly trained, is recommended. A further co-operation between the police,researchers and decision-makers should be promoted.36
6.1.3 Bicycle theft and lack of parking facilities
In the local background studies37, theft has been identified as an important deterrentfactor. These comparative studies show that in all cities under review, theft is asignificant and increasing problem. A household survey in 1995 reveals that inGanghzou 3 bicycles were stolen on average per household in a time-frame of threeyears. A total of 3.4 million bicycles were missing in that same period. This finding issupported by new data indicating that 1,703 bicycles were stolen from 470 householdsduring the last 5 years, an average of nearly 4 bicycles per household. The other citiesare experiencing the problem of theft to a lesser extent: in Accra, Leon and Delhirespectively 17%, 20% and 28% of the interviewees had their bicycles stolen for at leastone time. The effects on bicycle use are significant, since a considerable number ofcyclists (up to 30% in Guangzhou) said they would stop cycling after getting their bikestolen. Low percentage of bike recovery (not more than 10%) and unwillingness ofpolice to register theft probably support the idea of not buying another bicycle. Thesefindings are very much in line with similar findings in Amsterdam, the Netherlands:bicycle theft is for many people a reason for not owning a bicycle or for using it less thandesired. A significant number of people replaces the stolen bike with a poor qualitybicycle.
Thieves are generally not scared off by the vision of locks. Nearly all bicycles in thestudy that were stolen were locked and sometimes even parked in a guarded parkingfacility. However, parking facilities have turned out to be a rather good means againsttheft. Unfortunately, most cities do not have proper parking facilities: neither location,nor price is usually convenient for the bike users.Bicycle registration (at least, without effective control) turned out to be not a successfultool against bicycle theft as shows the case of Guangzhou. In Jiangmen City, where anew bicycle number plate practice is in place, results are different. First reports aboutthe movable plate have been positive: police recorded a substantial decrease in thefts.The reasoning behind a bicycle registration system is that it would enable the police toidentify stolen bicycles or to confirm rightful ownership. The condition for this however istwofold: the system should be set up in a way that regular checks are easy to do; andsecondly, the police should put effort and time in actually executing these checks. Inpractice these conditions are not easy to fulfill.
From all studies and the experience from the Netherlands we might conclude thatparking the bicycle in guarded parking facilities prevents theft best. At one of the veryfew places in Lima where you can park your bike, i.e. the Catholic University, studentshave to show their ID before entering the university compound. So far, no single bikehas been reported stolen. Rather few bicycles were stolen out of guarded parkingfacilities in Guangzhou. The best and most economic location for a parking facility is atmajor destinations (stations, markets, offices etc). The establishment of guardedparking facilities might turn feasible, especially when such a facility will have a multi-functional purpose, for instance bicycle repair shop or kiosk.A second best and very practical solution is to have solid bicycle parking facilitiesoffering the opportunity to lock the bicycle to the facility. Such a provision is particularlyrelevant for destinations which do not attract enough numbers of cyclists, or where visitsare too short to justify guarded bicycle parking. Besides, these bicycle parking facilitiesprovide a reasonable solution for those cyclists who are reluctant to pay for guarding orfind proceedings too time consuming.

Non-motorised transport in developing countries final report
81
Table 19 Bicycle theft and location in cities under survey (in percentages)
Location of theftAccra Delhi Guangzho
uLeon Lima
Residential area 24 n.a. 62 26 n.a.
Office 8 n.a. 5.1 11 n.a.
Market place 16 n.a. 33 16 n.a.
School - n.a. - 7 n.a.
Other place 52 n.a. - 40 n.a.
Total 100 n.a. 100 100 n.a.
Theft cases1 17% 38% 99%2 20% 26%
1Percentage of respondents having their bicycle stolen at least once.2Assumption: 1703 bicycles were stolen from 470 responding households during 1991-1996, which meansthat on average 99 bicycles were stolen from every 100 people (including non-bicyclists).
6.1.4 Requirement: prevent bicycle theft and offer parking facilities
Theft is an important deterrent to bicycle use. The prevention of bicycle theft isconsidered to be an effective tool to stop people switching to motorised transport or topromote wider use of it. Facilities such as guarded parking lots need to be positioned atmore suitable places (major destinations) against more reasonable prices. Localgovernments should incorporate these facilities in their land use plans. They mightfinancially support employers and shops by subsidy, reduced VAT on construction etc.when providing guarded parking facilities.
The financial feasibility of these parking facilities can be improved when other serviceslike bicycle repair, bike rent, or even kiosks/small shops can be offered or established.
The quality and availability of locks should be improved. However, one should bear inmind that so far no bicycle locks exist that are fully theft-proof.
A more active approach by the police and authorities against theft and receiving wouldhelp to scare off potential thieves and buyers. The Chinese case has shown that it has arelatively great impact. In many countries victims were frustrated by not getting theirstolen bicycle even reported.
6.1.5 Lack of proper infrastructure
Often, bicyclists and pedestrians can not use suitable and safe paths or roads to move.In Asian countries, where NMT has been dominant, the emergence of the private carand motorbike has deteriorated the position of NMT significantly. Even in such a speedthat in some cities it hardly exists anymore (Bangkok) or is diminishing quickly (Ho ChiMinh-city). In the case of HCM-city, the roads (formally constructed to accommodateNMT) are used by various means of transport now. Bad driving behaviour of MT-users,lack of traffic regulations and enforcement, and total lack of NMT facilities make itextremely dangerous in a city, where 15 years ago hardly a motorbike or car was seen.
Guitink illustrated38 the issue of urban density and use of NMT (especially bicycles) with3 different examples:- American cities: low density and therefor long trip distances;- South-east Asian cities: high density; any increase in car use will inevitably have a
negative impact on bicycle use (NMT will be pushed off the roads);

Non-motorised transport in developing countries final report
82
- European cities: ‘optimal’ density; there is enough space for bicycles, pedestriansand motorised vehicles to exists simultaneously.
In some Asian cities one can see that just a relatively small group of road users (MT) isdominating or monopolising the road or urban space in general.
During the TRB in 1998 a comparison was presented about accommodating car trafficin European and American cities versus Asian cities. It was argued that for more than80 years European and American cities have tried to adjust these to the use of cars withjust limited success. It is beyond imagination that Asian cities could accommodate thesame level of MT within 10 years, nor the money, nor the space is available to do this39.It once more illustrates the unlikely success of the transport policy of these cities.
As shown above, in case no facilities are offered, cyclists and pedestrians arevulnerable road users. In African countries, where walking still remains the mostimportant means of transport (due to captive usership), lack of proper infrastructurelimits further growth of NMT or even possibilities to sustain actual levels; in thesecountries, a switch from walking to cycling induced by an improvement in income won’toccur if roads are in an appalling and bicycle unfriendly-shape. Income loss due to thetime-inefficiency of walking will be the inevitable result.
6.1.6 Requirement: provide infrastructure and facilities
The provision of adequate infrastructure to NMT users, pedestrians as well as cyclists,has an immediate impact on the use of bicycles. Its impact however can not bemeasured by just counting the number of people using the new facility, since they mighthave changed their routes. Surveys have unambiguously pointed out that whenimproved walking and cycling facilities meet the requirements of safety, directness,coherence, comfort and attractiveness more people will walk or cycle (or the decreasewill be stopped). Chapters 3 and 5 have explored extensively about the effects of thesekinds of interventions. The reader is referred.
6.1.7 Taxes, fees and procedures
Some governments discriminate fiscally against NMT. For example, in Africa thediminishing stock of bicycles (and so high prices) has partly resulted from high taxationon bicycle imports. Bicycles were treated as luxury items. Markups on boarder priceshave ranged between 200 and 500 percent in Tanzania, Ethiopia and Ghana.40 Hightaxes has been mentioned by 10% of the non-cyclists in the Leon case study as a majordeterrent (whereas these interviewees mentioned “roads in disrepair” in just 2% of theiranswers). Since bicycles (especially in the case of Africa and Asia) are generally usedby the poor, it is very illogical to tax them as luxury items; even more surprising is thatthese same governments refer to cycling as a backward, old-fashioned way of moving,not belonging to a modern city.
In a number of countries, a.o. Nicaragua, China and Tanzania bicycles have to beregistered. In the case of China this has been explicitly implemented to reduce theft.However, in other cases the registration requirement is part of a strategy either to limitthe growth of people using a bike, or to generate additional income for the localbureaucracy. It is found that in some cases the bureaucracy is keener on pursuing thecollection of registration fees and road taxes from cyclists than from car-owners.
6.1.8 Requirement: remove procedures and registration obligations
In most cases, the procedures and registration obligations of bicycles perform thefunction of income generation for officials or as a demotivator for bicycle use. Theabolishment of such procedures might be part of a process of good governance andadministrative reform. However, China appears to be an exceptional case. The frequent

Non-motorised transport in developing countries final report
83
theft of bicycles is said to be halted after implementation of a new number (registration)plate of metal that is attached to the bike.41 It is highly doubtful whether such a strict anddemanding approach can be implemented in other countries as well.
6.1.9 Unaffordable prices and fees for urban poor
Due to the high taxes on imports, prices at the local market are equally high. However,since China and India are huge producers of affordable bicycles, the development of alocal bicycle industry in other countries remains difficult. Various efforts have beenmade, but these turned out to be not viable and competitive once trade liberalisationwas introduced. Even in the case that prices are reduced, bicycles might still be out ofreach for the majority of the poor. Though poor households might save a considerablepart of their income (no need for renting bicycle, buying a bus ticket, and saving time),the purchase of a bicycle is still a “big” investment. The World Bank (1994) calculatesthat a bicycle costs 7 months average income in Uganda, ten months in Malawi andTanzania and over three years income in Ethiopia42.
Looking from another angle, we might state that there is a significant bias towards MT-use and to richer sections of society. The external costs of car use (air pollution,congestion, and administrative costs of accidents) are merely transferred on society asa whole. Not incorporating these external costs in car use charges should be seen asan implicit subsidy. Furthermore, prices of petrol are in many countries far below theinternational price (and are thus a subsidy): for example, in Vietnam a litre of petrol isjust 4,000 VND, equal to 0.30 USD (mid-2000).
A subsidised public transport system to increase the mobility of the poor, is not helpingthem very much either. Again, since such a programme is in most cases anindiscriminate policy, it helps the middle and higher income classes more than the poor,who still can not afford the price of a ticket. Making cycling more affordable, even whenthis would be detrimental to tax-income of the government, might save money forsociety. It may take away the need for additional investments in road infrastructure forMT and public transport.
6.1.10 Requirement: make bicycles affordable for the poor
The use of bicycles, as previous sections have shown, is dependent on various factors.Though between bicycle ownership and use there is not a clear-cut positive link(countries with a high number of bicycles per capita don’t cycle often that much) theauthor of this report is convinced that lack of money for the purchase of a cycle is alimiting factor. As the Dutch case has shown, an increase in income per capita hasmade the bicycle a popular means of transport, accessible for the majority of thepeople. In the African case studies a similar picture reveals. To overcome this problemseveral options can be identified:
• A credit programme directed to the poorer sections of the urban population. TheWorld Bank has provided funds for such a scheme in for instance Lima (Peru).Unfortunately, when the credits had to be released, no credit mechanism for clientswithout assets was is place at the Municipal Bank of Lima.
• An incentive programme for employers to establish credit and savings schemes.The African pilots market conditions and attitudes turned out to be unfavourable tocredits pre-financed by employers. In Eldoret (Kenya) good results were achievedwith a saving programme for the purchase of bicycles for its members.
• Bicycle sale-on-credit-programmes have got a lukewarm reception in the pilotprojects in Africa since it proves to be too risky for a shopkeeper to loan to poorclients this way.
• In Morogoro (Tanzania) the project experimented with bicycle lease contracts. Itwas said that the idea received a positive welcome by bicycle hirers. However, the

Non-motorised transport in developing countries final report
84
renter’s financial situation was too weak at that time to allow them to pre-financeenough bicycles.
• The scheme for promotional bicycle sales to women and children enteringsecondary school was quite popular. It shows that women are an importantpotential target group (less than 5% of the cyclists is female in Morogoro). It showsthat price-elasticy turns out to be high: a reduction of the price will lead to significantmore bicycles sold.
• A local Government in Belgium has announced very recently (August, 2000) to paya monthly 20 USD premium to their employees if they make use of a non-motorised means of transport to come to work.
6.2 Stakeholder participation
6.2.1 Stakeholder participation: key to success
User/stakeholder participation has been mentioned as the key to success in alldiscussions and reports consulted. A lack of participation by users and otherstakeholders will definitely lead to a weak and unsustainable result of interventionsundertaken. Planned and implemented activities will not be understood and may evenharm the interests of bicyclists. In cases of lack of participation during the design andplanning, bicycle lanes and paths quite often lead from nowhere to nowhere, are hardlyused by cyclists or are used by others (motorbikes and cars, pedestrians, people whodry or stall their products).
The major and most-sustainable motivation of people to join efforts in improving urbanmobility is self-interest. Saving travel time, increasing safety, reducing costs andimproving accessibility are often heard reasons to support actions. If interventions willcertainly harm their interest, little co-operation might be expected. To overcome theresistance one might try to convince the partner with sound arguments, or compromiseso that the major disadvantages are shared or removed. One can also decide tocompensate the disadvantaged partner. Looking for “win-win” situations, where nobodylooses, is often the key to success.
In general, the advantages of participation (besides avoiding the problems mentionedabove) are the following:• It smoothens the execution of interventions since fewer objections/court cases from
citizens will occur and wider acceptance is secured. All layers of society should berepresented in order to prevent biases that will harm the poor and less-powerful.
• It improves the quality of the decisions since local know-how and experiences ofusers and professional expertise are combined. Users are often in the best positionto identify urgent priorities.
• Potential future problems might be identified earlier and solved quicker since thereis wider support.
• Sharing of responsibility and costs solves the financial and organisational burden ofthe government – stakeholders become more pro-active actors. But one shouldbear in mind that private investments can only be obtained when there is a realisticexpectation of tangible benefits.
Tembele43 describes the requirements for user participation. They sound simple but areunfortunately seldom met:• Mutual trust between community and government• Early implementation of at least some of the prioritised interventions• Localising user participation, i.e. concentration on relevant, close-to-home problems• Open user platform membership, so to include the groups that are often neglected• Transparency by making all information, priorities, strategies and actions openly
available to and known to all stakeholders.
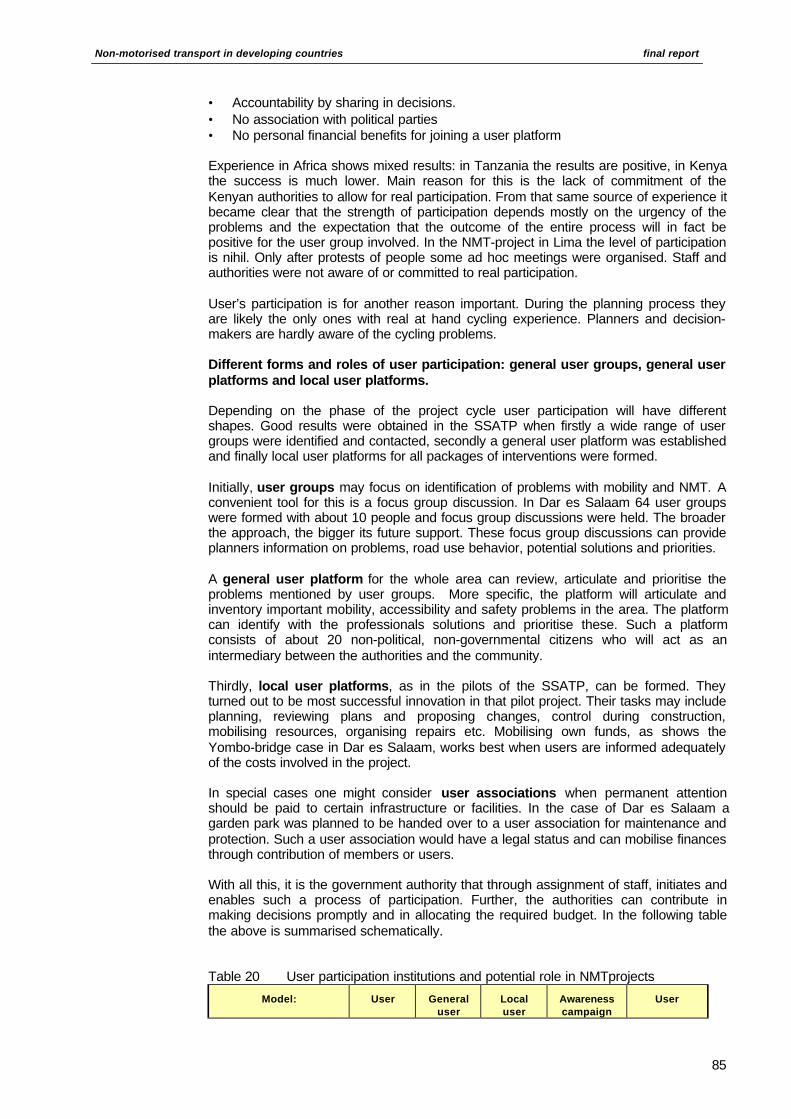
Non-motorised transport in developing countries final report
85
• Accountability by sharing in decisions.• No association with political parties• No personal financial benefits for joining a user platform
Experience in Africa shows mixed results: in Tanzania the results are positive, in Kenyathe success is much lower. Main reason for this is the lack of commitment of theKenyan authorities to allow for real participation. From that same source of experience itbecame clear that the strength of participation depends mostly on the urgency of theproblems and the expectation that the outcome of the entire process will in fact bepositive for the user group involved. In the NMT-project in Lima the level of participationis nihil. Only after protests of people some ad hoc meetings were organised. Staff andauthorities were not aware of or committed to real participation.
User’s participation is for another reason important. During the planning process theyare likely the only ones with real at hand cycling experience. Planners and decision-makers are hardly aware of the cycling problems.
Different forms and roles of user participation: general user groups, general userplatforms and local user platforms.
Depending on the phase of the project cycle user participation will have differentshapes. Good results were obtained in the SSATP when firstly a wide range of usergroups were identified and contacted, secondly a general user platform was establishedand finally local user platforms for all packages of interventions were formed.
Initially, user groups may focus on identification of problems with mobility and NMT. Aconvenient tool for this is a focus group discussion. In Dar es Salaam 64 user groupswere formed with about 10 people and focus group discussions were held. The broaderthe approach, the bigger its future support. These focus group discussions can provideplanners information on problems, road use behavior, potential solutions and priorities.
A general user platform for the whole area can review, articulate and prioritise theproblems mentioned by user groups. More specific, the platform will articulate andinventory important mobility, accessibility and safety problems in the area. The platformcan identify with the professionals solutions and prioritise these. Such a platformconsists of about 20 non-political, non-governmental citizens who will act as anintermediary between the authorities and the community.
Thirdly, local user platforms, as in the pilots of the SSATP, can be formed. Theyturned out to be most successful innovation in that pilot project. Their tasks may includeplanning, reviewing plans and proposing changes, control during construction,mobilising resources, organising repairs etc. Mobilising own funds, as shows theYombo-bridge case in Dar es Salaam, works best when users are informed adequatelyof the costs involved in the project.
In special cases one might consider user associations when permanent attentionshould be paid to certain infrastructure or facilities. In the case of Dar es Salaam agarden park was planned to be handed over to a user association for maintenance andprotection. Such a user association would have a legal status and can mobilise financesthrough contribution of members or users.
With all this, it is the government authority that through assignment of staff, initiates andenables such a process of participation. Further, the authorities can contribute inmaking decisions promptly and in allocating the required budget. In the following tablethe above is summarised schematically.
Table 20 User participation institutions and potential role in NMTprojects
Model: User Generaluser
Localuser
Awarenesscampaign
User
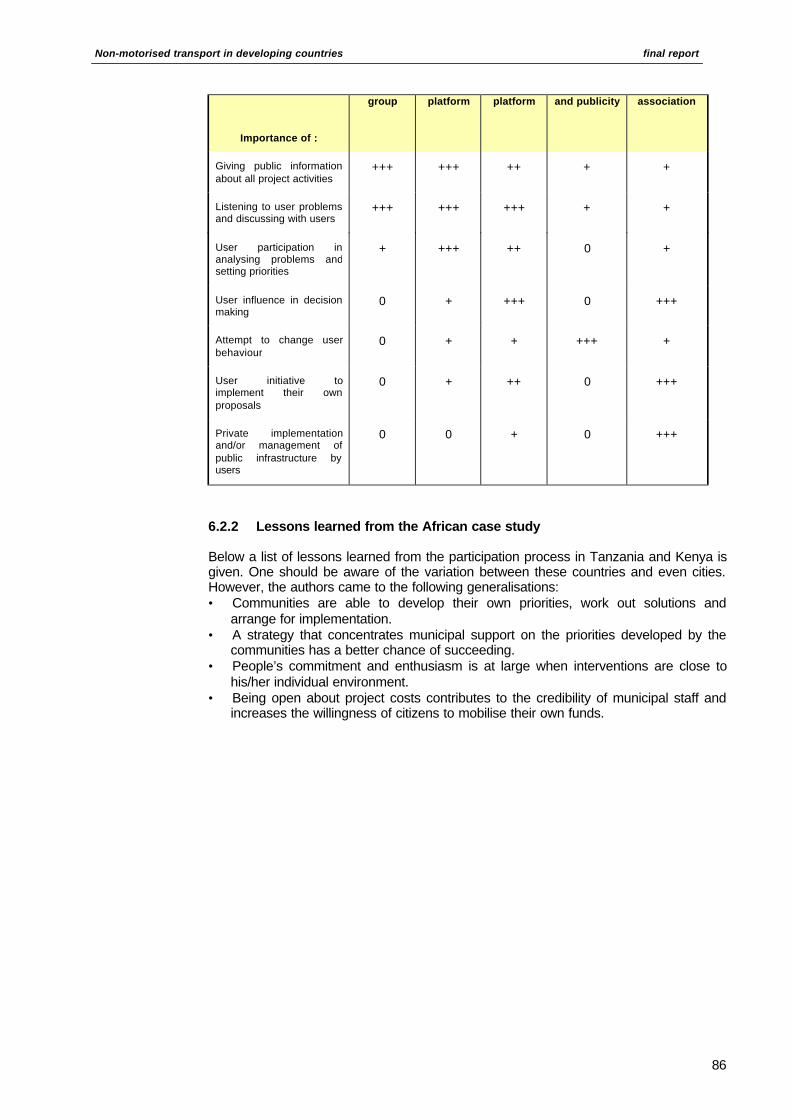
Non-motorised transport in developing countries final report
86
Importance of :
group platform platform and publicity association
Giving public informationabout all project activities
+++ +++ ++ + +
Listening to user problemsand discussing with users
+++ +++ +++ + +
User participation inanalysing problems andsetting priorities
+ +++ ++ 0 +
User influence in decisionmaking
0 + +++ 0 +++
Attempt to change userbehaviour
0 + + +++ +
User initiative toimplement their ownproposals
0 + ++ 0 +++
Private implementationand/or management ofpublic infrastructure byusers
0 0 + 0 +++
6.2.2 Lessons learned from the African case study
Below a list of lessons learned from the participation process in Tanzania and Kenya isgiven. One should be aware of the variation between these countries and even cities.However, the authors came to the following generalisations:• Communities are able to develop their own priorities, work out solutions and
arrange for implementation.• A strategy that concentrates municipal support on the priorities developed by the
communities has a better chance of succeeding.• People’s commitment and enthusiasm is at large when interventions are close to
his/her individual environment.• Being open about project costs contributes to the credibility of municipal staff and
increases the willingness of citizens to mobilise their own funds.

Non-motorised transport in developing countries final report
87
6.3 Organisational requirements for local NMT interventions
In their report “Guidelines for Pedestrian and Bicycle Traffic in African Cities” theauthors come up with a set of organisational conditions for increasing the chance ofsuccess in a municipal NMT project. Hereunder the somewhat revised major conditions:
One should consider the following:
Team composition:1. The municipal team should be multi-disciplinary and inter-departmental composed
of a social scientist, planner and an engineer.2. Selection of the gender balanced team should be based on proven past
commitment and quality. A national advisory group of independent experts shouldbe established.
Mandate and tasks:3. The team should have the authority to take initiatives, plan and implement
interventions.4. The municipal government should fully support and commit herself to the cause of
NMT.5. Disciplined internal team work-planning and progress control
Choice of activities:6. The team should support intensive user participation in planning and design
process.7. Team’s focus should be on widely supported interventions with a high benefit/cost
ratio (value for money).8. Implementation at an early stage of the first activity should be sought for. Planning
without implementation creates negative effects among the public as well as withinthe municipal organisation.
Monitoring:9. Intervention effects should be carefully monitored.10. Independent technical and financial audit of interventions should be in place, with
user representatives on the audit committee. Openness and transparency inplanning and reporting are required.
Budgeting11. A realistic project implementation budget should be drawn up. It is better to start
small at a manageable scale.12. Budget for next interventions should only be made available after successful
completion of previous tasks and strict financial and technical control.13. In case of international financial support:
a) International loans for urban renewal activity with a large number of smallcomponents, trigger a complicated process involving many parties that areremote from the issue at hand and involve excessive indirect costs. Thereforit is recommended that, grants should be released step by step, to controlthe excessive indirect costs.
b) Partial financial support for intervention costs so that counterpart has toshow commitment. The requirement of allocating local funds for interventionmeasures makes future allocation more likely and can ensure that the rightpriorities are made (and not just the ones of the donor).
c) No or just limited control by foreign agency in the planning andimplementation process to improve sense of ownership and responsibility.
d) Allowances should not become a project target.

Non-motorised transport in developing countries final report
88
CHAPTER 7 OBJECTIVES AND STRATEGIESFOR INCREASED ROLE OF NON-MOTORISED TRANSPORT INURBAN ECONOMIES
7.1 Introduction
In this chapter we will elaborate on the three overall objectives or principles that shouldbe the start of any strategy or plan of interventions: improved quality of life, economicgrowth and poverty reduction. The authors believe that NMT can contribute significantlyto the aforementioned objectives. Hereunder, we will explain why. To achieve theseobjectives, we have worked out a set of strategic issues that should be covered in anycomprehensive programme to support NMT.In previous chapters we have explored the opportunities for a more effective policy withregard to NMT, basing on literature study and interviews. We do realise that therecommendations are based on a relatively limited number of cases. Furtherexperimenting and research on the influence of (differences in) local circumstances onthe effectiveness is of NMT policies is recommended strongly.
7.2 Three objectives: Improved Quality of Life, Economic Growthand Poverty Reduction
7.2.1 Quality of Life and Economic Growth
The Bank has committed itself to improving quality of life of people. At variousoccasions the Bank has shown its commitment to NMT too, since it believes that NMTcan contribute to more liveable and productive cities. If quality of life is the denominatorof aspects of household income, clean environment, health, attractive cities to live inand easy physical access to essential services NMT can play a significant role. In thefollowing sections NMT’s contribution to the economy and quality of life (includinghealth, safety, accessibility, employment and environment) are dealt with. In section7.2.2 we focus on NMT’s value for poverty reduction.
Cities are the engines of economic growth in developing countries. The urgent mobilityproblems in most of the big cities in these countries are hampering further growth to animportant extent. The costs of urban congestion for cities like Bangkok, Manila orBogota and many others are impressive. In their study “The Economic Significance ofCycling” Buis and Wittink 44have elaborated on the theme of economics. Investments inNMT are sound and economically attractive. Below, some insight is given in theirargumentation. The authors identified 8 aspects that contribute or are related toeconomic growth and quality of life.
Accessibility and use of space are two fundamental economic aspects to whichbicycles can contribute in a positive way. It is quite ironic that with the increase of fastertransport means, the average speed in cities is diminishing. Surveys in the Netherlandsreveal that trips in cities shorter than three kilometre are best made by bicycle from theperspective of time. In cities where motorised traffic is slow (Bangkok = 8 kph) an
Non-motorised transport in developing countries final report
89
important time-saving effort can be made by travelling on a bike. Major contributor tocongestion is the car, which occupies expensive and scarce urban space. The parking-ratio for cars and bicycles is 1:10; the maximum road capacity-ratio is striking as well,i.e. 1:4 (some experts argue that this is a rather conservative estimation; according tothem 1:20 is more likely). All in all, Bangkok is missing out one-third of its economicgrowth due to congestion (1.8 Billion US$ per year). Investments in transport modesrequiring less space (public transport, bicycles, walking) seems therefor justified since itwill reduce the problem of congestion and improve the economic productivity of cities.
The reduced accessibility of the inner-city has had indirectly major consequences for itsattractiveness and quality of life for companies and people. Due to that, major socialand economic problems have arisen: a vicious circle of unattractiveness occurred:crime, unemployment, deteriorating infrastructure, closing shops and leavinginhabitants. Improved public transport, pedestrian zones, improved cycle facilities hashelped to halt such a process. The Brazilian city of Curitiba with good public transportand bicycle facilities in a healthy environment is attracting now big internationalcompanies. It shows that a sustainable and attractive transport system pays off itsinvestments.
Safer traffic is another economic aspect of bicycling. While the number of fatalities intraffic in developed countries is declining, the number is exploding in most of thedeveloping countries. Among the deaths, cyclists and pedestrians take a major share.Therefor less and less people chose to cycle and switch to other modes, which in itselfmakes it even more dangerous for people who continue to cycle. Results show thatafter implementation of bicycle plans in Amsterdam and Graz (Austria) for instance,fatality rates dropped due to bigger awareness of other road users, segregated cyclepaths and speed limits for motorised traffic. Further, safety levels are highest incountries in which people cycle most. On average 2% of GDP is spent around the worldon the consequences of road accidents. The costs of road casualties in the Netherlandsamount up to more than US$ 5 billion per annum. The European Union considers afatality an economic loss of around US$ 1 million per year.
Cycling has an important contribution to city’s employment. A high level of bicycle usegenerates a demand for bicycles and parts, and services such as repair, rent, and paidparking. The Dutch bicycle industry has a turnover of US$ 1 billion annually. The bicycleproduction industry in developing countries is underdeveloped. China and India areimportant bicycle producers and compete internationally with local producers. Sincelocal markets are still small most countries will rely on imports. A drop in price (importlevies or VAT) will stimulate the purchase of bicycles; the price-elasticity for bicyclesnamely has turned out to be high. Afribike – a South African Bicycle PromotionOrganisation – has so far positive experiences with a franchising package, in whichproducers/assemblers, sellers and credit experts co-operate.Besides, other industries will also benefit from NMT development. Small entrepreneurscan widen their action-radius and market for their products through increased mobility;as a consequence, their economic activities can develop.
Considerable public savings could be made when investments in bicycle infrastructuremake investments in car infrastructure unnecessary. So far, investments for bicycleinfrastructure are nullified by those for public transport and cars. For reasons ofefficiency, as shows the case of the Dutch city of Dordrecht, one has to considerinvestments in cycling infrastructure: to deal with increased demand for mobility twoscenarios were developed. The first scenario focused on widening the existing publicroads to increase the car capacity. The second scenario focused on constructing newcycle paths and four cycle tunnels. Nonetheless, the costs of the second scenarioamounted to just 75% of the cost of scenario 1. When one would also consider thecosts for building parking lots in the inner-city, the second scenario would even beenmore beneficial. In Bern (Switzerland) three scenarios were worked out; a trendscenario in which car traffic is not restricted, a pubic transport scenario and a bicyclescenario in which major emphasis lies on bicycle investments. It shows that the trendscenario turns out to be the least expensive, whereas the public transport scenario the

Non-motorised transport in developing countries final report
90
most expensive one. However, when external costs are taken into account (casualties,environmental pollution) the bicycle scenario - with increased costs for public transportand cycling - turns out the least expensive solution to cope with increasing mobility.
The transport sector is a major source of environmental pollution. In most urbanareas, motor vehicles are the most important source of air and noise pollution. It is amain source of carbon monoxide (CO), nitrogen oxides (NOx), sulphur dioxide (SO2),volatile organic compounds (VOCs), particulate matter (PM) and a major emitter ofcarbon dioxide (CO2) and other greenhouse gases. Besides the short-range movementof air pollutants, that are most harmful for the health of the urban population, a long-range movement of these pollutants has also significant effects. The long-rangemovement of air pollutants from the transport sector, such as emissions of sulphur andnitrogen oxides, has resulted in acid deposition. Transboundary air pollution causeswidespread acidification of terrestrial and aquatic ecosystems, which has impacts onhuman health, crop productivity, forest growth, biodiversity and man-made materials.Economic costs of this short-, and long movement of pollutants pollution are difficult toestimate; calculations my widely vary since methodology may differ. Research carriedout in 1996 shows that the health costs in France, Austria and Switzerland due to PM10emission by traffic amount up to US$ 27 billion per year.To meet the environmental standards that are internationally agreed (post-Kyoto), itturns out that technological solutions alone won’t be enough. The authors of thetransport air pollution study for Europe45 make a plea that a reduction can only beachieved when mobility demand is equally decreased. Demand management, changesin travel behaviour, increased use of less polluting modes of transport are crucial. Thisimplies that NMT is a good option since a significant part of trips made in the cities areshort and could easily be replaced by NMT.
The aspect of health improvement, resulting from physical exercise, is actually mostvalid in high income countries, where a certain level of facilities exists. Cycling can be ahealthy, relaxing exercise that reduces the chances of getting ill or stressed. Reducedabsenteeism and healthier, more relaxed employees increase the productivity of acompany. Calculations show that this could save Dutch industries around 1.6 billionguilders a year on absenteeism and health insurance.
7.2.2 Poverty Reduction
It has been stated at various places elsewhere in this report that households indeveloping countries, the poorer ones in particular, rely heavily on NMT-modes. Theydo not have the minimum of mobility that is required to participate fully in social andeconomic terms in urban life. Especially walking is the key mode for those who can notafford a bus fare or the rent or purchase of a bicycle. Improvements in walking facilitieswill therefore have an direct impact on the poor since time spent on walking might bereduced due to de-tour prevention. Actually, for the poor time and money cost of accessto employment, health services, education and other amenities are relatively high. Thecosts for trips to work can be a significant drain on income and inaccessibility maysignificantly reduce the prospects of employment in cities in developing countries.Lowering these costs contributes directly to poverty reduction.46 It has been estimatedthat travel costs might reduce up to 25% in case walking speed is significantlyimproved; a 25 to 50% reduction of household travels costs can be expected when tripdistances are reduced47, because of smaller de-tours. A more important impact ofimproved walking facilities is the reduced number of fatalities among walkers, the majorcomponent of traffic deaths in many countries. A sudden death or permanent injury of amember of a household may result in a disastrous situation at individual householdlevel. A quantified assessment of the impact of NMT-measures on poverty reductioncould not be found in literature.
Increased bicycle use will definitely reduce the household travel costs, and enlarge theaverage radius of action considerably. According to De Langen and Tembele urbancycling might reduce travel costs for a household up to 50%. Other reports found

Non-motorised transport in developing countries final report
91
comparable figures. As shown in chapter 2 the lower costs of cycling is often stated asthe most important reason for cyclists to prefer the bicycle above the bus. Again, noreliable data could be found to calculate the impact of poverty.
Besides, increased bicycle use generates other spin-off effects at household level:employment in the bicycle service (repair, guarding) and production industry willincrease. Jobs in these sectors are potential options for low educated people and morelabour intensive compared to vehicle production. Further, as is also mentioned above,household’s access to (non-bicycle) labour market can be enlarged. The case of orangesellers in a village in Ghana, described in World Bank’s report on Poverty andTransport48, shows that women’s income could rise significantly when they could bringtheir produce to the market in Accra instead of selling it in their village. The bicyclewould have been the optimal solution for this; as compared to walking a bicycleenlarges the capacity for carrying freight considerably, and requires less physicalefforts.
In construction of roads it turns out that the construction of pedestrian accessinfrastructure is one with a very high internal market multiplier effect since it can uselow-skilled human resources and local building materials, much more than large-scaleroad infrastructure49.
7.3 Five strategies: Participation, Urban Planning, Education &Sensitisation, Incentives and Promotion, Capacity Building
7.3.1 Participation
In chapter 6 the relevance of user/stakeholder participation has been mentioned as thekey to success in all discussions and reports consulted. A lack of participation by usersand other stakeholders will definitely lead to a weak and unsustainable result ofinterventions undertaken. Planned andimplemented activities will not beunderstood and may even harm theinterests of bicyclists and pedestrians. Incases of lack of participation during thedesign and planning, foot paths andbicycle lanes and paths quite often leadfrom nowhere to nowhere, are hardly usedby cyclists or are used by others(motorbikes and cars, people who dry orstall their products).
The box on the right presents a part of theStatement of Delft (June 2000) in which itcalls for including pedestrians and cyclistsas stakeholders in any decision-makingprocess.
The major and most-sustainable motivation ofpeople to join efforts in improving urbanmobility freely is self-interest. Saving travel time, increasing safety, reducing costs andimproving accessibility are often heard reasons to support actions. If interventions willcertainly harm their interest, little co-operation might be expected. To overcome theresistance one might try to convince the partner with sound arguments, or compromiseso that the major disadvantages are shared or removed. One can also decide tocompensate the disadvantaged partner. Looking for “win-win” situations, where nobodylooses, is usually the key to success. Chapter 6 has gone into more detail about theadvantages and the conditions to have successful participation.
How can we promote participation?
Stakeholder participationAs is the case in other sectors,stakeholder participation is crucial inthe preparation and implementation ofsound and equitable policies, strategies,programmes, plans, and projects.National and local governments areurged to credibly involve, as a majorgroup of stakeholders, pedestrians andcyclists in any decision-making processwhich directly or indirectly relates totheir mobility and traffic safetyrequirements. In doing this, they shouldpay particular attention to the mobilityneeds of women, which are particularlyaffected by inappropriate urbantransport solutions.The Delft Low Cost MobilityStatement – June 2000.

Non-motorised transport in developing countries final report
92
Participation is not an easy concept to implement. The political establishment showsquite often some reluctance to share responsibilities in policy making andimplementation; planners and designers often assume they are the real experts andknow what is best. They often feel themselves offended in their professional pride ifparticipation is not organised in a proper way. To overcome the lack of support toparticipatory processes various approaches at various levels can be undertaken.
At the policy making level, participation belongs to a much wider administrative reformprocess. A mixture of sound donor pressure, intensive negotiations, showing goodexamples of successful decentralised and participatory planning and decision-makingand cases in which significant cost-reductions has been made will help to makeparticipation accepted as a way of modern and good governance.The establishment of pressure groups within the local environment is another, veryuseful strategy. The Dutch case has shown us that the Dutch Cyclists' Union has playedan important role in getting cycling on the political agenda.
At the planning and design level, participation meets similar resistance. There are anumber of ways to tackle this problem: firstly, training and awareness raising amongstaff can help them to overcome their bias; secondly, showing good cases of successfulparticipatory planning and design makes experts aware of the benefits of participation;thirdly, the formation of user groups, which on their turn may put pressure on theexperts to include their ideas has turned out to be successful in many places; fourthly,political commitment and pressure on experts will ensure that “in words” thebeneficiaries are heard and involved.Fifthly, it is important to create a clear understanding of roles and competencies of thevarious parties involved, and that each participant is recognised in his expertise.
Chapter 6 has given a framework dealing with the questions: who should participate, atwhat stage and in what. A distinction has been made between general user groups,general user platforms and local user platforms. These groups/platforms might becomeinvolved in giving public information about all NMT-activities, consultation with users toidentify and discuss user problems, organising participatory analyses and rankingpriority, mobilising users for influencing decisions, changing behaviour and promotinguser initiatives for implementing own proposals. They might be the one implementing,monitoring and or managing public infrastructure as well. Some authors do question thismixing of responsibilities and recommend a clear cut division, whereby the governmentis responsible for the broader weighing of interests. Nevertheless, it is useful to exploreup to what level users and representatives can be involved in above-mentionedfunctions.
Besides the participation of the target group, it is important to activate other actors orstakeholders in a process of promoting cycling by contributing to planned andimplemented measures. E.g. health care professionals can inform patients about thebenefits of cycling exercise; employers can reward employees who come to their workby bicycle or offer financial support when purchasing a bike; shop keepers may have adirect interest in bicycle parking facilities in shopping areas; public transport authoritiescan offer parking facilities at places where passengers switch from bicycle to bus ortrain and v.v. This will stimulate the combined use of the bicycle and public transport. Aprocess of sharing information, knowledge, interests and opportunities among thevarious stakeholders, (local government, user representatives and those like mentionedabove) will lead to a synergy of action and therefore be more effective. A platform canbe an useful forum for exchange and co-operation. In Appendix 6, an approach for aplatform will be presented.
7.3.2 Urban Planning
Traditional urban planning still relies heavily on Master Planning approaches as thepanacea for solving urban scale problems. Transport issues are treated as simple trafficengineering tasks. Public participation has also been relegated to a less prominent role,

Non-motorised transport in developing countries final report
93
especially in the public sector, where planning processes have been set up with verylittle connection to reality or involvement of final target group. In interviews and literaturethe relevance of urban planning for the promotion for NMT has been highly emphasised.Especially the neglect by urban planners of the effects on transport modes hasdeteriorated the position of NMT in many cities. The strict spatial division within the cityhas extended trip distances significantly. Further concentration and urban sprawl haseven worsened the situation.
How to overcome the problem of increasing trip distances?1. Raising awareness among urban planners about planning consequences for
transport and thus environment and economic/poverty.2. Introducing the concept of multi-centred-cities.3. Promoting the mixed composition of cities, so that residential and working places
are close to each other.
7.3.3 Information campaigns and other promotion activitiesIn chapter 6 attention has been paid to promoting safety in traffic by informationcampaigns and effective communication.Here we will go into some more detail andintroduce the concept of social marketing.
A strategy to inform citizens about policymeasures and to convince them to changebehaviour according to the measures, cannot easily become effective without takinginto consideration the determinants ofbehaviour, products and incentives thatmay facilitate the desired behaviour andthe social environment of the citizens.
Information will only be effective if themessage (product)presented is attractiveand will result in personal benefit. Forexample, a newly constructed bicycle lanemust offer people the opportunity to makeuse of it, i.e. it should match with the originand destination of their trips, be easyaccessible by bicycle and be competitive toalternatives. To make sure that increasedcycling matches with the needs of citizens, asocial marketing approach can be applied. No extensive research exercises arerequired, though some might be useful; the approach is more a way of comprehensivethinking and taking into account factors of influence in order to formulate the best way topromote cycling. In Annex 5, a step by step approach of social marketing will bepresented.
An effective messenger is one close to the final target group. This means that agovernment has to focus its training and awareness raising on intermediaries. Theadditional advantage is that through using intermediaries a much bigger population canbe reached (multi-plier effect).
7.3.4 Incentives and Promotion
The study has shown that there are a number of serious deterrents to the further growthof NMT. Safety and security (theft and harassment) are two factors often mentioned.Besides, the affordability of a bicycle and the procedure to get a license might scare offpeople. Moreover, the low status of walking and cycling is not promoting NMT. The poorfacilities for NMT users (lack of proper NMT-friendly roads and connections, parking
Awareness raisingA major stumbling block in realisingefficient and affordable mobility inAfrican cities is the lack of awarenessamongst politicians, administrators andprofessionals at national and locallevels of the benefits of low-costmobility options. In order to restore abalance in, and increase the efficiencyof the urban transport systems, nationalawareness raising strategies will needto be developed and implemented.These should aim at raising theirawareness of the economic and socialimportance of mobility, of the majorrole of walking and (the potential for)cycling, of the current inefficiencies ofthe urban transport systems as regardsthese modes, and of the ways andmeans to enhance low-cost mobility.The Delft Low Cost MobilityStatement – June 2000.

Non-motorised transport in developing countries final report
94
places, showers at work) partly explain why NMT has such a low status. In chapter 6 wehave elaborated on these deterrents and refrain therefore to go in much detail here.
The obvious and relatively easy measure to promote bicycles use is to lower the price ofbicycles, either by reducing the consumer tax (VAT) or import tax. The latter, as thisstudy has shown, can increase the number of bicycles bought significantly. Providingbetter facilities (and so improving its status) will help to overcome the deterrents. Betterinfrastructure, more parking opportunities, showers and dressing rooms at work will allhave a positive impact on NMT use. Financial compensation and credit or bonuses forpeople using their bicycle to come to their work will increase NMT-use as well.
7.3.5 Capacity Building
The institutional environment has been identified as a key determinant in the use ofbicycles (chapter 2). In a number of reports lack of capacity is mentioned as a crucialfactor, hindering further development of NMT in urban areas. Though very little literaturedeals with capacity building for NMT extensively, from the Dutch case and interviewswith experts, we might conclude that one should focus on the following issues:
7.3.5.1 Policy development
Policies to promote NMT as such make little sense. It is the process that resulted in acertain policy that is more important. The writing of a Masterplan Bicycle, like in theDutch case, is not something that went over one night. Before, authorities, planners andcitizens agreed more or less that bicycling is an important way of moving through thecity. The stakeholders differed in how toimprove the situation for cyclists and towhat extend other road users should bedismotivated. The drafting of the projectplan was a process in which the variousstakeholders were included. In this waythey became partners to a certain extent.
How can we promote NMT policydevelopment?There is no simple and single answer tothis question. It will depend on manyfactors: the political system that isprevailing, the actual position and function ofNMT, the state of development of thecountry, the existence of a developed civilsociety etc. Fact is that all intervieweesand most literature underscore theimportance of a NMT supportiveinstitutional and legislative environment.And, these are typically the result of agood NMT policy.
As in many other countries, the role of the State Government is limited at local level. Anice Masterplan, developed at national level remains meaningless unless at local levelNMT-friendly traffic management policy and plans are developed. The StateGovernment should develop a vision, with some long-term objectives formulated. Shecan provide a framework within which various actors may develop their own short-termNMT-friendly policy. The State Government can provide financial support to assist lowerlevels, to carry out research, to disseminate knowledge, expertise and arguments, todevelop local policy and plans and to experiment in pilot areas.
Therefore, instead of defining a detailed national policy, concentration should be oncapacity building at lower, intermediary levels, such as provinces and cities, interestgroups, regional or city directorates of transport, infrastructure and spatial planning.
Demonstration projectsThe consistent application of the 'menuof interventions' as an output of theSSATP pilot project at a large scale,and the monitoring and disseminationof the results thereof, will greatly helpin raising awareness of the importanceof efficient and safe walking andcycling, and in convincing politicians,administrators and professionals at thenational and local levels, as well as thepublic at large, that this efficiency andsafety can be greatly increased atrelatively limited costs. For this reason,national and local governments areurged to plan and implement, at city ordistrict level, a number of suchdemonstration projects in a number ofcountries, and to disseminate theresults within Sub-Sahara Africa.The Delft Low Cost MobilityStatement – June 2000.
Non-motorised transport in developing countries final report
95
Both the African and Dutch case study have shown us that experimenting and pilotingon a small scale is a good start to attract public and political attention and to test outvarious practical measures for NMT promotion. Criteria for success should beconsidered carefully, in order to avoid the negative impact of a failure. These pilots canbe used as inputs for further policy development, as do research and intensivemonitoring and evaluation. The Delft Statement on Low Cost Mobility calls for these kindof demonstration and research pilots (see box).
Proper communication with other agencies and departments about activities and theirresults, as well as dissemination of results of studies and research (in form of reports,workshops, newsletters etc) may turn out to be essential for creating the rightenvironment for developing an integrated and integral policy.
7.3.5.2 Funds
Financial means of governments in less-developed countries are limited. But even incase that funds would have been available, one might wonder whether these would beallocated to NMT-investments. As long as NMT is not an integrated part of transportplanning and recognised as essential to proper transport management, one shouldearmark funds for NMT. In chapter 3 we have identified various sources for NMTinvestments.
What should be done to expand the investments in NMT?1. Raise funds from international donors to invest in NMT-investments and
promotion;2. Reallocate national and local budgets more towards NMT;3. Assess various existing and potential financial mechanism to tax or subsidise NMT
and MT;4. Link taxes and fees (on import, ownership, licenses for bicycles) to NMT
investments;5. Introduce a proper comparative cost-benefit methodology for investments in NMT
and MT plans.
7.3.5.3 NMT expertise
The current NMT expertise in almost all countries of the world is limited. Transportdecision-makers, planners and designers are schooled nearly exclusively in planningand designing for motorised traffic. The relevance and benefits of NMT have never beena subject during their academic schooling; designing and planning for NMT has been, ifso, been dealt with in the periphery. The Delft Statement urges national governments toredress this situation (see box).

Non-motorised transport in developing countries final report
96
How can we build up local expertise?1. Inclusion of NMT as one of the major
topics in transport planning and design atuniversities. It needs review andadjustments of the existing universitycurriculum.
2. In-service training for transportplanners, designers and decisionmakers. This training might beprovided by existing local universities orat international centres of expertise(IHE Delft and I-ce are providingtraining courses for an internationalpublic regularly)
3. Participation of relevant staff innational and international conferences,networks and studies on NMT. Regularexchange and/or close co-operationwith partner-countries or –cities.
4. Study tours/exposure visits topromising NMT-countries or cities.
5. Provision of communication facilitiesand opportunities to access up-to-dateknow-how.
7.3.5.4 Mobilising and supporting local interest groups
Local interest and advocacy groups can play an important role in the promotion of NMT.Strengthening their position can influence the quality of transport policy, the plans anddesigns and implementation. In places where pilot projects have been successful, therole of these user and advocacy groups was recognised at forehand.
How can we support local groups?1) Funding of activities of existing and future groups (user as well as advocacy
groups).2) Establishment and training of groups in fund raising, awareness raising,
campaigning, project management, negotiating etc.3) Involving and assisting groups in steps of planning and design.4) Support the establishment of international, national and local coalitions between
user and/or advocacy groups.5) Technical support to groups, international, national as well as local.6) Provision of communication facilities.
7.3.5.5 Benchmarking andguidelines
Guidelines will help to strengthen thecapacity of planners, designers andpolicy-makers to make the rightdecisions. Therefore the use anddevelopment of NMT-friendly guidelinesshould be promoted. Since localsituations might be very different,guidelines should enable the user toapply and adjust them in a flexible way.The World Bank has paid considerableattention to the development ofguidelines in the SSTAP project. One ofthe important sources of this report is the output of that project: Guidelines for
Human resources capacity buildingIt is recognised that professionalleadership capacities (urban planningand management, transport planningand management) are well below whatis required, both in quality and innumbers, to prepare and implementsound and equitable low-cost mobilitypolicies for the fast growing Africantowns and cities. National governmentsare urged to redress this situation, byproviding relevant education andtraining opportunities, as well asattractive employment conditions, forprofessionals involved in urbanmobility at the national and locallevels. In addition, current relevantuniversity level curricula should beupgraded to reflect current thinkingabout (low-cost) urban mobility, inorder to better prepare graduates fortheir tasks.The Delft Low Cost MobilityStatement – June 2000.
Guidelines and quality standardsNational and local governments are urged toinclude these modes into mainstream urbantransport policies, strategies, programmes,plans and infrastructure investment projects.In addition, the requirements for efficient andsafe walking and cycling should be includedin national urban roads design standards. Thedraft document 'Productive and LiveableAfrican Cities: Guideline for Pedestrian andBicycle Traffic' includes relevant proposalsfor such standards.The Delft Low Cost Mobility Statement –June 2000.

Non-motorised transport in developing countries final report
97
Pedestrian and Bicycle Traffic in African Cities. The guidelines developed by a Dutchgroup of experts from various backgrounds and used by many Dutch designers andplanners are now used world-wide50. The concept of benchmarking is quite new: in theNetherlands the Dutch Cyclists' Union (Fietsersbond) has been assigned by theMinistry to implement a benchmarking programme in order to develop and ensure highquality infrastructure and facilities. On European scale a policy benchmarking project isunder implementation. In all participating countries the bicycle policy is under review,based on self-selected criteria. Such a self-evaluation is not only valuable forstrengthening or improving one’s own performance, but can also be a useful tool incommunicating with other cities or partner organisations.
7.4 Non-motorised transport system approach: integral andintegrated
The authors recommend an integral and integrated approach concerning urbantransport policy and planning. Transport in general, but non-motorised transport notdifferently, plays a number of functions, of which the major one is: playing a role infulfilling the demand for mobility, i.e. the demand for transporting people and goods.Besides, it has a function in the employment of people, in the production as well as inthe service industry; a role in improving the quality of life and in optimising the spatialdistribution patterns.
The integrated approach recommended aimed at the need for an effective and coherentplanning and implementation process based on a mutual understanding of legitimateinterests and rights on the side of the civil society, as well as on the side of the civil-political authority. Doing so, it becomes clear that a whole range of stakeholders willenter the stage. Chapter 2 and 3 elaborated this issue in quite some detail. As has beenshown, to pursue a successful integrated approach one should have the support of thepolitical, professional and popular (or user) stakeholders.
Moreover, NMT should be dealt with in an integral way. In order to achieve success onehas to consider several sectors. It may include the Banking sector (to provide loans forthe purchase of bicycles), the Police (to enforce traffic regulations), the bicycle industry(to develop and practical bicycles, fit to be used in the circumstances), Public transportoperators (to provide parking facilities at stations), Urban planners (to concentrateand/or mix functions of the city to limit travel distances), the media (to broadcast pro-bicycling reports) etc.
In both cases, the integrated and integralapproach, three features come to the fore51:• co-ordination, especially between
stakeholders, planners, sectors and theiractivities, plans and funding;
• co-operation, especially between thestakeholders (such as mentioned above);and lastly
• co-mbination. The latter refers to at thesame time designing and implementing.
Above all, these three co’s form the factors fora successful integration of the bicycle in theurban society.
Rijnsburger52 elaborated on this theme ofintegration and integral approach and identified4 clusters of interest or policy fields that dealwith NMT. These policy fields are transport,traffic, environment and economy. Table belowgives an impression of what policy elements one might expect at various differentstarting points.
Mainstreaming low-cost mobilityLow-cost mobility has a directrelationship with, amongst others,poverty alleviation, economic andsocial development, employmentgeneration, urban upgrading anddevelopment, and environmentalprotection. Rather than developingstand-alone low-cost mobility policies,national and local governments areurged to integrate low-cost mobility inpolicies, strategies, programmes, plansand projects that address these issues.As walking and cycling are animportant part of the wider urbantransport systems, they should betreated as such.The Delft Low Cost MobilityStatement – June 2000.

Non-motorised transport in developing countries final report
98
Table 21 The four policy fields and their promising policy elements during three phases of NMT.
Transport Traffic Economy Environment
Introductionphase
Inclusion of NMT as avaluable mode oftransport in theobjectives, strategiesand instruments of thepolicy.
Investment in sharedroad use and specificNMT infrastructure;inclusion of cycling indesign andmaintenance of roads.
Creating facilities forthe purchase andbenefits for the use ofcycles; Alleviation ofrestrictions in importsand taxation.
Inclusion of cycling insubsidies andcampaigns to promotealternatives formotorisation.
Improvementphase
Inclusion of NMT as anvaluable mode oftransport in theobjectives, strategiesand instruments of thepolicy.
Optimisation of theroad infrastructure forNMT use andexpansion of specificNMT infrastructure.
Balancing the effects ofimport regulations andtaxation in comparisonwith other transportmodes.
Profiling theenvironmentalimportance of cyclingagainst motorization.
Preservationphase
Inclusion of NMT as anendangered mode oftransport in theobjectives, strategiesand instruments of thepolicy.
Development ofinstruments to regulatemotorization.
Reduction of intensitiesand speeds of motortraffic;
Rationalisation of motortraffic accessibility.
Introducing benefits forNMT againstmotorization.
Profiling theenvironmentalimportance of NMTagainst motorization.
In the table below, we elaborate on these four “policy fields”, and indicate what policyelements they may exist of in the three phases of NMT. It shows that in the policy field“transport”, “integrated transport planning” and “separate NMT-promotion” are the twoappropriate policy instruments to support NMT. When looking at the policy field “traffic”,“integrated traffic management”, ”NMT network planning” and a “road safety planning”are suitable. Cycling promotion with the aim of mitigation of air pollution and of urbandegradation are policy approaches that can enhance or improve the environment. Theimpact of increased cycling on the economy comes through improved commuting andcommunication, industrial and small enterprise development and the reduction of fuelimports.

Non-motorised transport in developing countries final report
99
Transport Traffic Economy Environment
• Integratedtransportplanning:
Options:
Generation of targets,instruments and meansto enhance cycling(pull) and discouragemotorised modes(push).
• Focused NMTpromotion:
Options:
Generation of targets,instruments and meansto enhance NMT.
Threats:
Requirements for NMTsecondary topredominant andfavoured modes byoverall transportplanning.
• Integrated trafficmanagement:
Options:
Inclusion of NMT inaccessibility planningand road design;
Regulation of speedsand traffic flows (trafficcalming).
Threats:
NMT efficiencysecondary to interests ofdominant modes.
• NMT networkplanning:
Options:
Creation of a coherentinfrastructure of NMTfacilities and shared roadspace (effectiveness andefficiency of NMT)
Threats:
Network optimisationsecondary to interests ofdominant modes
• Road safetyplanning:
Options:
Investment ininfrastructure, legislationand campaigns topromote safe NMT.
• Improvedcommuting:
Options:
Investment in NMTinfrastructure andfacilities, direct and incombination with publictransport.
• Improvedcommunication:
Options:
Operation of a parcelservice and errandservices by bicycle.
• Industrialdevelopment:
Options:
Manufacturing andtrading of bicycles, partsand accessories
• Small-scaleenterprisedevelopment:
Options:
Use of cycles by pettytrading and smallenterprise.
Creation of cycle parkingand repair facilities.
• Reduction offuel imports:
Options:
Substitution of MT.
• Mitigation of airpollution:
Options:
Investment insubstitution of motorisedtransport by NMT asnon-polluting modes.
Threats:
Substitution of motorisedtransport by NMTsecondary to theintroduction of sub-surface (rail)infrastructure.
• Mitigation ofurban degradation
Options:
Investment insubstitution of motorisedtransport by NMT asnon-polluting modes.
Threats:
Substitution of motorisedtransport by NMTsecondary to theintroduction of catalyticconverters in motorsengines.

Non-motorised transport in developing countries final report
100
CHAPTER 8 CONCLUSIONS ANDRECOMMENDATIONS
8.1 Conclusions
The trend: a decrease in NMT-useThough NMT contributes positively to a number of valuable issues, the tendency is thatNMT will decrease in number of trips and kilometres per person if no promotional policy(including investments in NMT) is carried out.
It appears that in a growing number of countries economic development goes hand inhand with motorization of transport, initially public, later private motorised transport. Thedominant position of motorised traffic is one of the major deterrents for NMT.
The factors influencing the choice for NMT or MT can be grouped as follows:- infrastructure/physical factors- individual/societal factors- institutional factorsThis paper shows that a supportive institutional environment is essential for thedevelopment of NMT and should receive (as in the case of The Netherlands) muchmore attention.
An active NMT policy should be pursued since assessments of people at individual levelwill not automatically lead to a choice for NMT, or a choice that is optimal for society asa whole.
Who is using NMT?The use of NMT is rather biased in developing countries. The proto-type cyclist is aman, aged 25-35 who is employed and has an income high enough to afford a bicycle.In walking such a gender bias can not be observed. Since women would benefitsignificantly when NMT (read: bicycles) lies within their reach, promotional campaignsmust be targeted on them. The gender bias in cycling should not be taken for granted.
.The motives for (not) using NMTPeople’s motives to use or to refrain from using NMT differs from one country toanother. A significant difference between people in developed and developing countriescan be observed. In developing countries, captive-ridership (i.e. no other options tochoose from than NMT), is often heard as the main reason for walking or cycling.
A number of disincentives for NMT are lack of road safety, lack of infrastructure andlack of social safety (esp. for women). Studies have shown that besides a gender bias,a policy (and attitudinal) bias also exists. This bias includes high taxes for bicycleimports, bicycle registration procedures and special fees. Motorised transport is quiteoften promoted by means of not charging motorised road users for their external effects,or subsidising fuel. When promoting NMT one should consider and overcome theseproblems.
Non-motorised transport in developing countries final report
101
But, a number of people in developing countries values NMT for its affordability,flexibility, time-efficiency and speed, and prefers it above motorised transport. Thesepositive attributes are even recognised by non-NMT-users as this report has shown.
Benefits from NMTThe benefits that would accrue to society will outnumber the costs of the investments.Benefits in the field of quality of life and economic development in urban areas can beexpected. Improved attractiveness and accessibility of the city, increased employmentand public savings, health and environmental improvements are among the majorimpacts. Therefore NMT promotion is regarded as an important tool for povertyreduction.
Need for an integral and integrated approachTo ensure that interventions will have the desired impact, it is required to follow anintegrated and integral or holistic approach. NMT has the most impact when it isintegrated in plans and policies related with poverty alleviation, economic and socialdevelopment, employment generation, urban and regional planning, urban upgradingand environmental protection. Urban planning should pursue mixed-cities where workand residential areas are close by and trip distances accordingly short.
The physical possibility to walk and cycle on roads is very much related to the densityand speed of motorised traffic. In particular busses and lorries are prohibitive to thelateral use of curbs as well as crossing over by pedestrians and cyclists. Because of thisNMT needs to be integral part of urban transport planning and management.
How to start?
In a city where cycling hardly exists generic interventions are recommendable. In citieswhere NMT takes a considerable share in number of trips, specific interventions thatbenefit NMT mainly are proposed. Traffic calming is a good starting point that willimprove overall traffic situation.
In situations where generic and specific interventions are complementary, a synergyarises. It shows that one should not always start with big (long-term) investments forspecific modes. Further, one or two major weak points in a specific facility for a bicyclecan undermine the high quality of a route. It is therefore a waste of efforts and money toinvest in a few expensive, high quality bicycle routes in a city where cycling is notpopular or safe, especially on access or collector roads.
Need for partnershipsThe Dutch case shows us that in a tri-angular context of professionals, users(consumers) and politicians, partnerships should be established to ensure sustainableand successful plans. Lack of consensus or failing partnerships between these groupscan result in a lack of political willingness, meagre resource allocation and undesirableand ineffective plans.
Upscaling local initiativesChanges in city traffic and transport in which cycling is (positively) involved, are ofteninitiated and carried by individuals, such as activists, professionals and civil servants orpoliticians. Upscaling to higher levels is then the necessary approach for integration ofcycling in urban and national policies, resource allocation for infrastructure, and forchanging the perceptions of citizens with respect to status and economic benefits.
5 Strategies for developing NMTStrategies for NMT development may include: participation – urban planning –education & sensitization – incentives and promotion and capacity building.A programme of capacity building for policy development, allocating funds, improvingtechnical know-how and expertise, mobilising and supporting local interest groups will

Non-motorised transport in developing countries final report
102
contribute to NMT development. Benchmarking and guidelines are necessary tools toensure quality of investments.
Stakeholder participation- User/stakeholder participation has been mentioned as a key factor to success in alldiscussions and reports consulted. A lack of participation by users and otherstakeholders will definitely lead to a weak and unsustainable result of interventionsundertaken. Planned and implemented activities will not be understood and may evenharm the interests of bicyclists. In cases of lack of participation during the design andplanning, bicycle lanes and paths quite often lead from nowhere to nowhere, are hardlyused by cyclists or are used by others (motorbikes and cars, pedestrians, streetvendors). At the policy making level, participation belongs to a much wideradministrative reform process.
Urban planning and sensitizationThe neglect by urban planners of the effects of their planning on transport modes hasdeteriorated the position of NMT in many cities. The strict spatial division of work andliving within the city has extended trip distances significantly. Further functionalconcentration and urban sprawl has even worsened the situation.
Raising awareness among urban planners about planning consequences for transportand thus environment and economic/poverty can overcome this problem, along with theintroduction of the concept of multi-centred-cities, where residential and working placesare close to each other.
Removing professional biasesPlanning and design professionals often have their own biases and so hinder thedevelopment (or even existence) of NMT. Ways to overcome these biases are:- Training and awareness raising among staff;- Showing cases of successful participatory planning and design; experts maybecome more aware of the benefits of participation;- Formation of user groups, which on their turn may put pressure on the experts toinclude their ideas has turned out to be successful in many places;- Political commitment and pressure on experts will ensure that “in words” thebeneficiaries are heard and involved.Creating a clear understanding of roles and competencies of the various partiesinvolved, and that each participant is recognised in his expertise.
Communication and awareness-raisingA strategy to inform citizens about policy measures and to convince them to changebehavior according to the measures, can not easily become effective without taking intoconsideration the determinants of behavior (e.g. products and incentives that mayfacilitate the desired behavior and the social environment of the citizens). Informationwill only be effective if the message (product) that is presented is attractive and result inpersonal benefit. One can think of using a social marketing approach.
Incentives and removal of disincentivesReducing consumer tax (VAT) or import tax on bicycles and providing better facilities(and so improving its status) will remove major NMT disincentives. Better infrastructure,more parking opportunities, showers and dressing rooms at work will all have a positiveimpact on NMT use. Financial compensation and credit or bonuses for people who walkor cycle to their work will increase NMT-use as well.
The replicability of the Dutch National Master PlanThe author argues that a national masterplan, like the one from the Netherlands, can berelevant and suitable for developing countries as well, since the Dutch Masterplan is notvery prescriptive. It enables the stakeholders to become involved in actual local policyand plan-making and motivates them to take their own responsibility. It defines somefuture goals and directions. Such an approach, without prescribing which specificmeasure should be carried out, is realistic and useful.

Non-motorised transport in developing countries final report
103
The issues in the Dutch National Bicycle Plan as communication with stakeholders (andoffering forums for exchanging ideas and experiences) and capacity building arerelevant for all countries. The strengthening of user platforms and NMT-advocacygroups has already been adopted in various countries. Decentralisation is aphenomenon not only relevant for the Netherlands, but also for other countries.A strategy targeted on defending the existing NMT-use should come before exploringnew markets for NMT.
These conclusions are based on the experiences in a limited number of countries.Further field research on the use of NMT, including non-motorised freight transport andaccurate evaluations of NMT projects can provide insight in factors that are contributingto successful and sustaining NMT-strategies.
8.2.1 Recommendations
The Bank has a rich history with respect to the implementation of physical transportinfrastructure projects, which in many cases have created a good basis fordevelopment. Since early nineties, the Bank is aware of the fact that NMT has beenneglected in her projects for improving mobility. She has implemented and supported arange of projects in Africa (SSATP), Lima (Peru) and Bogota (Colombia) since. TheBank can continue to play an important role in getting NMT on the political agenda andto ensure the proper valuation and inclusion of NMT in transport programmes world-wide. As a lender and as an important knowledge centre the Bank has instruments to dothat.
It is recommended that the Bank will:
focus on integral and integrated transport planningThe Bank should assist countries:• in integrating NMT policies, strategies, plans and projects in plans related with
poverty alleviation, economic and social development, employment generation,urban upgrading and environmental protection.
• in mainstreaming NMT policies, strategies, plans and projects in overall traffic andtransport management policy.
• in ensuring that NMT interests are considered and protected (and that NMT qualityloss is compensated) in case of road infrastructure programmes.
• in redirecting and guiding urbanisation in such a way that functions of a city aremixed (working, shopping, recreating and residing) in order to keep trip distancesrelatively short and thus creating opportunities for NMT.
• in taking away the need for a shift to motorization and the therefromresulting need of high public investments.
focus on health and life threatening situationsThe Bank should assist countries:• in improving safety for pedestrian and bicycle users and reduce the more-than-
proportional share of traffic injuries and fatalities among these NMT-users.
focus on removing biases against NMTThe Bank should assist countries:• in removing or adjusting procedures, formalities and legislation that are directly or
indirectly undermining the use of NMT (bicycle road tax, bicycle registration feesand licenses, no recognised or described traffic rights etc).
• in removing high import taxes on bicycles (and treating them as a luxury item).• in eliminating the bias towards motorised road users in terms of subsidies on petrol,
road construction and for not charging the MT-user for congestion, pollution andsafety problems;
• in including the aforementioned externalities in road user charges.

Non-motorised transport in developing countries final report
104
• in ensuring that decisions concerning to transport investments are made based onproper cost-benefits analyses of various MT and NMT options.
• in supporting initiatives to change perceptions and remove biases and to promoteNMT as a means of transport for all (regardless sex or income).
stimulate participation of stakeholders in planning, design, and implementationThe Bank should assist countries:• in providing stakeholders opportunities to participate actively in decision-making
concerning planning, design, and implementation of NMT interventions.• in ensuring that traffic and transport problems of road users, NMT-users in
particular, are considered in aforementioned stages; and that interventions areaimed to solve the mobility problems, especially of the poorer sections in society.
• in mobilising and supporting user platforms, associations, interest groups andadvocacy groups of road users, NMT-users in particular.
• in promoting partnerships between government, private sector and public transportsector with regard to NMT.
focus on the urban poor and their transport problemsThe Bank should assist countries:• in creating better NMT conditions for the poor so they can increase their mobility
and reap the benefits of economic and social development and to get improvedaccess to jobs, education, health and other services.
• in designing cost-effective labour-based construction programmes for NMTinfrastructure.
• in channelling credit / revolving funds through banks or NGO’s that have developedcredit modalities and have the capacity for loaning small sums to (relatively) poorcustomers in a cost-effective and profitable way.
• in ensuring that gender biases in the provision and use of NMT will be eliminatedthrough targeted promotional campaigns, (saving- and) credit programmes,legislation etc.
focus on capacity building for NMT developmentThe Bank should assist countries:• in policy making at various levels, thereby promoting decentralised policy making; it
can stimulate the development of a Master Plan at national level, so that anenabling environment for further NMT development at lower levels is created.
• in working out traffic and transport strategies and plans for NMT (and ensure itsintegration in an overall transport strategy or plan) at lower levels.
• in developing mechanisms for internal funding and attracting external funding(including loans from international financial institutions like the Bank itself)
• in building up expertise in NMT, through supporting universities and training centresto update their curricula; in-service training for transport planners, designers anddecision makers; organising conferences, study tours, exchanges with “sister”-cities;and providing communication facilities to get access to internationalnetworks/literature etc.
• in building up knowledge through research, experiments and pilots and ensuringquality of transport facilities through pursuing benchmarking and producing anddisseminating guidelines for NMT-facilities design, NMT-integration in urbantransport policy and planning, and NMT promotion.
• in developing legislation in which attention is paid to the rights and responsibilitiesof NMT-users.
Furthermore, we recommend the Bank to:
• provide only loans for transport programmes in which the role of NMT is clearlydescribed and recognised and suggestions/plans are included to support this role.
• support training and education programmes focused on strategic planning of NMTprojects.

Non-motorised transport in developing countries final report
105
• support further quantitative research on the role of NMT in freight transport, publictransport, poverty alleviation and employment. In addition to this, research on itsrole in the reduction of emissions that harm the health and environmental situationshould be supported.
• support the establishment of an international network for NMT development, inorder to take full advantage of international exchange of experience and expertise.This may be a NGO closely related to the Bank.
• support the development of national Chapters for NMT development, asconstituent partners for the above mentioned network.
8.2.2 Additional recommendations
This report shows an overview of the position of NMT in total mobility. Much attentionhas been paid to best practices in planning, in choice of interventions, in supportingNMT development etc. It has provided a whole range of options and approaches forfuture action. A complete list of all these recommendations and suggestions won’t helpthe reader. Hereunder only general recommendations are mentioned as long as theyhave not been mentioned as recommendations to the Bank.
In order to have sustainable success, it is recommended:
Planning:
1) to develop an urban mobility plan for bicycle and pedestrian transport as an integralpart of a city’s transport and traffic policies and plan.
2) to develop an action plan with immediate or short-term, tangible results prior orparallel to the urban mobility plan.
3) to distinguish between non-cycling cities/areas and places where cycling hasalready an important share in traffic.
4) to look for a good balance between ambition and realistic and feasible objectives.5) to make a functional hierarchy of roads (access, distribution, transit) so that for each
category specific measures can be taken.6) to plan NMT interventions following an area-wide approach. The size/scale of such
an area should match with the characteristics of NMT-trips. This could either be asmall or medium sized city or a district of big cities. In the latter case theinterventions can gradually be extended to other districts.
Interventions:1) to implement area-wide speed reduction measures apart from roads with a flow
function for motorised traffic.2) to develop and implement design standards for infrastructure for pedestrian, bicycle
and all motorised transport.
Legislation and regulation:1) to introduce priority rules (right of way) and regulations for cyclists and pedestrians
in urban areas and technical measures that support priority and stimulatesperception and anticipation.
2) to introduce a graduated or intermediate licensing system for young car drivers andmotorised two wheelers.
3) to set the BAC limit for MT users at a lower level: 0.01% (alcohol limits).4) to change rules of liability (a higher order of transport is always liable unless it can
prove a case of force majeure).
Education and awareness campaigns:1) to combine education and awareness activities with other interventions since they
seem to have little impact when carried out in isolation.2) to refrain from negative campaigning concerning MT.3) to make use of intermediaries to convey the message to final target groups.

Non-motorised transport in developing countries final report
106
4) to adjust the message and the method of education and campaigning to the targetgroup (social marketing concept).

Non-motorised transport in developing countries final report
107
Endnotes
1 Urban Environmental Planning and Management Strategies for Sustainable Split Modal Transportation inArequipa, Peru. Luis Mauricio Huaco Zuniga (1997)2 Bicycle Master Plan for Delhi - a Summary of Final Report, TRIPP (2000)3 The Dutch Bicycle Master Plan – Description and Evaluation in an Historical Context, Ministry of Transport,Public Works and Water Management, the Netherlands (1999)4 Fietsverkeer in praktijk en Beleid in de Twintigste Eeuw, Ministry of Transport, Public Works and WaterManagement (1999)5 Cycling Promotion and Bicycle Theft – Local background studies in Leon (Nicaragua), Lima (Peru), NewDelhi (India), Guangzhou (China), and Accra (Ghana), I-ce (1997)6 Non Motorised Transport in Urban Areas: On the verge of extinction or hope for the future? Tiwari, G. (1995)7 Gomez Lara M. (2000) Gender analysis of two components of the World Bank Transport project in Lima,Peru: bikepaths and busways. Draft.8 Cycling Promotion and Bicycle Theft – Local background studies in Leon (Nicaragua), Lima (Peru), NewDelhi (India), Guangzhou (China), and Accra (Ghana), I-ce (1997)9 Cycling Promotion and Bicycle Theft – Local background studies in Leon (Nicaragua), Lima (Peru), NewDelhi (India), Guangzhou (China), and Accra (Ghana), Synthesis Report. Tiwari, G. and R. Saraf, for I-ce(1997).10 Policies for urban non-motorised transport – in: SSATP Preliminary assessment report 1993.11 Structure of I-ce’ s Interactive Training Programme – Explanation of a Holistic Approach, Pettinga, A.(2000).
Municipal Financing of Urban Road Infrastructure and Facilities for Pedestrians and Bicycles, Matovu, G.(2000) Paper presented in the Expert Group Meeting on Low-Cost Mobility in African Cities, the Netherlands(pp3-8).
The Bicycle in Africa: luxury or necessity, Velo City Conference Nottingham, Howe, J. and R. Dennis (1993).13Opiyo, T. and J.Koster (2000); Human Resources Requirements in Local Authorities – Principles and CaseStudy of Kenya (discussion paper).14 Delft evaluation (XXX)15 Bicycle Master Plan for Delhi – Final Report. Transport Department Government of New Delhi, 1998.16 Geetam Tiwari – Personal communication (June 2000)17 Productive and Liveable Cities: guidelines for pedestrian and bicycle traffic in African cities, by de Langen.Mand R. Tembele (ed) 200018 Dutch Designing Manual for Bicycle-friendly Infrastructure; Rotterdam/Ede, March 1993, as quoted in: Non-Motorized Friendly Infrastructure Planning and Traffic Management – An Overview of International Experienceand Literature Relevant for Sub-Sahara Africa: Grontmij, (1993)19 Guidelines for pedestrian and bicycle traffic in African cities”, WB SSATP (2000), section 5.1 and 6.320 D.Mohan (2000). Measures to Improve Road Safety of Vulnerable Road Users. Paper for the I-ce VeloMondial Interactive Training Programme.21 Kajzer, J. Yang, YK and D. Mohan (1992). Safer Bus Fronts for Pedestrian Impact Protection in Bus-Pedestrian Accidents. Proceedings 1992 International IRCOBI Conference on the Bio-mechanics of Impacts,IRCOBI, Bron, France, 13-23.22 Guidelines for pedestrian and bicycle traffic in African cities”, WB SSATP23 Sign up for the bike24 Guidelines for pedestrian and bicycle traffic in African cities”, WB SSATP, section 14.2.25 Guidelines for pedestrian and bicycle traffic in African cities”, WB SSATP, chapter 14, figure 14.1, 14.2 and14.3.26 The authors have deliberately used the information from “Guidelines for pedestrian and bicycle traffic inAfrican cities”, WB SSATP, chapter 12 and 13.27 This entire section is based on: The results of four cost—benefit calculations, I-ce (2000).28 Litmann, T. (1996) as cited in: The results of four cost-benefit calculations, I-ce (2000).29 Daggers, T. (2000): the economic benefits of cycling in Santa Fe de Bogota, Colombia.30 Abbey, M.A. and M. de Langen (2000) Economic costs and benefits of cycling in Morogoro, Tanzania.

Non-motorised transport in developing countries final report
108
31 Based on a study conducted by the Indian Institute of Technology.32 Wittink, R. (2000): Safety and Vulnerability of cycling – the interdependence between mobility and safety(unpublished paper).33 Wittink, R (1998): Road Safety Education, in: An Introduction to Road Traffic Safety – a MultidisciplinaryApproach.34 Saad, F. (1999); Communication with Road Users, in: An Introduction to Road Traffic Safety – aMultidisciplinary Approach.35 Lassarre, S. and N. Muhlrad (1998): The Safety Diagnosis, in: An Introduction to Road Traffic Safety – aMultidisciplinary Approach.36 Tiwari, G. (1998): Recording Traffic Crashes, in: An Introduction to Road Traffic Safety – a MultidisciplinaryApproach.37 Cycling and Bicycle Theft, Local Background Studies in Guangzhou (China), Leon (Nicaragua), Lima(Peru), New Delhi (India) and Accra (Ghana), I-ce 1997.38 Guitink P.(1996) during Velo Australia (Perth 1996)39 Amrita Daniere, University of Toronto, Sustainable Urbanisation in Mega-cities: role of NMT. TRB 1998.40 World Bank (1995); Sustainable Transport – A Sector Policy Review.41 Cycling and Bicycle Theft, Local Background Studies in Guangzhou (China), I-ce 1997.42 World Bank (1994): Non-motorised Transport: Confronting Poverty Through Affordable Mobility.43 Guidelines for pedestrian and bicycle traffic in African cities”, WB SSATP, section 17.44 The Economic Significance of Cycling, Buis, J. and R. Wittink (I-ce) 2000.45 Haq, G. and P. Bailey (1998) Air Pollution from the Transport Sector - A Scenario Study for Europe.Swedish Environmental Protection Agency.46 Wold Bank (1995). Sustainable transport – A Sector Policy Review.47 Productive and Liveable Cities: guidelines for pedestrian and bicycle traffic in African cities, by de Langen.Mand R. Tembele (ed) 2000, pp 13-1648 Poverty and Transport – World Bank, 1998 (as referred to in The Economic Significance of Cycling).49 Productive and Liveable Cities: guidelines for pedestrian and bicycle traffic in African cities, by de Langen.Mand R. Tembele (ed) 2000.50 Signing up for the Bike.51 Personal communication with Pettinga, A. June 2000.52 Policies for urban non-motorised transport – in: SSATP Preliminary assessment report 1993.
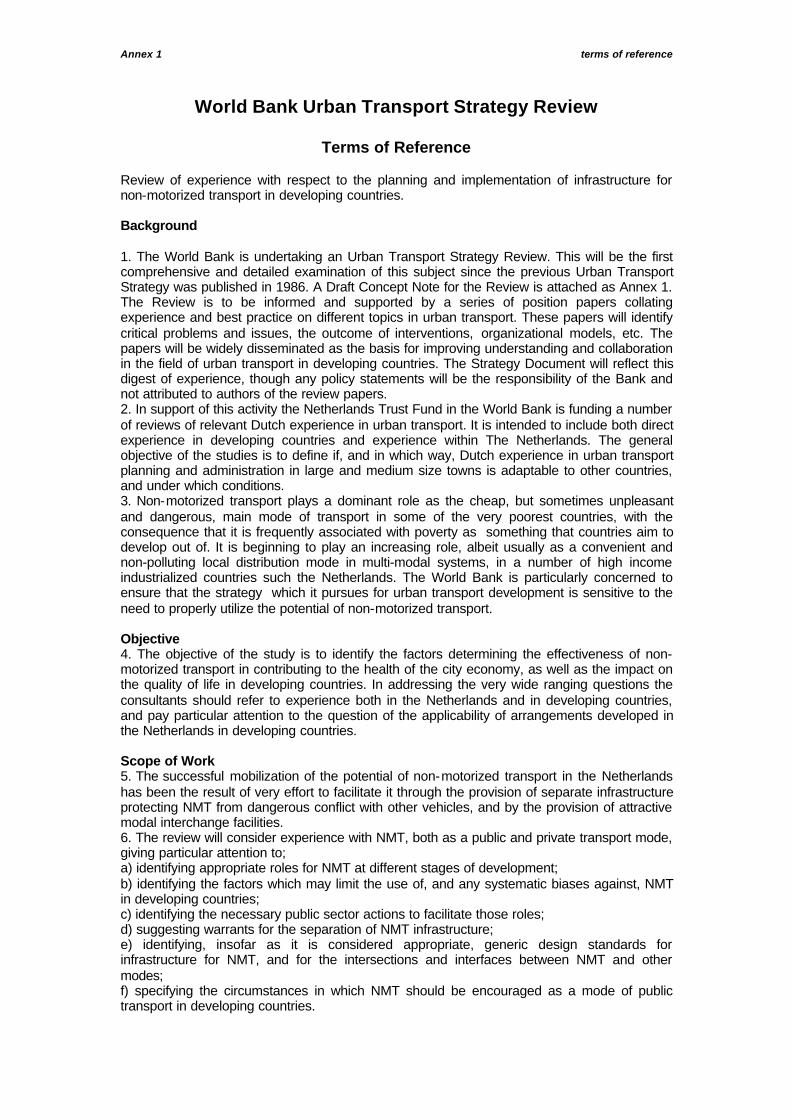
Annex 1 terms of reference
World Bank Urban Transport Strategy Review
Terms of Reference
Review of experience with respect to the planning and implementation of infrastructure fornon-motorized transport in developing countries.
Background
1. The World Bank is undertaking an Urban Transport Strategy Review. This will be the firstcomprehensive and detailed examination of this subject since the previous Urban TransportStrategy was published in 1986. A Draft Concept Note for the Review is attached as Annex 1.The Review is to be informed and supported by a series of position papers collatingexperience and best practice on different topics in urban transport. These papers will identifycritical problems and issues, the outcome of interventions, organizational models, etc. Thepapers will be widely disseminated as the basis for improving understanding and collaborationin the field of urban transport in developing countries. The Strategy Document will reflect thisdigest of experience, though any policy statements will be the responsibility of the Bank andnot attributed to authors of the review papers.2. In support of this activity the Netherlands Trust Fund in the World Bank is funding a numberof reviews of relevant Dutch experience in urban transport. It is intended to include both directexperience in developing countries and experience within The Netherlands. The generalobjective of the studies is to define if, and in which way, Dutch experience in urban transportplanning and administration in large and medium size towns is adaptable to other countries,and under which conditions.3. Non-motorized transport plays a dominant role as the cheap, but sometimes unpleasantand dangerous, main mode of transport in some of the very poorest countries, with theconsequence that it is frequently associated with poverty as something that countries aim todevelop out of. It is beginning to play an increasing role, albeit usually as a convenient andnon-polluting local distribution mode in multi-modal systems, in a number of high incomeindustrialized countries such the Netherlands. The World Bank is particularly concerned toensure that the strategy which it pursues for urban transport development is sensitive to theneed to properly utilize the potential of non-motorized transport.
Objective4. The objective of the study is to identify the factors determining the effectiveness of non-motorized transport in contributing to the health of the city economy, as well as the impact onthe quality of life in developing countries. In addressing the very wide ranging questions theconsultants should refer to experience both in the Netherlands and in developing countries,and pay particular attention to the question of the applicability of arrangements developed inthe Netherlands in developing countries.
Scope of Work5. The successful mobilization of the potential of non-motorized transport in the Netherlandshas been the result of very effort to facilitate it through the provision of separate infrastructureprotecting NMT from dangerous conflict with other vehicles, and by the provision of attractivemodal interchange facilities.6. The review will consider experience with NMT, both as a public and private transport mode,giving particular attention to;a) identifying appropriate roles for NMT at different stages of development;b) identifying the factors which may limit the use of, and any systematic biases against, NMTin developing countries;c) identifying the necessary public sector actions to facilitate those roles;d) suggesting warrants for the separation of NMT infrastructure;e) identifying, insofar as it is considered appropriate, generic design standards forinfrastructure for NMT, and for the intersections and interfaces between NMT and othermodes;f) specifying the circumstances in which NMT should be encouraged as a mode of publictransport in developing countries.

Annex 1 terms of reference
Supervision7. The consultancy is procured by the World Bank under the normal conditions applying to theNetherlands Trust Fund. The World Bank will nominate an officer to supervise the work and toliaise with the consultant on its content and scope.
Resources8. It is expected that the review will require up to 2 person months. The work will beconducted primarily in the Netherlands: this requires that the consultants have a first-handknowledge of issues in developing countries and of the related solutions and debates relatedto them. The consultant team should be composed of one or two experts who have an easyaccess to all available relevant documentation, in public as well as private libraries and databases.
Schedule and Reporting9. A short inception report in five copies will be submitted within three-four weeks ofinstructions to proceed with the project. The inception report will outline an assessment ofdata availability and the cities proposed for evaluation.10. The final report (100 pages at most, including appendixes) shall contain: ·Recommendations on the issues set out in section 6 above· Appendices,· An annotated bibliography.11. The draft final report will be submitted in ten copies within twelve-sixteen weeks ofinstructions to proceed with the project. The report will be delivered to the World Bank in aprovisional version, in English after 4 months. The World Bank will deliver comments within15 days. The final report in twenty copies will be submitted, in English, within two weeks ofreceiving comments on the draft final report from the World Bank.12. Each report (inception, draft final, and final) will be submitted in an electronic formatacceptable to the Bank (for example, Microsoft Word). All raw data files, intermediatecalculations, and final calculations and spreadsheets, graphics, model runs (if any), andworking papers files will also be submitted in electronic format.

Annex 2 Resource persons
.APPENDIX 2: CONTRIBUTORS
The following people have contributed to the production of this report; their names are in alphabeticalorder:
Sounding board members:
Jeroen BuisBicycle expert
Tom GodefrooijBicycle expert
Andre PettingaPresident of Board of I-ce, The NetherlandsUrban Planner/Traffic EngineerAssociate for Grontmij Consulting Engineers
Jaap RijnsburgerDirector of WASTE Advisers on Urban Environment and DevelopmentFounding member of I-ce, The Netherlands
Roelof WittinkActing director I-CE
Resource persons:
Carlos CorderoTon DaggersLuis Zuniga HuacoGeetam Tiwari

Annex 3 study planning matrix
ANNEX 3: STUDY PLANNING MATRIX
Means of verification Assumptions
Development/overall objective: A World Bank urban transport strategyincluding a NMT-component, based ona sound assessment of its potentialsand limitations.
World Bank report
Immediate objective: Overview of factors determining theeffectiveness of NMT in contributing tothe health of the city economy, as wellas the impact of life in developingcountries.
Final report
Output: 1. Appropriate roles of NMT atdifferent stages for developmentidentified
2. Opportunities for NMT indeveloping countries, includingsuggested key actors andnecessary actions to be included inNMT strategies identified
3. Factors which may limit the use of,and any systematic biases againstNMT in developing countriesidentified
4. Criteria for the separation and /orintegration of motorised and non-motorised road-users suggested
5. Potential gender and culturalbiases for NMT use identified andapproaches to overcome theseidentified
6. Benefits of the low incomepopulation from improvements inNMT conditions highlighted
7. Circumstances in which NMTshould be encouraged as a modeof public transport in developingcountries specified
8. Options for financing NMTinterventions suggested
9. Information on costs and benefitsof most important interventionsprovided
Final report Activitiesimplemented asproposed.
Activities: 1. Desk study of relevant literature
2. Interviews with key informants
3. Meeting with I-CE
4. Discussion with/in sounding board
Inception report
Minutes of meetings
Workshop report
Draft report
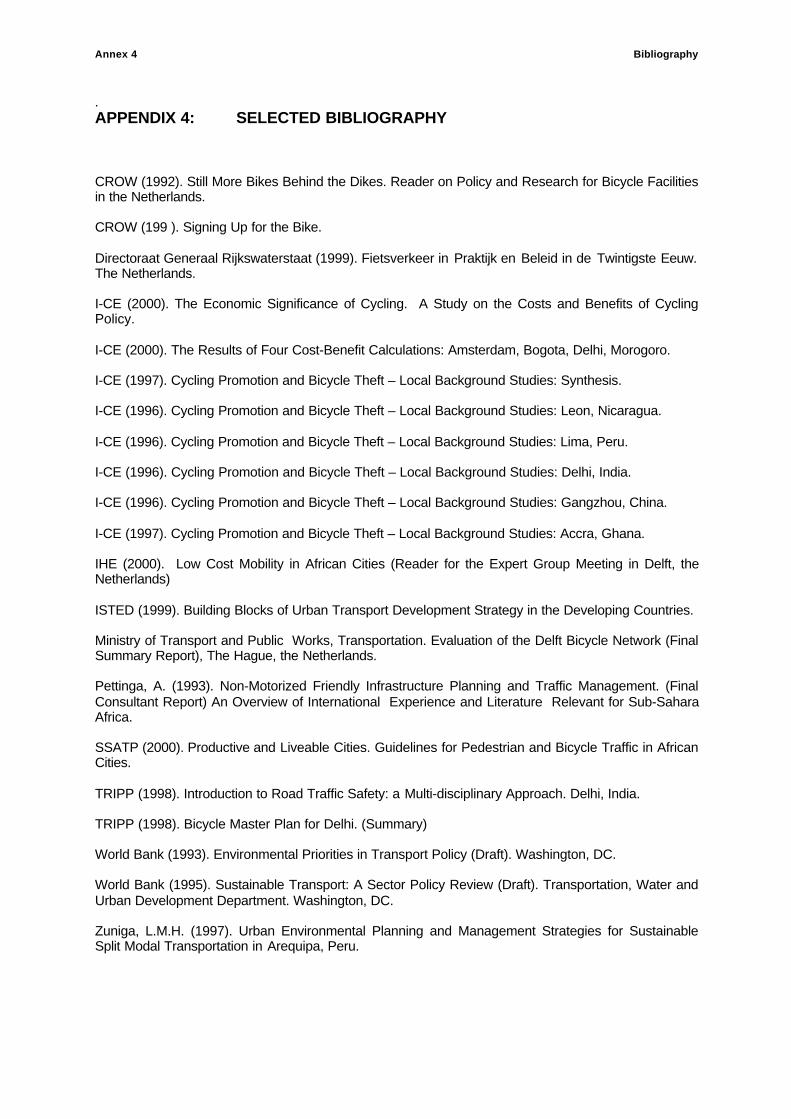
Annex 4 Bibliography
.APPENDIX 4: SELECTED BIBLIOGRAPHY
CROW (1992). Still More Bikes Behind the Dikes. Reader on Policy and Research for Bicycle Facilitiesin the Netherlands.
CROW (199 ). Signing Up for the Bike.
Directoraat Generaal Rijkswaterstaat (1999). Fietsverkeer in Praktijk en Beleid in de Twintigste Eeuw.The Netherlands.
I-CE (2000). The Economic Significance of Cycling. A Study on the Costs and Benefits of CyclingPolicy.
I-CE (2000). The Results of Four Cost-Benefit Calculations: Amsterdam, Bogota, Delhi, Morogoro.
I-CE (1997). Cycling Promotion and Bicycle Theft – Local Background Studies: Synthesis.
I-CE (1996). Cycling Promotion and Bicycle Theft – Local Background Studies: Leon, Nicaragua.
I-CE (1996). Cycling Promotion and Bicycle Theft – Local Background Studies: Lima, Peru.
I-CE (1996). Cycling Promotion and Bicycle Theft – Local Background Studies: Delhi, India.
I-CE (1996). Cycling Promotion and Bicycle Theft – Local Background Studies: Gangzhou, China.
I-CE (1997). Cycling Promotion and Bicycle Theft – Local Background Studies: Accra, Ghana.
IHE (2000). Low Cost Mobility in African Cities (Reader for the Expert Group Meeting in Delft, theNetherlands)
ISTED (1999). Building Blocks of Urban Transport Development Strategy in the Developing Countries.
Ministry of Transport and Public Works, Transportation. Evaluation of the Delft Bicycle Network (FinalSummary Report), The Hague, the Netherlands.
Pettinga, A. (1993). Non-Motorized Friendly Infrastructure Planning and Traffic Management. (FinalConsultant Report) An Overview of International Experience and Literature Relevant for Sub-SaharaAfrica.
SSATP (2000). Productive and Liveable Cities. Guidelines for Pedestrian and Bicycle Traffic in AfricanCities.
TRIPP (1998). Introduction to Road Traffic Safety: a Multi-disciplinary Approach. Delhi, India.
TRIPP (1998). Bicycle Master Plan for Delhi. (Summary)
World Bank (1993). Environmental Priorities in Transport Policy (Draft). Washington, DC.
World Bank (1995). Sustainable Transport: A Sector Policy Review (Draft). Transportation, Water andUrban Development Department. Washington, DC.
Zuniga, L.M.H. (1997). Urban Environmental Planning and Management Strategies for SustainableSplit Modal Transportation in Arequipa, Peru.

Annex 5 the Step-by-Step approach of Social Marketing
.APPENDIX 5:
STEP BY STEP APPROACH OF SOCIAL MARKETING
The step by step approach of social marketing comprises the following components:
• Situation analysis
• Target group segmentation
• Aims
• Marketing Strategy
• Implementation
• Monitoring and evaluation
(Source: Social marketing of traffic safety, OECD, 1993)
In order to show the relevance and practicalities of the approach, a case will be presented: a group ofofficials wants to promote cycling.
Step 1: situational analysis.In the first step, the situation analysis, one concentrates on the presence and characteristics of theobject (the State of Art), the context in which one has to operate (enabling or disabling factors) or thatinfluence any intervention; it describes the direction and room of manoeuvres; Four aspects areimportant: problem analysis, external factors of influence, internal factors of influence and consumeranalyses. One could interpret these aspects as follows:
- problem analysis: what are the reasons to put cycling on the political agenda? Reasons for thismay include the city climate, the inner-city economy, environmental protection, road safety,congestion etc.
- external factors of influence: what are the factors that the local administration has limited poweror authority over? The policy of the central government regarding modes of transport is one sucha field. It may include tax policies; policies of companies regarding transport management;policies of public transport companies; climate conditions etc.
- internal factors of influence: what are the conditions in the field of (own) organisation, capacityand instruments? This may also include aspects as political support, time for the development ofa bicycle policy and the exchange with citizens and interest groups.
- consumer analysis: what are the factors that influence people’s choice for the bicycle or anothermode? These factors may include aspects of presence and accessibility of modes, costs, safetyetc.
On basis of a problem analysis, the local official has to explore opportunities to involve otherstakeholders like the central government, private companies, NGO’s, citizens and their representativeorganisations etc. The situation analysis may lead to a first exploration of interventions. Theseinterventions have to be evaluated in relation with identified problems, external influences, the internalfactors (mandate and capacity) and the needs and preferences of the consumers.
Step 2: target group segmentation.The second step, target group segmentation, is needed because road users are not a homogenousgroup. Status may be the most important hindrance for some groups to make use of a bicycle, limitedaccess to a bicycle or safety for other groups. In identifying groups of road users, it is important toanalyse the social “network” of the target group, like family, friends, colleagues etc.

Annex 5 the Step-by-Step approach of Social Marketing
Step 3: aimsThe third step regards the formulation of aims. They have to be realistic, taken into account all theopportunities and benefits as well as the constraints. Society may benefit very much from a highershare of cycling and create political support for promoting the bike. It is important to analyse whetherthe allocated budget and planned and implemented interventions are sufficient and effective toachieve the aims. Preferably, the evaluation is made with all relevant stakeholders.
Aims will structure and direct policy and measures. Long term aims may inspire and involve people,whereas short term aims are needed for monitoring progress.
Step 4: marketing strategy.The aforementioned provides us the ingredients for the marketing strategy . Now we are able to definethe product, the price, the place and the way of promoting.- the product may be in our case, improved mobility, or more safety, increased health;- the price may be the price of a bicycle, or an “immaterial” one as getting wet when cycling in rain;- the place may be the channel by which a product can be obtained, for example a shop, employer
or an NGO like Afribike.- the promotion regards all the information that inform people about the product, price and place.
Step 5: implementation.The fifth step concerns implementation. With regard to the means, one has to be flexible and considerthe effectiveness of different approaches and measures.
Step 6: monitoring and evaluation.Monitoring and evaluation is important to know about effects and to keep in touch with the dynamics ofpeople and society.
Consumer analysis and external conditions
Two aspects of the social marketing approach will be explored in more detail hereunder, i.e.consumer analysis and analysis of external conditions. Two illustrations may give some better insight:
1. A few years ago a campaign took place in the Netherlands targeting on car drivers to convincethem about the harm cars cause to the environment and the need to restrict car use. Thecampaign had an opposite effect: most of the drivers developed arguments contra the campaign.The car drivers did not want to change their habit and sought justification for using the car. Thismakes clear that it is not easy to change attitudes by information campaigns. The determinants ofbehaviour, the social environment, and target group segmentation were not taken into account.
2. In the Netherlands employers were stimulated to promote bicycle use by their employees. Thecentral government introduced an incentive of excluding the gift of a bicycle (worth about 650USD) from income tax, if the employee would not receive a compensation for travel expenses forthree years.
3. A NGO supporting projects in developing countries, appealed to employers to stimulate the use ofa bicycle. The NGO would contribute money to projects dependent on every bicycle kilometre.Calculations made clear that employers would benefit from bicycle use, because of better healthconditions of employees and less costs for parking place
The two latter examples that social, economic and technical conditions have been taken into account.As a result people started to cycle for other purposes too (in case 2). People changed not just theirpractice going by bicycle, but also their attitude towards it.
Conclusions
Consumer analysis is an important tool to learn about the behavioural determinants; it helps inidentifying feasible opportunities for changing behaviour. Some politicians and officials find that thereis no need for bicycle facilities because there are no cyclists. In fact, they assume that there is no

Annex 5 the Step-by-Step approach of Social Marketing
demand for it, which is a different matter. Potential cyclists first want to see that they can use good,safe and comfortable provisions.
People are interested in comfort and technological improvements if that would increase comfort. Theirpreferences are usually based on money. If the social, technological and economic conditions are notmatching, they will resist changes in their behaviour.

Annex 6 negotiated government
APPENDIX 6
The concept of negotiated government
(Based on the report: Onderhandelend bestuur (Negotiated government), by B. de Vroom andR. van der Ent, Univ. of Leiden and Ch. Goldenbeld and R. Wittink, SWOV, 1995, SWOV,Leidschendam, the Netherlands).
A dialogue between government and the individual citizen has in general little effect. Theproblems and preferences of citizens are in general too complex and differentiated.Therefore, a platform at meso level is proposed, where government institutions negotiate andexchange with various organised citizens and other social organisations. The platform bringsactors together that are dependent from each other in solving a collective problem. Theplatform formulates a policy as a result of interaction between the participants. No one hasthe ultimate solution, but the contributions by the different participants will bring the solutionnear by. The participants learn to know each other interests better and may detect newopportunities for themselves. There is no objective reality independent from the differentparticipants. The reality will develop out of the perceptions and exchange between theparticipants. This will only happen if they are challenged to make concrete, to put into wordsand to actualise their own aims. Because the interests remain different, negotiations arenecessary to establish cooperation. But the platform will facilitate to reach consensus andcompromises.
The local government is the best actor to initiate the process and to formulate the domain andthe mandate (responsibilities and in terms of budget and funding) for the platform.Independent experts may help to analyse the collective problems, the social segmentationand the institutional segments, that all together constitute the specification of the domain. Theexperts may also contribute to the formulation of the target or norms of the platform. On thisbasis, the participants may be selected.
The platform starts with an exchange to define a common sense regarding their problemsthey want to solve. They will make an inventory of the background of the problems and ofalternative behavior that solve these problems. This is the basis to look for measures. It mustbe clear that the discussion about solutions, for which most people can not easily wait, has tobe postponed till an exchange has taken place about problems, the background of problemsand targets. Many debates about policies come to a dead stop because they focus only onthe measures that every one prefers and the objections the others have.
After the exchange and negotiations a plan of action can be fixed. The measures have to beevaluated and the process of exchange and negotiations will be repeated to improve andextend.

Annex 7 problem tree of bicycle use in urban areas in developing countries
ANNEX 7: PROBLEM TREE OF BICYCLE USE IN URBAN AREAS IN DEVELOPING COUNTRIES
Sub-optimal traffic mix
Economicloss
Loss of familyincome
Loss ofemployment
Air pollutionCongestion
Little usebicycles
Economic lossEconomicand social
loss
Healthproblems
Safetyproblem
Prices aretoo high
(import/tax)
Lack ofhousehold
budget
High incidenceof theft
Bicycles arenot affordable
Littlepolicecontrol
etc.
Prices are too high and/orwrongly located
Lowdemand for
facilities
No government priority – nosupportive policy
Noparkingfacilities
Trafficspeed is too
high
Bad drivingbehaviour
No locationmade
available
No trafficcalming
measures
Noawareness,
no goodattitude
Too few cyclists /pedestrians
Invisibilityof cyclists
Littleawareness
among otherroad users
Competitionbetweentransport
companies
Lowdemand
from NMT-users
Nobudgetpriority
Noproper
design ofroads
Indirect/ incoherentroutes
Trafficvolume istoo high
Bias amongplanners and
decision-makers
Travel distancestoo big
Noproperspatial
planning

Annex 8 objective tree of bicycle use in urban areas in developing countries
ANNEX 8: OBJECTIVE TREE OF BICYCLE USE IN URBAN AREAS IN DEVELOPING COUNTRIES
Optimal traffic mix
Economicgains
Increasedfamily income
Increasedemployment
Air pollutionreduced
Smooth trafficflow
Increaseduse bicycles
Economic gainsEconomicand social
gains
Healthproblemsprevented
Safety problemeliminated
Prices aretoo reducedhigh (lower
VAT)
Creditprovisionfor poor
households
Reducedincidence of theft
Bicycles areaffordable
Increasedpolicecontrol
etc.
Prices are affordableand/or correctly located
Increaseddemand for
facilities
Government recognises rolecycling – supportive policy
Parkingfacilitiesavailable
Trafficspeed isreduced
Improveddriving
behaviour
Locationmade
available
Trafficcalming
measuresin place
Awarenessand attitudeimproved
Increased no. ofcyclists / pedestrians
Visibilityof cyclistsimproved
Increasedawareness
among otherroad users
Competitiontransport
companiesregulated
Increaseddemand
from NMT-users
Sufficientbudget
allocated
Properdesign of
roads
Direct/ coherentroutes
Trafficvolume isproperly
managed
No bias amongplanners and
decision-makers
Travel distancesreduced
Properspatial
planning

Annex 9 the Delft low cost mobility Statement
ANNEX 9: THE DELFT LOW-COST MOBILITY STATEMENT
From 21-23 June 2000, some 80 experts gathered at IHE Delft, The Netherlands, to participate in theWorld Bank/Velomondial2000/IHE Delft Expert Group Meeting on Low-Cost Mobility in African Cities.The group consisted of politicians, administrators and professionals from African national, provincialand local government levels, NGO representatives, staff from External Support Agencies (ESA's),researchers, consultants and other independent experts. The background materials, presented papersas well as the outcomes of the working group sessions conducted during the Meeting, have beenreflected in the proceedings of the Meeting. Those proceedings also contain the below 'Delft Low-CostMobility Statement', to which the participants in the Meeting have agreed and committed themselves.
We, the participants in the Expert Group Meeting on Low-Cost Mobility in African Cities,
• recognising the importance of personal mobility for economic and socialdevelopment, and convinced that affordable mobility is on the critical path tosound economic and social development in Sub-Saharan African Cities, whichmust include rather than exclude the poor; Concerned that the already lowlevels of mobility of the urban poor in African cities will decline further with therapid rate of urbanisation and prevailing urban mobility policies which tend toignore the mobility needs of the poor;
• recognising the dominant role of walking and (the potential role of) cyclingwithin African towns and cities; Convinced that more efficient and saferwalking and cycling positively contribute to poverty alleviation, economicdevelopment, health improvement and environmental protection; Referring toArticle 150 of the Habitat II Global Plan for Action, which reads: 'Non-motorisedtransport is a major mode of mobility, particularly for low-income, vulnerableand disadvantaged groups. One structural measure to counteract the socio-economic marginalization of these groups is to foster their mobility bypromoting these affordable, efficient and energy-saving modes of transport';Also referring to article 7.53.c of Agenda 21, which commits governments to'encourage non-motorised modes of transport by providing safe cycle-ways andfoot-ways in urban and suburban centres in countries, as appropriate';
• recognising that these modes have been marginalized in planning,infrastructure provision and traffic management in many African towns andcities, which has resulted in economic losses due to inefficiencies, in economicand social exclusion, and in high economic costs and human suffering as aresult of traffic accidents;
• having taken note of the important findings of the Sub-Sahara Africa TransportProgramme's Pilot Project on Non-Motorised Transport (SSATP/NMT), which,in summary, are that the mobility and traffic safety of the majority of urbaninhabitants can be enhanced substantially through the application of a menu oflow-cost and straightforward interventions which yield high investmentcost/benefit ratio;
Call upon African national, provincial and local governments, civil society and all other relevant parties,including ESA's, to support and implement the following actions:
ACTIONS AT NATIONAL AND LOCAL LEVELS
Awareness raisingA major stumbling block in realising efficient and affordable mobility in African cities is the lack ofawareness amongst politicians, administrators and professionals at national and local levels of thebenefits of low-cost mobility options. In order to restore a balance in, and increase the efficiency of theurban transport systems, national awareness raising strategies will need to be developed andimplemented. These should target politicians, administrators and professionals at the national andlocal level, and aim at raising their awareness of the economic and social importance of mobility, of themajor role of walking and (the potential for) cycling, of the current inefficiencies of the urban transportsystems as regards these modes, and of the ways and means to enhance low-cost mobility.

Annex 9 the Delft low cost mobility Statement
Mainstreaming low-cost mobilityLow-cost mobility has a direct relationship with, amongst others, poverty alleviation, economic andsocial development, employment generation, urban upgrading and development, and environmentalprotection. Rather than developing stand-alone low-cost mobility policies, national and localgovernments are urged to integrate low-cost mobility in policies, strategies, programmes, plans andprojects that address these issues. As walking and cycling are an important part of the wider urbantransport systems, they should be treated as such. For this reason, national and local governmentsare urged to include these modes into mainstream urban transport policies, strategies, programmes,plans and infrastructure investment projects. In addition, the requirements for efficient and safewalking and cycling should be included in national urban roads design standards. The draft document 'Productive and Liveable African Cities: Guideline for Pedestrian and Bicycle Traffic' includes relevantproposals for such standards.
Stakeholder participationAs is the case in other sectors, stakeholder participation is crucial in the preparation andimplementation of sound and equitable policies, strategies, programmes, plans, and projects. Nationaland local governments are urged to credibly involve, as a major group of stakeholders, pedestriansand cyclists in any decision-making process which directly or indirectly relates to their mobility andtraffic safety requirements. In doing this, they should pay particular attention to the mobility needs ofwomen, which are particularly affected by inappropriate urban transport solutions.
Demonstration projectsAlthough the validity and applicability of the findings of the SSATP/NMT Pilot Project are beyonddoubt, they are based on a limited number of isolated engineering and cycling promotion pilotinterventions. The consistent application of the 'menu of interventions' as an output of the pilot projectat a large scale, and the monitoring and dissemination of the results thereof, will greatly help in raisingawareness of the importance of efficient and safe walking and cycling, and in convincing politicians,administrators and professionals at the national and local levels, as well as the public at large, that thisefficiency and safety can be greatly increased at relatively limited costs. For this reason, national andlocal governments are urged to plan and implement, at city or district level, a number of suchdemonstration projects in a number of countries, and to disseminate the results within Sub-SaharaAfrica.
Local applicationIndependently of, and in parallel with these demonstration projects, local governments can and shouldmake a start with addressing the mobility and safety needs of pedestrians and cyclists, whenever andwherever possible. In doing this, the guidelines produced under the SSATP/NMT Pilot Project are auseful tool, as is the exchange of experience through the network of experts on low-cost mobility.
Human resources capacity buildingIt is recognised that professional leadership capacities (urban planning and management, transportplanning and management) are well below what is required, both in quality and in numbers, to prepareand implement sound and equitable low-cost mobility policies for the fast growing African towns andcities. This has undoubtedly contributed to the near exclusion of the requirements of pedestrians andcyclists in urban transport and land-use policies and infrastructure investments. National governmentsare urged to redress this situation, by providing relevant education and training opportunities, as wellas attractive employment conditions, for professionals involved in urban mobility at the national andlocal levels. In addition, current relevant university level curricula should be upgraded to reflect currentthinking about (low-cost) urban mobility, in order to better prepare graduates for their tasks.
ACTIONS AT THE INTERNATIONAL LEVEL
Mainstreaming low-cost mobilityESA's are urged to integrate low-cost mobility in their current and future aid policies and to promote itsapplication in national and local strategies, plans, programmes and projects which they support andwhich aim at poverty alleviation, economic and social development, employment generation, urbandevelopment and upgrading, and environmental protection. They are also urged to provide technicaland financial support (both grants and loans) to urban transport plans and projects only if these dojustice to the importance and major modal share of walking and (the potential for) cycling in Africancities.
Support to demonstration projects
Annex 9 the Delft low cost mobility Statement
The identification, preparation, execution and monitoring of local demonstration projects (see 4.above) will require outside technical and financial support. In this connection, the Low-Cost UrbanMobility Demonstration Programme proposed under the UNCHS Sustainable Cities Programme is arelevant initiative, which qualifies for support by ESA's.
Support to human resources capacity buildingAs in many instances existing human resources at the professional level are either very weak or non-existent, national governments will require external support in building human resource capacities andin upgrading relevant university curricula. In view of limited resources and in order to promote regionalnetworking and knowledge sharing, the establishment of a regional 'Centre of Excellence' should beseriously considered. Such a centre could develop and provide training of trainers courses, post-graduate education modules and programmes and assistance to universities in the upgrading ofcurricula, staff development and strengthening of the related educational/training infrastructure. ThisCentre could also serve as the coordination unit for a Network of Experts on Low-Cost Mobility whichwould disseminate experiences and promote exchange amongst professionals working in this field.
Further pilot work and dissemination under SSATP.The SSATP/NMT Pilot Project has delivered valuable lessons which are applicable in a large numberof situations. Nevertheless, more coordinated pilots should be carried out. The supporters of theSSATP are urged to include a follow-up NMT Pilot Project for additional interventions in its programmeof activities. The SSATP is also urged to put in place a programme for much wider dissemination ofthe findings of the SSATP/NMT Pilot Project, as well as those of follow-up pilot activities and theproposed demonstration programmes. In order to fulfil these activities and to do justice to the crucialrole of non-motorised transport in African cities, the SSATP is also urged to ensure that low-cost urbanmobility remains a recognisable element within this important initiative.
As participants in the Expert Group Meeting, we commit ourselves to promote the proposed actions, toactively strengthen the network that the Meeting has helped to establish, to keep each other informedof successes and failures in implementation activities, and to meet again in the year 2005 to take stockof progress and to update the plan of action.
Delft, The Netherlands 23d June 2000.

Annex 10 cost benefit analysis of a bicycle policy
ANNEX 10:
COST – BENEFIT ANALYSIS OF A BICYCLE POLICY (DUTCH CASE STUDY)1
The reason for inclusion of this CBA is to show an example of how beneficial the bicycle policy can be from aneconomic point of view. Below we will go into the cost and benefit components. We will conclude annex 10 witha case study from Dordrecht, the Netherlands.
The basic assumption of the calculations made is that due to investments in bicycling infrastructure (paths andparking facilities) the number of short car trips will reduce. It will have a cost reduction effect on car infrastructuresince the need to invest in infrastructure is less. Basically, costs can be divided into three categories: costs formunicipalities, for the cyclists (internal costs) and for society (external). The costs for municipalities may consistof the construction of bicycle infrastructure and parking facilities, promotion campaigns and loss of parkingrevenues. For the cyclist the costs are purchase, use and maintenance of the bike. Benefits may accrue for thesame groups as for costs. In following table these benefits (and reduced costs) are detailed.
Table A.10.1: Overview of benefits of bicycle policy
Type of costs Example Beneficiary
Internal benefits of cycling
Reduction travel time Citizens
Quality of life Citizens
Quality of space Citizens
Reduction travel costs (carsubstitution)
Citizens
Internal benefits of guarded bicycleparking facilities
Reduction bicycle theft Citizens/Industries
Cost savings of car accommodatingpolicy
Reducing tear and wear Maintenance costs Municipality/province
Spatial occupancy Land costs Municipality/industries
Roads and parking space Construction costs Municipality/industries
Reduction of external costs car use
Noise pollution Prevention costs
Evasion costs
Damage costs
Silent road surface
Rehabilitation
State / municipality
State / municipality
Citizens
Traffic safety Prevention costs
Evasion costs
Damage
Safe traffic provisions State / provinces / municipalities
Citizens
Air pollution Prevention costs
Evasion costs
Damage
Cleaner engines
Environment/health
State / citizens
Citizens / property owners
Stench Prevention costs
Evasion costs
Damage
Congestion Prevention costs
Evasion costs
Damage Time loss
Municipality
Citizens / industries
External benefits bicycle policy
Improved health Doctor’s fee Citizens
Improved quality of life Citizens
Improved quality of space Citizens
External benefits of bicycle parkingfacilities
1 The information and calculations made in this annex, are entirely derived from “Handboek Kosten-Batenanalyse (KBA)Fietsbeleid, by MU Consult B.V. 2000. We kindly refer the interested reader to this manual for more detailed information.

Annex 10 cost benefit analysis of a bicycle policy
Type of costs Example Beneficiary
Tidy environment Citizens
Less hindrance pedestrians Citizens
Less bicycles in front of windowsshops
Citizens
Lower insurance premium Citizens
Less cleaning Cleaning costs Municipality
An active bicycle policy will result in two distinct trends: substitution (car by bicycle) and generation (more trips).In other words, total mobility and modal share will change. To estimate its impact, a whole range of formulasshould be developed and factors valued. For example, the value of time for business and commuting purposesshould be set. Same goes for environmental costs of the emission of CO2 per kilometre travelled by car. Below,the results are shown.
Table A.10.2: Costs and Benefits specified and valued.
Costs Benefits
Construction bicycle infrastructure PM Revenues parking bicycles PM
Construction bicycle parkingfacilities
PM Maintenance cost car parking carsand roads
F 0.008 /km
Information campaigns PM Construction costs parking lots forcars
F 2000.00/ unit
Organisational costs PM Change in car infrastructure andfunctions of roads
F 70.00 / m2
Mun
icip
aliti
es a
ndot
her
auth
ori
ties
Missed parking fees from cars PM
Internal costs additional bicycletraffic
Formula 1 Internal benefits additional bicycletraffic
Formula 2
Parking fee for cyclists PM Savings internal costs for car use Formula 4
Reduction of stolen bicycles PM
Improved quality of life PM
Cyc
lists
Improved quality of space PM
Noise pollution F 0.029/km
Air pollution:
CO2
NO2
HC
PM10
SO2
F 0.027/km
F 0.027/km
F 0.027/km
F 0.0001/km
Traffic safety:
Fatalities
Injuries
F 0.024/km
F 0.035/km
Congestion F 0.01/km
Stench PM
Reduction of natural resources PM
Emissions PM
Improved health PM
Effects quality of life PM
Less hindrance for pedestrians PM
Less bicycles in front of shopwindows
PM
Soc
iety
Lower insurance premiums PM
TOTAL COSTS TOTAL BENEFITS

Annex 10 cost benefit analysis of a bicycle policy
CASE STUDY: THE MUNCIPAL BICYCLE POLICY OF THE CITY OF DORDRECHT, THENETHERLANDS
• Scenario 1: reduction of total short trips (<5.25 km) by car in 2000 with 50% (base year:1994)• Scenario 2: replacement of short car trips depending on distance by bicycle in 2000• Scenario 3: reduction of growth of total short car trips from 1989-2000 with 50%; growth is limited
to a selected number of origin-destination locations.
The three scenarios will all lead to a reduction in number of kilometres per car (% in top row of table).External effects and costs are given as well for each scenario.
Table A.10.3: Overview of benefits of bicycle policy in Dordrecht (1993-2000) in million guilders1
Scenario 1
( - 35.5%)
Scenario 2
( - 66%)
Scenario 3
( - 9.9%)
Beneficiary
Noise pollution2 5.25 6.97 1.05 State
Air pollution 3.04 5.65 0.85 Public
Stench PM PM PM Public
Congestion PM PM PM Public/industries
Traffic safety 17.34 PM 1.32 PublicExt
ern
alef
fect
s
Space occupation PM PM PM Public
Reduced maintenancecosts car infrastructure
1.68 3.12 0.47 Municipality
Reduced additionalparking costs cars
4.00 7.00 1.00 Municipality/industries
Reduced costs new carinfrastructure
PM PM PM Municipality/province/State
External revenues bicycletraffic
PM PM PM PublicCo
sts
for
acco
mm
od
atin
gp
olic
y
TOTAL BENEFITS: 31.31 57.93 7.691Costs of promotion campaigns and policy development are not included; same goes for some benefits.2Some benefits are not recurring

Annex 11 effectiveness and efficiency of test interventions in SSATP
ANNEX 11: ANALYSIS OF EFFECTIVENESS AND EFFICIENCY (CBA) OF TESTINTERVENTIONS IN SSATP
In the study carried out for the World Bank (SSATP), a number of assumptions have been made.In calculations of annuity costs of capital an interest rate of 10% is used. The depreciation perioddepends on the facility: 10 years in case of small infrastructure/facilities; 20 years in case of biggerinfrastructural works (bridges). The valuation of time differs per group and country/city, ranging from 8to 20 USD cents per hour. The costs of accidents are equal for both Tanzania and Kenya: 3,000 USDfor a person killed, 250 USD for a person seriously wounded. The authors point out that these valuesare rather conservative (low); higher values would improve B/C considerably.
ANNEX 11.1
Intervention Unobstructed walkway (in combination with raised zebra crossing)
Description A narrow side street off the main road in the town centre of Morogoro, Tanzania is animportant shortcut for pedestrians for going to the northern part of town. Often, the street isblocked by street vendors or parked vehicles. During the rainy season, the street is muddy.The 2 stages of interventions were: 1) blocking the entrance for cars and constructing raisedzebra-crossing at main road to prioritise pedestrians on this route. 2) improving pavement anddemarcation for street vendors to stall their business.
Conditions Motor vehicle speed was 43 km/hr before, but just 16 km/hr on main road after intervention
Problems 1. Pedestrian crossing is unsafe. Non-fatal accidents happened regularly.2. Waiting times for vulnerable pedestrians were long.3. The walkways were often blocked by parked vehicles and street traders.4. The pavement of the side street was in bad condition.
Objectives 1. Enable unobstructed pedestrian movement on the walkways, in particular through theshortcut route, and eliminate pedestrian walking on the carriageway
2. Create safe traffic conditions at/near this spot, for crossing pedestrians and for cyclistsmoving on the main carriageway
Effects 1. Obstruction of pedestrian movement by street traders is minimal now; parking of vehicleson the walkway has been eliminated.
2. Road safety has been restored at/near this spot.3. Attractiveness of the pedestrian shortcut route has increased.4. Motor vehicle access has been eliminated.
Costs andbenefits
Costs:4,500 USD (including raised zebra)
BenefitsNo cost benefit analysis has been calculated for this intervention. It will be comparable to thatin annex 11.2.

Annex 11 effectiveness and efficiency of test interventions in SSATP
ANNEX 11.2:
Intervention Walkway improvement along a road corridor in Morogoro (Tanzania)
Description The walkway route improvement package included: a) construction of a separate walkwayalong the regional hospital fence, separated from the parked taxis and minibuses; b) walkwayreconstruction in front of a fuel station and reconstruction of an adjoining Y-construction into aT-shape; c) construction of three traffic calming spots to improve crossing safety (narrowingwith bicycle slips at two intersections and speed humps in front of hospital); d) construction offour pedestrian bridges over small streams (open drains); and e) small spot improvements towalkway pavement (filling big holes with compacted murram).All these interventions were directed to solve the urgent problems at specific spots on a route.
Conditions 1. The road is one of the most important pedestrian routes in Morogoro, leading fromresidential areas to city centre. The pedestrian ADT increases as the road gets nearer tothe centre, where it reaches about 10,000 per day.
2. The traffic on the main carriageway is a mixture of motor vehicles (40% of total) andcyclists (60%).
3. The bitumen carriageway is 8-10 meters wide and of fair pavement quality. Totalimproved walkway section is about 900 meters.
Problems 1. Several dangerous spots where pedestrians have to walk on the carriageway.2. One spot at the regional hospital entrance where pedestrians have to find their way
across an area blocked by chaotic minibus- and taxi-parking.3. A dangerous spot with a very long crossing distance (+ 20 meter), due to the location of a
fuel station entrance at a Y-junction.4. Motor vehicle speeds are too high in relation to traffic conditions (>40-50 km/hr).
Objectives 1. create a safe and convenient walking route along this corridor road
Effects The public, pedestrians as well as other road users positively received the improvement of thewalkway. Fine-tuning of initial improvements increased public appreciation, i.e. to eliminateremaining bottlenecks (a.o. pavement spot repair, protective bollard at the reshaped junction,and walkway re-alignment.
Costs andbenefits
Costs:Total costs 18,000 USD (12,000 USD for pedestrian bridges and repair existing culverts.Annual cost: 4,200 USD including maintenance)
Benefits:Pedestrians saving time 14,400 USD per year (4 minutes/km, ADT 8,000)
B/C ratio 3.4 (not included yet the avoidance of accidents and increased capacityintersection)

Annex 11 effectiveness and efficiency of test interventions in SSATP
ANNEX 11.3:
Intervention Raised zebra crossing in Dar es Salaam and Morogoro (Tanzania)
Description Eleven raised zebra crossings were constructed at the test sites (10 in Temeke (Dar esSalaam) and 1 in Morogoro)
Conditions A large number of pedestrians cross the road. Approximately 10,000 pedestrians are countednear a specific intersection. The average pedestrian ADT crossing the road at the locationswhere raised zebra’s are constructed is about 2,200. At junctions with wide streetsconcentration of pedestrians is highest; however, there is no concentrated crossing.During the day motor vehicle traffic ranges from 500 to 1,000 vehicles per hour (peak hourflow of passengers: 15,000 in peak direction).Minibuses stop randomly on the road shoulder to pick up/drop passengersThe estimated average ADT of cyclists on the roads ranges from 1,000 to 2,300.
Problems 1. Crossing the road is dangerous for pedestrians, due to high speed of MT.2. The high speed increases the chance of vehicle-vehicle collisions, which if happen, result
in damage and traffic delay.3. Cycling is dangerous in mixed traffic due too high speeds of motor vehicles.
Objectives 1. Create a more calm and safe traffic pattern along the entire section, and allowing safecrossing for pedestrians.
2. Create crossing points (green points) where crossing is made easy and very safe for themore vulnerable pedestrians (elderly, children etc).
Effects 1. Traffic accidents were nearly eliminated; pedestrians can cross road safely.2. The combination of zebra-crossing and bus bays (adjacent to zebra-crossing) has lead to
an increase use of the bus bays.3. Positive for motor vehicle movement:
a) reduced cost of damage to cars due to accidentsb) no significant increase in average transit time of this road section.
4. Negative for operators of large carts since elevation is too high for them.5. The pedestrian waiting times at the raised zebra crossing point are not reduced. The
slowing down does not increase the distance between the cars or the willingness to stopfor a pedestrian. The zebra’s are especially used by the more vulnerable (slower)pedestrians, while others don’t cross the street on these places. Since the traffic speedhas dropped, it is easier to cross elsewhere.
6. The elevation of the road by hump or raised zebra has a significant effect on speed (inTanzania more than in Europe).
Costs andbenefits
Costs:Costs for a raised zebra-crossing amount up to 4,500 USD (annual costs 1,000 USD).
Benefits:Avoidance of cost of accidents: 4,350 USD
Three crossings/km were built at the test section, which led to the elimination of trafficaccidents in the year after construction. An average of 12 accidents per year with seriousvehicle damage and hospitalisation of 3 pedestrians happened.
B/C ratio: 1.45 (based on cost avoidance only)
Intervention Painted zebra crossing without speed calming (flat top hump)
Effect 1. No change in motor vehicle driver behaviour;2. No change in vehicle speed distribution; V(85%) before = 63 km/hr; after = 64 km/hr.3. No change in number of accidents.4. Still difficult crossing.5. A painted zebra-crossing may suggest a safe crossing, which it is not, and therefore
increases the risk of accidents.

Annex 11 effectiveness and efficiency of test interventions in SSATP
ANNEX 11.4:
Intervention Pedestrian route network development (construction walkways, drainage, changingsome roads, parking places, upgrading access roads)
Description The plan area is under rehabilitation: a big market is constructed, attracting other businessesand additional traffic as well. Part of that traffic will be pedestrians and cyclists since tripdistances are expected to be short. Moreover, parking for cars will receive attention. Forpedestrians safety and speed calming measures will be taken.
Conditions 1. A need for simultaneous investments in drainage and walkways.2. A need for upgrading the pavement of most important access roads simultaneously (to
reduce severe competition between cars and pedestrians).3. Some shopkeepers will benefit (better access), some will not, because public space will
be taken from them.
Problems 1. Too high incidence of transit traffic2. Night time parking of trucks on walkways3. Inefficient traffic flow at key intersections4. Main pedestrian roads do not follow the collector roads, but cross them at right angles.
Roads are in a very poor condition.5. Poor drainage system
Objectives 1. Create safe, direct and comfortable access on foot and bicycle to the central part ofTemeke from all residential parts of the ward, as part of a good traffic solution foraccessibility of the new market and its surrounding area.
2. Demonstrate that a good NMT route for the unplanned area at the back of Temeke to thecentre can be constructed at modest costs and significantly improves mobility of residentsof that area.
Effects 1. Rehabilitation of the neighbourhood and positive image building2. Number of pedestrians can not be assessed yet due to unfinished work
Costs andbenefits
Costs:Investment: 70,000 USD (15,000 USD for walkways, 38,000 for drainage, 19,000 for motor-carriageway construction).
Benefits:Benefits: 4 minutes time saving (per km walkway). Per pedestrian ADT is 1,000, which is2,000 USD per year. So, break-even traffic for new 4 meter-wide walkway is 2,600 ADT and3,200 ADT for murram and concrete slabs respectively.

Annex 11 effectiveness and efficiency of test interventions in SSATP
ANNEX 11.5:
Intervention NMT Bridge
Description Bridge over river is important for reaching school, market and work. It has beenconstructed and repaired with community participation.
Conditions 1. Small river, sandy soil, considerable erosion.2. Users are likely the lower-income classes3. First trial for NMT only (some resistance at the start)
Problems Lack of direct routes for NMT
Objectives Create a good, direct NMT route between Yombo Island and the central part ofTemeke.
Effects 1. Good and direct NMT route created, without bottlenecks2. Commercial activities have started up along the road.3. Number of users is increasing day by day.4. Community building and building self-esteem.
Costs andBenefits
Costs:Investment: 11,000 USD ; annual cost: 1,500
Benefits:Benefits: 5 minutes time saving. The detour requires 15 minutes: value of time gain isabout 6,000 USD per year. Estimated B/C ration is 4.

Annex 11 effectiveness and efficiency of test interventions in SSATP
ANNEX 11.6:
Intervention Road shoulder separation MT-NMT in Dar es Salaam (Tanzania)
Description A 500 meter long section of a collector road with previously open shoulder was lined with T-blocks, with a variable distance between them, to test whether leaving wider gaps that allow acar to turn in at a low speed, e.g. for parking, significantly influences the effectiveness of theseparation from a pedestrian safety point of view.
The chaotic conditions on so-called open road shoulders are creating traffic flow inefficienciesand safety problems, especially in urban areas.
Conditions 1. Urban collector road with a trunk road design (7-meter wide carriageway with 1 metershoulders).
2. The unpaved stretch along the road is 0 to 5 meters wide.3. Frequent movement of motor vehicles on/off the road shoulders. This makes walking and
cycling on the shoulders unsafe and unpleasant.4. Random stopping of minibuses (partially) on the shoulder.
Problems 1. Conflicting uses: where undefined urban road shoulders exist, different activities competefor them:
a) pedestrian movementb) street tradingc) vehicle parking, loading and unloadingd) emergency traffic movement
2. Damage to road pavement and drains
Objectives 1. Separate the carriageway pavement physically from the shoulder, require minimummaintenance, create no drainage or solid waste accumulation, or encourage unintendeduse of the separators.
2. Reshape the road shoulder space into a proper walkway that can also be used by carts.
Effects(preliminary)
1. Motor vehicle movement onto the shoulders is no longer possible. Pedestrian movementsare more “relaxed”.
2. The number of minibuses stopping at the other spots than bus bays has been reduced toalmost zero (also due to simultaneous construction of bus bays at the end of roadshoulder separation section)
3. Traffic movement in and out of plot entrances along the section does not createsignificant disturbances.
4. The observed damage to T-blocks suggests that the annual maintenance will be around2-3% of the investment.
5. Vehicle top speeds are reduced slightly (visually narrowing the road)
Costs andbenefits(preliminary)
Costs:10 USD per meter road shoulder (every 3 meters 2 T-blocks for separation). Annual costs are1.6 USD per meter (including maintenance).
Benefits:Increased value of the road shoulder (walkway) 1 USD person/km/year (15% time-
saving)(break-even pedestrian ADT = 1,600. Actual ADT = 5,000 )
Reduced cost of pavement maintenance Results show that even the prevention of serious deterioration of road pavement alone fully justifies the investment.
Increased capacity of carriageway New road is 60 USD per meter. Annual costs are about 12 USD per meter lane.So an increase of 13% in capacity (due to removal obstructions) is already breaking even the investments in T-blocks.

Annex 11 effectiveness and efficiency of test interventions in SSATP
ANNEX 11.7:
Intervention Median in Eldoret (Kenya)
Description The construction of a median on both sides of a bridge over a total length of 60 and 160 meterintended to make overtaking impossible.
Conditions 1. Wide carriageway (10 meter in the approaches, 9 meter at the bridge)2. Fair bitumen pavement3. High vehicle speed. Inbound: V(85%)=47.5 km/hr, maximum 82 km/hr. Outbound:
V(85%)=50.5, while the recorded maximum is 72 km/hr.4. Most drivers have little concern for the safety of pedestrians and cyclists.
Problems 1. High speed of vehicles.2. The road slopes upward on both sides after the bridge. Overtaking is dangerous, with
cyclists and pedestrians on the carriageway.3. Absence of walkways. Pedestrians use the edge of the carriageway.
Objectives 1. Restore smooth and safe traffic flows and eliminate the spot as a black spot forpedestrians and cyclists.
2. Facilitate safe pedestrian crossing on both sides of the bridge, without imposing onesingle crossing point.
Effects 1. Restored traffic safety. Where previously this was the most dangerous section, it is nowprobably the safest.
2. Vehicle speeds (inbound) went down from V(85%)=47.5 to 21.0, and the highestobserved speed from 82 km/hr to 35 km/hr. Outbound similar changes occurred.
3. The volume of cyclists increased 13% in the 3 months after opening (180 cyclists per day,inbound; same weather conditions). This is probably a modal shift form minibus tobicycle.
Costs andbenefits
Costs:Costs of this median: 21,000 USD (annual costs: 4,500 USD)These costs cover the complete reshaping of the bridge section (including medians,pedestrians and bicycle tracks, drains and raised crossing). Cost for median = 25 USD permeter.
Benefits:Reduction in costs of accidents: 5,500 USD per year (estimation)Increase in modal share of cycling (cost saving): 10,000 USD per year (250 days*180
cyclists*0.23 USD) per year
B/C ratio (reduction costs accidents): 1.2B/C ratio (change modal share): 2.3

Annex 11 effectiveness and efficiency of test interventions in SSATP
ANNEX 11.8:
Intervention Mixed NMT track along an urban corridor in Eldoret (Kenya)
Description Construction of 390 meter of separate mixed NMT track (2.5 meter-wide, premix pavement),two pairs of two speed humps, repairs to drainage culverts, construction of one crossingisland where the track crosses a side street, road signs and painting.
Conditions 1. Maximum vehicle speed from outside town is 70-90 km/hr. Should be reduced to about50 km/hr.
2. Substantial number of heavy truck combinations on long distance trips.3. Fair pavement condition.4. ADT (12 hr count) at critical intersection is: MT 10,200; cyclists 4,200 and pedestrians
15,800. Motor vehicle speed was 43 km/hr before, but just 16 km/hr on main road afterintervention
Problems 1. High number of accidents with pedestrians and cyclists involved2. No walkway for pedestrians; no safe road-crossings3. Cyclists share the carriageway with MT, but in view of the high speed of motor vehicles
and the interference with pedestrians this is unsafe.4. The MT carriageway does not yet reach saturation in the peak hour, but the expected
increase of MT and bicycle traffic can not be accommodated on the existing road space inthe long run.
Objectives 1. Significant reduction of accidents2. Provision of adequate road capacity for both MT and cycling3. Improve attractiveness of cycling and walking.
Effects For pedestrians:Most pedestrians use the track in both directions. After completion of the mid-block crossingprotected by speed humps, the use of the track by pedestrians improved further, since it turnsout to be safe now to cross.
For cyclists:Most cyclists continue to use the carriageway. A week of active publicity and instruction ofcyclists at the site, urging them to use the track, did not change the situation, because:1. obstruction of the track by pedestrians2. the track requires a little detour and is still short (400 meters)3. the speed has reduced much on the carriageway, so that the overall safety has even
improved.What was meant to be a bicycle facility, turns out to have become a safe walkway. The designof the track was actually not adequate to serve both cyclists and pedestrians in bothdirections. For that, a much broader and separate track is required.Safety:After the construction no fatal accidents occurred over a period of one year. The year beforeconstruction 6 fatal accidents did happen.Road capacity:Though cyclists are using the carriageway, the overall situation has improved and capacity issatisfactory for both MT and cyclists. The road is 9 meters wide and offers now enough space;a next adjustment to the road profile is suggested: a painted bicycle lane.Attractiveness:Attractiveness has increased since the black spot (unsafe) has been eliminated.
Costs &Benefits
Costs:25,000 USD (5,300 USD annual costs); per meter track length is 27 USD.
Benefits:Enhanced cycling:Annual saving on travel cost (bus fee) 7,000 USD (per 100 former bus takers)Expected increase in cyclist 200 persons.Reduced costs of accidents:Estimated reduction of fatalities is 5 per year. The associated reduction in costs of accidentsis then 15,000 USD (excluding costs of vehicle damage, administration, congestion dueaccident).B/C ratio: > 4

Annex 11 effectiveness and efficiency of test interventions in SSATP
ANNEX 11.9:
Intervention Bus bays in Dar es Salaam (Tanzania)
Description The intervention consisted of the construction of two pairs of long bus bays, 3 meter wide, witha brick pavement. Pedestrian areas raised, separated from the bay by high kerbs, and paved(slabs), with shelter, either constructed or by trees. Furthermore, raised zebra crossings wereconstructed at the same locations. Separation between carriageway and shoulders todiscourage random stopping has also been implemented.
Conditions 1. Passengers see little benefit in going to a bus stop to wait there, because the bays arenot more attractive than any other spot.
2. Bus drivers look for passengers everywhere, and so reducing attention to safe driving.3. The shape of the road allows stopping at any particular point.
Problems Frequent and unpredictable manoeuvres of buses to pickup or drop passengers, whichcreates an inefficient traffic flow and unsafe traffic conditions for pedestrians, cyclists, motorvehicles and bus passengers.
Objectives Find a way of making bus bays so attractive to use, for both bus drivers and passengers, andstopping at other points so unattractive, that the large majority of all passengers is picked upfrom, or dropped at the bus bay.
Effects 1. From comparable test cases in Dar es Salaam, the following effects are achieved:a) Provision of bus bays alone leads to a situation where on average 25-30% of
bus stops is in those bays, the remainder still outside.b) Provision of bus bays, combined with raised zebra crossings (traffic calming at
the location of the bay) and paving of the pedestrian waiting area leads to 70-75% of bus stops being in those bays.
c) Road shoulder / carriageway separation in addition to the bays, increases thepercentage of stops in bays. Monitoring is ongoing to check the longer-termperformance of the combination of bus bay, raised crossing, road shoulderseparation.
Costs andbenefits
Costs:Total costs: 20,000 USD per set of bays (bay area, pedestrian waiting area, crossing); annualcosts: 4,300 USD. For a whole bus route in Dar es Salaam (like the Temeke-Posta) it will cost85,000 USD. Total number of travellers is about 8 million, paying 1.8 million USD for bus fare.
Benefits:To be expected from reduced maintenance buses, petrol saving, reduction in turn-round time,and avoidance of accidents.

Annex 11 effectiveness and efficiency of test interventions in SSATP
ANNEX 11.10
Intervention Bicycle track along urban corridor in Eldoret (Kenya)
Description Construction of a 500 meter long bicycle track along an existing road by rearranging theparking and traffic lanes. The track is on the existing carriageway pavement, separated fromthe parking lane by high kerbs.The road had a transit and centre function. The wide road (16 meter; 2x2 lane) was inreasonable condition. Due to angular parking and occupation of sidewalk by vendors andshopkeepers, the main road was actually narrow, offered limited overview, and was used bycyclists and pedestrians as well.
Conditions 1. Irregular parking spoils the efficiency and safety of the road.2. Through-traffic of heavy truck significantly adds to traffic hazards.3. Fair bitumen pavement.4. Insufficient pedestrian walking capacity (in view of pedestrian volume).5. ADT pedestrians 17-20,000; ADT cyclists: 2,500-5,000; ADT MT 8-12,000.6. Peak crossing volumes at main junctions: 3-3,500 per hour, cyclists: 200-35- per hour.
Problems 1. Very unsafe bicycle and pedestrian traffic along the main road corridor in Eldoret. 1995:10 cyclists and 30 pedestrians were killed; 18 cyclists and 55 pedestrians seriouslyinjured.
2. Inefficient use of existing motor carriageway.3. Very inefficient (slow) walking conditions.
Objectives 1. Create a safer and more efficient traffic flow for cyclists2. Improve the attractiveness of cycling, and reinforce the user confidence that cycling will
be safeguarded in the long term as a viable mode of transport by Eldoret authorities.3. Increase the efficiency and capacity of the MT flow, to demonstrate that a win-win
solution is possible.
Effects 1. The new bicycle track remains free of parked vehicles; the separation of bicycles andmotor vehicles with high kerbs is effective.
2. The inability of providing pedestrians unhindered walking on the walkways results inpedestrians using the new bicycle facility, whereas cyclists move out to the carriageway.Safety and attractiveness for pedestrians increased significantly, though not planned thisway.
3. Parking is parallel to traffic flow now, creating a much smoother and safer traffic flow.4. The total current motor vehicle capacity of the corridor is determined by the capacity of
the intersections, of approximately 1,000 vehicles/hour in each direction. On the straightsections that capacity can easily be provided by means of one motor vehicle lane. Itmeans that there is no capacity problem when rearranging the existing road into one widesingle motor traffic lane and one bicycle lane. Additional measures at the intersectionsare necessary.
Costs andbenefits
Costs:Total cost of redesigned bicycle track is 18,000 USD (600 meter track including separators,but no pavement since already existing as part of carriageway). Annual costs: 3,900 USD.
Benefits:Pedestrians:1 6,000 USD/year (1,20 USD per pedestrian / year)Cyclists:2 4,000 USD/year ( due to some avoided costs of accidents)
14,000 USD/year (due to haltering reduction of cyclists on this stretch = 300 days*200 cyclists*0.23 USD cents/day)
B/C: 1.5 (in case of pedestrians) and 4 – 5 (in case of cyclists)
1Due to increased walking speed on “planned” bicycle track, assuming 50% of walks are long-distance.2 In case cyclists win “authority” over the bicycle track.

Annex 11 effectiveness and efficiency of test interventions in SSATP
ANNEX 11.12:
Intervention Bicycle route network planning and design in Morogoro (Tanzania)
Description The bicycle network plan has been adopted by the municipality as part of the “urban mobilityplan”, to become an ingredient of its transport policies for the next decade and in particular forits priorities in a number of road rehabilitation plans now in preparation.First step in process is to plan the desired future bicycle route network.Second step is to provide design recommendations for the required bicycle infrastructure ofdifferent types of roads.Third step is to make detailed proposals for bicycle infrastructure on the roads in therehabilitation projects.
Conditions 1. Separated bicycle tracks outside the city centre, on main cycle routes. Since buildingdensity is low, speed reduction is not desirable. Therefor separate tracks must beconstructed to ensure safety for cyclists.
2. Bicycle lanes in the city centre, visually separated from MT. Here, the average speed mustbe reduced to about 30 km/hr due to building density, number of pedestrians and functionof road. No need for separation; mixing MT with cyclists is no problem.
3. Bicycle route network density (to be increased after positive effects related to cycling)
Problems 1. Bicycle traffic has not been taken into account in road designs.2. Worsening of the traffic safety for cyclists due to too high MT speed and lack of bicycle
road facilities.3. Cycling is becoming less popular due to unsafety.4. Household expenditures for transport will rise and mobility will decrease.
Objectives Design and implement a bicycle route network with the capacity to accommodate up to 40% ofall urban trips in the long term, offering safe traffic conditions and direct routes.
Effects Project under implementation
Costs andbenefits
Bicycle track per km: 20,000 USD (annual cost 4,200 USD including maintenance)Bicycle lane per km: 20,000 USD (annual cost 4,200 USD including maintenance)Motor traffic lane per km: 60,000 USD (annual cost 12,600 USD including maintenance)
Estimated minimum infrastructure cost per passenger km per year:Separate cycle track (2,0 meter) 0.16 USD cent per passenger / km ADT 9,000Mixed traffic cycle lane (1.5 meter) 0.28 USD cent per passenger / km ADT 5,000MT lane (3,0 meter, 75% bus) 0,07 USD cent per passenger / km ADT 60,000MT lane (3,0 meter, 25% bus) 0.14 USD cent per passenger / km ADT 60,000
Estimated operating cost per passenger km (Tanzania, Kenia, 1998)Bicycle 1 USD cent per passenger / kmMinibus 3 USD cent per passenger / kmCar 20 USD cent per passenger / km
Total cost:1
Bicycle on bicycle track 1.3 USD cent per passenger / kmBicycle on bicycle lane 1.6 USD cent per passenger / kmMinibus (75%)/car (25%), mixed 4.9 USD cent per passenger / kmCar (75%)/minibus (25%), mixed 10 USD cent per passenger / km
1 assuming a capacity utilisation of infrastructure of 50% (ADT = 3X peak capacity)
From this table it can be concluded that:1. travel costs are much higher than those for infrastructure.2. investment in roads predominantly used by full minibuses are the lowest per passenger/km.3. the travel and infrastructure costs for motorised transport are still 4 to 8 higher compared to bicycles
Calculations show that when investing in bicycle infrastructure (which is more expensive than for MT), the cycletrack still creates a cost savings per year of about 35% (1,600 USD) of total annual cost of bicycle infrastructure.
.