the segmentation of the demand for ferry travel – a case
TRANSCRIPT

Full Terms & Conditions of access and use can be found athttp://www.tandfonline.com/action/journalInformation?journalCode=rero20
Download by: [161.53.47.211] Date: 25 May 2017, At: 00:28
Economic Research-Ekonomska Istraživanja
ISSN: 1331-677X (Print) 1848-9664 (Online) Journal homepage: http://www.tandfonline.com/loi/rero20
The segmentation of the demand for ferry travel –a case study of Stena Line
Joanna Kizielewicz, Anntti Haahti, Tihomir Luković & Daniela Gračan
To cite this article: Joanna Kizielewicz, Anntti Haahti, Tihomir Luković & Daniela Gračan (2017)The segmentation of the demand for ferry travel – a case study of Stena Line, Economic Research-Ekonomska Istraživanja, 30:1, 1003-1020, DOI: 10.1080/1331677X.2017.1314789
To link to this article: http://dx.doi.org/10.1080/1331677X.2017.1314789
© 2017 The Author(s). Published by InformaUK Limited, trading as Taylor & FrancisGroup
Published online: 10 May 2017.
Submit your article to this journal
Article views: 26
View related articles
View Crossmark data

Economic REsEaRch-Ekonomska istRaživanja, 2017voL. 30, no. 1, 1003–1020https://doi.org/10.1080/1331677X.2017.1314789
The segmentation of the demand for ferry travel – a case study of Stena Line
Joanna Kizielewicza , Anntti Haahtib, Tihomir Lukovićc and Daniela Gračand
aFaculty of Entrepreneurship and Quality science, Gdynia maritime University, Gdynia, Poland; bFaculty of Business and tourism, University of Lapland, Rovaniemi, Finland; cDepartment of Economics and Business Economics, University of Dubrovnik, Dubrovnik, croatia; dFaculty of tourism and hospitality management, University of Rijeka, opatija, croatia
ABSTRACTIn an era of fierce competitive struggle about clients, enterprises seek information on characteristics of the main customer segments purchasing their services and goods. This knowledge is crucial to the marketing efforts of enterprises. The purpose of this research is to understand the changes in demand due to the diversity of travel motives. The study identifies distinct segments of travellers due to their motives of ferry travel, i.e., tourism, visiting relatives, work-/business-related and also three other segments with a mixture of these motives. It is also shown that each of these segments has a different profile in terms of their behavioural and socio-demographic characteristics. This article presents the results of surveys carried out among passengers travelling by Stena Line ferries on the route from Gdynia (Poland) to Karlskrona (Sweden), as well as the results of a literature review and ‘desk research’ of available statistics. The method of realisation of representative study can be useful for other researchers and the results of the study can be an interesting source of information both for ferry carriers and other entities in the tourist sector in the Baltic Sea region.
1. Introduction
The Baltic Sea region is famous for its dense network of ferry connections. The down-ward trend in demand has been observed both in the number of handled passengers and cars in Europe in recent years. In 2013 49.57 million people were carried by passenger ferries in the Baltic Sea region, when compared with 2012 when 50.73 million people travelled by ferry, 2013 saw a decrease of about 3%. Passenger ferry travel from Poland to Scandinavia was fairly stable and recorded a slight increase, because in 2013 more than 1.1 million passengers were carried. The Stena Line became the market leader among the ferry carriers in Poland with a market share of 46.2%. In 2013, the Stena Line carried more than 509,000 passengers on the route from Gdynia to Karlskrona (Urbanyi-Popiołek, 2014, pp. 9–10).
KEYWORDSFerry travel; tourism; demand; segmentation
JEL CLASSIFICATIONSm3; m31; F14; L83; R41; Z32
ARTICLE HISTORYReceived 14 september 2015 accepted 14 april 2016
© 2017 the author(s). Published by informa Uk Limited, trading as taylor & Francis Group.this is an open access article distributed under the terms of the creative commons attribution License (http://creativecommons.org/licenses/by/4.0/), which permits unrestricted use, distribution, and reproduction in any medium, provided the original work is properly cited.
CONTACT joanna kizielewicz [email protected]
OPEN ACCESS

1004 J. KIZIELEWICZ ET AL.
The transport of goods generates the greatest income, and the carriage of passengers brings only a small percentage of the total revenue for ferry companies. Ferry carriers appre-ciate the benefits derived from the passenger traffic and seek to attract their attention. They compete by upgrading the quality of the vessels by creating luxury cabins, bars, restaurants and cafes, as well as casinos, cinemas, theatres and spa & wellness facilities. The number of combinations of services, offered to passengers travelling by sea, is flexible and depends on clients’ needs and preferences (Kizielewicz, 2012, p. 113). Some ferry vessels even compete with the luxury cruise ships. Nowadays, all passengers of various profiles with a variety of expectations can find something of interest during their ferry travel (Kizielewicz, 2013, p. 30).
Initially, ferry shipping meant an extension of roads to cross the straits and channels (Miotke-Dzięgiel, 2002, p. 20), and ferries were the floating bridges and primarily met transport needs. Ferry shipping is designed to extend the land-based routes and to create the sea corridors for carriage of goods and passengers. Thus, the definition ‘ferry shipping provides regular connections between ports of the same state or of different states, usually in the borders of the sea’ (Kujawa, 1999, p. 120–121). The ferry shipping differs from other forms of marine transportation in several respects. First, regularity of connections on routes with a length of from a few dozen to a few thousand sea miles and second, the vessels used are designed for transportation of passengers, cars and trucks, and even railways (Kujawa, 1999, pp. 120–121). Truly ferries have changed from ‘floating bridges’ to ‘floating hotels’ and ‘floating beaches’ (Miotke-Dzięgiel, 2002, p. 20).
Research and analysis on market segmentation has been carried out intensively since the 1950s. Within a plethora of literature, notable examples are surveys conducted by Golob (2001, pp. 495–514), Badoe and Miller (1998, pp. 190–215), Lieberman et al. (2001, p. 60–67) among others. Interesting studies were also published by Matear (1991, pp. 7–502), Graham and Russell (2001, pp. 221–233), Outwater, Modugula, Bhatia and Castleberry (2003, pp. 170–180), Outwater, Modugula, Castleberry and Bhatia (2004, pp. 71–79), and Graham and Russell (2001, pp. 221–233). Market segmentation was also the subject of research and analysis in the studies of Johansson (2006, pp. 22–30) and Outwater et al. (2003, p. 15). In these scientific advances, there are presented a multitude of methods of market segmentation and models of market analysis (Table 1).
In Poland, a few institutions deal with research of the ferry market, i.e., the Polish Border Guard (PBG), the Central Statistical Office (CSO) and several maritime universities. The PBG keeps permanent records of the cross-border traffic of passengers and means of trans-ports on all marine border crossings in Poland. The CSO collects and analyses data on border crossings due to their nature and registers the nationality of people who cross. Unfortunately, this type of research has a fairly general character and its use is limited. Research carried out by the public entities are mainly quantitative rather than qualitative and are intended for general statistics. Ferry carriers follow the trends and results of the scientific studies on consumer behaviour in order to adapt the companies’ marketing policies to meet the needs of the market. They are interested in demand segments to obtain competitive advantages in their markets. Therefore, we attempt a deeper analysis of the phenomenon. The purpose of this research is to understand the changes in demand due to the diversity of travel motives. The research questions were the following: (1) What is the structure of tourist demand for ferry travel in terms of demographic characteristics?; (2) What are the motives of people travelling by ferry?; and (3) What kind of services are mostly purchased by people travelling by ferry?

ECONOMIC RESEARCH-EKONOMSKA ISTRAŽIVANJA 1005
As a result of the above considerations, the following working hypotheses are presented:
(1) H1 – The majority of passengers travelling by ferry on the route Gdynia–Karlskrona travel to their places of work in Sweden and Norway, therefore it is assumed that there is a significant relationship between the motives for ferry travel declared by ferry passengers and the destination countries tp which they go.
(2) H2 – There is a significant relationship between the motives for ferry travel declared by ferry passengers and the socio-demographic characteristics of travellers.
(3) H3 – The majority of travellers travelling for work and business do not purchase any extra services that are offered on-board ferries, therefore it is assumed that there is a significant relationship between the motives for ferry travel declared by ferry passengers and the goods and services purchased by them on-board.
2. Theoretical background
The issue of market segmentation has been an important part of marketing research for some time. Kotler, Armstrong, Saunders and Wong (1999, p. 379) say that market segmen-tation is a kind of specification of various groups of consumers with similar characteristics and behaviours in the market. These groups need to be treated as individuals as far as marketing activities are concerned. Middleton (1999, p. 77) defined the phenomenon of segmentation as the division of general market on subgroups for marketing purposes and applying the effective promotional activities geared to meet the specific consumers’ needs and preferences. This phenomenon is similarly described by Tangeland (2011, p. 438) who indicated that the purpose of market segmentation is the division of consumers to homogenous groups on the basis of one or more criteria, i.e., smaller niches with similar characteristics.
Table 1. the previous researches on market segmentation and consumer behaviour.
source: (Bhat, 1997, pp. 34–48; Golob & hensher, 1998, pp. 1–18; Badoe & miller, 1998, pp. 190–215; Lieberman et al., 2001, pp. 60–67; Golob, 2001, pp. 495–514).
Authors Year The advances in the area of segmentation for travel behaviour analysis
c. R. Bhat 1997 he used an endogenous segmentation approach to model mode choice, which jointly determines the number of market segments in the travel population, assigns individuals probabilistically to each segment, and develops a distinct mode choice model for each segment group.
t. F. Golob & D. a. hensher
1998 they studied the dichotomy between an individual’s behaviour and his or her attitudinal support for policies that are promoted as benefiting the environ-mental. they developed a measurement model to establish a set of latent attitudinal factors.
D. a. Badoe & E. j. miller
1998 he developed an analytical procedure that identify segments by simultane-ously dealing with level of service, socioeconomic and spatial factors to determine the relative role each plays in determining travel behaviour.
W.Lieberman, D.schumacher, a. hoffman & c. Wornum
2001 adopted an attitude driven market segmentation combined with an econo-metric analysis of travellers’ mode choice behaviour to quantify total travel and potential transit market share by market segment. Using factor analysis they developed eight latent variables that presented the key underlying attitudinal dimensions.
t. F. Golob 2001 he developed joint models of attitude and behaviour to explain how both mode choice and attitudes regarding the san Diego i-15 congestion Pricing Project differ across the population. Results show that some personal and sit-uational explanations of opinions and perceptions are attributable to mode choices, but other explanations are independent of behaviour.

1006 J. KIZIELEWICZ ET AL.
In practice, five criteria relating to market segments in order to be able to realise mar-keting efforts have been distinguished, i.e., a segment of a market has to be: measurable, substantial, accessible, differentiable and actionable (Middleton, 1999, p. 77). Market seg-mentation is used to differentiate an offer from other, competing ones. Ren and Blichfeldt (2011, p. 418) pointed out that product differentiation is the most important step in mar-keting and that products should be promoted so as to create ‘one clear identity’ in order to present ‘a clear image’ to customers.
According to Dolnicar, Kaiser, Lazarevski and Leisch (2011, p. 41) segmentation allows entities in the tourist market to extract specific groups with similar characteristics and this knowledge is used in the marketing mix in order to encourage the widest possible group of tourists to purchase specific offers. The specialisation and targeting of products to an individual market segment could give businesses a competitive advantage in the market.
Conducting market segmentation is not simple and there are many different types of options, variables, models and techniques (Outwater et al., 2003, p. 172–173). The choice depends on the characteristics of the market, and on the needs of the company carrying out the analysis. Skrzeszewska (2011, p. 272) highlighted that companies in the past concen-trated their efforts on the doorstep and they avoided direct price wars with competitors. They focused on the long-lasting competitive advantages. Nowadays, the situation has changed and companies are ready for the competitive struggle to gain customers, to look for niches and segments on the market where they could be unique. Marketing segmentation creates a lot of advantages for mass marketing. By adjusting products for customers who represent various consumer behaviours and specified market segments, the entrepreneurs can offer better services and act more effectively within the market (Kotler et al., 1999, p. 380–381).
The desirability of conducting research on the needs and expectations in order to extract segments of the tourism market is affirmed by many experts (Tangeland, 2011, p. 435; Dolnicar et al., 2011, p. 41). The process of market segmentation is a multistep task (Kotler et al., 1999, p. 408). In most cases, it begins with analysis of the market competition (Nechita, Muntean, Sarpe, & Nistor, 2010, p. 103) and pilot studies of the group of potential customers in order to develop appropriate research instruments. Then surveys and interviews are conducted to identify customers’ motivations (Šimková, 2011, p. 232), as well as customers’ behaviour and interests in products or services. In a study of one segment, researchers usually apply the test of 100 interviews, therefore, to explore more segments, a greater number of tests should be applied (Kotler et al., 1999, p. 408). In the next stage of the research, the empirical data are subjected to quantitative and/or qualitative analysis. Kotler et al (1999, p. 408) suggested using factor analysis to remove highly correlated variables, then applying a cluster analysis to find segments. Then the segments need to be validated, i.e., verified that the extracted segment is stable and true.
Finally, profiling is the last stage of the process of market segmentation. Kotler (2000, p. 263) distinguished two main groups of characteristics according to which the market segmentation is made, i.e.: (1) geographic, demographic and psychographic; and (2) the characteristics defining the consumers’ behaviours to products’ brands or promotional activ-ities, etc. In practice, in market segmentation – including tourism – different variables are used (Outwater et al., 2003, p. 15). Šimková (2011, p. 232) and Nechita, Muntean, Sarpe and Nistor (2010, p. 103) wrote about it, as well. The most widely used variables are: geographic (region, country size, city size, density, climate,), demographic (age, gender, family size, family life cycle, income, occupation, education, religion, race, nationality), psychographic

ECONOMIC RESEARCH-EKONOMSKA ISTRAŽIVANJA 1007
(social class, lifestyle, personality), and also behavioural (purchase occasion, benefits sought, user status, user rate, loyalty status, readiness state, attitude toward products) (Kotler et al., 1999, p. 386). The segmentation of the demand in marine tourism, including ferry travel, is contributed to by the following factors (Kizielewicz, 2013, pp. 30–31):
• changing shopping behaviours of people travelling by sea from passive to active• competitive struggle for clients among ferry carriers• desire of the ferry carriers to maintain a demand for marine travel• growing popularity of ferry travel among various groups of tourists• development of information systems (Internet, mobiles) and social networking
(Facebook, Twitter, YouTube, Blogger, etc.) make opportunities to organise joint expe-ditions, including marine cruises, by groups with various interests.
3. The ferry travel market in Poland
In Poland, there are two different groups of travellers in sea ports, i.e., the ferry passengers who depart from two cities, Gdynia and Świnoujście, and one-day visitors coming from the cruise ships because Polish seaports are only ports of call for cruise ships (Najder, 2013, p. 59). Polish citizens, who want to purchase a sea cruise, are forced to go to the sea ports in Copenhagen, Rostock or Stockholm, where there are base ports for cruise ships. Due to that, only ferry travel is the subject of study and analysis in this article. Stena Line is one of the world’s largest ferry operators and the largest privately-owned shipping company in the world. The biggest ferry boats operating in the Polish market belong to Stena Line, who operate on the Gdynia–Karlskrona ferry route, and now it has three ferry units at its disposal, i.e.: Stena Vision and Stena Spirit (1700 passengers each) and also Stena Baltica (1200 passengers) (Stena Line Poland Ltd., 2014).
4. Methodology
The subjects of the survey were travellers on Stena Line ferries on the route Gdynia–Karlskrona, who responded to a questionnaire in late 2012 and early 2013. The data collec-tion was carried out in collaboration with the Sales and Marketing Department of Stena Line Poland Ltd. The survey questionnaires were prepared in Polish, English and Swedish. Survey questionnaires were distributed to respondents, who expressed willingness to participate in research at the ferry terminal and on-board the ferries. Each survey questionnaire contains 11 closed questions used for classification, coding, and analysis of data (Kaczmarczyk, 1995). The questionnaires end with questions about respondents’ personal characteristics, i.e., gen-der, age, education, occupation, income and place of residence, all of which are required for conducting market segmentation. To calculate the minimum size of the empirical sample we used the following formula:
where: N = number of general population (all travellers on all ferry lines between Gdynia–Karlskrona), d = requested accuracy test, t - value of the unloaded estimator assuming that
n =N
1 +N∗d2
t2∗p∗q
+ 1
1008 J. KIZIELEWICZ ET AL.
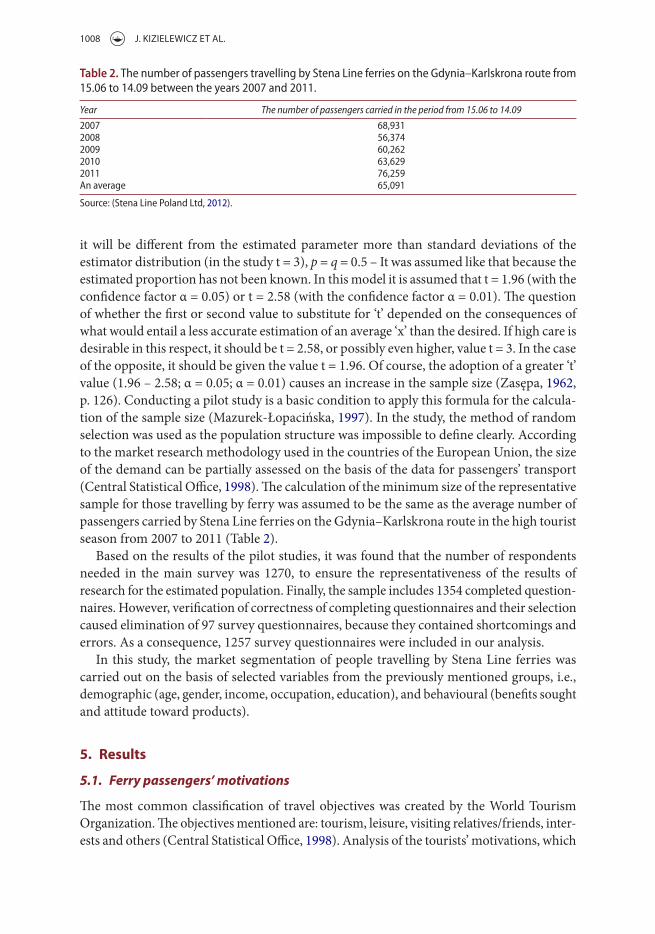
it will be different from the estimated parameter more than standard deviations of the estimator distribution (in the study t = 3), p = q = 0.5 – It was assumed like that because the estimated proportion has not been known. In this model it is assumed that t = 1.96 (with the confidence factor α = 0.05) or t = 2.58 (with the confidence factor α = 0.01). The question of whether the first or second value to substitute for ‘t’ depended on the consequences of what would entail a less accurate estimation of an average ‘x’ than the desired. If high care is desirable in this respect, it should be t = 2.58, or possibly even higher, value t = 3. In the case of the opposite, it should be given the value t = 1.96. Of course, the adoption of a greater ‘t’ value (1.96 – 2.58; α = 0.05; α = 0.01) causes an increase in the sample size (Zasępa, 1962, p. 126). Conducting a pilot study is a basic condition to apply this formula for the calcula-tion of the sample size (Mazurek-Łopacińska, 1997). In the study, the method of random selection was used as the population structure was impossible to define clearly. According to the market research methodology used in the countries of the European Union, the size of the demand can be partially assessed on the basis of the data for passengers’ transport (Central Statistical Office, 1998). The calculation of the minimum size of the representative sample for those travelling by ferry was assumed to be the same as the average number of passengers carried by Stena Line ferries on the Gdynia–Karlskrona route in the high tourist season from 2007 to 2011 (Table 2).
Based on the results of the pilot studies, it was found that the number of respondents needed in the main survey was 1270, to ensure the representativeness of the results of research for the estimated population. Finally, the sample includes 1354 completed question-naires. However, verification of correctness of completing questionnaires and their selection caused elimination of 97 survey questionnaires, because they contained shortcomings and errors. As a consequence, 1257 survey questionnaires were included in our analysis.
In this study, the market segmentation of people travelling by Stena Line ferries was carried out on the basis of selected variables from the previously mentioned groups, i.e., demographic (age, gender, income, occupation, education), and behavioural (benefits sought and attitude toward products).
5. Results
5.1. Ferry passengers’ motivations
The most common classification of travel objectives was created by the World Tourism Organization. The objectives mentioned are: tourism, leisure, visiting relatives/friends, inter-ests and others (Central Statistical Office, 1998). Analysis of the tourists’ motivations, which
Table 2. the number of passengers travelling by stena Line ferries on the Gdynia–karlskrona route from 15.06 to 14.09 between the years 2007 and 2011.
source: (stena Line Poland Ltd, 2012).
Year The number of passengers carried in the period from 15.06 to 14.09
2007 68,9312008 56,3742009 60,2622010 63,6292011 76,259an average 65,091
ECONOMIC RESEARCH-EKONOMSKA ISTRAŽIVANJA 1009
are the driving force in choosing the form and type of a travel, enables us to characterise the types of tourists and understand the purchase process made by various market segments. These motives should be described in relation to goal-oriented forms of behaviour or holiday choice of activity (Cooper, Fletcher, Gilbert, & Wanhill, 1998, p. 37).
We conducted our analysis on the data collected from a group of 1257 respondents, 69% of the respondents were men (873 passengers) and 31% were females (384 passengers). In the study for Stena Line Poland Ltd. the travel motives were applied, i.e., tourism, visiting relatives and business-/work-related.
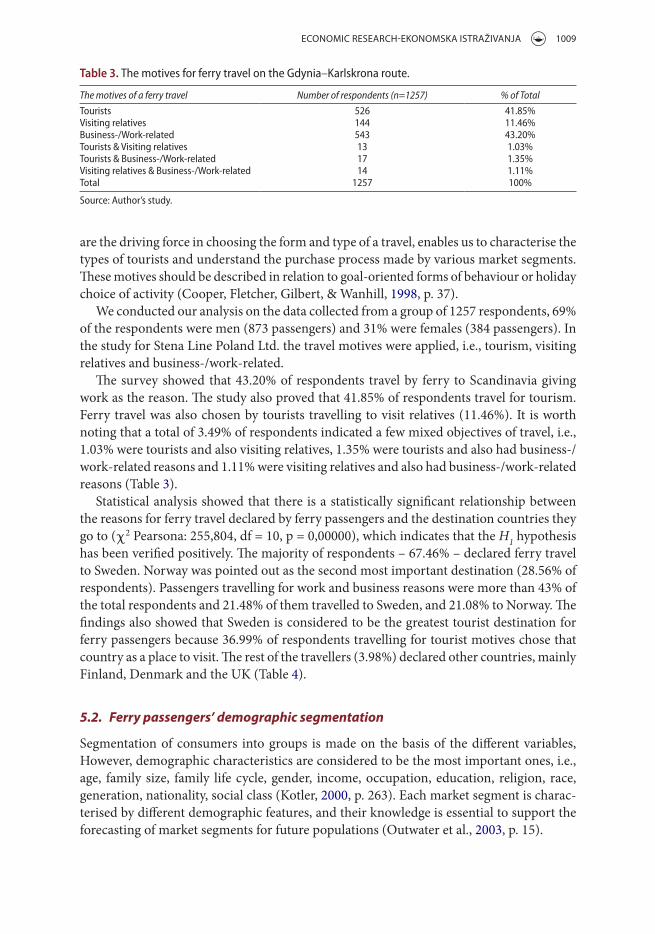
The survey showed that 43.20% of respondents travel by ferry to Scandinavia giving work as the reason. The study also proved that 41.85% of respondents travel for tourism. Ferry travel was also chosen by tourists travelling to visit relatives (11.46%). It is worth noting that a total of 3.49% of respondents indicated a few mixed objectives of travel, i.e., 1.03% were tourists and also visiting relatives, 1.35% were tourists and also had business-/work-related reasons and 1.11% were visiting relatives and also had business-/work-related reasons (Table 3).
Statistical analysis showed that there is a statistically significant relationship between the reasons for ferry travel declared by ferry passengers and the destination countries they go to (χ2 Pearsona: 255,804, df = 10, p = 0,00000), which indicates that the H1 hypothesis has been verified positively. The majority of respondents – 67.46% – declared ferry travel to Sweden. Norway was pointed out as the second most important destination (28.56% of respondents). Passengers travelling for work and business reasons were more than 43% of the total respondents and 21.48% of them travelled to Sweden, and 21.08% to Norway. The findings also showed that Sweden is considered to be the greatest tourist destination for ferry passengers because 36.99% of respondents travelling for tourist motives chose that country as a place to visit. The rest of the travellers (3.98%) declared other countries, mainly Finland, Denmark and the UK (Table 4).
5.2. Ferry passengers’ demographic segmentation
Segmentation of consumers into groups is made on the basis of the different variables, However, demographic characteristics are considered to be the most important ones, i.e., age, family size, family life cycle, gender, income, occupation, education, religion, race, generation, nationality, social class (Kotler, 2000, p. 263). Each market segment is charac-terised by different demographic features, and their knowledge is essential to support the forecasting of market segments for future populations (Outwater et al., 2003, p. 15).
Table 3. the motives for ferry travel on the Gdynia–karlskrona route.
source: author’s study.
The motives of a ferry travel Number of respondents (n=1257) % of Total
tourists 526 41.85%visiting relatives 144 11.46%Business-/Work-related 543 43.20%tourists & visiting relatives 13 1.03%tourists & Business-/Work-related 17 1.35%visiting relatives & Business-/Work-related 14 1.11%total 1257 100%

1010 J. KIZIELEWICZ ET AL.
Tabl
e 4.
the
rela
tions
hip
of tr
avel
des
tinat
ions
and
mot
ives
for f
erry
trav
el o
n th
e G
dyni
a–ka
rlskr
ona
rout
e.
χ2 P
ears
ona:
255
,804
, df =
10,
p =
0,0
0000
.so
urce
: aut
hor’s
stud
y.
A tr
avel
de
stin
atio
n
The
mot
ives
of a
ferr
y tr
avel
Tota
l%
of T
otal
Tour
ists
Visit
ing
rela
tives
Busin
ess-
/Wor
k-re
late
dTo
urist
s & V
isitin
g re
lativ
esTo
urist
s &
Busin
ess-
/Wor
k-re
late
dVi
sitin
g re
lativ
es &
Bu
sines
s-/W
ork-
rela
ted
(n =
526
)%
(n =
144
)%
(n =
543
)%
(n =
13)
%(n
= 1
7)%
(n =
14)
%(n
= 1
257)
%
swed
en46
536
.99%
856.
76%
270
21.4
8%9
0.72
%12
0.95
%6
0.48
%84
867
.46%
nor
way
37
2.94
%44
3.50
%26
521
.08%
30.
24%
30.
24%
70.
56%
359
28.5
6%o
ther
s24
1.91
%15
1.19
%8
0.64
%1
0.08
%2
0.16
%1
0.08
%50
3.98
%to
tal
526
41.8
5%14
411
.46%
543
43.2
0%13
1.03
%17
1.35
%14
1.11
%12
5710
0%

ECONOMIC RESEARCH-EKONOMSKA ISTRAŽIVANJA 1011
For the market segmentation of consumers travelling by ferry, based on the survey, a few selected demographic variables were applied, such as age, gender, education, occupation and income. Tourist activity is determined by the achievement of a certain cultural level. This level determines the choice of forms of tourism, intensity of tourist activity and influ-ences upon preferences concerning the management of leisure time. Researchers dealing with consumer demand consider that the level of education is the most relevant part of this culture (Kotler, 2000, p. 263). Numerous studies (Alegre & Garau, 2010, pp. 52–73; Duk-Byeong & Yoo-Shik, 2009, pp. 99–108; Mazilu & Mitroi, 2010, pp. 159–166; Swansona & Horridgeb, 2006, pp. 671–683) have shown the positive correlation between education and tourist activity, i.e., the higher the education a respondent has, the higher tendency for travelling she/he has. Generally speaking, education stimulates the desire to travel and increases awareness of travel opportunities (Cooper et al., 1998, p. 43).
The analysis of the structure of professions is also an important demographic factor used for conducting of the market segmentation and studying consumer behaviours. The structure of professions belongs to a subgroup of cultural variables (Kotler, 2000, p. 263). In the survey, the classification of occupations and specialties based on the International Standard of Classification of Occupations (ISCO) (2008) recommended by the International Labour Organisation (ILO) and EUROSTAT was applied. In Poland, this classification is adopted by the CSO and accepted by the Polish government (Minister of Labour & Social Policy, 2010). In the survey, three ranges of monthly salaries in Poland were applied – not exceeding the value of the lowest salary, not exceeding the average salary in 2012 (3496.82 zlotys) and higher than the average monthly salary (The Chancellery of the Prime Minister, 2012). Personal income is considered to be the most important economic factor influencing consumers’ behaviour (Nechita et al., 2010, p. 103). A low level of income may constitute a barrier for the development of demand for goods and services.
All these variables were used to define the main segments of ferry travellers: tourists, visiting relatives and business-/work-related travellers and also a few others who travel for other reasons. An analysis of the respondent’s socio-demographic characteristics is presented in Table 5.
A series of chi-square tests were applied to investigate if there was any statistical relation-ship between the motives of ferry travellers and the socio-demographic variables of each group. All the statistical analysis proved was that there is a significant relationship, which means that the H2 hypothesis was verified positively (Table 5).
The sample of the study amounted to a total of 1257 respondents. The majority of the respondents were male (69.45%), thus 30.55% were female. A large proportion of the respondents were aged between 24–34 (30.55%) and 35–44 (6.89%). More than 40% of the respondents declared a secondary education, and 35.40% declared high school diplomas. They were mostly specialists (14.56%) and engineers or other average employees (9.39%) and their monthly earnings were generally higher (40.89%) than the average salary in Poland (Table 5).
The study showed that in the main segment, in terms of numbers of travellers, there were passengers travelling for business- and work-related motives and they represented 43.20% of the total respondents (543 passengers), and 36.04% were males and 7.16% were females. Most people in this group were aged between 25 and 34 years (16.31% of all respondents), and 13.05% were in the age group 35–44 years. A survey also showed that this market segment was dominated by people with secondary school education (18.85%) as well as a

1012 J. KIZIELEWICZ ET AL.
Tabl
e 5.
seg
men
tatio
n of
ferr
y tr
avel
lers
by
soci
o-de
mog
raph
ic v
aria
bles
.
Soci
o-de
mog
raph
ic
Varia
bles
The
segm
ents
of f
erry
trav
elle
rs
Tour
ists
Visit
ing
rela
tives
Busin
ess/
Wor
k-re
-la
ted
Tour
ists &
Visi
ting
rela
tives
Tour
ists &
Bus
ines
s/W
ork-
rela
ted
Visit
ing
rela
tives
& B
usi-
ness
/Wor
k-re
late
dTo
tal n
umbe
r of
resp
onde
nts
% o
f Tot
al
(n=5
26)
(n=1
44)
(n=5
43)
(n=1
3)(n
=17)
(n=1
4)(n
=125
7)
n%
n%
n%
n%
n%
n%
Gen
der (χ
2 Pea
rson
a: 9
0,36
81, d
f = 5
, p =
,000
000)
Fem
ale
221
17.5
8%59
4.69
%90
7.16
%5
0.40
%5
0.40
%4
0.32
%38
430
.55%
mal
e30
524
.26%
856.
76%
453
36.0
4%8
0.64
%12
0.95
%10
0.80
%87
369
.45%
Age
(χ2 P
ears
ona:
84,
4079
, df =
25,
p =
,000
000)
18–2
4 ye
ars
907.
16%
171.
35%
604.
77%
10.
08%
10.
08%
30.
24%
172
13.6
8%25
–34
year
s12
710
.10%
393.
10%
205
16.3
1%2
0.16
%6
0.48
%5
0.40
%38
430
.55%
35–4
4 ye
ars
126
10.0
2%34
2.70
%16
413
.05%
40.
32%
80.
64%
20.
16%
338
26.8
9%45
–54
year
s82
6.52
%27
2.15
%82
6.52
%2
0.16
%2
0.16
%3
0.24
%19
815
.75%
55–5
9 ye
ars
463.
66%
141.
11%
191.
51%
20.
16%
00.
00%
00.
00%
816.
44%
60 y
ears
and
old
er55
4.38
%13
1.03
%13
1.03
%2
0.16
%0
0.00
%1
0.08
%84
6.68
%
Educ
atio
n (χ
2 Pea
rson
a: 7
7,54
74, d
f = 2
0, p
= ,0
0000
0)
Elem
enta
ry s
choo
l8
0.64
%10
0.80
%23
1.83
%0
0.00
%0
0.00
%0
0.00
%41
3.26
%Po
st E
lem
enta
ry
scho
ol14
1.11
%4
0.32
%13
1.03
%1
0.08
%0
0.00
%0
0.00
%32
2.55
%
Prof
essi
onal
sch
ool
645.
09`%
262.
07%
132
10.5
0%2
0.16
%1
0.08
%2
0.16
%22
718
.06%
seco
ndar
y sc
hool
204
16.2
3%56
4.46
%23
718
.85%
50.
40%
40.
32%
60.
48%
512
40.7
3%U
nive
rsity
stu
dies
236
18.7
7%48
3.82
%13
810
.98%
50.
40%
120.
95%
60.
48%
445
35.4
0%
Occ
upat
ion
(χ2 P
ears
ona:
249
,825
, df =
60,
p =
0,0
0000
)
an e
mpl
oyee
at t
he
sim
ple
wor
k15
1.19
%6
0.48
%55
4.38
%1
0.08
%1
0.08
%1
0.08
%80
6.36
%
an o
pera
tor /
as
sem
bler
of
mac
hine
ry a
nd
equi
pmen
t
131.
03%
100.
80%
554.
38%
00.
00%
20.
16%
20.
16%
826.
52%
an in
dust
rial w
orke
r / a
rtis
an17
1.35
%12
0.95
%87
6.92
%1
0.08
%0
0.00
%0
0.00
%11
79.
31%
a fa
rmer
/Gar
dene
r/
Fore
ster
/ Fi
sher
man
302.
39%
90.
72%
433.
42%
00.
00%
20.
16%
20.
16%
846.
68%

ECONOMIC RESEARCH-EKONOMSKA ISTRAŽIVANJA 1013
**1
EURo
= 4
,230
8 zl
otys
(1st
, jul
y, 2
012)
.; so
urce
: ow
n st
udy.
a pe
rson
al se
rvic
es
Empl
oyee
/ se
ller
493.
90%
110.
88%
332.
63%
20.
16%
00.
00%
00.
00%
967.
64%
an o
ffice
wor
ker
665.
25%
131.
03%
292.
31%
00.
00%
10.
08%
10.
08%
110
8.75
%an
eng
inee
r/
anot
her a
vera
ge
empl
oyee
383.
02%
110.
88%
614.
85%
30.
24%
10.
08%
10.
08%
118
9.39
%
a sp
ecia
list
836.
60%
171.
35%
745.
89%
10.
08%
70.
56%
70.
56%
183
14.5
6%th
e re
pres
enta
tive
of th
e pu
blic
au-
thor
ities
/man
ager
635.
01%
131.
03%
191.
51%
00.
00%
10.
08%
10.
08%
977.
72%
Retir
ed39
3.10
%18
1.43
%5
0.40
%1
0.08
%0
0.00
%0
0.00
%63
5.01
%an
une
mpl
oyed
221.
75%
70.
56%
211.
67%
30.
24%
20.
16%
20.
16%
564.
46%
a st
uden
t/Pu
pil
473.
74%
60.
48%
251.
99%
00.
00%
00.
00%
00.
00%
786.
20%
an a
noth
er p
rofe
s-si
on44
3.50
%11
0.88
%36
2.86
%1
0.08
%0
0.00
%0
0.00
%93
7.40
%
Mon
thly
Inco
me
(χ2 P
ears
ona:
49,
8836
, df =
10,
p =
,000
000)
up 1
500
zlot
ys *
* 12
59.
94%
463.
66%
897.
08%
40.
32%
10.
08%
20.
16%
267
21.2
4%15
01 z
loty
s - 3
750
zlot
ys *
* 22
718
.06%
473.
74%
184
14.6
4%5
0.40
%10
0.80
%3
0.24
%47
637
.87%
3750
zlo
tys*
* an
d m
ore
174
13.8
4%51
4.06
%27
021
.48%
40.
32%
60.
48%
90.
71%
514
40.8
9%
tota
l52
641
.85%
144
11.4
6%54
343
.20%
131.
03%
171.
35%
141.
11%
1257
100%
1014 J. KIZIELEWICZ ET AL.
university education (10.98%). In view of the fact that people in this group travel in order to reach their place of employment, it is also important to characterise the occupations which they represented and the level of their monthly income. In this market segment, there were representatives of all professions, but mostly they were employed as industrial workers and artisans (6.92%), and also specialists (5.98%). This segment includes such professions as: psychologists, sociologists, educators, physicians, veterinarians, dentists, first contact doctors, investment advisers and others. This market segment was also a top one business group, as most of this group (21.48%) were people with incomes above the national average salary.
In the second market segment we find people travelling by ferry for tourist reasons. They represented a total of 41.85% of all respondents (526 passengers), 24.26% were male (305 passengers) and 17.58% were females (221 passengers). As in the above-mentioned market segment, this was also dominated by people aged between 24–34 years (10.10% respondents) and 35–44 years (10.02%). The market segmentation regarding age confirms a worldwide trend in the market. It also confirms the analysis of the research carried out by Skrzeszewska, who noted that ‘taking into account the age structure of people travel-ling on tourist motives, people aged 25–44 years are the largest group (57.6%), but the smallest group – older than 65 years (45%). These data refer to the average values for the EU as a whole’(Skrzeszewska, 2012, p. 140). Passengers travelling for tourist motives were mainly university educated (18.77% of all respondents) and also secondary school educated (16.23%). This indicates that people with a secondary and university education travel more frequently. In this group, there were people employed mostly as specialists (6.60%) and as office workers (5.25%). Most respondents in this group had incomes on the level of the average salary in Poland (18.06%).
The third market segment was passengers travelling to visit relatives. They represent a total of 11.46% of all respondents (144 passengers), 6.76% were male and 4.69% were female. Similarly, as in the market segments mentioned above, they were mostly aged between 24–34 years (3.10%) and 35–44 years (2.70%). The study showed that most travellers in this group had a secondary education (4.46%) and also a university education (3.82%). Due to the fact that these passengers usually travel for other than commercial motives, the frequency dispersion is very large in the variety of professions. Travellers represented all groups of professions at the level of 1% of all respondents with no apparent dominance from any of them. However, when the monthly salaries of the passengers from this market segment were concerned, the full range was represented (Table 5).
Findings also allowed us to extract three smaller segments of travellers who indicated several various motives for their ferry travel, i.e.: (1) tourism and visiting relatives (n = 13); (2) tourism and business-/work-related (n = 17); and (3) visiting relatives and business-/work-related (n = 14). They represented a total of 3.49% of the respondents. As in the mar-ket segments analysed above, there were more men than women, aged from 24–34 years and 35–44 years with mostly secondary and university educations, representing mainly the specialist segment. Their monthly earnings were at the level of the national average, and only in the group of visiting relatives and business-/work-related were the earnings above the national average (0.71% of total respondents).
The most important group of consumers for the owners of shipping lines are those who make use of ferry services regulary and with a great frequency, because they provide per-mament incomes for ferry carriers and are considered to be a segment of loyal customers.

ECONOMIC RESEARCH-EKONOMSKA ISTRAŽIVANJA 1015
The study showed that only 15.27% of all passengers travelled frequently for business- and work-related motives and 14.64% travelkled occasionally for contract or seasonal work. In the market segment of passengers travelling for tourist motives 21.88% of all responedents confirmed that they were travelling for the first time and 15.57% travelled on an occasional basis.
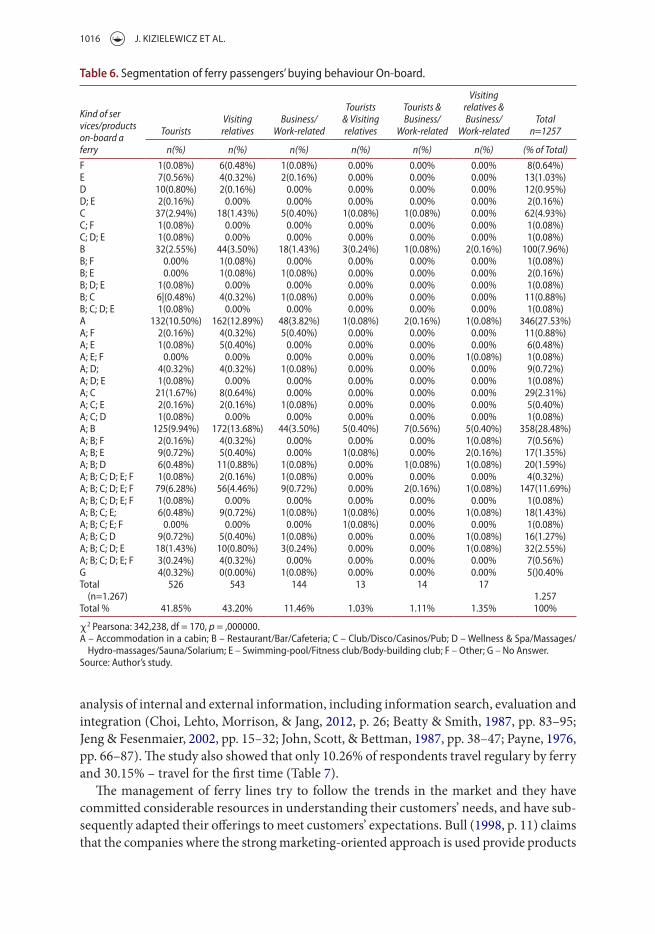
5.3. Ferry passengers’ buying behaviour
A statistical analysis of the study showed that there is a relationship between the travel motives of ferry passengers and the scope of services which they purchased on-board the ferry. The passengers travelling for tourist motives represented the largest segment of passen-gers purchasing the services on-board of the ferries. One hundred and thirty-two travellers from this segment (10.5% of the respondents) booked cabins, and 125 (9.94%) declared that they also benefitted from the catering services. In addition, between 1% and 2% of the total respondents declaring tourist motives used all other services offered on ships, i.e., wellness and spa, fitness clubs, etc.
As far as the passengers travelling to visit relatives are concerned, 162 of respondents (12.89%) booked cabins, and 172 (13.68%) said they took advantage of food services. A small demand for the extra services offered on-board was also noted in this group of consumers (4.46% of the respondents) (Table 6).
The lowest activity when it comes to purchasing services on-board the ferries was reported in the segment of travelling for business motives. A small group in this segment limited their purchases primarily to accommodation (3.82%) and catering (1.43%). Forty-four passengers of this segment (3.5%) confirmed that they benefitted from both accommodation and food on-board. Other services were not of interest to them (Table 6).
Statistical analysis by applying chi-square tests (χ2 Pearsona: 342,238, df = 170, p = 0,000000) showed that there is a statistically significant relationship between the motives of ferry travel declared by passengers and the goods and services purchased by travellers on-board the ferries. In spite of the fact that people travelling for work and business motives were the largest group of ferry travellers on the route from Gdynia to Karlskrona, on the basis of the above discussion, we may conclude that our working hypothesis the H3 hypothesis – that the majority of them do not purchase any extra services that are offered on-board the ferry – was verified positively (Table 6).
6. Discussion
Every operator, including ferry carriers, should be aware that the lack of knowledge about the factors influencing consumers’ decisions about purchasing tourist products can be the cause of the inefficient management of the tourist market (Cooper et al., 1998, p. 31). Regular market research, tracking changes in consumer behaviour and evaluation of the reaction of consumers to new products, is an activity that should constitute an important phase of the marketing efforts in the enterprises, thereby giving them a competitive advantage in the market (Babaita, Munteanu, & Ispas, 2010, p. 99; Pasca, 2013, p. 265). One has to remember that ‘consumer decision-making is interpreted as the process of acquiring information for and integrating information into related purchase decisions’. Researchers reported that the consumers’ behaviour and decision-making by them is associated with the process of
1016 J. KIZIELEWICZ ET AL.
analysis of internal and external information, including information search, evaluation and integration (Choi, Lehto, Morrison, & Jang, 2012, p. 26; Beatty & Smith, 1987, pp. 83–95; Jeng & Fesenmaier, 2002, pp. 15–32; John, Scott, & Bettman, 1987, pp. 38–47; Payne, 1976, pp. 66–87). The study also showed that only 10.26% of respondents travel regulary by ferry and 30.15% – travel for the first time (Table 7).
The management of ferry lines try to follow the trends in the market and they have committed considerable resources in understanding their customers’ needs, and have sub-sequently adapted their offerings to meet customers’ expectations. Bull (1998, p. 11) claims that the companies where the strong marketing-oriented approach is used provide products
Table 6. segmentation of ferry passengers’ buying behaviour on-board.
χ2 Pearsona: 342,238, df = 170, p = ,000000.a – accommodation in a cabin; B – Restaurant/Bar/cafeteria; c – club/Disco/casinos/Pub; D – Wellness & spa/massages/
hydro-massages/sauna/solarium; E – swimming-pool/Fitness club/Body-building club; F – other; G – no answer.source: author’s study.
Kind of ser vices/products on-board a ferry
TouristsVisiting relatives
Business/Work-related
Tourists & Visiting relatives
Tourists & Business/
Work-related
Visiting relatives & Business/
Work-relatedTotal
n=1257
n(%) n(%) n(%) n(%) n(%) n(%) (% of Total)
F 1(0.08%) 6(0.48%) 1(0.08%) 0.00% 0.00% 0.00% 8(0.64%)E 7(0.56%) 4(0.32%) 2(0.16%) 0.00% 0.00% 0.00% 13(1.03%)D 10(0.80%) 2(0.16%) 0.00% 0.00% 0.00% 0.00% 12(0.95%)D; E 2(0.16%) 0.00% 0.00% 0.00% 0.00% 0.00% 2(0.16%)c 37(2.94%) 18(1.43%) 5(0.40%) 1(0.08%) 1(0.08%) 0.00% 62(4.93%)c; F 1(0.08%) 0.00% 0.00% 0.00% 0.00% 0.00% 1(0.08%)c; D; E 1(0.08%) 0.00% 0.00% 0.00% 0.00% 0.00% 1(0.08%)B 32(2.55%) 44(3.50%) 18(1.43%) 3(0.24%) 1(0.08%) 2(0.16%) 100(7.96%)B; F 0.00% 1(0.08%) 0.00% 0.00% 0.00% 0.00% 1(0.08%)B; E 0.00% 1(0.08%) 1(0.08%) 0.00% 0.00% 0.00% 2(0.16%)B; D; E 1(0.08%) 0.00% 0.00% 0.00% 0.00% 0.00% 1(0.08%)B; c 6|(0.48%) 4(0.32%) 1(0.08%) 0.00% 0.00% 0.00% 11(0.88%)B; c; D; E 1(0.08%) 0.00% 0.00% 0.00% 0.00% 0.00% 1(0.08%)a 132(10.50%) 162(12.89%) 48(3.82%) 1(0.08%) 2(0.16%) 1(0.08%) 346(27.53%)a; F 2(0.16%) 4(0.32%) 5(0.40%) 0.00% 0.00% 0.00% 11(0.88%)a; E 1(0.08%) 5(0.40%) 0.00% 0.00% 0.00% 0.00% 6(0.48%)a; E; F 0.00% 0.00% 0.00% 0.00% 0.00% 1(0.08%) 1(0.08%)a; D; 4(0.32%) 4(0.32%) 1(0.08%) 0.00% 0.00% 0.00% 9(0.72%)a; D; E 1(0.08%) 0.00% 0.00% 0.00% 0.00% 0.00% 1(0.08%)a; c 21(1.67%) 8(0.64%) 0.00% 0.00% 0.00% 0.00% 29(2.31%)a; c; E 2(0.16%) 2(0.16%) 1(0.08%) 0.00% 0.00% 0.00% 5(0.40%)a; c; D 1(0.08%) 0.00% 0.00% 0.00% 0.00% 0.00% 1(0.08%)a; B 125(9.94%) 172(13.68%) 44(3.50%) 5(0.40%) 7(0.56%) 5(0.40%) 358(28.48%)a; B; F 2(0.16%) 4(0.32%) 0.00% 0.00% 0.00% 1(0.08%) 7(0.56%)a; B; E 9(0.72%) 5(0.40%) 0.00% 1(0.08%) 0.00% 2(0.16%) 17(1.35%)a; B; D 6(0.48%) 11(0.88%) 1(0.08%) 0.00% 1(0.08%) 1(0.08%) 20(1.59%)a; B; c; D; E; F 1(0.08%) 2(0.16%) 1(0.08%) 0.00% 0.00% 0.00% 4(0.32%)a; B; c; D; E; F 79(6.28%) 56(4.46%) 9(0.72%) 0.00% 2(0.16%) 1(0.08%) 147(11.69%)a; B; c; D; E; F 1(0.08%) 0.00% 0.00% 0.00% 0.00% 0.00% 1(0.08%)a; B; c; E; 6(0.48%) 9(0.72%) 1(0.08%) 1(0.08%) 0.00% 1(0.08%) 18(1.43%)a; B; c; E; F 0.00% 0.00% 0.00% 1(0.08%) 0.00% 0.00% 1(0.08%)a; B; c; D 9(0.72%) 5(0.40%) 1(0.08%) 0.00% 0.00% 1(0.08%) 16(1.27%)a; B; c; D; E 18(1.43%) 10(0.80%) 3(0.24%) 0.00% 0.00% 1(0.08%) 32(2.55%)a; B; c; D; E; F 3(0.24%) 4(0.32%) 0.00% 0.00% 0.00% 0.00% 7(0.56%)G 4(0.32%) 0(0.00%) 1(0.08%) 0.00% 0.00% 0.00% 5()0.40%total
(n=1.267) 526 543 144 13 14 17
1.257total % 41.85% 43.20% 11.46% 1.03% 1.11% 1.35% 100%

ECONOMIC RESEARCH-EKONOMSKA ISTRAŽIVANJA 1017
corresponding to the clients’ needs and are more efficient in the market. There is a clear need to acquire knowledge on customer preferences and motives of purchasing behaviour and to learn about the impact of marketing tools on the process of purchasing goods by consumers. Finally, it is worth noting that various market segments are extracted from purchase behaviours (Cooper et al., 1998, p. 31). Market segmentation can be applied at lots of levels in order to define broader types of buyers who differ in their product needs or buying responses (Kotler et al., 1999, p. 379).
There are sectors in the market, in which an individual approach to a client is a big advantage. Every client has various expectations, preferences, and needs and it is good if entrepreneurs use distinct affiliate marketing programmes tailored to different clients (Kotler et al., 1999, p. 379). However, as a rule, these are the industries that offer products and services of the highest standard and quality. However, in a case of ferry travel, individual preparation of products for an individual customer’s needs is economically unreasonable. Therefore, ferry carriers are geared to meet the needs of large groups of customers repre-senting a specific segment of the market.
7. Conclusions and implications
We identified six customer segments travelling by Stena Line ferries on the Gdynia–Karlskrona route. These were named according to ferry travel motives: (1) tourists; (2) vis-iting relatives’ (3) business-/work-related travellers, and also three others segments which are a mix of the previous segments. To profile these segments we analysed the generic structure of the tourist demand for ferry travel in terms of demographic variables and purchasing behaviour of passengers on-board ferries.
The dominant segment is represented by ferry passengers travelling for business- and work-related motives. However, the segment represented by passengers travelling for tourist motives is also very strong, but the market segment relating to passengers visiting relatives represents the smallest market share. The working hypothesis relating to purchasing behav-iour was verified positively and this is also useful information for ferry carriers because revenues from selling the ferry tickets are enriched with benefits from the sale of goods and services on-board vessels.
Table 7. the frequency of ferry travel by respondents.
source: author’s study.
The frequency of ferry travel
TouristsVisiting relatives
Business-/Work-related
Tourists &Visiting relatives
Tourists& Business-/
Work-related
Visiting relatives
&Business-/Work-related
Total number
% of Total
n(%) n(%) n(%) n(%) n(%) n(%)
i travel for the first time
275(21.88%) 25(1.99%) 72(5.73%) 4(0.32%) 1(0.08%) 2(0.16%) 37930.15%
i travel regularly
24(1.91%) 9(0.72%) 95(7.56%) 0(0.00%) 0(0.00%) 1|(0.08%) 12910.26%
i travel occasionally
198(15.57%) 73(5.81%) 184(14.64%) 7(0.56%) 12(0.95%) 4(0.32%) 47838.03%
i travel very often
29(2.31%) 37(2.94%) 192(15.27%) 2(0.56%) 4(0.32%) 7(0.56%) 27121.56%
total 526(41.85%) 144(11.46%) 543(43.20%) 13(1.03%) 17(1.35%) 14(1.11%) 1257 100%
1018 J. KIZIELEWICZ ET AL.
The survey provided interesting insights and useful information both for ferry carriers and entities in the tourist sector in the Baltic Sea region, i.e.:
• Extracting the key market segments on ferry travel offered in the Baltic Sea region.• Preparation of tenders, which will be better adapted to the needs and expectations of
potential customers.In an era of strong competition for customers, led by the ship-own-ers of ferry lines, the chances of success are given to companies who care about their customers’ satisfaction and meet their expectations. One proactive tactic is to contin-uously follow and collect foresight information by conducting regular market research to track changes in consumers’ behaviours.
Disclosure statement
No potential conflict of interest was reported by the authors.
ORCID
Joanna Kizielewicz http://orcid.org/0000-0001-7415-9928
References
Alegre, J., & Garau, J. (2010). Tourist satisfaction and dissatisfaction. Annals of Tourism Research, 37, Elsevier, 52–73.
Babaita, C., Munteanu, V., & Ispas, A. (2010). The effects of ethical marketing in tourism. Latest Trends on Cultural Heritage and Tourism, 3rd WSEAS International Conference on Cultural Heritage and Tourism (CUHT’10) Corfu Island, Greece 22-24 (July), 99.
Badoe, D. A., & Miller, E. J. (1998). An automated segmentation procedure for studying variations in mode choice behavior. Journal of Advanced Transportation, 32, 190–215.
Beatty, S. E., & Smith, S. M. (1987). External search effort: An investigation across several product categories. Journal of Consumer Research, 14, 83–95.
Bhat, C. R. (1997). An endogenous segmentation mode choice model with an application to intercity travel. Transportation Science, 31, 34–48.
Bull, A. (1998). The economics of travel and toruism (2nd ed.). Melbourne: Longman. 11.Central Statistical Office. (1998). The methodology of the European Union in the field of tourism
statistics. Warsaw: Author.Choi, S., Lehto, X. Y., Morrison, A. M., & (Shawn) Jang S. (2012). Structure of travel planning processes
and information use patterns. Journal of Travel Research, 51, SAGE Publications, 26.Cooper, C. H., Fletcher, J., Gilbert, D., & Wanhill, S. (1998). Tourism. Principles and practice (2nd
ed.). New York, NY: Longman, 31–43.Dolnicar, S., Kaiser, S., Lazarevski, K., & Leisch, F. (2011). Biclustering, overcoming data dimensionality
problems in market segmentation. Journal of Travel Research, 51, SAGE Publications, 41.Duk-Byeong, P., & Yoo-Shik, Y. (2009). Segmentation by motivation in rural tourism: A Korean case
study Yoon. Tourism Management, 30, Elsevier, 99–108.Golob, T. F. (2001). Joint models of attitudes and behavior in evaluation of the San Diego I-15
congestion pricing project. Transportation Research Part A: Policy and Practice, 35, 495–514.Golob, T. F., & Hensher, D. A. (1998). Greenhouse gas emissions and Australian commuters’ attitudes
and behavior concerning abatement policies and personal involvement. Transportation Research Part D : Transport and Environment, 3, 1–18.
Graham, M., & Russell, V. (2001). Inverclyde ferry services: A passenger segmentation analysis. Journal of Vacation Marketing, 7, (July), 221–233.

ECONOMIC RESEARCH-EKONOMSKA ISTRAŽIVANJA 1019
Jeng, J., & Fesenmaier, D. R. (2002). Conceptualizing the travel decision-making hierarchy: A review of recent developments. Tourism Analysis, 7, 15–32.
Johansson, L. (2006). Competiotion in the ferry industry a case study of the Helsinki-Tallin route. NHTV, Breda: MA European Tourism Management University, 22–30.
John, D. R., Scott, C. A., & Bettman, J. R. (1987). Sampling data for covariation assessment: The effect of prior beliefs on search patterns. Journal of Consumer Research, 13, 38–47.
Kaczmarczyk, S. (1995). Badania marketingowe, metody i techniki [Market research, methods and techniques]. Warsaw: Polish Economic Publishing House.
Kizielewicz, J. (2012). Theoretical considerations on understanding of the phenomena of marine tourism in Poland and the world. Scientific Journals, 31, Zeszyty Naukowe / Akademia Morska w Szczecinie, Szczecin: Maritime University of Szczecin, 113.
Kizielewicz, J. (2013). Themed cruises, as a trend in marine tourism. [in:]Scientific Journals, 33, 30–31. Zeszyty Naukowe / Akademia Morska w Szczecinie, Szczecin: Maritime University of Szczecin.
Kotler, Ph. (2000). Marketing management, the millenium edition, international edition. New Jersey: Prentice Hall Europe, 274.
Kotler, Ph., Armstrong, G., Saunders, J., & Wong, V. (1999). Principles of marketing (2nd ed.). New Jersey: Prentice Hill Europe, 379.
Kujawa, J. (Ed.). (1999). Organizacja i technika transportu morskiego [The organization and techinques of the sea transportation] (pp. 120–121). Gdańsk: University of Gdańsk.
Lieberman, W., Schumacher, D., Hoffman, A., & Wornum, C. (2001). Creating a new century of transit opportunity: Strategic planning for transit. Transportation Research Record, 1747, 60–67.
Matear, S. M. (1991). The existence and use of benefit segments in the Irish sea ferry market (A thesis submitted in partial fulfilment of the requirements of the Council for National Academic Awards for the Degree of Doctor of Philosophy). Centre for International Shipping and Transport Polytechnic South West (Plymouth) Collaborating Establishment: Sealink Stena Line Ltd. (August), 7–502.
Mazilu, M., Mitroi, S. (2010). Demographic, social, economic and geographic features – shaping factors of the tourist market. Romanian Economic and Business Review, 5, Elsevier Ltd., 159–166.
Mazurek-Łopacińska, K. (Ed.). (1997). Badania marketingowe, Podstawowe metody i obszary zastosowania [Market research, basic methods and application areas]. Wrocław: The Wrocław University of Economics.
Middletton, V. T. C. (1999). Marketing w turystyce [Marketing in tourism]. Warszawa: PART, 77.Minister of Labour and Social Policy. (2010). Law regulations of the minister of labour and social
policy on the classification of professions and specialities, 27th, April 2010, Dz. U. Nr 82 poz. 537, Polish State Government (April).
Miotke-Dzięgiel, J. (2002). Turystyka morska [Maritime ourism] (p. 20). Gdańsk: The University of Gdańsk.
Najder, J. (2013). Rozwój polskich portów morskich [The development of the polish seaports] (p. 59). Gdańsk: The University of Gdańsk.
Nechita, D., Muntean, M.-C., Sarpe, D., & Nistor, C. (2010). Tourism market competitiveness in southeastern Europe. Latest Trends on Cultural Heritage and Tourism, 3rd WSEAS International Conference on Cultural Heritage and Tourism (CUHT’10), Corfu Island, Greece, 22–24, (July), 103.
Outwater, M. L., Castleberry, S., Shiftan, Y., Ben-Akiva, M., Zhou, Y. S., & Kuppam, A. (2003). Use of structural equation modeling for an attitudinal market segmentation approach to mode choice and ridership forecasting. Moving Through Nets: The Physical and Social Dimensions of Travel 10th International Conference on Travel Behavior Research Lucerne, Washington, 10–15 (August), 15.
Outwater, M. L., Modugula, V., Bhatia, P., & Castleberry, S. (2003). A market segmentation approach to mode choice and ferry ridership forecasting. Proceedings of the Ninth TRB Conference on the Application of Transportation Planning Methods, Baton Rouge, Louisiana, 6–10, (April), 170–180.
Outwater, M., Modugula, V., Castleberry, S., & Bhatia, P. (2004). A market segmentation approach to mode choice and ferry ridership forecasting. Transportation Research Record, 1872, 71–79.
Pasca, M. D. (2013). Human behavior related to the elements of a tourist location. Advances in Environment, Ecosystems and Sustainable Tourism, Advances in Environment, Ecosystems and Sustainable Tourism Proceedings of the 11th International Conference on Environment,

1020 J. KIZIELEWICZ ET AL.
Ecosystems and Development (EED ‘13) Proceedings of the 2nd International Conference on Sustainable Tourism and Cultural Heritage (STACH ‘13), Brasov, Romania, 1-3, (June), 265.
Payne, J. W. (1976). Task complexity and contingent processing in decision making: An information search and protocol analysis. Organizational Behavior and Human Performance, 16, 366–387.
Ren, C., & Blichfeldt, B. S. (2011). One clear image? Challenging simplicity in place branding. Scandinavian Journal of Hospitality and Tourism, 11, 416–434, (December), 418.
Šimková, E. (2011). The importance of tourism research; Examples of research in tourism activities in the Czech Republic. Recent Researches in Tourism and Economic Development, Proceedings of the 1st International Conference on Tourism and Economic Development (TED ‘11), University Center Drobeta Turnu Severin, Romania, October 27–29, 232.
Skrzeszewska, K. (2011). Współpraca przedsiębiorstw, jako próba przezwyciężenia niekorzystnych zmian w ich otoczeniu [Cooperation enterprises, as an attempt to overcome the adverse changes in their environment]. In Zeszyty Naukowe Uniwersytetu Ekonomicznego w Poznaniu nr 170, E. Urbanowska-Sojkin (Ed.), Wybory strategiczne w przedsiębiorstwach, Rezultaty ekonomiczne, organizacyjne i społeczne [Scientific Research of the University of Economics in Poznań No 170] (pp. 272). Poznań: Uniwersytet Ekonomiczny w Poznaniu.
Skrzeszewska, K. (2012). Popyt na usługi noclegowe świadczone w basenie Morza Bałtyckiego na tle popytu na usługi turystyczne w Unii Europejskiej [The demand for accommodation services provided in the Baltic Sea basin on the background of the demand for tourist services in the European Union]. Zeszyty Naukowe nr 697, Ekonomiczne Problemy Usług nr 82, Uniwersytet Szczeciński, Szczecin, 140 [Scientific Research No 697, Economic Issues of Services No 82, The University of Szczecin, Szczecin, 140].
Stena Line Poland Ltd. (2012). Historia rozwoju Stena Line – maszynopis [The history of Stena Line]. Gdynia: Sales & marketing Management of Stena Line Poland Ltd.
Stena Line Poland Ltd. (2014). Retrieved from http://www.stenaline.pl/do-szwecjiSwansona, K. K., & Horridgeb, P. E. (2006). Travel motivations as souvenir purchase indicators.
Tourism Managemen, 27, Elsevier, 671–683.Tangeland, T. (2011). Why do people purchase nature-based tourism activity products? A norwegian
case study of outdoor recreation. Scandinavian Journal of Hospitality and Tourism, 11, (December), 438.
The Chancellery of the Prime Minister. (2012). Rozporządzenie Rady Ministrów z 13 września 2011 r. w sprawie wysokości minimalnego wynagrodzenia za pracę w 2012 [Regulation of the Council of Ministers of the 13th of September, 2011 on an amount of minimum remuneration for work in 2012], (Dz. U. z 14.09.2011 poz. 1141). Retrieved from http://isap.sejm.gov.pl/KeyWordServlet?viewName
The International Standard Classification of Occupations ISCO. (2008). Retrieved from http://www.ilo.org/public/english/bureau/stat/isco/
Urbanyi-Popiołek, I. (2014). Promem przez Bałtyk [By ferry onn the Baltic Sea] [in:] Namiary na morze i handel, 04/12, II, Organ Krajowej Izby Gospodarki Morskiej [About the sea and trade, 04/12, II, Authority of The National Chamber of Maritime Affairs], 10.
Zasępa, R. (1962). Badania statystyczne metodą reprezentacyjną, Zarys teorii i praktyki [Surveys by a representative method. An outline of the theory and practice] (p. 126). Warsaw: Polish Economic Publishing House.