the role of mammals & seabirds in marine ecosystemscetus.ucsd.edu/sio133/pdf/7 - role of mms in...
TRANSCRIPT

The Role of Marine Mammals in Marine Ecosystems
Lisa T. Ballance
SIO 133 – Marine Mammal Biology
Spring 2013
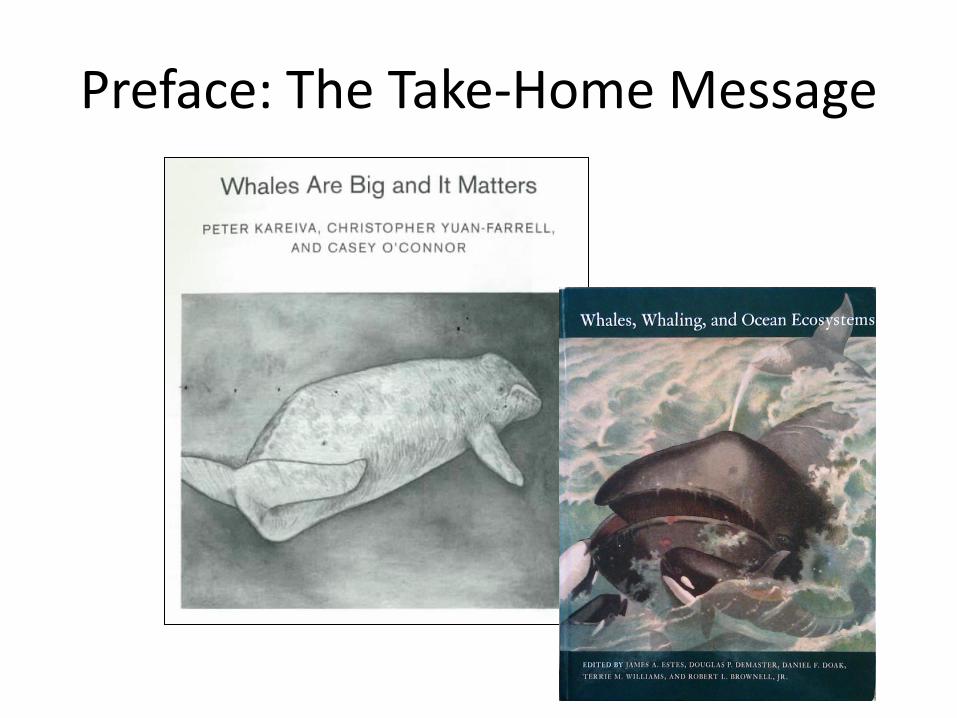
Preface: The Take-Home Message

Sources: RL Brownell pers. comm.; synthesis by Hewitt and Lipsky 2009
~15.7 million tons of whale in the world’s marine ecosystems
Current Population Estimates
Southern Hemisphere North Pacific North Atlantic Total Mean Body Mass
(tons) Tons of Whale in the
Ecosystem
Humpback Whale 56,000 20,000 12,000 88,000 31.8 2,798,400
Right Whales 12,000 550 450 13,000 53.0 689,000
Gray Whales 20,000 --- --- 20,000 25.0 500,000
Blue Whales 4,600 2,000 2,000 8,600 69.2 595,120
Fin Whales 15,000 11,000 37,000 62,000 42.3 2,622,600
Sei Whales 10,000 10,000 12,400 32,400 19.9 644,760
Bryde's Whales 50,000 39,000 5,000 94,000 13.2 1,240,800
Minke Whales 500,000 30,000 185,000 715,000 7.0 5,005,000
Bowhead Whales --- 12,000 8,000 20,000 80.0 1,600,000
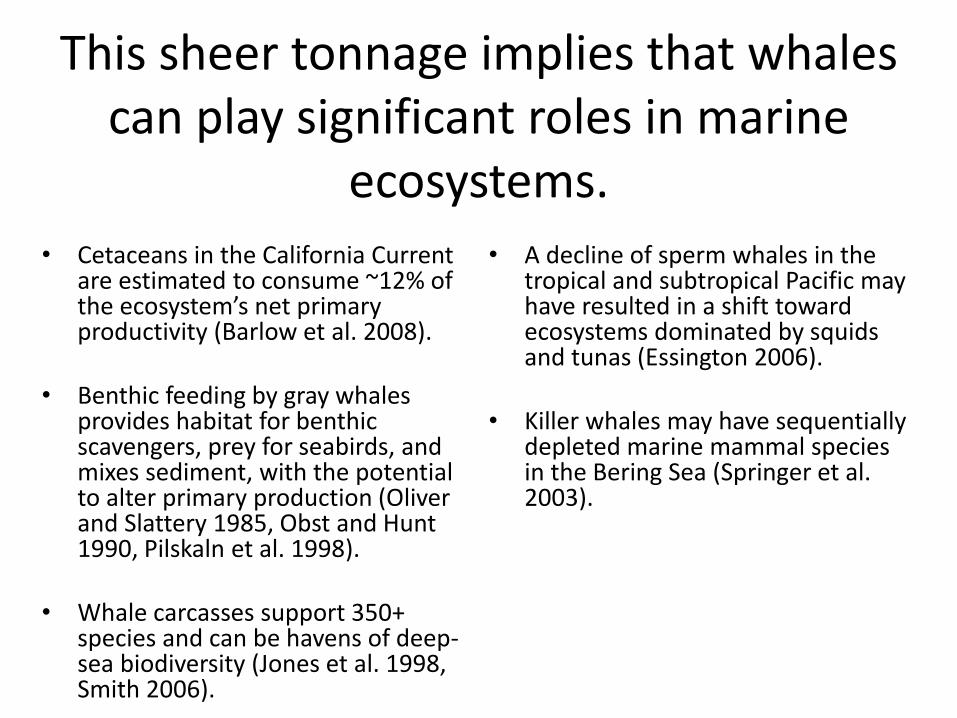
This sheer tonnage implies that whales can play significant roles in marine
ecosystems. • Cetaceans in the California Current
are estimated to consume ~12% of the ecosystem’s net primary productivity (Barlow et al. 2008).
• Benthic feeding by gray whales provides habitat for benthic scavengers, prey for seabirds, and mixes sediment, with the potential to alter primary production (Oliver and Slattery 1985, Obst and Hunt 1990, Pilskaln et al. 1998).
• Whale carcasses support 350+ species and can be havens of deep-sea biodiversity (Jones et al. 1998, Smith 2006).
• A decline of sperm whales in the tropical and subtropical Pacific may have resulted in a shift toward ecosystems dominated by squids and tunas (Essington 2006).
• Killer whales may have sequentially depleted marine mammal species in the Bering Sea (Springer et al. 2003).

“The irony is that, although whales have become a symbol of the human capacity for greedy overharvest and a rallying point for environmental activists, we know surprisingly little about their ecological role.”
Total Number of Publications Number (%) Addressing Whale Ecology, Species
Interactions, Effects on Ecosystem Processes
Marine Ecology (1999-2003) 106 0 (0%)
Marine Mammal Science (1985-2003) 94 (focused on whales) 17 (18%)
Kareiva et al. 2006

The Role of Whales in Southern Ocean Ecosystems
Lisa T. Ballance, Robert L. Pitman, and Robert L. Brownell, Jr.
Southwest Fisheries Science Center, NMFS, NOAA, U.S.A.
Symposium on Living Whales in the Southern Ocean, Puerto Varas, Chile,
March 2012

The Southern Ocean* Ecosystem
*South of the Polar Front

Whales and the Southern Ocean Ecosystem: A trophic interactions
perspective
• Whales as Consumers
• Whales as Competitors
• Whales as Prey
* = Cetaceans
*

Whales as Consumers
“The combination of great abundance, large body size, and endothermic metabolic demands make
odontocete and mysticete whales some of the most voracious consumers in the oceans. As such, they
have the potential to place extraordinary pressures on marine resources.” (Williams 2006)

When we think of consumers in an ecosystem context, we ask questions
like:
• What is eaten?
• How much?
• How does this consumption impact the ecosystem?

Krill
E. superba, E. crystallorophias, T. macrura
“Krill-based ecosystem” in about one quarter of the ~32 million sq. km of the Southern Ocean (Siegel & Loeb 1995)
Estimated Abundance Mean Mass (tons)
Ingestion Rate/Day
(1,000 kcal)
No. Days Spent
Feeding % Krill in
Diet
Total Krill Consumed Annually (millions of
tons)
Antarctic Blue Whales 2,300 83 3,708 120 100 1.1
Fin Whales 15,000 48 2,415 120 100 4.7
Sei Whales 20,000 17.5 1,096 120 80 2.3
Humpback Whales 55,000 26.5 1,517 120 100 10.8
Antarctic Minke Whales 500,000 7 535 120 100 34.5
53.4
How much krill is consumed?
Sources: RL Brownell pers. comm.; synthesis by Hewitt and Lipsky 2009

~53.4 million tons krill consumed annually by 5 species of whales
• For some perspective, annually: – 104,182 – 211,984 metric tons harvested: 2000 – 2011 (SC-CAMLR
2011) – 190 million tons consumed by baleen whales alone prior to
commercial exploitation (Laws 1985) – 250 million tons consumed by current populations of all krill predators
(whales, birds, pinnipeds, fish, squid: Miller and Hampton 1989)
• Despite much careful attention, estimates of krill consumption are invariably associated with a great degree of uncertainty (e.g., Leaper and Lavigne 2007)
• How does this consumption impact the ecosystem?*
*remember for later

Squid • Sperm whales
– 10,000 males (Brownell, pers. comm.)
• Beaked whales – 599,300 Ziphiid whales (almost all H.
planifrons) in the Southern Ocean (Kasamatsu & Joyce 1995)
– H. planifrons – the most abundant cetacean in the Southern Ocean?
• Killer whales? (Type B)
• How much squid is consumed?*
• How does this consumption impact the ecosystem?*
*Big Unanswered Questions Durban & Pitman, unpublished data

Other Species
• Killer whales as consumers of:
Fish, penguins, seals, whales

Fish - Ross Sea KWs “Type C”
Krahn et al. 2008

Penguins – Gerlache KWs “Mini Type B” Pitman & Durban 2010

Seals - Pack Ice KW “Big Type B” Pitman & Durban 2011

Whales – “Type A” Pitman & Ensor 2003
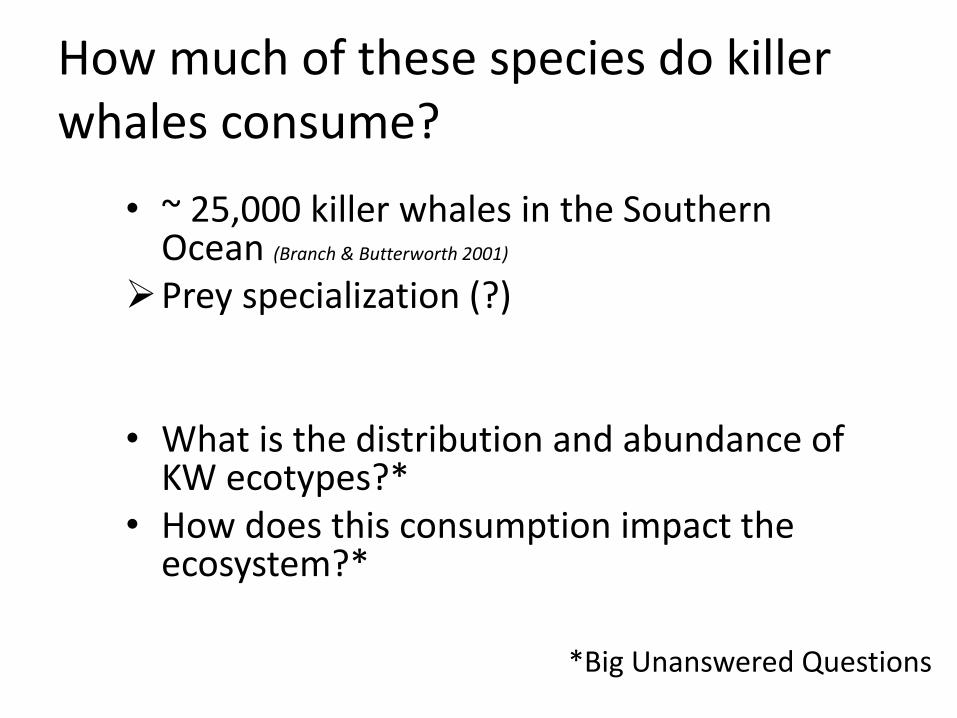
How much of these species do killer whales consume?
• ~ 25,000 killer whales in the Southern Ocean (Branch & Butterworth 2001)
Prey specialization (?)
• What is the distribution and abundance of KW ecotypes?*
• How does this consumption impact the ecosystem?*
*Big Unanswered Questions

Whales as Competitors
“…competition from any one species may profoundly affect the population dynamics
and carrying capacity of another, either through its effect on their mutual resources
or by direct interference.” (Rickleffs 1990)

Competitive Release: The “Krill Surplus” Hypothesis
• > 2 million whales removed from Southern Hemisphere (Clapham and Baker 2006)
• Up to 150 million tons krill/yr unconsumed (Laws
1977)
• Theoretically could support addition of 200-300
million penguins per year (Sladen 1964; Emison 1968)
• Growth in penguin populations attributed to “krill
surplus” (Sladen 1964; Emison 1968; Conroy 1975; Croxall and Kirkwood 1979; Croxall et al. 1981; Laws 1985; Rootes 1988)

Antarctic Fur Seals: the best example of competitive release?
• Remarkable recovery from commercial exploitation at South Georgia
• Populations above pre-exploitation levels?
Hodgson and Johnston 1997
South Georgia • Range expansion to
Signy, South Orkneys, due to population increase
• Numbers 78-94% > than during past 6570 (±60) radiocarbon years – exceeding range of natural variability
Boyd 1993

Competition for krill is occurring.
• At Anvers Island, there are significant relationships between humpback whale abundance, the size-frequency distribution of krill targeted by Adélie Penguins, and penguin foraging success (1993-2001).
Humpback whales and Adélie Penguins appear to target and share similar spatio-temporal prey resources.
Friedlander et al. 2008

This competition can result in changes in abundance (of predators and prey).
• Penguin population declining • Interpretation
– Predators reaching K – Competition for krill is
occurring – Fur seals are outcompeting
penguins
• At Bird Island, South Georgia, Antarctic fur seals and Macaroni Penguins exploit the same size and population of krill
• % krill in fur seal diet > in penguin diet
Antarctic Fur Seal
Macaroni Penguin
Macaroni Penguin
Antarctic Fur Seal
Barlow et al. 2002

Competition can result in niche partitioning.
• Near the South Shetland Islands baleen whales show a krill size-dependent relationship with krill abundance hotspots
Santora et al. 2010
Krill Hotspots Whale Hotspots
Smal
l M
ediu
m
Larg
e
Fin
M
inke
H
um
pb
ack

More on competition
• Clapham, Phillip J., and R. L. Brownell. 1996. The potential for interspecific competition in baleen whales. REPORT-INTERNATIONAL WHALING COMMISSION 46: 361-370.

Whales as Prey
“The ecological role of large whales as prey is the most controversial of
the three potential food web pathways …” (Estes et al. 2006)

Whales are prey for killer whales ….
…. or humans.

Killer whale predation may drive:
• Baleen whale migration (Corkeron & Connor 1999)
• Trophic cascades: prey switching due to loss of large whales (Branch & Williams
2006)

Sequential megafaunal collapse in the north Pacific ocean: an ongoing legacy of industrial whaling?
Springer, Estes, vanVliet, Williams, Doak, Danner, Forney, & Pfister 2003

Background • Abrupt decline of western stock of Steller sea lions
(Eumetopias jubatus) across northern North Pacific and southern Bering Sea
• Widely attributed to nutritional limitation due to a) climate regime shift, and/or b) competition with fisheries
• However – Adults and pups have better body condition, reduced foraging
effort and field metabolic rates relative to other SSL stocks – Abundance and trends in abundance of SSL prey incongruent
with hypothesis of prey limitation as driver of SSL decline – Abundance of seabird populations feeding on SSL prey species
stable or increasing over same time period
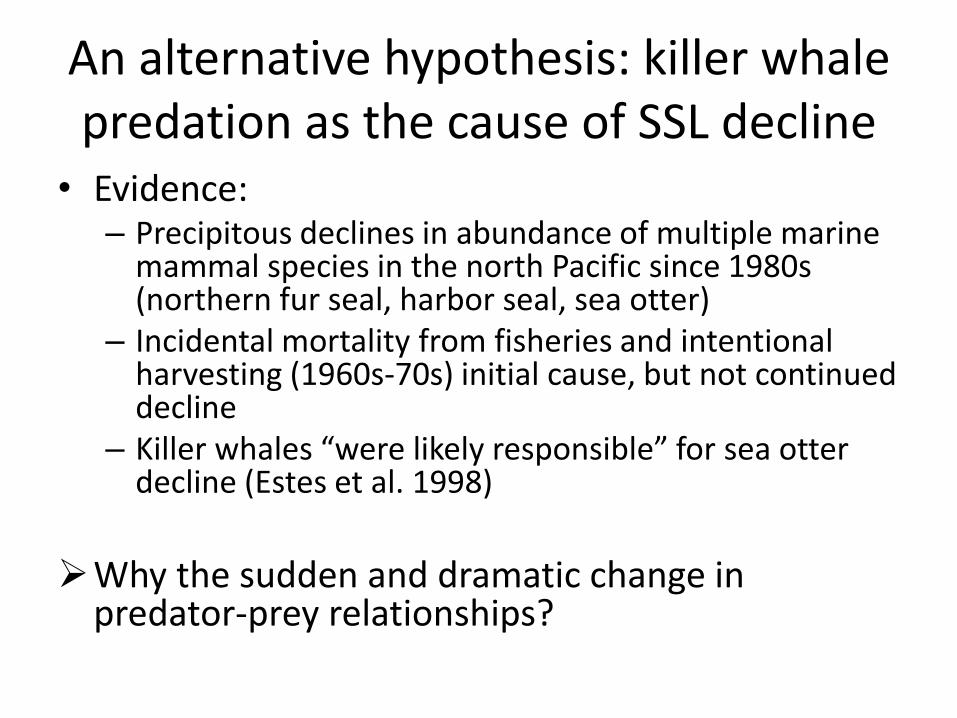
An alternative hypothesis: killer whale predation as the cause of SSL decline
• Evidence: – Precipitous declines in abundance of multiple marine
mammal species in the north Pacific since 1980s (northern fur seal, harbor seal, sea otter)
– Incidental mortality from fisheries and intentional harvesting (1960s-70s) initial cause, but not continued decline
– Killer whales “were likely responsible” for sea otter decline (Estes et al. 1998)
Why the sudden and dramatic change in
predator-prey relationships?

Sequential megafaunal collapse: i) killer whales are predators of large whales
• Killer whales attack and consume all species of great whales
• Scars from KW teeth indicate attacks are common – 20-40% of individuals in some species typical – >60% of individuals in Southern Ocean sperm whales
• Migration of baleen whales proposed as an evolutionary
response to KW predation
• Failure of bowhead whales in eastern Canadian Arctic to recover from commercial whaling proposed as result of KW predation

Sequential megafaunal collapse: ii) industrial whaling depleted large whales in the north Pacific • N Pacific right, bowhead,
humpback, blue, gray whales depleted by early 1900s
• Early post-war industrial whaling focused in far western N Pacific primarily by Japan on fin, sei, sperm whales (A)
• Progressive spread and intensification of whaling to east by Japan and Soviet Union, as stocks to the east were depleted (B, C)
• By early 1970s depletion of stocks drives whaling south to exploit Bryde’s and female sperm whales(D)
• 1949-1969 minimum of half a million whales removed from N Pacific and southern Bering Sea
• Combined current biomass of existing whales (1990s – early 2000s) ~14% of pre-exploitation levels

Sequential megafaunal collapse: iii) in response to depletion of their prey by industrial whaling, killer whales shifted to other species
• Sequential declines of pinnipeds and sea otters consistent with this hypothesis – Initial decline began following
collapse of industrial whaling – Harbor seals & fur seals first –
higher energy density and/or less aggressive behavior?
– Ultimate shift to smaller and less energetically rich prey (sea otters) due to exhaustion of other prey species

Killer whales and marine mammal trends in the north Pacific – a re-examination of evidence for sequential megafauna collapse and the prey-switching hypothesis
“…we suggest that there are little data to support this hypothesis and much to contradict it.”
Wade and 23 others 2007

• Spatial scale and geographic region is important
Data presented in Springer et al. are not consistent with a regional approach, e.g.,
– Peak of whale biomass removal differs
– Known KW predation patterns differ

• In all three regions, the biomass of large baleen & sperm whales is 5-24 x biomass of pinnipeds
Argues against prey switching *from* large whales
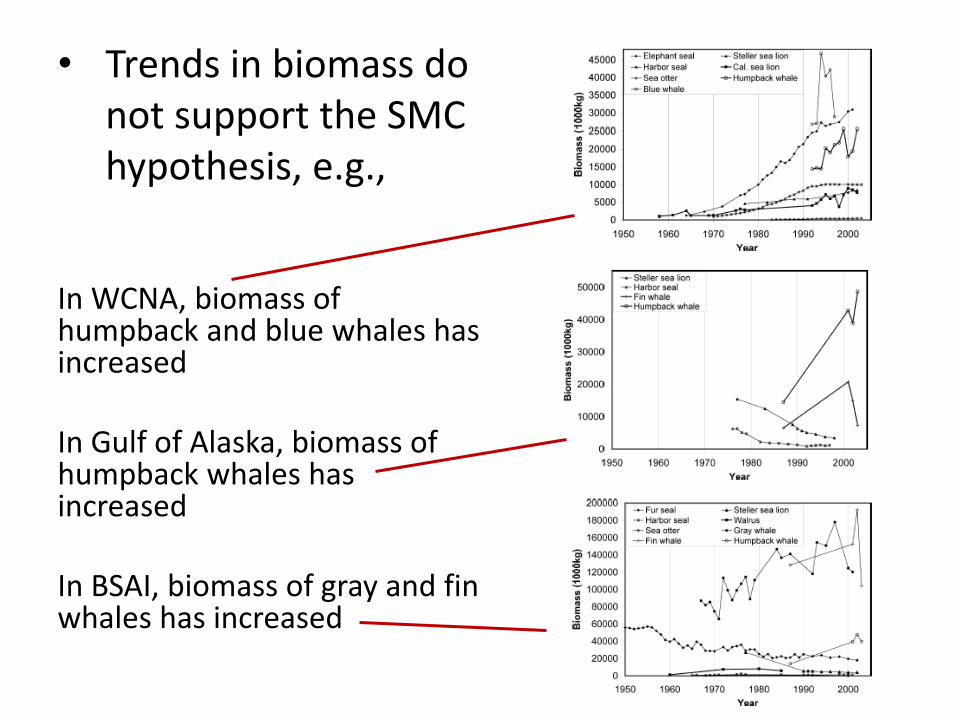
• Trends in biomass do not support the SMC hypothesis, e.g.,
In WCNA, biomass of humpback and blue whales has increased In Gulf of Alaska, biomass of humpback whales has increased In BSAI, biomass of gray and fin whales has increased

Additionally,
• There was no large population of mammal-eating KWs that preyed primarily upon large whales.
• Minke whales and small cetaceans have likely always been available
• Unidirectional prey switching of extended duration is rare and maladaptive
• The decline of pinnipeds and sea otters was not sequential

The sequential megafaunal collapse hypothesis: testing with existing data
DeMaster et al. 2006
“… statistical tests of the timing of the declines do not support the assumption that pinniped declines were sequential”

Assumption 3: Pinniped declines in the 1970s and 1980s in the BSAI were sequential
Three populations of pinnipeds from same gegraphic region began to decline simultaneously
Springer et al. 2003
DeMaster et al. 2007

This debate continues

The Ecosystem Consequences of Consuming, Competing, and Predation:
Whales as Drivers of Food Web Restructuring (“Top-Down Forcing”)
“Despite its popularity among Southern Ocean ecologists 25 years ago, [the] top-down hypothesis
(consumer effects on resources) has been largely replaced by an emphasis on bottom-up
explanations …” (Ainley et al. 2009)

Trophic cascades in the western Ross Sea
• ~Nov – Adelie penguins (incubating
eggs) feed on crystal krill – A. silverfish feed on c. krill
• ~Dec – Penguin chicks hatch; adults
feed themselves and chicks on krill
– minke whales arrive and feed on krill
• ~Jan – Krill abundance declines – Penguins and minke whales
shift to silverfish – Older silverfish become
cannibalistic
• ~Feb – Silverfish abundance declines – Penguin foraging duration
and distance increases – Minke whales leave to forage
elsewhere – Grazing pressure on
phytoplakton relaxes
Ainley et al. 2006 and references therein

So, how do whales impact Southern Ocean ecosystems?
• They remove a huge amount of krill from the system (and maybe a huge amount of squid, penguins, seals, and whales)
• They impact other krill predators
• They may drive evolutionary responses of their prey
• They have the potential to restructure food webs

• Let us not forget, the Southern Ocean is a highly perturbed marine ecosystem
– Whale populations are recovering
– The planet is warming
– Fisheries are removing krill and fish (and whales)

The Big Unanswered Questions
• Which is more important: top-down or bottom-up forcing – *Both* are important – As whales recover, top-down forcing deserves more attention
• Trophic linkages: which direction and how strong? – Squids: what are their trophic links with whales and their
importance? – What is the distribution and abundance of killer whale ecotypes
and to what extent do the specialize in (or switch) prey? – What are the indirect effects of food web restructuring?
• Are whales a year-round component of the ecosystem?

Durban and Pitman 2011
Satellite-tracked adult female Type B killer whale 13 Feb, 2010 for 109 days 30° S; 22.4° C North of 60, swim velocity ≥ 5-10 km/hr Returned 1 June, 2010

Reading
• Ballance, L.T., R.L. Pitman, R.P. Hewitt, D.B. Siniff, W.Z. Trivelpiece, P.J. Clapham, and R.L. Brownell, Jr. 2006. The removal of large whales from the Southern Ocean: evidence for long-term ecosystem effects? Pp. 215-230 in: Whales, whaling, and ocean ecosystems. J.A. Estes, D.P. DeMaster, D.F. Doak, T.M. Williams, and R.L. Brownell, Jr. (eds.). University of California Press.