the role of genetics and immune mechanisms in the
TRANSCRIPT
i
The Role of Genetics and Immune Mechanisms in the
Pathogenesis of Diabetic Retinopathy
A THESIS SUBMITTED TO
UNIVERSITY OF HEALTH SCIENCES IN PARTIAL FULLFILMENT OF THE REQUIREMENT FOR THE DEGREE
OF DOCTOR OF PHILOSOPHY
IN IMMUNOLOGY
By
Dr NADEEM AFZAL (M.B.B.S) MSc MEDICAL IMMUNOLOGY (UK)
Supervised by
Prof. Dr. A. H. NAGI M.B.B.S., Ph.D., FCPS., FRCP., FRCPath., FCPP
Head of Pathology Department, University of Health Sciences
Co-supervisor Prof Dr Ghazala Jaffery
MBBS, PhD Immunology Head, Department of Pathology
Services Institute of Medical Sciences Lahore
UNIVERSITY OF HEALTH SCIENCES
LAHORE, PAKISTAN

ii
CERTIFICATE
It is hereby certified that thesis is based on the results of experiments carried out by Dr.
Nadeem Afzal and that it has not been previously presented for PhD degree. Dr. Nadeem
Afzal has done this research work under our supervision. He has fulfilled all the
requirements and is qualified to submit the accompanying thesis for the degree of PhD in
the subject of Immunology.
Supervisor Professor Dr. A. H. Nagi M.B.B.S., Ph.D., FCPS., FRCP., FRCPath., FCPP Head, Department of Pathology University of Health Sciences, Lahore Pakistan Dated: -------------------------

iii
DEDICATED TO
My late sister, my family and respectable teachers for their continuous support and
assistance.

iv
ACKNOWLEDGEMENTS
All praises and thanks are for Allah Almighty, The Lord of the worlds, The All Merciful
All Compassionate, Who gave me the strength to complete this study. May Peace and
Blessing of Allah Almighty be upon Last Prophet Muhammad, the mercy for all
mankind.
I gratefully acknowledge the invaluable guidance, sympathetic attitude, moral support,
inspiring comments and strong motivation of my supervisor Prof. Dr. Abdul Hanan
Nagi, Department of Histopatholoy, University of Health Sciences, Lahore, whose
insight made me understand the important and essential aspects of my research.
Doing this research project on diabetes was an exciting experience. This would have been
impossible without the help and guidance of all working in Department of
Immunology. I am particularly indebted to my learned supervisor Professor Dr. A. H.
Nagi for always encouraging my efforts during this work and for providing insightful
feedback during all the stages of the research described in this thesis. His vision was
fundamental in shaping my research and I am very grateful for having had the
opportunity to learn from him.
I am always extremely grateful to (Late) Prof. Mahmood Ahmed Chaudary, Chairman
Board of Governors, University of Health Sciences Lahore, Prof. Dr. Malik Hussain
Mubashar, Ex-Vice Chancellor, University of Health Sciences Lahore and Prof I. A.
Naveed, Acting Vice Chancellor, University of Health Sciences Lahore for providing the
opportunities in the University to pursue research excellence.
I cannot fully express my gratitude to Col. Javaid Iqbal, and Dr Ahsan Ullah, Director
Administration, University of Health Sciences Lahore, for their untiring commitments,
passion for work and extraordinary dedication. Their efforts have created congenial
environment in the University.

v
I am extremely grateful to Prof Shakeela Zaman Head Department of Preventive
Medicine, Children Hospital and Institute of Child Health Lahore for her valuable time,
expertise, and patience in guiding and analyzing the data. I am also thankful to Prof Dr
Asim Mumtaz, Head Department of Allied Health Sciences, Dr Saqib Mehmood,
Department of Human Genetics and all my colleagues at UHS for their continuous
support and encouragement. My special gratitude to Dr Abu Zafar; in-charge Amin
Hayat Memoral Center Samanabad Lahore and the staff of this center to obtain samples
from diabetic patients. My heart filled appreciation for all the subjects who donated their
blood and without their assistance this study would not have been possible.
I would like to thank Dr. (Maj) Tipu, Pathologist (Immunologist), Combined Military
Hospital Chunia for his valuable contribution, in the form of time and expertise during
analyzing the data of flowcytometer.
These acknowledgements would be incomplete without mentioning the names of my
colleagues; Ms Afia Abbas, and Khursheed Javeed working in the Department of
Immunology for their valuable contribution in this research project.

vi
List of Abbreviations
ELISA Enzyme linked immunosorbant assay
IL Interleukin
Treg T regulatory cell
nTreg Natural T regulatory cell
Tr1 Type 1 regulatory T cells
HbA1c Glycosylated hemoglobin
WHO World Health Organization
T2DM Type-2 diabetes mellitus
IGT Impaired glucose tolerance
CRP C-reactive protein
BMI Body mass index
IDF International diabetic federation
IR Insulin resistance
PDR Proliferative diabetic retinopathy
DR Diabetic retinopathy
LTA Lymphotoxin-A
eNOS endothelial nitric oxide synthase
ITGA2 Integrin alpha-2
ACE Angiotensin converting enzyme
VEGF Vascular endothelial growth factor
ICAM Intracellular adhesion molecule-1
ADBR3 β3-adrenergic receptor gene
CD Cluster differentiation
EDN1 Endothelin-1
EPO Erythropoietin
ESRD End stage renal disease
HFE Haemochromatosis
SLE Systemic lupus erythmatosus
RA Rheumatoid arthritis

vii
HLA Human leucocyte antigen
GP Glycoprotein
TNF-α Tumor necrosis factor-alpha
Ig Immunoglobulin
IgM Immunoglobulin-M
IgG Immunoglobulin-G
Th cells T-helper cells
TCR T cell receptor
CDR Complementarity determining region
TGF-β Tumor growth factor-beta
GITR Glucocorticoid induced tumor receptor
CTLA-4 Cytotoxic T-lymphocyte Antigen 4
CXCR3 chemokine receptor-3
IPEX Immune dysregulation, polyendocrinopathy,
enteropathy, X-linked syndrome
GITR Glucocorticoid induced tumor necrosis factor
Receptor
PD-L1 Programmed cell death-ligand 1
SDF-1α Stromal cell derived factor-1 alpha
MCP Monocyte chemoattractant protein
ENA Epithelial neutrophils activator
IP Interferon-induced protein
MIP Macrophage inflammatory protein
VCAM Vascular cell adhesion molecule
SS Sjogren syndrome
CEPI Corneal epithelial cell line
AGEs Advanced glycation end products
VH Vitreous hemorrhage
AqH Aqueous humor
EIU Endotoxin-induced uveitis
RPE Retinal pigment epithelium

viii
PVR Proliferative vitreoretinopathy
EAU Experimental autoimmune uveitis
Th-17 cells T-helper 17 cells
NKT Natural killer T cells
iNKT Invariant natural killer T cells
GM-CSF Granulocyte monocyte colony stimulating factor
MCP-1 Monocyte chemotactic protein 1
CIA Collagen induced arthritis
EAE Experimental induced encephalomyelitis
IRBP Intra-retinal binding protein
UA Ursolic acid
IBD Inflammatory bowel diseases
CD Crohn’s disease
UC Ulcerative colitis
ESCC Oesophageal squamous cell carcinoma
ANCA Anti-neutrophil cytoplasmic antibody
AAV ANCA-associated vasculitis
FALS Forward angle light scatter-side scatter
SSC Side scatter
BD Becton Dickinson
MoA Monoclonal Antibodies
FITC Fluorescein isothiocyanate
PE Phycoerythrin
PerCP Peridinin-chlorophyll-protein
COPD Chronic obstructed pulmonary disease
°C Degree Centigrade
µ Micron
ANOVA Analysis of Variance
CI Confidence Interval Fig Figure
IQR Interquartile Range

ix
mg Milligram
SPSS Statistical Package for Social Sciences
Std. Error (S.E) Standard Error
WHO World Health Organization
HTM Human trabecular meshwork
PCR Polymerase chain reaction
RFLP Restriction fragment length polymorphism
HbA1c Glycosylated hemoglobin

x
List of Appendices ----------------------------------------------------134
Appendix A ----------------------------------------------------------------------------------134
Consent form
Appendix B --------------------------------------------------------------------------------------------------------------------------135
Patient history sheet

xi
List of Figures
1. Calibration and fluorescence signal compensation using CellQuest Pro software (BD)
and Calibrite Beads ----------------------------------------------------------------------------50
2. Electronic adjustment and fluorescence signal compensation of cytometer using
CellQuest Pro software.-----------------------------------------------------------------------51
3. FALS-SSC two parameter dot-plot showing the circumscribed gate (R1) containing
lymphocytes --------------------------------------------------------------------------------------52
4. CD45-SSC two parameter dot-plot showing the circumscribed acquisition gate (R2)
containing lymphocytes. ---------------------------------------------------------------------52
5. CD4-CD25 two parameter dot-plot showing that CD4+CD25+ T cell population is not
discernable from CD4+CD25- T cells. -----------------------------------------------------53
6. Determination of criteria for cells to be CD25 positive. ---------------------------------54
7. Determination of criteria for CD4 negative and CD4 positive cells. -------------------55
8. Histograms showing gating strategy using isotype control and statistics of
histogram ---------------------------------------------------------------------------------------56
9. Histograms showing gating strategy using isotype control and statistics of Histogram
----------------------------------------------------------------------------------------------------57
10. Histograms showing gating strategy using isotype control and statistics of Histogram
----------------------------------------------------------------------------------------------------58
11. Histograms showing gating strategy using isotype control and statistics of Histogram
----------------------------------------------------------------------------------------------------59
12. Histograms showing gating strategy using isotype control and statistics of Histogram
----------------------------------------------------------------------------------------------------60

xii
13. Histograms showing gating strategy using isotype control and statistics of Histogram
----------------------------------------------------------------------------------------------------61
14. Histograms showing gating strategy using isotype control and statistics of Histogram
----------------------------------------------------------------------------------------------------62
15. IL-6 ELISA Standard Curve Report --------------------------------------------------------67
16. IL-17 ELISA Standard Curve Report -------------------------------------------------------68
17. Bgl-II polymorphism of different subjects -------------------------------------------------75
18. Bgl-II polymorphism of different subjects -------------------------------------------------76
19. Bgl-II polymorphism of different subjects -------------------------------------------------77
20. Bgl-II polymorphism of different subjects -------------------------------------------------78

xiii
List of Tables
1. Sequences of primers for the amplification of loci -------------------------------------45
2. Different standards and their concentrations used for the determination of IL-6 and
IL-17 cytokines in ELISA technique -----------------------------------------------------66
3. Demographic data of the subjects ---------------------------------------------------------71
4. Comparisons of different variables in different groups --------------------------------73
5. Frequency of Bgl-II Polymorphism in Group-I, Group-II and Group-III by PCR ----
--------------------------------------------------------------------------------------------------80
6. Comparison of variables (Cytokines) in different groups ------------------------------82
7. Comparison of CD4CD25 T cells and Treg cells (by Flow cytometer) among different groups ------------------------------------------------------------------------------84
8. Logistic Regression Model for Group-II and Group-III---------------------------------86
9. Logistic Regression Model for Group-I and Group-III---------------------------------89

xiv
CONTENTS
Acknowledgements ----------------------------------------------------------------------------iv
List of abbreviations --------------------------------------------------------------------------------------------------------------vi
List of appendices ------------------------------------------------------------------------------x
List of figures ------------------------------------------------------------------------------------xi
List of tables -----------------------------------------------------------------------------------xiii
Abstract ------------------------------------------------------------------------------------------xix
Introduction and Literature Review----------------------------------------------------1
1.1. Diabetes mellitus -------------------------------------------------------------------------------1
1.2. Type-2 diabetes mellitus-----------------------------------------------------------------------1
1.3. Ethnicity and predisposition to diabetes -----------------------------------------------2
1.4. Diabetes and pregnancy -----------------------------------------------------------------------3
1.5. Factors contributing to development of diabetes ------------------------------------------3
1.6. Inflammatory markers -------------------------------------------------------------------------3
1.7. Immunological abnormalities ----------------------------------------------------------------4
1.8. Complications of diabetes---------------------------------------------------------------------4
1.9. Diabetic retinopathy ----------------------------------------------------------------------------5
1.10. Factors contributing to diabetic retinopathy -----------------------------------------------6
1.10.1. Duration of diabetes ------------------------------------------------------------------------6
1.10.2. Platelets --------------------------------------------------------------------------------------6
1.11. Diagnosis of diabetic retinopathy -----------------------------------------------------------7
1.12. Genetic Basis of Diabetic Retinopathy ----------------------------------------------------7
1.12.1. Candidate genes -----------------------------------------------------------------------------8
1.12.1.1. Endothelin-1 (EDN1) --------------------------------------------------------------------8
1.12.1.2. Leptin --------------------------------------------------------------------------------------8
1.12.1.3. Erythropoietin ----------------------------------------------------------------------------8
1.12.1.4. Hemochromatosis (HFE) gene ---------------------------------------------------------9

xv
1.12.1.5. Prolactin ---------------------------------------------------------------------------------9
1.12.1.6. α2β1 gene -------------------------------------------------------------------------------10
1.12.1.7. Association of Bgl II polymorphism with diabetic retinopathy ------------------11
1.13. Changing concept of type 2 diabetes mellitus ------------------------------------------12
1.14. Diabetic retinopathy and autoimmunity -------------------------------------------------13
1.15. Gender bias in autoimmunity -------------------------------------------------------------14
1.16. T regulatory cells (Tregs) ------------------------------------------------------------------16
1.16.1. Treg and autoimmunity ------------------------------------------------------------------16
1.16.2. Types of Treg cells -----------------------------------------------------------------------16
1.16.3. Murine CD4+ T cells ---------------------------------------------------------------------17
1.16.4. Regulation of Treg cells -----------------------------------------------------------------17
1.16.5. Foxp3 ---------------------------------------------------------------------------------------18
1.16.6. Surface markers for Treg cells ----------------------------------------------------------19
1.16.7. Role of co-stimulatory molecules -------------------------------------------------------19
1.17. Cytokines ------------------------------------------------------------------------------------20
1.17.1. IL-6 -----------------------------------------------------------------------------------------20
1.17.1.1. Production and action of IL-6 --------------------------------------------------------20
1.17.1.2. IL-6 and Eye ----------------------------------------------------------------------------21
1.17.1.3. IL-6 and diabetic retinopathy ---------------------------------------------------------21
1.17.1.4. IL-6 in the eye and in the serum ------------------------------------------------------22
1.17.1.5. IL-6 disturbs immune privilege site --------------------------------------------------23
1.17.1.6. Anti-IL-6 as treatment modality ------------------------------------------------------24
1.17.1.7. Role of IL-23 ----------------------------------------------------------------------------24
1.17.1.8. IL-6 and Treg cells ---------------------------------------------------------------------25
1.17.1.9. IL-6 and Th17 cells ---------------------------------------------------------------------26
1.17.2. IL-17 ----------------------------------------------------------------------------------------26
1.17.2.1. Role of IL-17 ----------------------------------------------------------------------------26
1.17.2.2. Pro-inflammatory cytokine ------------------------------------------------------------27
1.17.2.3. Th1 vs Th17 -----------------------------------------------------------------------------27
1.17.2.4. IL-17 in human diseases and in animal models ------------------------------------28
1.17.2.5. Concepts about IL-17 formation ------------------------------------------------------29

xvi
1.17.2.6. Role of IL-6 in IL-17 production -----------------------------------------------------29
1.17.2.7. IL-27 --------------------------------------------------------------------------------------30
1.17.2.8. IL-23 --------------------------------------------------------------------------------------31
1.17.2.9. IL-21 --------------------------------------------------------------------------------------31
1.17.2.10. Plasticity of Th17 ----------------------------------------------------------------------32
1.17.2.11. Difference of IL-17 in humans and animals ---------------------------------------33
1.17.2.12. γδ T cells and Th17 -------------------------------------------------------------------33
1.17.2.13. Invariant natural killer T cells -------------------------------------------------------34
1.17.2.14. IL-17 and diseases --------------------------------------------------------------------34
1.17.2.15. IL-17 and type-1 diabetes ------------------------------------------------------------35
1.17.2.16. Prognostic value of IL-17 ------------------------------------------------------------36
1.17.2.17. IL-17 Foxp3 Treg cells ---------------------------------------------------------------37
1.17.2.18. Variation in the therapeutic effect of targeting IL-17 ----------------------------37
1.17.2.19. IL-17 and other cytokines manipulation -------------------------------------------38
1.17.2.20. Protective side of IL-17 --------------------------------------------------------------38
2. Hypothesis ------------------------------------------------------------------------------------40
3. Aims and Objectives --------------------------------------------------------------------40
4. Material and Methods ----------------------------------------------------------------41
4.1. Study design -----------------------------------------------------------------------------------41
4.2. Setting ------------------------------------------------------------------------------------------41
4.3. Duration ----------------------------------------------------------------------------------------41
4.4. Sample size ------------------------------------------------------------------------------------41
4.5. Sample size ------------------------------------------------------------------------------------41
4.6. Sampling technique ---------------------------------------------------------------------------41
4.7. Sample selection ------------------------------------------------------------------------------41
4.7.1. Inclusion criteria ----------------------------------------------------------------------------41
4.7.2. Exclusion criteria ---------------------------------------------------------------------------42
4.8. Genotyping of Bgl II Polymorphism -------------------------------------------------------42

xvii
4.9. Analysis of cytokines ------------------------------------------------------------------------42
4.10. Analysis of T regulatory cells -------------------------------------------------------------42
4.11. Blood Sample collection -------------------------------------------------------------------43
4.12. DNA extraction------------------------------------------------------------------------------43
4.12.1. Protocol -------------------------------------------------------------------------------------43
4.12.2. dNTPs ---------------------------------------------------------------------------------------44
4.12.3. TE buffer -----------------------------------------------------------------------------------44
4.12.4. Primers --------------------------------------------------------------------------------------44
4.13. Electrophoresis ------------------------------------------------------------------------------45
4.14. DNA Recipe ---------------------------------------------------------------------------------45
4.15. Polymerase Chain Reaction (PCR) -------------------------------------------------------45
4.16. Restriction Fragment Length Polymorphism (RFLP) ----------------------------------45
4.17. Cytokine determination ---------------------------------------------------------------------46
4.17.1. Kit contents --------------------------------------------------------------------------------46
4.17.2. Reconstitution and Reagents Preparation ----------------------------------------------46
4.17.3. ELISA protocol ----------------------------------------------------------------------------47
4.17.4. Calculation of results ---------------------------------------------------------------------48
4.17.5. Cross reactivity ----------------------------------------------------------------------------48
4.18. Flowcytometry -------------------------------------------------------------------------------48
4.18.1. Immunostaining procedure --------------------------------------------------------------48
4.18.2. Flowcytometry / Immunophenotyping -------------------------------------------------49
4.19. Data Acquisition -----------------------------------------------------------------------------51
4.20. Sample analysis ------------------------------------------------------------------------------53
4.21. Markers used for Immunophenotyping ---------------------------------------------------63
4.22. Gating strategy to identify CD4dimCD25bright T cells -----------------------------------63
4.23. Reagent preparation ------------------------------------------------------------------------64
4.23.1. DNA Extraction ---------------------------------------------------------------------------64
4.23.1.1. Reagents Required ----------------------------------------------------------------------64
4.23.1.2. dNTPs -----------------------------------------------------------------------------------64
4.23.1.3. Preparation of working solution of dNTPs ------------------------------------------64
4.23.1.4. TE buffer ---------------------------------------------------------------------------------65

xviii
4.23.1.5. Preparation of Master Mix for primers ----------------------------------------------65
4.24. ELISA IL-6 and IL-17 ----------------------------------------------------------------------66
4.24.1. Statistical Analysis of IL-6 --------------------------------------------------------------67
4.24.2. Statistical Analysis of IL-17 -------------------------------------------------------------68
4.25. Data Analysis --------------------------------------------------------------------------------69
5. Results -----------------------------------------------------------------------------------------70
5.1. Demographic data of the subjects ----------------------------------------------------------70
5.2. Different continuous variables --------------------------------------------------------------72
5.3. Comparisons of different variables among the groups -----------------------------------72
5.4. Frequency of BglII Polymorphism in Group-I, Group-II and Group-III by PCR/RFLP
---------------------------------------------------------------------------------------------------------74
5.5. Cytokines Assessment -----------------------------------------------------------------------81
5.6. Data of Assessment of Cells by Flow cytometer -----------------------------------------83
5.7. Logistic Regression Model for Group-II and Group-III ---------------------------------85
5.8. Logistic Regression Model for Group-I and Group-III ----------------------------------87
6. Discussion ------------------------------------------------------------------------------------89
7. Conclusion ----------------------------------------------------------------------------------106
8. Suggestions ---------------------------------------------------------------------------------107
9. References ----------------------------------------------------------------------------------108
10. List of Appendices ---------------------------------------------------------------------136
Appendix A --------------------------------------------------------------------------------------136
Consent form
Appendix B --------------------------------------------------------------------------------------137
Data form

xix
ABSTRACT
Diabetes mellitus affects millions of people worldwide especially in Asia, Africa and
South America. It can cause many serious complications such as retinopathy and
nephropathy. Diabetic retinopathy is a terrible prospect to these patients which is
diagnosed with the onset of microaneurysms, haemorrhages and development of cotton
wool spots in the retina.
Mechanisms underlying pathogenesis of diabetic retinopathy are not completely
understood. Integrin α2β1 is a receptor for collagen on platelet cell membrane.
Polymorphism in intron 7 of integrin gene produces change in α subunit and this makes
retina vulnerable for platelet attachment during chronic hyperglycaemia in diabetes.
Earlier studies have established a relationship between variants of α2β1 gene and diabetic
retinopathy in Japanese and Caucassions. Derangements of several cytokines and
chemokines have been reported in diabetic retinopathy.
There are many studies that evaluate the role of IL-6 in the development of ophthalmic
complications but they determined the level of IL-6 in the vitreous fluid and majority of
them have emphasized the involvement of this cytokine in the development of eye
complications. Interleukin 6 increases vascular permeability and neovascularisation and
attracts macrophages. A study was performed in Type-I diabetes mellitus to determine its
role in diabetic retinopathy whereas some of them have correlated IL-6 with proliferative
diabetic retinopathy. In the literature there are a few studies that tried to determine the
level of IL-6 in the serum of diabetic retinopathy patients but some of them could not
determine its level in the serum while others found its level much less than in the vitreous
fluid.
The comparatively newly diagnosed subset of T cells known as Th17 cell secretes IL-17
which is a family of six cytokines (IL-17A-E). It is a pro-inflammatory cytokine and
mediates inflammation by attracting neutrophils. It has been documented that Th17 cells
have major contribution in different human diseases that are related to inflammation and
tissue destruction such as rheumatoid arthritis, psoriasis, Crohn’s disease, and multiple
sclerosis. Therefore it has also been suggested that IL-17 has got the potential to be used
as a treatment option as well.

xx
It has been suggested that some early aspects of pathogenesis of diabetic retinopathy
could be due to loss of self-tolerance. At the beginning of retinopathy, anti-pericyte and
anti-endothelial cell auto-antibodies have been detected in the circulation of diabetic
patients. There were increased vitreous concentrations of IL-6 and IL-8 in the patients of
diabetic retinopathy while in the serum there were elevated levels of IL-8, TNF-alpha,
and soluble IL-2 receptor. T regulatory (Treg) cells: a subset of CD4+ T cells, down
regulates the process of autoimmunity. It has been documented that Treg cells are
involved in the development of various autoimmune disorders.
Two hundred and twelve (212) subjects were divided into three groups i.e. (Group-III)
diabetic patients with retinopathy (152), (Group-II) diabetic patients without retinopathy
(30) and (Group-I) healthy control without diabetes (30). Blood was drawn after their
consent and integrin gene polymorphism was studied by restriction fragment length
polymorphism analysis. Concentration of IL-6 and IL-17 was determined by ELISA
technique. CD4+CD25+ (T regulatory cells) were enumerated by flow cytometer.
There were 77 males and 135 females and their age distribution was from 20 years to 75
years. 109 patients had history of diabetes between 5 and 10 years whereas 73 patients
had diabetes for more than 10 years. The percentage of HbA1c was between 5.5% and
15.4%. The mean age of the studied population was 34.66, 49.46, and 50.88 years in
Group-I, Group-II and Group-III respectively. There was statistically significant
difference of mean age among the three groups. The mean CD4+CD25+ count was 14.53,
14.68, and 16.47 in Group-I, Group-II and Group-III respectively and on comparison of
CD4+CD25+ count among the three groups, there was statistically significant difference.
The mean of Treg cells was 2.91, 3.07, and 2.88 in Group-I, Group-II and Group-III
respectively and there was no statistically significant difference of Treg cells among the
three groups,. The mean level of IL-6 was 133.98, 1341.78, and 718.66 in Group-I,
Group-II and Group-III respectively and there was statistically significant difference of
IL-6 among the three groups. The mean level of IL-17 was 718.05, 415.01, and 375.95 in
Group-I, Group-II and Group-III respectively and there was statistically significant
difference of IL-17 among the three groups. Mean duration of diabetes was 7.76 and
10.51 years in Group-II and Group-III respectively. There was statistically significant
difference of duration of diabetes between these two groups. Mean percentage of HbA1c

xxi
was 8.54% and 8.83% in Group-II and Group-III respectively and there was no
statistically significant difference in percentages of HbA1c between these two groups.
There was statistically significant difference in the gender and age of the subjects in all
parameters between Group-I and Group-II. There was statistically significant difference
in the gender, age, level of IL-6 and the level of IL-17 among the subjects (p<0.05). By
comparing Group-II and Group-III, we could find statistically significant difference in the
percentage of Treg cells, the level of IL-6 and the duration of diabetes in the studied
subjects. Regarding Bgl II polymorphism, 33 (15.6%), 104 (49.05%), and 75 (34.90%)
subjects had + +, + -, and - - phenotypes respectively. On comparing Bgl II
polymorphism among the three groups, there was no statistically significant difference.
By applying logistic regression model between Group-II and Group-III there was
statistically significant difference in the percentage of Treg cells and the level of IL-6 in
these groups. When the logistic regression model was applied between Group-I and
Group-III, significant difference was found in the age of the subjects, the level of
CD4+CD25+ cells and the level of IL-6 in these groups. Therefore, it is suggested that age
and gender of the subjects, duration of diabetes, levels of IL-6, IL-17, CD4+CD25+ cells
and the percentage of Treg cells can contribute towards the development of diabetic
retinopathy.

1
1. INTRODUCTION AND LITERATURE REVIEW
1.1. Diabetes mellitus: Diabetes mellitus is present all over the world and its increased
prevalence no doubt represents a huge burden on the health of human beings because this disease
has many and sometimes serious outcomes such as retinopathy, nephropathy, and cardiovascular
disease. Most of the times it is the hyperglycemia, which initiates diabetic complications such as
retinopathy, nephropathy and neuropathy and it sometimes leads to the development of
cardiovascular diseases. Many risk factors have been associated with diabetes and its
complications such as diet, sedentary life-style, age, obesity and genetic profile of a person
(Akramet al 2011, Cockram et al 2000, Caballero et al 2005). World Health Organization
(WHO) suggested in 1999 that diagnosis of diabetes mellitus should include determination of
blood glucose levels of both fasting and after two hours of 75g glucose load (World Health
Organization Expert Committee, 1999). There are also increased chances for the development of
macro vascular diseases in impaired glucose tolerance. It is type-2 diabetes mellitus (T2DM) that
is one of the leading causes of morbidity and mortality in all over the world. It is estimated that
this disease affects more than 170 million people every year throughout the world. It is estimated
that currently diabetes mellitus is affecting about 240 million people worldwide and this figure
may increase up to 380 million by the end of 2025. Surprisingly more than 80% of its burden is
seen in low and middle income countries (International Diabetic Federation, 2006). It is believed
that Pakistan is among the areas where diabetes is highly prevalent. It is estimated that Pakistan
has 6.9 million people affected with this disease and the estimated figure is expected to double
by the end of year 2025 and it may affect more than 11.5 million people (Qidwai et al 2010). In
the United States of America the prevalence of diabetes was 13.7% and 11.7% among men and
women of ≥ 30 years of age respectively and diabetes was suggested as the sixth leading cause of
death in the US (Danaei et al 2009).
1.2.T2DM: T2DM is relatively more common and most of the times it is present in adult
population. T2DM is now being considered as an epidemic of young, swiftly spreading globally
and therefore its serious health issues are coming up (Fagot-Campagna et al 2001). At the
moment, T2DM is affecting people of all age groups. There are reports of children of eight years
of age or even younger are having this disease (Pihoker et al 1998). There are more reports about
T2DM and impaired glucose tolerance (IGT) in the young age group and in young adults from

2
the developing world (Chan et al 2009). Dramatic rise of T2DM in all age groups is associated
with the increased prevalence of obesity which is linked to the change in dietary and lifestyle
patterns. There are reports about more and more childhood T2DM than type-1 diabetes in Japan
and Taiwan (Wei et al 2003). Similarly, in the USA, T2DM is becoming more prevalent as
compared to type-1 diabetes (Kahn et al 2000). Many studies have documented strong family
history association among the affected young people. About 45% - 80% have at least one parent
suffering from diabetes and from 74% - 100% had either first or second degree relative suffering
from T2DM (Kahnet al 2000, Silverman et al 1995). It is suggested that in 20 years time T2DM
may account for the 60% of disease load in non-communicable disease group in the developing
world (Caballero et al 2001).
1.3. Ethnicity and predisposition to diabetes: It is well documented that Asian people have
lower rates of overweight and obesity as compared to people living in the Western countries
(Chan et al 2009). In spite of the fact that Asians have lower body mass index (BMI), it has been
observed that some Asian countries have similar or even higher prevalence of diabetes mellitus
as compared to Western countries. It is suggested that the risk to developT2DM begins at the
lower level of BMI for Asians as compared to the individuals living in the European countries.
It is documented that in China, the prevalence of overweight in adult population increased from
14.6% to 21.8% (Chan et al 2009) during the year 1992 to 2002. In fact an increased trend of
childhood obesity in the Asian population puts many young individuals of these countries at a
higher risk of developing T2DM in early young age. Asian populations as a whole but especially
the people of South Asian origin are prone to abdominal obesity and they have low muscle mass
with increased insulin resistance as compared to the people living in Western countries.
Therefore, waist circumference that indicate central obesity can be used as a tool to determine
obesity that is a risk to develop T2DM, and it can be used more effectively for those individuals
who have normal values of BMI (Chan et al 2009).
Infect, it is the Asia-Pacific region which is thought to be heavily affected by epidemic of
diabetes. The risk of developing diabetes mellitus seems to be a combination of genetic factors
and change in life style. Lifestyle changes are reflected by the changes in dietary habits and lack

3
of physical activity. The reason for observing diabetes particularly in younger people can be
easily associated with obesity and in particular central obesity (Cockram et al 2000).
1.4. Diabetes and pregnancy: It has been documented by animal studies that increased level of
glucose during pregnancy may lead to glucose intolerance, impaired insulin secretion, and even
in some cases increased insulin resistance (IR) in the offspring of that pregnancy(Dyck et al
2001). In humans there are increased rates of T2DM in the offspring’s of those mothers who
developed gestational diabetes mellitus. There are also increased rates of impaired glucose
tolerance among the offspring of those mothers (Aerts et al 1988). There are reports suggesting
that both the babies of low and high birth weight are likely to develop T2DM in their later life.
1.5. Factors contributing to development of diabetes: In T2DM, there is an increased
resistance to insulin along with an inability of pancreatic beta cells to secrete enough insulin to
maintain hemostasis.There are reports about high association among insulin resistance, obesity
and physical inactivity. Many studies have documented heritability of T2DM where both genetic
and environmental factors play their roles (Kahnet al 2000, Silverman et al 1995). There are
assumptions that genetic susceptibility contribute strongly towards the development of T2DM in
different populations. It has been observed that 15% - 25% of first degree relatives of T2DM
patients may develop impaired glucose tolerance or diabetes mellitus (Pierce et al 1995).
The study performed to determine the prevalence of diabetes in eight European countries
documented that all age prevalence in the network population was lowest in Slovenia and highest
in Belgium (Fleming et al 2004). For the development of T2DM, different risk factors have been
suggested by Manzella et al (2010) which include obesity, sedentary life style, unhealthy eating
life style, family history and genetics, increasing age, high blood pressure and high cholesterol,
and history of gestational diabetes in females. In the recent past evidence has emerged linking
T2DM with systemic inflammation (Kolb et al 2005)
1.6. Inflammatory markers: It has been observed that there is an increased level of
inflammatory markers in healthy individuals who eventually develop T2DM in the later part of
their lives (Vozarova et al 2002). It suggests that the process of inflammation may start much
4
early, may be during the phase of impaired glucose tolerance which might be there much before
the diagnosis of T2DM. Individuals with high white blood cell counts and increased level of
inflammatory markers such as IL-6 and C-Reactive Protein (CRP) are expected to develop
T2DM in the next 20-years and 4-years time respectively as compared to those individuals who
do not have white blood count and inflammatory markers at the higher levels (Pradhan et al
2001).
There is increased level of inflammatory markers in healthy individuals who are likely to
develop type 2 diabetes. It suggests that inflammation is present during the period of impaired
glucose tolerance prior to the development of type 2 diabetes (Vozarova et al 2002, Pradhan et al
2001, Thorand et al 2003) (Reviewed by King et al 2008). In the current study, two of the
cytokines i.e. IL-6 and IL-17 have been selected to determine their contribution towards the
development of diabetic retinopathy.
1.7. Immunological abnormalities are associated with the complications of both type 1 and
T2DM. It is suggested that in T2DM, inflammation and activation of monocytes are crucial
factors responsible for the development of insulin resistance and they are thought to add to the
loss of insulin secretary function by islet cells (CDC 2008). There are many other factors that can
increase insulin resistance for example genetic predisposition, sedentary life style, obesity,
chronic inflammation and infection (Mooradian et al 2001). During inflammation there are
factors such as activated monocytes and high level of inflammatory cytokines, CRP, and
plasminogen activator inhibitor-1 that have been documented to contribute in the development of
insulin resistance, even without diabetes mellitus (Shoelson et al 2006). It was though that there
could be abnormalities in the innate immune system may also take part in the development of
complications in diabetes mellitus (Reviewed by King et al 2008).
1.8. Complications of diabetes: Many complications of diabetes mellitus have been suggested
that could be either macro vascular or micro vascular and that are supposed to take place due to
the process of enhanced atherogenesis (Zimmet et al 2001). It is estimated that in T2DM the
morbidity because of cardiovascular problems might be two to four times more as compared to

5
subjects without diabetes. Further a family history of diabetes also increases the chances up to
2.4 fold for the development of T2DM (Pierce et al 1995).
In the literature, several mechanisms have been proposed for the pathogenesis of diabetes that
include increased non-esterified fatty acids, increased levels of inflammatory cytokines, and
dysfunction of mitochondria contributing to insulin resistance (Kelley et al 2002). Furthermore
lipotoxicityalong with glucotoxicity and amyloid formation have also been implicated in beta-
cell dysfunction in diabetes (Stumvoll et al 2005).Various complications of diabetes include
microvascular e.g. nephropathy, neuropathy and retinopathy and macrovascular e.g.
cerebrovascular diseases, peripheral vascular diseases and cardiovascular complications (Nichols
et al 2008).
1.9. Diabetic retinopathy: Apart from many complications of diabetes mellitus, diabetic
retinopathy is also a horrifying prospect to patients (Singh et al 2004). It is expected that number
of people who are at risk to develop this particular complication of diabetes would double in the
next 30 years (Wild etal 2004). Retina is a transparent layer of neural tissue placed between
vitreous body and retinal pigment epithelium (Bito et al 1978). The unique structure of retina
gives it special physiologic constraints e.g. retinal axons are not en-sheathed by myelin, therefore
un-myelinated nerves need more energy for membrane potential (Bristow et al 2002). The
density of blood vessels that can absorb light is low, hence oxygen tension in the inner retina is
hypoxic i.e. only about 25mmHg (Wangsa-Wirawan et al 2003). The pO2 gradient of retina
decreases as it moves from outside to the inner side of retina (Pournaras et al 1995). Further,
inner retina contains a few mitochondria that have light absorbing hemebased cytochrome
proteins (Gremer et al 1998, Bentmann et al 2005). Therefore inner retina depends on glycolysis
which is a less potent way of generating ATP as compared to oxidative phosphorylation that is
present at the outer retina, where pO2 is about 80mmHg (Pournaras et al 1995, Ahmed et al
1993). In spite of low vascularity and pO2 the retina has one of the highest metabolic demands.
Therefore, increased metabolic demands and low vascular supply limit the inner retina’s ability
to cope with the metabolic stress of diabetes (Cohen et al 1965).
It is documented that in the United States, it is the diabetic retinopathy which is the leading cause
of blindness in adult population under the age of 65 years and in the developing world this

6
diabetic retinopathy is the major reason for the vision loss (Kempen et al 2004). It is claimed that
diabetes might affect more than 300 million subjects worldwide by the year 2025, and it is
estimated that about 10% might probably develop visual impairment which will be secondary to
this diabetic retinopathy (WHO Fact sheet 2002).
Diabetic retinopathy and especially proliferative diabetic retinopathy (PDR) is an important
reason for adult blindness, and this condition is characterized by the development of
neovascularization. These new vessels which are formed are actually fragile and these vessels
also lack normal barrier function, therefore these vessels allow extra vascular leakage of different
components of blood. Since diabetic retinopathy is one of the serious complications and the
precise mechanisms involved in the aetiopathogenesis of PDR/DR are not known (Funatsu et al
2005). Therefore it is necessary to develop better means for identification, prevention and
treatment of diabetic retinopathy before the onset of vision loss (Singh R et al 2004).
1.10. Factors contributing to diabetic retinopathy
1.10.1. Duration of diabetes: Several experimental and epidemiological studies have indicated
that it is the duration of diabetes and the level of glucose that can be blamed as major
contributors for the development of diabetic complications such as retinopathy or nephropathy
(Diercks et al 2002). If the state of hyperglycemia is there for a longer duration of time, then
there could be alterations in the retinal or in the renal blood flow. There could be metabolic
changes, or even hemostatic abnormality (Monster et al 2002, Konen et al 1993), and there could
have been no enzymatic glycosylation of long-lived tissue proteins. All these changes are labeled
as vascular dysfunctions seen in the microcirculation and are supposed to play a major role in the
development of diabetic retinopathy and nephropathy (Tong et al 2008). The complication of
diabetic retinopathy has been suggested among individuals having diabetes at young age and
after 5 to 10 year of their disease duration (Krakoff et al 2003, Reviewed by Singh et al 2004).
1.10.2. Platelets have been documented and are said to be responsible in the development of
diabetic complications such as retinopathy and nephropathy. It is suggested that in diabetic
patients hyper reactive platelets might interact with the damaged vessels and especially to the
exposed sub endothelium and it is the area that causes enhanced micro thrombus formation or

7
occlusion of small vessels (Powell et al 1964, Glustina et al 1998, Barnett et al 1984). It might
become the reason for the change in the blood flow of retinal or renal tissues. Further there are
reasons to believe in the favourable effects of anti-platelet treatment in patients suffering from
retinopathy and nephropathy as it points towards the contribution of platelets in the pathogenesis
of microangiopathy (Matsubara et al 2000).
1.11. Diagnosis of diabetic retinopathy: Clinically, the condition of diabetic retinopathy can be
diagnosed at the development of micro aneurysms, hemorrhages and development of cotton wool
spots. It is characterized by amplified vascular permeability, abnormalities in the hemostatic
conditions, more tissue ischemia and neo-angiogenesis. It has been suggested that functional
defects often presents much earlier than the actual defects are observed in one of the above
mentioned categories. It was further suggested that this is the time when better results can be
achieved in treating the patients while there are no symptoms of visual impairment to the patients
(The New Eng. J Med 1993).
1.12. Genetic Basis of Diabetic Retinopathy
Although role of chronic hyperglycemia is well established in the pathogenesis of diabetic
retinopathy, but genetic aspects also contribute in determining susceptibility toward retinopathy
(Frank et al 2004). Genetics along with environmental elements and intra-uterine signals for low
birth weight and gestational diabetes are thought to be the major reasons for the high prevalence
of type-2 diabetes in Pakistan. Better understanding of various contributing factors in the
pathogenesis DR have suggested that prevention of the disease should infect begin much before
the start of the disease process (Hakeem et al 2010). It is well known that genetic susceptibility
contributes in the development of type 2 diabetes mellitus in certain populations (Dedousis et al
2007). Familial aggregation is a useful marker in determining genetic susceptibility to diabetic
retinopathy. The risk of developing severe diabetic retinopathy increases in the siblings of
affected individuals (Leslie et al 1982). It has also been found that frequency of diabetic
retinopathy varies with ethnicity and race. Therefore, so far several genes have been studied to
determine the association with diabetic retinopathy but only a few of them have been found to be
associated (Warpeha et al 2003).

8
1.12.1. Candidate genes: Different researchers have investigated a number of genes and they
have suggested association of more than 30 genes in various metabolic and functional pathways
in the development of diabetic retinopathy. But there are only a couple of them that have
revealed reliable associations with the development of diabetic retinopathy or with the severity
of DR. Aldosereductase (AR2) gene polymorphism at the (CA)n micro satellite marker (the 5’
end) has been repeatedly associated with DR (Warpeha et al 2003). Some other genes that have
been studied for an association includes endothelial nitric oxide synthase, lymphotoxin-a,
integrin alpha-2, angiotensin converting enzyme, vascular endothelial growth factor, intracellular
adhesion molecule 1/CD45, β3-adrenergic receptor gene and endothelin-1. (Li et al 2008) There
is a strong correlation of diabetic retinopathy with aldose receptor, advanced glycation end
products receptor, vascular endothelial growth factor, intercellular adhesion molecule 1, beta3
adrenergic receptor gene, hemochromatosis, and alpha2 beta1 integrin (Uhlmann et al 2006).
1.12.1.1. Endothelin-1 (EDN1): Polymorphism of EDN1 gene (Lys198Asn) has been suspected
to be associated with DM because this gene is often correlated with hypertension which is
considered to be one of the risk factors fordiabetic retinopathy (Rabineau et al 2003). There was
significantly higher frequency of EDN1 Asn/Asn genotype in controls as compared to the DR
patients. (Li et al 2008). Uhlmann et al (2006) concluded that further studies are required for the
analysis of these genes in order to have better understanding of path physiology of diabetes
(Uhlmann et al 2006).
1.12.1.2. Leptin is considered to be associated with obese (ob) gene expression which is present
on chromosome 17 and it is involved in the regulation of different metabolisms and body weight
(Pelleymounter et al 1995). Leptin gene has been associated with many states such as diabetes,
glucose metabolism and insulin metabolism. Polymorphism of leptin gene (C2549 A) has been
associated in Chinese population in patients of T2DM. (Wei et al 2004)
1.12.1.3. Erythropoietin: In the experimental studies performed in diabetic human beings and
also in the eyes of mouse model, erythropoietin (EPO) has been observed as a potent angiogenic
factor. In the three European-American cohorts that were performed on the promoter region of
EPO gene; (T allele of SNP rs1617640) it was documented that there is a significant association

9
with PDR and end stage renal disease (ESRD). It was further suggested that the concentration
EPO in the human vitreous body was 7.5 times more than healthy normal subjects and they
exhibited TT risk genotype as compared to those individuals that had GG genotype (Tong et al
2008).
1.12.1.4. Hemochromatosis (HFE) gene: Hereditary hemochromatosis is an autosomal
recessive disorder which exhibit a defect in the gene of hereditary hemochromatosis (HFE) that
leads to an increased intestinal absorption of dietary iron and ultimately there is an accumulation
of iron (Peterlin et al 2003). First of all in 1978, an association between diabetic retinopathy and
idiopathic hemochromatosis was established (Walsh et al 1978). Until recently, hereditary
hemochromatosis has been significantly correlated with the two of 37 allelic variants of HFE
gene i.e. C282Y andH63D (Hanson et al 2001).
There was a significant higher frequency of C282Y heterozygotes in the subjects suffering from
proliferative diabetic retinopathy (PDR) as compared to the healthy individuals but there was no
association between H63D genotype and PDR. Therefore C282Y mutation was considered to be
a significant independent risk factor for the causation of PDR (Peterlin et al 2003). Similarly,
hetrozygosity of C282Y was thought to be a risk factor for the development of PDR in
Caucasians having T2DM. (Peterlin et al 2003) 1245 T2DM patients were tested for
heterozygosity of H63D in C282Y and mutation of C282Y HFE gene to determine prognostic
significance of HFE gene mutation in T2DM as well as to determine its prevalence (Davis et al
2008). It was cross sectional and longitudinal study but they could not identify an independent
positive association between HFE gene and vascular complications. Davis et al concluded that
HFE gene could not independently predict cardiac or other causes of mortality (Davis et al
2008).
1.12.1.5. Prolactin: is a hormone and its gene is located on chromosome 6 that can affect
various functions. Many cells of the body such as T-lymphocytes, B-lymphocytes and even
thymocytes have been documented to produce this hormone that can perform the functions of
pro-inflammatory cytokine in the body (Ben-Jonathan et al 1996). Increased secretion of
prolactin has been labeled for different autoimmune disorders such as systemic lupus
10
erythematous and rheumatoid arthritis (Jaraet et al 1992).It has been shown that there is linkage
disequilibrium between HLA-DR and prolactin gene (Brennan et al 1997). Therefore, it was
suggested that polymorphisms of prolactin gene may have an association with HLA gene. A Bgl
II polymorphism has been documented in prolactin gene (Stevenes et al 1999). Still further
studies are required in other ethnic populations to check its relationship between α2β1
polymorphism and diabetic retinopathy.
1.12.1.6. α2β1 gene: Concentrations of β-thromboglobulin and platelet factors have been found
high in diabetic patients as compared to normal controls that lead to hyper activation of platelets
in diabetic patients to collagen, epinephrine and thrombin (Barnettet al 1991). Among these,
collagen is a potent physiological activator of platelets. After their activation, a cascade reaction
starts in platelets which trigger integrin and platelet aggregation (Winocour et al 1992, Mustard
et al 1984). It has been established that polymorphism in intron 7 of α2β1 gene produces
polymorphism in α subunit of collagen receptor and makes retina vulnerable during
hyperglycemia (Jung et al 2000, Matsubara et al 2000). In Japanese and Caucasians populations,
association of genetic variations in α2β1 integrin and diabetic retinopathy has been well
established (Petrovic et al 2003).
It was suggested that integrin α2β1 is one of the under investigation gene, for its association with
retinopathy. Human platelet glycoprotein (GP) plays a vital part in platelet adhesion and
aggregation, and these are important steps in the development of thrombosis and hemostasis.
Therefore variation in the density of platelet GP may assume as a risk factor for hemostatic
dysfunction. Basically integrin α2β1 is a glycoprotein which acts as a receptor for collagen
present on the membranes of platelets (Jung et al 2000).
Platelet 2β1 density is genetically determined that affects adhesion of platelet to collagen which
contribute towards thrombus formation. It was suggested that platelets of diabetic patients often
interact with sub endothelial collagen that is the major component of sub endothelial matrix
(Petrovic et al 2003).

11
The scientists have documented that the 2β1 expression upon the platelets increases chances of
adhesion of platelets to the sub endothelium (Kritzik et al 1998, Kunicki et al 2009).Therefore
they concluded that platelets adhesion to the collagen is an important step for the normal activity
of platelet, during hemostasis and also for wound repair (Kunicki et al 1997). Hence, genetic
variation in the level of 2β1 integrin on the platelet could be due to the presence of multiple
alleles of 2 gene. It was concluded that this expression might have a substantial impact on the
functions of platelet which could contribute towards the process of thrombosis or bleeding.
Kunicki et al (1997) documented polymorphism association of GP Ia gene with the variations in
the levels of 2β1 on platelets. It was observed that platelets of subjects having 807T allele often
exhibit higher levels of 2β1 while subjects having 807C allele showed lower density of 2β1
integrin. By these different experiments, Kunicki et al (1997) concluded that platelets from the
subjects having 807T allele stick considerably quickly as compared to the platelets from the
subjects with 807C allele. This concept of 2β1expression was further studied by Pavkovic et al
(2010) by determining the BglII polymorphism of the 2β1 integrin gene in Macedonian healthy
population and concluded that polymorphism of 2β1integrin gene is present in their population.
Further, this BglII polymorphism of 2β1 integrin gene has been documented by Matsubara et al
(2000) in subjects of diabetic retinopathy.
1.12.1.7. Association of Bgl II polymorphism with diabetic retinopathy: A study showed that
polymorphism of Bgl II have association with the development of retinopathy in patients of
T2DM (Kritizik et al 1998). The genotypes of BglII i.e. (+/+, +/-) have shown increased risk for
the development of retinopathy and nephropathy (Kritizik et al 1998, Kunicki et al 1997). In
many studies (Kritizik et al 1998, Kunicki et al 1997, Carisson et al 1999, Moshfegh et al 1999)
the polymorphism of Bgl II has been linked with 2β1 density of platelet, the degree of adhesion
of platelets to collagen, and also with the chances of having myocardial infarction or stroke
(Carisson et al 1999). Infect it is the very first study that demonstrated an association of Bgl II
polymorphism and the development of diabetic retinopathy. It was suggested that platelets
having Bgl II (+)- could easily interact with glycosylated collagen that may enhance the
development of retinopathy (Reviewed by Matsubara et al 2000). Therefore, it was suggested
that the patients with Bgl II (+/-, +/+) genotype may benefit from the anti-platelet therapy. Even

12
today the precise role of 2β1 integrin in the causation of diabetic retinopathy is not known, but
this study does suggest a strong association of platelets in the process of diabetic retinopathy.
Hence, it was concluded that polymorphism of subunit of 2β1 integrin of Bgl II is strongly
associated with the development of retinopathy in T2DM patients (Matsubara et al 2000).
Matsubara et al (2000) documented higher frequency of polymorphism of 2β1 integrin gene of
Bgl II (+/+) in diabetic retinopathy patients as compared to those patients who did not develop
DR. Different factors such as polymorphism of 2β1 integrin gene of Bgl II (+/+) genotype, age
at start of diabetes, total duration of diabetes, and insulin treatment were independent risk factor
for the development of DR in Caucasians (Petrovic et al 2003) with T2DM. These results are
similar with the findings of Matsubara et al (2000) who performed the study in Japanese
population with T2DMand documented strong association between genetic variations of 2β1
integrin and DR (Petrovic et al 2003) whereas Tsi et al (2001)could not detect an association of
α2β1 integrin with diabetic nephropathy inT2DM in Chinese population.
1.13. Changing concept of type 2 diabetes mellitus
Type 2 diabetes mellitus was considered to be due to insufficient amount of insulin and it was
often linked to obesity which was thought to be the reason for insulin resistance and
glucolipotoxicity (Kahn et al (2006). It has been documented that subjects of T2DM have
subclinical inflammation which can be demonstrated by acute phase proteins, the level of
cytokines, etc which are raised as compared to healthy individuals but their level is low as
compared to individuals with full blown acute infection (Kolb et al 2005) HLA genes
polymorphism have been demonstrated in subjects of T2DM (Groop et al 1986, Tuomilehto-
Wolf et al 1993). Further, polymorphism in TNF-alpha receptor (Ferandez-Real et al 2000) and
TGF-beta (Rosmond et al 2003) has also been studied. These immune disorders and
inflammation are thought to be the reasons for the diabetic complications (Mandrup-Poulsen et
al 2010).
The newly diagnosed subset of T cells called as Th17 cells has been recognized as a vital
contributor in various conditions such as infection, autoimmune diseases, inflammation and
cancers (Dong et al 2008). It has been documented that Th1 cells of CD4+T cells and

13
CD4+CD25hi Treg cells play an important role in the regulation of insulin resistance, glucose
tolerance and T2DM in both mice and humans (Winer et al 2009, Feuerer et al 2009).
The increased level of Th17 and Th1 cells while decreased level of CD4+CD25hi Treg cells have
been observed in inflammation and insulin resistance (Winer et al 2009, Feuerer et al 2009).
T2DM patients have shown predominance of pro-inflammatory subset of cells (Jagannathan et al
2011). Zeng et al (2012) documented reduced CD4+CD25hi Treg/Th17 and
CD4+CD25hiTreg/Th1 ratios in T2DM and they suggested that this decreased ratio is the reason
for the chronic low degree of activation of innate immune system and later on for the
complications of T2DM. They were of the opinion that in T2DM patients, the decreased ratio of
CD4+CD25hi Treg could be due to impaired survival capability and it was not due to the
decreased thymic output. Zeng et al (2012) further suggested that by regulating CD4+CD25hi
Treg and Th17 cells of the host, one can not only prevent the development of diabetic
complications but can also use this approach for the treatment purposes as well.
Studies on diabetic pre-retinal membranes have showed that they consist of deposition of
immunologlobulins, monocytes, components of activated complement system, two categories of
T lymphocytes i.e. suppresser and cytotoxic, fibroblasts, B lymphocytes, and lymphokines e.g.
IL-2 and IL-1 alpha (Baudouin et al 1993, Attawia et al 1999, Tang et al 1995).
1.14. Diabetic retinopathy and autoimmunity
It is suggested that some early aspects of pathogenesis of diabetic retinopathy could be due to
loss of self-tolerance (Baudouin et al 1993, Attawia et al 1999, Tang et al 1995). At the
beginning of retinopathy, anti-pericyte and anti-endothelial cell auto-antibodies are detected in
the circulation of diabetic (Attawia et al 1999) patients. It has been documented that there were
increased vitreous concentrations of IL-6 and IL-8 in the patients of diabetic retinopathy while in
the serum there were elevated levels of IL-8, TNF-alpha, and soluble IL-2 receptor (sIL-2R)
(Doganay et al 2002).
The expression of human leukocyte antigens (HLA) DR and DQ have been determined on retinal
vascular endothelial cells and on the pigmented and non-pigmented epithelial cells (Baudouin et

14
al 1993). It was suggested that aberrant expression of HLA-DR and HLA-DQ antigens on the
places where in normal circumstances do not express these antigens may lead to autoimmunity
by altering these target cell into an antigen presenting cell. This conversion process may allow
the activation of helper T lymphocytes and it subsequently result in the shape of autoimmune
reaction (Bottazzo et al 1983). All these findings suggest the involvement of autoimmune
processes during the early stages of diabetic retinopathy (Reviewed by Kastelan et al 2007).
1.15. Gender bias in autoimmunity
It has been documented that hormones from hypothalamic-pituitary gland and sex hormones may
affect the severity, occurrence, and development of autoimmune diseases (Lahita et al 1990,
Ahmed et al 1990, Arythera et al 1998, Whitacre et al 1999, Task Force on Gender MSaA
1999). The association of gender biases in susceptibility and also in the severity of autoimmune
and allergic diseases have been established (Reviewed by Shames et al 2002).
It is well known that autoimmune diseases are more common in females as compared to males
and females have about 2.7 times more chances as compared to men to develop an autoimmune
disease (Jacobson et al 1997). The severity of autoimmune disease also changes during different
stages of female life such as periods, pregnancy, or menopause, and even by the use of hormonal
contraceptives (Rosciszewska et al 1980, Zorgdrager et al 1997). Likewise to autoimmune
diseases, studies have documented similar kind of gender bias in patients of allergic disease and
asthma (Venn et al 1998, Aberg et al 1990).
It has been observed that female asthma patients are likely to have bad prognosis as compared to
male patients (Jenkins et al 1994). It was suggested that sex hormones might directly bind to the
surface receptors at lymphocytes and macrophages and hence affect their function and they may
act indirectly by acting on hormone-responsive target tissues i.e. through hypothalamic-pituitary
axis (Sthoegher et al 1988). It is also seen that females can mount more intense antibody
mediated immune response as compared to the male patients (Sthoegher et al 1988). One of the
reasons is that estrogen can enhance B cell function whereas inhibitory action has been observed
by testosterone. Therefore serum IgM levels are mostly raised in females as compared to males
(Sthoegher et al 1988).

15
Another observation that has been made is that females develop swift rejection of allografts,
generally more resistance to the mechanism of immune tolerance as compared to males (Graff et
al 1969). The females also demonstrate low incidence and regression of tumors as compared to
male counterparts (Gross et al 1941).
It has been observed that females and hypo gonadal males are likely to maintain an elevated ratio
of CD4+, CD8 T+ cells in their peripheral blood, which means that they have an increased
number of circulating CD4+ T lymphocytes in their circulation (Amadori et al 1995). Therefore,
if androgens are given, they seem to increase CD8+ cells activity. It has been documented that
hormones affect all the lymphoid tissue in the body but the most responsive organ to hormones is
thymus.
It has been observed that the production of T cells by the thymus is at its maximum level during
young age but after puberty this production of hormones is decreased and it is thought that it is
because of the sex hormones (Sobhon et al 1974, Chiodi et al 1940). Further, replacement of
androgen is likely to reverse this balance while estrogen causes an increase in mature T helper
cells. Similar kind of evidence comes during pregnancy because at this time immunological
response also differs and during the postpartum stage worsening of disease have been seen and it
may be due return of TH1 responses (Warner et al 1997). It has been observed that in susceptible
hosts the change of Th2 response in pregnancy can affect allergic diseases which may later lead
to atopic diseases (Shames et al 2002).
It has been documented that a person with the family history of diabetes, overweight (obese),
female sex, living in the urban region and the age above 40 years have high chances of
developing impaired glucose tolerance or diabetes i.e. (Zargar et al 2000). It was suggested that
more woman transmit type-II diabetes to their off springs as compared to males (Reviewed by
Gale et al 2001, Tull et al 1995). There are studies on the development of metabolic syndrome
i.e. diabetes, obesity and hypertension and it has been observed that this syndrome is accepted as
a strong risk factor for type-II diabetes mellitus and females are affected more as compared to
males (Ahmed et al 2010, Mohsin et al 2007).

16
1.16. T regulatory cells (Tregs)
1.16.1. Treg and autoimmunity: In the last a couple of years, researchers have developed a lot
of interest in T regulatory (Treg) cells that are supposed to down regulate the process of
autoimmunity (Kappler et al 1987). Treg cells are the subset of CD4+ T cells. Treg cells which
are important to maintain peripheral tolerance and they do so by the down regulation of antigen
specific immune responses (O’ Garra et al 1997). Nature has provided regulatory mechanisms at
different levels to immune system and the purpose is to minimize the chances of autoimmune
damage. Infect in the process of autoimmunity there is activation of self-reactive T cells and at
the same time there is inefficiency of other regulatory mechanisms which are supposed to control
this process. Actually CD4+Treg cells identify a specific framework region 3 of the Vβ8.2 chain
of TCR (B5 peptide, aa 76-101), whereas CD8+ Treg cells attack at the complementarity
determining region (CDR) ½ determinant. Different studies have shown that these cells secrete
TGF-β, IL-10 and IL-4 to down regulate autoimmune diseases (O’ Garra et al 1997, Delovitch et
al 1997, Nicholson et al 1996, Reviewed by Madakamutil et al 2003).
A study was performed to determine the percentage of CD4+CD25+ Treg cells in the patients of
autoimmune liver disease. This study included both the aspects of the disease i.e. at the clinical
presentation and later at the time of remission. The purpose was to determine the frequency of
Treg cells at different stages of disease and to observe the ability of CD4+CD25+ T cells to
expand and at the same time to inhibit INF-gamma production. This study suggested the possible
mechanism to develop autoimmunity against liver and they concluded that its therapy must be
directed to increase the number of Treg cells (Longhi et al 2004).
1.16.2. Types of Treg cells: The ability of the T cell that can suppress the immune response
provides them the quality of regulatory T cell. These Treg cells can be classified into natural T
reg cells and induced or adoptive Treg cells. Natural T reg cells (nTreg) are those cells which are
self-antigen specific CD4+ T cells and they express CD25 in high levels and Foxp3-gene as well.
Further, these cells also express CD62 ligand, CD103, glucocorticoid induced tumor receptor,
cytotoxic T-lymphocyte Antigen 4, CD152, neurophilin and CD45RO. It was suggested that
these nTregs cells are selected within the thymus, and they become Treg cells in the peripheral
circulation (Nandakumar et al 2009).
17
Another variety of Treg cells are called adoptive or induced T regulatory cells. They arise due to
activation of mature T cells and it happens in the absence of antigen exposure or co-stimulation
or occasionally in the presence of some inhibitory cytokines. Generally, induced Tregs consist of
type 1 regulatory T cells (Tr1) and Th3 cells. It has been observed that Tr1 cells exhibit Th1 as
well as Th2 markers e.g. CXCR3, CCR5, CCR3, CCR4 and CCR8. Upon activation these cells
exhibit CD40L, CD69, CD28, CTLA-4, IL-2R-α, IL-15Rα and HLA-DR. It is documented that
Tr1 cells have the property of producing increased quantity of IL-10, TGF-β and IL-5. Further, it
was determined that naïve CD4+ T cells develop into IL-10 producing Tr1 cells but it happens in
the existence of immunosuppressive drugs, soluble proteins and during the stages of chronic
stimulation due to allergic, infectious or tumor antigens.
1.16.3. Murine CD4+ T cells: There was a study to investigate the role of CD4+CD25+ cells
towards alloantigen and to determine their importance for the induction of tolerance. In this
experiment murine CD4+ T cells were exposed to alloantigen through CD40/CD40 ligand or by
the exposure of CD28/cytotoxic T lymphocyte which were associated with antigen-4/B7
blockade. Secondary mixed leukocyte reaction and against the alloantigen tolerance was
observed. It was concluded that CD4+CD25+ cells are needed for the development of tolerance
process against alloantigen. They claimed it to be an important application for the strategies to
create tolerance while targeting the pathways of co-stimulatory signals for the T cells (Taylor et
al 2001).
1.16.4. Regulation of Treg cells: It has been documented that Treg cells have well defined
phenotype, they produce a specific set of cytokine and they have specific mechanism of action
which include CD8+ and CD4+. It has been observed that within the domain of CD4+Treg cells,
there are T-rig cell type-I that produce IL-10, transforming growth factor-β secreting T helper
cell type-3 and a sub population of Treg cells that exert suppressive function in a very specific
contact dependent manner and in the periphery these cells express high levels of CD25 and the
fork head and winged-helix family transcription factor (Foxp3), gamma-delta T cell, and NKT
cells (Dejaco et al 2005).

18
A study was conducted to identify CD4+CD25+ T cells development and their function. Further,
they determined the diversity of both CD4+CD25+ as well as CD4+CD25- T cell populations in
the thymus and peripheral circulation. They concluded that in humans CD4+CD25+ T cells can
recognize similar kind of antigens as CD4+CD25- T cells can. It was suggested that the reduced
levels of TCR on Treg cells recommend different requirements for their activation and in this
way it may contribute towards immune system responses that in which way they have to precede
i.e. a specific response should be suppressed or it has to be augmented. They concluded that in
humans CD4+CD25+ T cells repertoire is quite diverse. However, it is clear that it is extensive
and composite just like the population of CD4+CD25- T cells (Kimberly et al 2004).
1.16.5. Foxp3: Phenotypically CD4+ Tregs are characterized by increased expression of the level
of CD25 and at the same time forkhead winged-helix family transcription factor (Foxp3) which
is a master control gene. In 2001, Foxp3 gene was first identified in Scurfy mice as the disease
causative agent. In this case due to single gene mutation on the X chromosome the animal
spontaneously develop severe autoimmunity or sever inflammation. Clinical findings in humans
with mutated FOXP3 gene encounter disease which is given the name as IPEX (immune
dysregulation, polyendocrinopathy, enteropathy, X-linked syndrome). This disease results in
autoimmunity where various endocrine organs are involved (Sakaguchi et al 2007).
There is evidence from the studies where scientists have discovered that the expression of
FOXP3 mRNA transcripts and other protein can also be expressed in the activated non-
regulatory human T cells. Unlike older observations, this time FOXP3 induction was not
specifically associated with the suppressive activity in these activated T cells. In autoimmune
patients low levels of CD4+CD25hi T cells were determined e.g. in individuals with juvenile
idiopathic arthritis, psoriatic arthritis, HCV–associated mixed cryoglobulinaemia, autoimmune
liver disease, SLE and Kawasaki disease. Further, low levels of CD4+CD25hi T cells in the
circulation have also been correlated with an increased activity of the disease or it is associated
with the poor prognosis. They concluded that decreased percentage of Tregs in the circulation is
not a common observation in all the patients of autoimmune diseases and it also do not indicate
the real picture at the inflammation site (Dejaco et al 2005).

19
1.16.6. Surface markers for Treg cells: Till to date there is not a single specific surface marker
available in the market for the enumeration of Treg cells. Most of the time increased surface
expression of IL-2 receptor alpha chain i.e. CD25 is considered as a reliable marker for most of
the human Treg cells. It is assumed that their regulatory capacity is augmented in CD4 T cells
that express increased levels of CD25. Other surface markers for the identification of Treg cells
include CTLA-4, CD62L which is also known as L-selectin, CD134 (OX40), glucocorticoid
induced tumor necrosis factor receptor, membrane bound TGF-β, programmed cell death-ligand
1, and α4β7/α4β1 integrin. It was observed and possible explanation for the induction of Treg
cells due to pro-inflammatory cytokines from synovial fluids of patients of rheumatoid arthritis is
that IL-6 cytokine is increased at the sites of inflammation. This cytokine causes resistance of
CD4+CD25- T cells towards suppressive actions of Treg cells. Further, IL-6 producing cells have
been detected and it was observed that IL-6 abrogates suppression of human Treg cells
(Hoffmann et al 2007, Dejaco et al 2005).
1.16.7. Role of co-stimulatory molecules: It has been suggested that the specific signals which
assist the Treg cells in the peripheral circulation are still not very clear but the evidence about the
involvement of co-stimulatory molecules e.g. CTLA-4, TGF- β and dendritic cells is present. It
was documented that T cells that express retroviral Foxp3 are far less suppressive as compared to
the freshly isolated CD4+CD25+Tregs121 cells and hence it is suggested that it may be not
sufficient to down regulate autoimmune process in human beings. Further, it has been suggested
that increased percentage of Treg cells also exhibit increased risk of developing cancer and it
may alter immune response during stages of acute or chronic infections. There were clinical
trials where administration of growth hormone or IL-17 cytokine increased thymic size and even
its cellularity. It has been noted that in autoimmune diseases there can be insufficient suppression
of inflammatory process or there can be transformed creation of Treg cells that are needed for the
initiation and later for the continuation of autoimmune disease (Dejaco et al 2005).
The concept of Treg cell involvement in the autoimmune diseases have been studied by various
scientists, therefore Treg cells participation in different human autoimmune diseases have been
reviewed by Buckner et al 2010. The role of Treg cells in type 1 diabetes mellitus has been
studied and proved extensively (D’Alise et al 2008, Clough et al 2008, Tang et al 2008).

20
Scientists have pointed out towards derangement of immune mechanisms in type 2 diabetes
mellitus as well (Keppler et al 1987, O’ Garra et al 1997, Madakamutil et al 2003). Zeng et al
2012 have provided some evidence about the involvement of Treg cells and Th17 cells in the
development of complications in T2DM patients but the convincing evidence about the
development of autoimmune processes in type 2 diabetes mellitus is lacking.
1.17. Cytokines
It is well documented that hyperglycemia is the main reason for the development and also for the
progression of diabetic retinopathy but still, precisely about the pathogenesis of diabetic
retinopathy the concepts are not clear. The evidence supports that it is due to chronic
inflammation. Cytokines may play physiological role in maintaining the ocular surface. The level
of two chemokines i.e. RANTES/CCL5 and stromal cell derived factor (SDF-1α) was much
raised in the patients of severe diabetic retinopathy. It is known that ICAM-1/CD54 is an
intracellular adhesion molecule which is mandatory for the adhesion of leukocytes to capillary
endothelium, and it has also been associated in the pathogenesis of diabetic retinopathy.
Monocyte chemo-attractant protein (MCP)-1/CCL2 has been found increased in diabetic
retinopathy. Several inflammatory cytokines and chemokines have been found elevated during
severe diabetic retinopathy such as RANTES/CCL5, stromal cell derived factor (SDF-
1α),epithelial neutrophils activator, interferon-induced protein-10 which is also known as
CXCL10, stromal cell derived factor-1 that is also known as CXCLl2, monocyte chemo-
attractant protein-1 which is also given the name as CCL2, macrophage inflammatory protein-1
that is known as CCL3, IL-8 also known as CXCL8, intercellular adhesion molecule-1 that is
also known as CD54, vascular cell adhesion molecule which is known as CD106, vascular
endothelial growth factor and IL-6 cytokine (Meleth et al 2005). Many researchers have
documented increased level of different cytokines in the intra-vitreous fluid of eye (Yoshimora et
al 2009, Dongancy et al 2002, Ongkosuwito et al 1998).
1.17.1. IL-6
1.17.1.1. Production and action of IL-6: IL-6 is synthesized by different cells that include
macrophages, fibroblasts, epidermal cells, vascular endothelial cells, and vascular smooth

21
muscles (Kishimoto et al 1989). It is also documented that within an eye, the causes of IL-6
consist of retinal pigmented epithelial cells, corneal epithelial cells, keratocytes, iris and ciliary
body. It is well observed that IL-6 cytokine is capable of various functions that may induce an
increase of endothelial permeability directly and at the same time it induces new vessel
formation (Cohen et al 1996, Maruo et al 1992). This cytokine can induce an increased quantity
of vascular permeability and neovascularization through the expansion of vascular endothelial
growth factor (VEGF) indirectly.IL-6 exhibits a variety of biologic activities including activation
of macrophages. In a study, it was documented that in both aqueous and vitreous, the levels of
VEGF and IL-6 are closely correlated with each other (Funatsu et al 2005). It was observed that
the levels of VEGF and IL-6 were increased in the eye as compared to their plasma levels
(Funatsu et al 2005). Funatsu et al concluded that the levels of aqueous and vitreous of VEGF
and IL-6 were associated with the severity of diabetic retinopathy (Funatsu et al 2005).
1.17.1.2. IL-6 and Eye: Significantly increased levels of IL-6 were found in the conjunctival
epithelium in the patients of Sjogren syndrome (SS) and non-SS dry eye as compared with
controls (Pflugfelder et al 1999, Chotikavanich et al 2009). The effect of desiccation on secretion
of inflammatory cytokines in corneal epithelial cells and in rat desiccation model was
investigated and it was found that desiccation induced IL-6 expression in corneal epithelial cells,
suggesting that IL-6 participates in the desiccation induced cell death. Therefore, it was expected
that neutralization of IL-6 would suppress cell death. In fact, anti-IL-6 antibody protected
corneal epithelial cell line (CEPI) from cell death induced by short term desiccation (Higuchi et
al 2011).
It has been documented that in human trabecular meshwork (HTM) cells, TGF-β1 and IL-6 are
required for the signaling pathways and these cells had increased expression of IL-6 cytokine
that is infect happening due to mechanical stress. Linton et al incubated HTM cells with TGF-β1
which showed a significant increase of protein, mRNA, the level of IL-6 and they concluded the
importance of TGF-1 in the induction of basal and stretch-induced expression of IL-6 cytokine
by the involvement of an autocrine loop between TGF- β1and IL-6 (Liton et al 2009).
22
1.17.1.3. IL-6 and diabetic retinopathy: A study was conducted in children with diabetes
mellitus type-1 to determine the relationship in early diabetic retinopathy and the IL-6cytokine.
Higher concentration of IL-6 was demonstrated in the serum of diabetic patients with retinopathy
as compared to diabetic patients without diabetic retinopathy and the level of cytokine was
associated with the severity of disease. In this study the control group showed the lowest level of
IL-6 among the studied population (Mysliwiec et al 2008).
A study was carried out to determine the possible involvement of IL-6 in the pathogenesis of
proliferative diabetic retinopathy (PDR). Mocan et al (2006) documented higher concentrations
of intra-vitreous IL-6 cytokine in PDR patients as compared with the control subjects. The serum
levels of IL-6 in the PDR subjects were decreased as compared to the lower measurable
threshold by the ELISA technique. This study could not determine association between intra-
vitreous IL-6 levels and patient age, duration of diabetes mellitus or vitreous hemorrhage, etc. It
was concluded that IL-6 may have a contribution towards the development of PDR (Mocan et al
2006). Intraocular production of IL-6 seems to be responsible for the elevated intra-vitreous
levels observed. The serum IL-6 concentrations were undetectably low in all the type 2 diabetic
patients. The author accepted that although the sample size is a limitation of this study but it
supported a previous study where elevated levels of IL-6 in the vitreous fluid of diabetic patients
were not associated with corresponding elevations in the serum IL-6 levels. At the same time, the
results of Mocan et al (2006) suggested that systemic circulation of IL-6 was not the primary
source for the elevated intra-vitreous IL-6 concentrations. It is also believed that IL-6 levels may
have been elevated secondary to acute hemorrhage (Mocan et al 2006).
1.17.1.4. IL-6 in the eye and in the serum: In a study Nakamura et al (2003) tried to determine
the reasons for the initiation of diabetic retinopathy and for this they worked on IL-6 cytokine
and advanced glycation end products. They documented higher levels of IL-6 cytokine in the
vitreous fluid of PDR patients as compared to the control group. Further they suggested the level
of IL-6 cytokine was higher in those patients of PDR who had vitreous hemorrhage (VH) as
compared to those PDR subjects who did not have VH. The level of IL-6 was much higher in the
vitreous fluid as compared with the serum and these scientists could not determine any
correlation of IL-6 levels within these two fluids. They proposed that there may be an increased

23
amount of advanced glycation end products in the vitreous fluid that causes production of IL-6
from retinal Muller cells and finally they contribute towards the development of diabetic
retinopathy. They could not determine any significant association of IL-6 levels between the
serum and vitreous fluid of the patients. It was suggested that the levels of IL-6 of vitreous fluid
could be independent from the levels of IL-6 in the serum and therefore increased levels of IL-6
in the vitreous fluid could be of intraocular in origin and that is how it signifies its presence
during PDR (Nakamura et al 2003).
A study was conducted to define the relationship between the levels of cytokines in the serum
and the different stages of DR among diabetes patients and they compared these levels with the
levels in the healthy controls. They could not determine the level of IL-6 in both the patients and
the control group because it was below the detection limits of that particular assay. They
concluded that IL-6 is not an important factor for the pathophysiology and progression of DR.
Further, they found out that IL-6 was raised in poorly controlled diabetes (Doganay et al 2002).
In a study, patients of diabetic vitreo-retinopathy were selected and among them the levels of
different cytokines were measured in their vitreous fluid and serum. Vitreous levels of IL-6 were
mush greater than in the non-inflammatory retinopathy but in the sera, concentrations of IL-6
was similar in proliferative and non-proliferative retinopathy subjects. They also documented
that IL-6 deceases with the duration of diabetes because the levels of IL-6 was low in patients
who had diabetes for more than 10 years as compared to those patients who had diabetes of less
than five year duration (Yuuki et al 2001).
1.17.1.5. IL-6 disturbs immune privilege site: A study was performed in the animal model to
define the immunosuppressive status of aqueous humor (AqH) in the mouse eyes. During the
experiment, the mouse eye was exposed to endotoxin-induced uveitis (EIU) and the aim of the
scientists was to identify the set of cytokines that are accountable for immune-modulatory
activity within EIU AqH. It was demonstrated that there is local production of IL-6 after PLS-
induced intraocular inflammation. Therefore they concluded that it is IL-6 that is a key hazard to
ocular immune privilege. Therefore, it was concluded that approaches should be developed to
24
decrease intraocular synthesis of IL-6 and in this way it may reduce the inflammation and would
restore ocular immune privilege (Ohta et al 2000).
It has been observed that most of the time there is a rejection of retinal pigment epithelium
(RPE) allografts after retinal transplantation and therefore the long term success is difficult
(Enzmann et al 2000, Algvere et al 1997, Gouras et al 1996). A study was conducted to
determine the importance of IL-6 during the rejection process and to identify the possibility to
use its levels for monitoring transplant rejection. It was shown that there is an increase in the
level of IL-6 in the vitreous fluid after the transplantation and it was low in the control group.
They supported the potential of IL-6 to act as a modulator of the immune response after such
transplantation. They also suggested that since there is a local production of IL-6 in the eye
therefore for monitoring purposes, after the transplant it will not be advisable to determine the
level of IL-6 in the serum (Enzmann et al 2000).
A study was conducted to measure the levels of cytokines in the vitreous fluid of patients
suffering from different eye diseases. They included the patients of proliferative diabetic
retinopathy (PDR), proliferative vitreo-retinopathy (PVR), vitreous hemorrhage and patients of
macular pucker. Elevated levels of IL-6 were detected in the vitreous fluid of PVR and it
correlated with disease severity but it was low / undetectable in patients with PDR. They
proposed the contribution of IL-6 in the pathogenesis of this ocular disorder (Kauffmann et al
1994).
1.17.1.6. Anti-IL-6 as treatment modality: It has been documented that an increased level of
IL-6 contributes towards different autoimmune inflammatory diseases e.g. RA and SLE
(Nishimoto et al 2006). There is a recombinant humanized anti IL-6 receptor antibody by the
name of tocilizumab, which has been proven to be of value in the usage of many diseases. It has
been used both in experimental studies and also in the clinical settings as well e.g. RA, systemic
onset juvenile idiopathic arthritis, Chron’s disease, reactive astrogliosis, and experimental spinal
cord injury (Yoshimura et al 2009).

25
1.17.1.7. Role of IL-23: In a study an experimental model, experimental autoimmune uveitis
(EAU) was used to determine the contribution of IL-6 in the initiation of refractory ocular
inflammation. It was observed that for the establishment of IL-17 producing T-helper subset
(Th17) from naïve CD4+ T cells, both the cytokines i.e. IL-6and IL-23 are needed. It was
concluded that IL-6 is accountable for the development of ocular inflammation which is at least
partially because of IL-6 dependent Th17 differentiation. Therefore in humans, to treat refractory
endogenous uveitis, IL-6 may be considered as a target. It has been found that during chronic
ocular inflammation, it isTh-17 which is blamed for. In this sequence of inflammatory reaction,
IL-6 has been recognized as an important element in the induction of Th-17 from the naïve T
cells along with the combination of TGF-β. Both the cytokines i.e. IL-6 and IL-23 have been
identified for the production of Th-17. IL-17 has been identified as a vital component in the
pathogenesis of different inflammatory and autoimmune disorders, e.g. RA (Murphy et al 2003),
chronic obstructive pulmonary disease (Curtis et al 2007), bone destruction (Sato et al 1992),
EAE (Langrish et al 2005) and experimental autoimmune uveo-retinitis (Yoshimura et al 2008,
Amadi-Obi et al 2007). Further, it has been suggested that by blocking the cytokines such as IL-
6 and IL-23 improves EAU in terms of Th-17 differentiation and its expansion (Yoshimura et al
2009).
1.17.1.8. IL-6 and Treg cells: The crucial role of IL-6 in the production of Foxp3 CD4+CD25+
regulatory cells and Th17 has been studied. It was documented that IL-2 and TGF-beta drives
immature (naïve) T cells into regulatory cells (iTregs) that have the expression of
forkhead/winged helix transcription factor (Foxp3). Further it was observed that by the
combination of IL-6 with the TGF-beta causes induction of IL-17 producing cells (Th17).
Further, IL-6 cytokine in combination with TGF-beta, which is coming from thymus-derived
natural regulatory T cells (nTregs), can also convert them to Th17 cells (Xu et al 2007). It has
been documented that IL-6 receptor expression and also IL-6 signaling is being down regulated
by the IL-2 and TGF-beta cytokine (Zheng et al 2008). It was found that activating nTregs in the
presence of IL-2 and TGF-beta down regulated expression of IL-6 receptor and its signaling,
thus enabling them to also develop resistance against conversion of Th17 (Xu et al 2007, Zheng
et al 2008). Further it was suggested that in an inflammatory condition, resistance of iTregs to

26
attain the form of Th17 recommends that they can be more effectively used as compared to
nTregs (Zheng et al 2008).
1.17.1.9. IL-6 and Th17 cells: It was found that IL-6 and TGF-beta is required for lineage
commitment of Th17and for the maintenance of this lineage IL-23 is essential. It was
demonstrated that there is constitutive expression of IL-23 receptor and RORγt (lineage specific
transcription factor for Th17) upon NKT cells and therefore they can rapidly cause IL-17
production upon ligation of its receptor and it is independent of IL-6. It was concluded that IL-
17which is secreted from NKT cells (Rachitskaya et al 2008) is not due to a particular subset of
NKT and it differs considerably from the adaptive IL-17 which is being produced by Th17 cells
(Rachitskaya et al 2008). It has been documented that innate IL-17 production by the NKT cells
is quite rapid, it is independent of IL-6, it is facilitated by the engagement of TCR and more over
it is constitutively expressed IL-23R which makes it different from the adaptive IL-17. It was
concluded that contribution of IL-17 from NKT cells is different as compare to the involvement
of pro-inflammatory IL-17 from Th17 cells. These differences have been associated with the
effector cells in different autoimmunity models (Rachitskaya et al 2008).
1.17.2. IL-17
CD4+ T cells have been divided into various subgroups which are on the basis of different
cytokines that are being produced and also upon the various functions they perform. One
population of Th cells is Th17 that is characterized by the production of IL-17 cytokine
(Harrington et al 2005). IL-17 comprised of six family members of related cytokines i.e. IL-17A,
B, C, D, E, and F (Kolls et al 2004). It is IL-17E that is also labeled as IL-25, and it has been
designated with Th2 responses and also with the immune responses against helminthes (Fallon et
al 2006, Owyang et al 2006). It is suggested that IL-17A is a pro-inflammatory cytokine which
has the capacity to induce the production of many different cytokines and chemokines e.g. IL-6,
IL-8, GM-CSF and MCP-1, and endothelial and epithelial cells. (Cooke et al 2006)
1.17.2.1. Role of IL-17:In 1995 when scientists became aware of IL-17 and they found out that
it is produced by T cells and this cytokine has wide effects on inflammation and the activation of
neutrophils (Fossiez et al 1996, Yao et al 1995). Later during 2006, while performing

27
experiments on muse model, precise source of IL-17was identified and then these cells were
labeled as Th17 cells (Miossec et al 2003). It has been documented that these Th17 cells have
major contribution in different human diseases that are related to inflammation and tissue
destruction such as rheumatoid arthritis, psoriasis, Crohn’s disease, and multiple sclerosis,
therefore it was suggested that IL-17 has got the potential to be used as treatment option
(Firestein et al 2003, Lubberts et al 2000). It was documented that constant supply of IL-17 by
virtue of over-expression of gene in a healthy knee joint induced immense damage and it was
accompanied with broad inflammatory cell migration, erosions of bones and there was
degradation of cartilage tissue (Lubberts et al 2002). It has been observed that synovium of the
rheumatoid arthritis patient can produce IL-17. Further, along with inflammation of synovium,
there is bone resorption which also associate with inflammation induced by IL-17 and it also
participates in similar diseases e.g. periodontal disease and joint prosthesis loosening (Anderson
et al 2007, Oda et al 2003).
1.17.2.2. Pro-inflammatory cytokine: IL-17 is regarded as a pro-inflammatory cytokine like
TNF-α, IL-1, IL-6, IL-8, GM-CSF and chemokines CXCL1, 2 and 8, which are the hall marks
of acute inflammatory process (Aggarwal et al 2002, Fossiez et al 1996, Jovanovic et al 1998,
Yao et al 1995). The salient feature of Th17 mediated inflammation is that it mobilizes
chemokines that are essential for the recruitment of neutrophils (Cooke et al 2006).
1.17.2.3. Th1 vs Th17: The contribution of Th17 cells in inducing autoimmune pathology is also
being acknowledged in those conditions which were blamed for Th1 mediated (Amadi-Obi et al
2007). In a study it is shown that two human inflammatory diseases i.e. uveitis and scleritis have
great contribution of Th17 cells and their findings were confirmed in EAU; a model for uveitis
(Amadi-obi et al 2007). It has been observed that IL-2 causes expansion of Th17 cells while they
are inhibited by INF-γ (Amadi-obi et al 2007). It was observed that the number of Th17 cells
was increased in the infections of eye i.e. active uveitis and scleritis and the number of Th17
cells were decreased after treatment (Amadi-obi et al 2007). It was documented that IL-17 is
elevated during EAU, uveitis and scleritis, and at the same time IL-17 cytokine induced
expression of TNF-α on retinal cells, that suggested the mechanism of Th17 to cause pathology
in the ocular region (Amadi-obi et al 2007).

28
1.17.2.4. IL-17 in human diseases and in animal models: Increased levels of IL-17 have been
detected in rheumatoid synovitis, multiple sclerosis, psoriasis and systemic lupus erythematous
(Firestein et al 2003). TGF-β plus IL-6 are essential for the development of Th17 cells from the
naïve CD4+ T cells. It was observed that for this differentiation, there should be nonexistence of
INF-γ (Veldhoen et al 2006, Park et al 2005, Harrington et al 2005). Further it was suggested
that IL-23 is needed for IL-17 production and it actually promotes Th17 cell expansion (Duerr et
al 2006). Later some of the studies pointed out that by particularly targeting IL-23 one can be
reduce the symptoms of inflammation (Lock et al 2002).Two experimentally induced
autoimmune conditions i.e. collagen induced arthritis (CIA) and experimental induced
encephalomyelitis (EAE) and many other conditions are infect facilitated by Th17 cells (Cua et
al 2003, Murphy et al 2003). Different in vivo experimental studied have pointed out that by the
neutralization of IL-17 through specific antibody one can prevent the initiation of EAE. Further
it was observed that the deficiency of IL-23 protected against EAE and CIA disease (Cua et al
2003, Murphy et al 2003).
Using the model of experimental autoimmunity uveitis (EAU), it was shown that Th1 and Th17
cells have the ability to cause tissue damage that depends on the methods used to initiate the
disease (Cua et al 2003, Murphy et al 2003). It was observed that by giving antibodies against
IL-17 one can inhibit EAU disease that can develop after immunization with retinal antigen
intra-retinal binding protein (IRBP) and it can also reverse an established disease. It was
concluded that Th17 is not the only reason for the tissue damage in MS or EAE (Cua et al 2003,
Murphy et al 2003).
It has been observed that IL-1, IL-6 and IL-23 facilitate differentiation of Th17 in humans and
there is no need for the TGFβ-1 (Acosta-Rodriguez et al 2007). It has been documented that
Th17 cells are vital for the immunity to check fungi and extracellular bacteria and they can also
be blamed for the pathogenesis of autoimmune diseases. Therefore, it was suggested that by
specifically attacking Th17 cells, beneficial effects in inflammatory and autoimmune diseases
can be achieved (Chen et al 2008, Lubberts et al 2007).

29
1.17.2.5. Concepts about IL-17 formation: It was observed that IL-6 with TGF-beta can induce
Th17 cell generation from the naïve T cells while TNF-alpha and IL-1beta is not required
(Kimura et al 2007). At the same this reaction inhibits TGF-beta induced Foxp3 expression
(Kimura et al 2007). It was also found out that IL-6 and TNF-beta can sustain activation of
signal transducer and activation of transcription (Stat)3, but they cannot express Stat1 (Kimura et
al 2007). Either IL-27 or INF-γ can suppress Th17 induction by TGF-beta along with IL-6 and
they can also express preserve Stat1 activation (Kimura et al2007).
It was observed that Th17 cells with specificity for self-antigens can be pathogenic because they
cause initiation of sever autoimmunity and inflammation (Bettelli et al 2007). Further, it was
documented that TGF-beta along with IL-6 and transcription factors STAT3 and RORγt are
needed for the initial stages of Th17 cells and for the later stabilization of Th17 cells,IL-23 is
required (Veldhoen et al 2006). A new player (IL-21) which is produced by Th17 cells
contribute substantially in the multiplication of Th17 cells (Bettelli et al 2007). Another study
documented that the differentiation of Th17 cells in mice, needs TGF-β and IL-6 and the
transcription factor RORγt (Acosta-Rodriguez et al 2007). In human beings naïve CD4+ T cells,
RORγt expression and Th17 formation is induced by IL-1β while it is potentiated by IL-6 but
this lineage of cells is depressed in the presence of TGF-β and IL-12 (Duerr et al 2006). Acosta-
Rodriguez et al concluded some basic dissimilarity in the ingredients for the differentiation of
Th17 cells in human and mice (Acosta-Rodriguez et al 2007).
It was observed that IL-6 can endorse the growth of Th17 by stimulating T cells gp130-STAT3
pathway and in this way it has smallest effect on the development of Treg (Acosta-Rodriguez et
al 2007). Acosta-Rodriguez et al concluded that by blocking IL-6-gp130-STAT3 pathway ofCD4
T cells, can be a reasonable option to check unsolicited Th17-mediated responses that also
include autoimmune diseases (Nishihara et al 2007).
1.17.2.6. Role of IL-6 in IL-17 production: In an experiment upon IL-6 deficient (Il6-/-) mice it
was observed that these animals cannot establish Th17 production and the repertoire in their
circulation consisted of Foxp3 Treg cells. Upon removing the Treg cells, there was re-
appearance of Th17 cells in these (Il6-/-) mice, which suggested some other routes for the

30
production of Th17 cell in vivo. They showed that IL-21 along with TGF-beta induced Th17
cells in naïve IL6-/- T cells but IL-21-receptor deficient T cells are unable to generate Th17
response (Korn et al 2007).
TGF cytokine is critical for initiation ofTh17 development and it also up-regulates IL-23R
expression, and in this way it shows responsiveness to IL-23. It is INF and IL-4 that antagonizes
the action of TGF on naïve T cells, therefore it indicates the process for the divergence of Th1,
Th2 and Th17 lineage (Mangan et al 2006).
IL-23 causes the expansion of Th17 cells that leads to production of IL-17, IL-6 and TNF-α
(Veldhoen et al 2006). Now the scientists believe that Th17 cells discovery is a mile stone in
making better understanding of inflammatory processes (Cooke et al 2006). It has been
documented that there is an increased production of IL-23 and IL-17 in the pathogenesis of
several autoimmune diseases, including multiple sclerosis and rheumatoid arthritis (Joseph et al
2011). Further they suggested that inflammation by virtue of IL-23/IL-17 and understanding
about related molecules can become a therapeutic agent for autoimmune diseases (Wong et al
2008).
1.17.2.7. IL-27: IL-27 is constitutively present in the retina of eye and it is up-regulated by INF-
γ while it obstructs propagation of Th17 cells (Amadi-Obi et al 2007). It suggested that it is INF-
γ that may alleviate uveitis by antagonizing Th17 by the production of IL-27 in the target tissue.
It is believed that IL-23 and IL-27 also inhibited secretion of IL-2 to the almost at the same
degree but this effect is more noticeable for IL-27 (Amadi-Obi et al 2007). IL-27 prevents the
IL-2 production, suppresses Th1 expansion and Th17 cells and also impedes IL-23 induced IL-
17 expression through the activated CD4 T cells (Owaki et al (2005). It was documented that
increase in activated Th17 cells was stopped by primary retina cells, through IL-27 which was
endogenously produced. It has been observed that there is a reciprocal antagonism between Th1
cells and Th17, which becomes the reason for the production of mutual T-cell developmental
pathways by IL-27 and IL-23. It is now known that Th17 cells are involved in the pathogenesis
of immune-mediated diseases (Amadi-Obi et al 2007) and studies have documented that specific

31
targeting of IL-23 may result in the improvement of several inflammatory conditions (Cooke et
al 2006).
1.17.2.8. IL-23: The establishment of IL-23-IL-17 cytokine network in different mechanisms of
pathogenesis lead the scientists to further investigate these cytokines for CD4 T effector lineage
i.e. Th17. It has been documented that Th17 cells play role in the control of certain pathogens,
analogous to the specialized functions of Th1 and Th2 cells to deal with intracellular pathogens
and also parasitic infections (Harrington et al 2006). IL-23 enhanced production of human Th-17
cells and at the time it is a powerful inducer of other pro-inflammatory cytokines (Chen et al
2007).
It is well documented that rheumatoid arthritis and multiple sclerosis are basically IL-17
mediated autoimmune diseases (Cooke et al 2006). It is believed that in future manipulation of
IL-17/23 axis of inflammation could be used as therapeutic targets for various diseases
(Furuzawa et al 2007).It is believed that IL-23 in not a differentiation factor for the production of
Th17 cells from naïve T cells (Veldhoen et al 2006). A dichotomy was observed in the initiation
of pathogenic Th17 cells that could induce autoimmunity and Foxp3 Treg cells that can check
autoimmune tissue injury (Bettelli et al 2006).
1.17.2.9. IL-21 is a major element in the production of IL-17 secreting CD4T cells and also for
the establishment of experimental autoimmune encephalomyelitis. The results of in vitro studies
have suggested that IL-21 can guide Th17 responses along with TGF-β (Spolski et al 2007). At
the same time one study has challenged the perception that IL-21 is important in producing Th17
mediated immunity and disease (Korn et al 2007). They also suggested that IL-21 signaling
inhibits, rather than exacerbates Th17 mediated EAE (Coquet et al 2008).
RORγt induces transcription of the genes encoding IL-17. Th17 cells are constitutively expressed
all over the intestinal lamina propria, also express RORγt and they are not present in the mice
which are deficient for RORγt or IL-6 (Amadi-Obi et al 2007). RORγt is a main element for the
immune homeostasis and therefore it can be used as a therapeutic option in inflammatory
diseases (Ivaylo et al 2006).

32
It was observed that EAE is ameliorated by the suppression of T-bet and it is basically through
stopping initiation of auto reactive Th1 cells and also by inhibiting pathogenic Th17 cells via the
regulation of IL-23R (Gocke et al 2007).
A small molecule present in herbal medicine is known as ursolic acid (UA) and its contribution
to suppress IL-17 production by selectively antagonizing the function of RORγt was studied. It
was found that this molecule specifically and quite efficiently stops the function of RORγt, that
lead to immensely decrease in IL-17 expression in developing and already differentiated Th17
cells. Therefore, UA was suggested as a reasonable option for treating Th17-mediated
inflammatory diseases and cancer (Tao et al 2011).
T-betis an important element for the production of INF-γ producing CD4 Th1 lymphocytes and
the suppression of T-bet can ameliorate EAE because in this way it stops initiation of auto
reactive Th1 cells and it also checks pathogenic Th17 cells through IL-23R regulation (Gocke et
al 2007).
1.17.2.10. Plasticity of Th17: It has been observed that by providing appropriate stimuli such as
IL-12, Th17 lineage can be converted into Th1-type cells (Zheng et al 2008). In early days it was
believed that IL-23 is an essential factor for expanding and maintaining Th17 cell responses but
studies have documented that IL-23 can facilitate aberration from Th17 to Th1 phenotype (Cua
et al 2006, Veldhoen et al 2006). It has been established that variations of the IL-23R gene can
effect IL-22 secretion (Weaver et al 2006). Nevertheless the findings of a study upon two
antibodies for neutralizing IL-23/p40 subunit were not promising. Further, a study performed
later for blocking IL-17A was also not effective in CD (Fujino et al 2003). It is assumed that
tissue damaging immune response in IBD is due to some other cytokines and they are not Th17
related (Fujino et al 2003). They speculated that at the same time neutralization of at least two or
more of these molecules e.g. IFN-gamma and IL-17A could assist the patients to deal with the
active phases of IBD (Annunziato et al 2007, Monteleone et al 2011).There is a contradiction in
the production of Th17 cells that leads to autoimmunity and Treg cells that check autoimmune
tissue injury (Fujino et al 2003).

33
It has been demonstrated in an in vitro study that in inflammatory conditions at the single cell
level FoxP3 cells can be stimulated to secrete IL-17 (Ivanov et al 2006). They suggested a
different mechanism through which inflammation can stimulate Tregs cells to secrete IL-17, and
hence reducing suppression and at the same time promoting an inflammatory milieu. They
documented flexibility of a subset of Tregs in the circulation, which are influenced by
environmental factors to exhibit dual Treg and Th17 function (Baecher-Allan et al 2009).
A study was performed to determine the contribution of cytokines that were labeled to promote
murine Th17 cells on naïve human CD4 T cells. It was found that IL-23 stimulates production of
human Th17 cells and it is the key inducer of other pro-inflammatory cytokines. These results
are significant in the pathogenesis of human autoimmunity as compared to animal models (Duerr
et al 2006). It has been observed that for CD4 T cells in human, IL-23 is an exceptionally
effective inducer of IL-22, INF-γ, and other cytokines that participate in autoimmune diseases.
The action of IL-23 is of interest, but at this point of time this cytokine seems to have diverse
effects on human CD4 T cells (Chen et al 2007).
1.17.2.11. Difference of IL-17 in humans and animals: It has been documented that the
features that guide the expression of IL-17 in human CD4 T cells are different from mice. It was
observed that IL-6 and IL-21 could not initiate IL-17 expression in both naïve and effector T
cells, and infect TGF-beta checked expression of IL-17 (Evans et al 2009). They concluded that
Th17 cells of human and mouse need different factors during differentiation. They suggested that
human Th17 cells seem to regulate innate immunity in epithelial cells as well (Wilson et al
2007).
1.17.2.12. γδ T cells and Th17: The involvement of γδ T cells and Th17 cells in a mouse model
of pulmonary inflammation and fibrosis induced by silica particles was studied. They reported an
accumulation of IL-17A and IL-22 producing T cells in experimental silicosis. They
demonstrated that the early lung inflammation had numerous neutrophils and acute tissue injury
require the production of IL-17A by γδ T lymphocytes and Th17 cells. They suggested that Th17
cells producing IL-17A are required for acute alveolitis during experimental silicosis. However,
IL-17A and IL-22 are dispensable for chronic inflammation and are not essential modulators of

34
fibroblast functions, uncontrolled tissue repair, and lung fibrosis induced by silica particles (Re-
Sandra et al 2010).
1.17.2.13. Invariant natural killer T cells: A study was conducted by using a model of
experimental autoimmune uveitis (EAU) immunized with an uveitogenic regimen of the retinal
antigen and the aim was to explore the role of invariant natural killer T (iNKT) cells in the
directive of autoimmunity to retina. It was found that once iNKT cells are activated, they protect
the animal from EAU by involving innate production of INF-γ and dampening of Th1 and Th17
effector responses. It was suggested that protective effect of iNKT cells in EAU seems to require
INF-γ and is associated with reduced adaptive INF-γ and IL-17 responses. They demonstrated
that iNKT cells can actively participate in regulating the autoimmune response to
immunologically privileged retinal antigens. The mechanism involves the induction of innate
INF-γ production through ligation of the invariant TCR and leads to inhibited development of
adaptive Th1 and Th17 responses that represent pathogenic effector mechanisms in uveitis
(Grajewski-Rafael et al 2008).
1.17.2.14. IL-17 and diseases: A study was performed on skin biopsies of psoriasis patients and
high level of IL-17, IL-23 and IL-22expression was observed. The cytokines such as IL-23, IL17
and IL-12 had been identified as over expressed in the lesions of CD. In the patients of multiple
sclerosis, brain biopsies showed high level of gene expression for IL-17 (Firestein et al 2003).
High levels of IgE have been identified in patients of hyper IgE syndrome which is a primary
immunodeficiency (Minegishi et al 2007). These patients documented various kinds of mutations
in the Stat3 gene and there were defects in Th17 cells (Ma et al 2008). As it is believed that IL-
23 is involved in the production of IL-17, therefore stopping IL-23 could be a way to manipulate
Th17 pathway. Kobayashi et al concluded the use of monoclonal antibody against p40 that is
similar to IL-12 and IL-23, which is effective for psoriasis and Crohn’s disease (Kobayashi et al
2008).
Studies in experimental models of inflammatory bowel diseases (IBD) indicated that T cell
derived cytokines are fundamental mediators of the tissue damage. In the beginning, CD and
ulcerative colitis (UC) were thought as the two perfect examples of Th1 and Th2 associated
35
diseases respectively but at the moment it is clear that CD and UC related inflammation has
increased production of cytokines by the Th17 cells (Fujino et al 2002).
In the gut Th17 cells change their cytokines production according to the stimuli they received
and they can convert into Th1 producing cells (Ivanov et al 2006). Genome-wide association
studies in IBD and on candidate genes had showed that polymorphisms of Th17-related genes,
such as Stat3 or IL-23R, often associate with IBD (Franke et al 2010, Anderson et al 2011, Glas
et al 2009). Therefore it supports the contribution of Th17 pathway in the pathogenesis IBD.
In humans, it is documented that presence of T cell clones in the intestines of IBD patients can
induce IL-17 and INF-gamma and hence it is labeled as Th1/Th17cells (Ivanov et al 2006).
Further, such dual producer cells have also been identified in EAE lesions in mice. These cells
express Th17-inducing transcription factor (ROR-γt) and Th1-stimulating transcription factor (T-
bet) (Ivanov et al 2006).
At the moment it is believed that Th1 and Th17 cells are capable of inducing autoimmunity
(Steinman et al 2008).Some of the Th17 cells present in the gut of CD patient yield both IL-17
and INF-γ (Th17/Th1) (Annunziato et al 2007). Self-reactive Th cells co-express IL-17 and IL-
22 but IL-22 seems unlikely to be involved in autoimmune pathogenesis of CNS in vivo
(Kreymborg et al 2007).
Th17 cells have been associated in the pathogenesis of several autoimmune diseases, e.g.
multiple sclerosis and rheumatoid arthritis (Chen et al 2006, Kotake et al 1999). It was
concluded that IL-17 is dispensable, at least in large part, in the pathogenesis of autoimmune
diabetes (Joseph et al 2011). Nakae et al suggested that IL-17 is essential in the development of
(CIA) through activating auto antigen specific cellular and humoral immune responses. (Nakae
et al 2003)
1.17.2.15. IL-17 and type-1 diabetes: In a study on children with type-1 diabetes (TID), the
Th17 immunity in the peripheral blood T cells was studied. They documented increased level of
IL-17 and expression of IL-17, IL-22 and retinoic acid-related orphan receptor C isoform 2.

36
Foxp3 transcripts have been observed upon T cell activation in vitro. They showed that IL-17
had harmful effects on human islet cells in vitro; it potentiated both inflammatory and pro-
apoptotic responses. Their results highlighted the contribution of IL-17 immunity in the
pathogenesis of human TID which also indicated towards probable option as treatment
(Honkanenat et al 2010). The mutual relationship between regulatory T cells and Th17 cells
suggested options to revert the function of regulatory T cells in autoimmune diseases (Miossec et
al 2009).
Serum levels of IL-17, IL-22 and INF-γ were found significantly elevated in comparison to
normal controls in the patients of psoriasis. The levels of IL-17 and IL-22 were significantly
correlated with the severity of disease while INF- γ level was not. It was suggested that psoriasis
is a condition which might have a mixture of Th1 and Th17 involvement. (Almakhzangy et al
2009).
1.17.2.16. Prognostic value of IL-17:A study was conducted to investigate the predictive value
of tumor-infiltrating IL-17 cells in human esophageal squamous cell carcinoma (OSCC).
Increased levels of tumor infiltrating IL-17 lymphocytes were linked with better survival. It was
suggested that tumor infiltrating IL-17 producing cells in OSCC may provide shielding effect in
the tumor microenvironment and this marker can be opted as a predictive tool for OSCC patients
(Lv et al 2011).
In a study on liver disease, various aspects of IL-17 and Th17 cells were looked at. It has been
observed in various liver diseases that in humans and mice Th17 cells and Th17 related
cytokines are present. Precisely pathogenic involvement of Th17 cells to liver inflammation may
differ and it depends upon the disease e.g. infectious and autoimmune disorder (Hammerich et al
2011).
Bahcet disease (BD) is a chronic, systemic, relapsing inflammatory disease that mainly featured
as recurrent uveitis, oral aphthae, genital ulcers and skin lesions. The involvement of IL-17 CD4
T cells in BD was studied and it was observed that rIL-23 stimulate creation of IL-17 by CD4 T
cells in BD patients. It was suggested that in active uveitis in BD patients, IL-23/IL-17 pathway

37
is involved. The increased levels of IL-17 were thought to be the reason for intraocular
inflammation of BD patients (Chi et al 2011).
ANCA-associated vasculitis (AAV) patients showed increased serum level of IL-17, IL-23 and
percentage of auto-antigen specific Th-17 cells and surprisingly the level remained increased in a
number of patients during convalescent stage. There was no difference in the level of INF-γ
between patients and control group. They concluded that Th17 and more precisely IL-23 are key
intermediaries of sever disease in AAV (Nogueira et al 2010).
1.17.2.17. IL-17 Foxp3 Treg cells: It has been observed that human thymus do not contain IL-
17 producing Treg cells which suggested that IL-17 Foxp3 Treg cells are produced in the
peripheral circulation (Voo et al 2009).IL-17 Treg cells are thought to contribute in antimicrobial
defense and it checks autoimmunity and inflammation (Voo et al 2009). Therefore, Treg cells
might participate towards antimicrobial innate immunity by producing IL-17. It was claimed that
these cells restrict inflammation and autoimmunity at the same time (Voo et al 2009).
It is demonstrated that IL-17 is generated simultaneously with INF-γ by the T cells that infiltrate
coronary artery cells and in this way cytokines act synergistically to build pro-inflammatory
responses in vascular smooth muscle cells (Eid at al 2009). IL-17 is a vital component of T cell
mediated skin response and they may have systemic or antagonist effects on INF-γ and TNF-α-
stimulated keratinocyte activation (Albanesi et al 1999).
1.17.2.18. Variation in the therapeutic effect of targeting IL-17: It has been documented that
there are major variances in the development of Th17 cells and also it is important that how they
function in autoimmune diseases in humans and experimental animals. It has been suggested that
there are differences in the therapeutic effects of attacking IL-17 related molecules in human
autoimmune diseases (Yamada et al 2010). It is believed that understanding differentiation
pathways of IL-17 and Th17 has improved the understanding of immunologists about chronic
tissue inflammation, in particularly where Th1 cells were thought as the reason for pathology.
The closeness of Treg and Th17 differentiation pathway is of special interest for future research
because now we can hypothesize that Th17 immune response could be more influentially

38
changed into Treg or tolerogenic reactions than Th2 or Th1 pathways. It is believed that the
knowledge about Th17 has added difficulty towards immune regulation, but simultaneously it
has assisted in explaining various themes in T cell differentiation (Schmidt-Webber et al 2007).
1.17.2.19. IL-17 and other cytokines manipulation: It has been observed that in RA patients,
TNF-α inhibitors can control the disease by limiting TNF-α, and by repairing defective
regulatory T cell functions (Nadkarni et al 2007). Suppression of IL-17 can affect acute defense
mechanisms by the involvement of neutrophils. In mouse mode, suppression of IL-17 was
associated with enhanced mortality due to bacterial lung infections (Dublin et al 2006). Further,
suppression of IL-23 pathway was also associated with the abnormalities in the cell mediated
immunity that included more severity of mycobacterial infections in the mouse (Chung et al
2003). They concluded that by combined suppression of TNF and IL-17, could assist to target
two different cell types, monocytes and T cells (Miossec et al 2009).
It has been observed that by blocking important cytokines in vivo specificallyIL-6 could result in
a drift from Th17 to the regulatory phenotype and in this way, it may persuade latency of
autoimmune disease or stop transplant rejection (Afzali et al 2007). Researchers have
documented the role of various cytokines as a treatment modality. At the same time they also
suggested the side effects of this anti-cytokine treatment such as the use of anti-TNF-alpha can
expose the patients to mycobacterium tuberculosis infection (Feldmann et al 2000, Dinarello et
al 2003)
1.17.2.20. Protective side of IL-17: Protective aspect of the IL-17 has been documented in a
study of mycobacterium tuberculosis, where IL-17 was needed to recruit CD4+ T cells; which
are basically required to produce INF-gamma to protect the lung (Khader et al 2007). Similarly,
an asthma model documented that neutralization of IL-17 enhances infiltration of eosinophil
during the effector phase of the disease, while providing recombinant IL-17 decreases airway
hyperactivity and decreases the number of eosinophil and lymphocytes in the bronchial lavage
(Steinman et al 2008, Schnyder-Candrian et al 2006). The protective side of IL-17 has also been
documented by Tato et al (2006) stating that IL-17 along with IL-25 is important for the
resistance against Klebsiella pneumonia and mycobacterium tuberculosis (Tato et al 2006).

39
It was documented that IL-17 and IL-23 affect the production of antimicrobial proteins in the
mucosal epithelium (Duerr et al 2006, Yen et al 2006). It was observed that TGF-β1 and IL-6 are
essential for the growth of Th17 cells from naïve precursors; IL-23 also seems to contribute in
IL-17 production in the mucosal tissues in response to different infectious stimuli. As compared
to Th1 cells, IL-23 and IL-17 documented a little participation in manipulating host defense
against intracellular bacteria such as mycobacterium tuberculosis, which suggested an important
contribution of Th17 lineage in host defense against extracellular pathogens (Aujla et al 2007).
In another study distinct as well as specific IL-17 and IL-23 producing CD4+ T cell subsets were
documented and it was suggested that these contribute towards human anti-mycobacterial
immune response (Scriba et al 2008).
It is believed that along with a healthy diet, discovering the predisposing genes for diabetes and
clarification of their interactions with the dietary products would hopefully reduce the incidence
of T2DM and would improve the outcome of the disease (Dedoussis et al 2006).
The role of IL-6 has been studied in different human diseases and in the development of diabetic
retinopathy (Funatsu et al 2005) but most of scientists concentrated on the determination of intra-
vitreous level of this cytokine. Although scientists did try to measure the level of IL-6 in the
serum of diabetic patients but generally they could not measure its level in the serum (Mocan et
al 2006). IL-6 has been linked with the IL-17 (Rachitskaya et al 2008) and it has been studied in
different diseases e.g. in the development of autoimmune diseases (Annunziato et al 2007). IL-
17 has also been investigated in type 1 diabetes mellitus and increased secretion and expression
of IL-17 and IL-22 in the peripheral blood T cells was documented. At the same time there are
alterations in the Treg cells which are linked with the up regulation of IL-17 cytokine. Further it
was observed that IL-17 had detrimental effects on human islet cells (Honkanenat et al 2010). In
a study it was demonstrated that IL-17+FOXP3+ Treg cells are not produced in thymus but they
are produced in the peripheral circulation. IL-17 producing Treg cells are vital for the body
defense against microbial infections and that it helps against inflammation and autoimmunity.
(Voo et al 2009).

40
2. Hypothesis
Genetic and auto-immune mechanisms are associated with type-2 diabetic retinopathy.
3. AIMS AND OBJECTIVES
The objectives of this study were to
determine Bgl II polymorphism of α2β1integrin gene as a risk factor for the development
of diabetic retinopathy
determine the levels of interleukins (IL-6 and IL-17) and
enumerate CD4+CD25+ cells (T regulatory cells) to determine their role in diabetic
retinopathy

41
4. MATERIALS AND METHODS
4.1. Study design: Analytical-observational cross-sectional study
4.2. Setting: Department of Immunology, University of Health Sciences, Lahore
4.3. Duration: The study was started in May 2009 after the approval of synopsis by the
Advanced Study and Research Board of the University.
4.4. Sample size: n=203 was selected by using the following formula
(Sample Size determination in health studies version 2.0.21 WHO)
= for 95% confidence level P = Anticipated population proportion d = Margin of error = 5% n = Sample Size Z = 1.96, p = 0.157, 1-p = 0.843 and d = 0.05
4.5. Sample size: 203subjects. They were divided into groups as follows
Diabetic retinopathy 143 subjects
Diabetic without retinopathy 30 subjects
Normal healthy control 30 subjects
4.6. Sampling technique: Simple random sampling technique for sample allocation
4.7. Sample selection:
4.7.1. Inclusion criteria
The subjects for this study were recruited in three categories i.e. healthy individuals without
diabetes (Group-I), subjects having diabetes type II without retinopathy (Group-II), and type II
diabetes patients with retinopathy from either sex between 20 – 75 years of age. Group-I subjects
were clinically healthy volunteers and they were not receiving any medication for other reasons.

42
The assessment of eye complications among the patients was made by the consultant
ophthalmologist. Group-II and Group-III subjects were receiving the treatment from their
physicians for their diabetes while Group-III subjects were receiving medications for the
management of diabetes and in addition to that they were receiving laser treatment and /or local
eye drops and/or oral medication for their eye complications. All the diabetic subjects were
recruited from the public hospitals and non-governmental organization out-patient clinics. The
socioeconomic status and level of education of these diabetic subjects was low.
4.7.2. Exclusion criteria
Subjects with a history of infection in the last two weeks and suffering from chronic infections
like TB, autoimmune disorders, etc. were excluded. In addition patients with impaired renal
functions were also excluded.
4.8. Genotyping of BglII Polymorphism
Genomic DNA was isolated from leukocytes using DNA isolation and purification kit
(Fermentas, Canada). For genotyping of Bglll polymorphism, a 600 bp DNA fragment that
contained Bglll was amplified by PCR with a Thermal cycler (BioRad). Sequences of primers are
given in Table 1. PCR conditions of 34 cycles were: the first two cycles were at 94ºC for 1 min,
and 69ºC for 1 min and 72ºC for 1 min; the second two cycles were at94ºC for 1 min, 67ºC for 1
min and 72ºC for 1 min, the remaining 30 cycles were at 94ºC for 1 min, 65ºC for 1 min and
72ºC for 1 min. Amplified DNA was digested with BglII at 37ºC for 3 hours. Resulting product
was electrophoresed on 2% agarose gel. The PCR product containing BglII (+) was cut in to
fragments of 200 bp and 400 bp whereas those containing Bglll (-) were not cut.
4.9. Analysis of cytokines
Concentrations of interleukin 6 and interleukin 17 were determined by ELISA technique.
4.10. Analysis of T regulatory cells
CD4+CD25+ Tregs were enumerated by flowcytometry using CD4 and CD25 monoclonal
antibodies from BD.

43
4.11. Blood Sample collection
Venous blood, 2-3 ml in EDTA tube (purple top) for flowcytometery and for PCR and 2 ml of
blood in plain tube (red top) or gel vial (yellow top) for cytokines by ELISA technique was
collected. Soon after the collection of blood, the sample was transported in an ice pack to the
Department of Immunology, UHS Lahore where processing of the specimen was started within
one hour of sample collection for flowcytometery.
4.12. DNA EXTRACTION
4.12.1. Protocol
Three (3) ml of whole blood was collected in EDTA tube, mixed properly and stored at -20C for
24 hours. The aliquots were thawed and labeled for DNA extraction. 500ul of whole blood was
dispensed in each aliquot, and then added 700ul of TE buffer and it was mixed properly. It was
centrifuged at 13500rpm for 10 minutes. The supernatant was discarded; the pallet at the bottom
of aliquots was dissolved. Then added 700ul of TE buffer in it and it was centrifuged again at
13500rpm for 10 minutes. The supernatant was discarded, and pallet at the bottom of aliquots
was dissolved. Then added 700ul of TE buffer in it and it was centrifuged again at 13500rpm for
10 minutes. These washing steps were repeated for 3-4 times. After removal of supernatant it
was mixed with 375ul, 3 molar sodium acetate and 25ul of 10% SDS and 10ul of proteinase-K.
All the ingredients were mixed well and incubated for overnight in a shaking water bath at 37C.
During the washing steps the pellet was dissolved after every 15 minutes for 5 to 6 times. After
overnight incubation it was mixed properly and added 4% isoamylalcoholat a 1:3 ratios i.e. 2
part of the mixture in the tube and 1 part of isoamyl alcohol. Isoamylalcohol mixture was
prepared in chloroform. Then it was mixed well and centrifuged at 13500rpm for 10 minutes.
After centrifugation two layers were formed, supernatant was collected and lower layer was
discarded. In the supernatant, an equal amount of absolute ethanol which was ice cold was
added. The solution was mixed well and DNA contents (precipitation) appeared like a small
cotton ball /thread. The mixture was left at room temperature for 10 minutes for good
precipitation of proteins, and then it was centrifuged at 13500rpm for 10 minutes. The
supernatant was discarded and the DNA was washed with 500ul of 70% ice cold ethanol. It was
centrifuged at 13500rpm for 10 minutes. During precipitation and washing steps, the DNA
threads were observed and at the end after removal of supernatant, DNA threads were settled at

44
the bottom of aliquots. Supernatant was discarded and the remaining contents of the tube were
washed with 70% ice cold ethanol once more. Once again discarded the supernatant completely
and observed the DNA threads attached/settled at the bottom of the tube. The aliquots were kept
in the incubator at 370C till it dried, then added 50ul of TE buffer, mixed and incubated the
mixture at 67 0C for 30-60 minutes. Then the samples were electrophoresed. (TE buffer, absolute
ethanol, 70% ethanol and isoamylalcohol were stored at4C).
4.12.2. dNTPs
PCR Grade highly pure dNTPs set were used. We made a 10mM dNTPs solution by adding 5µl
of dATP, dCTP, TTP and dGTC (each 100mM) to 30µl sterile double distilled water. Finally for
PCR 2µl of 10 mM dNTP mix containing 2.5mM each dNTP were used in 25µl PCR reaction
(final conc. 200 µM)
4.12.3. TE buffer
In 1 ml of 1 M TrisHCl and 200ul of 0.5 M EDTA was mixed. Its volume was made up to 100ml
with double distilled water. From this, 10 ml 1M TrisHCl was mixed with 2ml 0.5M EDTA and
its volume was made up to 1 liter and its pH was adjusted to 8.
4.12.4. Primers
The stock solution for both the primers was prepared; for Forward primer, which was 383ug
reconstituted in 574ul of low TE buffer to get concentration of 0.67ug/ul and 100 uM was added
in the primer vial. For Reverse primer which was 351ug reconstituted in 522ul of low TE buffer
to get concentration of 0.67ug/ul and 100 uM in the primer vial and stock solution for both the
primers was stored at -20C. From this stock solution, working solution of 1:10 dilution was
prepared to make 10uM or 10pMol i.e. 50ul of stock and 450ul of distilled water. For both the
primers 1:10 dilution was prepared and it was stored at -20C.
Mastermix was tapped and centrifuged for short spin. Dispensed 25ul of it in each reaction tube,
tapped and short spin in micro centrifuge, then PCR was run.

45
4.13. Electrophoresis
Three (3) ul of PCR product was mixed with 3ul of Bromophenol Blue dye. The mixture was
dispensed into the wells for electrophoresis. Voltage of 10-12V was applied for 30 minutes. PCR
product was electrophoresed for 1 hour. The results were observed under the UV light in gel
documentation system.
4.14. DNA Recipe
DNA 1ul, DNTPs 2ul, FP 1ul, RP 1ul, Taq 0.2ul, Buffer (NH4)2 SO4 2.5ul, MgCl2 3ul, dH2O
14.3ul
4.15. Polymerase Chain Reaction (PCR)
The setting for the run of mixture for PCR was 95C 4 min, 94C 30 Sec, 59C 30 Sec, 72C 1
min, 72C 10 min, 40C and the number of cycles were 35.
4.16. Restriction Fragment Length Polymorphism (RFLP)
For restriction fragment length polymorphism (RFLP) 0.2ul of Bgl II was added to 2ul of buffer
and it was mixed with 7.8ul of sterile water. Each PCR reaction product was incubated at 37C
for overnight (14-16 hours) and then the gel electrophoresis was performed by mixing 5ul of
RFLP product with dye and buffer.
After PCR, DNA product 20ul, Hind III (enzyme) 0.2ul, buffer 2ul, nuclease free water 7.8ul
which was 30ul in total was incubated for 2 hours at 37 C and then this mixture was
electrophoresed.
Table 1: Sequences of primers for the amplification of loci
Primer 1
(Nucleotide number 2789-2812)
5′-GATTTAACTTTCCCGACT-3′
Primer 2
(Nucleotide number 3346-3369)
5′-CATAGGTTTTTGGGGAACAGGTGG-3′

46
4.17 Cytokine Determination
IL-6 and IL-17 were determined using commercial (commercially available) ELISA kits
(KOMA BIOTECH INC, KOREA).
4.17.1. Kit Contents
1. Pre-coated 96 well ELISA micro plates (Two) coated with purified high affinity Rabbit
anti-Human IL-6 and IL-17.
2. Detection antibody 2.75ug (lyophilized) which is purified high affinity Rabbit anti-
Human IL-6 and IL-17 (one vial each).
3. Standard Protein (lyophilized) containing recombinant human interleukin (100 ng) one
vial each for IL-6 and IL-17.
4. Color Development Enzyme (lyophilized) containing avidin-HRP (horse radish
peroxidase) conjugate (one vial each).
5. Assay diluent containing 0.1% bovine serum albumin (BSA) in phosphate buffered saline
(PBS) 50 ml each for IL-6 and IL-17 (ready to use).
6. Color development reagent ‘A’ containing tetramethylebenzidine (TMB) solution.
7. Color development reagent ‘B’ containing hydrogen peroxide (H2O2) solution.
8. PBS powder in pouch for one liter (two pouches one each for IL-6 and IL-17).
9. Tween 20 (50% ready to use) two vials one each for IL-6 and IL-17.
10. Stop Solution containing 2M H2SO4 (ready to use).
11. Plate sealer
4.17.2. Reconstitution and Reagents Preparation
Reconstitution and reagents preparation was done on the day of analysis as follows:
1. Standard proteins (100ng)
(a). Reconstitution was done in 0.1 ml (100ul) sterile water for a concentration of 1.0
ug/ml.
(b). Standards were prepared by adding Assay Diluent (0.1% BSA in PBS) at 1:2 serial
dilutions as follows:

47
Step Dilution Method Standard conc.
Step A 2ul of Standard + 1ml of Assay Diluent 2000 pg/ml
Step B 0.5ml of Step A + 0.5ml of Assay Diluent 1000 pg/ml
Step C 0.5ml of Step B + 0.5ml of Assay Diluent 500pg/ml
Step D 0.5ml of Step C + 0.5ml of Assay Diluent 250pg/ml
Step E 0.5ml of Step D + 0.5ml of Assay Diluent 125 pg/ml
Step F 0.5ml of Step E + 0.5ml of Assay Diluent 62.5 pg/ml
Step G 0.5ml of Step F + 0.5ml of Assay Diluent 31.25 pg/ml
2. Detection antibody: 2.75ug (1 vial) of biotinylated high-affinity purified anti-Human IL-6
and IL-17.
(a). Reconstitution was done in 0.275ml sterile water for a concentration of 10ug/ml.
(b). Reconstituted detection antibody was diluted with assay diluent (0.1% BSA in PBS)
to a concentration of 0.25ug/ml (1:40 dilution)
3. Color Development Enzyme (avidin-HRP conjugate)
(a). Reconstituted in 60ul of sterile water.
(b). Reconstituted color development enzyme was diluted with assay diluent (0.1% BSA
in PBS) in 1:200 dilution.
4. Washing solution: PBS powder (1 pouch) was resolved to sterile water and made 1-liter
and then 1ml of Tween-20 (50%) was added to this solution.
5. Color Development Solution was prepared by mixing 1 volume of color development
reagent ‘A’ with 2 volumes of color development reagent ‘B’ (1:2) prior to use.
4.17.3. ELISA Protocol
Two hundred (200) ul of washing solution (1 liter PBS + 1 ml Tween20) was added to each well.
Wells were aspirated to eliminate the liquid and plates were washed three times using 300ul of
washing solution (1 liter PBS + 1 ml Tween20) per well. After the last wash, plates were
inverted to remove the residual solution and the plates were blotted on the paper towel. 100ul of
standard or sample was added to each well in duplicate except one well (blank). Plates were
covered with the plate sealer provided and they were incubated at room temperature for 2 hours.

48
Wells were aspirated to remove the liquid and each plate was washed again for 4 times with
washing solution (1 liter PBS + 1 ml Tween20) as it was done before.100ul of diluted detection
antibody (0.25ug/ml of biotinylated high-affinity purified anti-Human IL-6 or IL-17) was added
to each well. Plates were covered with the plate sealer provided and incubated at room
temperature for 2 hours. Plates were aspirated and washed 4 times with washing solution (1 liter
PBS + 1 ml Tween20) again in the same manner. 100ul of diluted color development enzyme
(1/200 diluted avidin-HRP conjugate) was added in each well. Plates were covered with the plate
sealer provided and incubated for 30 minutes at room temperature. Plates were aspirated and
washed 4 times again as before. 100ul of color development solution (1 vol. of color
development reagent ‘A’ + 2 vol. of color development reagent ‘B’) was added to each well and
incubated at room temperature for proper color development (15-25 minutes). The reaction was
stopped using 100ul of stop solution (2M H2SO4) to each well. The plates were read at 450nm
wavelength using microtiter plate reader (Bio-Rad, USA).
4.17.4. Calculation of results
The average from the duplicate readings of each standard, control and sample was obtained.
Reading of blank was subtracted from each averaged value. Standard curve was made by
reducing the data by using ELISA reader’s computer software (Micro plate Manager Version
2.2).
4.17.5. Cross reactivity
Manufacturer claimed that for IL-6, at 50ng/ml antigens (recombinant protein) such as CNTF,
CT, G-CSF, sIL-6R, IL-11, IL-12, Leptin and OSM did not exhibit cross reactivity. Similarly for
IL-17, at 50ng/ml antigens (recombinant protein) such as INF-γ, IL-8, IL-10, IL-12, IL-16, Il-
17B, IL-17D, IL-17E and IL-17F did not exhibit cross reactivity.
4.18. Flowcytometry
4.18.1. Immunostaining procedure
Samples were prepared by using lyse-wash method on whole blood. For each sample one
hundred (100) ul of anti-coagulated blood (about 1 million cells) of each subject was added into

49
2 Falcon propylene tubes (12 x 75 mm BD Falcon tubes). 20ul of each of FITC (Fluorescein
isothiocyanate) labeled anti-CD4, PE (Phycoerythrin) labeled anti-CD25, and PerCP (Peridinin-
chlorophyll-protein) labeled anti-CD45 monoclonal antibodies were added to one tube and 20ul
of isotype control to the other. All these antibodies and isotype were bought from Becton
Dickinson (BD). Antibodies were vortex before adding them to blood. The tubes were vortex and
incubated in dark at room temperature for 15 minutes. 2ml of BD FACSLyse (containing <15%
formaldehyde and <50% diethylene glycol, diluted 1:10 in deionized water immediately before
use) was added to each tube. The tubes were re-incubated in dark for 12 minutes. The tubes were
centrifuged at 250g/3200 rpm for 10 minutes and supernatant was discarded. The pellet was re-
suspended and the cells were washed twice by adding 2ml of sheath fluid, it was mixed and
centrifuged. The supernatant was discarded. The cells were re-suspended in 0.5ml of sheath fluid
with 2% paraformaldehyde and the data was acquired on flow cytometer (FACS Calibur BD
USA) within 24 hours.
4.18.2. Flowcytometry / Immunophenotyping
FACS Calibur 4-color analyzer (BD USA) was used to analyze the cells. The instrument was
calibrated and fluorescent signal compensation was performed by using CellQuest Pro software
(BD) and Calibrite beads (BD) before the samples were analyzed. The data was acquired by
using these settings (Figure 1).
CD4+ cells (FITC tagged MoA against CD4), CD25+ cells (PE tagged with MoA against CD25)
and CD45+ cells (PerCP tagged with MoA against CD45) was determined using excitation by a
15mW, 488nM, argon-ion blue laser.

50
Fig.1. Calibration and fluorescence signal compensation using Cell Quest Pro software (BD) and
Calibrite Beads. R1 (First row Left; a) indicates gate for lymphocytes. Quadrants in (b) and (c)
indicate thresholds values of double negative, single positive, and double positive cells for FITC,
PE and PerCP labeled antibodies respectively. Fluorescence intensity for FITC, PE and PerCP
dyes are represented in d, e and f (Second row) respectively.
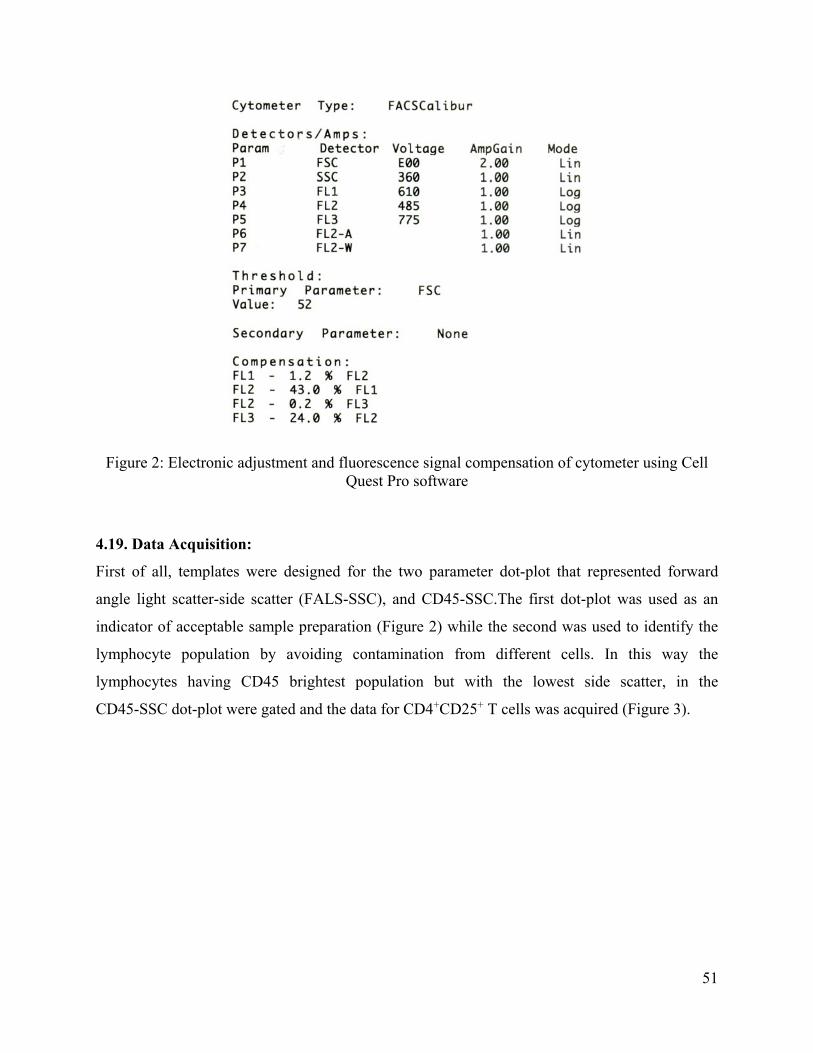
51
Figure 2: Electronic adjustment and fluorescence signal compensation of cytometer using Cell Quest Pro software
4.19. Data Acquisition:
First of all, templates were designed for the two parameter dot-plot that represented forward
angle light scatter-side scatter (FALS-SSC), and CD45-SSC.The first dot-plot was used as an
indicator of acceptable sample preparation (Figure 2) while the second was used to identify the
lymphocyte population by avoiding contamination from different cells. In this way the
lymphocytes having CD45 brightest population but with the lowest side scatter, in the
CD45-SSC dot-plot were gated and the data for CD4+CD25+ T cells was acquired (Figure 3).

52
Figure 3: FALS-SSC two parameter dot-plot showing three populations of WBCs. Top right cluster of cells indicate polymorphs, middle cluster indicates monocytes, the red cluster indicates lymphocytes which were circumscribed and gated as R1with some degree of mixing with debris (bottom; left).
Figure 4: CD45-SSC two parameter dot-plot was drawn to separate lymphocytes from debris, these were circumscribed and 2nd gate (R2) was applied.

53
4.20. Sample analysis
T cells (CD4+CD25+) were analyzed by using the two parameters dot-plot where on X-axis it
was log FITC fluorescence (CD4) and on Y-axis it was log PE fluorescence (CD25). Cell Quest
Pro software was used. Unlike mouse, humans CD4+CD25+ T cells are not clearly discernible
from CD4+CD25- T cells. Instead, they appear as a homogenous population (Figure 4).
Figure 5: CD4-CD25 two parameter dot-plot showing that CD4+CD25+ (right column; upper portion) T cell population is not discernible from CD4+CD25- T cells (lower right). Instead these cells form a continuous population. Lower left quadrant shows double negative cells (CD4-CD25-) and in the upper left quadrant CD25+cells are present.
Therefore the following strategy was adopted. CD25 (PE) one parameter histogram was overlaid
on that for control and the boundary for the fluorescence channel was selected above which not
more than 1% of control cells were detected (Figure 5). This is how the channel was set and
below this limit all the stained cells were considered negative.

54
Figure 6: Determination of criteria for the CD25 positive cells. One parameter histograms for
isotype control (blue outline) and CD25-stained cells (red) were overlaid and the fluorescence
channel was designated such that not more than 1% of the control cells were detected above this
limit. This channel (represented as M1) was selected as a limit before that all the stained cells
were considered negative.
For determination of criteria for CD4+ cells, a different strategy was adopted as there was a clear
demarcation between negative and positive populations. The cutoff for negative and positive
populations was set at the nadir of the first peak (Figure 6). This channel was selected as a limit
below which all stained cells were considered negative.

55
Figure 7: Determination of criteria for CD4 negative and CD4 positive cells. On one parameter
histogram for CD4 stained cells, a fluorescence channel boundary was selected at the nadir of the
first peak and all cells above this channel (M1) were considered positive. Blue out-line
represents isotype control, first green peak (left) represents non-specific staining.

56
Top left; shows the dot-plot of selection of CD45 cells. Top-right shows the dot-plot of CD45 isotype control. Second row left; selection of top 2% population of CD4+CD25+ population. Second row right; isotype control of CD4CD25 cells. Third row: strategy to determine percentage of top 2% of CD4+CD25+ population.
Fig 8: Histograms showing gating strategy using isotype control and Statistics of histogram
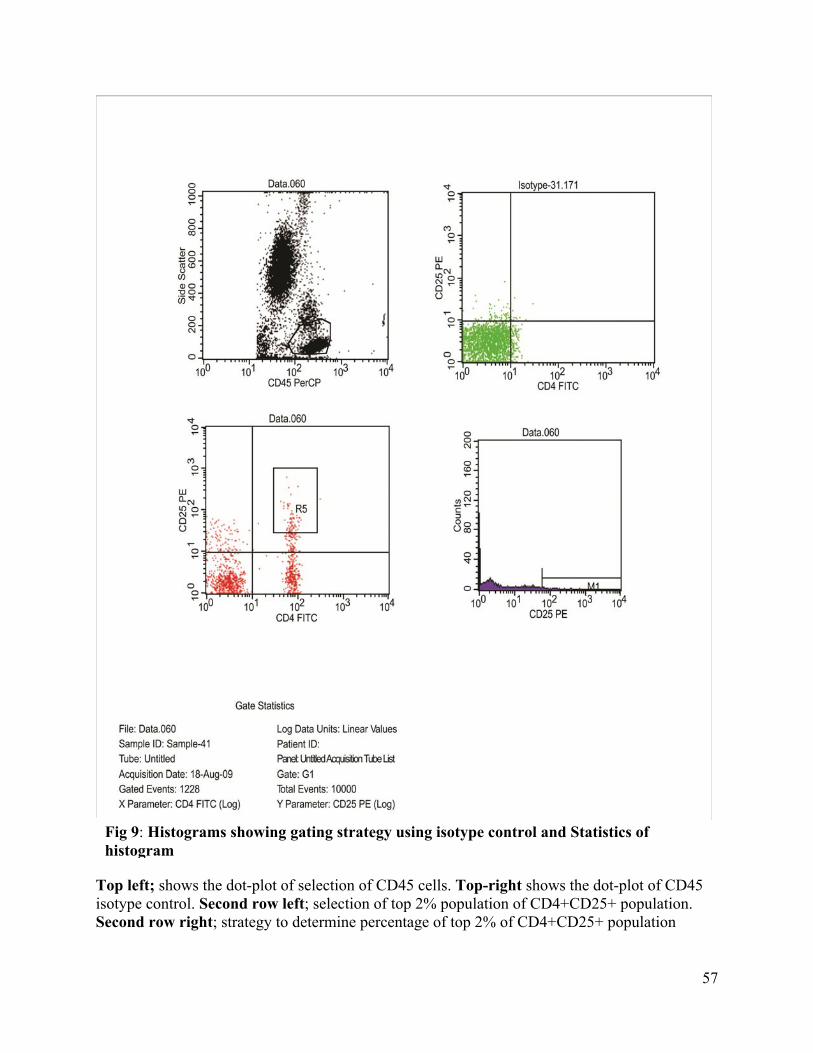
57
Top left; shows the dot-plot of selection of CD45 cells. Top-right shows the dot-plot of CD45 isotype control. Second row left; selection of top 2% population of CD4+CD25+ population. Second row right; strategy to determine percentage of top 2% of CD4+CD25+ population
Fig 9: Histograms showing gating strategy using isotype control and Statistics of histogram

58
Fig 10: Histograms showing gating strategy using isotype control and Statistics of histogram
Top left; shows the dot-plot of selection of CD45 cells. Top-right shows the dot-plot of CD4+CD25+ isotype control. Second row left; selection of top 2% population of CD4+CD25+ population. Second row right; strategy to determine percentage of top 2% of CD4+CD25+ population.
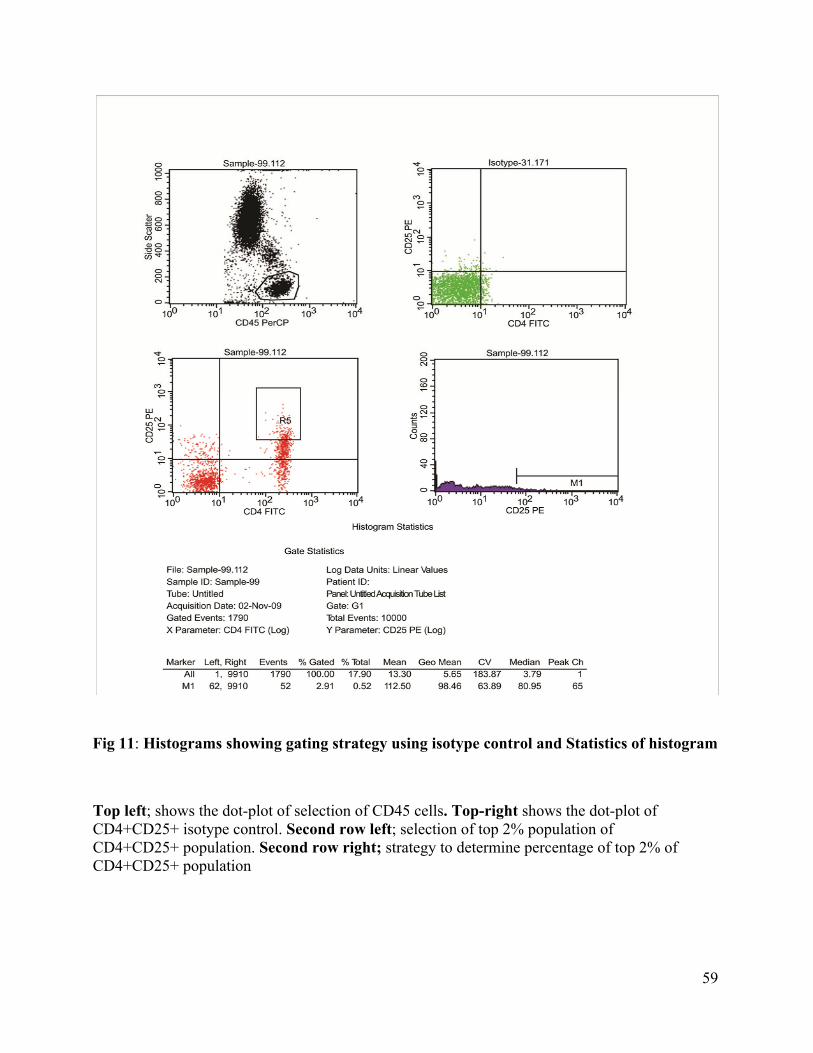
59
Fig 11: Histograms showing gating strategy using isotype control and Statistics of histogram
Top left; shows the dot-plot of selection of CD45 cells. Top-right shows the dot-plot of CD4+CD25+ isotype control. Second row left; selection of top 2% population of CD4+CD25+ population. Second row right; strategy to determine percentage of top 2% of CD4+CD25+ population

60
Fig 12: Histograms showing gating strategy using isotype control and Statistics of histogram
Top left; shows the dot-plot of selection of CD45 cells. Top-right shows the dot-plot of CD4+CD25+ isotype control. Second row left; selection of top 2% population of CD4+CD25+ population. Second row right; strategy to determine percentage of top 2% of CD4+CD25+ population

61
Fig 13: Histograms showing gating strategy using isotype control and Statistics of histogram
Top left; shows the dot-plot of selection of CD45 cells. Top-right shows the dot-plot of CD4+CD25+ isotype control. Second row left; selection of top 2% population of CD4+CD25+ population. Second row right; strategy to determine percentage of top 2% of CD4+CD25+ population

62
Fig 14: Histograms showing gating strategy using isotype control and Statistics of histogram
Top left; shows the dot-plot of selection of CD45 cells. Top-right shows the dot-plot of CD4+CD25+ isotype control. Second row left; selection of top 2% population of CD4+CD25+ population. Second row right; strategy to determine percentage of top 2% of CD4+CD25+ population

63
Using these strategies, quadrants for CD4 and CD25 positive cells were defined and their
percentages were determined and then percentage of Treg cells was calculated.
4.21. Markers used for Immunophenotyping
Fluorescein isothiocyanate (FITC) tagged with MoAagainst CD4, Phycoerythrin (PE) tagged
with MoA against CD25, Peridinin-chlorophyll-protein (PerCP) tagged with MoA against CD45
were used as monoclonal antibodies.
4.22. Gating strategy to identify CD4dimCD25bright T cells
It was obtained by the protocol adopted by Hoffman et al 2000. Briefly the proposed gate from
CD4+CD25+ was defined as CD4dimCD25bright; a region that was suggested to contain
predominantly FOXP3+ T cells. Hoffman et al documented that the top 2% of the CD4+CD25+
(CD4dimCD25bright) population was FOXP3+ and had regulatory properties. An algorithm was
constructed to obtain a metric proportional to the number of FOXP3 expressing T cells on the
basis of CD4 and CD25 expression; it is the number of CD4dimCD25bright T cells in the region
that had a CD4 MFI (mean fluorescence intensity) of ≤0.9 of the MFI of CD25+CD4+ T cells.
To identify the region properly, two rectangular regions were placed on the CD25CD4 dot-plot
of CD4+ lymphocytes and they were wide enough to include the range of CD4 expression; one
region i.e. CD4+CD25+ contained all the CD25+ cells above the isotype control, and the other
region i.e. CD4dimCD252% contained the 2% cells that expressed most of the CD25. If the MFI
for CD4 of CD4dimCD252%was equal or more than CD4+CD25+, the sample might have recently
been activated, and could not be evaluated, therefore it was not considered. If the MFI for the
CD4 of CD4dimCD252% was less than the CD4 MFI of the CD4+CD25+ region, the gate of the
CD4dimCD252% was moved toward the axis until the MFI for CD4 of this region was 0.9 x the
CD4 MFI of the CD+CD25+ region. The region set by this procedure was termed
CD4dimCD25bbright.
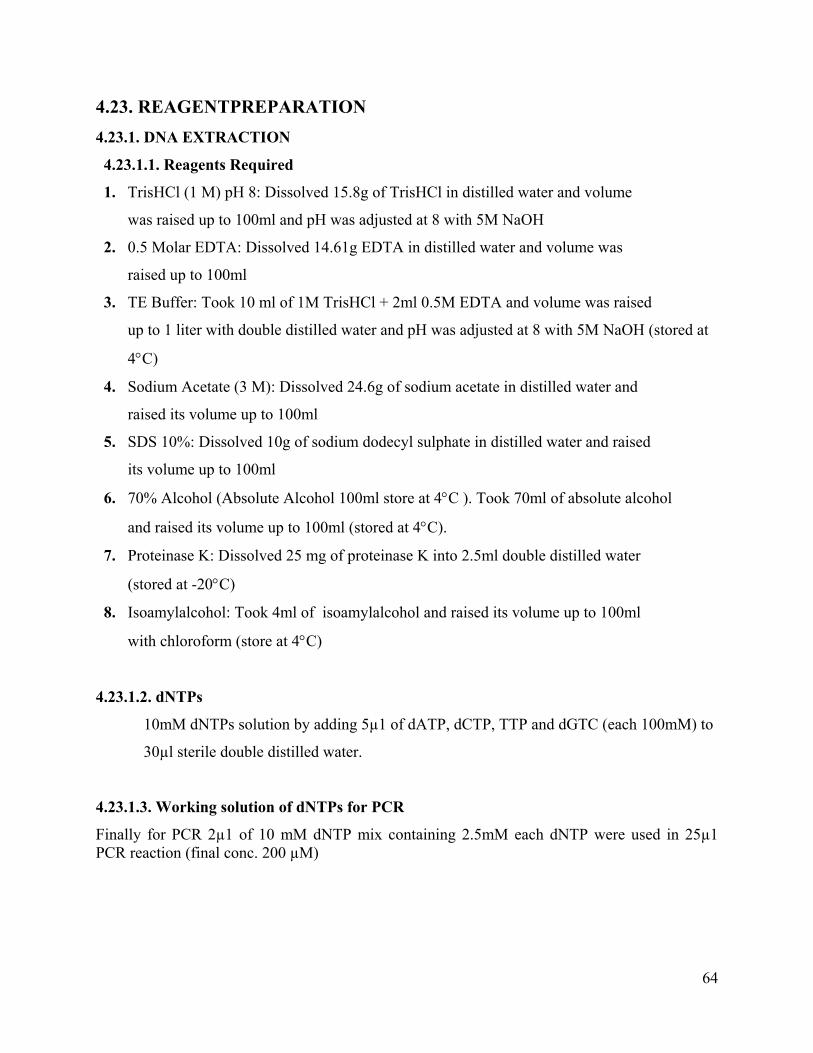
64
4.23. REAGENTPREPARATION
4.23.1. DNA EXTRACTION
4.23.1.1. Reagents Required
1. TrisHCl (1 M) pH 8: Dissolved 15.8g of TrisHCl in distilled water and volume
was raised up to 100ml and pH was adjusted at 8 with 5M NaOH
2. 0.5 Molar EDTA: Dissolved 14.61g EDTA in distilled water and volume was
raised up to 100ml
3. TE Buffer: Took 10 ml of 1M TrisHCl + 2ml 0.5M EDTA and volume was raised
up to 1 liter with double distilled water and pH was adjusted at 8 with 5M NaOH (stored at
4C)
4. Sodium Acetate (3 M): Dissolved 24.6g of sodium acetate in distilled water and
raised its volume up to 100ml
5. SDS 10%: Dissolved 10g of sodium dodecyl sulphate in distilled water and raised
its volume up to 100ml
6. 70% Alcohol (Absolute Alcohol 100ml store at 4C ). Took 70ml of absolute alcohol
and raised its volume up to 100ml (stored at 4C).
7. Proteinase K: Dissolved 25 mg of proteinase K into 2.5ml double distilled water
(stored at -20C)
8. Isoamylalcohol: Took 4ml of isoamylalcohol and raised its volume up to 100ml
with chloroform (store at 4C)
4.23.1.2. dNTPs
10mM dNTPs solution by adding 5µ1 of dATP, dCTP, TTP and dGTC (each 100mM) to
30µl sterile double distilled water.
4.23.1.3. Working solution of dNTPs for PCR
Finally for PCR 2µ1 of 10 mM dNTP mix containing 2.5mM each dNTP were used in 25µ1 PCR reaction (final conc. 200 µM)

65
4.23.1.4. TE buffer
1 molar TrisHcl
0.5 Molar EDTA (14.61 g / 100ml)
Initial Final
1000mM (C1) 10mM (C2)
Required volume (V1) 100 ml (V2)
C1V1=C2V2
V1=C2V2/C1
V1=10 x100/1000
V1= 1ml of Tris
C1V1=C2V2
V1=C2V2/C1
V1=1x100/500
V1=0.02ml of EDTA
In 1 ml of 1 M TrisHCl, 200ul of 0.5 M EDTA was added. Its volume was raised up to 100ml
with double distilled water.
10 ml 1M TrisHCl + 2ml 0.5M EDTA, raised the volume up to 1 liter. Adjusted its pH 8.
4.23.1.5. Preparation of Master Mix for Primers
1X 9X Concentration for each Reaction
DNA 1ul 9ul 10ng
10X PCR Buffer 2.5ul 22.5ul
25mMMgCl2 1.5ul 13.5ul 1.5mM
10mMdNTPs 2ul 18ul 200uM
10uM PF 1ul 9ul 0.4uM
10uM PR 1ul 9ul 0.4uM
Taq 0.1ul 0.9ul 1 unit
DDH2O 15.9 143.1ul
Total Volume 225ul
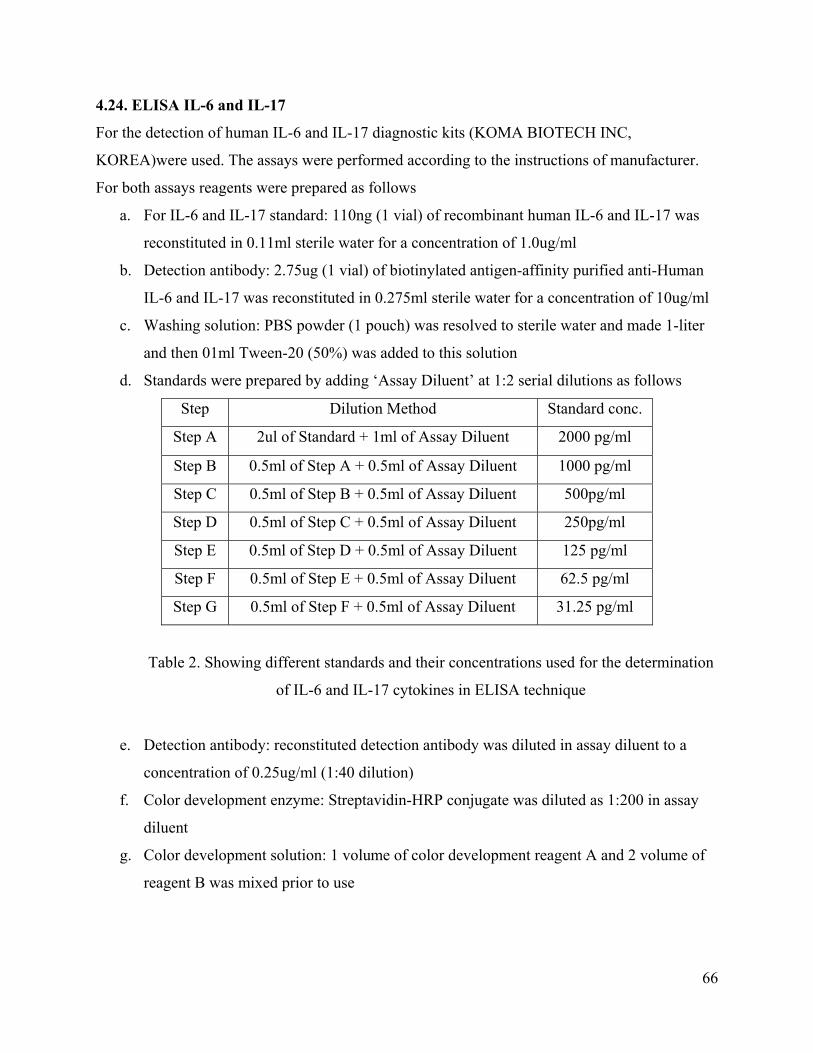
66
4.24. ELISA IL-6 and IL-17
For the detection of human IL-6 and IL-17 diagnostic kits (KOMA BIOTECH INC,
KOREA)were used. The assays were performed according to the instructions of manufacturer.
For both assays reagents were prepared as follows
a. For IL-6 and IL-17 standard: 110ng (1 vial) of recombinant human IL-6 and IL-17 was
reconstituted in 0.11ml sterile water for a concentration of 1.0ug/ml
b. Detection antibody: 2.75ug (1 vial) of biotinylated antigen-affinity purified anti-Human
IL-6 and IL-17 was reconstituted in 0.275ml sterile water for a concentration of 10ug/ml
c. Washing solution: PBS powder (1 pouch) was resolved to sterile water and made 1-liter
and then 01ml Tween-20 (50%) was added to this solution
d. Standards were prepared by adding ‘Assay Diluent’ at 1:2 serial dilutions as follows
Step Dilution Method Standard conc.
Step A 2ul of Standard + 1ml of Assay Diluent 2000 pg/ml
Step B 0.5ml of Step A + 0.5ml of Assay Diluent 1000 pg/ml
Step C 0.5ml of Step B + 0.5ml of Assay Diluent 500pg/ml
Step D 0.5ml of Step C + 0.5ml of Assay Diluent 250pg/ml
Step E 0.5ml of Step D + 0.5ml of Assay Diluent 125 pg/ml
Step F 0.5ml of Step E + 0.5ml of Assay Diluent 62.5 pg/ml
Step G 0.5ml of Step F + 0.5ml of Assay Diluent 31.25 pg/ml
Table 2. Showing different standards and their concentrations used for the determination
of IL-6 and IL-17 cytokines in ELISA technique
e. Detection antibody: reconstituted detection antibody was diluted in assay diluent to a
concentration of 0.25ug/ml (1:40 dilution)
f. Color development enzyme: Streptavidin-HRP conjugate was diluted as 1:200 in assay
diluent
g. Color development solution: 1 volume of color development reagent A and 2 volume of
reagent B was mixed prior to use
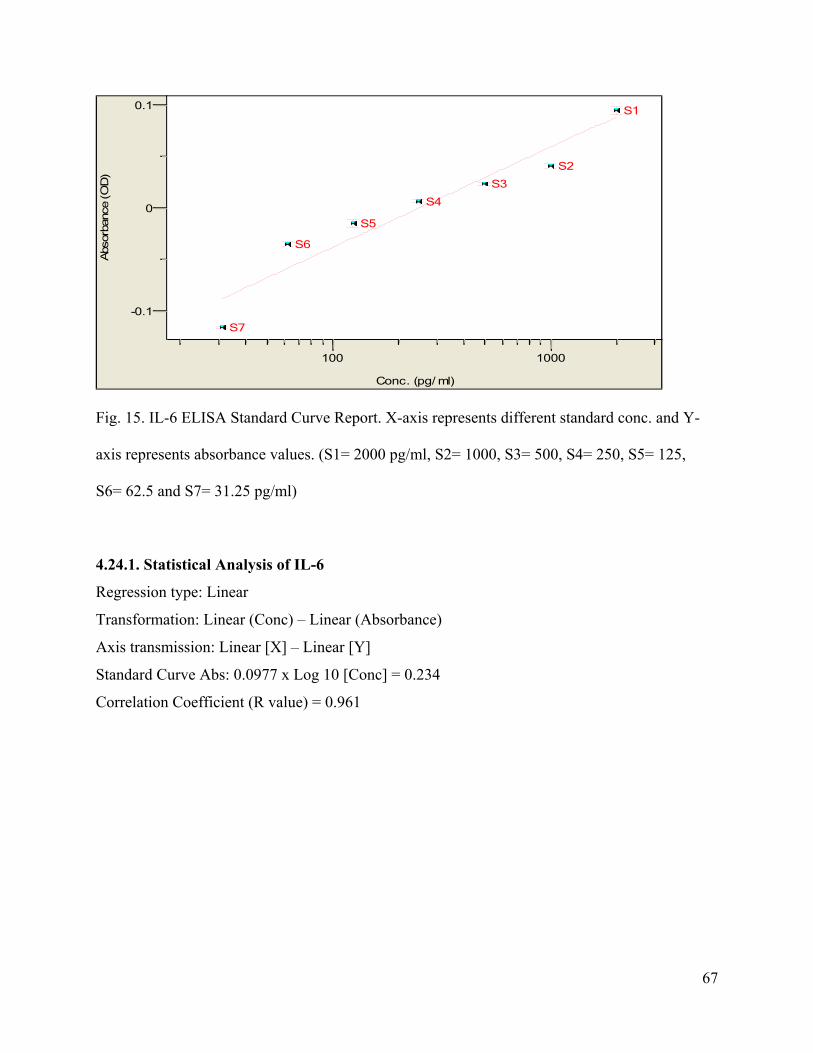
67
100 1000
Conc. (pg/ ml)
-0.1
0
0.1Abs
orba
nce
(OD
)
S4
S1
S5
S2
S6
S3
S7
Fig. 15. IL-6 ELISA Standard Curve Report. X-axis represents different standard conc. and Y-
axis represents absorbance values. (S1= 2000 pg/ml, S2= 1000, S3= 500, S4= 250, S5= 125,
S6= 62.5 and S7= 31.25 pg/ml)
4.24.1. Statistical Analysis of IL-6
Regression type: Linear
Transformation: Linear (Conc) – Linear (Absorbance)
Axis transmission: Linear [X] – Linear [Y]
Standard Curve Abs: 0.0977 x Log 10 [Conc] = 0.234
Correlation Coefficient (R value) = 0.961

68
0 500 1000 1500 2000
Conc. (pg/ ml)
0
0.1
0.2
0.3
Abs
orba
nce
(OD
)
S1
S5
S2
S6
S3
S7
S4
Fig. 16. IL-17 ELISA Standard Curve Report. X-axis represents different standard conc. and Y-
axis represents absorbance values. (S1= 2000 pg/ml, S2= 1000, S3= 500, S4= 250, S5= 125,
S6= 62.5 pg/ml and S7= 31.25 pg/ml)
4.24.2. Statistical Analysis of IL-17
Regression type: Linear
Transformation: Linear (Conc) – Linear (Absorbance)
Axis transmission: Linear [X] – Linear [Y]
Standard Curve Abs: 0.000769 x Log10 [Conc] = 0.00452
Correlation Coefficient (R value) = 0.999

69
4.25. Data Analysis
Data was entered and analysed using SPSS 17.0. Mean + SD, frequencies and percentages were
used for qualitative variables. One way ANOVA was used to observe group mean differences.
Post Hoc Tukey test was applied to observe which group means differs from the others. Pearson
correlation test was used to observe correlation between quantitative variables. Pearson Chi-
Square test was applied to observe associations between qualitative variables. A p-value of ≤
0.05 was considered statistically significant.

70
5. Results
5.1. Demographic data of the subjects
The demographic data of the studied population is shown in Table-3. In the Group-I i.e. the
healthy subjects, included 21 (70%) males and 09 (30%) females. In the Group-II i.e. diabetic
patients who did not develop diabetic retinopathy, included 5 (16.66%) males and 25 (83.33%)
females. In the Group-III i.e. diabetic patients who had diabetic retinopathy consisted of 51
(33.55%) males and 101 (66.44%) females.
The mean SD of age was 34.66 8.78 (range 24-64) years in Group-I, 49.4 9.94 (range 27-
75) years in Group-II and 50.88 8.90 (range 20-70) years in Group-III of the studied
population.
For Group-II subjects, the range of the percentage of HbA1c was between 5.9% – 12.6% and it
was 5.2% – 15.4% in Group-III subjects.
Regarding the duration of diabetes, Group-II had 25 (11.79%) subjects whose duration of
diabetes was between 5–10 years and there were 5 (2.35%) subjects who had diabetes for more
than 10 years (2.35%). In Group-III, there were 84 (39.2%) subjects who had duration of
diabetes between 5–10 years and there were 68 (32.07%) subjects who had diabetes for more
than 10 years (Table-3).
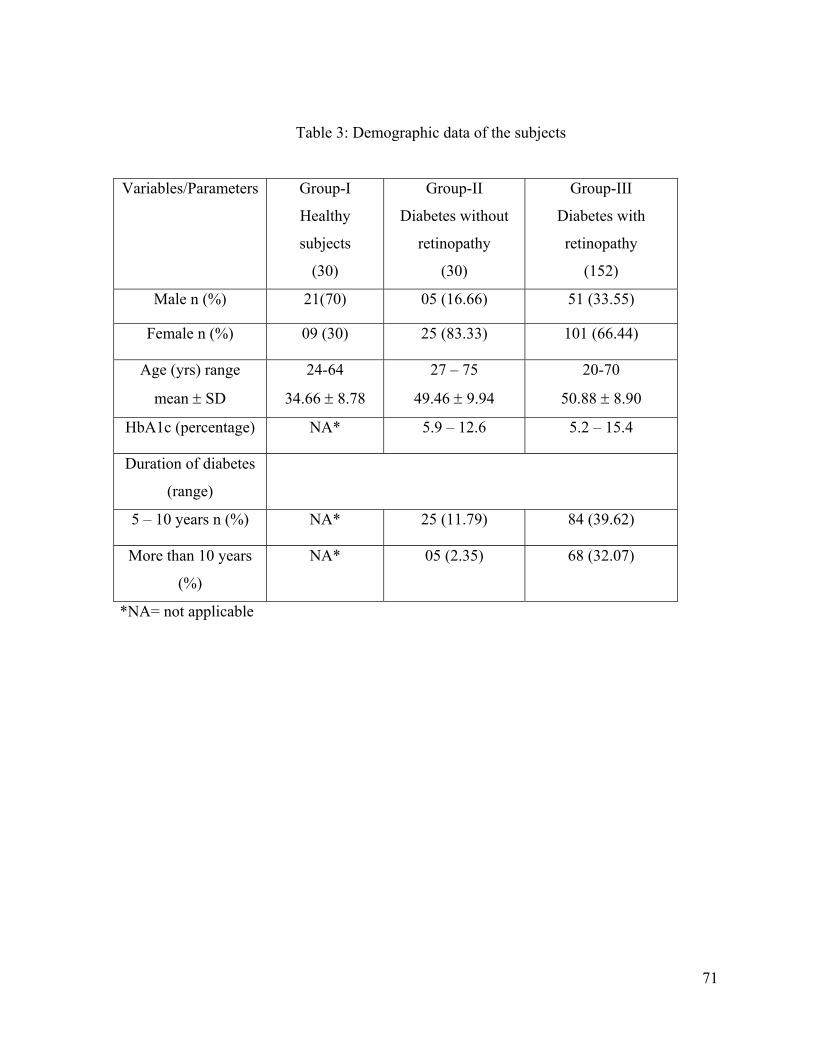
71
Table 3: Demographic data of the subjects
Variables/Parameters Group-I
Healthy
subjects
(30)
Group-II
Diabetes without
retinopathy
(30)
Group-III
Diabetes with
retinopathy
(152)
Male n (%) 21(70) 05 (16.66) 51 (33.55)
Female n (%) 09 (30) 25 (83.33) 101 (66.44)
Age (yrs) range
mean SD
24-64
34.66 8.78
27 – 75
49.46 9.94
20-70
50.88 8.90
HbA1c (percentage) NA* 5.9 – 12.6 5.2 – 15.4
Duration of diabetes
(range)
5 – 10 years n (%) NA* 25 (11.79) 84 (39.62)
More than 10 years
(%)
NA* 05 (2.35) 68 (32.07)
*NA= not applicable

72
5.2. Different continuous variables
The mean SD of percentage of HbA1c was 8.54 2.06 (range 5.90-12.60%) in Group-II and
8.83 2.35 (range 5.20-15.40%) in Group-III. On comparison of HbA1c between the two groups
there was no significant difference
The mean SD of duration of disease was 7.76 4.14 (range 5-20) years in Group-II and 10.51
5.24 (range 2-26) years in Group-III.
5.3. Comparison of different variables among the groups
For comparison of gender distributions, ANOVA test was applied and it was observed that there
was a statistically significant difference among the three groups (p-value=0.0029).Then to
determine the differences within the groups, Post Hoch Tucky Test was applied for comparison
of gender distribution. Higher percentage of females were detected in Group-II (83%) and
Group-III (66%) compared to Group-I (30%) (p-value<0.0001in each). On comparison of gender
distribution between Group-II and Group-III, there was no significant difference.
The mean SD of age of the subjects was 34.66 8.78 (range 24-64) years in Group-I, 49.4
9.94 (range 27-75) years in Group-II and 50.88 8.90 (range 20-70) years in Group-III of the
studied population. On comparison of age of the subjects, there was significant difference among
the three groups(p-value<0.0001). On comparison of age of the subjects, higher age of the
subjects was found in Group-II (49.46 ± 9.94 yrs) and in Group-III (50.88 ± 8.90 yrs) compared
to Group-I (34.66 ± 8.78 yrs) (p-value<0.0001in each) while there was no significant difference
in the age of the subject between Group-II and group-III.
In Group-II, the mean duration of diabetes was 7.76 4.14 (range 5–20) years and 10.51 5.24
(range 2–26) years in Group-III. On comparison of duration of diabetes, longer duration of
disease was found in Group-III (10yrs) compared to Group-II (7yrs) (p-value = 0.0073).
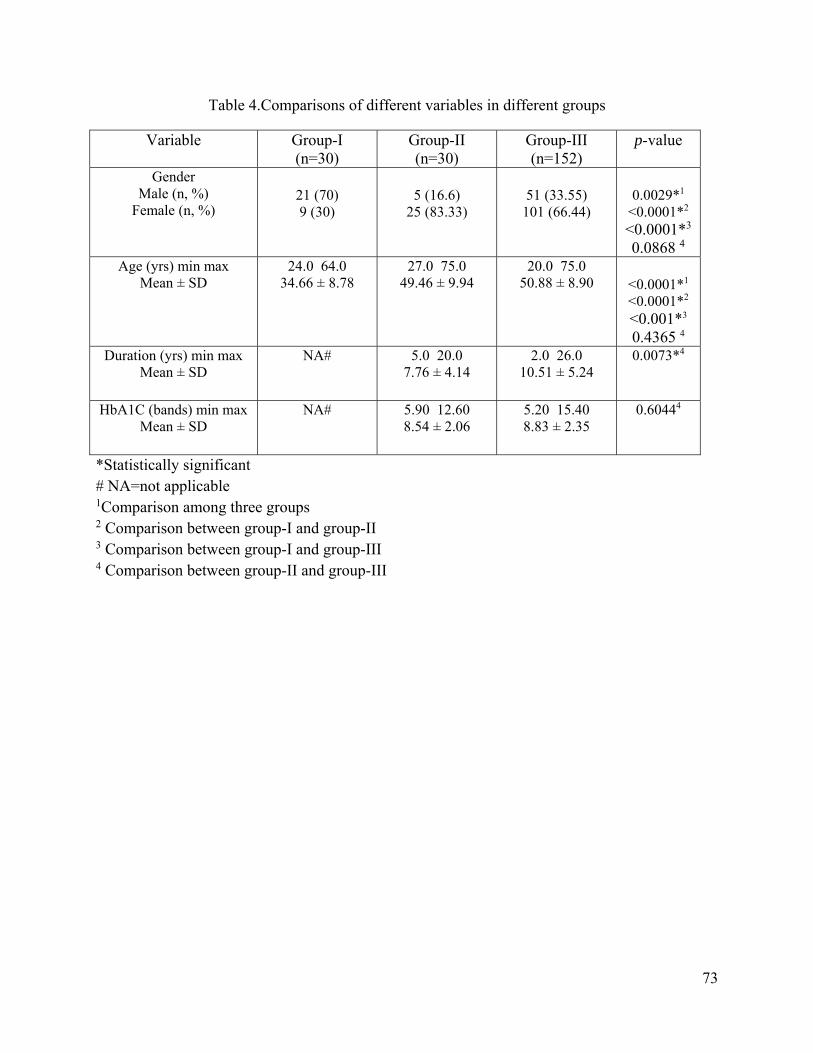
73
Table 4.Comparisons of different variables in different groups
Variable Group-I (n=30)
Group-II (n=30)
Group-III (n=152)
p-value
Gender Male (n, %)
Female (n, %)
21 (70) 9 (30)
5 (16.6)
25 (83.33)
51 (33.55)
101 (66.44)
0.0029*1
<0.0001*2 <0.0001*3 0.0868 4
Age (yrs) min max Mean ± SD
24.0 64.034.66 ± 8.78
27.0 75.049.46 ± 9.94
20.0 75.0 50.88 ± 8.90
<0.0001*1 <0.0001*2 <0.001*3 0.4365 4
Duration (yrs) min max Mean ± SD
NA# 5.0 20.07.76 ± 4.14
2.0 26.0 10.51 ± 5.24
0.0073*4
HbA1C (bands) min max Mean ± SD
NA# 5.90 12.608.54 ± 2.06
5.20 15.40 8.83 ± 2.35
0.60444
*Statistically significant # NA=not applicable 1Comparison among three groups 2 Comparison between group-I and group-II 3 Comparison between group-I and group-III 4 Comparison between group-II and group-III

74
5.4. Frequency of BglII Polymorphism in Group-I, Group-II and Group-III by PCR/RFLP
The frequency of Bgl II polymorphism i.e. disease associated homozygous positive (++), disease
associated heterozygous positive (+-) and non-disease associated homozygous negative (--) for
the allele of α2β1integrin gene was determined in all the studied population.

75
Fig 17. Showing ladder and BglII polymorphism of different subjects
Sample # 1, 3 are negative for Bgl II polymorphism
Sample # 2, 4, and 5 are heterozygous for Bgl II polymorphism
600bp
400bp
200bp

76
Fig 18. Showing BglII polymorphism of different subjects
Sample # 1, 5, 7, 8, and 10 are negative for Bgl II polymorphism
Sample # 2, 3, 4, 11, and 12 are heterozygous for Bgl II polymorphism
Sample # 6, and 9 are homozygous for Bgl II polymorphism
400
200
+/+ ‐/‐ +/‐ +/‐ ‐/‐ +/+ ‐/‐ ‐/‐+/‐ +/‐ +/‐
1 2 3 4 5 6 7 8 9 10 11 12

77
Fig 19. Showing ladder and Bgl-II polymorphism of different subjects
Sample # 1, 2, 3, 4, 6, 7, 10, 11, 12, 16, 25, 31, 35, 37, 38, and 40 are negative for Bgl II
polymorphism
Sample # 5, 8, 9, 13, 14, 15, 17, 18, 19, 20, 21, 23, 24, 26, 27, 28, 29, 32, 33, 34, 41, and 42 are
heterozygous for Bgl II polymorphism
Sample # 30, 36, and 39 are homozygous for Bgl II polymorphism
‐/‐‐
‐/‐
‐/‐
‐/‐
+/‐
‐/‐
‐/‐
+/‐
+/‐
‐/‐
‐/‐
+/‐
‐/‐
+/‐
+/‐
‐/‐
+/‐
+/‐
+/‐
+/‐
‐/‐
+/‐
+/‐
+/‐
‐/‐
+/‐
+/‐
+/‐
+/‐
+/+
‐/‐
+/‐
+/‐
+/‐
‐/‐
+/+
‐/‐
‐/‐
+/+
‐/‐
+/‐
+/‐
600400 200
200
400 600
1 2 3 4 5 6 7 8 9 10
11
12
13
14
15
16
17
18
19
20
21
22
23
24
25
26
27
28
29
30
31
32
33
34
35
36
37
38
39
40
41
42
dder
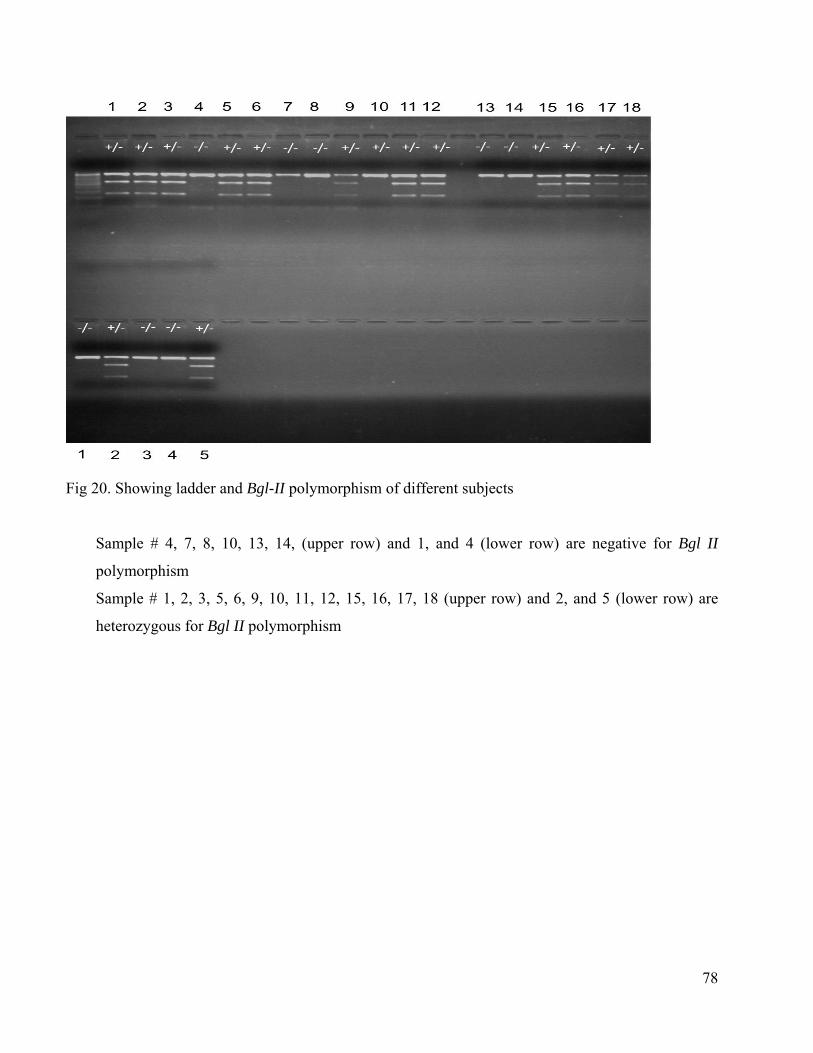
78
Fig 20. Showing ladder and Bgl-II polymorphism of different subjects
Sample # 4, 7, 8, 10, 13, 14, (upper row) and 1, and 4 (lower row) are negative for Bgl II
polymorphism
Sample # 1, 2, 3, 5, 6, 9, 10, 11, 12, 15, 16, 17, 18 (upper row) and 2, and 5 (lower row) are
heterozygous for Bgl II polymorphism

79
In Group-I, none of the subjects had ++ polymorphism, there were 21 (70%) subjects with + -
polymorphism and 9 (30%) subjects had - - polymorphism. In Group-II, there were 4 (13.3%)
subjects who had ++ polymorphism, 16 (53.3%) subjects had + - polymorphism and 10 (33.33%)
subjects had - - polymorphism. In Group-III, 29 (19.1%) subjects had ++ polymorphism, 67
(44.7%) subjects had + - polymorphism and 56 (36.18%) subjects had - - polymorphism.
In total, 33 (15.6%) subjects had + + polymorphism, 104 (49.05%) had + - polymorphism and 75
(34.90%) had - - polymorphism.
On comparison of Bgl I polymorphism between Group-I and Group-III, higher percentage of ++
polymorphism was found in Group-III (19%) compared to Group-I (0%) (p-value=0.003). While
comparing Bgl II polymorphism among the three groups, between Group-I and Group-II and
between Group-II and Group-III, there was no significant difference (Table 7).
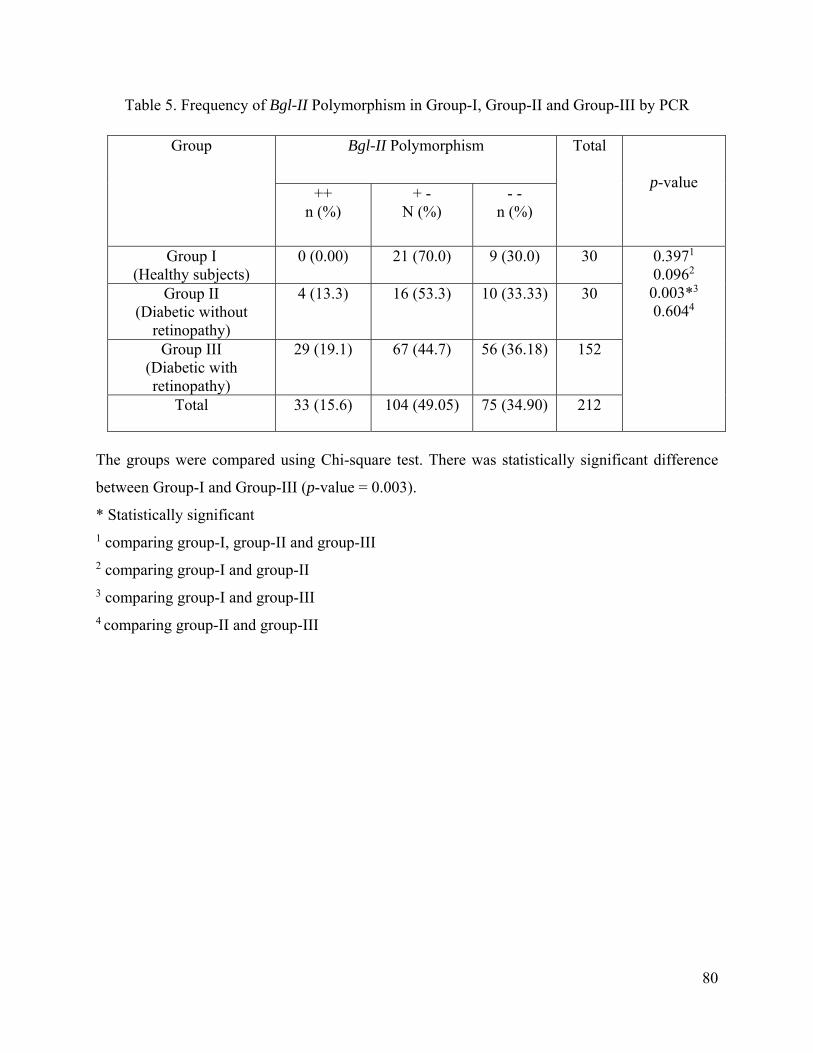
80
Table 5. Frequency of Bgl-II Polymorphism in Group-I, Group-II and Group-III by PCR
Group Bgl-II Polymorphism Total
p-value ++
n (%) + -
N (%) - -
n (%)
Group I (Healthy subjects)
0 (0.00) 21 (70.0) 9 (30.0) 30 0.3971 0.0962 0.003*3 0.6044
Group II (Diabetic without
retinopathy)
4 (13.3) 16 (53.3) 10 (33.33) 30
Group III (Diabetic with retinopathy)
29 (19.1) 67 (44.7) 56 (36.18) 152
Total 33 (15.6) 104 (49.05) 75 (34.90) 212
The groups were compared using Chi-square test. There was statistically significant difference
between Group-I and Group-III (p-value = 0.003).
* Statistically significant 1 comparing group-I, group-II and group-III 2 comparing group-I and group-II 3 comparing group-I and group-III 4 comparing group-II and group-III

81
5.5. Cytokines Assessment
The mean SD of level of IL-6 was 1331.98 306.41 (range 728.66-1680.58) pg/ml in Group-I,
1341.78 294.74 (range 750.95-1666.73) pg/ml in Group-II, and 718.66 614.02 (range 10.00-
2000.0) in Group-III.
The highest level of IL-6 was found in Group-II, followed by Group-I and then Group-III. For
the comparison of IL-6 levels among the three groups, ANOVA test was applied and it was
observed that there was a statistically significant difference (p-value<0.0001). Then to determine
the differences of level of IL-6 within the groups, Post Hoch Tucky Test was applied. Higher
level of IL-6 was found in Group-I (1331pg/ml±306) and in Group-II (1341pg/ml±294)
compared to Group-III (718pg/ml±614) (p-value<0.0001 in each). On comparison of IL-6
between Group-I and Group-II, there was no significant difference in the level of IL-6.
The mean SD of level of IL-17 was 718.05 756.55 (range 44.37-2000) pg/ml in Group-I,
415.01 483.40 (range 85.67-1743.64) pg/ml in Group-II, and 375.95 468.19 (range 38.47-
2000) pg/ml in Group-III.
The highest level of IL-17 was detected in Group-I, followed by Group-II and then Group-III.
On comparison of IL-17 levels, significant difference was found in the level of IL-17 among the
three groups (p-value=0.0026) and higher level of IL-17 was found in Group-I (718pg/ml±756)
compared to Group-III (375pg/ml±468)(p-value=0.0014). On comparison of level of IL-17
between Group-I and Group-II and between Group-II and Group-III, there was no statistically
significant difference (Table 6).

82
Table 6. Comparison of variables (Cytokines) in different groups
Variable Group-I (n=30)
Group-II (n=30)
Group-III (n=152)
p-value
IL-6 (pg/ml) min max Mean ± SD
728.66 1680.58 1331.98 ± 306.41
750.95 1666.731341.78 ± 294.74
10.00 20000 718.66 ± 614.02
<0.0001*1
<0.4255 2 <0.0001*3 <0.0001*4
IL-17 (pg/ml) min max Mean ± SD
44.37 2000718.05 ± 756.55
85.67 1743.64415.01 ± 483.40
38.47 2000 375.95 ± 468.19
0.0026*1
0.1456 2 0.0014*3 0.67914
*Statistically significant 1 Comparison among three groups 2 Comparison between group-I and group-II 3 Comparison between group-I and group-III 4 Comparison between group-II and group-III

83
5.6. Data of Assessment of Cells by Flow cytometer
The mean SD of percentage of CD4+CD25+cells was 14.53 4.84 (range 7.08-25.64) in Group-
I, 14.68 6.21 (range 1.60-27.55) in Group-II and 16.47 6.56 (range 2.14-31.54) in Group-III.
On comparison there was no statistically significant difference among the three groups.
From the CD4+CD25+ cells, the percentage of T-reg cells was calculated. The meanSD of
percentage of T-reg cells was 2.910.4 (range 2.28-4.40) in Group-I, 3.070.43 (range 2.36-
4.02) in Group-II and 2.880.38 (range 2.23-4.72) in Group-III.
On comparison of Treg cells, higher percentage of Treg cells was found in Group-II (3.07%)
compared to Group-III (2.88%) (p-value=0.0150). There was no significant difference in the
percentage of Treg cells among the three groups, between Group-I and Group-II and between
Group-I and Group-III (Table 7).

84
Table 7. Comparison of CD4CD25 T cells and Treg cells (by Flow cytometer) among different
groups
Variable Group-I (n=30)
Group-II (n=30)
Group-III (n=152)
p-value
CD4CD25 (%) min max
Mean ± SD
7.08 25.64
14.53
1.60 27.55
14.68
2.14 31.54
16.47
0.06751
0.8374 2 0.1272 3 0.1705 4
T-regs (%) min max Mean ± SD
2.28 - 4.40 2.91 ± 0.04
2.36 - 4.02 3.07 ± 0.43
2.23 - 4.72 2.88 ± 0.38
0.24341
0.5383 2 0.6643 3 0.0150*4
*Statistically significant 1 Comparison among three groups 2 Comparison between group-I and group-II 3 Comparison between group-I and group-III 4 Comparison between group-II and group-III

85
5.7. Logistic Regression Model for Group-II and Group-III
Logistic regression model was applied to determine the associations among various variables
(Table-8).
There was statistically significant difference in the percentages of T-reg cells and the level of IL-
6 (p-values=0.039, 0.009) respectively. On comparison of the number of CD4+CD25+cells p-
value was 0.05 while for rest of the parameters there was no statistically significant difference.

86
Table 8. Logistic Regression Model for Group-II and Group-III
Variable Degree of
Freedom (DF)
Estimate Standard Error
Chi-Square p-value
Age 1 0.0004 0.0008 0.21 0.644 Duration 1 0.0019 0.0015 1.62 0.203 HbA1C 1 0.0006 0.0034 0.04 0.847
CD4CD25 1 0.0022 0.0011 3.59 0.058 T-regs 1 -0.0419 0.0204 4.24 0.039* IL-6 1 -0.0000 0.0000 6.74 0.009* IL-17 1 0.0000 0.0000 0.87 0.350
Frequency of Bgl-II polymorphism
1 -0.0011 0.0106 0.01 0.9199
*Statistically significant

87
5.8. Logistic Regression Model for Group-I and Group-III
Age, percentages of CD4+CD25+cells, and the level of IL-6 (p-values <0.0001, 0.0044, 0.0054)
respectively were significant predictors between Group-I and Group-III. The rest of the variables
were not statistically significant (Table 9).

88
Table 9. Logistic Regression Model for Group-I and Group-III
Variable Degree of
Freedom (DF)Estimate Chi-
Square Standard
Error p-value
Age 1 0.0174 42.93 0.0027 <0.0001*CD4CD25 1 0.0099 8.12 0.0035 0.0044*
T-regs 1 0.0383 0.40 0.0603 0.5249 IL-6 1 -0.0001 7.74 0.0000 0.0054* IL-17 1 -0.0001 2.84 0.0000 0.0921
Frequency of Bgl-II polymorphism
1 -0.0011 0.12 0.0112 0.7333
*Statistically significant

89
6. Discussion
The present study was carried out on 212 subjects that included healthy, diabetic without
retinopathy and diabetic with retinopathy subjects. The study included both male and female
subjects but the percentage of female diabetic patients was higher as compared to male diabetic
patients. On comparison between gender distribution there was statistically significant difference
among the groups, between Group-I and Group-II, and between Group-I and Group-III (p-
value=0.0029, <0.0001, <0.0001) respectively but there was no statistically significant difference
between Group-II and Group-III (p-value=0.0868). The possible explanation for this non-
significant value for gender distribution is that in both the groups percentage of female patients
was more as compared to male patients.
The percentage of male and female included in this study is in agreement with the study of
Akram et al (2011), who determined the prevalence of peripheral arterial disease in type-II
diabetes mellitus. In their study, among 830 patients, males were 49% while females included in
the study were 51%. Similarly regarding the percentage of patients studied in this work there is
an agreement with the study reported by Chhutto et al (2009) where among 350 patients there
were 35.1% males and 64.9% were females. In the study of Ahmadani et al (2008) the
percentage of female patients was 56.3% while for male patients it was 43.7%, which is also
very close to the percentage of subjects in the current study. The current study is also in
agreement with the study of Jamal-u-Din et al (2006), who included a total of 192 patients that
consisted of 43.5% males and 56.5% females. They determined the prevalence of diabetic
retinopathy among individuals screened positive for diabetes in five community-based eye
camps in northern Karachi, Pakistan. The current study is similar to the study conducted by Tam
et al 2008, because they included females (59.6%) and males (40.4) whereas the current study
had females (63.67%) and males (36.32%). They determined incidence and progression of
diabetic retinopathy in Hong Kong Chinese with type 2 diabetes mellitus. Although the
prevalence of diabetes has been reported more in men as compared to females, however impaired
glucose tolerance was higher among females as compared to males (Qidwai et al 2010, Shera et
al 2007).

90
Similarly, the findings of Khan et al (2007) are different from ours study as they documented the
mean prevalence of diabetes mellitus as 1.77% and the higher prevalence of diabetes in males
(1.01%) than females (0.76%) in Mirpur and Kotli districts of Azad Jammu and Kashmir,
Pakistan whereas in the current study there were more females as compared to males. Regarding
the median age of the subjects the study of Zhang et al (2010) is in partial agreement with the
current study because they included 1006 subjects of 40 years of age as the current study
included. They documented prevalence of diabetic retinopathy in the United Sates during 2005-
2008 that consisted of 504 males and 502 females. In the literature, there are different reports
about gender distribution of diabetes prevalence, but majority of the studies documented that
diabetes is more prevalent in females as compare to males and the current study is in agreement
with them because there were more females as compare to males in this study.
In the current study, highest meanSD of age was detected in Group-III (508.90yrs), followed
by Group-II (499.94yrs) and then Group-I (348.78yrs). On comparison among the three
groups, there was significant difference in the age (p-value<0.0001). Higher meanSD of age
was observed in Group-II (499.94yrs) as compared to Group-I (348.78yrs) (p-value<0.0001)
and higher meanSD of age was observed in Group-III (508.90yrs) as compared to Group-I
(348.78yrs) (p-value<0.0001). There was no significant difference between the meanSD of
age of Group-II and Group-III. The possible explanation for no difference in the meanSD of
age range could be that both the groups had diabetic patients and diabetic retinopathy could be
due to certain other factors e.g. genetics and environmental factors that need to be investigated in
future studies.
Regarding the age distribution our study is in close agreement with the study of Chhutto et al
(2009), in which the age range for the diabetic patients was between 15 - 65 years. The study of
Ahmadani et al (2008) is also in agreement with our study because they set the lower age of 18
years for the diabetic patients and the mean age of the diabetic patients was 49.9 10.8. The
current study is in agreement with the study of Shaw et al (2010) because they selected the
subjects between 20 - 80 years for global estimate of the prevalence of diabetes for 2010 and
2030 and the subjects of the current study were also between 20 - 75 years of age. Similarly,
Yang et al (2010) and Wild et al (2004) also set the lower age of the subjects as 20 years to

91
determine the prevalence of diabetes among men and women in China and global prevalence of
diabetes respectively and it is the same in the current study. Similarly the current study is close to
the study conducted by Tam et al 2008, because they included diabetic subjects between 20 - 77
years of age. They determined incidence and progression of diabetic retinopathy in Hong Kong
Chinese with type 2 diabetes mellitus. However the study of Akram et al (2011) is not in
agreement with the current study because they set the lower limit of age as 40 years for the
diabetic patients while for the maximum age they did not set the age limit. The patients included
in the study by Zhang et al (2010) were between 58.9 - 62.9 years.
Although the exact reason for the development of diabetic retinopathy is not known as described
previously that age factor does not play a role between the diabetic patients, however it can be
concluded that age of the subjects play a role in the development of diabetes and later on along
with the genetic and environmental factors, diabetic complications such as retinopathy may
develop (Anonymous et al 2000, Silverman et al 1995).
On comparison of percentage of HbA1c between the Group-II and Group-III subjects, there was
no significant difference. In the literature, there are different opinions about relevance of HbA1c
with diabetic complications. Ahmadani et al (2008) is in agreement with the current study, as
they determined the percentage of HbA1c among the hypertensive patients with type-2 diabetes
with macro albuminuria, micro albuminuria and normal subjects and they observed the level of
HbA1c as 9.32 2.14%. In this study there was no significant difference in the percentage of
HbA1c. Similarly the current study is in agreement with the study of Tam et al (2008) who
determined the incidence and progression of diabetic retinopathy in Hong Kong Chinese with
type 2 diabetes mellitus and they documented the percentage of HbA1c as 8.1 1.5% while the
current study determined the percentage of HbA1c as 8.54% 2.06 and 8.83% 2.35 in the
Group-II and Group-III respectively.
The percent of HbA1c among the patients studied by Zhang et al (2010) was between 6.8% and
8.1% and it is not in agreement with the current study because they determined statistically
significant difference in the percentage of HbA1c among the diabetic patients with retinopathy
and those without retinopathy. Although the findings of the current study are not similar to the

92
study of Yang et al (2010) who determined the prevalence of diabetes among men and women in
China and they inferred significant difference (p-value=0.01) in the level of glucose between
male and female subjects but the current study should not be compared with that because they
estimated the mean fasting glucose level as 95.6 mg/dl and 94.1 mg/dl in male and female
patients respectively.
In the current study almost similar level of HbA1c in both the diabetic groups reflects poor
diabetes control on part of the subjects. The reason for this non-significant value for the
percentage of HbA1c, in the current study, could be that both the groups had diabetic patients.
All the diabetic patients included in this study, had their disease for a period of more than 5-
years, and they were recruited from the public hospital/non-governmental organizations.
Majority of these patients were from the low socio-economic background and their education
level was not very high. Education and socioeconomic status has already been associated with
the increased prevalence of diabetes (Seeman et al 2008, Yan et al 2006), therefore the probable
reasons for the inefficient control of diabetes in the current study could be their low education
level and poor socioeconomic background.
Regarding the duration of diabetes, the results of the current study is in agreement with the study
of Ahmadani et al (2008). They included diabetic patients who had diabetes for 9.32 6.87 years
duration, which is similar to the duration of diabetes in the current study. They conducted a study
to determine the prevalence of micro-albuminuria in hypertensive patients with type-2 diabetes
in Pakistan. Similarly, the current study is in agreement with the study reported by Zhang et al
(2010). They also included the diabetic patients having diabetes between 6.5 years to 16.5 years
which is not different from the period of diabetes in the current study. They conducted this study
to document the prevalence of diabetic retinopathy in the United States from 2005 to 2008.
The current study is not in agreement with the study of Jamal-u-Din et al (2006), because they
included the subjects with newly diagnosed diabetes and diabetes of up to 15 years. They
determined prevalence of diabetic retinopathy among individuals screened positive for diabetes
in five community-based eye camps in northern Karachi Pakistan. Similarly the current study is
in partial agreement with the study conducted by Tam et al(2008), because they included

93
subjects having diabetes for the duration of 8.8 6.1 years while in the current study the duration
of diabetes was 7.76 4.14 in Group-II and 10.51 5.24 years in Group-III. Tam et al (2008)
determined incidence and progression of diabetic retinopathy in Hong Kong Chinese with type 2
diabetes mellitus.
Regarding the selection of the diabetic subjects for the current study i.e. the duration of their
disease is generally in agreement with the majority of studies in the literature which explains that
the duration of disease plays a role in development of diabetic retinopathy. The possible
explanation for the significance of duration of diabetes could be that along with other factors,
length of disease could play a role in the development of diabetic retinopathy.
In the current study, on comparison of Bgl-II polymorphism i.e. homozygous disease associated
(++), heterozygous disease associated (+-) and homozygous for not disease associated (- -), it
was found that there was difference in Group-I and Group-III. In Group-I the Bgl-II
polymorphism was 0 (+ +), 70% (+ -), and 30% (- -) whereas in Group-III this polymorphism
was 15% (+ +), 49% (+ -), and 34% (- -) (p-value=0.003). On comparison among the three
groups there was no difference and similarly there was no difference between Group-I and
Group-II and between Group-II and Group-III.
There are studies in the literature whose findings are in agreement with the current study such as
Matsubara et al (2000) claimed to be the first one to demonstrate an association between the
BglII polymorphism of subunit of 2β1 integrin and diabetic retinopathy among patients with
type 2 diabetes mellitus in Japanese population. Matsubara et al (2000) documented that Bgl II
(+/+, +/-) genotypes increased the risk of retinopathy and nephropathy. The researcher also
suggested that patients with the BglII (+/-, +/+) genotype might benefit more from anti-platelet
therapies. (Matsubara et al 2000).
Similarly, Pavkovic et al (2010) studied polymorphism in GP Ia gene and suggested that it is
associated with variations in platelet 2β1 expression levels. Platelets from individuals with
807T allele express higher levels of 2β1 whereas individuals with 807C exhibit a lower density
of 2β1 integrin. High levels of GP Ia/IIa only depend on the presence of the 807T allele and

94
heterozygous individuals express almost similar number of GP Ia copies as individuals
homozygous for 807T. Platelets derived from 807T donors adhere significantly faster than
platelets from 807C donors.
In the current study BglII polymorphism has been observed between the normal healthy control
group and the diabetic retinopathy subjects. Therefore along with other factor, BglII
polymorphism could have been one of the factors responsible for the development of diabetic
retinopathy. Petrovic et al (2003) determined a significantly higher frequency of the Bgl II (+/+)
genotype of the gene polymorphism of the 2β1 integrin gene in patients with diabetic
retinopathy as compared to patients without diabetic retinopathy. The Bgl II (+/+) genotype of
the gene polymorphism of 2β1 integrin gene, age at the onset of diabetes, duration of diabetes,
and insulin therapy were independent risk factor for diabetic retinopathy in Caucasians with
type-2 diabetes. Tsai et al (2001) on the other hand tried to find out an association between Bgl II
genotype polymorphism in diabetic nephropathy in the Chinese population of type-2 diabetes but
he could not succeed. Since in the current study, on comparison of BglII polymorphism in
Group-I and Group-III has been observed, therefore this study suggests that the BglII
polymorphism may have contributed towards the development of diabetic retinopathy in the
studied population.
In the current study the polymorphism of BglII was determined by PCR/RFLP (Polymerase
chain reaction/Restriction fragment length polymorphism). This technique has been
recommended as the method of choice by Stevens et al (1999) who mapped Bgl II polymorphism
to intron C and developed a PCR-RFLP method to genotype individuals. The researcher
suggested PCR/RFLP based assay for the BglII polymorphism for high throughput typing in
association studies.
On comparison of IL-6, highest level of IL-6 was observed in Group-II, followed by Group-I and
then Group-III, there was significant difference among the three groups (p-value<0.0001). The
higher level of IL-6 was observed in Group-I (1331pg/ml) and in Group-II (1341pg/ml compared
to Group-III (718pg/ml) (p-value<0.0001 in each). It showed that the levels of IL-6 were high in

95
the control group and in diabetic patients who did not have retinopathy compared to diabetic
patients with retinopathy.
Most of the studies that have been performed to evaluate the role of IL-6 in the development of
ophthalmic complications are performed to determination the level of IL-6 in the vitreous fluid
and majority of them have emphasized the involvement of this cytokine in the development of
eye complications. Mysliwec et al (2008) determined the level of IL-6 in the diabetic
retinopathy patients. They included 202 children with diabetes mellitus type-I and grouped them
into two. They observed higher levels of vitreous IL-6 in Group-I and they were able to establish
a relationship of level of IL-6 with the retinopathy. Unlike Mysliwec et al (2008), the current
study determined the level of IL-6 in the serum, and could not determine high levels of IL-6 in
the diabetic patients of retinopathy. Mocan et al (2006) performed a study to elucidate the
possible role of IL-6 in the pathogenesis of proliferative diabetic retinopathy. They documented
significantly higher vitreous level of IL-6 in patients with proliferative diabetic retinopathy
compared to control group however the serum level of IL-6 was below the lower detection limit
in both patients and controls. They suggested that IL-6 may have a role in the pathogenesis of
retinal neo-vascularization. Its intra-vitreous levels appear to be independent of both serum IL-6
levels and the clinical and metabolic parameters of the study. The findings of the current study
indicate that although IL-6 being an inflammatory cytokine could be blamed for different stages
of diabetic retinopathy but in the subjects with fully developed diabetic retinopathy the level of
IL-6 could be decreased, if they are getting treatment for the diabetes and for their eye
manifestations.
The relationship between advanced glycation end products (AGEs) and IL-6 in the development
of diabetic retinopathy was studied by Nakamura et al (2003). They included 62-patients of
proliferative diabetic retinopathy and 50-non diabetic controls. They documented significantly
higher level of IL-6 in the vitreous of patients with proliferative diabetic retinopathy (PDR) as
compared with the controls. Level of IL-6 was higher in the vitreous as compared to serum level
and there was no correlation between these two levels of IL-6. They suggested that increased
formation of AGEs in the vitreous may be involved in the development of diabetic retinopathy
by inducing IL-6 from retinal Muller cells. Although they showed the involvement of IL-6 in

96
diabetic retinopathy but again it was on the basis of IL-6 level in the vitreous fluid which is
different from the current study because we determined the level of IL-6 in the serum.
A further study measured concentration of cytokines including IL-6 in vitreous and serum from
47 patients with PDR and 21 patients with vitreous non-inflammatory retinopathy patients
(Yuuki et al 2001). They suggested higher IL-6 concentration in vitreous fluid of proliferative
diabetic retinopathy patients as compared to non-inflammatory retinopathy patients. In the serum
there was no difference in the levels of IL-6 between proliferative diabetic retinopathy and non-
inflammatory patients. Unlike their findings, in my study, we were able to determine the level of
IL-6 in the serum of patients of diabetic retinopathy, diabetic patients without retinopathy and
normal healthy controls. The probable reason could be subclinical infection in healthy
individuals and in diabetic without retinopathy whereas diabetic subjects with retinopathy were
being more aggressively treated and therefore, the level of IL-6 was low in this group of subjects.
A mouse experimental autoimmune uveitis (EAU) model was created in which researcher
investigated the role of IL-6 in the formation of refractory ocular inflammation (Yoshimura et al
2009). They found significantly increased level of IL-6 in the vitreous of refractory/chronic
uveitis as compared to control group. They concluded that IL-6 is responsible for causing ocular
inflammation, and it is at least partially due to IL-6 dependent Th17 differentiation. They
suggested IL-6 involvement in the ophthalmic complications whereas in the current study
different level of IL-6 has been observed in the serum of different groups of the study. The serum
level of IL-6 may not be the true reflection of eye complications such as diabetic retinopathy and
the level of IL-6 may be different in the vitreous fluid compared to serum level.
The role of IL-6 in proliferative vitreo-retinopathy (PVR) as compared to retinal detachment
patients was documented by Limb et al 1991. Norose et al 1994 suggested participation of IL-6
as an inflammatory mediator in Vogt-Koyanagi-Harada (VKH) disease. Ongkosuwito et al 1998
documented higher level of IL-6 in the ocular fluid samples from patients with uveitis. Most of
the researchers have documented the higher levels of IL-6 in the vitreous fluid of various eye
diseases whereas in the current study the determination of IL-6 has been performed in the serum
of the diabetic patients and normal healthy controls.

97
The first study regarding the role of IL-6 as an inflammatory mediator in uveitis documented
higher levels of intraocular IL-6 in the patients of uveitis but the serum level of IL-6 was not
different in patient and control groups (Murray et al1990). It is dissimilar from the findings of
the current study because here different levels of IL-6 were detected in the serum of three
groups, which could not be detected by Murray et al. Dongancy et al 2002 determined the level
of certain cytokines including IL-6 with stages of diabetic retinopathy. In their study the level of
IL-6 was below the detection limit in both the diabetic patients and controls. They further
claimed that IL-6 was raised in poorly controlled diabetic patients. It is again unlike with the
findings of the current study because various levels of IL-6 in diabetic patients, diabetic patients
with retinopathy and healthy controls were detected but the level of IL-6 was low in diabetic
retinopathy patients as compared to diabetic without retinopathy and control group. The lowest
level of IL-6 in diabetic with retinopathy subjects as compared to the other two groups could be
due to the treatment which these patients were receiving as they were being treated with
laser/local eye drops along with their regular medications for the control of diabetes.
IL-6 levels decline after normalization of plasma glucose (Esposito et al 2002). Ohta et al 2000
determined the immunosuppressive status of aqueous humor (AqH) from mouse eyes affected
with endotoxin induced uveitis (EIU) and identified the relevant cytokines responsible for
immune modulatory activity with EIU. They documented that lipopolysaccharide (LPS) induced
intraocular inflammation is associated with local production of IL-6. The researcher suggested
that suppression of intraocular synthesis of IL-6 may reduce inflammation and restore ocular
immune privilege. In the current study patients of diabetic retinopathy were getting treatment for
their eye complications that could have been the reason for their low IL-6 level.
The role of IL-6 was investigated by the rejection process in sub retinal space and the use of IL-6
monitoring for a possible early sign of rejection after transplantation of allogeneic retinal
pigment epithelial (RPE) cells (Enzmann et al 2000). Unlike the current study, Enzmann et al
(2000) conclude that the difference in the level of serum IL-6 was not statistically different
between control and experimental models but this difference was significant in the intra-vitreous
fluid. Similarly, Kauffmann et al (1994) measured the level of IL-6 and other cytokines in the
vitreous of patients of proliferative vitreo-retinopathy (PVR), PDR, vitreous hemorrhage, and

98
macular pucker. The researchers found highest level of IL-6 in the vitreous of PVR patients and
it was correlated with the disease activity. In the PDR group the level of IL-6 was either below
the detection limit or was low as compared to PVR group. Rosenbaum et al (1998) used IL-6
deficient mice to test the hypothesis that IL-6 contributes to the development of endotoxin
induced uveitis and found out that IL-6 was not the sole agent to induce uveitis in mice. They
suggested that IL-6 was not necessary for the development of uveitis subsequent to intra-vitreous
injection of endotoxin in mice.
Most of the researchers have concluded the involvement of IL-6 in various eye diseases and they
were able to detect IL-6 in the vitreous fluid of the eye but they did not detect IL-6 in the serum
whereas the current study focused on the determination of IL-6 in the serum of different groups.
In the current study various levels of IL-6 were detected in different groups and the level of IL-6
was decreased in the diabetic retinopathy subjects as compared to the two other groups. The
probable explanation for the low IL-6 levels in Group-II and Group-III compared to Group-I,
could be that Group-II and Group-III were receiving treatment for their diabetes as compared to
Group-I and Esposito et al (2002) have documented that level of IL-6 decreases after
normalization of serum glucose. Further, since all the patients of Group-III were receiving the
treatment for their eye complications i.e., either they were getting laser treatment for the eye or
some were on medications while some were on both kind of treatment. Therefore one of the
possibilities for the low level of IL-6 in the serum of diabetic retinopathy patients could be due to
their treatment of eye complications which are likely to reduce the inflammation in general and
of the eye in particular because Ohta et al (2000) also documented that suppression of IL-6 can
reduce inflammation as well.
Further, the protective aspect of the IL-6 genotype polymorphism has been highlighted in
retinopathy and nephropathy of type 1 diabetes mellitus patients. The researchers documented -
174GG IL-6 polymorphism as protected from late diabetic complications (Mysliwska et al 2009,
Hermann et al 2005). The same polymorphism of IL-6 has also been studied by other researchers
and they have the similar observation. They found elevated level of serum IL-6 and its
association with the raised insulin levels at fasting and after meals (Andreozzi et al 2006). The
protective aspect of Il-6 was confirmed in pre-diabetic condition by using transgenic non-obese

99
diabetic mouse (NOD). The NOD mouse over express human IL-6 cytokine and these animals
has decreased fasting levels of glucose with the delayed onset of disease i.e. diabetes. At the
same time these animals can survive for the longer time as compared to those animals who do
not over express IL-6 gene (DiCosmo et al 1994).
Another reason for the raised IL-6 in the control group could be that although detailed history of
infection in the last two weeks were obtained from all the studied population but the reason for
high level of IL-6 in the control group could be any sub-acute infection. The high level of IL-6 in
the Group-II could be due to diabetes because Dongancy et al (2002) documented high level of
IL-6 in poorly controlled subjects or this high of IL-6 could be due to the initial stages diabetic
complications. Further, high level of inflammatory markers has been suggested in the healthy
individuals who are prone to get diabetes in later part of their lives (Shoelson et al 2006).
In the current study, highest level of IL-17 cytokine was detected in Group-I (718756pg/ml),
followed by Group-II (415483pg/ml), and Group-III (375468pg/ml). In the literature, some of
the studies are in agreement with the findings of current study such as Steinman et
al(2008)highlighted protective aspect of IL-17 in mycobacterial infection and documented that
IL-17 is required to recruit protective INF-g producing CD4+ T cells into the lung. Further, in an
asthma model, neutralizing IL-17 increased infiltration of eosinophil during the effector phase of
disease. Likewise, Joseph et al (2011) concluded in his study that IL-17 is dispensable at least in
large part in the pathogenesis of autoimmune diabetes. Re et al (2010) suggested, although Th17
cells producing IL-17A are required for acute alveolitis during experimental silicosis, IL-17A
and IL-22 are dispensable for chronic inflammation and are not essential modulators of fibroblast
functions, uncontrolled tissue repair and pulmonary fibrosis. Ye et al (2001) demonstrated that
IL-17 is produced locally in lung tissue as part of the normal host response to a bacterial
challenge with Kalebsella pneumonia. Lv et al (2011) investigated prognostic value of
measuring tumor-infiltrating IL-17 producing cell levels in human esophageal squamous cell
carcinoma (ESCC) and documented higher densities of these calls are associated with better
prognosis. Although the current study also documented high level of IL-17 in healthy control
group compared to diabetic patients with retinopathy and probably this IL-17 is there to provide
protection against the ophthalmic complications but the comparison of above mentioned studies

100
with the current study should not be made because none of the above mentioned studies were
performed in diabetic patients.
It was also suggested that IL-17 may constitute an early initiator of the T cell dependent
inflammatory reaction (Fossiez et al 1996). Guangfu et al (2003) concluded that in vitroIL-17
may play a role in the initiation and development of lupus nephritis through induction of IL-6
over-expression and autoantibody overproduction in peripheral blood mononuclear cells. It is in
agreement with the results of the current study because in Group-II the level of IL-17 was more
compared to Group-III patients which suggest that the level of IL-17 decreased after the
development of diabetic retinopathy.
The results of the current study are not in agreement with some studies such as Zeng et al (2012)
documented increased level of IL-17 in type 2 diabetic patients compared to healthy controls.
Honkane et al (2010) showed an in vitro increased secretion of IL-17 upon T cell activation of
peripheral blood of type-1 diabetic patients. Grajewski et al (2008) explored the role of iNK cells
in the regulation of autoimmunity to retina. They suggested activation of iNK cells ameliorates
experimental ocular autoimmunity by involving innate INF-γ production and dampening
adaptive Th1 and Th17 responses. Monteleone et al (2011) documented enhanced production of
IL-17 in Crohn’s disease (CD) and ulcerative colitis (UC). They speculated simultaneously
neutralization of INF- and IL-17A could help manage the active phases of IBD. Fujino et al
(2003) also concluded increased expression of IL-17 in IBD patients. Hammerich et al (2011)
suggested Th17 cells and related cytokines in various liver diseases. Chi et al (2011) documented
significantly higher levels of IL-17 in active Behcet disease (BD) compared to inactive disease
and normal controls. Nogueira et al (2010) reported significantly elevated levels of IL-17A and
IL-23 in acute ANCA-associated vasculitis.
Similarly, Eid et al (2009) reported that IL-17 is produced concomitantly with INF- by coronary
artery infiltrating T cells and these cytokines act synergistically to induce pro-inflammatory
responses in vascular smooth muscle cells. Almakhzangy et al (2009) documented high levels of
IL-17 and IL-22 in patients of psoriasis. Pene et al (2008) demonstrated high quantity of CD4+ T
cells that produced increased level of IL-17in the inflamed tissue of psoriasis, Crohn’s disease,

101
rheumatoid arthritis, and allergic asthma. Zhao et al (2009) showed elevated levels of IL-17 in
SLE patients compared to normal controls. Wong et al (2008) documented elevated levels of IL-
17 and IL-23 in SLE patients compared to healthy controls. Kotake et al (1999) determined
significantly increased levels of IL-17 in rheumatoid arthritis patients compared to osteoarthritis
patients. Nakae et al (2003) suggested the role of IL-17 in the development of autoimmune
arthritis by T cell activation.
Although the results of the above mentioned studies are different from the current study but
findings of the current study suggest that high level of IL-17 in the control group compared to
diabetic patients with retinopathy could be a protective aspect of IL-17 or low level of IL-17 in
the diabetic patients with retinopathy could be attributed to the effect of medications which these
subjects were having or it could be a combination of both. Although the history of the
medication was not obtained from these patients but there is a possibility that these patients
might be having anti-inflammatory drugs for their eye complications. Therefore, in the light of
the current study, the possibility of negative association of IL-17 with the development of
diabetic retinopathy may also be considered.
In the current study, on comparison of CD4+CD25+cells there was no significant difference.
Studies are available on the frequency of CD4+CD25+ cells whose results are close to the
findings of the current study such as Sun et al (2010) is in partial agreement with the current
study but they used mice model and determined the contribution of CD4+CD25+ T cells to the
regression phase of experimental autoimmune uveoretinitis (EAU). They documented the level
of CD4+CD25+ T cells between 12.7% and 20.7%. Liu et al (2008), investigated the level of
CD4+CD25+ T cells in primary Sjogren syndrome and correlated their level with the
inflammation and they found their level between 7.85 2.62% in the patient group and 11.68
3.78% in the healthy controls. Brusko et al (2005) studied the functional defects and the
influence of age on the frequency of CD4+CD25+ T cells in type-1 diabetes. They documented
their level from 9.67% to 20.75% in the patient group and from 13.49% to 24.57% in the control
group.

102
Similarly, Baecher-Allan et al (2001) studied CD4+CD25high regulatory T cells in human
peripheral blood and suggested the level of CD4+CD25+ cells up to 16%. Fai Ng et al (2001)
documented human CD4+CD25+ cells as a naturally occurring population of regulatory T cells
and suggested their level as 15% to 20% in the peripheral circulation. Dieckmann et al (2001)
studied ex-vivo isolation and characterization of CD4+CD25+ T cells from the blood and
suggested their level between 2.8% to 17.2%. Levings et al (2001) documented that human
CD4+CD25+ T regulatory cells suppress naïve and memory T cell proliferation and this
population can be expanded in vitro without loss of function. They suggested the level of
CD4+CD25+ T cells from 9.8% to 18.1%. All these above mentioned studies detected
CD4+CD25+T cells in the same range as have been observed in the current study but these
studies cannot be compared with the current work because none of them have been performed in
type-II diabetes patients.
There are a number of studies which suggested the range of CD4+CD25+ cells that is different
from the current study. The study reported by Radstake et al (2009) is not in full agreement with
the current study because they found an increased frequency and compromised function of T
cells in systemic sclerosis and they determined the level of CD4+CD25+ T cells as 12.4% 1.0%.
Abdulahad et al (2007) do not agree with the current study because they studied the functional
defect of circulating regulatory CD4+T cells in patients with Wegener’s granulomatosis in
remission and compared it with healthy control group. They documented the level of
CD4+CD25+T cells in Wegner’s granulomatosis and healthy control as 13.29% and 13.68%
respectively. Yeh et al (2006) documented that regular Tai Chi Chuan exercise enhances
functional mobility and number of CD4+CD25+ T cells because before the exercise the level of
CD4+CD25+ cells was 12.5% while their level was 13.6% after this exercise. Game et al (2003)
studied the role of CD4+CD25+ T cells in the patients of renal transplant and they documented
the level of these cells as 7.76% in the patient group and 9.10% in the healthy control group.
Sullivan et al (2002) studied CD4+CD25+T cell production in healthy humans and in patients
with thymic hypoplasia and suggested comparatively higher number of these cells in healthy
controls as compared to the patient group. The level of these cells was between 6% and 15% in
both the groups. Smyth et al (2007) determined CD4 T regulatory cells in chronic obstructed
pulmonary disease (COPD) patients and documented their median level as 0%, 28.8% and 23.1%
in healthy individuals, smokers and COPD patients respectively.
103
The findings of the above mentioned studies suggested that in humans, in different diseases there
is variation in the percentage of CD4+CD25+ T cells. The variation observed in the percentage of
CD4+CD25+ T cells in the current study, is almost similar to the percentage observed by various
researchers in different diseases. In the current study, on comparison of total CD4+CD25+ cells
among different groups, there was no significant difference. The reason for not finding any
significant relationship of CD4+CD25+cells in any group could be that CD4+CD25+ T cells may
not be involved directly in the development of diabetic retinopathy in type-II diabetes.
In the current study, it was also observed that on comparison of Treg cells; that were calculated
from the total population of CD4+CD25+ cells, higher percentage of Treg cells was determined in
Group-II (3.07%) compared to Group-III (2.88%) (p-value=0.0150) but there was no significant
difference of Treg cells among the groups, between Group-I and Group-II, and between Group-I
and Group-III. Therefore, in the current study direct involvement of Treg cells in the
development of diabetic retinopathy cannot be documented.
There are various studies on Treg cells which are in agreement with the current study such as
that Radstake et al (2009) documented an increased frequency and compromised function of
Treg cells in systemic sclerosis and they determined the level of Treg cells as 2.9% 0.5%. Liu
et al (2008) determined the level of CD4+CD25+brightT cells in patients of primary Sjogren
syndrome and suggested their level between 2.79 1.06% in the patient group and 3.84 1.42%
in the healthy controls. Chen et al (2007) documented that CD4+CD25+ Foxp3 regulatory T cells
suppress mycobacterium tuberculosis immunity in patients with active disease. They suggested
their level as 3%, 1.5% and 1.6% in pulmonary tuberculosis, healthy individuals and pulmonary
tuberculosis patients after treatment respectively. Brusko et al (2005) studied the functional
defects and the influence of age on the frequency of CD4+CD25+ Treg cells in type-1 diabetes.
They documented the level of Treg cells around 1.5% in both patient and control group which is
similar to the findings of the current study.
The level of CD4CD25 Treg cells in the patients of renal transplant and healthy control was
reported (Game et al 2003). They observed their level as 7.76% and 9.10% in the patients and
healthy controls respectively but they could not find a significant difference in the level of Treg

104
cells. Baecher-Allan et al (2001) studied CD4+CD25high regulatory T cells in human peripheral
blood and suggested their level as 1 - 2%. Levings et al (2001) documented that human
CD4+CD25+ T regulatory cells suppress naïve and memory T cell proliferation and reported the
level of CD4+CD25+ T reg cells as 1.6 - 4.4%. Guyot-Revol et al (2006) suggested that
regulatory T cells are expanded in blood and disease sites in patients with tuberculosis and
documented the mean level of Treg cells as 1.17% and 2.51% for the healthy subjects and
tuberculosis patients respectively.
In the literature, there are various studies performed on the Treg cells but the data of Treg cells in
diabetes type-II is very limited. Sun et al (2010) who observed significantly increased frequency
of CD4+CD25+ Treg cells in association with the development and regression of experimental
autoimmune uveoretinitis. They documented the level of CD4+CD25+ Foxp3 cells between 6.47
- 13.25%. Hoffmann et al (2007) determined CD4+CD25bright T cells frequencies in asthmatics
and controls and they documented similar frequencies in both. In the normal control group their
level was between 9.41% (7.44% - 12.85) and 10.17% (7.06 – 12.94) in asthmatics. Abdulahad
et al (2007) studied the functional defect of circulating regulatory CD4+ T cells in patients with
Wegener’s granulomatosis in remission. They documented Treg cells as 5.9% 0.5% and 6.8%
0.5% in untreated and treated Wegener’s granulomatosis patients respectively. Loghi et al
(2004) studied the impairment of CD4+CD25+ Treg cells in autoimmune liver disease and
suggested their level as 3.3 0.4 in the patient group while 6.8 0.7 in the control group. They
concluded decreased Treg cell number in autoimmunity against liver. Dieckmann et al (2001)
studied characterization of CD4+CD25+ T cells with regulatory properties and suggested their
level between 2.8% and 17.2% with a mean of about 6%.
The results of the above mentioned studies suggested that in different diseases the percentage of
Treg cells can vary but the above mentioned studies cannot be compared with the findings of the
current study because none of the above mentioned studies were performed on diabetes type-II
patients. Further, the possible explanation for not finding the significant difference in the
percentage of Treg cells could be that Treg cells are involved in the autoimmune process of type-
I diabetes (D’Alise et al 2008, Clough et al 2008, Tang et al 2008) and since in the current study,

105
only patients of type-II diabetes were included, therefore no significant association of type-II
diabetes with Treg cells was found.

106
7. Conclusion
It has been observed in this study that age and gender of the subjects, duration of diabetes and
BglII polymorphism may contribute in the development of type-II diabetic retinopathy. The
serum levels of IL-6 andIL-17 are found negatively associated while level of CD4+CD25+T cells
and percentage of Treg cells are not associated with the development of type-II diabetic
retinopathy.

107
8. Suggestions
1. It has been observed in this study that age and gender of the subjects, duration of diabetes and
BglII polymorphism may contribute in the development of diabetic retinopathy.
2. The differences which has been observed in the levels of IL-6 and IL-17 cytokine, level of
CD4+CD25+ T cells and percentage of Treg cells could have been the result of disease
manifestations.
3. Although, high levels of IL-6 in the intra vitreous fluid has been documented in diabetic
retinopathy subjects but studies should be carried on for the determination of IL-17 in the intra
vitreous fluid as well.
4. There should be functional assays of T lymphocytes and in particular CD4+CD25+ cells to
evaluate their actual role in the diabetic retinopathy.
5. The use of more reliable markers for enumeration of Treg cells such as Foxp3 or CD127
should be performed.

108
9. REFERENCES
Abdulahad WH., Stegeman CA., Ymke M., van der G., Meer BD-van der., Limburg PC.,
Kallenberg CGM. (2007). Functional Defect of Circulating Regulatory CD4+ T cells in
Patients With Wegner’s Graulomatosis in Remission. Arthritis & Rheumatism. 56; 6:
2080-2091.
Aberg N, EngstromI. (1990). Natural history of allergic diseases in children. Acta
Paediatr Scand. 79: 206-11.
Acosta-Rodriguez EV., Napolitani G., Lanzavecchia A., Sallusto F. (2007). Interleukin
1β and IL-6 but not transforming growth factor-β are essential for the differentiation of
interleukin-17 producing human T helper cells. Nature Immunology. 8(9):942-949.
Aerts L, Sodoyez-Goffaux F, Sodoyez JC, Malaisse WJ, Van Assche FA. (1988). The
diabetic intrauterine milieu has a long-lasting effect on insulin secretion by B cells and on
insulin uptake by target tissues. Am J Obstet Gynecol. 159: 1287-1292.
Afzali B., Lombardi G., Lechler RI., Lord GM. (2007).The role of T helper (Th17) and
regulatory T cells (Treg) in human organ transplantation and autoimmune disease. Clin
Exp Immunol. 148(1): 32-46.
Aggarwal S, Gurney AL. (2002). IL-17: prototype member of an emerging cytokine
family. J Leukoc Biol. 71(1): 1-8.
Ahmed J, Braun RD, Dunn R, Linsenmeier RA. (1993). Oxygen distribution in the
macaque retina. Invest Ophthalmol Vis Sci. 34: 516-521.
Ahmed SA, Talal N. (1990). Sex hormones and the immune system-Part II. Bailliere’s
Clin Rheumatol. 4: 13-31.
Ahmadani M. Y., Fawwad A., Basit A., Hydrie Z. I. (2008). Microalbuminuria
Prevalence Study in Hypertensive Patients with Type 2 Diabetes in Pakistan. J Ayub Med
Coll abbottabad. 20; 3: 117-120.
Amadi-Obi A, Yu CR, Liu X. (2007). Th 17 cells contribute to uveitis and scleritis and
are expanded by IL-2 and inhibited by IL-27/STAT1. Nat Med. 13: 711-8.
Akram J., Aamir Aziz-ul-H., Basit A., Qureshi M. S., Mehmood T., Shahid S. K., Khoso
I. A., Ebrahim M. A., Qmair A. (2011). Prevalence of peripheral arterial disease in type 2
diabetes in Pakistan. JPMA. 61; 7: 644-648.
109
Albanesi C., Cavani A., Girolomoni G. (1999), IL-17 Is Produced by Nickel-Specific T
Lymphocytes and Regulates ICAM-1 Expression and Chemokine Production in Human
Keratinocytes: Synergistic or Antagonist Effects with INF- and TNF-. The Journal of
Immunology. 162; 494-502
Algvere PV, Berglin L, Gouras P, Sheng Y, Kopp ED. (1997). Transplantation of RPE in
age-related macular degeneration: observations in disc form lesions and dry RPE atrophy.
Graefe’s Arch Clin Exp Ophthalmol. 235: 149-158.
AlmakhzangyI., Gaballa A. (2009). Serum Level of IL-17, IL-22, INF- in Patients with
Psoriasis. Egyptian Dermatology Online Journal. 5; 1: 4
Amadi-ObiA., Cheng-Rong Y., Xuebin L., Mahdi R. M., Clarke G. L., Nussenblatt R. B.,
Grey I., Lee Y. S., Egwuagu C. E. (2007). Th17 cells contribute to uveitis and scleritis
and are expanded by IL-2 and inhibited by IL-27/STAT 1. Nature Medicine.13(6):711-
18.
Amadori A, Zamarchi R, De Silvestro G. (1995). Genetic control of the CD4/CD8 T-cell
ratio in humans. Nat Med. 1: 1279-83
Anderson MK, Lundberg P, Ohlin A, Perry MJ, Lie A, Stark A, Lerner UH. (2007).
Effects on osteoclast and osteoblast activities in cultures mouse calvarial bones by
synovial fluids from patients with a loose joint prosthesis and from osteoarthritis patients.
Arthritis Res Ther. 9: R18
Anderson CA, Boucher G, Lees CW, Franke A, D’Amato M, Taylor KD, Lee JC,
Goyette P, Imielinski M, Latiano A, Lagace C, Scott R, Amininejad L, Bumpstead S,
Baidoo L, Baldassano RN, Barclay M, Bayless TM, Brand S, Buning C, Colombel JF,
Denson IA, DE Vos M, Dubinsky M, Edwards C, Ellinghaus D, Fehrmann RS, Floyd JA,
Flarin T, Franchimont D. (2011). Meta-analysis identifies 29 additional ulcerative colitis
risk loci, increasing the number of confirmed associations to 47. Nat Genet. 43: 246-252.
Andreozzi F, Laratta E, Cardellini M, Marini MA, Lauro R, Hribal ML, Perticone F,
Sesti G. (2006). Plasma interleukin 6 levels are independently associated with insulin
secretion in a cohort of Ittalian-Caucassian no diabetic subjects. Diabetes. 55: 2021-2024.
Annunziato F., Cosmi L., Santarlasci V., Maggi L., Liotta F., Mazzinghi B., Parente E.,
Fili L., Ferri S., Giudici F., Romagnani P., Parronchi P., Tonelli F., Maggi E., Romagnani

110
S. (2007). Phenotypic and functional features of human Th17 cells. J Exp Med. 204; 8:
1849-61.
Arythrea BH. (1998). Hypophseal-Pituitary-Adrenal axis in autoimmune and rheumatic
diseases. Immunol Res. 18: 93-102.
Attawia MA, Nayak RC. (1999). Circulating antipericyte autoantibodies in diabetic
retinopathy. Retina. 19(5): 390-400.
Aujila S. J., Dubin P. J., Kolls J. K. (2007). Th17 cells and mucosal host defense.
Seminars in Immunology. 19: 377-382.
Baecher-Allan C., Brown Julia A., Freeman G. J., Hafler D. A. (2001). CD4+CD25high
Regulatory Cells in Human Peripheral Blood. The Journal of Immunology. 167: 1245-
1253.
Balasubbu S., Sundaresan P., Rajendran A., Ramasamy K., Govindarajan G.,
Perumalsamy N., Hejtmancik J. F. (2010). Association analysis of nine candidate gene
polymorphisms in Indian patients with type 2 diabetic retinopathy. BMC Medical
Genetics.11:158
Barnett AH. (1991). Pathogenesis of diabetic microangiopathy: an overview. Am J Med.
90: 67S
Barnett AH, Wakelin K, Leatherdale BA. (1984). Specific thromboxane synthetase
inhibition and albumin excretion rate in insulin dependent diabetes. Lancet. 16: 1322.
Baudouin C, Fredj-Reygrobellet D, Brignole F, Lapalus P, Gastaud P. (1993). MHC class
II antigen expression by ocular cells in proliferative diabetic retinopathy. Fundam Clin
Pharm. 7: 523-30.
Ben-Jonathan N, Mershon JI, Allen DI, Steinmetz RW. (1996). Extrapitutary prolactin:
distribution, regulation and clinical aspects. Endocrine Reviews: 17: 639.
Bentmann A, Schmidt M, Reuss S, Wolfrum U, Hankein T, Burmester T. (2005).
Divergent distribution in vascular and avascular mammalian retinae links neuroglobin to
cellular respiration. J Biol Chem. 280: 20660-20665
Bettelli E.K.T., Kuchroo VK. (2007). Th17: the third member of the effector T cell
trilogy. Curr Opin Immunol. 6; 652-7.

111
Bettelli E., Carrier Y., Gao W., Korn T., Strom T.B., Oukka M., Weiner H.L., Kuchroo
V.K. (2006). Reciprocal development pathways for the generation of pathogenic effector
Th17 and regulatory T cells. Nature. 441: 235-238.
Beriou G., Costantino C.M., Ashlay C.W., Yang L., Kuchroo V.K., Baecher-Allan C.,
Hafler D. A. (2009). IL-17 producing human peripheral T cells retain suppressive
function. Blood. 113; 4240-4249.
Bito LZ, Salvador EV, Petrinovic L. (1978). Intraocular fluid dynamics. IV. Intraocular
sites of solute utilization and transport as revealed by studies on aphakic eyes. Exp Eye
Res. 26: 47-55.
Bottazzo GF, Pujol-Borrell R, Hanafusa T, Feldmann M. (1983). Role of aberrant HLA-
DR expression and antigen presentation in induction of endocrine autoimmunity. Lancet.
2: 1115-9
Brennan P, Hajeer A, Ong KR, Worthington J, John S, Thomson W, Silman AJ, Ollier
WER. (1997). Allelic markers close to prolactin are associated with HLA-DRB1
susceptibility alleles among women with rheumatoid arthritis and systemic lupus
erythematosus. Arthritis and Rheumatism. 40: 1383.
Bristow EA, Griffiths PG, Andrews RM, Johnson MA, Turnbull DM. (2002). The
distribution of mitochondria activity in relation to optic nerve structure. Arch
Ophthalmol. 120: 791-796.
Brusko T.M., Wasserfall C.H., Clare-Salzler M.J., Schatz D. A., Atkinson M.A. (2005).
Functional Defects and the Influence of Age on the Frequency of CD4+CD25+ T-Cells in
Type 1 Diabetes. Diabetes. 54: 1407-1414
Buckner HJ. (2010). Mechanisms of impaired regulation of CD4+CD25+Foxp3+
regulatory T cells in human autoimmune diseases. Nature Reviews/Immunology; 10: 849-
859.
Caballero B. (2005). A nutrition paradox – underweight and obesity in developing
countries. N Engl J Med. 352: 1514-1516
Caballero B. (2001). Introduction symposium: obesity in developing countries: biological
and ecological factors. J Nutr: 131: 866S-870S.

112
Carisson LE, Santoso S, Spitzer C, Kessler C, Greinacher A. (1999). The alpha2 gene
coding sequence T807/A873 of the platelet collagen receptor integrin alpha2beta1 might
be a risk factor for the development of stroke in younger patients. Blood. 93: 3583.
Center for disease control and Prevention. (2008). Diabetes data & trends. Overweight
and Obesity. U.S. Obesity trens. 1985-2006.
http://www.cdc.gov/nccdphp/dnpa/obesity/trend/maps/
Chan JCN., Malik V, Jia W., Kadowaki T., Yajnik CS., Yoon KH., Hu FB. 2009.
Diabetes in Asia: Epidemiology, risk factors and pathophysiology. JAMA; 301(20): 2129-
2140
Chen X., Zhou B., Li M., Deng Q., Wu X., Le X., Wu C., Larmonier N., Zhang W.,
Zhang H., Wang H., Katsanis E. (2007). CD4+CD25+ FoxP3+ regulatory T cells suppress
Mycobacterium tuberculosis immunity inpatients with active disease. Clinical
Immunology. 123; 50-59
Chen Y, Langrish CL, McKenzie B, Joyce-Shaikh B, Stumhofer JS, McClanahan T,
Blumenschein W, Churskovsa T, Low J, Presta L, Hunter CA, Kastelein RA, Cua DJ.
(2006). Anti-IL23 therapy inhibits multiple inflammatory pathways and ameliorates
autoimmune encephalomyelitis. J Clin Invest. 116: 1317-1326.
Chen Z., Tato CM., Muul L., Laurence A., O’Shea JJ. (2007). Distinct regulation of
interleukin-17 in human T helper lymphocytes. Arthritis Rheum. 5; 9: 36-46.
Chen Z., O’Shea JJ. (2008). Th17 cells: a new fate for differentiating helper T cells.
Immunol Res. 41: 87-102.
Chhutto M.A., Qadar Habib-ur-R., Abro H.A., Shaikh M.A., Sheikh B.A., Sheikh N.,
Buriro S.A. (2009). Awareness of diabetes mellitus and its complications in diabetic
patients. Medical Channel. Oct – Dec; 153-156
Chi W., Zhu S., Yang P., Chen L. (2011). CD4+ T cells from behcet patients produce
high levels of IL-17. Eye. 26;65-9.
Chiodi H. (1940). The relationship between the thymus and sex organs. Endocrinology.
26: 107-35.
Chotikavanich S, de Paiva CS, Li de Q, Chen JJ, Bian F, Farley WJ, Pflugfelder SC.
(2009). Production and activity of matrix metalloproteinase-9 on the ocular surface
increase in dysfunctional tear syndrome. Invest Ophthalmol Vis Sci. 50: 3203-9.

113
Chung DR, Kasper DL, Panzo RJ, Chtinis T, Grusby MJ, Sayegh MH, Tzianabos AO.
(2003). CD4+ T cells mediate abscess formation in intra-abdominal sepsis by an IL-17
dependent mechanism. J Immunol. 170: 1958-1963.
Clough LE. (2008). Release from regulatory T cell-mediated suppression during the onset
of tissue-specific autoimmunity is associated with elevated IL-21. J. Immunol. 180: 5393-
5401.
Cockram CS. (2000). The epidemiology of diabetes mellitus in the Asia-Pacific region.
HKMJ. 6(1): 43-52.
Cohen T, Nahari D, Cerem LW. (1996). Interleukin 6 induces the expression of vascular
endothelial growth factor. J Biol Chem. 271: 736-741.
Cooke A. Th17 cells in inflammatory conditions. Rev Diabetic Studies. (2006).3:72-5.
Cohen LH, Noell WK. (1965). Relationships between visual function and metabolism.
Orlando FL, Academic Press.
Coquet J.M., Chakrvarti S., Smyth M.J., Godfrey D.I. (2008). Cutting Edge: IL-21 is Not
Essential for Th17 Differentiation or Experimental Autoimmune Encephalomyelitis. The
Journal of Immunology. 180: 7097-7101.
Cua DJ, Sherlock J, Chen Y, Murphy CA, Joyce B, Seymour B. (2003). Interleukin-23
rather than interleukin-12 is the critical cytokine for autoimmune inflammation of the
brain. Nature. 6924: 744-8.
Curtis JL, Freeman CM, Hogg JC. (2007). The immunopathogenesis of chronic
obstructive pulmonary disease: insights from recent research. Proc Am Thorac Soc. 4:
512-21.
D’Alise AM. (2008). The defect in T cell regulation in NOD mice is an effect on the T
cell effectors. Proc. Acad. Sci. USA. 105: 19857-19862.
Danaei G., Fried AB., Oza S., Murray CJL., Ezzati M. (2009). Diabetes prevalence and
diagnosis in US states: analysis of health surveys. Population Health Metrics. 7: 16.
Davis TME., Beilby J., Davis WA., Olynyk JK., Jeffrey GP., Rossi E., Boyder C., Bruce
DG. (2008). Prevalence, characteristics and prognostic significance of HFE gene
mutations in type 2 diabetes. Diabetes Care. 31(9): 1795-1801.
Dedoussis G.V.Z., Kaliora A.C, Panagiotakos D. Genes, Diet and Type 2 Diabetes
Mellitus: A Review. Rev Diabet Stud. (2006); 3:13-24.

114
Dejaco C., Duftner C., Grubeck-Loebenstein B., Schirmer M. (2005). Imbalance of
regulatory T cells in human autoimmune diseases. Immunology.117:289-300.
Dieckmann D., Plottner H., Berchtold S., Berger T., Schuler G. (2001). Ex Vivo Isolation
and Characterization of CD4+ CD25+ T Cells with Regulatory Properties from Human
Blood. J. Exp. Med. 193; 11: 1303-1310.
Delovitch TL, Singh B. (1997). The non-obese diabetic mouse as a model of autoimmune
diabetes: immune dysregulation gets the NOD. Immunity. 7: 727.
DiCosmo BF, Picarella D, Flavell RA. (1994). Local production of human IL-6 promotes
insulinitis but retards the onset of insulin-dependent diabetes mellitus in non-obese
diabetic mice. Int Immunol. 6: 1829-137.
Diercks GF, Van Boven AJ, Hillege JL, DeJong PE, Roulean JL, Van Gilst WH. (2002).
The importance of micro albuminuria as a cardiovascular risk indicator: a review. Can J
Cardiol: 18: 525-535.
Dinarello CA. (2003). Anti-cytokine therapeutics and infections. Vaccine. 21 S2/24-
S2/34.
Doganay S., Evereklioglu C., Er H., Tukoz Y., Serving A., Mehmet N., Savli H. (2002).
Comparison of serum NO, TNF-alpha, IL-1beta, sIL-2R, IL-6 and IL-8 levels with grades
of retinopathy in patients with diabetes mellitus. Eye.16; 163-170.
Dong C (2008). Th17 cells in development: an updated view of their molecular identity
and genetic programming. Nat Rev Immunol. 8: 337-348.
Dong-Hwa Tsai., Yi-Der J., Kwan-Dun Wu., Tong-Yang Tai., Lee-Ming C. (2001).
Platelet collagen receptor α2β1 integrin and glycoprotein IIIa PlA1/A2 polymorphisms are
not associated with nephropathy in type 2 diabetes. American Journal of Kidney
Diseases. 38 (6):1185-1190
Dublin PJ, Kolls JK. (2006). IL-23 mediates inflammatory responses to mucoid
Pseudomonas aeruginosa lung infection in mice. Am J Physiol Lung
Duerr R, Taylor KD, Brant SR, Rioux JD, Silverberg MS, Daly MJ. (2006). A genome-
wide association study identifies IL-23R as an inflammation bowel disease gene. Science.
314: 1461-63.

115
Dyck RF, Klomp H, Tan L. (2001). From ‘thrifty genotype’ to ‘hefty fetal phenotype’:
the relationship between high birth weight and diabetes in Saskatchewan Registered
Indians. Can J Public Health. 92: 340-344.
Eid R.E., Rao D.A., Zhou J., Lo Shefung-fu L., Ranjbaran H., Gallo A, Sokol S.I., Pfau
S., Pober J.S, Tellides G. (2009). Interleukin-17 and interferon-gamma are produced
concomitantly by human coronary artery-infiltrating T cells and act synergistically on
vascular smooth muscle cells. Circulation. 119: 1424-1432.
Enzmann V., Faude F., Wiedemann P., Kohen L. (2000). The local and systemic
secretion of the pro-inflammatory cytokine interleukin-6 after transplantation of retinal
pigment epithelium cells in a rabbit model. Current Eye Research. 21;1: 530-534.
Esposito K., Nappo F, Marfella R, Giugliano G, Giugliano F, Ciotola M, Quagliaro L,
Ceriello A, Giugliano D. (2002).Inflammatory cytokine concentrations are acutely
increased by hyperglycemia in humans: role of oxidative stress. Circulation. 106: 2067–
2072
Evans HG., Gullick N.J., Kelly S., Pitzali C., Lord G.M., Kirkham B.W., Taams L.S.
(2009). In vivo activated monocytes from the site of inflammation in humans specifically
promote Th17 responses. PNAS. 106(15): 6232-6237.
Fagot-Campagna A, Narayan KM, Imperatore G. (2001). Type 2 diabetes in children.
BMJ: 322: 377-378.
Fallon PG, Ballantyne SJ, Mangan NE, Barlow JL, Dasvarma A, Hewett DR, Mcllgorm
A, Jolin HE, McKenzie. (2006). Identification of an interleukin-25 dependent cell
population that provides IL-4, IL-5, and IL-13 at the onset of helminth expulsion. J Exp
Med.203(4): 1105-1116.
Feldmann M., Miotla J., Paleolog E., Williams R., Malfait A.M., Taylor P., Brennan
F.M., Maini R.N. (2000). Future prospects for anti-cytokine treatment. Ann Rheum Dis.
59(Suppl I):i119-i122.
Fernandez-Real JM, Vendrell J, Ricart W, Broch M, Gutierrez C, Casamitjana R, Oriola
J, Ricart C (2000). Polymorphism of the tumor necrosis factor-alpha receptor 2 gene is
associated with obesity, leptin levels and insulin resistance in young subjects and diet-
treated type 2 diabetic patients. Diabetes Care. 23: 831-837.
116
Feuerer M, Herrero L, Cipolletta D, Naaz A, Wong J, Nayer A, Lee J, Goldfine AB,
Benoist C, Shoelson S. (2009). Lean but not obese, fat is enriched for a unique population
of regulatory T cells that affect metabolic parameters. Nat Med. 15: 930-939.
Firestein GS. (2003). Evolving concepts of rheumatoid arthritis. Nature. 423: 356-361.
Fleming D.M., Schellevis F.G., Casteren V.V. (2004). The prevalence of known diabetes
in eight European countries. European Journal of Public Health14: 10-14.
Fossiez F., Djossou O., Chomarat P., Flores-Romo L., Ait-Yahia S., Maat C., Pin Jean-J.,
Garrone P., Garcia E., Saeland S., Blanchard D., Gaillard C., Mahapatra B.D, Rouvier E.,
Golstein P., Banchereau J., Lebecque S. (1996). T Cell Interleukin-17 Induces Stromal
Cells to Produce Proinflammatory and Hematopoietic Cytokines. J Exp Med. 183; 2593-
2603.
Frank R.N. (2004) Diabetic retinopathy. N Engl J Med.350:48-58.
Franke A, McGovern DP, Barrett JC, Wang K, Radford-Smith GL, Ahmed T, Lees CW,
Balschun T, Lee J, Roberts R, Anderson CA, Bis JC, Bumpstead S, Ellinghaus D, Festen
EM, George M, Green T, Haritunians T, Jostins L, Latiano A, Mathew CG, Mongomery
GW, Prescott NJ, Raychaudhurl S, Rotter JI, Schunm P, Sharma Y, Simms LA, Taylor
KD, Whiteman D. (2010). Genome-wide meta-analysis increases to 71 the number of
confirmed Crohn’s disease susceptibility loci. Nat Genet. 42: 1118-1125.
Fujino S., Andoh A., Bamba S., Ogawa A., Hata K., Araki Y., Bamba T., Fujiyama Y.
(2003). Increased expression of interleukin-17 in inflammatory bowel disease. Gut.52:
65-70
Funatsu H., Yamashita H., Noma H., Mimura T., Nakamura S., Sakata K., Hori S.
(2005). Aqueous humor levels of cytokines are related to vitreous levels and progression
of diabetic retinopathy in diabetic patients. Arch Clin Exp Ophthalmol. 243:3-8.
Furuzawa-Carballeda J., Vargas-Rojas M.I., Cabral A.R. (2007). Autoimmune
inflammation from the Th17 prespective. Autoimm Rev. 6;3: 169-175.
Game D.S., Hernandez-Fuentes M.P., Chaudary A.N., LechlerR.I. (2003). CD4+CD25+
Regulatory T Cells Do Not Significantly Contribute to Direct Pathway Hypo
responsiveness in Stable Renal Transplant Patients. Am Soc Nephrol. 14: 1652-1661.

117
Germer A., Biedermann B., Wolburg H., Schuck J., Grosche J., Kuhrt H. (1998).
Distribution of mitochondria within Muller cells. Correlation with retinal vascularization
in different mammalian species. J Neurocytol.27:329-345.
Glas J, Stallhofer J, Ripke S, Wetzke M, Pfenning S, Klein W, Epplen JT, Griga T,
Schiemann U, Lacher M, Koletzko S, Folwaczny M, Lohse P, Goke B, Ochserkchn T,
Muller-Myhsok B, Brand S. (2009). Novel genetic risk markers for ulcerative colitis in
the IL2/IL21 region are in epistasis with IL23R and suggest a common genetic
background for ulcerative colitis and celiac disease. Am J Gastroenterol. 104: 1737-1744.
Global Information Inc. (2012). Insulin delivery devices – Increasing prevalence of
diabetes to drive market. http://www.giiresearch.com/press/gd1227854.shtml
Glustina A, Perini P, Desenzani P. (1998). Long term treatment with the dual ant
thromboxane in normotensive type II diabetic patients. Diabetes. 47: 423
Gocke A.R., Carvens P.D., Ben Li-H., Hussain R.Z., Northrop S.C., Racke M.K., Lovett-
Racke A.E. (2007). T-bet regulates the fate of Th1 and Th17 lymphocytes in
autoimmunity. J Immunol. 178: 1341-1348.
Gouras P, Algvere PV. (1996). Retinal cell transplantation in the macula: new techniques.
Vision Res. 36: 4121-4125.
Graff RJ, Lappe MA, Snell GD. (1969). The influence of gonads and the adrenal glands
on the immune response to skin grafts. Transplantation. 7: 105-11.
Grajewski R.S., Hansen A.M., Agarwal R.K., Kronenberg M., Sidobre S., Su S.B., Silver
P.B., Tsuji M., Franck R.W., Lawton A.P., Chan Chi-C., Caspi R.R. (2008). Activation
of INKT Cells Ameliorates Experimental Ocular Autoimmunity By A Mechanism
Involving Innate INF- Production and Dampening of the Adaptive Th1 and Th17
Responses. J Immunol. 181; 7: 4791-4797.
Groop L, Groop PH, Koskimies S (1986). Relationship between B-cell function and HLA
antigen in patients with type 2 diabetes. Diabetologia29: 757-760.
Gross L. (1941). Influence of sex on the evolution of a transplant mouse sarcoma.
Proceedings for the Society for Experimental Biology and Medicine. 47: 273-6.
Guangfu D., Rengao Y.E., Wei S.H.I., Shuangxin L.I.U., Tao W., Xiao Y., Niansheng Y.,
Xueqing Y.U. (2003). IL-17 induces autoantibody overproduction and peripheral blood

118
mononuclear cell overexpression of IL-6 in lupus nephritis patients. Chineas Medical
Journal.116(4): 543-548
Guyot-Revol V., Innes J.A., Hackforth S., Hinks T., Lalvani A. (2006). Regulatory T
cells are Expanded in Blood and Disease Sites in Patients with Tuberculosis. Am J Respir
Crit Care Med. 173; 803-810.
Hakeem R., Fawwad A. (2010). Diabetes in Pakistan: Epidemiology, Determinants and
Prevention. Journal of Diabeteology. June; 3:4
Hammerich L., Heymann F., Tacke F. (2011). Role of IL-17 and Th17 Cells in Liver
Diseases. Clinical and Developmental Immunology. doi. 10.1155/345803.
Hanson EH, Imperatore G, Burke W. (2001). HFE gene and hereditary hemochromatosis:
a HuGE review. Human genome epidemiology. Am J Epideimol. 154: 193-206.
Harrington L.E., Mangan P.R, Weaver C.T. (2006). Expanding the effector CD4 T cell
repertoire: the Th17 lineage. Current Opinion in Immunology. 18; 349-356.
Harrington L.E., Hatton RD, Mangan PR, Turner H, Murphy TL, Murphy KM, Weaver
CT. (2005). Interleukin 17 producing CD4+ effector T cells develop via a lineage distinct
from the T helper type 1 and 2 lineage. Nat Immunol. 6(11): 1123-1132.
Hermann C, Krikovszky D, Fust G, Kovacs M, Korner A, Szabo A, Vannay A, Madacsy
L. (2005). Association between interleukin-6 polymorphism and age-at-onset of type-1
diabetes. Epistatic influences of the tumor necrosis factor-α and interleukin-1β
polymorphism. Eur Cytokine Netw. 16; 277-81.
Higuchi A., Kawakita T., Tsubota K. (2011). IL-6 induction in desiccated corneal
epithelium in vitro and in vivo. Molecular Vision. 17; 2400-2406.
Hoffmann H.J., Malling T.M., Topcu A., Ryder L.P., Nielsen K.R., Varming K., Dahl R.,
Omland O., Sigsgarrd T. (2007). CD4dim CD25bright Treg Cell Frequencies Above a
Standadized Gating Threshold are Similar in Asthmatics and Controls. Internationl
Society for Analytical Cytology; Cytometry Part A 71A: 371-378
Honkanen J., Nieminen J.K., Gao R., Luopajarvi K., Salo H.M., Llonen J., Knip M.,
Otonkoski T., Vaarala O. (2010). IL-17 Immunity in Human Type 1 Diabetes. The
Journal of Immunology. 185; 1959-1967.
International Diabetic Federation. (2006). Diabetes Atlas. 3rd ed. Brussels, Belgium:
International Diabetic Federation: 2006.

119
Ivanov II, McKenzie BS, Zhou L, Tadokoro CE, Lepelley A, Lafaille JJ. (2006). The
orphan nuclear receptor RORgammat directs the differentiation program of pro-
inflammatory IL-17+ T helper cells. Cell. 6: 1121-33.
Ivaylo I.I., Brent S. M., Liang Z., Carios E.T., Alice L., Juan J. L., Daniel J.C., Dan R. L.
(2006). The Orphan Nuclear Receptor RORt Directs the Differentiation Program of
Proinflammatory IL-17+ T Helper Cells. Cell. 126; 1121-1133.
Jacobson DL, Gange SJ, Rose NR, Graham NMH. (1997). Epidemiology and estimated
population burden of selected autoimmune diseases in the United States. Clin Immunol
Immunopathol. 84: 223-43.
Jagannathan M, McDonnell M, Liang Y, Hasturk H, Hetzel J, Rubin D, Kantarci A, Van
Dyke TE, Ganley-Leal LM, Nikolajczyk BS. (2011). Toll-like receptors regulate B cell
cytokine production in patients with diabetes. Diabetologia. 53: 1461-1471.
Jamal-u-D., Qureshi M.B., Khan A.J., Khan M.D., Ahmad K. 2006. Prevalence of
diabetic retinopathy among individuals screened positive for diabetes in five community-
based eye camps in northern KarachiPakistan. J Ayub Med Coll Abbotabad18(3): 40-43.
Jara IJ, Sanchez CG, Silveira LH, Osuna PM, Vasey FB, Espinoza LR. (1992).
Hyperprolectinaemia in SLE: association with disease activity. American Journal of
Medical Sciences. 303: 222.
Jenkins MA, Hopper JL, Bowes G. (1994). Factors in childhood as predictors of asthma
in adult life. Brit Med J. 309: 90-3
Joseph J., Bittner S., Kaiser F.M., Wiendl H., Kisslr S. (2011). IL-17 Silencing Does Not
Protect Nonobese Diabetic Mice From Autoimmune Diabetes. J Immunol23.
Jovanovic DV, Di Battista JA, Martel-Pelletier J, Jolicoeur FC, He Y, Zhang M, Mineau
F, Pelletier JP. (1998). IL-17 stimulates the production and expression of pro-
inflammatory cytokines, IL-beta and TNF-alpha, by human macrophages. J Immunol.
160(7): 3513-3521.
Jung S.M., Moroi M.(2000).Activation of the platelet collagen receptor integrin α2β1. Its
mechanism and participation in the physiological functions of platelets. Trends
Cardiovasc Med.10:285–92.
Kahn R. (2000). Type 2 diabetes in children and adolescents. American Diabetic
Association. Diabetic Care. 23: 381-389.

120
Kahn SE, Hull RL, Utzschneider KM (2006). Mechanisms linking obesity to insulin
resistance and type 2 diabetes. Nature444: 840-846.
Kappler JW, Roehm N, Marrack P. (1987). T cell tolerance by clonal elimination. In the
thymus. Cell. 49: 273.
Kasow K.A., Chen X., Knowles J., Wichlan D., Handgretinger R., Riberdy J.M. (2004).
Human CD4+CD25+regulatory T cells share equally complex and comparable repertoires
with CD4+CD25- counterparts. J Immunol; 172: 6123-6128.
Kastelan S., Zjacic-R.V., Kastelan Z. (2007). Could diabetic retinopathy be an
autoimmune disease? Medical Hypotheses. 68:1016–18.
Kauffmann D.J.H., van Meurs J.C., Mertens D.A.E., Peperkamp Ed., Master C.,
GerritsenM.E. (1994). Cytokines in Vitreous Humor: Interleukin-6 Is Elevated in
Proliferative Vitreoretinopathy. Investigative Ophthalmology & Visual Science. 35;900-
906
Kelley DE, He J, Menshikova EV, Ritov VB. (2002). Dysfunction of mitochondria in
human skeletal muscle in type 2 diabetes. Diabetes. 51: 2944-2950.
Kempen JH, O’Colmain BJ, Leske MC. (2004). The pravelance of diabetic retinopathy
among adults in the United States. Arch Ophthalmol. 122: 552-563.
Khader SA, Bell GK, Pearl JE, Fountain JJ, Rangel-Moreno J, Cilley G, Shen F, Eaton
SM, Gaffen SL, Swain SL. (2007). IL-23 and IL-17 in the establishment of protective
pulmonary CD4+ T cell responses after vaccination and during Mycobacterium
tuberculosis challenge. Nat Immunol. 8: 369-377.
Khan S., Abbas M., Habib F., Khattak I.H., IqbalI. (2007). Prevalence of diabetes
mellitus in Mirpur and Kotli districts of Azad Jammu & Kashmir (AJ&K). Sarhad J.
Agric. 23; 4: 1141-1143
Kimura A., Naka T., Kishimoto T. (2007). Il 6 dependent and independent pathways in
the development of IL 17 producing T helper cells. PNAS. 104(29): 10299-12104
King G.L. (2008). The role of inflammatory cytokines in diabetes and its complications. J
Periodontol.79:1527-34.
Kishimoto K. (1989). The biology of interleukin 6. Blood. 74: 1-10.

121
Kobayashi T, Okamoto S, Hisamatsu T, Kamada N, Chinen H, Saito R, Kitazume MT,
Nakazawa A, Sugita A, Koganei K, Lsobe KI, Hibi T. (2008). IL-23 deficiency regulates
the Th1/Th17 balance in ulcerative colitis and Crohn’s disease. Gut. 16: 115-118.
Kolb H, Mandrup-Poulsen T (2005). An immune origin of type 2 diabetes?
Diabetologia48: 1038-1050.
Kolls JK, Linden A. (2004). Interleukin 17 family members and inflammation. Immunity.
21(4): 467-476.
Konen JC, Shihabi ZK. (1993). Microalbuminuria and diabetes mellitus. Am Fam
Physician. 5: 419-428.
Kotake S., Udagawa N., Takahashi N., Matsuzaki K., Itoh K., Ishiyama S., Saito S.,
Inoue K., Kamatani N., Gillespie M.T., Martin T.J, Suda T. (1999). IL-17 in synovial
fluids from patients with rheumatoid arthritis is a potent stimulator of osteclastogenesis.
The Journal of Clinical Investigation.103(9): 1345-1352
Korn T., Bettelli E., Gao W., Awasthi A., Jager A., Strom T.B., Oukka M., Kuchroo V.K.
(2007). IL-21 initiates an alternative pathway to induce proinflammatory Th17 cells.
Nature. 448: 484-487.
Krakoff J, Lindsay RS, Looker HC, Nelson RG, Hanson RL, Knowler WC. (2003).
Incidence of retinopathy and nephropathy in youth-onset compared with adult-onset type
2 diabetes. Diabetic Care. 26: 76-81.
Kreymborg K., Etzensperger R., Dumoutier L., Haak S., Rebollo A., Buch T., Heppner
F.L., Renauld J.C. (2007). IL-22 Is Expressed by Th17 Cells in an IL-23 Dependent
Fashion, but Not Required for the Development of Autoimmune Encephalomyelitis. The
Journal of Immunology.179: 8098-8104
Kritzik M, Savage B, Nugent DJ, Santoso S, Ruggeri ZM, Kunicki TJ. (1998).
Nucleotide polymorphisms in the alpha2 gene define multiple alleles that are associated
with differences in platelet alpha2 beta1 density. Blood. 92(7): 2382-8
Kunicki TJ, Kritzik M, Annis DS, Nugent DJ. (1997). Hereditary variation in platelet
integrin alpha 2 beta 1 density is associated with two silent polymorphisms in the alpha 2
gene coding sequence. Blood89(6): 1939-43.

122
Kunicki TJ, Williams SA, Salomon DR, Harrison P, Crisler P, Nakagawa P, Mondala TS,
Head SR, Nugent DJ. (2009). Genetics of platelet reactivity in normal, healthy
individuals. J Thromb Haemost. 7(12): 2116-22.
Kursar M., Koch M., Mittrucker H.W., Nouailles G., Bonhangen K., Kamrad T.,
Kaufmann St.H.E. (2007). Cutting Edge: Regulatory T Cells Prevent Efficient Clearance
of Mycobacterium Tuberculosis. The Journal of Immunology. 178; 2661-2665.
Lahita RG. (1990). Sex hormones and the immune system-part I. Human data. Bailliere’s
Clin Rheumatol. 4: 1-12.
Langrish CL, Chen Y, Blumenschein WM. (2005). IL-23 derives a pathogenic T cell
population that induces autoimmune inflammation. J ExpMed. 201: 233-240.
Leslie RDG, Pyke DA. (1982). Diabetic retinopathy in identical twins. Diabetes. 31: 19-
21.
Levings M.K, Sangregoria R., Roncarolo M.G. (2001), Human CD25+CD4+ T
Regulatory Cells Suppress Naive and Memory T cell Proliferation and Can Be Expanded
In Vitro without Loss of Function. J. Exp. Med. 193; 11: 1295-1301.
Li H., Louey J.W.C., Choy K.W., Liu D.T.L., Chan W.M., Chan Y.M., Fung N.S., Fan
B.J., Baum L., Chan J.C.N., Lam D.S.C., Pang C.P. (2008). EDN1 Lys198Asn is
associated with diabetic retinopathy in type 2 diabetes. Molecular Vision. 14: 1698-1704.
Limb G.A., Little B.C., Meager A., Ogilvie J.A., Wolstencroft R.A., Franks W.A.,
Chignell A.H., Dumonde D.C. (1991). Cytokines in proliferative vitreretinopathy. Eye. 5:
686-693.
Liton P.B., Li G., Luna C., Gonzalez P., Epstein D.L. (2009). Cross-talk between TGF-
beta1 and IL-6 in human trabecular meshwork cells. Molecular Vision. 15; 326-334.
Liu M.F., Lin L.H., Weng C.T., Weng M.Y. (2008). Decreased CD4+CD25+bright T cells
in peripheral blood of patients with primary Sjogren,s syndrome. Lupus.17: 34-39.
Lock C, Hermans G, Pedotti R, Brendolan A, Schadt E, Garren H. (2002). Gene-
microarray analysis of multiple sclerosis lesions yields new targets validated in
autoimmune encephalomyelitis. Nat Med. 5: 500-8.
Longhi M.S., Ma Y., Bogdanos D.P., Cheeseman P., Vergani G.M., Vergani D. (2004).
Impairment of CD4+CD25+ regulatory T cells in autoimmune liver disease. Journal of
Hepatology. 41: 31-37.

123
Lubberts E. (2007). IL-17/Th17 targeting: On the road to prevent chronic destructive
arthritis? Cytokine. 41:84-91
Lubberts E, Joosten LA, van de Loo FA, Schwarzenberger P, Kolls J, van de Berg WB.
(2002). Overexpression of IL-17 in the knee joint of collagen type II immunized mice
promotes collagen arthritis and aggravates joint destruction. Inflamm Res. 51: 102-104.
Lubberts E, Joosten LA, Chabaud M, van Den Bersselaar L, Oppers B, Coenen-De Roo
CJ, Richards CD, Miossec P, Van Den Berg WB. (2000). IL-4 gene therapy for collagen
arthritis suppresses synovial IL-17 and osteoprotegerin ligand and prevents bone erosion.
J Clin Invest. 105: 1697-1710.
Lv L., Pan K., Li X.D., She K.L., Zhao J.J., Wang W., Chen J.G., Chen Y.B., Yun J.P.,
Xia J.C. (2011). The Accumulation and Prognosis Vlue of Tumor Infiltrating IL-17
Producing Cells in Esophageal Squamous Cell Carcinoma. PLoS. 6: 3; e18219.
Ma CS, Chew GY, Simpson N, Priyadarshi A, Wong M, Grimbacher DA, Flucher SG,
Tangye M, Cook C. (2008) J Exp Med. 205: 1551-1557.
Madakamutil L.T., Maricic I., Sercarz E., Kumar V. (2003). Regulatory T cells control
autoimmunity invivo by inducing apoptotic depletion of activated pathogenic
lymphocytes. The J Immunology.170:2985-92.
Mandrup-Poulsen T (2000). IAAP boosts islet macrophage IL-1 in type 2 diabetes. Nat
Immunol. 11: 881-883.
Mangan P.R., Harrington L.E., O'Quinn D.B., Helms W.S., Bullard D.C., Elson C.O.,
Hatton R.D., Wahl S.M., Schoeb T.R., Weaver CT. (2006). Transforming growth factor β
induces development of the Th17 lineage. Nature. 441: 231-234.
Manzella D. (2010). About.com: type 2 diabetes
http://diabetes.about.com/od/symptomsdiagnosis/tp/riskfactors.htm
Maruo N, Morita I, Shirao M, Murota S. (1992). IL-6 induces endothelial permeability in
vitro. Endocrinology. 131: 710-714.
Matsubara Y., Murata M., Maruyama T., Handa M., Yamagata N., Watanabe G., Saruta
T., Ikedo Y. (2000). Association between diabetic retinopathy and genetic variations in
α2β1 integrin, a platelet receptor for collagen. Blood. 95:1560-64.

124
Meleth A.D., Agron E.,Chan C., Reed G.F., Arora K., Byrnes G., Csaky K.G., Ferris III
F.L., Cheu E.Y. (2005). Serum inflammatory markers in diabetic retinopathy.
Investigative Ophthalmology & Visual Science. 46:4295–301.
Mika N., Hideki O., Naoko U., Mineko T., Chika K., Tsuji F., Aruo H., Ishihara K.,
Huseby E., Betz U.A., Murakami M., Hirano T. (2007). IL-6-gp130-STAT3 in T cells
directs the development of IL-17+ Th with a minimum effect on that of Treg in the steady
state. Int Immunology19(6): 695-702.
Minegishi Y, Saito M, Tsuchiya S, Tsuge I, Takada H, Hara T, Kawamura N, Ariga T,
Pasic S, Stojkovic O, Metin A, Karasuyama H. (2007). Dominant negative mutations in
the DNA-binding domain of STAT3 cause hyper-IgE syndrome. Nature. 448: 1058-1062.
Miossec P., Korn T., Vijay K. (2009). Interleukin 17 and Type 17 helper T cells. The
New England Journal of Medicine. 361: 888-898
Miossec P. (2009). IL-17 and Th17 cells in human inflammatory diseases. Microbes and
Infection. 11; 25-30.
Miossec P. Interleukin 17 in rheumatoid arthritis: if T cells were to contribute to
inflammation and destruction through synergy. Arthritis Rheum. 48: 594-601.
Mocan M.C, Kadayifcilar S., Eldem B. (2006). Elevated intravitreal interleukin-6 levels
in patients with proliferative diabetic retinopathy. Can J Ophthalmol. 4. 747-752.
Monster TB, Janssen WM, de Jong PE, de Jong-Van den Berg LT, Prevented Study
Group. (2002). The impact of antihypertensive drugs groups on urinary albumin
excretion in a non-diabetic population. Br J Clin Pharmocol. 53: 31-36.
Monteleone I., Pallone F., Montelone G. (2011). Th17-related cytokines: new players in
the control of chronic intestinal inflammation. BMC Medicine. 9;122 doi. 1186/1741-
7015-9-122.
Mooradian AD. (2001). Obesity: A rational target for managing diabetes mellitus.
Growth Horm IGF Res. 11(Suppl. A): S79-S83
Moshfegh K, Wuillemin WA, Redondo M. (1999). Association of two silent
polymorphisms of platelet glycoprotein Ia/IIa receptor with risk of myocardial infarction:
a case-control study. Lance. 353: 351.
Murphy CA, Langrish CL, Chen Y. (2003). Divergent pro- and anti-inflammatory roles
for IL-23 and IL-12 in joint autoimmune inflammation. J Exp Med. 198: 1951-59.

125
Murray P.I., Hoekzema R., van Haren M.A.C., de Han F.D., Kijlsta A. (1990). Aqueous
humor interleukin-6 levels in uveitis. Investigative Ophthalmology & Visual Science.
31(5):917-920.
Mustard JF, Packham MA. (1984). Platelets and diabetes mellitus. N Eng J Med. 311:
665
Mysliwiec M., Balcerska A., Zorena K., Mysliwska J., Lipowski P., Raczynska K.
(2008). The role of vascular endothelial growth factor alpha and interleukin-6 in
pathogenesis o diabetic retinopathy. Diabetes Research and Clinical Practice. 79. 141-
146.
Mysliwska J, Zorena K, Mysliwiec M, Malinowska E, Raczynska K, Balcerska A.
(2009). The – 174GG interleukin-6 genotype is protective from retinopathy and
nephropathy in juvenile onset type-1 diabetes mellitus. Pediatric Research. 6; 3: 341-345.
Nadkarni S, Mauri C, Ehrenstein MR. (2007). Anti-TNF-alpha therapy induces a distinct
regulatory T cell population in patients with rheumatoid arthritis via TGF-beta. J Exp
Med. 204: 33-39.
Nakae S., Nambu A., Sudo K., Iwakura Y. (2003). Suppression of immune induction of
collagen-induced arthritis in IL-17 deficient mice. The Journal of Immunology. 171:
6173-6177.
Nakae S., Saijo S., Horai R., Sudo K., Mori S., Iwakura Y. (2003). IL-17 production from
activated T cells is required for the spontaneous development of destructive arthritis in
mice deficient in IL-1 receptor antagonist. PNAS. 100(10): 5986-5990
Nakamuura N., Hasegawa G., Obayashi H., Yamazaki M., Ogata M., Nakano K.,
Yoshikawa T., Watanabe A., Kinoshita S., Fujinami A., Ohta M., Imamura Y., Ikeda T.
(2003). Increased concentration of pentosidine, an advanced glycation end product, and
interleukin-6 in the vitreous of patients with proliferative diabetic retinopathy. Diabetic
Research and Clinical Practice. 61;93-101.
Nandakumar S., WT Miller C., KumaraguruU. (2009). T regulatory cells: an overview
and intervention techniques to modulate allergy outcome. Clinical and Molecular
Allergy. 7(5); doi:10.1186/1476-7961-7-5

126
Ng W.F., Duggan P.J., Ponchel F., Matarese G., Lombardi G., Edwards A.D., Isaacs J.D.,
Lechler R.I. (2001). Human CD4+CD25+ cells: a naturally occurring population of
regulatory T cells. Blood. 98: 2736-2744
Nichols GA, Arondekar B, Herman WH. (2008). Complications of dysglycemia and
medical costs associated with nondiabetic hyperglycemia. Am J Manag Care. 14: 791-
798.
Nicholson LB, Kuchroo VK. (1996). Manipulation of the Th1/Th2 balance in
autoimmune disease. Curr Opin Immunol. 8: 299.
Nishimoto N, Kishimoto T. (2006). Interleulin 6 from bench to bed side. Nat Clin Pract
Rheumotol. 2: 619-26.
Nogueira E., Hamour S., Sawant D., Henderson S., Mansfield N., Chavele K.M., Pusey
C.D., Salama A. (2010). Serum IL-17 and IL-23 levels and autoantigen-specific Th17
cells are elevated in patients with ANCA-associated vasculitis. Nephrol Dial Transplant.
25; 2209-2217.
Norbert D., Wirawan W.L., Robert A. (2003). Retinal oxygen. Fundamental and clinical
aspects. Arch Ophthalmol. 121:547-57.
Norose K., Yano A., Wang X.C., Tokushima T., Umihira J., Seki A., Nohara M., Segawa
K. (1994). Dominance of activated T cells and interleukin-6 in aqueous humor in Vogt-
Koyanagi-Harada disease. Investigative Ophthalmology & Visual Science. 35:33-39
Oda T, Yoshie H, Yamazaki K. (2003). Porphyromonas gingivalis antigen preferentially
stimulates T cells to express IL-17 but not receptor activator of NF-kappaB ligand in
vitro. Oral Microbiol Immunol. 18: 30-36.
O’ Garra A, Steinman L, Gijbels K. (1997). CD4+ T cell subset in autoimmunity. Curr
Opin Immunol. 9: 872.
Ohta K., Yamagami S., Taylor A.W., Streilein J.W. (2000). IL-6 Antagonizes TGF-beta
and abolishes Immune Privilege in Eyes with Endotoxin-Induced Uveitis. Investigative
Ophthalmology & Visual Science. 41(9): 2591-2599.
Ongkosuwito J.V., Feron E.J., van Doornik C.E.M., der Lelij A., Hoyng C.B., La heij
E.C., Kijlstra A. (1998). Analysis of immunregulatory cytokines in ocular fluid samples
from patients with uveitis. Investigative Ophthalmology & Visual Science. 39:2659-2665.

127
Owaki T. (2005). A role for IL-27 in early regulation of Th1 differentiation. J Immunol.
175: 2191-2200.
Owyang AM, Zaph C, Wilson EH, Guild KJ, McClanahan T, Miller HR, Cua DJ,
Goldschmidt M, Hunter CA, Kastelein RA, Artis D. (2006). Interleukin 25 regulates type
2 cytokine-dependent immunity and limits chronic inflammation in the gastrointestinal
tract. J Exp Med. 203(4): 843-849.
Park H, Li Z, Yang XO, Chang SH, Nurieva R, Wang YH. (2005). A distinct lineage of
CD4 T cells regulates tissue inflammation by producing interleukin 17. Nat Immunol. 11:
1133-41.
Pavkovic M., Petlichkovski A., Stojanovic A., Trajkov D., Spiroski M. (2010). BglII
polymorphism of the α2β1 integrin gene in Mecedonian population. Mecedonian Journal
of Medical Sciences. 3(2): 115-118.
PelleymounterMA, Cullen MJ, Baker MB. (1995). Effects of the obese gene product on
body weight regulation in ob/ob mice. Science: 269: 540-543
Pene J., Chevalier S., Preisser L., Venereau E., Guilleux M.H., Ghannam S., Moles J.P.,
Danger Y., Ravon E., Lesaux S., Yssel H., Gascan H. (2008). Chronically inflamed
human tissues are infiltrated by highly differentiated Th17 lymphocytes. J Immunol.
180(11): 7423-30.
Peterlin B., Petrovic M.G., Makuc J., Hawlina M., Petrovic D. (2003). A
hemochromatosis-causing mutation C282Y is a risk factor for proliferative diabetic
retinopathy in Caucasians with type 2 diabetes. J Hum Genet. 48: 646-649.
Petrovic M.G., Hawlina M., Peterlin B., Petrovic D. (2003). Bgl II gene polymorphism of
the α2β1 integrin gene is a risk factor for diabetic retinopathy in Caucasians with type 2
diabetes. J Hum Genet. 48:457-60.
Pftugfelder SC, Jones D, Ji Z, Afonso A, Monroy D. (1999). Altered cytokine balance in
the tear fluid and conjunctiva of patients with Sjogren syndrome keratoconjunctivitis
sicca. Curr Eye Res. 19: 201-11.
Pierce M, Keen H, Bradly C. (1995). Risk of diabetes in offspring of parents with non-
insulin dependent diabetes. Diabet Med: 12: 6-13.

128
Pihoker C, Scott CR, Lensing SY, Cradock MM, Smith J. (1998). Non-insulin dependent
diabetes mellitus in African-American youths of Arkansas. Clin Pediatr (Phila): 37: 97-
102.
Pournaras CJ. (1995). Retinal oxygen distribution: its role in the pathophysiology of
vasoproliferative microangiopathies. Retina. 15: 332-347
Powell EDU, Field RA. (1964). Diabetic retinopathy and rheumatoid arthritis. Lancet. 2:
17.
Pradhan AD, Manson JE, Rifai N, Buring JE, Ridker PM. (2001). C-reactive protein,
interleukin-6 and risk of developing type 2 diabetes mellitus. JAMA. 286: 327-334.
Qidwai W., Ashfaq T. (2010). Imminent epidemic of diabetes mellitus in Pakistan: Issues
and challenges for health care providers. JLUMHS. Sept – Dec. 9; 3: 112-113
Rabineau KM, Treiber FA, Poole J, Ludwig D. (2005). Interactive effects of anger
expression and ET-1 Lys198Asn polymorphism on vasoconstriction reactivity to
behavioral stress. Ann Behav Med. 30: 85-89.
Rachitskaya A.V., Hansen A.M., Horai R., Zhuqing L., Villasmil R., Luger D.,
Nussenblatt R.B., Caspi R.R. (2008). Cutting Edge: NKT Cells Constitutively Express
IL-23 Receptor and RORt and Rapidly Produce IL-17 upon Receptor Ligation in an IL-6
Independent Fashion. The Journal of Immunology. 180; 5167-5171.
Radstake T.R.D.J., Bon L.V., Broen J., Wenink M., Santegoets K., Deng Y., Hussaini A.,
Simms R., Cruikshank W.W., Lafytis R. (2009). Increased Frequency and Compromised
Function of T Regulatory Cells in Systemic Sclerosis (SSc) Is Related to a Diminished
CD69 and TGF-beta Expression. PLoS ONE.4;6:e5981
Re Sandra L., Dumoutier L., Couillin I., Vyve C.V., Yakoub Y., Uwambayinema F.,
Marien B., Sybille B.V.D., Snick J.V., Uyttenhove C., Ryffel B., Renauld J.C., Lison D.,
Huaux F. (2010). IL-17A Producing T and Th17 Lymphocytes Mediate Lung
Inflammation but not Fibrosis in Experimental Silicosis. J Immunol.184; 6367-6377.
Roncarolo M.G., Levings M.K. (2000). The role of different subsets of T regulatory cells
in controlling autoimmunity. Current opinion in Immunology.12: 676-683.
Rosciszewska D. (1980). Analysis of seizure dispersion during menstrual cycle in women
with epilepsy. Monogr Neural Sciences. 5: 280-4.

129
Rosenbaum J.T., Kievit P., Han Y.B., Park J.M., Planck S.R. (1998). Interleukin-6 does
not mediate endotoxin-induced uveitis in mice: studies in gene deletion animals.
Investigative Ophthalmology & Visual Science. 39: 64-69.
Rosmond R, Chagnon M, Bouchard C, Bjorntorp P (2003). Increased abdominal obesity,
insulin and glucose levels in non-diabetic subjects with a T29C polymorphism of the
transforming growth fector-beta1 gene. Horm Res. 59: 191-194.
Sakaguchi S., Wing K., Miyara M. (2007). Regulatory T cells – a brief history and
prespective. Eur J Immunol. 37: S116-123.
Sato K, Suematsu A, Okamoto K. (1992). Th17 functions as an osteoclastogenic helper T
cell subset that links T cell activation and bone destruction. J Exp Med. 11(Suppl 1): 181-
6.
Schmidt-W.C.B., Akdis M., Akdis C.A. (2007). Th17 cells in the big picture of
Immunology. J Allergy Clin Immunol. 120: 247-254.
Schnyder-Candrium S, Togbe D, Couillin I, Mereier I, Brombacher F, Quesniaux V,
Fossiez F, Ryffel B, Schnyder B. (2006). Interleukin 17 is a negative regulator of
established allergic asthma. J Exp Med. 203: 2715-2725.
Scriba T.J., Kalsdorf B., Abrahams D.A., Isaacs F., Hofmeister J., Black G., Hassan
H.Y., Wilkinson R.J., Walzl G., Gelderbloem S.J., Mahomed H., Hussey G.D., Hanekom
WA. (2008). Distinct, specific IL-17 and IL-22 producing CD4+ T cell subsets contribute
to the human anti-mycobacterial immune response. The Journal of Immunology. 180:
1962-1970.
Seeman T, Merkin SS, Crimmins E, Koretz B, Karalamangla A. (2008). Education,
income and ethnic differences in cumulative biological risk profiles in a national sample
of US adults. NHANES III (1988-1994). Soc Sci Med. 66: 72-87.
Shames R.S. (2002). Gender Differences in the Development and Function of the
Immune System. J Adolescent Health.30:59-70.
Shaw J.E., Sicree R.A., Zimmet P.Z. (2010). Global estimates of the prevalence of
diabetes for 2010 and 2030. Diabetic Research and Clinical Practice. 87; 4-14.
Shera A.S., Jawad F., Maqsood A. (2007). Prevalence of diabetes in Pakistan. Diabetes
Research and Clinical Practice. 76: 219-222.

130
ShoelsonSE, Lee J, Goldfine AB. (2006). Inflammation and insulin resistance. J Clin
Invest: 116: 1793-1801.
Silverman BL, Metzger BE, Cho NH, Loeb CA. (1995). Impaired glucose tolerance in
adolescent offspring of diabetic mothers. Relationship to fetal hyperinsulinism. Diabetic
Care. 18: 611-617.
Singh R., Shaw J., Zimmet P. (2004). Epidemiology of childhood type 2 diabetes in the
developing world. PediatrDiabetes.5:154-68.
Smyth L.J.C., Starkey C., Vestbo J., Singh D. (2007). CD4 Regulatory Cells in COPD
Patients. Chest. 132: 156-163
Sobhon P, Jirasattham C. (1974). Effects of sex hormones on the thymus and lymphoid
tissue of ovariectomized rats. Acta Anat. 89: 211-25.
Spolski R, Leonard WJ. (2007). Interleukin-21: basic biology and implications for cancer
and autoimmunity. Ann Rev Immunol. 26: 57-59.
Steinman L. (2008). A rush to judgment on Th17. J Exp. Med. 205; 7: 1517-1522.
Stevens F.R.A., Hajeer A., John S, Thomson W., Worthington J., Davis J.R.E., Ollier
W.E.R. (1999). The BglII polymorphism of the human prolactin gene lies within intron C
and can be detected by PCR/RFLP. European Journal of Immunogenetics. 26: 261-263.
Sthoegher ZM, Chirozi M, Lahita RG. (1988). Regulation of the immune response by sex
hormones I. Effects of estradiol and testosterone on pokeweed mitogen induced human B
cell differentiation. J Immunol. 141: 91-8
Stumvoll M., Goldstein B.J., van Haeften T.W. (2005). Type 2 diabetes: principles of
pathogenesis and therapy. Lancet. 365:1333-46.
Sullivan K.E., McDonald-M.D., Zackai E.H. (2002). CD4+CD25+ T-cell Production in
Healthy Humans and in Patients with Thymic Hypoplasia. Clinical and Diagnostic
Laboratory.Sept. 1129-1131
SunM, Y.P., Du L., Zhou H., Ren X., Kijlstra A. (2010). Contribution of CD4+CD25+ T
Cells to the Regression Phase of Experimental Autoimmune Uveoretinitis. Investigative
Ophthalmology. 51(1):383-389.
Tam V.H.K., Lam E.P.K., Chu B.C.Y., Tse K.K., Fung L.M. 2008. Incidence and
progression of diabetic retinopathy in Homg Kong Chinese with type 2 diabetes mellitus.
Journal of Diabetes and its Complications. Xxxxxx
131
Tang Q. (2008). Central role of defective interleukin-2 production in the triggering of
islet autoimmune destruction. Immunity. 28: 687-697.
Tang S, Le-Ruppert KC. (1995). Activated T lymphocytes in epiretinal membranes from
eyes of patients with proliferative diabetic retinopathy. Graef Arch Clin Exp. 233: 21-5.
Tao X, Wang X, Zhong B, Nurieva RI. (2011). Ursolic acid suppresses interleukin-17
production by selectively antagonizing the function of RORγT protein. The Journal of
Biological Chemistry. 286(26): 22707-227.
Tato C., Laurence A., O’Shea JJ. (2006). Helper T cell differentiation enters a new era:
Le Roi est mort; vive le Roi! JExp. Med. 203(4): 809-812.
Taylor P.A., Noelle R.J., Blazar B.R. (2001). CD4+CD25+ Immune regulatory cells are
required for induction of tolerance to alloantigen via costimulatory blockade. J Exp. Med.
193(11): 1311-1317.
The effect of intensive treatment of diabetes on the development and progression of long-
term complications in insulin-dependent diabetes mellitus. The diabetes control and
complications trial research group. (1993). New Engl J Med.329:977-86.
The Task Force on Gender MSaA. (1999). Sex differences in autoimmune diseases.
Focus on multiple sclerosis New York: National Multiple Sclerosis Society.
Thorand B, Lowel H, Schneider A. (2003). C-reactive protein as a predictor for incident
diabetes mellitus among middle aged men: results from MONICA Augsburg cohort
study, 1984-1998. Arch Intern Med. 163: 93-99.
Tong Z., Yang Z., Patel S., Chen H., Gibbs D., Yang X., H.V.S., Kaminoh Y., Harmon J.,
Pearson E., Buehler J., Chen Y., Yu B., Tinkham N.H., Zabriskie N.A., Zeng J., Luo L.,
Sun J.K., Prakash M., Hamam R.N., Tonna S., Constantine R., Ronquillo C.C., Sadda
S.V., Avery R.L., Brand J.M., London N., Anduze A.L., King G.L., Bernstein P.S.,
Watkins S. Genetics of diabetes and Diabetic Complication Study Group, Jorde L.B., Li
D.Y., Alello L.P., Pollak M.R., Zhang K. (2008). Promoter polymorphism of the
erythropoietin gene in sever diabetic eye and kidney complications. PNAS; 105(19):
6998-7003.
Tull ES, Rosemann JM. (1995). Diabetes in African Americans. Chapter in : Diabetes in
America. 2nd edn. NIH Publication No 95-1468; pp 613-630.

132
Tuomilehto-Wolf E, Tuomilehto J, Hitman GA, Nissinen A, Stengard J, Pekkanen J,
Kivinen P, Kaarsalo E, Karvonen MJ (1993). Genetic susceptibility to non-insulin
dependent diabetes mellitus and glucose intolerance are located in HLA region. BMJ.
307: 155-159.
Uhlmann K., Kovacs P., Boettcher Y., Hammes H.P., Paschke R. (2006). Genetics of
diabetic retinopathy. Exp Clin Endocriniol Diabetes.114:275-94.
Veldhoen M , Hocking RJ, Atkins CJ, Locksley RM, Stockinger B. (2006). TGF-beta in the
context of an inflammatory cytokine mileu supports de novo differentiation of IL-17 producing T
cells. Immunity. 2: 179-89.
Venn A, Lewis S, Cooper M. (1998). Questionnaire study of effect of sex and age on the
prevalence of wheeze and asthma in adolescence. Br Med J. 316: 1945-6.
Voo K.S., Wang Y.H., Santori F.R., Boggiano C., Wang Y.H., Arima K., Bover L.,
Hanabuchi S., Khalili J., Marinova E., Zheng B., Littman D.R., Liu Y.J. (2009).
Identification of IL-17 producing FOXP3+ regulatory T cells in humans. PNAS. 106; 12:
4793-4798.
Vozarova B, Weyer C, Lindsay RS, Pratley RE, Bogardus C, Tataranni PA. (2002). High
white blood cell count is associated with a worsening of insulin sensitivity and predicts
the development of type 2 diabetes. Diabetes. 51: 455-461.
Walsh CH, Malins JM. (1998). Proliferative retinopathy in a patient with diabetes
mellitus and idiopathic haemochromatosis. Br Med J: 2: 16-17.
Wangsa-Wirawan ND, Linsenmeier RA. (2003). Retina oxygen: fundamental and clinical
aspects. Arch Ophthalmol. 121: 547-557.
Warner JA, Jones CA, Jones AC. (1997). Immune responses during pregnancy and the
development of allergic disease. Pediatr Allergy Immunol. 8: 5-10.
Warpeha K.M., ChakravarthyU.(2003). Molecular genetics of microvascular disease in
diabetic retinopathy. Eye.17:305–11.
Wei R., Su-hua Z., Jing W.U., Ying N.I. (2004). Polymorphism of the leptin gene
promoter in pedigrees of type 2 diabetes in ChongqingChina. Chinese Medical
Journal147(4): 558-561
Weiner HL. (2001). Induction and mechanism of action of transforming growth factor-
beta-secreting Th3 regulatory cells. Immunol Rev. 182: 207-214.

133
Whitacre CC, Reingold SC, O’Looney PA, Task Force on Gender MSaA. (1999). A
gender gap in autoimmunity. Science. 283: 1277-8.
Wild S., Roglic G., Green A. (2004). Global Prevalence of Diabetes. Estimates for the
year 2000 and projections for 2030. Diabetes Care.27(5):1047–1053.
Wilson N.J, Boniface K., Chan J.R., Mckenzie B.S., Blumenschein W.M., Mattson J.D.,
Basham B., Smith K., Chen T., Morel F., Lecron J.C., Kastelein R.A., Cua D.J.,
McClanahan T.K, Bowman E.P., Malefyt R.D.W. (2007). Development, cytokine profile
and function of human interleukin-17 producing helper T cells. Nature Immunology. 8; 9:
950-957.
Winer S, Chan Y, Paltser G, Truong D, Tsui H, Bahrami J, Dorfman R, Wang Y,
Zielenski J, Mastronardi F. (2009). Normalization of obesity-associated insulin resistance
through immunotherapy. Nat Med. 15: 921-929.
Winocour PD. (1992). Platelet abnormalities in diabetes mellitus. Diabetes. 41: 26.
Wong C.K., Lit L.C.W., Tam L.S., Li E.K.M., Wong P.T.Y., Lam C.W.K. (2008).
Hyperproduction of IL-23 and IL-17 in patients with systemic lupus erythematosus:
Implications for Th17-mediated inflammation in autoimmunity. Clinical Immunology.
127: 385-393.
World Health Organization Expert Committee. (1999). Definition, diagnosis and
classification of diabetes mellitus and its complications. Report of a WHO consultation,
part 1: diagnosis and classification of diabetes mellitus. WHO, Geneva.
World Health Organization. (2002). Fact Sheet N138. Geneva. Switzerland. WHO
Xu I, Kitani A, Fuss I, SuoberW. (2007). Cutting edge regulatory cells under
CD4+CD25+ Foxp3+ T cells or are self-induced to become Th17 cells in the absence of
exogenous TGF-beta. J Immunol. 178: 6725-6729.
Xu T., Wang X., Zhong B., Nurieva R.I., Ding S., Dong C. (2011). Urosolic acid
suppresses IL-17 production by selectivity antagonizing the function of RORt protein.
The American Society for Biochemistry and Molecular Biology. Manuscript
C111.250407.
Yamada H. (2010). Current perspectives on the role of IL-17 in autoimmune disease.
Journal of Inflammation and Research.3: 33-44

134
Yan D, Cheung J, Scheerens H. (2006). IL-23 is essential for T cell mediated colitis and
promotes inflammation via IL-17 and IL-6. J Clin Invest. 116: 1310-16.
Yan LL. Liu K, Daviglus ML. (2006). Education, 15-year risk factor progression, and
coronary artery calcium in young adulthood and early middle age: the Coronary Artery
Risk Development in Young Adults study. JAMA. 295: 1793-800.
Yang W., Lu J., Weng J., Jia W., Ji L., Xiao J., Shan Z., Liu J., Tian H., Ji Q., Zhu D., Ge
J., Lin L., Chen Li., Guo X., Zhao Z., Li Q., Zhou Z., Shan G., He J. (2010). Prevalence
of Diabetes among Men and Women in China. The New England Journal of
Medicine.362: 1090-101
Yao Z, Painter SL, Fanslow WC, Ulrich D, Macduff BM, Springgs MK, Armitage RJ.
(1995). Human IL-17: a novel cytokine derived from T cells. J Immunol. 155: 5483-
5486.
Ye P., Garvey P.B., Zhang P., Nelson S., Bagby G., Summer W.R, Schwarzenberger P.,
Shellito J.E, Kolls J.K. (2001). Interleukin-17 and lung host defense against Klebsiella
pneumonia infection. Am J Respir Cell Mol Biol.25; 335-340.
Yeh S.H., Chuang H., Lin L.W., Hsiao C.Y., Eng H. L. (2006). Regular tai chi chuan
exercise enhances functional mobility and CD4CD25 regulatory T cells. Br J Sports Med.
40; 239-243.
Yoshimura T., Sonoda K.H., Ohguro N., Ohsugi Y., Ishibashi T., Cua D.J., Kobayashi T.,
Yoshida H., Yoshimura A., (2009). Involvement of Th17 cells and the effect of anti-IL-6
therapy in autoimmune uveitis. Rheumatology. 48; 347-354.
Yoshimura T., Sonoda K.H, Miyazaki Y. (2008). Differential roles for INF-gamma and
IL-17 in experimental autoimmune uveoretinitis. Int Immunol. 20: 209-14.
Yuuki T., Knda T., Kimura Y., Kotajima N., Tamura J., Kobayashi I., Kishi S. (2001).
Inflammatory cytokines in vitreous fluid and serum of patients with diabetic
vitreoretinopathy. Journal of Diabetes and its Complications. 15;257-259.
Zhang X, Saaddine J.B., Chou C.F., Coteh M.F., Cheng Y.J., Geiss L.S., Gregg E.W.,
Albright A.I., Klein B.E.K., Klein R. (2010). Prevalence of diabetic retinopathy in the
United States, 2005-2008. JAMA. 304; 6; 649-656.

135
Zhao X.F., Pan H.F., Yuan H., Zhang W.H., Li X.P., Wang G.H., Wu G.C. Su H., Pan
F.M., Li W.X., Li L.H., Chen G.P., Ye D.Q. (2009).Increased serum interleukin 17 in
patients with systemic lupus erythematosus. Mol Biol Rep. 9533-43
Zeng C. Xiaoyun S, Baojun Z, He L, Lianjun Z, Wenjun D, Yong Z. (2012). The
imbalance of Th17/Th1/Tregs in patients with type 2 diabetes: relationship with
metabolic factors and complications. J Mol Med. 90: 175-186.
Zheng S.G., Wang J., Horwitz D.A. (2008). Cutting edge: Foxp3+CD4+CD25+
regulatory T cells induced by IL-2 and TGF-β are resistant to Th17 conversion by IL-6.
The Journal of Immunology180: 7112-7116
Zimmet P, Alberti KG, Shaw J. (2001). Global and social implications of the diabetic
epidemic. Nature. 414: 782-787.
Zorgdrager A, De Keyser J. (1997). Menstrually related worsening of symptoms in
multiple sclerosis. J Neurol Sci. 149: 95-7

136
Appendix A
CONSENT FORM
Introduction:
Aim of this project is to analyze one of those genes that determine susceptibility to diabetic
retinopathy, enumerate T regulatory cells and to determine the concentration of cytokines (IL-6
and IL-17).
Procedure:
In this study we would draw 10 ml blood by aseptic technique
Possible risks:
No risk
Possible benefits:
It will help in understanding the etiology of diabetic retinopathy.
Financial benefit:
There is no financial benefit for your participation in this research.
Confidentiality:
The information provided by you will be kept secret.
Available sources of information:
You may ask any question from principal investigator; Dr. Nadeem Afzal, Department of
Immunology, University of Health Sciences,Lahore.
Authorization:
I have read and understand this consent form, and I volunteer to participate in this research study.
I am not waiving any of my legal rights by signing this form. My signature below indicates my
consent.
Name of participant: Date:
Signature/thumb impression: Date:
Signature of principal investigator: Date:

137
Appendix B
DATA FORM
Patient ID: ___________
Name: ___________ Age: ________________
Sex: _____________ Occupation: ____________
Contact Address: _________________________________________________________
Land line number: _____________ Cell phone number: ____________________
Duration of diabetes: ________________________________
Insulin therapy: ____________________________________
Age at the onset of diabetes: _____________________________
Smoking status: ____________________________________
History of hypertension: _____________________________
Blood pressure (mmHg): _____________________________
HbA1c (%): ____________________________________________________________
Diagnosis:
______________________________________________________________________________
______________________________________________________________________________
____________________________________________________________