the role of connections in academic promotions
TRANSCRIPT

The Role of Connections in AcademicPromotions∗
Natalia Zinovyeva† Manuel Bagues ‡
October 30, 2012
Abstract
This paper analyzes the role of connections in academic promotions.We exploit the exceptional evidence provided by centralized evalua-tions in Spain, where evaluators are randomly assigned to promotioncommittees. Candidates are more likely to be promoted when theyare evaluated by an acquainted evaluator. The source of this pre-mium depends on the nature of their relationship. Candidates pro-moted by a weak link turn out to be more productive in the futurerelative to other promoted candidates, suggesting that informationalgains dominate potential evaluation biases. On the contrary, can-didates promoted by a strong connection exhibit a worse researchrecord both before and after the evaluation. Our results have impor-tant implications for the optimal design of evaluation committees inacademia.
Keywords: academic promotion, connections, evaluation bias, infor-
mation asymmetries
JEL Classification: J44, M51
∗An earlier version of this paper was circulated under the title “It’s Not What YouKnow, but Who You Know? The Role of Connections in Academic Promotions.” We areextremely grateful to Berta Esteve-Volart, Dan Hamermesh, Eduardo Melero, Nic Mor-gan, Heidi Williams and participants at presentations at the DIME-BRICK workshop,Simposio de Analisis Economico, European Society of Population Economics, UniversitaBocconi, Universidad Carlos III, NBER Summer Institute and the European EconomicAssociation for their valuable comments. Both authors acknowledge the support fromthe Spanish Ministry of Science and Innovation (grant CSO2011-29431 and Ramon yCajal program).†Institute of Public Goods and Policies (IPP-CSIC). Email: [email protected]‡Universidad Carlos III de Madrid. Email: [email protected]
1

1 Introduction
Science is largely relying on a non-market reward system, based on meri-
tocracy and credit granted by peers (Stephan 1996). Failures in this system
might have important consequences for the overall quality of research. A
potential threat is the existence of previous connections between candi-
dates and evaluators. Evaluators may favor connected candidates out of
nepotism or because they share a common view on which academic areas
are more valuable.1 However, the presence of acquainted evaluators might
also improve the efficiency of a selection process, as they might be better
informed about candidates’ quality.
The net effect of this trade-off, the potential existence of an evalua-
tion bias versus the positive informational effect of connections, may vary
depending on the nature of connections and the institutional setup. The
empirical evidence is relatively scarce.2 Laband and Piette (1994) and
Brogaard et al. (2012) show that, in top Economics journals, editors
take advantage of their connections with colleagues from their own institu-
tion in order to identify and ‘capture’ high-impact papers for publication.
Li (2011) finds that the presence of related reviewers, as measured by cita-
tions, improves the quality of research supported by the National Institute
of Health (NIH). Whether these results hold in other contexts or whether
they apply to other types of connections remains an open question.
In this paper we study the role of connections in academic promotions
using the exceptional evidence provided by the system of centralized eval-
uations that was in place in Spain from 2002 through 2006. During this
period, candidates both to full professor and associate professor positions
were evaluated by a committee at the national level.3 Successful candi-
1As Joseph A. Schumpeter (1954) pointed out, “it is merely human nature that weoverrate the importance of our own types of research and underrate the importance ofthe types that appeal to others.” (History of Economic Analysis, London: George Allenand Unwin, 1954, page 20.)
2A number of studies observe that connected candidates are more likely to be pro-moted. For instance, evidence from France and Italy shows that promotion committeestend to prefer connected candidates, conditional on their observable research production(Perotti 2002, Combes et al. 2008, De Paola and Scoppa 2011, Durante et al. 2011).This evidence is consistent both with the existence of informational asymmetries andan evaluation bias.
3The position of catedratico de universidad at a Spanish university may be consideredequivalent to the position of full professor in a U.S. university. The category of profesor
2
dates could then apply for a position at the university level.4 The evidence
provided by centralized competitions has several convenient features for
the analysis. First, committee members were selected out of the pool of
eligible professors in the discipline using a random lottery. Our empirical
strategy exploits this random assignment of evaluators to committees. This
approach allows for the possibility that connected candidates are better in
dimensions that are observable to evaluators but not to the econometri-
cian. Second, conflict of interest rules were seldom implemented. As a
result, it is possible to study the effect of different types of connections
between evaluators and candidates, including very close ones such as the-
sis advisors, co-authors and colleagues as well as weaker ties. Finally, the
system affected a large number of researchers at every academic discipline.
In total, our database includes information on thirty thousand candidacies
evaluated by approximately one thousand committees. The size and the
breadth of the database allow us to investigate the robustness of results
along a number of dimensions.
Connections have a significant positive impact on candidates’ chances of
being promoted. The magnitude of the effect is increasing with the strength
of the connection. Candidates have 78% more chances of being promoted
if the committee includes, by luck of the draw, a strong connection such as
their doctoral thesis advisor or a co-author; the presence in the committee
of a colleague from the same university increases candidates’ chances of
success by 35%, and the presence of a weak connection, such as a professor
with whom the candidate had interacted previously at some PhD thesis
defense, by 19%. The importance of connections is commensurate with
the relevance of observable research quality, as measured by the number of
publications in ISI Web of Science, received citations, and participation in
thesis committees. For instance, the presence of a strong connection in the
evaluation committee is equivalent to a one standard deviation increase in
candidates’ observable quality.
titular de universidad would be equivalent to associate professor; in Spain, the positionof associate professor typically carries tenure.
4This procedure is relatively similar to promotion systems currently in place in othercountries in continental Europe. In France, professors are recruited through a centralizedexamination (concours nationaux d’agregation). In Italy, the Moratti Law (2005) intro-duced a nation-wide qualification exam for candidates to university positions (l’idoneitanazionale).
3

The information on candidates’ research production during the five-year
period following the evaluation suggests that the source of the premium
enjoyed by connected candidates depends on the nature of their relation-
ship with committee members. Information asymmetries about candidates’
research quality may explain why evaluators are more likely to promote
weakly connected candidates. Candidates that were promoted by a com-
mittee that included a weak tie turn out to be significantly more productive
in the future relative to other promoted candidates. On the contrary, candi-
dates who were promoted by a committee that included their thesis advisor,
a co-author or a colleague exhibit a worse research record both before and
after the evaluation. In this case, evaluators seem to be willing to ‘sac-
rifice’ candidates’ research production in exchange for getting connected
candidates promoted. There are at least two possible explanations for this
behavior. Strong connections might be benefiting from cronyism. Alterna-
tively, the larger success rate of these candidates might reflect the existence
of information asymmetries in some other dimension that is only observ-
able for strongly connected evaluators, such as candidates’ willingness to
help other colleagues (Oettl 2012). However, it seems unlikely that these
information asymmetries can fully explain the large premium associated
to connections. According to survey information, publications in journals
covered by ISI Web of Science were the most important factor for promo-
tion decisions.5 Overall, our analysis suggests that the balance between the
positive informational effect of connections and the potential existence of
evaluation biases varies depending on the strength of connections.
The rest of the paper is organized as follows. Section 2 describes the
institutional background. Section 3 provides details on the data and the
definition of variables. In section 4 we present the empirical evidence and
we investigate possible explanations for the effect of connections. Finally, in
section 5 we summarize our results and discuss possible policy implications.
5Survey completed by 1,294 eligible evaluators (Sierra et al. 2009).
4
2 Institutional background
European countries are increasingly concerned with the efficiency of their
universities. In an attempt to strengthen meritocracy, during the last
decade several countries have reformed the organization of universities
(Aghion et al. 2010). In this respect, Spain offers an insightful case.
Before 2002, Spanish public universities had a large degree of autonomy
regarding hiring and promotion.6 This system was largely associated with
inbreeding, generating public concerns about the potential existence of fa-
voritism.7 In order to increase meritocracy, in 2002 a system of centralized
competitions known as habilitacion was introduced by the government.8
The new system involved two stages. First, candidates to full and asso-
ciate professor positions were required to qualify in a national competition
held at the discipline level.9 Successful candidates could then apply for
a position at a given university. The number of positions created at the
national level was very limited, and competition at the university level was
largely absent. Thus, in practice, being accredited was generally equivalent
to being promoted. Notably, committee members in centralized competi-
tions were selected by random draw from the pool of all evaluators in the
field. In 2006, the system of habilitacion was replaced by a system known
as acreditacion, which is still in place. As in the system of habilitacion,
applicants are required to be accredited by a national review committee.
However, under the new system, committee members are selected from the
pool of professors who volunteer for the task, and there is no limit to the
number of candidates who may receive the accreditation.
6As is generally the case in Europe, most university professors in Spain are basedin public universities. In Spain, approximately 88% of university professors work in apublic institution (Source: Instituto Nacional de Estadıstica 2010).
7According to Cruz-Castro et al. (2006) in the nineties 93% of university tenuredpositions were assigned to internal candidates. Approximately 70% of these candidateshad also done their PhD in the same university.
8This motivation for the reform was expressed, among others, by Julio Iglesias deUssel, vice-minister for Education and Universities (newspaper El Paıs, November 5th,2001). Detailed information about this system of centralized competitions is available atthe State Bulletin (http://www.boe.es/boe/dias/2002/08/07/pdfs/A29254-29268.pdf)
9There are nearly two hundred legally defined academic disciplines. These disci-plines were created in 1984 on the basis of “the homogeneity of its object of knowledge,a common historic tradition and the existence of a community of researchers” (R.D.1988/84).
5
In this paper we analyze centralized competitions in the Spanish public
university system during 2002-2006. The time structure of examinations
was as follows. First, universities reported the number of openings to the
Ministry.10 The centralized competition was then announced, and candi-
dates were allowed to apply within twenty days. Once the list of applicants
was settled, committee members were selected by random draw from the
list of eligible evaluators. This list included those professors and researchers
who were working in public institutions in Spain at the time, and who were
officially recognized to have a minimum research quality in the discipline.11
Around 80% of full professors and approximately 70% of associate profes-
sors qualified.12 The selection was carried out by Ministry officials using a
drum which contained as many balls as there were eligible evaluators.
Each committee was composed of seven members. In exams to associate
professor positions, three evaluators were chosen from the list of eligible full
professors (henceforth FP), and four evaluators were chosen from the list
of eligible associate professors (henceforth AP). In the case of exams to FP
positions, all committee members were chosen from the list of eligible FPs.
The committee member with the longest tenure was appointed president,
and the exam was held at the university where the president was based.
Further, seven evaluators were randomly assigned to form a committee
in reserve. Their role was to replace evaluators in case somebody resigned
10Even though the number of available accreditations was equal to the total numberof openings requested by universities, these accreditations were not directly linked touniversity openings. Universities that had requested a position were not forced to hireone of the candidates who were accredited in the following competition. Universitiescould postpone hiring decisions, or they could hire a candidate who had been accreditedin the past. In fact, universities would often create a position once a local candidatehad been accredited.
11The random assignment of evaluators to committees was subject to some minorconstraints. Not more than one non-university researcher belonging to the SpanishResearch Council (CSIC) was allowed to be selected as a member of the evaluationcommittee for a given exam. Similarly, not more than one emeritus professor was allowedto be selected as a member of a given evaluation committee. Therefore, in exams wherethe population of potential evaluators contained two or more researchers, or two or moreemeritus professors, the expected committee composition should be computed takinginto account this constraint. The details on these calculations are in Appendix B.
12The research quality requirement was based on the number of sexenios recognized toeach professor. Sexenios are granted by the Spanish education authorities on the basis ofapplicants’ academic research output in any non-interrupted period of a maximum of sixyears. Source: Comision Nacional Evaluadora de la Actividad Investigadora, Memoriade los resultados de las evaluaciones realizadas de 1989 a 2005, 2005.
6
from the committee. Evaluators could only resign under a very restricted
set of reasons, and resignations happened very rarely: about 2% of initially
assigned evaluators were replaced. There are two main types of resigna-
tions. Professors were allowed to decline if they were temporarily holding a
high position in Spain’s public administration. Also, professors were to ab-
stain from participating in the committee if they had a very close personal
connection with one of the candidates.13 With very few exceptions, evalu-
ators did not report such connections. For instance, according to our own
calculations, out of 832 professors who were assigned to evaluate their own
PhD students, only 22 resigned from the committee, a proportion which is
similar to the overall rate.
Competitions to FP positions had two qualifying stages. In the first
stage each candidate presented her resume. In the second stage candidates
presented a piece of their research work. Additionally, exams to AP po-
sitions had an intermediate stage, in which candidates had to deliver a
lecture on a topic from their syllabus. At each stage, passing decisions
were taken on a majority basis. At the end of the process, the number of
qualified candidates could not be larger than the total number of positions.
3 Data
We use data from three different sources. First, we have collected informa-
tion on all exams to AP and FP positions that were held in Spain when the
centralized system of examinations was in place (years 2002-2006). Second,
we have gathered information on the research output of candidates and el-
igible evaluators from ISI Web of Science. Third, we use information on
PhD dissertations read in Spain. This data allows us to identify individ-
uals’ PhD alma mater and their academic networks. In Appendix A we
provide a detailed explanation on how this data was collected and how each
variable was constructed. Below we describe the final database.
13The law considers three main cases: (i) the evaluator has a personal interest in thematter, (ii) there is some kinship relationship, (iii) there exists a well-known friendship(or enmity). Ley de Procedimiento Administrativo 30/1992, article 28, retrieved onFebruary 7th 2012 at http://www.boe.es/aeboe/consultas/bases_datos/doc.php?
id=BOE-A-1992-26318. We thank Anxo Sanchez for providing us this reference.
7
3.1 Exams
The dataset includes information on 967 exams, of which 465 are exams
to AP positions and 502 are exams to FP positions. Table 1 provides de-
scriptive information on the characteristics of these exams. There were
on average five positions available per exam in AP exams, and three posi-
tions per exam in FP exams. The level of competition was similar; in both
types of exams there were approximately ten candidates for every position.
Practically all positions offered were filled.
3.2 Evaluators
In total, in the period we study there were 7,963 eligible FPs and 21,979
eligible APs. As shown in Table 2, the average eligible FP is 53 years old;
eight years older than the average eligible AP. Women constitute 14% of
eligible FPs and 35% of APs. As expected, eligible FPs tend to have a larger
research record than APs. On average, FPs have nine (single-authored
equivalent) ISI publications and APs have five.14 Publications of both
FP and AP professors receive around 8 citations each. Eligible FPs have
supervised on average five doctoral students, while the average eligible AP
has supervised only one student. Similarly, FPs have participated in almost
five times more PhD thesis committees than APs, 25 and 5 respectively.
3.3 Candidates
During the period of study there were 13,612 applications to FP positions,
and 18,138 applications to AP positions. On average, candidates applied
twice, either because they failed the first time, or because they tried to
simultaneously obtain a position in several related disciplines. As shown in
Table 2, candidates to FP positions tend to be older, male, and to exhibit
a better research record than candidates to AP positions. Applicants to
FP positions have on average advised two students, and have participated
in seven dissertation committees, whereas applicants to AP positions have
not yet actively participated in the direction of doctoral students, and only
14In what follows we divide publications by the number of co-authors. For instance,two publications with two co-authors are equivalent to one single-authored publication.
8
a few of them have taken part in PhD committees. Given that there are
relatively large differences across positions and across disciplines in the
propensity to publish, cite, participate in dissertations, and time necessary
to progress in the career, in what follows we normalize research indicators
and age to have zero mean and unit standard deviation for candidates
within each exam.
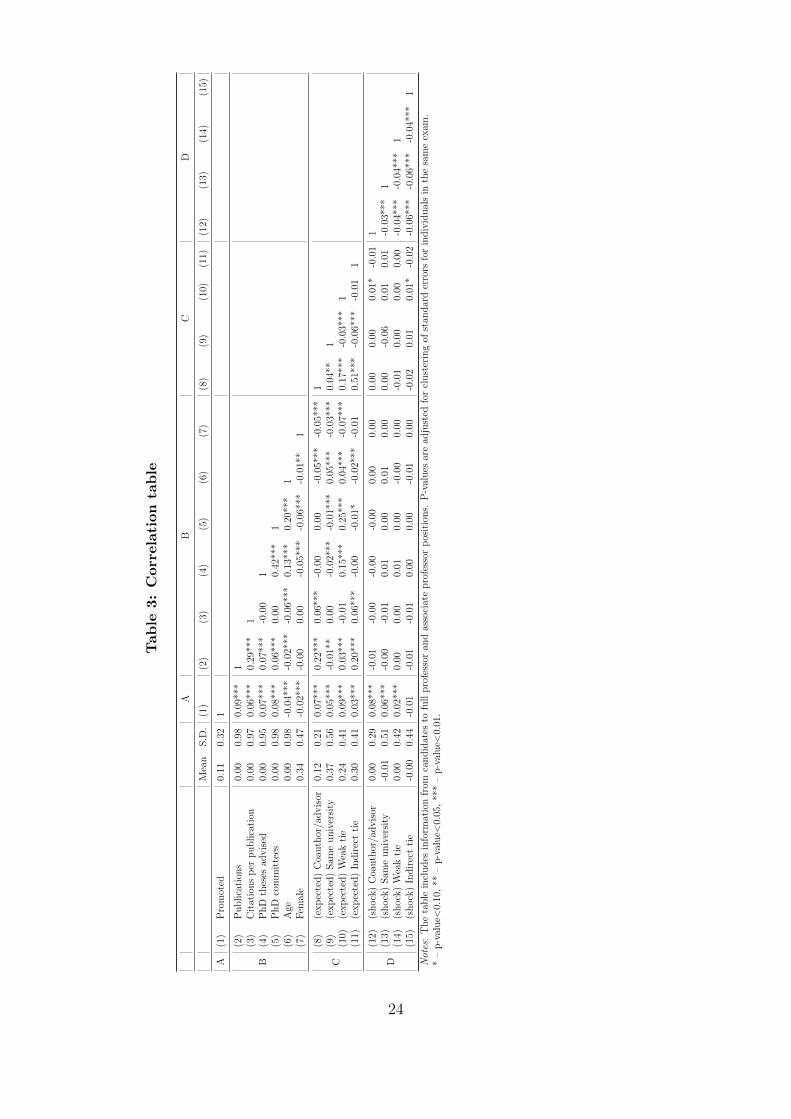
In Table 3 we report the correlation between the main characteristics of
candidates, pooling together information from exams to FP and AP posi-
tions.15 We observe that more prolific candidates tend also to have higher
research quality, as measured by the number of citations received (Table
3, block B-B). Well-published candidates are also more likely to partici-
pate in students’ supervision and evaluation. On average, older candidates
do not have a better publication record, but they have participated more
extensively in students’ supervision and evaluation. There are no gender
differences in terms of publications and citations, but women are signifi-
cantly less likely to advise doctoral students or participate in dissertation
committees.
3.4 Links between evaluators and candidates
We consider several types of connections between candidates and evalua-
tors. As Granovetter (1973) points out, the strength of an interpersonal
tie should be related to “the amount of time, the emotional intensity, the
intimacy (mutual confiding), and the reciprocal services which characterize
the tie”. First, we focus on the strongest academic connections: advisors
and co-authors. As shown in Table 4, approximately 13% of applicants
to a FP positions happened to be evaluated by one of these strong links.
In exams to AP positions, they affected 8% of candidates. Second, we
investigate institutional connections. In exams to FP positions 28% of can-
didates had a colleague from their university (who was not an advisor or a
co-author) sitting in the evaluation committee. In exams to AP positions,
25% of candidates were evaluated by a committee that included an evalua-
tor who was based in candidates’ alma mater.16 Third, we use information
15Results are very similar if we disaggregate the table by position.16Unfortunately we cannot observe the affiliation of candidates to AP positions at
the time of the exam, we only observe the institution where they obtained their PhD.
9

on candidates’ and evaluators’ participation in PhD thesis committees. We
consider several types of interactions: (i) the evaluator was a member of
candidate’s thesis committee, (ii) the evaluator has invited the candidate
to sit on the thesis committee of one of her students (or vice versa) and
(iii) the evaluator and the candidate participated in the same thesis com-
mittee. We denominate these links weak ties. Weak ties are relatively more
frequent in exams to FP positions, where approximately 34% of candidates
are evaluated by a weak link. In exams to AP positions, only 7% of candi-
dates have a weak tie with a committee member. Finally, we define several
indicators of indirect links between candidates and evaluators: the evalu-
ator and the candidate have either (i) a common advisor, (ii) a common
co-author or (iii) a common thesis committee member. To stress that these
links do not necessarily imply professional interaction or awareness of each
other’s research, we denominate them indirect ties. These indirect ties are
also relatively frequent, affecting about a fifth of candidates.
4 Empirical analysis
Our empirical analysis is structured as follows. First, we estimate the
(causal) effect of committees’ composition on applicants’ chances of being
promoted. In order to get a better understanding of the magnitude of
the effect, we also compare the effect of connections on promotions with
the effect of observable research quality. Second, we explore the effect of
connections across different types of disciplines, departments, candidates
and evaluators. Finally, we investigate the source of the premium associ-
ated to connections. In particular, using information on candidates’ future
research production, we consider the possibility that evaluators might be
more accurate at assessing the research potential of candidates they are
acquainted with.
Given the low geographical mobility of Spanish professors at this stage (Cruz-Castro etal. 2006), it seems reasonable to presume that the large majority of candidates to APpositions were still based in their alma mater at the time of the evaluation.
10
4.1 The (causal) effect of connections on promotions
As shown in Table 4, candidates’ chances of success are significantly larger
when they have some connection in the evaluation committee. In exams
to FP positions, candidates who are evaluated by their thesis advisor or
co-author are three times more likely to be promoted than candidates who
had no connections in the committee. Candidates with colleagues or weak
connections among evaluators have more than twice larger chances of suc-
cess relatively to unconnected candidates. Indirect connections are also
associated to larger chances of success, although the premium is not as
high as in the case of direct connections. The pattern is very similar in
exams to AP positions.
Naturally, this descriptive evidence might be suggestive about the po-
tential relevance of connections, but it has no causal interpretation. The
larger success rate of connected candidates might simply reflect their higher
quality (see Table 3, block C-B). In order to identify the causal effect of hav-
ing a connection in the committee, we compare the outcomes of candidates
with a similar expected committee composition but who, as a consequence
of the realizations of random draws, are evaluated by committees with dif-
ferent composition. For instance, one may think about the case of two
candidates who apply for a promotion, each one has a connection in the
set of eligible evaluators, but only one of these two connected evaluators
happens to be (randomly) assigned to the evaluation committee.
As pointed out in section 2, approximately 2% of evaluators drawn
in the lottery where replaced. As well, according to anecdotal evidence,
some professors did not attend the exam (or part of it) without a proper
justification. In what follows, we measure committee composition using the
outcome of the initial random draw, which might be slightly different from
the committee composition that ends up evaluating candidates. Therefore,
our estimates below provide the intention-to-treat effect.
The following equation describes the relationship between the candi-
dates’ probability of being promoted and the (random) number of connec-
tions in the evaluation committee:
yie = β0 + β1(cie − µie) + εie (1)
11

where yie indicates whether individual i qualified in exam e and (cie−µie) is
the shock to committee composition, i.e., the difference between the actual
(cie) and the expected number of connections (µie) of candidate i. Note
that β0 indicates the average success rate.
The key assumption in our identification strategy is that the selection
of committee members was random. More formally,
E[(cie − µie) · εie] = 0 (2)
If this condition is satisfied, β1 can be interpreted as the causal effect of
an additional connection among evaluators on candidates’ probability of
success.
The empirical evidence is consistent with the assignment indeed being
random. As shown in Table 3, there is no significant difference between the
expected committee composition and the mean of the actual realization of
the draw. As well, there is no relationship between the magnitude of the
shocks to committee composition and candidates’ characteristics (Table 3,
blocks D-B and D-C).
Table 5 presents the estimation results for equation (1). Standard errors
are clustered at the exam level, reflecting the fact that the shocks received
by candidates in the same examination are not independent. We report
results for the four aggregate sets of connections defined earlier: strong,
institutional, weak and indirect connections.17 Strong connections lead to
a 9 percentage points increase in applicants’ likelihood of success (column
1). This is equivalent to a 78% increase relative to the average success rate
(about 11% of candidates are promoted). Institutional and weak connec-
tions with committee members also have a significant positive effect. They
increase candidates’ chances of success by 4 and 2 percentage points respec-
tively (approximately a 35% and a 19% increase). The effect of indirect
connections is not statistically different from zero.
Weak ties are relatively more important in exams to AP positions.
The importance of other connections is stable over the academic career
(columns 2 and 3). Next, as a robustness check, in column 4 we control
for exam fixed effects. As expected, results are unchanged. We also use an
17In Appendix A we report results at a disaggregated level.
12

alternative identification strategy to estimate the effect of committee com-
position. Specifically, given that many individuals applied several times for
promotion, we use a fixed-effects strategy. In other words, we compare the
evaluations given to the same individual by different promotion committees.
Note that this strategy is less efficient, since it does not exploit all possible
variation in the data. Its internal validity is also more limited, as it con-
siders only those individuals who participated in examinations more than
once. Nevertheless, the estimates are statistically similar to the baseline
estimation (column 5 vs. column 1). As an additional robustness check, we
replicate the analysis for the subsample of candidates who obtained their
PhD in Spain. The estimated coefficients are similar to the ones obtained
for the whole sample (column 6 vs. column 1).
4.2 The role of candidates’ quality
The results above suggest that connections have a strong effect on promo-
tion decisions. In order to get a better understanding of the magnitude
of these effects, we examine the relevance of a number of observable in-
dividual characteristics that proxy for candidates’ quality. In particular,
we estimate the effect of candidates’ publications, the average number of
citations per publication, the number of PhD students advised, and the
number of participations in PhD thesis committees. We also control for
age since, conditional on research output, younger candidates might have
a larger potential. These variables are all normalized at the exam level.
The effect of observable research quality is commensurate with the effect
of connections. Candidates who, conditional on age, score one standard
deviation more than average in each one of these four observable dimensions
of research quality have approximately 7 percentage points higher chances
of success (Table 5, column 7). We also observe that, conditional on their
research output, older candidates have lower chances of promotion.
Our analysis may be subject to a measurement error induced by homonymity.
This might create an attenuation bias in our estimates for variables based
on publications data. Given that homonymity is expected to be less of
a problem for individuals with less common surnames, we also perform
the analysis on the subsample of individuals with surnames that are less
13
frequent than the median surname (column 8). The estimates of some co-
efficients are slightly larger. In this subsample, an increase of one standard
deviation in all research indicators is associated with 10 percentage points
higher chances of success. The presence of an advisor or a co-author in
the committee has also a slightly larger impact. It increases candidates’
chances of being promoted by 12 percentage points. The effect of colleagues
and weak connections remains the same.
4.3 Heterogeneity analysis
Next we analyze whether the effect of connections varies depending on the
characteristics of disciplines, universities, candidates and evaluators.
4.3.1 Disciplines
The Spanish academic profession is formally divided into nearly two hun-
dred disciplines. We divide disciplines into seven broad groups: Physics
and Mathematics, Engineering, Chemistry and Biology, Medicine, Social
Sciences, Humanities, and Law. The upper panel of Table 6 shows some
descriptive information by disciplinary group. Candidates’ propensity to
publish in journals indexed by ISI Web of Science varies across groups. In
Law, candidates have almost no publications, suggesting that, at least in
Spanish academia, ISI journals are not a common outlet for research in this
disciplinary group. Candidates in the Social Sciences and Humanities have
published less than one article (adjusted by the number of co-authors),
whereas candidates in the rest of disciplines have published about five to
nine articles.
The lower panel provides information on the impact of candidates’ ob-
servable research quality and connections on their probability of being pro-
moted. Indicators of research quality and connections tend to have a similar
effect on candidates’ chances of being promoted across all groups of disci-
plines. The only exception is observed in Law, where ISI publications and
participation in dissertations do not seem to matter for promotion and the
impact of having direct connections in the committee is twice as large as
in the average discipline.
The size of the discipline may affect the prevalence of connections and
14
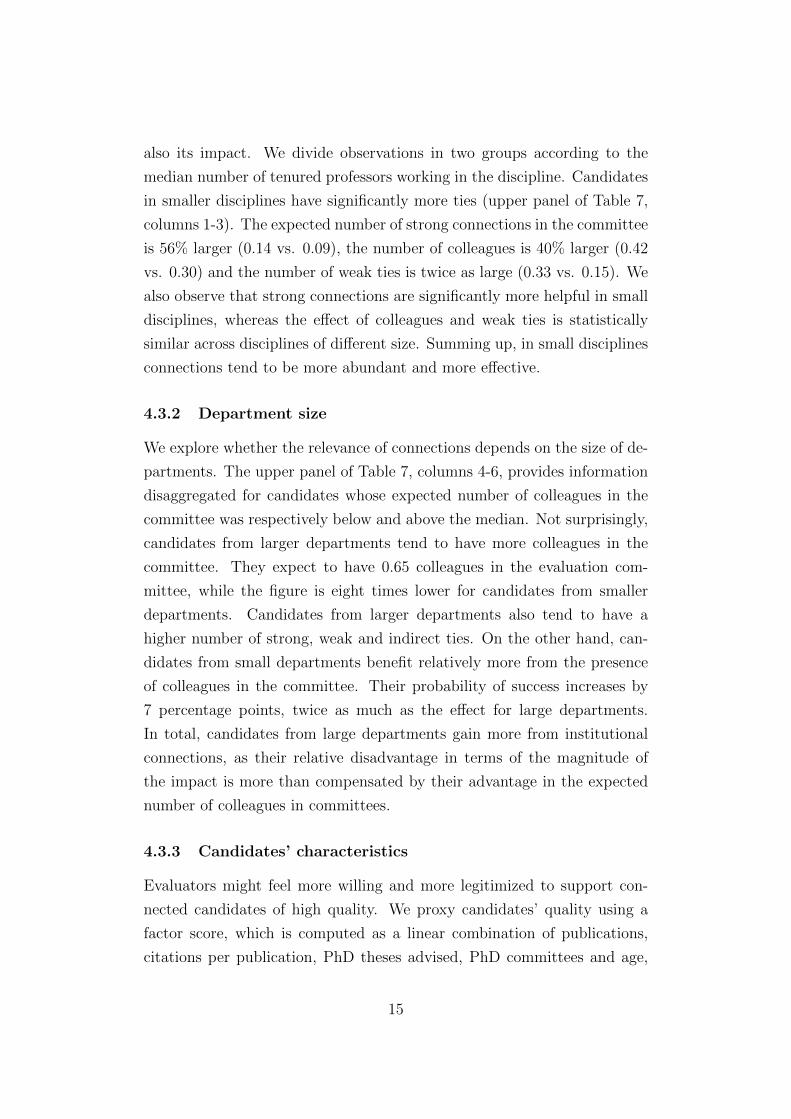
also its impact. We divide observations in two groups according to the
median number of tenured professors working in the discipline. Candidates
in smaller disciplines have significantly more ties (upper panel of Table 7,
columns 1-3). The expected number of strong connections in the committee
is 56% larger (0.14 vs. 0.09), the number of colleagues is 40% larger (0.42
vs. 0.30) and the number of weak ties is twice as large (0.33 vs. 0.15). We
also observe that strong connections are significantly more helpful in small
disciplines, whereas the effect of colleagues and weak ties is statistically
similar across disciplines of different size. Summing up, in small disciplines
connections tend to be more abundant and more effective.
4.3.2 Department size
We explore whether the relevance of connections depends on the size of de-
partments. The upper panel of Table 7, columns 4-6, provides information
disaggregated for candidates whose expected number of colleagues in the
committee was respectively below and above the median. Not surprisingly,
candidates from larger departments tend to have more colleagues in the
committee. They expect to have 0.65 colleagues in the evaluation com-
mittee, while the figure is eight times lower for candidates from smaller
departments. Candidates from larger departments also tend to have a
higher number of strong, weak and indirect ties. On the other hand, can-
didates from small departments benefit relatively more from the presence
of colleagues in the committee. Their probability of success increases by
7 percentage points, twice as much as the effect for large departments.
In total, candidates from large departments gain more from institutional
connections, as their relative disadvantage in terms of the magnitude of
the impact is more than compensated by their advantage in the expected
number of colleagues in committees.
4.3.3 Candidates’ characteristics
Evaluators might feel more willing and more legitimized to support con-
nected candidates of high quality. We proxy candidates’ quality using a
factor score, which is computed as a linear combination of publications,
citations per publication, PhD theses advised, PhD committees and age,
15
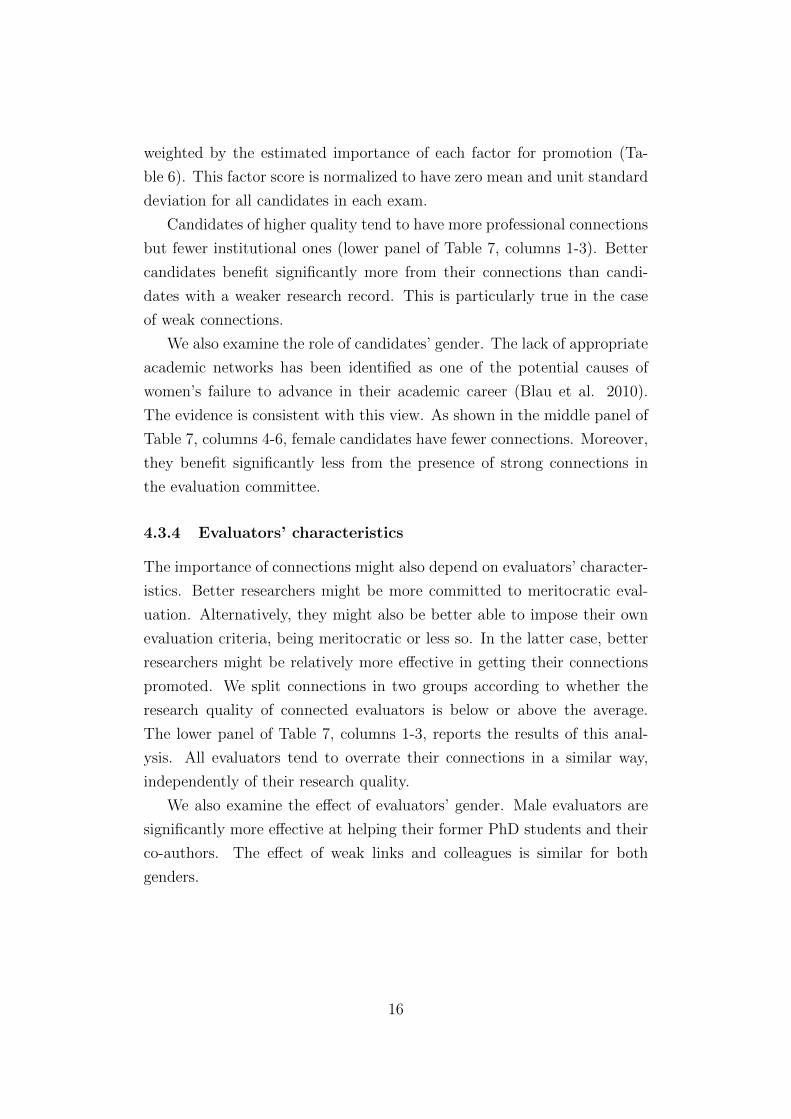
weighted by the estimated importance of each factor for promotion (Ta-
ble 6). This factor score is normalized to have zero mean and unit standard
deviation for all candidates in each exam.
Candidates of higher quality tend to have more professional connections
but fewer institutional ones (lower panel of Table 7, columns 1-3). Better
candidates benefit significantly more from their connections than candi-
dates with a weaker research record. This is particularly true in the case
of weak connections.
We also examine the role of candidates’ gender. The lack of appropriate
academic networks has been identified as one of the potential causes of
women’s failure to advance in their academic career (Blau et al. 2010).
The evidence is consistent with this view. As shown in the middle panel of
Table 7, columns 4-6, female candidates have fewer connections. Moreover,
they benefit significantly less from the presence of strong connections in
the evaluation committee.
4.3.4 Evaluators’ characteristics
The importance of connections might also depend on evaluators’ character-
istics. Better researchers might be more committed to meritocratic eval-
uation. Alternatively, they might also be better able to impose their own
evaluation criteria, being meritocratic or less so. In the latter case, better
researchers might be relatively more effective in getting their connections
promoted. We split connections in two groups according to whether the
research quality of connected evaluators is below or above the average.
The lower panel of Table 7, columns 1-3, reports the results of this anal-
ysis. All evaluators tend to overrate their connections in a similar way,
independently of their research quality.
We also examine the effect of evaluators’ gender. Male evaluators are
significantly more effective at helping their former PhD students and their
co-authors. The effect of weak links and colleagues is similar for both
genders.
16
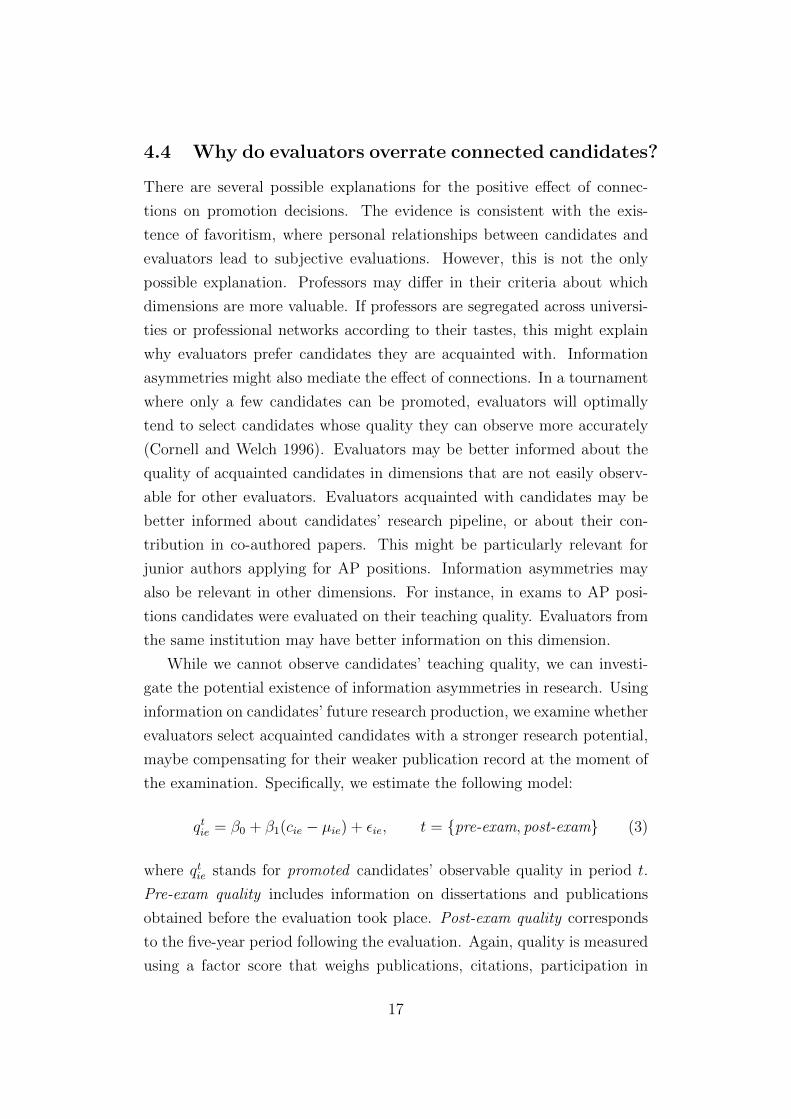
4.4 Why do evaluators overrate connected candidates?
There are several possible explanations for the positive effect of connec-
tions on promotion decisions. The evidence is consistent with the exis-
tence of favoritism, where personal relationships between candidates and
evaluators lead to subjective evaluations. However, this is not the only
possible explanation. Professors may differ in their criteria about which
dimensions are more valuable. If professors are segregated across universi-
ties or professional networks according to their tastes, this might explain
why evaluators prefer candidates they are acquainted with. Information
asymmetries might also mediate the effect of connections. In a tournament
where only a few candidates can be promoted, evaluators will optimally
tend to select candidates whose quality they can observe more accurately
(Cornell and Welch 1996). Evaluators may be better informed about the
quality of acquainted candidates in dimensions that are not easily observ-
able for other evaluators. Evaluators acquainted with candidates may be
better informed about candidates’ research pipeline, or about their con-
tribution in co-authored papers. This might be particularly relevant for
junior authors applying for AP positions. Information asymmetries may
also be relevant in other dimensions. For instance, in exams to AP posi-
tions candidates were evaluated on their teaching quality. Evaluators from
the same institution may have better information on this dimension.
While we cannot observe candidates’ teaching quality, we can investi-
gate the potential existence of information asymmetries in research. Using
information on candidates’ future research production, we examine whether
evaluators select acquainted candidates with a stronger research potential,
maybe compensating for their weaker publication record at the moment of
the examination. Specifically, we estimate the following model:
qtie = β0 + β1(cie − µie) + εie, t = {pre-exam, post-exam} (3)
where qtie stands for promoted candidates’ observable quality in period t.
Pre-exam quality includes information on dissertations and publications
obtained before the evaluation took place. Post-exam quality corresponds
to the five-year period following the evaluation. Again, quality is measured
using a factor score that weighs publications, citations, participation in
17

theses committees, and age based on the estimated contribution of each
factor to promotion decisions (as reported in Table 6).
This analysis is reported in Table 8. Results differ depending on the
nature of the connection. The evidence suggests that information asymme-
tries regarding candidates’ research quality cannot justify the premium en-
joyed by candidates who were evaluated by a strong professional connection
or a colleague. These candidates tend to be significantly less productive,
both before and after the evaluation, relative to other promoted candidates
(columns 1 and 4).
However, in the case of weak ties the informational component seems
to dominate any potential evaluation bias. Candidates who were promoted
by a weak tie turn out to be more productive in the five-year period follow-
ing the examination than other promoted candidates, although this effect
is only marginally significant at standard levels. Given that information
asymmetries about candidates’ research potential are more likely to be
present at earlier stages of the career, we analyze separately promotions to
AP and FP positions. As expected, the informational contribution of weak
ties is particularly large in AP exams. An additional weak tie is associated
to future research quality being 0.25 standard deviations higher, an effect
that is very significant both in statistical and economic terms (column 6).
5 Conclusions
The selection of evaluators is subject to a well-known dilemma. Evaluators
who are acquainted with candidates may have superior information about
their quality. Unfortunately, their criteria might also be biased. Which of
the two effects dominates may vary depending on the nature of their rela-
tionship, on the extent of information asymmetries and on the institutional
framework.
In this paper we analyze the role of connections in the context of aca-
demic promotions in Spain. We focus on the period between 2002 and
2006, when a system of centralized competitions with random assignment
of evaluators to committees was in place. We find that connections improve
significantly candidates’ chances of chances of success both in exams to as-
sociate professor positions and full professor positions. Connections affect
18
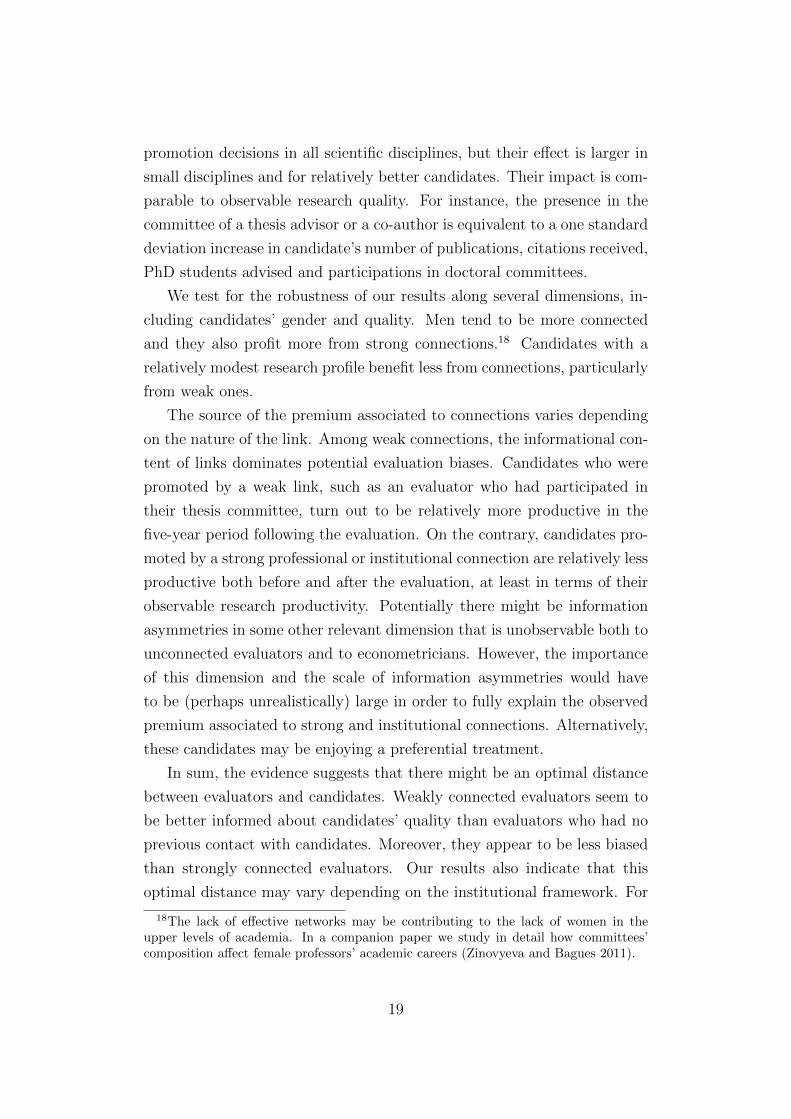
promotion decisions in all scientific disciplines, but their effect is larger in
small disciplines and for relatively better candidates. Their impact is com-
parable to observable research quality. For instance, the presence in the
committee of a thesis advisor or a co-author is equivalent to a one standard
deviation increase in candidate’s number of publications, citations received,
PhD students advised and participations in doctoral committees.
We test for the robustness of our results along several dimensions, in-
cluding candidates’ gender and quality. Men tend to be more connected
and they also profit more from strong connections.18 Candidates with a
relatively modest research profile benefit less from connections, particularly
from weak ones.
The source of the premium associated to connections varies depending
on the nature of the link. Among weak connections, the informational con-
tent of links dominates potential evaluation biases. Candidates who were
promoted by a weak link, such as an evaluator who had participated in
their thesis committee, turn out to be relatively more productive in the
five-year period following the evaluation. On the contrary, candidates pro-
moted by a strong professional or institutional connection are relatively less
productive both before and after the evaluation, at least in terms of their
observable research productivity. Potentially there might be information
asymmetries in some other relevant dimension that is unobservable both to
unconnected evaluators and to econometricians. However, the importance
of this dimension and the scale of information asymmetries would have
to be (perhaps unrealistically) large in order to fully explain the observed
premium associated to strong and institutional connections. Alternatively,
these candidates may be enjoying a preferential treatment.
In sum, the evidence suggests that there might be an optimal distance
between evaluators and candidates. Weakly connected evaluators seem to
be better informed about candidates’ quality than evaluators who had no
previous contact with candidates. Moreover, they appear to be less biased
than strongly connected evaluators. Our results also indicate that this
optimal distance may vary depending on the institutional framework. For
18The lack of effective networks may be contributing to the lack of women in theupper levels of academia. In a companion paper we study in detail how committees’composition affect female professors’ academic careers (Zinovyeva and Bagues 2011).
19
instance, while Laband and Piette (1994) and Brogaard et al. (2012) find
that editors use personal associations with colleagues in their departments
in order to improve selection decisions, in Spain the presence of colleagues
in promotion committees tends to decrease the research quality of promoted
candidates.
Our analysis suggests that the introduction of centralized promotion
examinations with random assignment of evaluators to committees per se
does not eliminate the problem of favoritism. If anything, it introduces
an element of randomness relative to who benefits from connections and
who gets ultimately promoted. It also favors candidates from universities
with relatively many senior researchers, which might be detrimental for the
growth prospects of young departments. According to our findings, strong
conflicts of interest should be prevented. If necessary, disciplines should be
legally defined in such a way that they are large enough to allow for the
implementation of the conflict of interest rules. At the same time, the pres-
ence of external evaluators who are weakly acquainted with the candidate
may improve the quality of selection. Our work might be also interpreted
as additional evidence in favor of a radical change in the way higher ed-
ucation is organized in continental Europe. The analysis of Aghion et al.
(2010) suggests that a combination of competition and autonomy would
make European universities more productive. According to this view, Eu-
rope needs to move from a system of rules to one of incentives, whereby
it is in the self-interest of universities to appoint and promote the most
productive individuals (Perotti 2002). Our analysis does not provide an
answer about which of these alternatives, more rules or incentives, would
yield better outcomes. Nevertheless, it illustrates the limitations of a sys-
tem of centralized competitions where evaluators (and universities) do not
internalize the consequences of their decisions.
References
Aghion, Philippe, Mathias Dewatripont, Caroline Hoxby, Andreu Mas-
Colell and Andre Sapir (2010), “The governance and performance
of universities: evidence from Europe and the US,” Economic Pol-
icy, Vol 25(61), pp. 7-59.
20

Blau, Francine D., Janet M. Curie, Rachel T.A. Croson and Donna K.
Ginther (2010), “Can Mentoring Help Female Assistant Professors?
Interim Results from a Randomized Trial,” American Economic
Review, Vol. 100(2), pp. 348-352.
Brogaard, Jonathan, Joseph Engelberg and Christopher A. Parsons
(2012), “Network Position and Productivity: Evidence from Jour-
nal Editor Rotations,” mimeo.
Combes, Pierre-Philippe, Laurent Linnemer and Michael Visser
(2008), “Publish or peer-rich? The role of skills and networks
in hiring economics professors,” Labour Economics, Vol. 15, pp.
423-441.
Cornell, Bradford and Ivo Welch (1996), “Culture, Information, and
Screening Discrimination,” Journal of Political Economy, Vol.
104(3), pp. 542-571.
Cruz-Castro, Laura, Luis Sanz-Menendez and Jaime Aja Valle (2006),
“Las trayectorias profesionales y academicas de los profesores de
universidad y los investigadores del CSIC,” Unidad de polıticas
comparadas (CSIC) Working Paper #06-08.
De Paola, Maria and Vincenzo Scoppa (2011), “Gender Discrimina-
tion and Evaluators’ Gender: Evidence from the Italian Academy”,
Universita di Calabria, Working Paper #06 - 2011.
Durante, Ruben, Giovanna Labartino and Roberto Perotti (2011),
“Academic Dynasties: Decentralization and Familism in the Italian
Academia”, NBER Working Paper #17572.
Fuentes, Eulalia and Llorenc Arguimbau (2010), “Las tesis doctorales
en Espana (1997-2008): analisis, estadısticas y repositorios cooper-
ativos”, Revista Espanola de Documentacion Cientıfica, Vol. 33(1),
pp. 63-89.
Laband, David N. and Michael J. Piette (1994), “Favoritism versus
Search for Good Papers: Empirical Evidence Regarding the Behav-
ior of Journal Editors”, Journal of Political Economy, Vol. 102(1),
pp. 194-203.
21
Li, Danielle (2011), “Information, Bias, and Efficiency in Expert Eval-
uation: Evidence from the NIH”, mimeo, MIT.
Granovetter, Mark S. (1973), “The Strength of Weak Ties”, American
Journal of Sociology, Vol. 78 (6), pp. 1360-1380.
Oettl, Alexander (2012), “Reconceptualizing Stars: Scientist Helpful-
ness and Peer Performance,” Management Science, Vol. 58(6), pp.
1122-1140.
Perotti, Roberto (2002), “The Italian University System: Rules vs.
Incentives”, paper presented at the First Conference on Monitoring
Italy, ISAE, Rome.
Sierra, Juan Carlos, Gualberto Buela-Casal, Mara Paz Bermudez
Sanchez, and Pablo Santos-Iglesias (2009), “Opinion de Profe-
sores Titulares y Catedraticos de Universidad acerca de criterios
y estandares para la acreditacion del profesorado universitario,”
Revista Espanola de Documentacion Cientıfica, Vol. 32 (3), pp.
89-100.
Stephan, Paula E. (1996), “The Economics of Science”, Journal of
Economic Literature, Vol. 34(3), pp. 1199-1235.
Zinovyeva, Natalia and Manuel Bagues (2011), “Does Gender Matter
for Academic Promotion: Evidence from a Randomized Experi-
ment”, IZA Discussion Paper #5537.
22
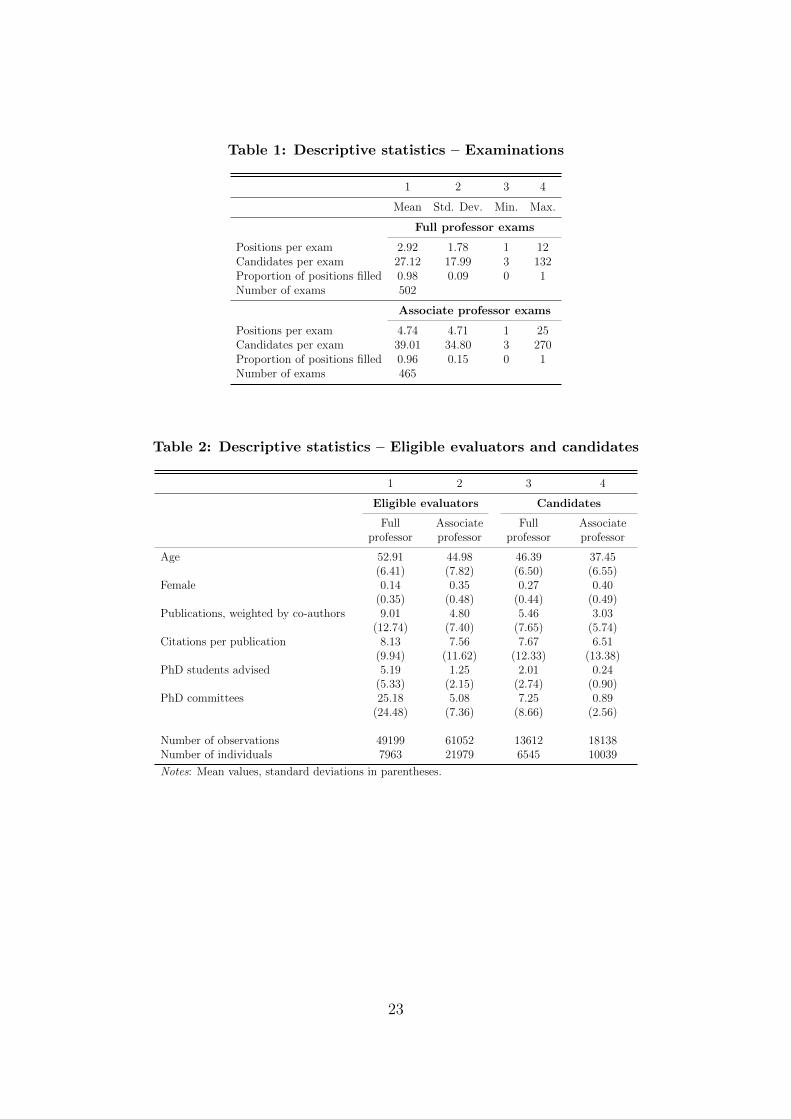
Table 1: Descriptive statistics – Examinations
1 2 3 4
Mean Std. Dev. Min. Max.
Full professor exams
Positions per exam 2.92 1.78 1 12Candidates per exam 27.12 17.99 3 132Proportion of positions filled 0.98 0.09 0 1Number of exams 502
Associate professor exams
Positions per exam 4.74 4.71 1 25Candidates per exam 39.01 34.80 3 270Proportion of positions filled 0.96 0.15 0 1Number of exams 465
Table 2: Descriptive statistics – Eligible evaluators and candidates
1 2 3 4
Eligible evaluators Candidates
Full Associate Full Associateprofessor professor professor professor
Age 52.91 44.98 46.39 37.45(6.41) (7.82) (6.50) (6.55)
Female 0.14 0.35 0.27 0.40(0.35) (0.48) (0.44) (0.49)
Publications, weighted by co-authors 9.01 4.80 5.46 3.03(12.74) (7.40) (7.65) (5.74)
Citations per publication 8.13 7.56 7.67 6.51(9.94) (11.62) (12.33) (13.38)
PhD students advised 5.19 1.25 2.01 0.24(5.33) (2.15) (2.74) (0.90)
PhD committees 25.18 5.08 7.25 0.89(24.48) (7.36) (8.66) (2.56)
Number of observations 49199 61052 13612 18138Number of individuals 7963 21979 6545 10039
Notes: Mean values, standard deviations in parentheses.
23
Tab
le3:
Corr
ela
tion
tab
le
AB
CD
Mea
nS.D
.(1
)(2
)(3
)(4
)(5
)(6
)(7
)(8
)(9
)(1
0)(1
1)(1
2)(1
3)(1
4)(1
5)
A(1
)P
rom
oted
0.11
0.32
1
B
(2)
Publica
tion
s0.
000.
980.
09**
*1
(3)
Cit
atio
ns
per
publica
tion
0.00
0.97
0.06
***
0.29
***
1(4
)P
hD
thes
esad
vis
ed0.
000.
950.
07**
*0.
07**
*-0
.00
1(5
)P
hD
com
mit
tees
0.00
0.98
0.08
***
0.06
***
0.00
0.42
***
1(6
)A
ge0.
000.
98-0
.04*
**-0
.02*
**-0
.06*
**0.
13**
*0.
20**
*1
(7)
Fem
ale
0.34
0.47
-0.0
2***
-0.0
00.
00-0
.05*
**-0
.06*
**-0
.01*
*1
C
(8)
(exp
ecte
d)
Coa
uth
or/a
dvis
or0.
120.
210.
07**
*0.
22**
*0.
06**
*-0
.00
0.00
-0.0
5***
-0.0
5***
1(9
)(e
xp
ecte
d)
Sam
euniv
ersi
ty0.
370.
560.
05**
*-0
.01*
*0.
00-0
.02*
**-0
.01*
**0.
05**
*-0
.03*
**0.
04**
1(1
0)(e
xp
ecte
d)
Wea
kti
e0.
240.
410.
09**
*0.
03**
*-0
.01
0.15
***
0.25
***
0.04
***
-0.0
7***
0.17
***
-0.0
3***
1(1
1)(e
xp
ecte
d)
Indir
ect
tie
0.30
0.41
0.03
***
0.20
***
0.06
***
-0.0
0-0
.01*
-0.0
2***
-0.0
10.
51**
*-0
.06*
**-0
.01
1
D
(12)
(shock
)C
oauth
or/a
dvis
or0.
000.
290.
08**
*-0
.01
-0.0
0-0
.00
-0.0
00.
000.
000.
000.
000.
01*
-0.0
11
(13)
(shock
)Sam
euniv
ersi
ty-0
.01
0.51
0.06
***
-0.0
0-0
.01
0.01
0.00
0.01
0.00
0.00
-0.0
60.
010.
01-0
.03*
**1
(14)
(shock
)W
eak
tie
0.00
0.42
0.02
***
0.00
0.00
0.01
0.00
-0.0
00.
00-0
.01
0.00
0.00
0.00
-0.0
4***
-0.0
4***
1(1
5)(s
hock
)In
dir
ect
tie
-0.0
00.
44-0
.01
-0.0
1-0
.01
0.00
0.00
-0.0
10.
00-0
.02
0.01
0.01
*-0
.02
-0.0
6***
-0.0
6***
-0.0
4***
1
Not
es:
The
table
incl
udes
info
rmat
ion
from
candid
ates
tofu
llpro
fess
oran
das
soci
ate
pro
fess
orp
osit
ions.
P-v
alues
are
adju
sted
for
clust
erin
gof
stan
dar
der
rors
for
indiv
idual
sin
the
sam
eex
am.
*–
p-v
alue<
0.10
,**
–p-v
alue<
0.05
,**
*–
p-v
alue<
0.01
.
24

Table 4: Success rate, by committee composition
1 2 3 4
FP exams AP exams
Proportion, Success Proportion, Success% rate, % % rate, %
No connection 33 6 50 9
At least one connection: 67 13 50 15
- Co-author/PhD advisor 13 18 8 23- Same university 28 15 25 16- Weak tie 34 15 7 19- Indirect tie 21 11 24 12
Notes: Columns 1 and 3 indicate the percentage of candidates that has acertain type of connection in the evaluation committee. Columns 2 and 4provide information about their success rate. FP exams and AP exams standfor exams to Full and Associate Professor positions respectively. Candidates’average success rate is 11% in FP exams and 12% in AP exams.
25

Table 5: The effect of connections on candidates’ success
1 2 3 4 5 6 7 8
All FP exams AP exams All All Graduatedin Spain
All Lessfrequentsurnames
Connections in committee (shock):
- Co-author/PhD advisor 0.088*** 0.082*** 0.094*** 0.092*** 0.074*** 0.087*** 0.089*** 0.118***(0.008) (0.010) (0.012) (0.008) (0.012) (0.009) (0.008) (0.012)
- Same university 0.040*** 0.038*** 0.041*** 0.043*** 0.025*** 0.041*** 0.040*** 0.040***(0.004) (0.006) (0.006) (0.004) (0.007) (0.004) (0.004) (0.005)
- Weak tie 0.021*** 0.017*** 0.041*** 0.025*** 0.027*** 0.019*** 0.021*** 0.023***(0.005) (0.005) (0.011) (0.005) (0.008) (0.005) (0.005) (0.007)
- Indirect tie -0.001 0.004 -0.003 0.003 -0.003 -0.002 -0.001 0.000(0.004) (0.006) (0.005) (0.005) (0.007) (0.005) (0.004) (0.006)
Quality indicators (normalized):
- Publications 0.023*** 0.044***(0.002) (0.004)
- Citations per publication 0.012*** 0.016***(0.002) (0.003)
- PhD theses advised 0.016*** 0.017***(0.002) (0.003)
- PhD committees 0.021*** 0.023***(0.002) (0.003)
- Age -0.019*** -0.019***(0.002) (0.002)
Constant 0.113*** 0.106*** 0.118*** 0.113*** 0.113*** 0.114*** 0.113*** 0.128***(0.002) (0.003) (0.003) (0.000) (0.003) (0.002) (0.002) (0.003)
Exam dummies YesIndividual dummies YesAdjusted R-squared 0.011 0.011 0.011 0.016 0.200 0.011 0.030 0.043Number of observations 31750 13612 18138 31750 31750 24638 31750 16168
Notes: OLS estimates, standard errors clustered by exam are reported in parentheses. Coefficients indicate the percentage-pointincrease in the success rate associated to a (random) increase in the number of connected evaluators (in a seven-member committee).FP exams and AP exams stand for exams to Full and Associate Professor positions respectively. Column 6 only includes candidateswho did their PhD in Spain. Quality measures are normalized for candidates in the same exam. The subsample of individuals with“less frequent surnames” includes individuals whose paternal and maternal surname have a frequency inferior to 100,000 (source:Spanish Statistical Institute).* – p-value<0.10, ** – p-value<0.05, *** – p-value<0.01.
26

Table 6: The effect of connections on candidates’ success, by disci-plinary group
1 2 3 4 5 6 7
Disciplinary group:
Physics Engineering Chemistry Medicine Social Humanities Lawand Math and Biology Sciences
Means
Connections in committee:
- Co-author/PhD advisor 0.10 0.16 0.15 0.30 0.05 0.04 0.04- Same university 0.28 0.60 0.25 0.32 0.36 0.47 0.19- Weak tie 0.13 0.21 0.20 0.32 0.23 0.33 0.30- Indirect tie 0.23 0.32 0.44 0.66 0.13 0.10 0.31
Quality indicators (non-normalized):
- Publications 6.08 5.55 8.88 7.01 0.84 0.55 0.13- Citations per publication 8.00 7.22 16.67 14.14 3.60 0.87 0.58- PhD theses advised 0.71 0.79 1.57 2.28 0.69 0.79 0.27- PhD committees 2.11 2.31 5.38 7.65 2.75 3.81 1.44- Age 38.54 38.80 42.87 45.38 40.16 43.20 39.51
Effect on success
Connections in committee (shock):
- Co-author/PhD advisor 0.099*** 0.104*** 0.047*** 0.072*** 0.092*** 0.142*** 0.213***(0.020) (0.019) (0.016) (0.013) (0.032) (0.030) (0.039)
- Same university 0.022** 0.019** 0.042*** 0.042*** 0.032** 0.044*** 0.106***(0.010) (0.009) (0.011) (0.011) (0.012) (0.008) (0.015)
- Weak tie 0.023 0.015 0.029** 0.027* 0.007 0.027** 0.014(0.017) (0.013) (0.013) (0.014) (0.013) (0.011) (0.010)
- Indirect tie 0.001 -0.005 0.009 -0.003 -0.004 0.010 -0.012(0.011) (0.010) (0.010) (0.009) (0.013) (0.018) (0.011)
Quality indicators (normalized):
- Publications 0.026*** 0.018*** 0.024*** 0.026*** 0.036*** 0.027*** 0.002(0.005) (0.006) (0.006) (0.005) (0.007) (0.006) (0.005)
- Citations per publication 0.018*** 0.006 0.023*** 0.018*** 0.011* 0.006 -0.002(0.004) (0.005) (0.005) (0.005) (0.006) (0.006) (0.005)
- PhD theses advised 0.016*** 0.010* 0.028*** 0.026*** 0.005 0.018** 0.004(0.005) (0.006) (0.006) (0.006) (0.006) (0.007) (0.007)
- PhD committees 0.013*** 0.017** 0.020*** 0.020*** 0.028*** 0.031*** 0.013**(0.005) (0.007) (0.006) (0.006) (0.007) (0.006) (0.006)
- Age -0.014*** -0.033*** -0.015*** -0.016*** -0.020*** -0.010** -0.026***(0.004) (0.004) (0.005) (0.005) (0.004) (0.005) (0.005)
Constant 0.089*** 0.118*** 0.125*** 0.103*** 0.115*** 0.141*** 0.087***(0.005) (0.005) (0.007) (0.006) (0.006) (0.004) (0.006)
Adjusted R-squared 0.033 0.027 0.031 0.046 0.034 0.030 0.051Number of observations 5227 4596 4023 4120 4073 6254 3457
Note: The upper panel provides the mean values of the corresponding variables. The lower panel reports OLS estimates, standarderrors clustered by exam are reported in parentheses. Quality measures are normalized for candidates in the same exam. * –p-value<0.10, ** – p-value<0.05, *** – p-value<0.01.
27

Table 7: Heterogeneity analysis
1 2 3 4 5 6
Discipline size: Department size:≤ median >median Difference ≤ median >median Difference
Means
Connections in committee:- Co-author/PhD advisor 0.14 0.09 0.05*** 0.08 0.15 -0.07***- Same university 0.42 0.30 0.11*** 0.08 0.65 -0.57***- Weak tie 0.33 0.15 0.18*** 0.22 0.27 -0.04***- Indirect tie 0.29 0.31 -0.02*** 0.27 0.32 -0.05***
Effect on success
Connections in committee (shock):- Co-author/PhD advisor 0.106*** 0.062*** 0.043*** 0.079*** 0.093*** -0.014
(0.010) (0.010) (0.015) (0.012) (0.010) (0.016)- Same university 0.042*** 0.036*** 0.007 0.069*** 0.036*** 0.032***
(0.005) (0.006) (0.008) (0.011) (0.004) (0.011)- Weak tie 0.021*** 0.022*** -0.001 0.025*** 0.018*** 0.008
(0.006) (0.008) (0.010) (0.007) (0.007) (0.010)- Indirect tie -0.003 -0.000 0.003 0.000 -0.001 -0.002
(0.006) (0.006) (0.008) (0.006) (0.006) (0.008)Constant 0.129*** 0.096*** 0.032*** 0.096*** 0.130*** -0.034***
(0.003) (0.003) (0.004) (0.003) (0.003) (0.004)Number of observations 16153 15597 15876 15874
Quality of candidates: Gender of candidates:≤median ≥median Difference Male Female Difference
Means
Connections in committee:- Coauthor/PhD advisor 0.09 0.14 -0.05*** 0.12 0.10 0.02***- Same university 0.38 0.34 0.04*** 0.37 0.34 0.03***- Weak tie 0.19 0.30 -0.11*** 0.27 0.21 0.06***- Indirect tie 0.25 0.34 -0.09*** 0.30 0.29 0.01
Effect on success
Connections in committee (shock):- Coauthor/PhD advisor 0.073*** 0.101*** -0.027* 0.099*** 0.064*** 0.034**
(0.011) (0.011) (0.015) (0.009) (0.013) (0.015)- Same university 0.034*** 0.049*** -0.015* 0.038*** 0.043*** -0.006
(0.005) (0.007) (0.008) (0.005) (0.007) (0.008)- Weak tie 0.011* 0.028*** -0.017* 0.023*** 0.017* 0.006
(0.006) (0.007) (0.009) (0.006) (0.009) (0.011)- Indirect tie -0.004 0.002 -0.006 0.000 -0.002 0.002
(0.005) (0.006) (0.008) (0.005) (0.007) (0.009)Constant 0.077*** 0.151*** -0.074*** 0.117*** 0.106*** 0.011***
(0.002) (0.003) (0.004) (0.003) (0.003) (0.004)Number of observations 16220 15530 20901 10849
Quality of connected evaluators: Gender of connected evaluators:≤median ≥median Difference Male Female Difference
Effect on success
Connections in committee (shock):- Coauthor/PhD advisor 0.090*** 0.081*** 0.009 0.095*** 0.033* 0.062***
(0.013) (0.009) (0.016) (0.008) (0.019) (0.021)- Same university 0.039*** 0.031*** 0.008 0.037*** 0.036*** 0.001
(0.005) (0.005) (0.007) (0.004) (0.010) (0.011)- Weak tie 0.015* 0.020*** -0.005 0.019*** 0.030** -0.011
(0.008) (0.006) (0.010) (0.005) (0.014) (0.015)- Indirect tie -0.005 -0.004 -0.001 0.000 -0.012 0.012
(0.007) (0.005) (0.008) (0.004) (0.010) (0.011)Constant 0.113*** 0.113*** 0.000 0.113*** 0.113*** 0.000
(0.002) (0.002) (0.004) (0.002) (0.002) (0.004)Number of observations 31750 31750 31750 31750
Notes: The panel “Means” provides information on the mean of the corresponding variables. The panel “Effect on suc-cess” reports OLS estimates, standard errors clustered by exam are in parentheses. “Quality” is a factor score computedas a linear combination of (normalized) publications, citations per publication, PhD theses advised, participation in PhDcommittees and age, weighted by the estimated importance of each factor for promotion in the corresponding disciplinarygroup, as reported in Table 6. By construction, the mean of candidates’ “quality” is zero; variance is normalized to one.* – p-value<0.10, ** – p-value<0.05, *** – p-value<0.01.
28
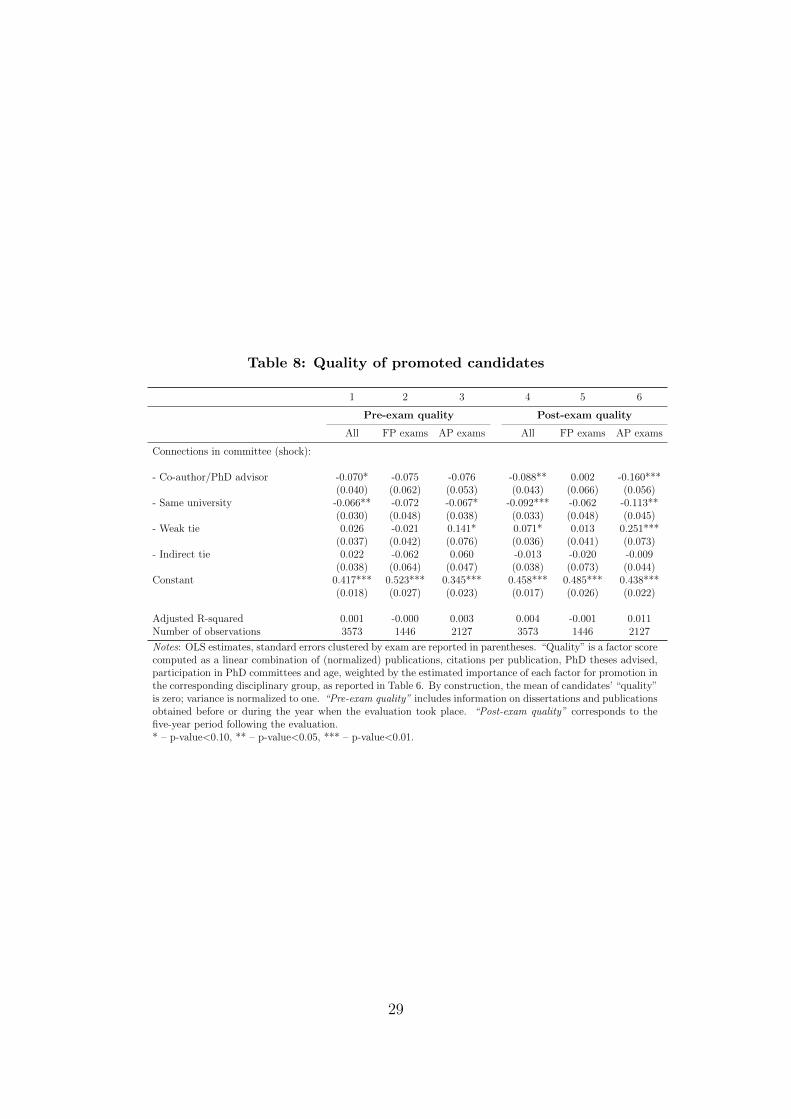
Table 8: Quality of promoted candidates
1 2 3 4 5 6
Pre-exam quality Post-exam quality
All FP exams AP exams All FP exams AP exams
Connections in committee (shock):
- Co-author/PhD advisor -0.070* -0.075 -0.076 -0.088** 0.002 -0.160***(0.040) (0.062) (0.053) (0.043) (0.066) (0.056)
- Same university -0.066** -0.072 -0.067* -0.092*** -0.062 -0.113**(0.030) (0.048) (0.038) (0.033) (0.048) (0.045)
- Weak tie 0.026 -0.021 0.141* 0.071* 0.013 0.251***(0.037) (0.042) (0.076) (0.036) (0.041) (0.073)
- Indirect tie 0.022 -0.062 0.060 -0.013 -0.020 -0.009(0.038) (0.064) (0.047) (0.038) (0.073) (0.044)
Constant 0.417*** 0.523*** 0.345*** 0.458*** 0.485*** 0.438***(0.018) (0.027) (0.023) (0.017) (0.026) (0.022)
Adjusted R-squared 0.001 -0.000 0.003 0.004 -0.001 0.011Number of observations 3573 1446 2127 3573 1446 2127
Notes: OLS estimates, standard errors clustered by exam are reported in parentheses. “Quality” is a factor scorecomputed as a linear combination of (normalized) publications, citations per publication, PhD theses advised,participation in PhD committees and age, weighted by the estimated importance of each factor for promotion inthe corresponding disciplinary group, as reported in Table 6. By construction, the mean of candidates’ “quality”is zero; variance is normalized to one. “Pre-exam quality” includes information on dissertations and publicationsobtained before or during the year when the evaluation took place. “Post-exam quality” corresponds to thefive-year period following the evaluation.* – p-value<0.10, ** – p-value<0.05, *** – p-value<0.01.
29

Table A1: The role of connections, by type of connection
1 2 3 4 5 6 7 8 9 10 11 12
Means The effect of connections Pre-exam quality of Post-exam quality ofon candidates’ success promoted candidates promoted candidates
All FP AP All FP AP All FP AP All FP AP
Strong connection:
- PhD advisor 3 3 3 0.141*** 0.098*** 0.173*** -0.186*** -0.190 -0.156** -0.074 0.015 -0.102(0.014) (0.020) (0.019) (0.065) (0.128) (0.074) (0.073) (0.153) (0.080)
- Co-author 8 10 6 0.065*** 0.077*** 0.051*** -0.005 -0.036 -0.015 -0.100* -0.009 -0.206***(0.009) (0.011) (0.013) (0.051) (0.069) (0.075) (0.052) (0.073) (0.073)
Institutional connection:
- Same university 26 28 25 0.040*** 0.038*** 0.041*** -0.065** -0.070 -0.069* -0.090*** -0.062 -0.115**(0.004) (0.006) (0.006) (0.030) (0.048) (0.038) (0.033) (0.049) (0.044)
Weak tie:
- PhD thesis committeemember
7 9 5 0.029*** 0.021** 0.042*** 0.002 -0.039 0.032 0.130** 0.100 0.148*(0.008) (0.010) (0.013) (0.059) (0.086) (0.081) (0.060) (0.085) (0.084)
- Link by invitation 4 8 0.5 0.043*** 0.045*** 0.020 0.015 -0.057 0.427 0.002 -0.062 0.564**(0.012) (0.013) (0.046) (0.076) (0.071) (0.324) (0.070) (0.068) (0.281)
- Same PhD thesis committee 10 21 2 0.009 0.006 0.046* 0.049 0.010 0.326* 0.069 0.025 0.440***(0.007) (0.007) (0.025) (0.054) (0.055) (0.172) (0.050) (0.053) (0.146)
Indirect tie:
- Same PhD advisor 0.3 0.3 0.2 0.048 0.089 0.023 -0.338 -1.291*** 0.286 -0.456* -0.673 -0.331(0.046) (0.086) (0.053) (0.334) (0.346) (0.479) (0.271) (0.426) (0.393)
- Same co-author 14 12 15 -0.002 0.005 -0.006 -0.007 -0.096 0.035 -0.068 -0.143 -0.032(0.006) (0.009) (0.007) (0.052) (0.088) (0.065) (0.052) (0.103) (0.060)
- Same PhD thesis committeemember
8 8 9 0.001 0.005 -0.002 0.084 0.040 0.088 0.086 0.210** 0.032(0.007) (0.011) (0.009) (0.054) (0.101) (0.063) (0.056) (0.104) (0.065)
Constant 0.113*** 0.106*** 0.118*** 0.419*** 0.525*** 0.347*** 0.457*** 0.484*** 0.436***(0.002) (0.003) (0.003) (0.018) (0.027) (0.023) (0.017) (0.026) (0.022)
Adjusted R-squared 0.012 0.012 0.013 0.002 0.004 0.004 0.004 0.003 0.012Number of observations 31750 13612 18138 3573 1446 2127 3573 1446 2127
Notes: Columns 1-3 provide information on the means of the corresponding variables. Columns 4-12 report OLS estimates, standard errors clustered by exam arereported in parentheses. Columns 4-6 provide information from an analysis similar to the one reported in Table 5. Columns 7-12 replicate the analysis in Table 8.* – p-value<0.10, ** – p-value<0.05, *** – p-value<0.01.
30

Appendix A: Data
We have collected information from three different sources: (i) information
on centralized competitions from the Ministry of Research and Science, (ii)
individual research production from ISI Web of Science and (iii) information
on doctoral dissertations from TESEO database. Below we describe the
process of data collection in detail.
Ministry of Research and Science The system of centralized compe-
titions known as ‘habilitacion’ was in place between 2002 and 2006. Infor-
mation on candidates’ and evaluators’ first name, last name and id number
was retrieved from the website of the Ministry of Research and Science
in July 2009 (http://www.micinn.es). In total, 1016 exams took place,
around five per discipline. We restrict the sample in several ways. We
exclude exams where the number of available positions was larger or equal
than the number of candidates (two exams in Basque Philology and one
exam in Textile and Paper Engineering) and disciplines where the num-
ber of potential evaluators was not big enough to form a committee (46
exams).19 The final database includes 967 exams.
The actual age of individuals is not observable. Instead, we exploit the
fact that Spanish ID numbers contain information on their issue date to
construct a proxy for the age of native individuals on the basis of his/her
national ID number. In Spain police stations are given a range of numbers
that they then assign to individuals in a sequential manner. Since it is com-
pulsory for all Spaniards to have an ID number by age 14, two Spaniards
with similar ID numbers are likely to be of the same age (and geographical
origin).20 In order to perform the assignment, we first use registry informa-
tion on the date of birth and ID numbers of 1.8 million individuals in order19In theses cases, unfilled seats in the committee were filled with professors from
related disciplines.20There are a number of exceptions. For instance, this methodology will fail to identify
the age of those individuals who obtained their nationality when they were older than 14.This could be a case of immigrants coming to Spain. Still, immigration was a very rarephenomenon in Spain until the late 1990s. Additionally, some parents may have theirkids obtain an ID number before they are 14. This may be the case particularly afterSpain entered in the mid 90s the Schengen zone and IDs became a valid documentation totravel to a number of European countries. Still, individuals born around the introduction
31
to create a correspondence table which assigns year of birth to the first four
digits of ID number (ranges of 10,000 numbers). To test the precision of
this correspondence, we apply it to a publicly available list of 3,000 court
secretaries, which contains both the ID number and the date of birth. In
95% of the cases the assigned age is within a three year-interval of the
actual age. In order to minimize potential errors, whenever our age proxy
indicated that a candidate to associate professor is less than 27 years old
and a candidate to full professor is less than 35 years old, we assign age a
missing value (around 5% of the sample). The choice of these thresholds
is justified by survey information, according to which the minimum age at
which promotion to associate and full professor positions was granted in
Spain before 2002 is respectively 27 and 35 (Cruz-Castro et al. 2006). Our
proxy of age is not defined for non-Spaniards (less than 1% of the sample).
We imputed the missing information on age assuming that individuals, for
whom the age proxy is missing, have the same age as an average individual
of the same academic rank in the same discipline.
The Ministry provides information on affiliation for eligible evaluators.
Given that most candidates to full professor positions are themselves el-
igible evaluators in exams to associate professor positions, it is possible
to obtain their affiliation by matching the list of eligible evaluators with
the list of candidates. Using this procedure, we were able to obtain the
information on affiliation for 93% of candidates to full professor positions.
Information on affiliation at the time of the examination for the remaining
7% of candidates was obtained from the State Official Bulletin or directly
from professors’ CVs.
ISI Web of Science Information on scientific publications comes from
Thompson ISI Web of Science (WoS).21 WoS database includes over 10,000
high-impact journals in Science, Engineering, Medicine and Social Sciences,
as well as international proceedings coverage for over 110,000 conferences.
Out of these ten thousand journals, approximately two hundred are edited
in Spain. For the purpose of this analysis, we considered all articles, re-
of the Schengen zone were generally too young to participate in the public examinationsperformed during 2002-2006.
21We are grateful to the Fundacion Espanola para la Ciencia y la Tecnologıa forproviding us with access to the data.
32

views, notes and proceedings. We collected information on publications
since 1975 by authors based in Spain. As well, we consider citations re-
ceived by these publications before July 2012.
The assignment of articles to professors is non trivial. For each publi-
cation and author, WoS provides information on the surname and on the
initial (or, in some cases, initials). Homonymity problems may arise in the
case of common surnames (i.e. Garcia, Fernandez, Gonzalez). Moreover,
unlike most countries, in Spain individuals typically use two surnames (pa-
ternal and maternal) and sometimes also a middle name. A paper authored
by a Spanish author may include only the paternal or the maternal sur-
name, or both surnames hyphenated. As well, Spanish authors may sign
using their first name, their middle name, or both.
We use the following matching procedure in order to identify authors.
First, we match publications with Spanish affiliations to professors using
information on surnames and initials. We select the subsample of publi-
cations that have a unique match in our list of Spanish professors. This
subsample includes 250,000 publications. Second, we use this subsample to
create a correspondence table between the 240 scientific areas used by ISI
to classify publications and the 190 scientific disciplines used by the Min-
istry of Education in order to classify professors. Specifically, we assign
the ISI area to a given discipline (i) if the proportion of publications in the
ISI area by professors from the discipline exceeds 10% of the total number
of publications in the discipline (or viceversa), or (ii) if it appears before
the 50% threshold in the cumulative distribution of publications ordered
by the decreasing importance of ISI areas in the discipline (or viceversa).
The resulting correspondence table, available upon request, allows match-
ing publications in ISI areas to the scientific areas defined by the Ministry
of Education. On average, we assign five ISI areas to each discipline. Fi-
nally, using this correspondence table, we merge the ISI publication data
with the full list of professors using information on surnames, initials and
discipline.
If a given publication can be assigned to more than one possible match,
the value of this publication is divided by the number of such possible
matches. Less than 3% of publications were assigned to more than one
individual. This figure is equal to 0.5% in the subsample of individuals with
33

“less common surnames”, i.e. individuals whose maternal and paternal
surnames have a frequency below 100,000 according to the Spanish National
Statistical Institute.
Given that propensity to publish differs substantially across disciplines,
we normalize the number of individual’s publications to have zero mean and
unit standard deviation among applicants to the same exam and among
eligible evaluators of a given category in a given exam. The number of
citations of each publication depends on time elapsed between the publica-
tion date and the date when the number of received citations is observed.
Therefore, we first normalize the number of citations received by each pub-
lication subtracting the average number of citations received by Spanish-
authored articles published in the corresponding ISI disciplinary area in
the same year and then dividing by the corresponding standard deviation.
Next, for each individual in our database we calculate the average number
of normalized citations per publication. Finally, similarly to the number of
publications, we re-normalize the number of individual’s citations per pub-
lication to have zero mean and unit standard deviation among applicants
to the same exam and among eligible evaluators of a given category in a
given exam. We treat individuals who have no ISI publications as if they
had received zero citations.
TESEO database on doctoral dissertations Since 1977 PhD can-
didates in Spanish universities register their dissertation in the database
TESEO, which is run by the Ministry of Education. We retrieved all
the information available in this database from the website https://www.
educacion.gob.es/teseo in May 2011. We observe 151,483 dissertations.
TESEO provides the identity and affiliation of dissertations’ authors, ad-
visors and committee members.
We are able to find the dissertation of 83% of candidates to AP ex-
ams. Missing information may be due to the fact that (i) individuals did
their PhD abroad, (ii) they defended their dissertation before 1977, (iii)
there are spelling mistakes, (iv) there was a homonymity problem (0.1%
of individuals share the same name, middle name, paternal surname and
maternal surname) or (v) the dissertation was not included in TESEO for
34

unknown reasons.22 We use dissertation information to identify candidates’
alma mater.
Connections We define different types of connections between candi-
dates and evaluators. First, we consider strong professional connections
that imply interaction on a common piece of research, c′1: advisor-student
relationship and co-authors. These two types of connections are highly in-
tertwined in Spain: around 50% of individuals have co-authored a paper
with their advisor. We use information from ISI on individuals’ publication
record to identify whether candidates and evaluators have co-authored a
paper. In the case when an author of a publication can be assigned to more
than one possible match, the co-authorship tie is given a weight equal to
the inverse of the number of possible matches. Second, we identify insti-
tutional connections, c′2. In the case of FP exams, we consider that the
evaluator and the candidate have an institutional connection if at the time
of the examination they are colleagues at the same university. Unfortu-
nately we cannot observe the affiliation of candidates to AP positions at
the time of the exam, we only observe the institution where they obtained
their PhD. In this case we consider that the evaluator and the candidate
have an institutional connection if the candidate obtained her PhD from
the university where the evaluator is based. Given the low geographical
mobility of Spanish professors at this stage (Cruz-Castro et al. 2006), it
seems reasonable to presume that the large majority of candidates to AP
positions were still based in their alma mater at the time of the evaluation.
Third, we identify the following weak ties between candidates and evalu-
ators, c′3, which imply some professional interaction: the evaluator was a
member of the candidate’s thesis committee; the evaluator has invited the
candidate to sit on the thesis committee of one of her students (or vice
versa); the evaluator and the candidate sat on the same thesis committee.
Finally, we identify several indirect ties between candidates and evaluators,
c′4: the evaluator and the candidate have either a common advisor or a
common thesis committee member or a common co-author.
22While registration is compulsory, according to Fuentes and Arguimbau (2010),TESEO does not include information on approximately 10% of all dissertations readin Spain.
35
We attribute only one type of connection to a given pair of individu-
als, following the priority order introduced above. Specifically, given that
the co-authorship link is defined probabilistically, we apply the following
transformation:
c1 = c′1 c3 = (1− c2)c′3c2 = (1− c1)c′2 c4 = (1− c3)c′4
where c1, ..., c4, c′1, ..., c
′4 ∈ [0, 1].
Appendix B: Expected Committee composition
In exams to FP positions, the expected number of connections in the
committee is essentially equal to the proportion of connections in the pool
of eligible FPs times seven (as there are seven evaluators in the committee).
However, as explained in footnote 11, the random assignment of evaluators
to committees was subject to a constraint: every committee could include
at most one researcher from the Spanish Research Council (CSIC) and
one emeritus professor. When a second individual belonging to one of
these categories was drawn, the draw was not considered. Therefore, in
exams where the population of potential evaluators contains two or more
researchers, or two or more emeritus professors, the expected number of
connections in the committee should be computed taking into account this
constraint. This affects 387 of 967 exams.
First, we compute the probability that at least one researcher is drawn
from the pool, pR, and the probability that at least one emeritus professor
is drawn, pE. For FP exams these probabilities are:
pR = 1−(R0
)(P+E7−0
)(P+E+R
7
) , pE = 1−(E0
)(P+R7−0
)(P+E+R
7
)where R is the number of researchers in the pool, E is the number of
emeritus professors and P is the number of eligible professors who are not
emeritus. Once these probabilities are computed, it is possible to calculate
36
for each candidate the expected number of connections in the committee:
µ =pRpE(cR + cE + 5cP ) + pE(1− pR)(cE + 6cP )
+ pR(1− pE)(cR + 6cP ) + (1− pR)(1− pE)7cP
where cj indicates the number of connections in group j and j ∈ {R,E, P}.In AP exams, three evaluators are drawn from the pool of eligible FPs,
and then four evaluators are drawn from the pool of eligible APs. The
expected number of connections in the committee is generally equal to the
proportion of connections among FPs times three plus the proportion of
connections among APs times four. Again, in order to take into account
the constraint on the randomization, analogously to the case of FP exams,
we compute the probabilities that at least one researcher and at least one
emeritus professor is drawn from each pool: pFPR , pFP
E , pAPR , and pAP
E ). Then
we compute the expected number of connections in the committee using
the following formula:
µ =[pFPR pFP
E (cFPR + cFP
E + cFPP ) + pFP
E (1− pFPR )(cFP
E + 2cFPP )
+ pFPR (1− pFP
E )(cFPR + 2cFP
P ) + (1− pFPR )(1− pFP
E )3cFPP ]
+ [(1− pFPR )(1− pFP
E )[pAPR pAP
E (cAPR + cAP
E + 2cAPP ) + pAP
E (1− pAPR )(cAP
E + 3cAPP )
+ pAPR (1− pAP
E )(cAPR + 3cAP
P ) + (1− pAPR )(1− pAP
E )4cAPP ]
+ pFPR (1− pFP
E )[pAPE (cAP
E + 3cAPP ) + (1− pAP
E )4cAPP ]
+ pFPE (1− pFP
R )[pAPR (cAP
R + 3cAPP ) + (1− pAP
R )4cAPP ] + pFP
E pFPR 4cAP
P ]
where ckj is the proportion of connections in the pool of k ∈ {FP,AP}professors belonging to group j ∈ {R,E, P}.
37